The 2015 Secchi dip-in report · In 2015, Dr. Bob Carlson transferred the operation of the Secchi...
22
Prepared by Lauren Salvato North American Lake Management Society March 2016 THE 2015 SECCHI DIP-IN REPORT Photo by Bob Kirschner
Transcript of The 2015 Secchi dip-in report · In 2015, Dr. Bob Carlson transferred the operation of the Secchi...

3 | P a g e
Prepared by Lauren Salvato
North American Lake Management Society
March 2016
THE 2015 SECCHI DIP-IN
REPORT
Photo by Bob Kirschner
4 | P a g e
Thank you to the North American Lake Management Society for supporting the Secchi Dip-In.
Thank you to the 2015 and 2016 Secchi Dip-In committee members:
Melissa Clark, Sarah Powers, Sara Peel, Ann St. Amand, Reed Green, Elizabeth Herron, Bob
Carlson, Lisa Borre, Steve Lundt, Nicki Bellezza, Chris Holdren, Mark Hoyer, Linda Green,
Terry McNabb, Julie Chambers, Frank Wilhelm, Greg Arenz, and Philip Forsberg
i | P a g e
TABLE OF CONTENTS
TABLE OF FIGURES i
TABLE OF TABLES ii
SECCHI DIP-IN PROGRAM DESCRIPTION 1
Mission statement 1
What we do 1
THE SECCHI DISK 2
MATERIALS AND METHODS 2
Measuring water clarity 2
Additional water parameters- temperature, dissolve oxygen, and pH 4
Data entry 4
Lake classification 5
Carlson’s trophic state index (TSI) 5
Factors affecting lake transparency 6
VOLUNTEER RECRUITMENT 6
Program participation 7
TRANSPARENCY RESULTS AND DICUSSION 7
Spatial distribution of Secchi Dip-In participation 7
Comparing TSI results 9
SURVEY RESULTS 11
LESSONS LEARNED AND FUTURE GOALS 12
Outreach campaign 12
Database upgrade 12
Lake Observer app 12
Citizen Science day 12
Future annual reports 13
CONCLUSIONS 13
LITERATURE CITED 14
APPENDIX A 15
Secchi Dip-In mail in forms 15
APPENDIX B 17
Secchi Dip-In survey responses 17
TABLE OF FIGURES
Figure 1. Secchi disk and water quality 2
Figure 2. Turbidity tube 3
Figure 3. Turbidity column and turbidity meter 3
Figure 4. The horizontal black disk 4
Figure 5. The relationship between trophic state and lake classification 5
Figure 6. Carlson’s trophic state index, the most widely used index 6
Figure 7. Secchi Dip-In program participation (1994-2015) 7
Figure 8. Participation in the 2015 Secchi Dip-In, North America 8
Figure 9. 2015 average Secchi measurements displayed by state 9
Figure 10. Chlorophyll-a trophic state conditions across nine ecoregions 10

ii | P a g e
Figure 11. Lake classifications by state 10
Figure 12. Lake classifications by region 11
TABLE OF TABLES
Table 1. Descriptive statistics of 2015 Secchi measurements by state 8

1 | P a g e
SECCHI DIP-IN PROGRAM DESCRIPTION
The Secchi Dip-In is a program of the North American Lake Management Society (NALMS).
The purpose of the Society is to foster the management and protection of lakes and reservoirs for
today and tomorrow.
The Secchi Dip-In began in 1994 to demonstrate that volunteers can provide accurate, consistent
information on the waters of North America. What began as a pilot study with six Midwest states
(Indiana, Illinois, Wisconsin, Michigan, Ohio, and Minnesota) expanded to 37 states and 2
provinces of Canada by 1995. In 2015, Dr. Bob Carlson transferred the operation of the Secchi
Dip-In to NALMS. In the 21 years Dr. Bob Carlson led the Secchi Dip-In, the database
accumulated more than 41,000 records on more than 7,000 individual waterbodies.
The Dip-In is an ongoing program using trained volunteers to gather long-term water clarity data
in the summer of every year. Secchi Dip-In participants include trained monitoring volunteers
and individuals who are interested in citizen science and enthusiastic about lakes. We encourage
anyone interested in understanding the ecology of their lake or watershed to get involved with
the Secchi Dip-In.
Mission statement
To involve citizen scientists in monitoring the water quality of North America’s lakes and their
watersheds
What we do
Organize an annual data-gathering event during Lakes Appreciation month for North
American lakes, reservoirs, and other waterbodies
Provide educational materials and training for anyone engaged in managing lakes and
their watersheds
Maintain long-term transparency monitoring data for use in research on aquatic systems
and the discovery of trends
Prepare annual reports analyzing Secchi Dip-In data and make data available for all
interested stakeholders
Promote public awareness and stewardship of lakes and watersheds
Recognize the importance of volunteers in the gathering of environmental data
2 | P a g e
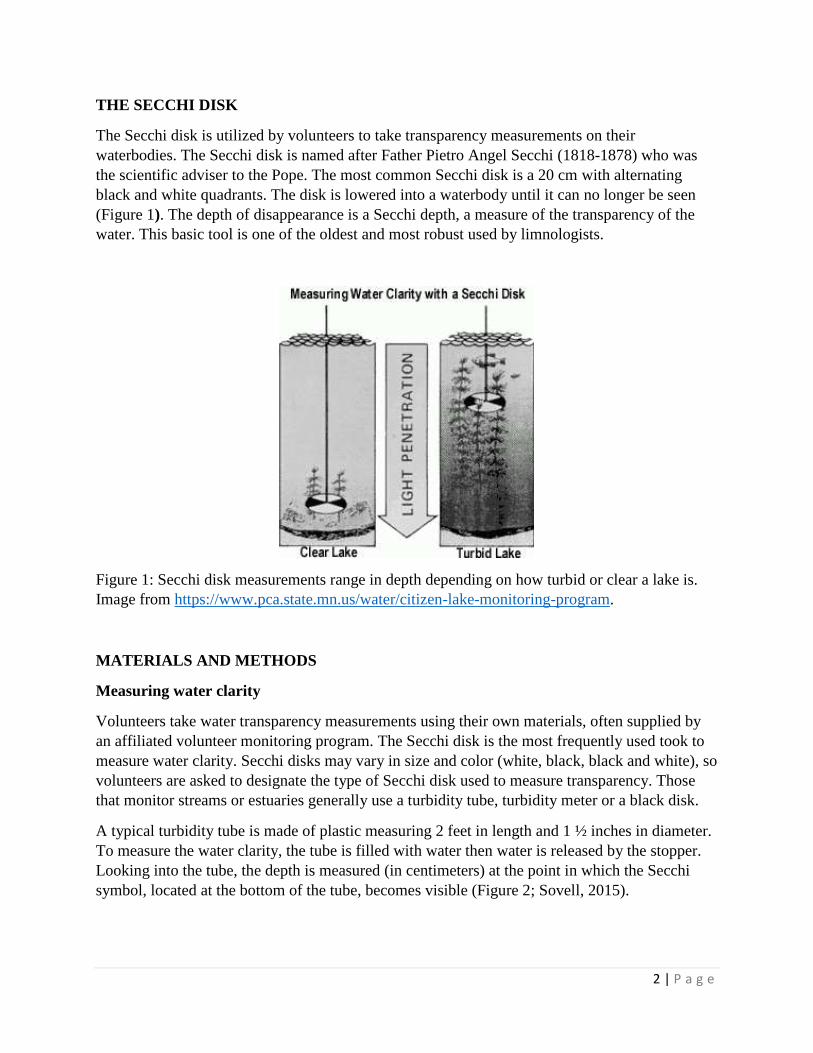
THE SECCHI DISK
The Secchi disk is utilized by volunteers to take transparency measurements on their
waterbodies. The Secchi disk is named after Father Pietro Angel Secchi (1818-1878) who was
the scientific adviser to the Pope. The most common Secchi disk is a 20 cm with alternating
black and white quadrants. The disk is lowered into a waterbody until it can no longer be seen
(Figure 1). The depth of disappearance is a Secchi depth, a measure of the transparency of the
water. This basic tool is one of the oldest and most robust used by limnologists.
Figure 1: Secchi disk measurements range in depth depending on how turbid or clear a lake is.
Image from https://www.pca.state.mn.us/water/citizen-lake-monitoring-program.
MATERIALS AND METHODS
Measuring water clarity
Volunteers take water transparency measurements using their own materials, often supplied by
an affiliated volunteer monitoring program. The Secchi disk is the most frequently used took to
measure water clarity. Secchi disks may vary in size and color (white, black, black and white), so
volunteers are asked to designate the type of Secchi disk used to measure transparency. Those
that monitor streams or estuaries generally use a turbidity tube, turbidity meter or a black disk.
A typical turbidity tube is made of plastic measuring 2 feet in length and 1 ½ inches in diameter.
To measure the water clarity, the tube is filled with water then water is released by the stopper.
Looking into the tube, the depth is measured (in centimeters) at the point in which the Secchi
symbol, located at the bottom of the tube, becomes visible (Figure 2; Sovell, 2015).

3 | P a g e
Figure 2: A typical turbidity tube. Image from: http://www.secchidipin.org/wordpress/wp-
content/uploads/2015/04/tube004.gif
The turbidity meter is an electronic device that measures turbidity, which is the amount of
cloudiness in water caused by particles recorded in Nephelometric Turbidity Units (NTU). A
LaMotte turbidity column also measures turbidity recorded in Jackson Turbidity Units (JTU).
With either NTU or JTU measurements, a 1 is clear water and a 100 is extremely cloudy water.
A sample of water is collected and turbidity is measured by the respective device and unit of
measure (Figure 3; Carlson, 2015).
Figure 3: The LaMotte turbidity column (left) and Hach Portable turbidity meter (right). Images
from: http://www.secchidipin.org/wordpress/wp-content/uploads/2015/04/LaMotte_Tube.gif and
http://www.secchidipin.org/wordpress/wp-content/uploads/2015/04/Hach2100P.jpg.
The black disk is generally used to obtain a transparency measurement horizontally. The
advantages of the black disk are that it can be used in shallow waters, lighting conditions are
independent of measurement, and it can be used in moving water (Carlson, 2015).The
measurement process is similar to using a Secchi disk vertically. The device consists of a sealed
viewing tube and stick with a black disk. The black disk is pulled away horizontally from the
tube until it is no longer visible (Figure 4; Steel and Neuhasuer, 2015).

4 | P a g e
Figure 4: The horizontal black disk. Image from: http://www.secchidipin.org/wordpress/wp-
content/uploads/2015/04/black2.jpg
Additional water parameters- temperature, dissolved oxygen and pH
Volunteers most frequently submit Secchi measurements but have the option to submit additional
information. Those details include temperature of the surface and bottom of the waterbody,
dissolved oxygen (DO) and pH.
The temperature of water impacts many of the biologic and physical properties of aquatic
systems. Understanding the temperature of a waterbody at different depths indicates how well
mixed the water column is. In fact, temperature is the basis of the thermal classification system
described by Carlson and Simpson (1996). If a lake is stratified or layered, then warmer, less
dense waters lie at the surface and colder, denser waters at the bottom of the lake. Temperature
also impacts where aquatic organisms live in a lake.
Dissolved oxygen (DO) is an important factor impacting aquatic organisms and nutrient
recycling within aquatic systems (Holdren et al., 2001). These concentrations define where
aquatic life can survive within a lake ecosystem. Conditions at the bottom of the lake generally
have lower DO concentrations and may not support aquatic life. Towards the surface there are
typically higher DO concentrations, which better support a habitat for fish and plant
communities.
The pH is a measure of hydrogen ion concentration in water with low values describing acid
conditions and high alkaline conditions. The pH in lakes generally ranges from 5.5-9.0 and there
are plant and animals adapted to these levels. Changes in pH, particularly in early life stages, can
rapidly change fish and plant communities (Holdren et al., 2001).
Data entry
The Secchi Dip-In website is where volunteers can learn about lakes and submit their water data.
The process involves creating an account, adding background information about the waterbody
(e.g. lake name, latitude and longitude, etc.) to the database, and entering the water quality
parameters obtained. Volunteers also have the option to submit a physical copy by mail
(Appendix A).

5 | P a g e
Through a collaboration with the US Environmental Protection Agency, the North American
Lake Management Society invited members to test the Global Lake Ecological Observatory
Network (GLEON) Lake Observer mobile app during the 2015 Secchi Dip-in. The app enables
citizen scientists to submit water quality data using their smart devices and was successfully
tested by volunteer monitoring programs in Indiana and Rhode Island.
Lake classification
Trophic state is a classification system defining the level of productivity in a lake. Lakes are
classified into four main types based on TSI calculations (Figure 5). Oligotrophic lakes are
associated with high transparency and low plant productivity (Holdren et al., 2001). Mesotrophic
lakes indicate a medium range of productivity. Eutrophic lakes are associated with low
transparency and high productivity. Finally, hypereutrophic lakes are associated with low
transparency and extremely high productivity.
Carlson’s trophic state index (TSI)
Carlson’s TSI is a numeric method of classifying the trophic state of lakes using Secchi depth,
chlorophyll-a, total phosphorous and total nitrogen. Individually or together the factors indicate
whether a lake is oligotrophic, mesotrophic, eutrophic, or hypereutrophic (Carlson, 1977). For
our purposes, we focused on Secchi disk measurements and utilized the TSI Secchi depth
equation (Figure 6). In the long-term, the trophic state index can be used to determine how a
lake’s trophic status is changing over time.
Figure 5: The relationship between trophic state and lake classification (Clark, 2015).

6 | P a g e
Figure 6: Carlson’s Trophic State Index, the most widely used index (Carlson, 1977)
Factors affecting lake transparency
Transparency is affected by the water color, algal abundance, and non-algal suspended sediments
(Holdren et al., 2001). As suspended sediments or algal abundance increases, transparency
decreases. Decaying plant matter can stain the color of the water. Algae, small green aquatic
plants, are abundant depending on plant nutrients, especially phosphorus and nitrogen.
Transparency can be affected by the amount of plant nutrients coming into the lake from sources
such as sewage treatment plants, septic tanks, and lawn and agricultural fertilizer. Suspended
sediments often come from sources such as resuspension from the lake bottom, construction
sites, agricultural fields and urban runoff.
VOLUNTEER RECRUITMENT
Volunteers are an essential component of the Secchi Dip-In program. They have been the sole
contributors to the Secchi Dip-In database since 1994. Volunteers were recruited in the past by
mail solicitation with contact information provided by volunteer monitoring programs.
Volunteers were asked to fill out a questionnaire and return postage was provided. Other
publicity for the Dip-In was provided by Kent State University through new press releases.
Outreach eventually became solely electronic (Carlson and Lee, 1994). For the 2015 Dip-In
volunteers were notified by email and advertisements on the NALMS and Secchi Dip-In website
leading up until July, the month selected for the Secchi Dip-In’s data collections. In addition, the
volunteer monitoring listserve has served as a resource to communicate with the volunteer
monitoring community.

7 | P a g e
Program Participation
The Secchi Dip-In received funding from various partner organizations when it began in 1994.
After funding ceased in 2001, the Secchi Dip-In experienced a decreasing trend in volunteer
participation (Figure 7). As a program of NALMS, the Secchi Dip-In hopes to reverse this trend
and thus far between 2014 and 2015, this has been the case.
Figure 7: The number of annual data entries to the Secchi Dip-In database (1994 - 2015)
TRANSPARENCY RESULTS AND DISCUSSION
Spatial distribution of Secchi Dip-In participation
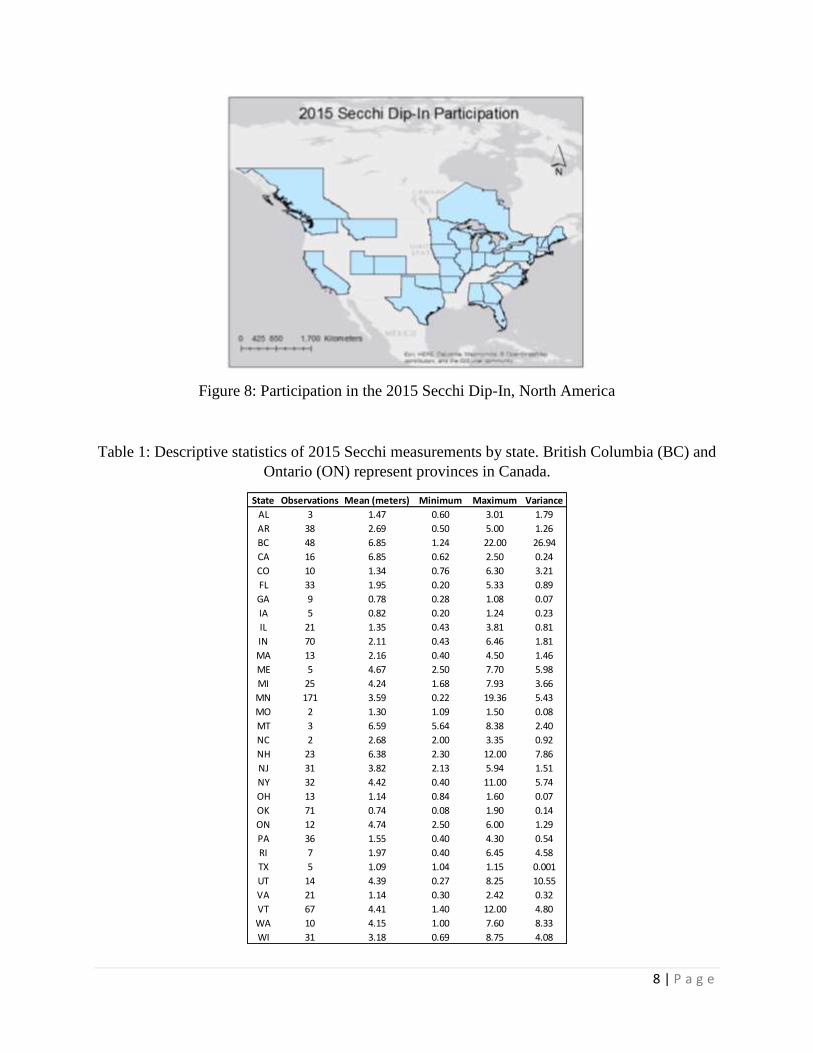
The 2015 Dip-In attracted a range of participants across the US and Canada (Figure 8). However,
the sample size for each state or province varies from 2 to as many as 171. This was considered
during the data analysis process (Table 1).
0
500
1000
1500
2000
2500
3000
3500
4000
19
94
19
95
19
96
19
97
19
98
19
99
20
00
20
01
20
02
20
03
20
04
20
05
20
06
20
07
20
08
20
09
20
10
20
11
20
12
20
13
20
14
20
15
Nu
mb
er o
f En
trie
s
Year
Secchi Dip-In Participation
8 | P a g e
Figure 8: Participation in the 2015 Secchi Dip-In, North America
Table 1: Descriptive statistics of 2015 Secchi measurements by state. British Columbia (BC) and
Ontario (ON) represent provinces in Canada.
State Observations Mean (meters) Minimum Maximum Variance
AL 3 1.47 0.60 3.01 1.79
AR 38 2.69 0.50 5.00 1.26
BC 48 6.85 1.24 22.00 26.94
CA 16 6.85 0.62 2.50 0.24
CO 10 1.34 0.76 6.30 3.21
FL 33 1.95 0.20 5.33 0.89
GA 9 0.78 0.28 1.08 0.07
IA 5 0.82 0.20 1.24 0.23
IL 21 1.35 0.43 3.81 0.81
IN 70 2.11 0.43 6.46 1.81
MA 13 2.16 0.40 4.50 1.46
ME 5 4.67 2.50 7.70 5.98
MI 25 4.24 1.68 7.93 3.66
MN 171 3.59 0.22 19.36 5.43
MO 2 1.30 1.09 1.50 0.08
MT 3 6.59 5.64 8.38 2.40
NC 2 2.68 2.00 3.35 0.92
NH 23 6.38 2.30 12.00 7.86
NJ 31 3.82 2.13 5.94 1.51
NY 32 4.42 0.40 11.00 5.74
OH 13 1.14 0.84 1.60 0.07
OK 71 0.74 0.08 1.90 0.14
ON 12 4.74 2.50 6.00 1.29
PA 36 1.55 0.40 4.30 0.54
RI 7 1.97 0.40 6.45 4.58
TX 5 1.09 1.04 1.15 0.001
UT 14 4.39 0.27 8.25 10.55
VA 21 1.14 0.30 2.42 0.32
VT 67 4.41 1.40 12.00 4.80
WA 10 4.15 1.00 7.60 8.33
WI 31 3.18 0.69 8.75 4.08

9 | P a g e
Average Secchi measurements were highest in Canada, the Northeast, and a few of the upper
Midwest states. The lowest values were consistently in the Southeast and West/Southwest area.
The Midwest states displayed a mixture of lower to middle range Secchi measurements (Figure
9).
Figure 9: Average Secchi measurements displayed by state
Comparing TSI results
The National Lakes Assessment (NLA) was completed in 2007 by the USEPA in order to
provide a comprehensive survey of the nation’s lakes. Figure 10 provides a basis for comparison
with 2015 Secchi Dip-In results. As indicated by the Carlson TSI lower transparency
measurements reveal more eutrophic conditions and higher transparency measurements indicate
more oligotrophic conditions (Figure 11; Carlson, 1977). Comparing the NLA data to the Dip-
in’s state trophic conditions, the results were consistent with the nine ecoregions. The Pacific
Northwest and Northeast regions had predominately oligotrophic conditions and the
Southwestern and Southeast regions had more eutrophic lake conditions. A closer geographic
equivalent is to compare the National Lakes Assessment results with lake classifications by US
region (Figure 12). However, regional TSI conditions do not match as closely as they do with
state lake classifications. This is likely because not all states are represented in regional values
and regions varied in sample size.

10 | P a g e
Figure 10: Chlorophyll-a trophic state conditions across nine ecoregions (Level III). The pie
chart represent the percentage of lakes types found in each ecoregion. From the 2007 National
Lakes Assessment http://www.epa.gov/sites/production/files/2013-
11/documents/nla_newlowres_fullrpt.pdf
Figure 11: Lake classifications by state. Mean values were used to calculate the TSI for Secchi
depth.

11 | P a g e
Figure 12: Lake classifications by region. Mean values were used to calculate the TSI for Secchi
depth.
SURVEY RESULTS
A survey was conducted at the end of August 2015 to gather feedback from both Secchi Dip-In
volunteers and NALMS affiliates. The survey was created on SurveyMonkey and consisted of
14 questions with a combination of multiple choice and questions requesting feedback
(Appendix B). Over 200 individuals participated in the survey. Volunteers were asked whether
they had participated in the 2015 Dip-In, their reasons for participating or not participating, and
what changes they would like to see for future Dip-Ins.
Volunteers were asked which volunteer monitoring program they affiliate themselves. This gave
us an idea of the types of programs submitting to the Secchi Dip-In, which are primarily
volunteer monitoring programs (69%). When asked if future Dip-Ins should incorporate
individual monitors, 75% voted in favor of including both individuals and volunteer monitoring
programs. Finally, volunteers were asked the likelihood of using a mobile smart phone app for
data entry. The majority of respondents were not interested, however 34% said they would be
likely to use the app and can be recruited for the 2016 Dip-In.

12 | P a g e
LESSONS LEARNED AND FUTURE GOALS
Outreach campaign
NALMS took over the Secchi Dip-In officially in March 2015 and a Secchi Dip-In intern was
not hired until June 2015. These circumstances did not allow enough time to adequately
advertise the 2015 Dip-In.
For the 2016 Dip-In, we intend to diversify our outreach campaign. That is, to focus additional
recruitment efforts on monitoring programs not currently affiliated with the Secchi Dip-In. The
Secchi Dip-In is also eager to expand citizen science across the United States and increase
monitoring in waterbodies not currently being monitored. Individual outreach will focus on lake
and homeowner associations, water focused environmental groups, and outdoor groups through
email and social media outlets. Outreach will occur in higher frequency during the spring season.
Database Upgrade
A general consensus from the survey was that volunteers found the website data entry to be
difficult. We are aware of the status of the data entry process and are making plans to address
these issues. In the short term NALMS will make basic updates to the data entry process to make
it more streamlined. In the long term, NALMS is working to forge partnerships to make a
database upgrade. This would involve geographic functionality and easier access to datasets.
Lake Observer App
The Lake Observer app was successfully tested by two volunteer monitoring programs: URI
Watershed Watch in Rhode Island and the Clean Lakes Program (CLP) in Indiana. The lessons
learned include launching and advertising the app further in advance of the summer sampling
season. Successes in Indiana were in part from the Secchi Dip-In intern who promoted the app
during side-by-side trainings with the CLP. The 2015 Lake Observer app beta test received 127
Secchi depth observations from 11 users, comprising of 14% of all 2015 Secchi observations
(Borre, 2015). For the 2016 Dip-In, the app will be updated and available for a wider audience.
Outreach efforts for the 2016 Dip-In will encourage the usage of the app.
Citizen Science Day
In the last few years, the White House has recognized the need for citizen science to ‘…address
societal and scientific challenges’ (Kahlil and Wilkinson, 2015). The White House has deemed
April 16, 2016 as Citizen Science day, and the Secchi Dip-In will host an event in celebration.
Getting involved with the White House has helped forge new relationships with citizen science
programs and we will continue to utilize this outlet in the future.

13 | P a g e
Future Annual Reports
Future Dip-In reports will include long-term trends and any significant changes over time. The
Secchi Dip-In database was prepared to be migrated to the STOrage and RETrieval and Water
Quality eXchange (STORET and WQX), a database operated by the US Environmental
Protection Agency that allows for the submission and sharing of water quality monitoring data.
Due to time constraints, only 2015 data was analyzed for the 2015 Dip-In report.
CONCLUSIONS
The data analyzed provided a snapshot of lake conditions using only 2015 data. Due to the range
of entries submitted across North America, average Secchi disk measurements were better
represented at the state level rather than regional level. This was confirmed by comparing the
chlorophyll-a trophic index in the 2007 National Lakes Assessment report.
The Secchi Dip-In has water quality parameters dating back to the early 1980’s. Therein lies a
resource for interested stakeholders and many possibilities for data analysis. The 2011 report
‘Assessing the Needs of Volunteer Water Monitoring Programs’ highlighted that funding
stability and quantity are the top two program concerns (Green et al., 2011). In the midst of
underfunded state volunteer monitoring programs, the Secchi Dip-In has served as a place for
volunteers to continue submitting their data. With the support of NALMS, the Secchi Dip-In
expects to continue as a long-standing citizen science monitoring program.
The volunteers contributing data to the Secchi Dip-In program provide valuable information
about waterbodies nation-wide. The consistency of volunteers allows for long-term data and the
ability to see trends. Presently, the Secchi Dip-In has seen a decreasing trend in volunteer
participation. Recently absorbed by the North American Lake Management Society, we hope to
reverse the trend, grow and revitalize the program, and contribute to the expansion and
recognition of citizen science.
Thank you to all the volunteers who have participated in the Secchi Dip-In. You all are the key
to the success of this program.
14 | P a g e
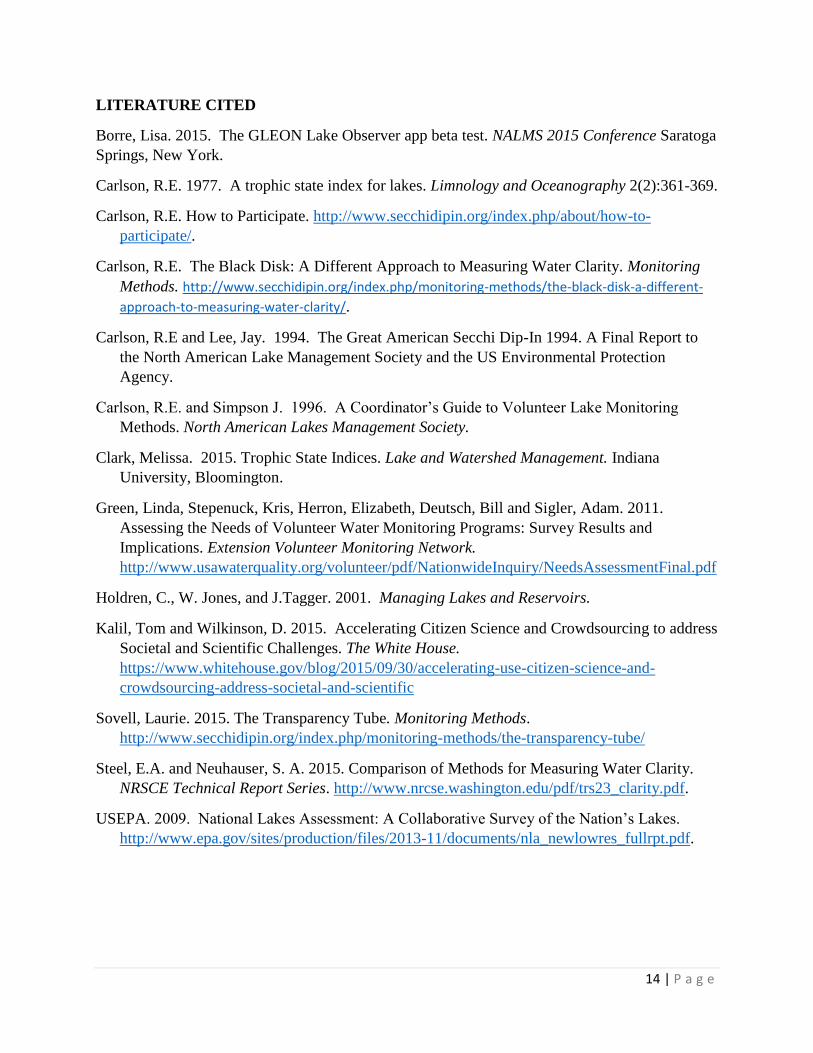
LITERATURE CITED
Borre, Lisa. 2015. The GLEON Lake Observer app beta test. NALMS 2015 Conference Saratoga
Springs, New York.
Carlson, R.E. 1977. A trophic state index for lakes. Limnology and Oceanography 2(2):361-369.
Carlson, R.E. How to Participate. http://www.secchidipin.org/index.php/about/how-to-
participate/.
Carlson, R.E. The Black Disk: A Different Approach to Measuring Water Clarity. Monitoring
Methods. http://www.secchidipin.org/index.php/monitoring-methods/the-black-disk-a-different-
approach-to-measuring-water-clarity/.
Carlson, R.E and Lee, Jay. 1994. The Great American Secchi Dip-In 1994. A Final Report to
the North American Lake Management Society and the US Environmental Protection
Agency.
Carlson, R.E. and Simpson J. 1996. A Coordinator’s Guide to Volunteer Lake Monitoring
Methods. North American Lakes Management Society.
Clark, Melissa. 2015. Trophic State Indices. Lake and Watershed Management. Indiana
University, Bloomington.
Green, Linda, Stepenuck, Kris, Herron, Elizabeth, Deutsch, Bill and Sigler, Adam. 2011.
Assessing the Needs of Volunteer Water Monitoring Programs: Survey Results and
Implications. Extension Volunteer Monitoring Network.
http://www.usawaterquality.org/volunteer/pdf/NationwideInquiry/NeedsAssessmentFinal.pdf
Holdren, C., W. Jones, and J.Tagger. 2001. Managing Lakes and Reservoirs.
Kalil, Tom and Wilkinson, D. 2015. Accelerating Citizen Science and Crowdsourcing to address
Societal and Scientific Challenges. The White House.
https://www.whitehouse.gov/blog/2015/09/30/accelerating-use-citizen-science-and-
crowdsourcing-address-societal-and-scientific
Sovell, Laurie. 2015. The Transparency Tube. Monitoring Methods.
http://www.secchidipin.org/index.php/monitoring-methods/the-transparency-tube/
Steel, E.A. and Neuhauser, S. A. 2015. Comparison of Methods for Measuring Water Clarity.
NRSCE Technical Report Series. http://www.nrcse.washington.edu/pdf/trs23_clarity.pdf.
USEPA. 2009. National Lakes Assessment: A Collaborative Survey of the Nation’s Lakes.
http://www.epa.gov/sites/production/files/2013-11/documents/nla_newlowres_fullrpt.pdf.

15 | P a g e
Appendix A:
Secchi Dip-In mail in forms
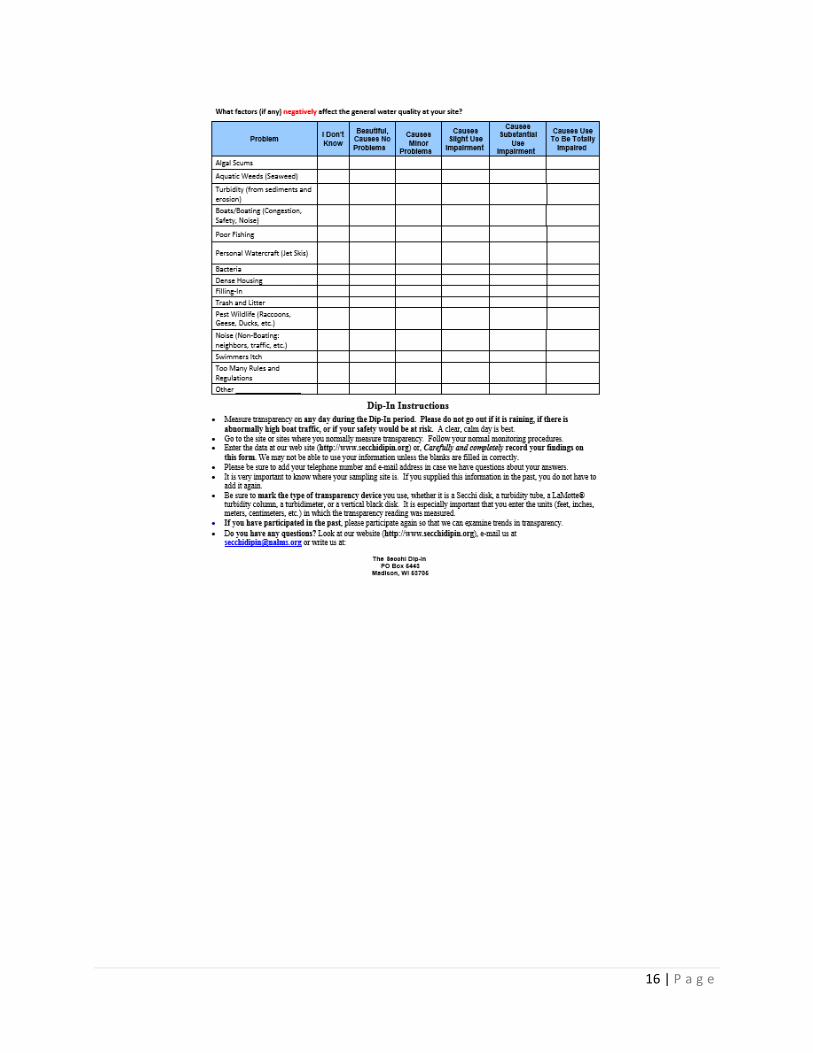
16 | P a g e

17 | P a g e
Appendix B:
Secchi Dip-In Survey Responses

18 | P a g e