The 2012 Equal Remuneration Sustainability Impacts … | P a g e Overview In 2012, the Fair Work...
34
The 2012 Equal Remuneration Order: Sustainability Impacts on Human Services Delivery in Western Australia June 2017 A Partnership between:
Transcript of The 2012 Equal Remuneration Sustainability Impacts … | P a g e Overview In 2012, the Fair Work...
The 2012 Equal Remuneration
Order:
Sustainability Impacts on Human
Services Delivery in Western
Australia
June 2017
A Partnership between:
2 | P a g e
Contents Overview ............................................................................................................................... 4
Recommendations ................................................................................................................ 5
Industry Response from WACOSS and CEWA ..................................................................... 7
Project Background & Context .............................................................................................. 9
The Human Services Sector in Western Australia ............................................................... 10
Sustainability and Human Services Organisations ........................................................... 11
Attributing Sustainability Impacts to the ERO................................................................... 14
Equal Remuneration Order ................................................................................................. 14
Potential Impacts on Service Users ................................................................................. 16
Potential Impacts on Government Policy & Increased Risk .............................................. 17
Potential Impact on the Human Services Sector .............................................................. 17
This Research ..................................................................................................................... 18
Methodology .................................................................................................................... 18
Report Limits ................................................................................................................... 20
Summary of key data ....................................................................................................... 20
The Impact of the ERO ....................................................................................................... 21
Organisational Impact ...................................................................................................... 21
Program Impact ............................................................................................................... 22
The Financial Impact Reported ........................................................................................ 23
Inherent Sustainability - (Pre ERO) .................................................................................. 23
Impact of ERO on organisation financial sustainability ..................................................... 25
Impact of ERO on Programs ............................................................................................ 26
Combined Impact – Organisational Sustainability & Program Profitability ........................ 26
How are Human Services Providers Responding? .............................................................. 27
Indicators of Sustainability .................................................................................................. 29
WA Government Agencies Most Impacted .......................................................................... 30
Recommendations .............................................................................................................. 30
Short Term Market Stewardship. ..................................................................................... 30
Recommendation One ................................................................................................. 30
Longer Term Market Stewardship .................................................................................... 31
Recommendation Two ................................................................................................. 32
Recommendation Three ............................................................................................... 32
Recommendation Four ................................................................................................. 32
Recommendation Five ................................................................................................. 32
Recommendation Six ................................................................................................... 32
3 | P a g e
Citation Information
This study was undertaken by the Curtin Not-for-profit Initiative, Curtin School of Accounting and commissioned by the Western Australian Council of Social Service and Community Employers WA. It was funded by Lotterywest.
Citation Information
This document should be cited as follows: Gilchrist, D. J., and P. A. Knight, (2017), The 2012 Equal
Remuneration Order: Sustainability Impacts on Human Services Delivery in Western Australia. A Report to the
Western Australian Council of Social Service, Perth, Australia.
The Curtin Not-for-profit Initiative
Curtin’s School of Accounting established the Curtin Not-for-profit Initiative in 2011 following a refocus of research objectives toward industry-ready research outputs that are readily applicable in practice. As such, the aims of the Initiative are to:
1) Develop a body of research focused on practical and implementable outcomes that will enhance the resilience, efficiency and the sustainability of the Not-for-profit Sector Australia-wide;
2) Build significant and effective industry engagement in order to identify and prioritise the topics of research, and to facilitate dissemination and discussion of the findings to the best effect for the sector; and
3) Build a body of up-to-date, Australia-specific knowledge that can be used to inform policy and practice within government, the Not-for-profit Sector and the broader community with a view to enhancing policy outcomes to the greater benefit of all Australians.
4 | P a g e
Overview In 2012, the Fair Work Commission issued an Equal Remuneration Order (ERO)
impacting the remuneration paid to staff falling under the Social, Community, Home
Care and Disability Services Award (SCHCDS) 2010;
The ERO provides for ‘above Award’ pay increases for social and community service
workers of between 23% and 45% over an eight-year commencing December 2012
to December 2020;
As such, by definition, the advent of the ERO will negatively impact the sustainability
of human services organisations. This research program was focused on assessing
the impact of the ERO on a subset of human services providers;
The aims of the ERO are well supported by human services organisations, but for
service provision to be maintained, it is imperative that the impact of the ERO be
understood in the context of individual service users, government policy and
expenditure, and human services providers. This report focuses on the impact of the
ERO on 19 significant Western Australian human services organisations, service
delivery and the programs they provide;
These 19 organisations employed 4,642 Full Time Equivalent (FTE) staff of which
3,090 FTE (or 67%) are impacted by the ERO. This represents 34% of total human
services personnel as reported on by Treasury in 2016. They turned over $352
million in 2015/16 and had combined employee expenditure of $250 million;
14 of the 19 organisations reported information that suggested they were not under
financial stress prior to the advent of the ERO. However, forecasting financial results
incorporating the ERO, 11 organisations of the 19 reported data that suggested they
would be under financial stress;
In terms of program sustainability, 282 programs were operated by these
organisations of which 182 (65%) were negatively impacted by the ERO by 10% or
more, impacting organisational sustainability in turn;
The results highlighted that the impact will be significant;
The participants reported that they were likely to reduce output, reduce quality,
reduce quantity, stop providing services and/or fund the extra expense from existing
assets, amongst other responses;
The research also highlighted a set of “Sustainability Indicators” that can be used to
assess the relative vulnerability of specific human services organisations so that
appropriate mitigations, including the provision of resources and the managed
winding up of some organisations can be effected; and
Our recommendations focus on the need for a balanced response using
established data collection infrastructure to determine the impact and assess the
appropriate response by considering each impacted organisation rather than
suggesting a blanket payment be made.
5 | P a g e
Recommendations
Recommendation One The WA Government develop and implement a plan to identify
the human services organisations at risk and to respond in a
balanced and effective way, including by:
using the Indicators of Sustainability as the first step in
identifying those organisations that are under significant
financial pressure but that are likely to be able to be supported
to recover their financial capacity. The funded human services
sector co-operate by providing the necessary information.
Department of Treasury and Department of Finance either
identify funding to ensure on-going supply or take other
measures to mitigate the impact of supply-side failure. Such
measures could include tightly focused top up funding for a
limited duration, re-negotiation of service contracts where the
contract does not allow for the additional costs incurred as a
result of the ERO to be recovered via current funding
arrangements, support to assist organisations to merge where
this could reduce financial risk, and support for wind up and
transfer of assets and operations to another provider.
Department of Finance advise all WA Government funded
human service organisations that no further money will be
forthcoming to bolster contracts. NFPs must develop their
costing and pricing systems, strategic plans etc. to ensure that
they are financially sustainable and not bid for contracts that
they cannot deliver.
Recommendation Two The WA Government adopt the Indicators of sustainability as a
method of assessing supply-side financial vulnerability in Not-for-
profit human services organisations receiving funding for service
delivery.
Recommendation Three That each WA Government agency procuring human services
communicate with those supplying organisations to indicate that, if
those organisations find they are under financial stress as a result
of the ERO, they should make that known to the agency and also
provide their Indicators of Sustainability together with their planned
response in order to allow the agency to assess the prospective
impact on service delivery and to devise a prospective way
forward in securing the supply-side.
Recommendation Four That the WA Government include an analysis of the Indicators of
Sustainability for all organisations providing human services to
funding agencies when they collect data for the annual Review of
the Sustainable Funding and Contracting with the Not-for-profit
Sector Initiative. While responding to this review is not mandatory
for funded organisations, the incentive will be there if organisations
are under financial stress.
6 | P a g e
Recommendation Five The Department of Finance communicate with all Not-for-profit
supply-side organisations and confirm that the meeting of the
ERO should be budgeted for within organisational budgets and in
any tenders forwarded to WA government agencies and that,
while the ERO will cause financial stress for some organisations,
the onus of providing for this cost will rest with human services
providers from the commencement of each new contract or
extension of existing contracts. In the meantime, WA government
agencies will consider approaches from those organisations
impacted by the ERO, which may include strategies such as
mergers and transfers of service programs to other, more financial
sound organisations. Finally, organisations may choose not to
seek this assistance but must be prepared to respond to financial
stress regardless.
Recommendation Six Those government agencies highlighted as impacted by the data
provided for this report respond to the implied risk by examining
the Indicators of Sustainability of their suppliers including seeking
their suppliers’ intended actions.
7 | P a g e
Industry Recommendations This is the response from WACOSS and CEWA on behalf of the community services sector
to the independent report by Curtin Not-for-profit Initiative on the impacts of the ERO on the
sustainability of services in WA.
Western Australian community services face a significant challenge from the impact of rising
wages on the cost of delivering services under current funding arrangements. We are very
concerned that we will see a significant reduction in the level and quality of services delivered
to the most vulnerable members of our community, and that service delivery in some areas
and some communities may become unviable.
The WA Government has not made provision in existing funding arrangements to keep up with
the rising cost of service delivery, and as this research demonstrates previous funding
increases are no longer sufficient to meet the cost of wage increases. This effect will be
compounded by the announcement after the completion of this research of a 3.3% increase
to the National Minimum Wage and associated modern awards, and the anticipated increase
to the State Minimum Wage.
We urge the WA Government to act on this issue with some urgency to ensure there are
provisions and processes in place to maintain the sustainability of essential services.
RECOMMENDATIONS
• The WA Government develop and implement a plan to ensure the sustainability
of essential community services.
• The 2017-18 State Budget include funding to maintain existing levels of essential
service delivery in light of the ERO, national and state minimum wage and award
wage increases as a matter of urgency.
• The WA Government overturn the decision of the former government to scrap
WA Labor initiated Non-Government Human Services Sector (NGHSS)
indexation of wage costs, and return to fair funding arrangements.
• The WA Government put in place arrangements for providers concerned about
the viability of services to voluntarily undertake a service sustainability
assessment to secure supplementary funding for existing contracts.
• Service providers undertake their own audit of service viability using the
‘indicators of sustainability tool’ and ensure they fully cost wage obligations into
future planning.
• The WA Government work with WACOSS and CEWA to seek top-up funding for Federal service contracts to cover the additional costs imposed by the Fair Work Commission National Wage Case adjustments.
The Fair Work Commission’s 2012 Equal Remuneration Order (ERO) requiring service
providers to pay increases of between 23% and 45% over 8 years (to 2020), was a significant
acknowledgement of the longstanding inequity in wages paid to workers in the community
8 | P a g e
sector. The current annual increases, while welcome for underpaid staff and supported by the
sector, are now proving unsustainable in the face of current funding arrangements and are
adversely impacting services. With over 400 organisations providing State Government
funded services, the impact on the sustainability of services, programs and organisations is
now a major concern for the State and the community sector. More importantly, this impact
will be felt most by those people who rely on services and support, often on a daily basis.
To better understand the extent of the impact, WACOSS and Community Employers WA with
the support of Lotterywest commissioned the Curtin Not-for-profit Institute to research the
impact of the ERO on service delivery. The findings in this report confirm that there is a critical risk to sustainable service delivery over the next 3 years and that any response needs to
be targeted in order to meet the needs of Western Australia’s most vulnerable citizens and to
ensure the budget constraints faced by government are balanced with those most in need of
our compassion.
The findings speak for themselves. The impact of the ERO is already being felt by all
organisations providing government funded services in WA. Treasury’s data shows that there
were 1500 contracts in operation in 2015 involving 14 government agencies and
approximately 400 service providers.1 If these service providers have a similar employee
expense profile to that of the cohort examined in the study, between 71% and 76% of recurrent
expenses (Figure 4 page 23) will be committed to employee remuneration, so there will be
significant cost implications in relation to the WA Government contracts and the services
provided.2
The decision of the Barnett government to overturn long-standing NGHSS indexation
arrangements (80% Wage Price Index / 20% CPI) has exacerbated this situation, and we urge
the McGowan government to take a principled position on fair contracting arrangements to
support fair wages and conditions for the community service sector.
Acknowledgements: WACOSS and CEWA wish to thank Professor David Gilchrist and Penny
Knight for their work in producing this highly valuable and insightful report. We also wish to
thank Lotterywest who provided the funding to make this research and report possible.
9 | P a g e
Project Background & Context In July 2012, the Fair Work Commission issued an Equal Remuneration Order (ERO)
impacting the remuneration paid to staff falling under the Social, Community, Home Care
and Disability Services Award (SCHCDS) 2010. The aim of the ERO is to ensure that there
is equal remuneration for men and women workers for work of equal or comparable value.3
The purpose of this report is to provide the reader with findings and recommendations
regarding the potential impact of the ERO and reasonable responses needed to ensure
continuity of service delivery to WA’s most vulnerable people.
The ERO impacted human services providers in Western Australia (WA) by increasing the
remuneration to be paid to relevant staff in progressive annual increments over eight years.
By definition, the ERO will negatively impact the financial sustainability of all affected
organisations. It is the magnitude of this impact and the subsequent impact on service
delivery that is the most important question.
The provision of human services is labour intensive with more than half and often 75% or
more of total expenditure allocated to employee expenses. As such, the ERO cost increases
are likely to have an impact of such a magnitude as to threaten the ongoing survival of some
organisations providing human services in WA.4
Governments are the single largest funder of the human services sector in Australia and
their budgets have been under increasing financial pressure in recent years. This budget
pressure is being passed on to service providers implementing government policy via
funding that is based on budget allocations rather than comprehensive cost of service
delivery, via limited increases in funding year-on-year which do not meet current cost
increases, and via specific program cuts.
The WA budget is no different with an increasing budget deficit and increasing debt driving
calls for government parsimony.5 The new Labor government has announced plans for a
review of expenditure priorities. Amongst other things, this will consider current WA
government funding for human services organisations providing services in accordance with
government policy. This initiative represents an important prospect as a circuit breaker,
allowing the new government to take stock and reflect on the prospects for re-establishing a
funding regime that works for its human services priorities.
Governments’ responses can be varied. For instance, Victoria’s state government has
responded by increasing its prices used to fund service providers by $935 million, while this
report suggests that a much more nuanced and targeted process be used to ensure the
public purse is not over compensating for the additional costs incurred by human services
organisations at no fault of their own.
This is important for the WA community because a well-structured, efficient and effective
human services sector can increase the economic and social participation of individuals
within the WA community, improve the life expectations and outcomes for many thousands
of supported individuals, and create significant economic activity that, in turn, generates
positive economic outcomes for all West Australians.
The aims of the ERO are well supported by human services organisations, but for service
provision to be maintained, it is imperative that the impact of the ERO be understood in the
context of individual service users, government policy and expenditure, and human services
providers. Information on the impact of the ERO will support the development of a response
that ensures the ongoing provision of high quality, reliable services, maintains and protects
10 | P a g e
government’s capacity to implement its policy framework, and protects the capacity of the
sector (not necessarily individual organisations) so that the considerable investment made to
date, the intellectual property and the experience inherent in the sector are retained in WA’s
long term interest.
It is not possible to easily identify all organisations affected by the ERO let alone conduct a
census of organisations to assess its impact. Further, the government-funded human
services sector is very complex and even within individual sub-sectors, it is clear that no two
organisations are identical. As such, any investigation must be based on a sample drawn
from the total population. For this project, we sought to develop an understanding of the
impact of the ERO on a small but significant sub-group of the human services sector in WA
as measured by employee numbers. As such, we asked 48 of the most significant human
services organisations by size to participate and 19 agreed and provided data. In all, these
19 organisations employed 4,642 Full Time Equivalent (FTE) staff of which 3,090 FTE (or
67%) were impacted by the ERO. This represents 34% of total human services personnel as
reported on by Treasury in 2016.6 Therefore, these findings are relevant to a significant
proportion of staffing in the WA human services sector. The results have been analysed
closely to assess the current and prospective impact of the ERO on service provision and
service providers, and therefore the risks that services may not be provided.
In addition to examining the impact of the ERO on the individual organisations included in
the sample, this study also sought to identify the “Indicators of Sustainability” that are likely
to enable policy makers to better understand the impact of the ERO on different types of
organisations and to develop a policy framework that will mitigate negative impacts while
ensuring the efficient and effective use of public funds. These indicators can then be used to
identify at-risk organisations, allowing for the development of targeted mitigations, including
funding, controlled mergers and controlled windups.
The Human Services Sector in Western Australia The human services sector in WA is a critical part of the social infrastructure of our
community. It provides:
- Support and services to WA’s most vulnerable people;
- A conduit for the achievement of government social and health policies;
- A conduit for volunteer and donated resources to be applied to service needs;
- A repository of intellectual property, experience and capacity in terms of service
delivery providing the greatest opportunities for innovation; and
- Considerable economic activity that employs people and supports downstream
industry.
Non-government human services providers can be For-profits or Not-for-profits, but at
present a significant majority are Not-for-profit (NFP) organisations. We have very little
information on the size and operations of the whole NFP sector in WA, but a recent report
examining newly available data has found that charities alone:
- Employ approximately 93,000 people or about 7% of the WA workforce;
11 | P a g e
- Generate income of approximately $12.7 billion, of which only 41% is sourced from
governments, allowing government funding to be leveraged via other sources and
increasing the prospects for meaningful outcomes for the community;
- Expends approximately $5.8 billion on employee wages and related costs, increasing
overall economic demand.
- In some rural and remote areas, the provision of services via the human services
sector has the effect of supporting people to participate in every aspect of the
community, including to provide much needed employment opportunities in some
areas where such opportunities are scarce if not entirely absent.
The WA Government contracts with approximately 400 organisations to deliver its policy
framework relevant to 14 government departments.7 These services range from child
protection and disability services to housing, regional and remote community services and
corrective services—the infrastructure, intellectual property and experience of this sector is
critical to government and cannot be easily and readily replaced. The human services sector
can often deliver the human services and supports needed more effectively and cheaper
than government can deliver such services in its own right.8
The WA government and the sector itself need to closely monitor the supply-side to ensure
that there continues to be a strong, efficient, effective and competitive range of service
providers available to fulfil both government contracts and to continue to deliver any other,
self-funded essential human services. If service providers collapse due to increased cost
pressures, the ability of government to deliver its policy will be impacted and extra costs will
no doubt be incurred by the public purse.
This does not mean that individual human service organisations should be protected or
supported regardless of the level of efficiency and effectiveness they achieve, but rather that
the assets and total capacity of the sector as a whole should be monitored and its
development should be planned. Indeed, where individual organisations are not
sustainable, an orderly transfer of assets, staff and capacity to alternative providers is a far
better outcome than the loss of that infrastructure and capacity out of the sector. An
understanding of sector sustainability in the context of the impact of the ERO is a critical
element here.
Sustainability and Human Services Organisations The assessment of, and response to, the impact of the ERO is a particularly important
process that will allow government and the sector to assess the extent of the impact on
sustainability of service delivery and to respond in the interests of the service users and
government investment over time.
Research has found that, inter alia, the following elements are indictors of NFP organisation
vulnerability:9
- Loss of profitability
- Lack of diversity of income sources
- Reduced ability to pursue mission
Other indicators include cash flow tightening, incapacity to replace assets, and incapacity to
implement change or improve services.
12 | P a g e
Building on the academic literature, sustainability in a human services organisation can be
defined for our purposes here as the ability of the organisation, in the short-, medium- and
long-term, to continue to:
- Deliver the same quantity of services;
- at the same quality; and
- at the same time; while
- remaining solvent.
This does not mean that an organisation is only sustainable if it does not change the way it
delivers services. Indeed, sustainability can be increased by providing services in different
ways, particularly in the context of client-centric services delivery while efficiency can be
increased by increasing service delivery output while maintaining current administrative
capacity. However, if for instance a human services provider faces increased costs and
reacts by reducing the quantity or quality of service delivery, it is demonstrating that it is not
sustainable—it has reacted to this lack of sustainability by reducing its contribution,
impacting service users, government policy and the organisation itself.10
Broadly, when considering the sustainability impacts of the ERO, we are concerned with the
financial sustainability of human services organisations and in turn, the services delivered.
Financial sustainability can mean differing things at different times. Indeed, those charged
with governance of human services organisations will consider sustainability in the following
broad time frames:
Short Term Sustainability: The ongoing solvency of an organisation is a critical
element of sustainability. The ability to pay bills as and
when they fall due ensures that the organisation can
continue to provide services and pursue its mission,
providing the financial foundation of the organisation
allowing it to implement its strategic plans. Without
solvency, the organisation will not be able to continue
to provide services and an organisation impacted by
the ERO will experience a reduction in its short term
sustainability.
Typically, a loss of short term sustainability creates
a crisis—organisations becoming insolvent must react
quickly to limit the economic damage they cause to
creditors and staff and the impact on service users, and
this may include the abrupt discontinuation of services.
Medium Term Sustainability: An organisation is sustainable in the medium term if it
is profitable. While most human services organisations
are Not-for-profit or charitable, they still need to achieve
a profit in order to build their balance sheet, creating
resources that can be applied to: (1) the pursuit of the
of the strategic plan; (2) the re-organisation of the entity
in order to meet the client-centric nature of modern
service funding regimes; and (3) to be able to maintain
service delivery capacity in the context of staff training,
service re-design and sound governance reporting
processes.11
13 | P a g e
A loss of medium term sustainability is most likely
to impact service quality and reliability. As those
charged with governance react to the loss of
sustainability generally felt in falling profits and
increased risk to solvency over time, they may feel they
need to cut costs by reducing service quantity if
possible—the increasing application of faux market
funding regimes may reduce their capacity to reduce
service quantum due to the transactional nature of the
funding arrangement—quality and/or reducing reliability
by reducing their use of agency and casual staff as well
as becoming less flexible in terms of services to
groups.
Long Term Sustainability: In the long term, the sustainability of an organisation is
related to the ability of the organisation to invest to
replace assets and build reserves in order to be able to
invest to: (1) improve services in the context of
changing client needs and expectations; (2) respond to
technological change in order to be efficient and to
focus resources where they can best meet mission
needs; and (3) to invest in strategic objectives such as
growth, organisational change and diversification of
services delivered.
A loss of long term sustainability is most likely to
manifest in a lack of ongoing investment in
organisational improvements and infrastructure.
This is a starvation model of declining sustainability
where the organisation gradually becomes less able to
meet their service users’ needs, inefficient and less
able to recruit and retain clients.
Of course, gradually decreasing sustainability can be difficult to identify as insolvency creeps
up on organisations. As such, failing sustainability at any time interval will lead to the demise
of the organisation.
Clearly then, a major element of sustainability in the short, medium and long term relates to
financial capacity. Achieving profitable operations is critical to building financial capacity and
the ERO will impact this by increasing costs in an environment where prices achieved for
service delivery are not necessarily responsive to cost of service delivery.
The evaluation of sustainability in these temporal frames is important as it will guide the
response that organisations and funders may implement in order to ensure the sustainability
of human services delivery over time. As such, organisational analysis needs to be
undertaken to determine:
(a) Whether the ERO will impact an organisation;
(b) What financial resources / reserves an organisation has in order to avoid solvency
issues in the short term; and
14 | P a g e
(c) What capacity does the organisation have to invest to meet the challenge of the ERO
in the medium and long term?
The indicators of vulnerability are intended to highlight the relevant elements necessary to
answer the above questions.
Attributing Sustainability Impacts to the ERO The advent of the ERO will, by definition, reduce the sustainability of all human services
providers affected by it—staff costs will rise as will the value of existing staff entitlement
liabilities. However, this impact will not necessarily make organisations unsustainable: some
will already have been financially stressed, some will now become financially stressed and
some will remain sustainable, but in a reduced way.
However, historical underfunding of human services was recognised in the 2009 Economic
Audit Committee’s report12 and responded to in part by the WA Government’s Sustainable
Funding and Contracting with the Not-for-profit Sector Initiative which provided for two
tranches of top up funding over a period of two years.13
Indeed, at any point in time across a population of organisations, some will be struggling to
remain sustainable, some will be breaking-even and maintaining their size, and others will be
profitable and growing—all in the context of changing government policy, a changing service
delivery profile and changing service user demands. Therefore, we sought to understand the
direct impact of the ERO on organisational sustainability net of the sustainability trajectory
the sample of organisations were already on. This allowed us to define the likely
sustainability impact attributable to the ERO. Specifically, we sought to understand whether
the ERO will impact organisational capacity to maintain service output by requiring each
organisation to consume assets, shift resources from other areas or put at risk its future
viability.
To assess the impact of the ERO, we evaluated the existing sustainability status of the
organisation or base-case at a point in time—30 June 2016—by asking organisations to
consider their sustainability trajectory before and after the ERO.
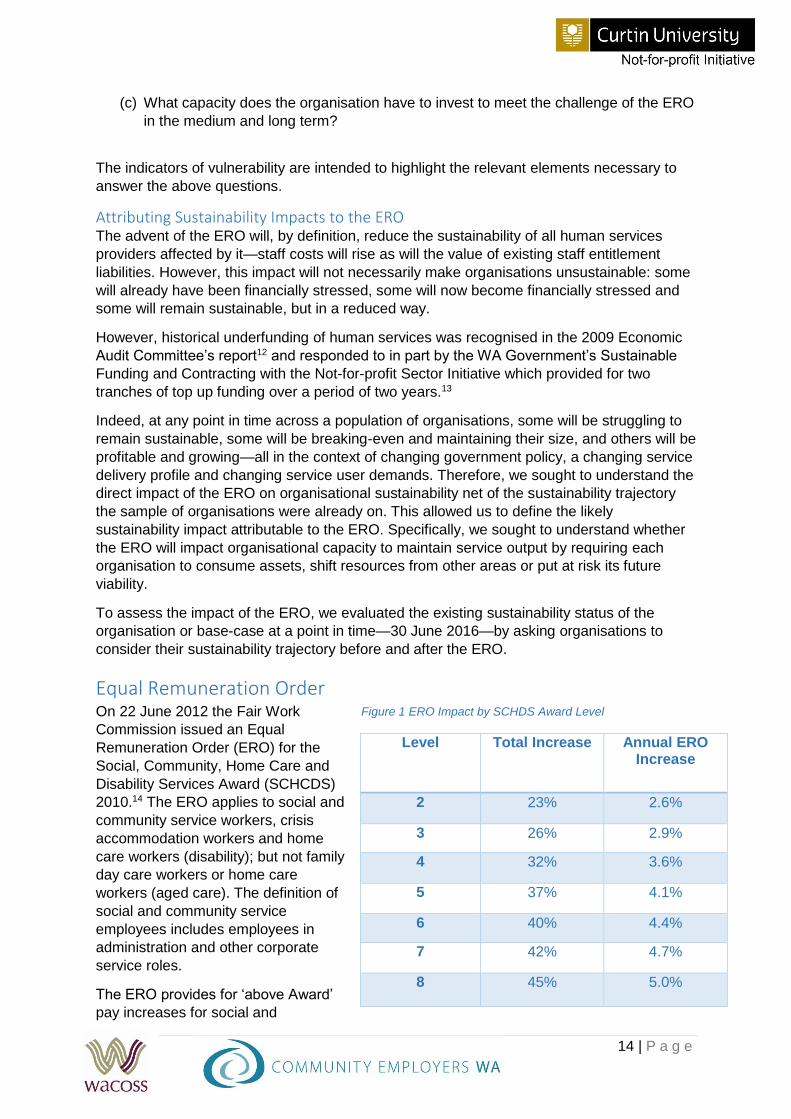
Equal Remuneration Order On 22 June 2012 the Fair Work
Commission issued an Equal
Remuneration Order (ERO) for the
Social, Community, Home Care and
Disability Services Award (SCHCDS)
2010.14 The ERO applies to social and
community service workers, crisis
accommodation workers and home
care workers (disability); but not family
day care workers or home care
workers (aged care). The definition of
social and community service
employees includes employees in
administration and other corporate
service roles.
The ERO provides for ‘above Award’
pay increases for social and
Level Total Increase Annual ERO Increase
2 23% 2.6%
3 26% 2.9%
4 32% 3.6%
5 37% 4.1%
6 40% 4.4%
7 42% 4.7%
8 45% 5.0%
Figure 1 ERO Impact by SCHDS Award Level
15 | P a g e
community service workers of between 23% and 45% over an eight-year period
commencing December 2012 to December 2020. Therefore, the ERO has already impacted
the relevant service lines and figure 1 shows the impact by SCHDS Award level.
These increases are in addition to the Fair Work Annual Wage Review (AWR) which applies
to Modern Awards from 1 July each year. Past AWR increases have also been substantial.15
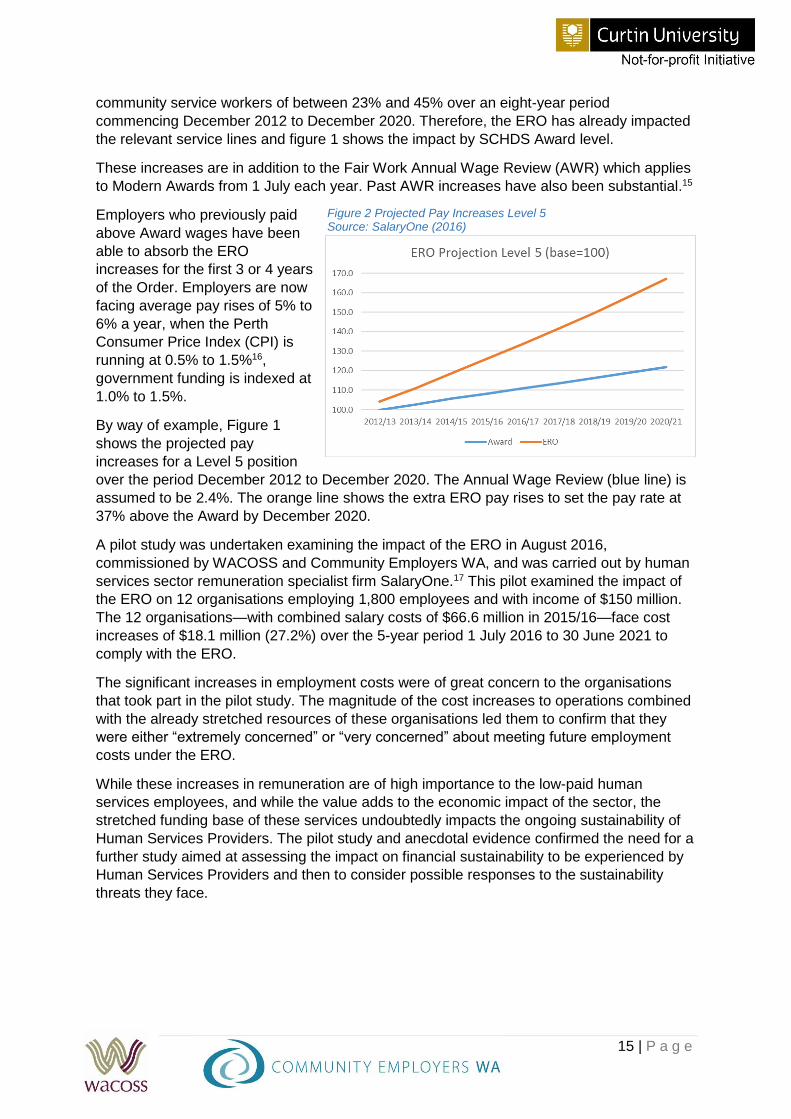
Employers who previously paid
above Award wages have been
able to absorb the ERO
increases for the first 3 or 4 years
of the Order. Employers are now
facing average pay rises of 5% to
6% a year, when the Perth
Consumer Price Index (CPI) is
running at 0.5% to 1.5%16,
government funding is indexed at
1.0% to 1.5%.
By way of example, Figure 1
shows the projected pay
increases for a Level 5 position
over the period December 2012 to December 2020. The Annual Wage Review (blue line) is
assumed to be 2.4%. The orange line shows the extra ERO pay rises to set the pay rate at
37% above the Award by December 2020.
A pilot study was undertaken examining the impact of the ERO in August 2016,
commissioned by WACOSS and Community Employers WA, and was carried out by human
services sector remuneration specialist firm SalaryOne.17 This pilot examined the impact of
the ERO on 12 organisations employing 1,800 employees and with income of $150 million.
The 12 organisations—with combined salary costs of $66.6 million in 2015/16—face cost
increases of $18.1 million (27.2%) over the 5-year period 1 July 2016 to 30 June 2021 to
comply with the ERO.
The significant increases in employment costs were of great concern to the organisations
that took part in the pilot study. The magnitude of the cost increases to operations combined
with the already stretched resources of these organisations led them to confirm that they
were either “extremely concerned” or “very concerned” about meeting future employment
costs under the ERO.
While these increases in remuneration are of high importance to the low-paid human
services employees, and while the value adds to the economic impact of the sector, the
stretched funding base of these services undoubtedly impacts the ongoing sustainability of
Human Services Providers. The pilot study and anecdotal evidence confirmed the need for a
further study aimed at assessing the impact on financial sustainability to be experienced by
Human Services Providers and then to consider possible responses to the sustainability
threats they face.
Figure 2 Projected Pay Increases Level 5 Source: SalaryOne (2016)
16 | P a g e
As indicated above, the ERO will, by definition, reduce all affected human services
organisations. It will reduce sustainability by virtue of the increase in staff costs. Those cost
increases will have three essential components:
1) the increase in affected staff hourly rates;
2) the increase in on-costs including superannuation, workers’ compensation insurance
and any other costs that are incurred as a proportion of the rate of pay; and
3) an increase in affected staff leave liabilities which will all be payable under the new
rates of pay.
All of these costs will be incurred by affected human services organisations without them
having the capacity to recover the costs through pricing in the way that entities operating in a
market are able to do.
Previous research has shown that NFP organisations do not necessarily have the balance
sheet capacity (reserves and fungible assets18) to meet the challenges of sustainability in the
short-, medium- and long-term. Research has also shown that to maintain sustainability
when there is a significant change to the cost base of operations, the lack of balance sheet
capacity can impact the ability of the organisation to be solvent in the short-term or to have
sufficient capacity to reinvest.
As such, there are two essential issues faced by organisations in the context of sustainability
and their financial performance:
1) Can they derive sufficient profit to be operationally sustainable in the short-, medium-
and long-term; and
2) Do they have, or can they generate, sufficient financial resources to meet the
challenges of change requirements over time?
If they cannot do these things, then the potential is for organisations to become defunct—
they either run out of money or they are no longer able to meet the needs of their service
users and funders.
If the ERO impacts the profitability of an organisation and there is no prospect for mitigating
this negative outcome, the impact will be felt by service users, government and human
service providers themselves.
Potential Impacts on Service Users Service users require reliability, certainty and quality in the services and supports they rely
on. While it may seem that they can simply transfer their demand to a new service provider,
the reality can be very different:
- Those charged with governance of an insolvent organisation have responsibility for
limiting the impact of insolvency on creditors and staff and so the implications of
insolvency for a client can be an immediate withdrawal of supports without a
replacement or warning.
- Creeping unsustainability can impact service users in terms of reliability and quality
of service delivery initially imperceptibly then in an increasing way. Service users
may become accepting of the poor service or mechanisms designed to identify poor
quality services or other issues, such as internal assurance processes, may be
17 | P a g e
reduced or removed in order to cut costs and so it may be some time before these
issues are identified if at all.
- A reduction in quality or clinical standards brought about by a reduction in senior
staff, staff numbers or appropriately qualified personnel may well put service users’
health and wellbeing at risk.
Potential Impacts on Government Policy & Increased Risk Government relies on human services organisations to deliver policy outcomes and to
support some of our community’s most vulnerable people. It also has a significant financial
exposure to these service providers. For instance, in 2015 and in terms of Not-for-profits
alone, the government held contracts for services with human services organisations of
$1.65 billion.19 As a result, a reduction in the sustainability of a human services organisation
impacts government by:
- Reducing the capacity available to meet policy objectives;
- Placing government in the position of provider-of-last-resort or of having to pay a
premium to meet support needs within a timeframe that serves the client in the
context of clinical risk;
Placing government at risk as a result of service quality and clinical risks exacerbated
by a lack of resourcing provided to service providers; and
Placing public funding resources at risk.
While the ongoing sustainability of an individual organisation may not be of interest to
government in general terms, government has a very real interest in ensuring an efficient
and sustainable supply-side. Besides the economic advantages inherent in ensuring
sustainability of the human services sector,20 government also faces considerable political
risk if it allows a significant reduction in service delivery to occur.
Potential Impact on the Human Services Sector It is not intended that this report suggest that the failure of a service provider should be
prevented at all costs or that failure of individual organisations is necessarily bad. Indeed,
the failure of individual service providers is part of the ongoing renewal process in a healthy
economic sector. However, the advent of the ERO will likely exacerbate the already difficult
financial circumstances of otherwise healthy and contributing service providers.
Further, while it may be argued that the demise of one or two organisations is a part of the
natural order of things, the systemic failure of a number of organisations will likely result in a
significant negative impact on the sector as:
- Experienced and trained staff find it necessary to leave the sector in order to gain
employment;
- The assets of the organisation may be disbursed outside of the sector reducing
infrastructure capacity available for service delivery, especially if it is insolvent and a
fast wind up is required; and therefore,
- The loss of service delivery capacity will impact service users and government,
leaving both vulnerable.
18 | P a g e
The faster an organisation declines, the more likely the above outcomes occurs and the less
control government and the organisation itself has over the disbursal of assets and staff.
It is important that the ERO is not allowed to cause an uncontrolled re-construction of the
sector as the destructive impact of such change is likely to be considerable and result in
significantly diminished services access and quality for service users, and both political and
economic impacts to government.
This Research This research project was developed to gain an understanding of the potential impacts
associated with the ERO and its application in the human services sector in WA. The
intention is to use this analysis to inform the development of policy that will enhance
outcomes for service recipients and government while maintaining an efficient, innovative
and functioning Human Services delivery supply-side.
The human services sector is highly diverse both in terms of the subsectors it supports and
in terms of the variation between Human Services Providers within each subsector. No two
organisations are identical, therefore no two organisations are identically impacted by the
ERO.
This diversity is a strong and important feature of the sector, allowing for greater innovation,
person-centred care and giving service users opportunities to exercise their choice and
control over the types of services provided, when they are provided and by whom.
However, the diversity also makes a sound policy reaction to the effects of the ERO very
difficult to develop. A ‘one size fits all’ approach is, by and large, not an effective way forward
and it is in government’s interest (as well as service users’) to develop a nuanced and
thoughtful policy to the appropriate mitigation of the negative impacts of the ERO.
The impact of the ERO on individual Human Services Providers will depend on their financial
position and the nature and amount of any reserves they have accumulated, their historical
financial performance, the structure of the staffing arrangements in the context of award
levels of staff, and the types of services they provide and funding those services attract—
both in terms of the amount of funding and how it is delivered.
Methodology Given the diversity and complexity of the Human Services Sector, this project was
implemented in such a way as to try to identify the implications of the ERO on specific
organisations in the context of their size by turnover, the services they deliver and their
balance sheet position.
There is no data on the population of organisations that are effected by the ERO, so it was
not possible to select a sample that is representative of the sector. Instead, the approach
taken was to focus on surveying the largest providers of human services, as the failure of
one or more of these organisations or the programs they provide would present a greater
risk of supply side failure, with concomitant risks to service users, departmental budgets, as
well as political risks. This sample was supplemented by a number of smaller, more
specialised organisations to determine if they were more or less impacted by the ERO than
the larger organisations.
Our intention was to seek data from 20 large Not-for-profit human services providers on the
basis that in WA, 4% of the largest charities account for almost 76% of income and 73% of
19 | P a g e
employment in the sector.21 In all, 19 Human Service Providers were recruited to the project
after creating a list of 48 potential participants and seeking interest. .
This allowed the analysis to consider the impact of the ERO on the organisations providing
the most services. However, it is also likely that smaller organisations may be more
vulnerable to financial stress due to their lack of resources and capacity to manage changes
such as the ERO. Small organisations may be more easily managed through a financial
crisis than larger organisations on an individual basis as service users can be more easily
absorbed by other providers due to their low numbers, the collapse of a number of
organisations simultaneously represents significant problems to the service recipients who
bear the risk, to government and the broader sector.
All data provided by these participants was guaranteed to be reported anonymously and so
any data, or the framing of that data for reporting purposes, that can directly or by inference
identify participants has not been included in the findings here. To retain this anonymity, we
have also found it necessary not to disclose the program names as this could inadvertently
have identified a number of participants. We do not feel this diminishes the findings or the
logic of the recommendations provided.
For data collection, we developed two MS Excel templates—one for those organisations
subject to the SCHDS Award and the other for those organisations subject to State Awards.
Each participant was asked to provide data via the appropriate template which was
developed to capture the following information types:
- Organisation name and entity type;
- Name, service category and funding source for all contracts and programs;
- Employee headcount and full-time equivalent by ERO coverage status and type (full-
time, part-time or casual);
- Number of enterprise agreements and names;
- ERO compliance status (below, equal to or above) and percentage above or below
award;
- 2015/16 income and expenses breakdown and 2016/17 budget;
- 2015/16 assets and liabilities breakdown; and
- Potential actions as a result of salary cost changes
We also asked the participants to provide data relating to the six most significant programs
they operate under the following heads of data:
- Employee headcount and full-time equivalent by ERO coverage status and type (full-
time, part-time or casual);
- 2015/16 salaries and on-costs for ERO covered staff and percentage above or below
ERO;
- Income for 2015/16 and forecasts for 2016/17 to 2021/22 financial years and source
(State, Commonwealth, Other);
- Contract indexation rate for 2015/16 to 2021/22 financial years;
- Salary costs for 2015/16 and forecasts for 2016/17 to 2021/22 by ERO status (total,
SCHCDS award staff, non-SCHCDS award staff);
- All other costs for 2015/16 and forecasts for 2016/17 to 2021/22; and
- Potential actions as a result of salary cost changes
Some of the larger organisations have over 40 programs running at any one time, but it
would have been too onerous for these organisation to provide data on all of these.
20 | P a g e
Therefore, organisations were asked for detailed data on the six largest programs impacted
by the ERO only. Respondents were given the option of providing data on another program if
they wished.
The results included in this section attempt to take into consideration the contracted
indexation arrangements as well as the broader financial position and performance of the
participants. Equally, we have sought to identify the state government’s risk areas as well as
the funding sourced from the Commonwealth.
Report Limits Because of the level of complexity inherent in the Human Services Sector; the differing
experiences and financial position and performance of each member of the sector; the
different impacts of the ERO; and, the sampling approach the results discussed here do not
necessarily lend themselves to extrapolation across the entire sector.
Funding mix, service mix, service location, size by turnover, employee types, relevant
awards, and the variations of support requirements of individuals within the same service
subsector all impact the response capacity organisations have. This complexity makes it
very difficult and very costly to undertake research and develop a model that encompasses
all aspects of the sector.
Additionally, the service providers examined were all located in Perth and, while they may
have operations outside of the Metropolitan Area, the impact of the ERO in regional, rural
and remote locations has not been considered. While some service providers will support
people in CALD communities, we have not undertaken any research focusing on the
nuances associated with these service recipients which can add cost and complexity to the
process.
While the findings from the research are not sufficiently uniform to enable extrapolation to
the entire sector, they do allow us to identify the indicators of vulnerable organisations in
order that policy makers and service providers can assess the impacts on vulnerability
represented by the ERO.
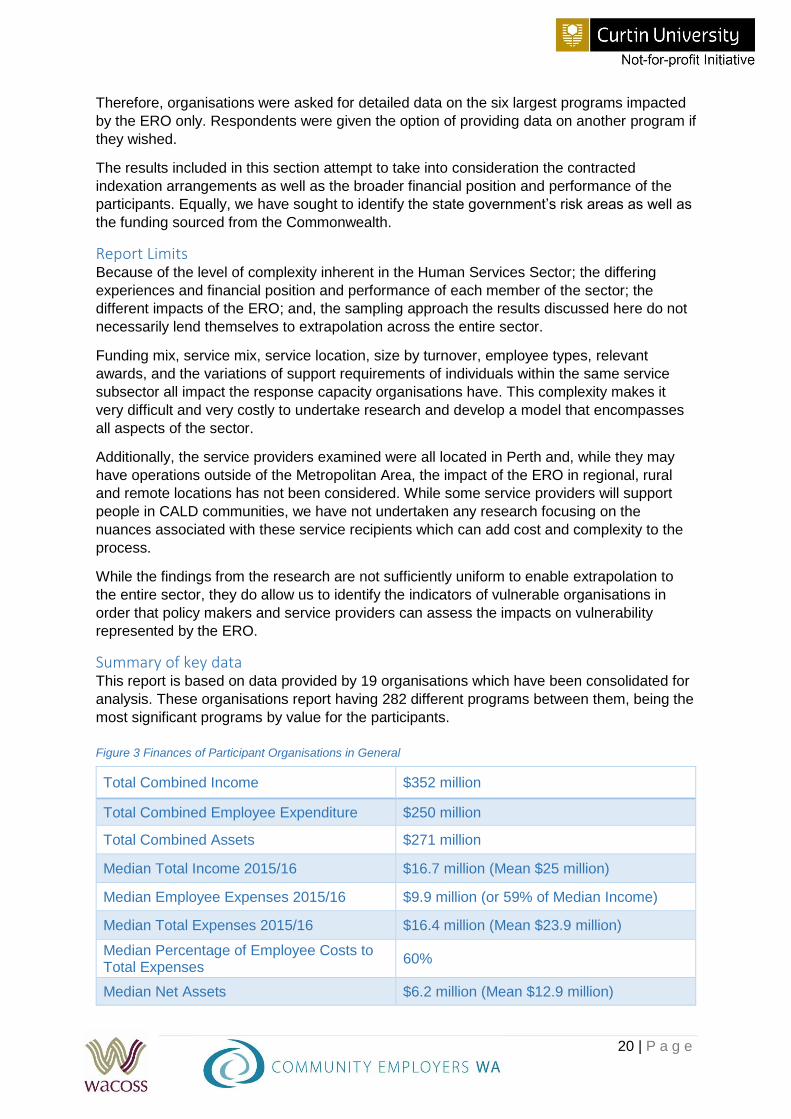
Summary of key data This report is based on data provided by 19 organisations which have been consolidated for
analysis. These organisations report having 282 different programs between them, being the
most significant programs by value for the participants.
Total Combined Income $352 million
Total Combined Employee Expenditure $250 million
Total Combined Assets $271 million
Median Total Income 2015/16 $16.7 million (Mean $25 million)
Median Employee Expenses 2015/16 $9.9 million (or 59% of Median Income)
Median Total Expenses 2015/16 $16.4 million (Mean $23.9 million)
Median Percentage of Employee Costs to Total Expenses
60%
Median Net Assets $6.2 million (Mean $12.9 million)
Figure 3 Finances of Participant Organisations in General
21 | P a g e
The participant organisations employed 4,642 FTE of which 3,090 FTE are impacted by the
ERO. Interestingly, the WA Treasury’s analysis of the sector described above reports on
data collected in 2015 from 158 organisations employing 9,100 FTE. Therefore, while not
necessarily easily extrapolated, this sample represents 51% of total employees considered
in Treasury’s evaluation while those employees impacted by the ERO represent 34% of that
total reported by Treasury. 22
The majority (11) report paying rates above the total of the SCHCDS awards and ERO, while
one reported paying at SCHCDS and ERO level. No organisations reported paying below
award rates. Of the organisations that reported paying above SCHCDS and ERO, the
median of the above award payment was 4.4% (mean = 6.6%).
The Impact of the ERO This section summarises with the impact of the ERO on the specific organisations
examined—at an organisation level and at a program of service level. It provides an
indication of the scale and impact on organisations.
Organisational Impact When assessing the findings it is important to note the following.
1) This research focusses on identifying the impact of the ERO on State Government
funded programs. The impact on programs funded by the Commonwealth Government is
the responsibility of the Commonwealth Government.
2) This research and analysis is not intended to facilitate a reaction regarding funding for
these specific organisations. Instead, the aim is to present the data as reported and
interpret the findings objectively.
3) Vulnerability has been assessed by considering the marginal impact of the increased
cost caused by the ERO. This leads to three further notes:
a. Where organisations indicated that they paid above award rate, we have
assumed that the ERO will be met out of that above award margin rather than
being added to the above award margin;
b. Therefore, we have been conservative in the analysis by suggesting that the
organisations involved will not choose to maintain the above award rate gap
that they paid to staff prior to the ERO but would allow the ERO to be
absorbed into any above award payment thus reducing that above award
payment by the value of the ERO. In some cases, this may mean that there
will still be an ERO balance to be paid and in others it means that the ERO
may be entirely paid out of the over award payment.
c. Importantly, if an organisation pays above award and chooses to pay the
ERO in addition so that they maintain the above award gap, the financial
impact of this relates to a strategic decision that the organisation makes
rather than an imposed extra cost. Notwithstanding such a decision may be
strategically logical for an organisation in the context of their recruitment and
retention strategies, the increased cost is an optional impost rather than a
mandatory one.
22 | P a g e
4) As the ERO will increase the costs of service provision it will have a negative financial
impact on all organisations covered by the relevant awards. This impact will either:
a. Not affect financial sustainability in the short or long term. That is, their financial
outcome will reduce in accordance with the cost of the ERO but not sufficiently to
cause financial distress;
b. Reduce the sustainability of previously financially healthy organisations such that
they become financially stressed; or
c. Further reduce the sustainability of organisations that were under financial stress
prior to the introduction of the ERO, possibly to the point at which their board
believes they are no longer viable.
5) In addition to the data from the organisations surveyed, we have identified indicators of
sustainability that can help to identify the organisations that may be most negatively
affected by the ERO. However, these are indicators only and given the heterogeneity of
the sector, may not be relevant in all cases. They provide a basis for initial screening of
organisations but will not categorically confirm whether financial weakness exists;
6) Furthermore, some organisations may be in financial stress or may be heading in that
direction but not be identified by the indicators. Similarly, an organisation may appear
financially distressed when in fact it is sustainable. This is because:
a. the indicators are historical rather than prospective. They are using historical
data to predict the future and cannot be reflective of recent decisions made
within the organisation or by funders and others which may alter the apparent
financial sustainability of an organisation;
b. the indicators are created out of data at a high level and are not sensitive
enough to identify all or detailed issues related to financial performance; and
c. the indicators do not necessarily differentiate between the pre- and post-ERO
impact in terms of causes of financial stress.
Program Impact Typically, human services organisations are funded to provide services under a contractual
or other arrangement. We are concerned here with those activities funded by the WA
Government and which for our purposes we called programs. A program is an area of
service provision activity that is funded/remunerated by government and which is a
universally accepted description of the service itself. As such, a program might relate to a
service type, a package of services types, the service user type and/or the location or
community in which the service is provided. Typically, a program aligns with a contract for
service.
It is important to note that, in relation to programs:
1. The ERO does not impact an organisation because of specific programs—that is, it is
the employment arrangements and the nature of the award and salary rates at the
corporate level that impact the application or otherwise, not the specifics of each
program;
23 | P a g e
2. However, an analysis of the programs undertaken by each participant is critical
because:
a. Program profitability contributes to organisational financial sustainability;
b. Organisations impacted by the ERO—regardless of whether they become
unsustainable or have a reduced sustainability—will likely react to that impact;
c. Not all programs are necessarily impacted by the ERO. However, where
program sustainability or corporate sustainability is reduced by the ERO,
those charged with governance must consider their reaction in order to
reduce the risk to their organisation;
d. In terms of the reaction of those charged with governance, those programs
not impacting sustainability or marginally reducing sustainability may be
retained—perhaps in a modified form—while those that impact organisational
sustainability in a substantial way may induce organisations to a more
significant response, including by discontinuing a program or service;
e. Such a reaction may include the reduction or cessation of a program, or
programs thus impacting government policy implementation and service
reliability for service users; and
f. It allows identification of the types of human services that are most likely to be
impacted within and across government agencies.
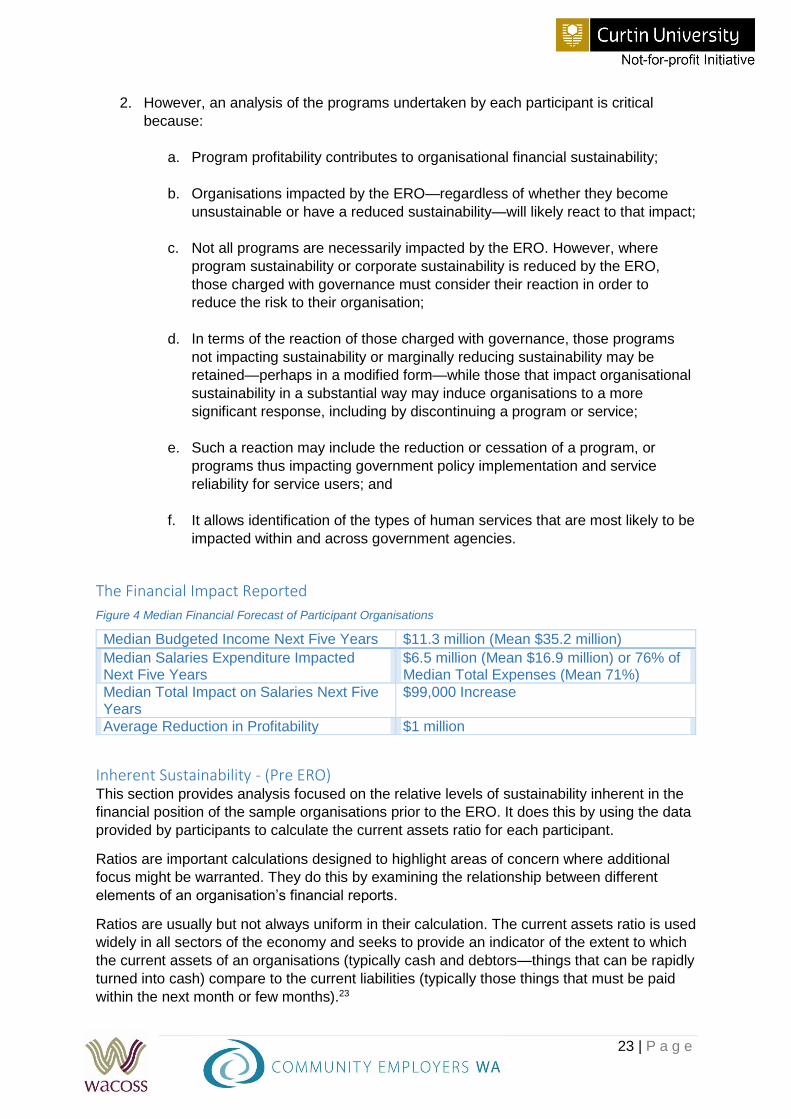
The Financial Impact Reported
Median Budgeted Income Next Five Years $11.3 million (Mean $35.2 million)
Median Salaries Expenditure Impacted Next Five Years
$6.5 million (Mean $16.9 million) or 76% of Median Total Expenses (Mean 71%)
Median Total Impact on Salaries Next Five Years
$99,000 Increase
Average Reduction in Profitability $1 million
Inherent Sustainability - (Pre ERO) This section provides analysis focused on the relative levels of sustainability inherent in the
financial position of the sample organisations prior to the ERO. It does this by using the data
provided by participants to calculate the current assets ratio for each participant.
Ratios are important calculations designed to highlight areas of concern where additional
focus might be warranted. They do this by examining the relationship between different
elements of an organisation’s financial reports.
Ratios are usually but not always uniform in their calculation. The current assets ratio is used
widely in all sectors of the economy and seeks to provide an indicator of the extent to which
the current assets of an organisations (typically cash and debtors—things that can be rapidly
turned into cash) compare to the current liabilities (typically those things that must be paid
within the next month or few months).23
Figure 4 Median Financial Forecast of Participant Organisations
24 | P a g e
For our purposes, we have calculated the current assets ratio as follows:
[Accounts Receivable + Cash] divided by [Accounts Payable + Overdrafts +
Unearned Income + the Current Liability Provision for Employee Entitlements]
The current ratio is usually reported by describing the proportion of current assets to current
liabilities in dollar terms, such that an organisation with current assets of $100 and current
liabilities of $80 will report a ratio of 1:0.8. It can also be reported as a single digit, in this
case as 1.25—that is, there are $1.25 worth of current assets compared to every dollar of
current liabilities. It is the latter form that we have reported in table 3 below.
While the calculation of the ratio is relatively straight forward and almost universally
accepted, the identification of the most appropriate target result is more difficult to quantify.
Obviously, it is important that there is a preponderance of current assets over current
liabilities. Therefore, an organisation with less than $1 of current assets to each dollar of
current liabilities is potentially in financial distress. We would also like to see more current
assets than liabilities and so a ratio of $1:$1or 1:0 is not satisfactory as it does not provide
for reserves in the case of mis-timing between the payment of liabilities to receipts from
assets or in the case of the impact of unexpected payments. Generally, we would like to see
a ratio of 1.5:1 or better to ensure these reserves are in place. However, a ratio that is
markedly high may also suggest that an organisation’s assets are not being managed
properly, the organisation might be inefficient or lazy.
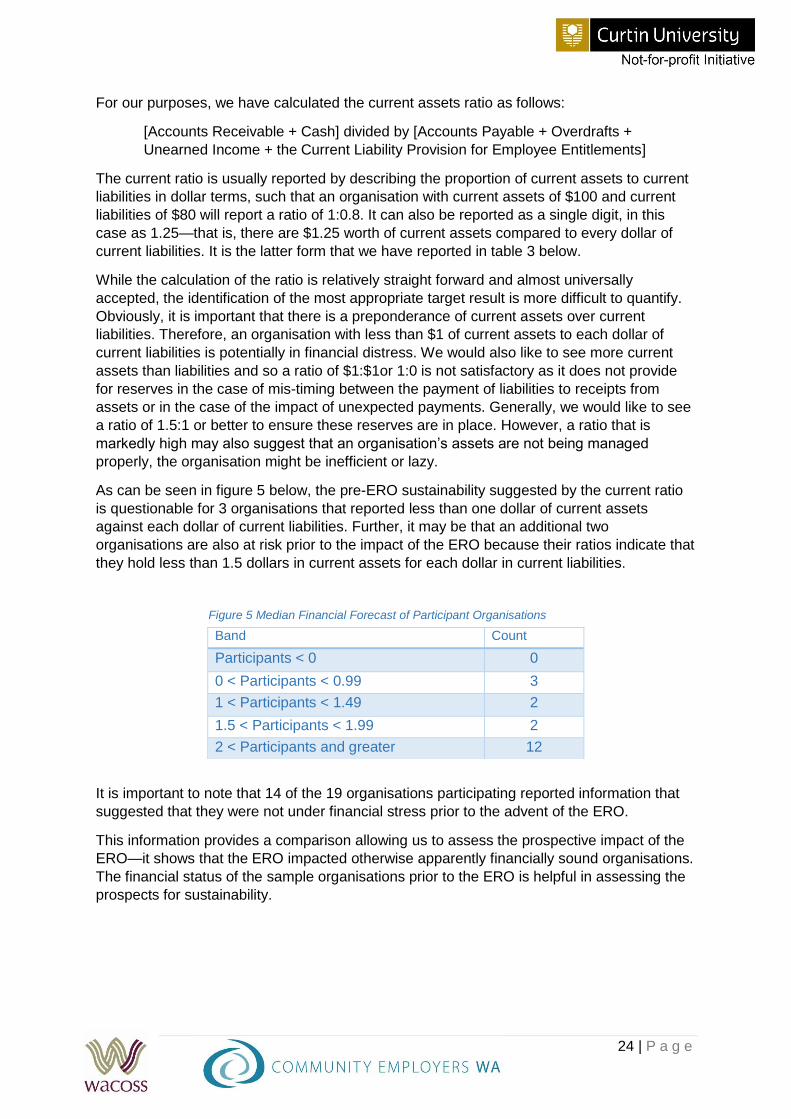
As can be seen in figure 5 below, the pre-ERO sustainability suggested by the current ratio
is questionable for 3 organisations that reported less than one dollar of current assets
against each dollar of current liabilities. Further, it may be that an additional two
organisations are also at risk prior to the impact of the ERO because their ratios indicate that
they hold less than 1.5 dollars in current assets for each dollar in current liabilities.
It is important to note that 14 of the 19 organisations participating reported information that
suggested that they were not under financial stress prior to the advent of the ERO.
This information provides a comparison allowing us to assess the prospective impact of the
ERO—it shows that the ERO impacted otherwise apparently financially sound organisations.
The financial status of the sample organisations prior to the ERO is helpful in assessing the
prospects for sustainability.
Band Count
Participants < 0 0
0 < Participants < 0.99 3
1 < Participants < 1.49 2
1.5 < Participants < 1.99 2
2 < Participants and greater 12
Figure 5 Median Financial Forecast of Participant Organisations
25 | P a g e
Impact of ERO on organisation financial sustainability In this section, we report on the inherent impact on short term sustainability caused by the
ERO. We were able to consider the impact on profitability for the 2016/17 and the 2017/18
Financial Years by asking for prospective budget and forecast data from participants, both in
the context of current non-ERO expectations as well as ERO expectations. We did this by
comparing the total summary of the difference between the ERO results for 2016/17 and
2017/18.
We were concerned to report the short-term impact for two reasons:
1) The short-term impact is critical in ensuring the ongoing provision of services to users
who rely on them. In the longer-term, strategic responses can be developed and
implemented. However, in the short-term the destructive impact may be felt before a
sound policy position may be arrived at; and
2) The data provided by participants was of the highest quality when it considered the
short term. Our horizon for analysis was the years 2017/18 to 2021/22. However,
typically organisations do not undertake extensive budgeting beyond the following
financial year and so the short-term data is likely to be a more faithful representation
of the likely outcome than the longer-term data. Of course, risk of a variable outcome
increases with the extension of the time horizon as well, so that, regardless of the
current efficacy of the longer-term forecast data, there is always great opportunity for
change the longer the time horizon.
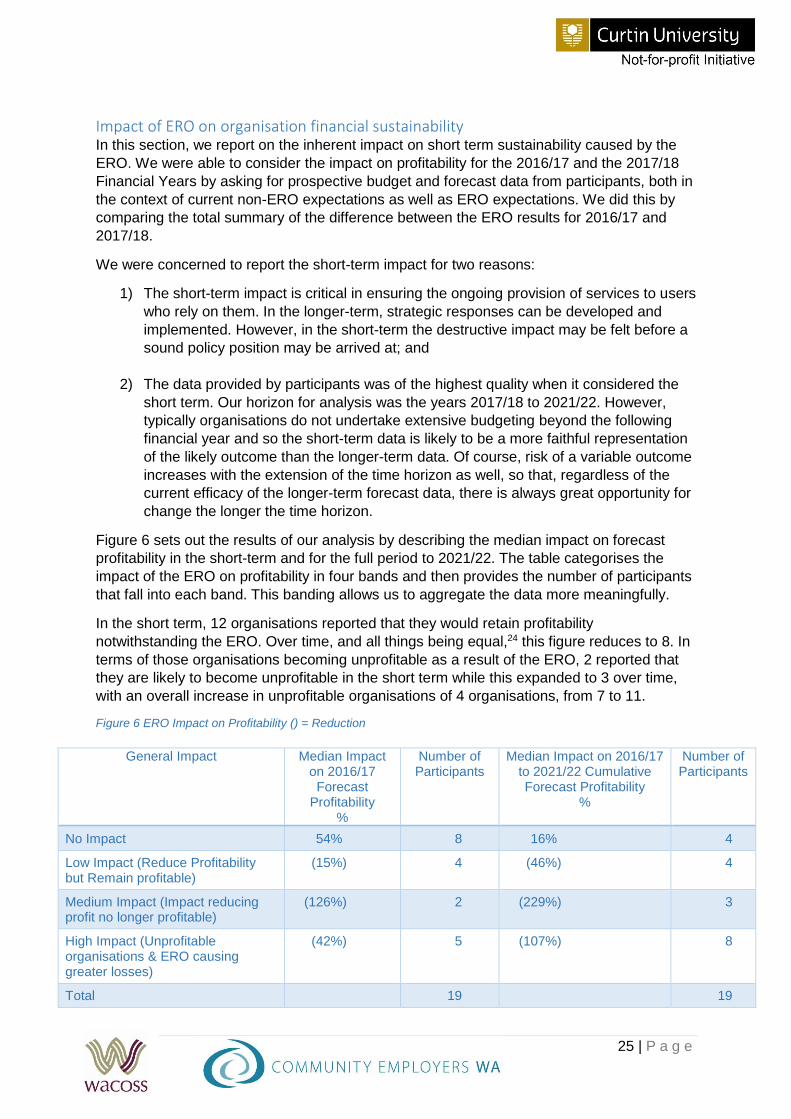
Figure 6 sets out the results of our analysis by describing the median impact on forecast
profitability in the short-term and for the full period to 2021/22. The table categorises the
impact of the ERO on profitability in four bands and then provides the number of participants
that fall into each band. This banding allows us to aggregate the data more meaningfully.
In the short term, 12 organisations reported that they would retain profitability
notwithstanding the ERO. Over time, and all things being equal,24 this figure reduces to 8. In
terms of those organisations becoming unprofitable as a result of the ERO, 2 reported that
they are likely to become unprofitable in the short term while this expanded to 3 over time,
with an overall increase in unprofitable organisations of 4 organisations, from 7 to 11.
General Impact Median Impact on 2016/17 Forecast
Profitability %
Number of Participants
Median Impact on 2016/17 to 2021/22 Cumulative Forecast Profitability
%
Number of Participants
No Impact 54% 8 16% 4
Low Impact (Reduce Profitability but Remain profitable)
(15%) 4 (46%) 4
Medium Impact (Impact reducing profit no longer profitable)
(126%) 2 (229%) 3
High Impact (Unprofitable organisations & ERO causing greater losses)
(42%) 5 (107%) 8
Total 19 19
Figure 6 ERO Impact on Profitability () = Reduction
26 | P a g e
Therefore, the ERO will impact a substantial number of the participant organisations over the
next five years. This impact will reduce inherent profitability and place organisations in
financial stress.
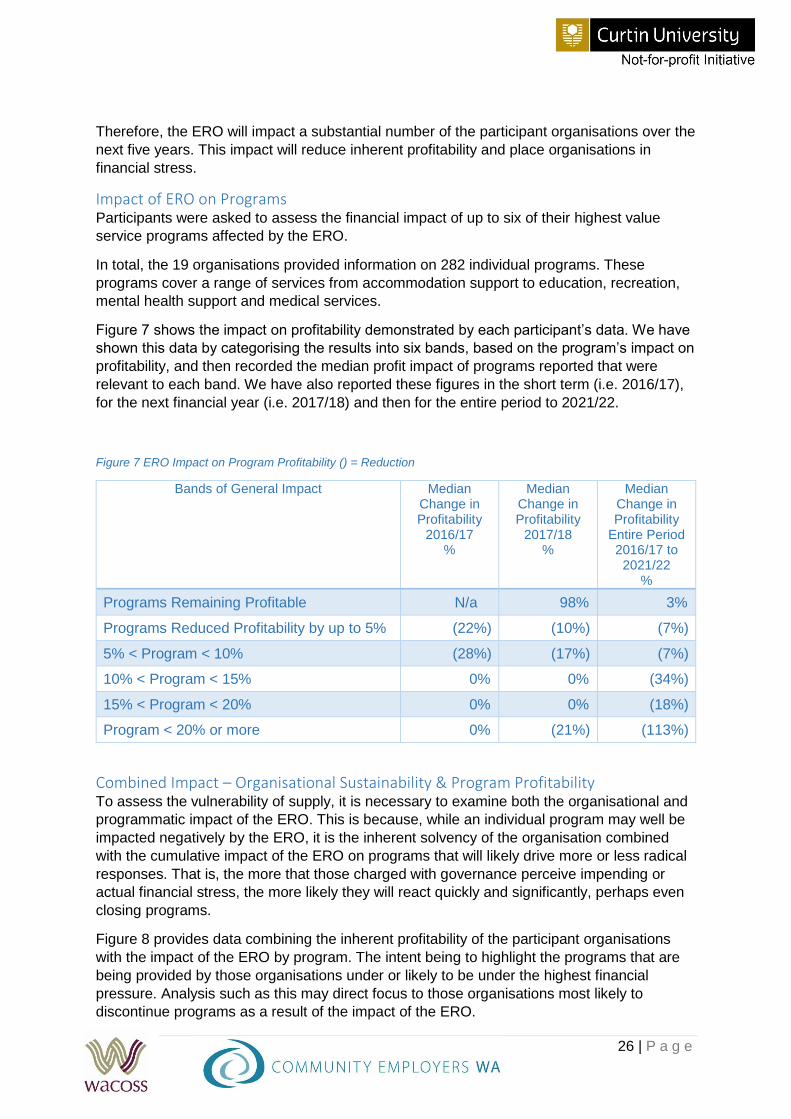
Impact of ERO on Programs Participants were asked to assess the financial impact of up to six of their highest value
service programs affected by the ERO.
In total, the 19 organisations provided information on 282 individual programs. These
programs cover a range of services from accommodation support to education, recreation,
mental health support and medical services.
Figure 7 shows the impact on profitability demonstrated by each participant’s data. We have
shown this data by categorising the results into six bands, based on the program’s impact on
profitability, and then recorded the median profit impact of programs reported that were
relevant to each band. We have also reported these figures in the short term (i.e. 2016/17),
for the next financial year (i.e. 2017/18) and then for the entire period to 2021/22.
Bands of General Impact Median Change in Profitability
2016/17 %
Median Change in Profitability
2017/18 %
Median Change in Profitability
Entire Period 2016/17 to 2021/22
%
Programs Remaining Profitable N/a 98% 3%
Programs Reduced Profitability by up to 5% (22%) (10%) (7%)
5% < Program < 10% (28%) (17%) (7%)
10% < Program < 15% 0% 0% (34%)
15% < Program < 20% 0% 0% (18%)
Program < 20% or more 0% (21%) (113%)
Combined Impact – Organisational Sustainability & Program Profitability To assess the vulnerability of supply, it is necessary to examine both the organisational and
programmatic impact of the ERO. This is because, while an individual program may well be
impacted negatively by the ERO, it is the inherent solvency of the organisation combined
with the cumulative impact of the ERO on programs that will likely drive more or less radical
responses. That is, the more that those charged with governance perceive impending or
actual financial stress, the more likely they will react quickly and significantly, perhaps even
closing programs.
Figure 8 provides data combining the inherent profitability of the participant organisations
with the impact of the ERO by program. The intent being to highlight the programs that are
being provided by those organisations under or likely to be under the highest financial
pressure. Analysis such as this may direct focus to those organisations most likely to
discontinue programs as a result of the impact of the ERO.
Figure 7 ERO Impact on Program Profitability () = Reduction
27 | P a g e
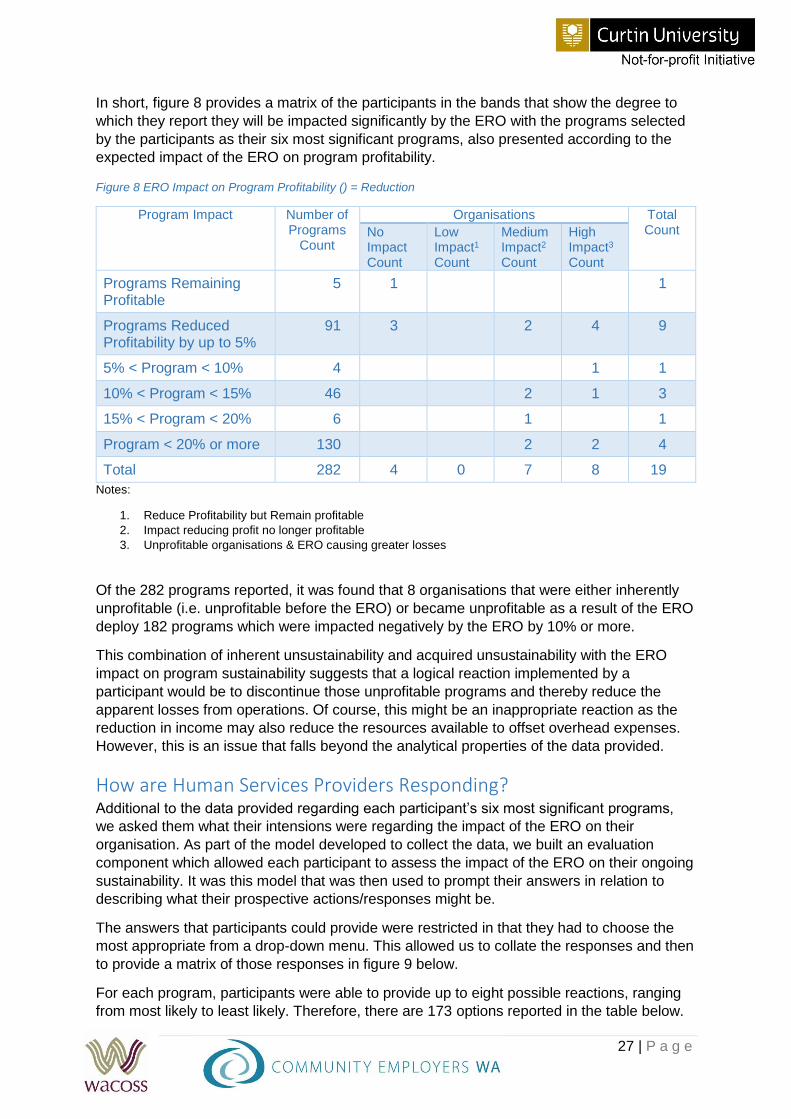
In short, figure 8 provides a matrix of the participants in the bands that show the degree to
which they report they will be impacted significantly by the ERO with the programs selected
by the participants as their six most significant programs, also presented according to the
expected impact of the ERO on program profitability.
Program Impact Number of Programs
Count
Organisations Total Count No
Impact Count
Low Impact1 Count
Medium Impact2 Count
High Impact3
Count
Programs Remaining Profitable
5 1 1
Programs Reduced Profitability by up to 5%
91 3 2 4 9
5% < Program < 10% 4 1 1
10% < Program < 15% 46 2 1 3
15% < Program < 20% 6 1 1
Program < 20% or more 130 2 2 4
Total 282 4 0 7 8 19
Notes:
1. Reduce Profitability but Remain profitable
2. Impact reducing profit no longer profitable
3. Unprofitable organisations & ERO causing greater losses
Of the 282 programs reported, it was found that 8 organisations that were either inherently
unprofitable (i.e. unprofitable before the ERO) or became unprofitable as a result of the ERO
deploy 182 programs which were impacted negatively by the ERO by 10% or more.
This combination of inherent unsustainability and acquired unsustainability with the ERO
impact on program sustainability suggests that a logical reaction implemented by a
participant would be to discontinue those unprofitable programs and thereby reduce the
apparent losses from operations. Of course, this might be an inappropriate reaction as the
reduction in income may also reduce the resources available to offset overhead expenses.
However, this is an issue that falls beyond the analytical properties of the data provided.
How are Human Services Providers Responding? Additional to the data provided regarding each participant’s six most significant programs,
we asked them what their intensions were regarding the impact of the ERO on their
organisation. As part of the model developed to collect the data, we built an evaluation
component which allowed each participant to assess the impact of the ERO on their ongoing
sustainability. It was this model that was then used to prompt their answers in relation to
describing what their prospective actions/responses might be.
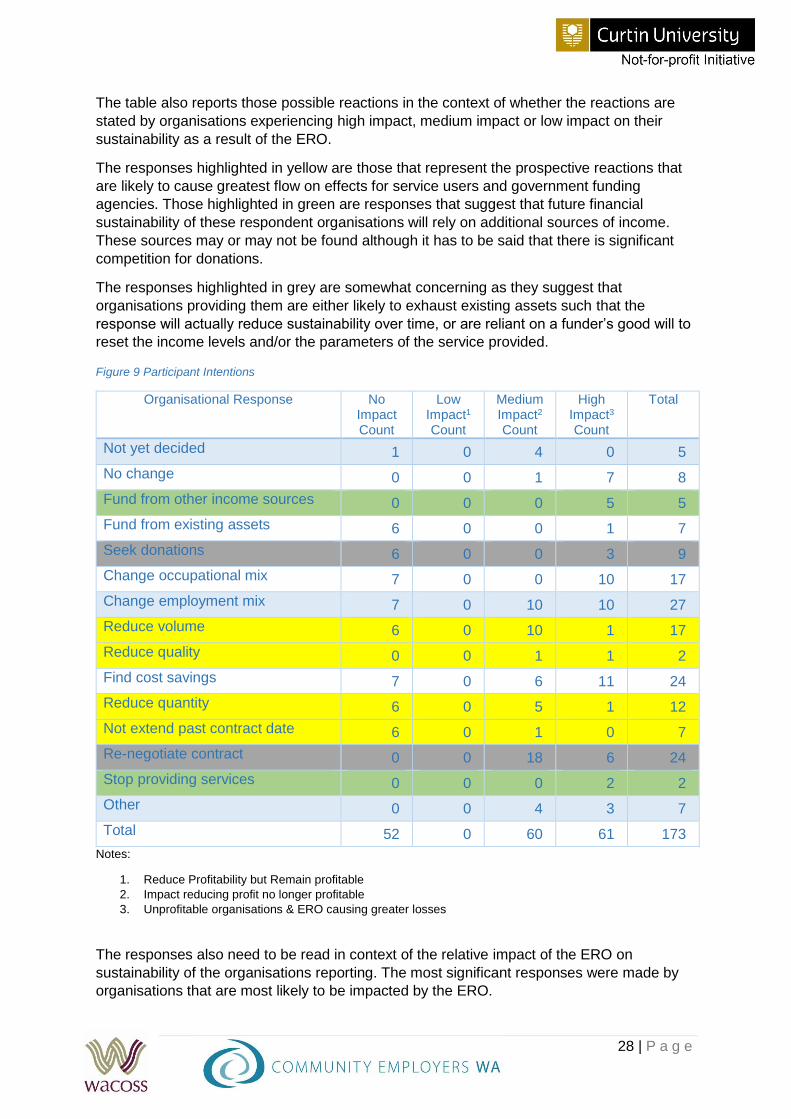
The answers that participants could provide were restricted in that they had to choose the
most appropriate from a drop-down menu. This allowed us to collate the responses and then
to provide a matrix of those responses in figure 9 below.
For each program, participants were able to provide up to eight possible reactions, ranging
from most likely to least likely. Therefore, there are 173 options reported in the table below.
Figure 8 ERO Impact on Program Profitability () = Reduction
28 | P a g e
The table also reports those possible reactions in the context of whether the reactions are
stated by organisations experiencing high impact, medium impact or low impact on their
sustainability as a result of the ERO.
The responses highlighted in yellow are those that represent the prospective reactions that
are likely to cause greatest flow on effects for service users and government funding
agencies. Those highlighted in green are responses that suggest that future financial
sustainability of these respondent organisations will rely on additional sources of income.
These sources may or may not be found although it has to be said that there is significant
competition for donations.
The responses highlighted in grey are somewhat concerning as they suggest that
organisations providing them are either likely to exhaust existing assets such that the
response will actually reduce sustainability over time, or are reliant on a funder’s good will to
reset the income levels and/or the parameters of the service provided.
Organisational Response No Impact Count
Low Impact1 Count
Medium Impact2 Count
High Impact3 Count
Total
Not yet decided 1 0 4 0 5
No change 0 0 1 7 8
Fund from other income sources 0 0 0 5 5
Fund from existing assets 6 0 0 1 7
Seek donations 6 0 0 3 9
Change occupational mix 7 0 0 10 17
Change employment mix 7 0 10 10 27
Reduce volume 6 0 10 1 17
Reduce quality 0 0 1 1 2
Find cost savings 7 0 6 11 24
Reduce quantity 6 0 5 1 12
Not extend past contract date 6 0 1 0 7
Re-negotiate contract 0 0 18 6 24
Stop providing services 0 0 0 2 2
Other 0 0 4 3 7
Total 52 0 60 61 173
Notes:
1. Reduce Profitability but Remain profitable
2. Impact reducing profit no longer profitable
3. Unprofitable organisations & ERO causing greater losses
The responses also need to be read in context of the relative impact of the ERO on
sustainability of the organisations reporting. The most significant responses were made by
organisations that are most likely to be impacted by the ERO.
Figure 9 Participant Intentions
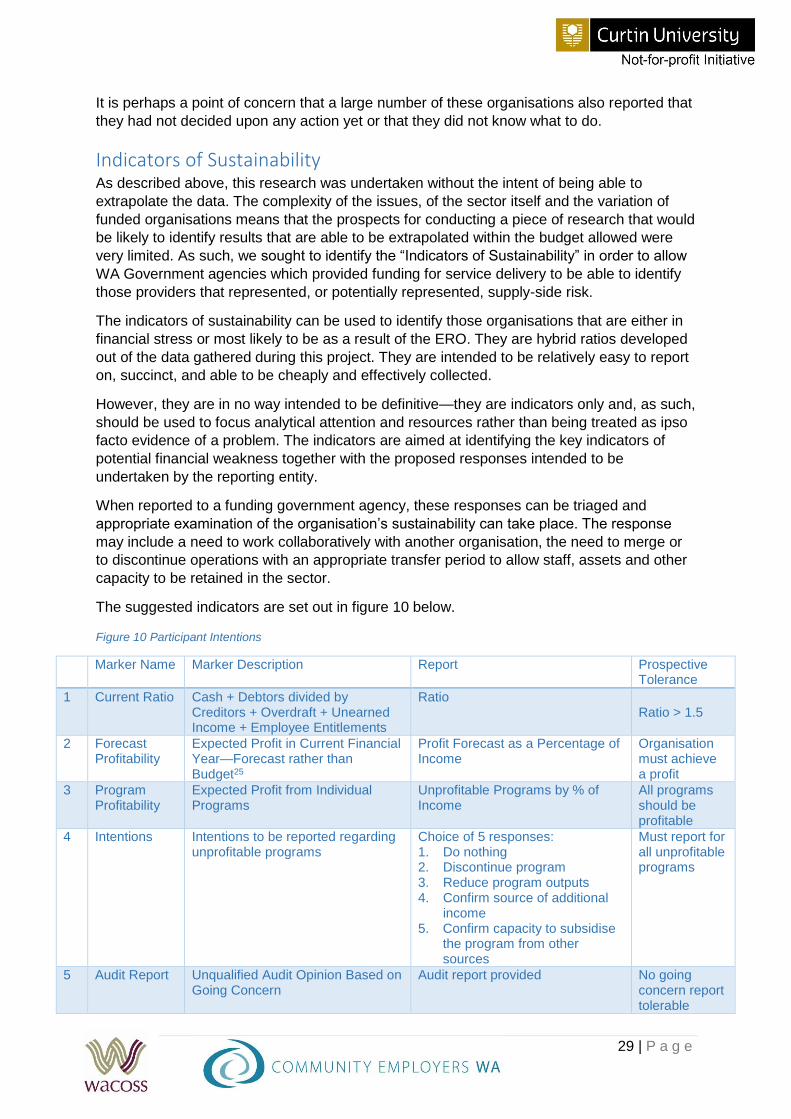
29 | P a g e
It is perhaps a point of concern that a large number of these organisations also reported that
they had not decided upon any action yet or that they did not know what to do.
Indicators of Sustainability As described above, this research was undertaken without the intent of being able to
extrapolate the data. The complexity of the issues, of the sector itself and the variation of
funded organisations means that the prospects for conducting a piece of research that would
be likely to identify results that are able to be extrapolated within the budget allowed were
very limited. As such, we sought to identify the “Indicators of Sustainability” in order to allow
WA Government agencies which provided funding for service delivery to be able to identify
those providers that represented, or potentially represented, supply-side risk.
The indicators of sustainability can be used to identify those organisations that are either in
financial stress or most likely to be as a result of the ERO. They are hybrid ratios developed
out of the data gathered during this project. They are intended to be relatively easy to report
on, succinct, and able to be cheaply and effectively collected.
However, they are in no way intended to be definitive—they are indicators only and, as such,
should be used to focus analytical attention and resources rather than being treated as ipso
facto evidence of a problem. The indicators are aimed at identifying the key indicators of
potential financial weakness together with the proposed responses intended to be
undertaken by the reporting entity.
When reported to a funding government agency, these responses can be triaged and
appropriate examination of the organisation’s sustainability can take place. The response
may include a need to work collaboratively with another organisation, the need to merge or
to discontinue operations with an appropriate transfer period to allow staff, assets and other
capacity to be retained in the sector.
The suggested indicators are set out in figure 10 below.
Marker Name Marker Description Report Prospective Tolerance
1 Current Ratio Cash + Debtors divided by Creditors + Overdraft + Unearned Income + Employee Entitlements
Ratio Ratio > 1.5
2 Forecast Profitability
Expected Profit in Current Financial Year—Forecast rather than Budget25
Profit Forecast as a Percentage of Income
Organisation must achieve a profit
3 Program Profitability
Expected Profit from Individual Programs
Unprofitable Programs by % of Income
All programs should be profitable
4 Intentions Intentions to be reported regarding unprofitable programs
Choice of 5 responses: 1. Do nothing 2. Discontinue program 3. Reduce program outputs 4. Confirm source of additional
income 5. Confirm capacity to subsidise
the program from other sources
Must report for all unprofitable programs
5 Audit Report Unqualified Audit Opinion Based on Going Concern
Audit report provided No going concern report tolerable
Figure 10 Participant Intentions
30 | P a g e
WA Government Agencies Most Impacted In undertaking this analysis, it was found that the following WA Government agencies were
most likely to be impacted as a result of financial stress to service providers caused by the
ERO:
Department of Child Protection and Family Support
Mental Health Commission
Disability Services Commission
Department of Health
Of course, this does not represent a comprehensive list of organisations impacted as this is
based on the data provided by the sample organisations. However, it is likely that these
organisations have considerable supply-side exposure as a result of the ERO
implementation given their role and reliance on externally supplied service delivery for
meeting their policy objectives.
Recommendations At its centre, the impact of the ERO is a financial one which has been forced on the human
services sector and the WA government by an external, Commonwealth agency. The sector
is unable to recover the costs by implementing normal commercial responses to cost
escalation, such as by increasing the price of services, and government is managing in a
very tight economic environment. As such, the mitigation of the impacts of the ERO are a
joint responsibility with co-operation being required of both parties in order to facilitate the
implementation of an effective response. The following recommendations are provided in
order to mitigate the significant financial impacts likely to result from organisational impact
caused by the ERO.
Short Term Market Stewardship. In the short term, the WA government needs to respond to the impact of the ERO in order to
avoid additional and significant costs associated with supply-side failure. To do this, the WA
Government should develop a plan for managing the underlying financial and service
delivery risk. If government wishes to retain provision of the impacted programs and/or
supply-side depth and capacity, it will need to identify the human services organisations for
which additional funding will enable organisational survival and program survival.
Additionally, it will need to identify those human services organisations that are unlikely to
recover their financial position and performance so that the cost of supply-side collapse can
be mitigated.
Recommendation One The WA Government develop and implement a plan to identify
the human services organisations at risk and to respond in a
balanced and effective way, including by:
using the Indicators of Sustainability as the first step in
identifying those organisations that are under significant
financial pressure but that are likely to be able to be supported
to recover their financial capacity. The funded human services
sector co-operate by providing the necessary information.
Department of Treasury and Department of Finance either
identify funding to ensure on-going supply or take other
measures to mitigate the impact of supply-side failure. Such
31 | P a g e
measures could include tightly focused top-up funding for a
limited duration; re-negotiation of service contracts where the
contract does not allow for the additional costs incurred as a
result of the ERO to be recovered via current funding
arrangements; support to assist organisations to merge where
this could reduce financial risk; and support for wind up and
transfer of assets and operations to another provider.
Department of Finance advise all WA Government funded
human service organisations that, once current ERO-induced
deficits are addressed, no further money will be forthcoming to
bolster contracts. NFPs must develop their costing and pricing
systems, strategic plans etc. to ensure that they are financially
sustainable and not bid for contracts that they cannot deliver.
Longer Term Market Stewardship The WA Government is effectively the provider of last resort when individual organisations
are no longer able to remain viable and deliver services. This is usually a costly exercise for
government as it requires capital to be injected into the failing organisation, fees to be paid
to a substitute organisation, and considerable amount of senior executive time to ensure an
appropriate and reliable service continues to be provided to the service user so that further
complications and costs are not incurred.
The collection and analysis of the Indicators of Sustainability on current and potential
suppliers of services would allow the government and individual funding agencies to better
select and evaluate suppliers, and build a portfolio of suppliers that meet government’s
needs, including the need to achieve value for money, manage total funding and mitigate
supply risk.
This data can also be returned to the funded sector, at an aggregate and anonymous level,
to be used to benchmark individual organisational results against those of the whole sector.
The infrastructure required to collect this data can be cost effectively developed and
implemented during the contracting and subsequent collection of information for annual
contract acquittal. Specifically:
1) it can be appended to the contracting reporting process so that government
departments contracting with Not-for-profit human services providers can assess the
sustainability of service providers during the contracting arrangement; or
2) The reporting of these indicators can be undertaken during the annual data collection
undertaken by the WA Treasury when it reviews the Sustainable Funding and
Contracting with the Not-for-profit Sector.26
The amount of data collected should be proportionate to the size of the contract, the
organisation and risk.
Alternatively, organisations in financial distress as a result of the implementation of the ERO
could apply to their contracting government agency for relief after providing the Indicators of
Sustainability for their organisations.
However, in the short term, the supply-side may be at risk as a result of the implementation
of the ERO and WA Government agencies must consider their processes in the context of
32 | P a g e
managing this risk in timely and effective manner in order to avoid the substantial costs
associated with a collapse of service providers.
As such, we recommend as follows:
Recommendation Two The WA Government adopt the Indicators of Sustainability as a
method of assessing supply-side financial vulnerability in Not-
for-profit human services organisations receiving funding for
service delivery.
Recommendation Three That each WA Government agency procuring human services
communicate with those supplying organisations to indicate
that, if those organisations find they are under financial stress
as a result of the ERO, they should make that known to the
agency and also provide their Indicators of Sustainability
together with their planned response in order to allow the
agency to assess the prospective impact on service delivery
and to devise a prospective way forward in securing the
supply-side.
Recommendation Four That the WA Government include an analysis of the Indicators
of Sustainability for all organisations providing human services
to funding agencies when they collect data for the annual
Review of the Sustainable Funding and Contracting with the
Not-for-profit Sector Initiative. While responding to this review
is not mandatory for funded organisations, the incentive will be
there if organisations are under financial stress.
Recommendation Five The Department of Finance communicate with all Not-for-profit
supply-side organisations and confirm that the meeting of the
ERO should be budgeted for within organisational budgets and
in any tenders forwarded to WA Government agencies and
that, while the ERO will cause financial stress for some
organisations, the onus of providing for this cost will rest with
human services providers from the commencement of each
new contract or extension of existing contracts. In the
meantime, WA Government agencies will consider approaches
from those organisations impacted by the ERO, which may
include strategies such as mergers and transfers of service
programs to other, more financial sound organisations. Finally,
organisations may choose not to seek this assistance but must
be prepared to respond to financial stress regardless.
Recommendation Six Those government agencies highlighted as impacted by the
data provided for this report respond to the implied risk by
examining the Indicators of Sustainability of their suppliers
including seeking their suppliers’ intended actions.
33 | P a g e
1 Government of Western Australia, (2016), Sustainable Funding and Contracting with the Not-for-profit Sector Initiative: 2015 Evaluation Report, Perth, Australia. 2 For general employment and employee cost data relating to the WA Charitable Sector, see: Gilchrist, D. J. and P. A. Knight, (2017), WA’s Not-for-profit Sector 2017: The First Report on charities and Other Not-for-profits in WA. A Report for the Western Australian Council for Social Service. Perth, Australia. 3 Fair Work Commission. https://www.fwc.gov.au/cases-decisions-orders/major-cases/equal-remuneration-case-2013-14/legislation. 4 Gilchrist, D. J. and P. A. Knight, (2017), WA’s Not-for-profit Sector 2017: The First Report on charities and Other Not-for-profits in WA. A Report for the Western Australian Council for Social Service. Perth, Australia. 5 For instance, see: http://www.perthnow.com.au/news/western-australia/wa-budget-2016-your-quick-guide-to-the-state-budget/news-story/e3e01b08e6fceea102b8a3f6c8e6754a 6 Government of Western Australia, (2016), Sustainable Funding and Contracting with the Not-for-profit Sector Initiative: 2015 Evaluation Report, Perth, Australia. 7 Government of Western Australia, (2016), Sustainable Funding and Contracting with the Not-for-profit Sector Initiative. 8 Government of Western Australia, (2011), Delivering Community Services in Partnership Policy: A Policy to Deliver Better Outcomes for Western Australians Through the Funding and Contracting of Community Services. 9 Zhai, L., J. Watson, D. J. Gilchrist and R. Newby, (2016), “Nonprofit Vulnerability: An Exploratory
Study”, Financial Accountability and Management, In Print – Forthcoming January 2018. 10 For additional commentary regarding sustainability and human services organisations, see: Gilchrist, D. J., and P. A. Knight, “Western Australian Disability Services Annual Funded Sector Report: 2010-2011”, A Report for the Disability Services Commission, Western Australian Government, Perth. 11 The Not-for-profit classification relates to the use to which profits and assets of an entity are applied. A For-profit entity is one which either retains profits for re-investment or for distribution to owners. These owners are entitled to a return on the capital they provided. If a For-profit is wound up, the owners can enjoy the benefits of any assets remaining after all liabilities are extinguished. On the other hand, a Not-for-profit can only re-invest profits. Not-for-profits cannot distribute assets or profits to members but must apply them to their objects or mission or transfer them to another Not-for-profit. However, the same rules of sustainability apply equally to Not-for-profits and For-profit organisations. 12 Government of Western Australia, (2009), Putting the Public First: Partnering with the Community and Business to Deliver Outcomes, Report of the Economic Audit Committee. Available at: https://www.dpc.wa.gov.au/Publications/EconomicAuditReport/Pages/Default.aspx 13 Government of Western Australia, (2016), Sustainable Funding and Contracting with the Not-for-profit Sector Initiative 2015 Evaluation Report. 14 See: http://www.fairwork.gov.au/pay/minimum-wages/social-and-community-services-industry-pay-rates 15 For instance, 2012 – 2.9%; 2013 – 2.6%; 2014 3.0%; 2015 – 2.5%; and 2016 – 2.4% 16 Australian Bureau of Statistics, December Key Figures, December Quarter 2015 to December Quarter 2016, available at: http://www.abs.gov.au/ausstats/[email protected]/mf/6401.0 17 SalaryOne, (2016), ERO Case Study: Forecast the Impact of the Equal Remuneration Order on Salary Costs for 12 WA Community Employers (July 2016 to June 2021), A Report for Community Employers WA and the Western Australian Council of Social Service, Perth. 18 A fungible asset is one that can be changed to another form—usually sold to create a cash
reserve—as it is surplus to requirements, does not have any restrictions on its sale or alternative use,
and/or its change to another form will not impact the quality and quantity of services delivered. For
further discussion regarding the prospects for sustainability relating to human services, see: Gilchrist,
D. J. and P. A. Knight (2016), Australia’s Disability Services Sector 2016: Financial Sustainability—
Summary of Findings, A Report for the Research and Data Working Group, Sydney, Australia 19 Government of Western Australia, (2016), Sustainable Funding and Contracting with the Not-for-profit Sector Initiative: 2015 Evaluation Report, Perth. 20 Gilchrist, D. J. and P. A. Knight, (2017), WA’s Not-for-profit Sector 2017: The First Report on charities and Other Not-for-profits in WA. A Report for the Western Australian Council for Social Service. Perth, Australia.
34 | P a g e
21 Gilchrist, D. J. and P. A. Knight, (2017), WA’s Not-for-profit Sector 2017: The First Report on charities and Other Not-for-profits in WA. A Report for the Western Australian Council for Social Service. Perth, Australia. 22 Government of Western Australia, (2016), Sustainable Funding and Contracting with the Not-for-profit Sector Initiative: 2015 Evaluation Report, Perth. 23 Information relating to these items is available at in the NDS Curtin National Costing and Pricing Framework: Gilchrist, D. J., (2014), A National Costing and Pricing Framework for Disability Services, A Resource Developed for National Disability Services, Canberra. Training materials relating to ratio analysis and other key financial operations is available as part of the open access tools and materials provided by Curtin and National Disability Services as part of the Costing and Pricing Learning Program available at: cplp.nds.org.au. 24 That is, all other things remaining the same. 25 The annual budget is typically cast prior to the commencement of a financial year. It usually remains in place for the entire year. However, as the year progresses and actual performance becomes apparent, a forecast can be developed using that experience to predict the likely outcome for the year. Of course, early in the year, the Budget and the Forecast will likely be the same. It is this likely outcome or the Forecast that is of value here. 26 Government of Western Australia, (2016), Sustainable Funding and Contracting with the Not-for-profit Sector Initiative 2015 Evaluation Report.