The 2005 ANDP Survey of Neuroscience Graduate ...
24
The 2005 ANDP Survey of Neuroscience Graduate, Postdoctoral, and Undergraduate Programs Edward M. Stricker, Ph.D., University of Pittsburgh Introduction Neuroscience Departments and Programs are relatively new entities, being virtually unknown 40 years ago. By now they are plentiful, diverse in organization and goals, and still evolving. For years the ANDP has attempted to monitor that evolution by characterizing the departments and programs along several important dimensions so that we can know ourselves better (i.e., bench- marking) and present ourselves better to our colleagues, our deans, our students, and to the federal agencies that support our predoctoral and postdoctoral training programs. The first ANDP surveys of graduate and postdoctoral training in the U.S and Canada were conducted in 1986 by Michael Zigmond, in 1991 by Linda Spear, and in 1998 by Lesly Huffman, Robert Fellows, and Ronald Schoenfeld. 1,2 In 2000, we wanted to initiate a series of annual surveys that focused on the most critical issues and allowed current information about the academic discipline to be readily available. Two versions of the survey were developed, one intended for graduate and postdoctoral programs and one intended for undergraduate programs. Programs were asked to complete and submit data electronically to the University Center for Social and Urban Research (UCSUR) at the University of Pittsburgh, which helped to design the surveys and was responsible for compiling the obtained responses. A report based on the obtained data, which focused on academic year 1999-2000 (AY2000), was posted on the ANDP web page in spring 2001. 3 In early 2002, another survey was conducted which focused on AY2001. The new data were added to the pool of responses from the previous year, and a report based on the merged file of information spanning two consecutive years was posted on the ANDP web page in spring 2002. 4 The feedback we received in response to the AY2001 survey encouraged us to conduct surveys every other year rather than annually. Thus, the next survey was begun in fall 2003 and was posted in spring 2004. 5 The present survey was begun in fall 2005. Responses were obtained from 88 of the 140 graduate training programs that were members of the ANDP, which represents an excellent 63% rate of participation. 6 Similarly, responses were obtained from 27 of the 33 undergraduate programs that were members of the ANDP (82%). As with the previous surveys, their value is not in the absolute numbers they provide but in their relative numbers and trends in comparison to the results of earlier surveys. In this regard, 70 (81%) of the graduate programs that participated in the 2003 survey, and 14 (54%) of the undergraduate programs, also had participated in the 2003 survey, which encouraged such comparisons. A complete list of the 88 graduate programs and 27 undergraduate programs that participated in the 2005 survey is given below. A broad cross-section of graduate Neuroscience departments and programs were represented. That is, responses were obtained from older programs and relatively new programs, from programs with many students and programs with relatively few students,
Transcript of The 2005 ANDP Survey of Neuroscience Graduate ...

The 2005 ANDP Survey of Neuroscience Graduate, Postdoctoral, and Undergraduate Programs Edward M. Stricker, Ph.D., University of Pittsburgh Introduction Neuroscience Departments and Programs are relatively new entities, being virtually unknown 40 years ago. By now they are plentiful, diverse in organization and goals, and still evolving. For years the ANDP has attempted to monitor that evolution by characterizing the departments and programs along several important dimensions so that we can know ourselves better (i.e., bench-marking) and present ourselves better to our colleagues, our deans, our students, and to the federal agencies that support our predoctoral and postdoctoral training programs. The first ANDP surveys of graduate and postdoctoral training in the U.S and Canada were conducted in 1986 by Michael Zigmond, in 1991 by Linda Spear, and in 1998 by Lesly Huffman, Robert Fellows, and Ronald Schoenfeld.1,2 In 2000, we wanted to initiate a series of annual surveys that focused on the most critical issues and allowed current information about the academic discipline to be readily available. Two versions of the survey were developed, one intended for graduate and postdoctoral programs and one intended for undergraduate programs. Programs were asked to complete and submit data electronically to the University Center for Social and Urban Research (UCSUR) at the University of Pittsburgh, which helped to design the surveys and was responsible for compiling the obtained responses. A report based on the obtained data, which focused on academic year 1999-2000 (AY2000), was posted on the ANDP web page in spring 2001.3 In early 2002, another survey was conducted which focused on AY2001. The new data were added to the pool of responses from the previous year, and a report based on the merged file of information spanning two consecutive years was posted on the ANDP web page in spring 2002.4 The feedback we received in response to the AY2001 survey encouraged us to conduct surveys every other year rather than annually. Thus, the next survey was begun in fall 2003 and was posted in spring 2004.5 The present survey was begun in fall 2005. Responses were obtained from 88 of the 140 graduate training programs that were members of the ANDP, which represents an excellent 63% rate of participation.6 Similarly, responses were obtained from 27 of the 33 undergraduate programs that were members of the ANDP (82%). As with the previous surveys, their value is not in the absolute numbers they provide but in their relative numbers and trends in comparison to the results of earlier surveys. In this regard, 70 (81%) of the graduate programs that participated in the 2003 survey, and 14 (54%) of the undergraduate programs, also had participated in the 2003 survey, which encouraged such comparisons. A complete list of the 88 graduate programs and 27 undergraduate programs that participated in the 2005 survey is given below. A broad cross-section of graduate Neuroscience departments and programs were represented. That is, responses were obtained from older programs and relatively new programs, from programs with many students and programs with relatively few students,

and from programs located in medical schools and programs located in colleges of arts and sciences (or both, or neither). Almost all of the graduate programs were located in the United States, in 33 states plus the District of Columbia, but responses also were obtained from programs in two Canadian provinces. Similarly, the 27 institutions with undergraduate programs in the neural sciences were diverse in age, size, institutional affiliation, and administrative structure, and were located in 14 states in the U.S. plus one Canadian province. The results reported below represent the full responses from these programs but for the responses from the graduate programs in Canadian institutions to questions regarding U.S. citizenship and U.S. racial and ethnic minority groups, which were excluded. The results have been organized for presentation in nine categories. The first six categories summarize the results regarding graduate and postdoctoral training. Whenever possible, the results based on the 2005 survey were compared with those obtained from the ANDP surveys in 1986, 1991, 1998, 2000/2001, and 2003. The seventh category summarizes the responses regarding undergraduate training. The final two categories provide a summary of the major findings of the 2005 survey and the conclusions drawn. A specific index of these nine categories is as follows: Results 1. Program Characteristics 6. Financial Support 2. Faculty 7. Undergraduate Education 3. Graduate Education 8. Summary 4. Postdoctoral Training 9. Conclusions 5. Diversity 1Zigmond, M.J. and Spear, L.P. Neuroscience training in the USA and Canada: observations and suggestions. Trends in Neuroscience 15: 379-383, 1992. 2Huffman, L., Fellows, R.E., and Schoenfeld, R.I. The 1998 ANDP survey of neuroscience graduate & postdoctoral programs. 3Stricker, E.M. The 2000 ANDP survey of neuroscience graduate, postdoctoral, & undergraduate programs. 4Stricker, E.M. The 2000 and 2001 ANDP surveys of neuroscience graduate, postdoctoral, & undergraduate programs. 5Stricker, E.M. The 2003 ANDP survey of neuroscience graduate, postdoctoral, & undergraduate programs.
6The expert advice and technical assistance of Mr. Robert Keene of the UCSUR is gratefully acknowledged.

Participating Institutions Graduate and Postdoctoral Programs (n = 88) Note that some institutions have multiple Neuroscience training programs (the number of which is indicated in parentheses) that participated separately in the survey. U.S. State Institution AL University of Alabama, Birmingham (2) AR University of Arkansas for Medical Sciences AZ University of Arizona CA University of California, Berkeley CA University of California, Los Angeles CA University of California, San Diego CO Colorado State University CO University of Colorado Health Science Center CT University of Connecticut CT University of Connecticut Health Center DC Georgetown University Medical Center DE University of Delaware FL Florida State University FL University of Florida FL University of Miami Miller School of Medicine GA Georgia State University (2) GA Medical College of Georgia IL Loyola University Medical Center IL Northwestern University IL Rosalind Franklin University of Medicine and Science IL University of Chicago IL University of Illinois at Chicago IN Indiana University IN Indiana University School of Medicine MA Boston University (2) MA Boston University School of Medicine MA Harvard University Medical School MA Massachusetts Institute of Technology MA Tufts University School of Medicine MA University of Massachusetts, Amherst MD Johns Hopkins University MD Uniformed Services Univ. of Health Sciences MD University of Maryland, Baltimore (2) MI Michigan State University MI University of Michigan MN Mayo Graduate School MN University of Minnesota (2) MO Washington University School of Medicine
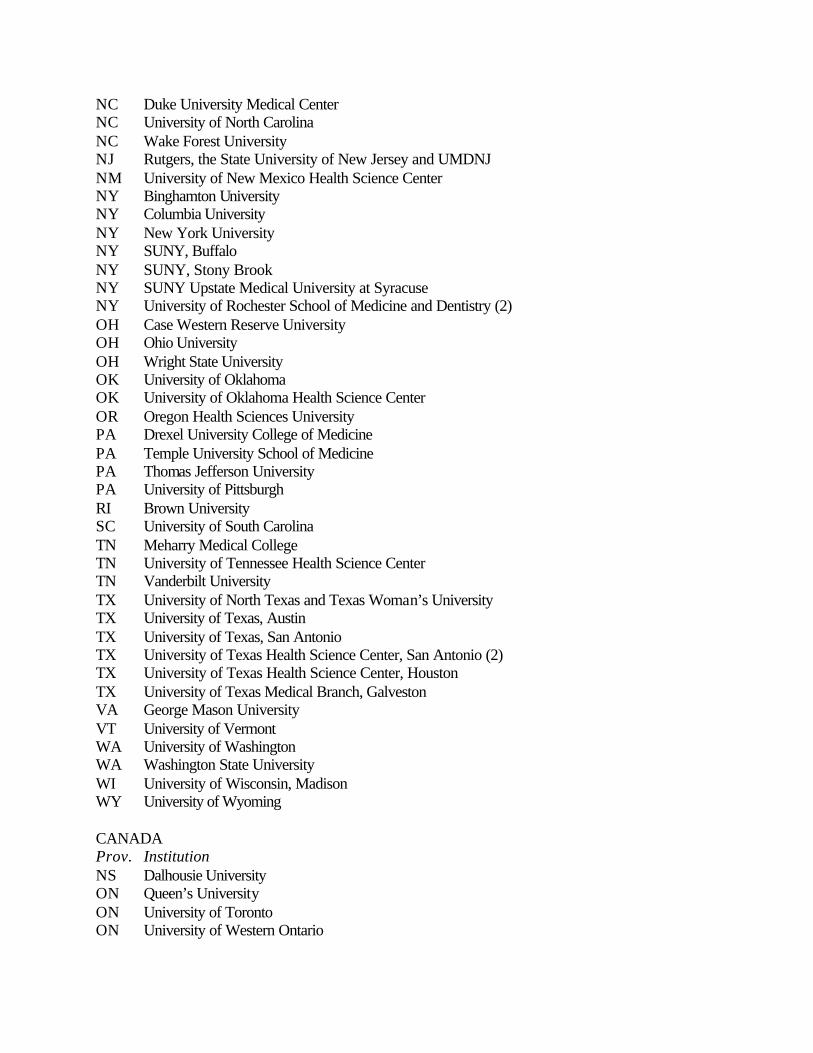
NC Duke University Medical Center NC University of North Carolina NC Wake Forest University NJ Rutgers, the State University of New Jersey and UMDNJ NM University of New Mexico Health Science Center NY Binghamton University NY Columbia University NY New York University NY SUNY, Buffalo NY SUNY, Stony Brook NY SUNY Upstate Medical University at Syracuse NY University of Rochester School of Medicine and Dentistry (2) OH Case Western Reserve University OH Ohio University OH Wright State University OK University of Oklahoma OK University of Oklahoma Health Science Center OR Oregon Health Sciences University PA Drexel University College of Medicine PA Temple University School of Medicine PA Thomas Jefferson University PA University of Pittsburgh RI Brown University SC University of South Carolina TN Meharry Medical College TN University of Tennessee Health Science Center TN Vanderbilt University TX University of North Texas and Texas Woman’s University TX University of Texas, Austin TX University of Texas, San Antonio TX University of Texas Health Science Center, San Antonio (2) TX University of Texas Health Science Center, Houston TX University of Texas Medical Branch, Galveston VA George Mason University VT University of Vermont WA University of Washington WA Washington State University WI University of Wisconsin, Madison WY University of Wyoming CANADA Prov. Institution NS Dalhousie University ON Queen’s University ON University of Toronto ON University of Western Ontario

Undergraduate Programs (n = 26) State Institution CO Regis University CT Wesleyan University GA Wesleyan College IL Loyola University, Chicago LA Tulane University MA Amherst College MA Brandeis University MA Holy Cross College MN University of Minnesota NC Davidson College NY Ithaca College NY University of Rochester OH Baldwin-Wallace College OH Bowling Green State University OH Muskingum College OH Oberlin College PA Cedar Crest College PA Franklin & Marshall College PA Lafayette College PA Temple University PA University of Pittsburgh PA Westminster College UT Brigham Young University WA Washington State University WI Carthage College CANADA Prov. Institution NS Dalhousie University
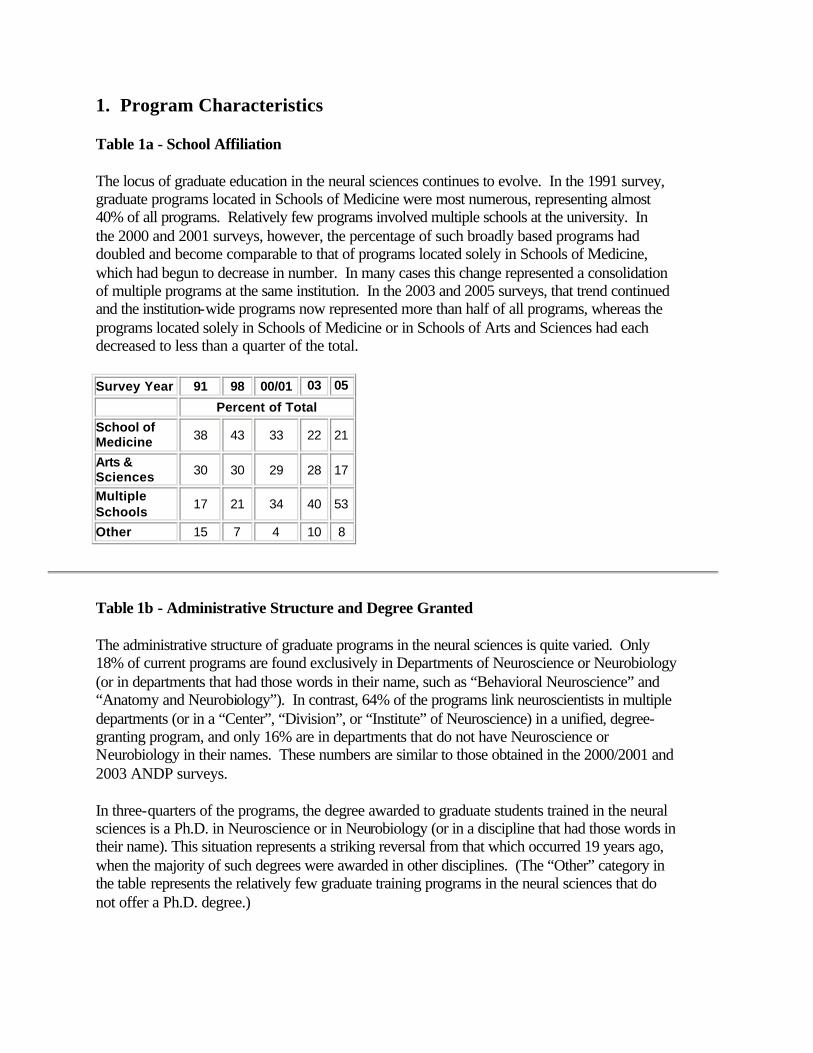
1. Program Characteristics Table 1a - School Affiliation The locus of graduate education in the neural sciences continues to evolve. In the 1991 survey, graduate programs located in Schools of Medicine were most numerous, representing almost 40% of all programs. Relatively few programs involved multiple schools at the university. In the 2000 and 2001 surveys, however, the percentage of such broadly based programs had doubled and become comparable to that of programs located solely in Schools of Medicine, which had begun to decrease in number. In many cases this change represented a consolidation of multiple programs at the same institution. In the 2003 and 2005 surveys, that trend continued and the institution-wide programs now represented more than half of all programs, whereas the programs located solely in Schools of Medicine or in Schools of Arts and Sciences had each decreased to less than a quarter of the total.
Survey Year 91 98 00/01 03 05
Percent of Total
School of Medicine 38 43 33 22 21
Arts & Sciences 30 30 29 28 17
Multiple Schools 17 21 34 40 53
Other 15 7 4 10 8
Table 1b - Administrative Structure and Degree Granted The administrative structure of graduate programs in the neural sciences is quite varied. Only 18% of current programs are found exclusively in Departments of Neuroscience or Neurobiology (or in departments that had those words in their name, such as “Behavioral Neuroscience” and “Anatomy and Neurobiology”). In contrast, 64% of the programs link neuroscientists in multiple departments (or in a “Center”, “Division”, or “Institute” of Neuroscience) in a unified, degree-granting program, and only 16% are in departments that do not have Neuroscience or Neurobiology in their names. These numbers are similar to those obtained in the 2000/2001 and 2003 ANDP surveys. In three-quarters of the programs, the degree awarded to graduate students trained in the neural sciences is a Ph.D. in Neuroscience or in Neurobiology (or in a discipline that had those words in their name). This situation represents a striking reversal from that which occurred 19 years ago, when the majority of such degrees were awarded in other disciplines. (The “Other” category in the table represents the relatively few graduate training programs in the neural sciences that do not offer a Ph.D. degree.)

Survey Year 86 91 98 00/01 03 05
Percent of Total
Ph.D. in Neuroscience 24 28 66 63 71 74
Ph.D. in another discipline
74 54 30 33 24 22
Other 2 18 4 4 5 4
Perhaps in consequence of the predominantly multidepartmental structure, only 47% of graduate training programs in the neural sciences hire their own faculty. In the 2003 ANDP survey, 44% did so.
Table 1c - Undergraduate Activities Graduate programs in the neural sciences now play a substantial role in the education of undergraduate students. Although only 15% of the graduate programs additionally administer an undergraduate program in Neuroscience, most graduate programs have faculty members who teach undergraduate courses (67%) and provide opportunities for undergraduate students to be involved in research projects (94%). These important contributions are similar to the findings in the last few surveys but are much greater than those reported 14 years ago, a development which may result from the increasing number of graduate programs whose faculty members are drawn from multiple schools within an institution. Survey Year 86 91 98 00/01 03 05
Percent of Total
Formal Program - 23 24 26 15 15
Teaching 9 48 39 69 65 67
Research - 68 62 91 94 94
2. Faculty There are 3819 faculty members in the 75 graduate training programs in the neural sciences that responded to these questions in the 2005 survey, which computes to 51 faculty members per program. These numbers represent a steady increase in faculty size from an average of 34 members per program that was reported in the 1998 ANDP survey. Forty-three (85%) faculty members per program have tenure-stream positions whereas 8 (15%) have positions outside the tenure stream. These percentages are similar to those observed in each of the past surveys. There is considerable stability in the training faculty. In AY2005, only 2% of the tenure-stream

faculty left their positions while only 6% arrived as new appointments. A similarly low turnover was observed in the two previous surveys. The turnover of nontenure-stream faculty was comparable (4% leaving, 10% arriving) and also was similar to that observed in previous years. Table 2a - Number of Faculty per Program The number of tenure-stream faculty members per graduate program varies widely, from less than 10 to more than 100 per program. However, 82% of the programs have 50 or fewer faculty members (the median number is 29).
Number 1-10 16%
11-20 18%
21-30 22%
31-40 13%
41-50 13%
51-60 2%
61-70 6%
71-80 2%
81-90 2%
>90 6%
Table 2b - Distribution of Faculty by Academic Rank The distribution of tenure-stream faculty across the three ranks is strikingly similar to that reported in the previous surveys; approximately half the faculty are full professors and one-fourth each are at the assistant and associate levels. Survey Year 86 91 98 00/01 03 05
Percent of Total
Assistant Professor 23 26 24 23 23 24
Associate Professor 28 28 25 26 25 24
Full Professor
49 46 51 51 52 52
Ninety-four percent of faculty members who have tenure-stream positions at U.S. institutions are U.S. citizens. This number is similar to that seen in the 1991, 1998, 2000/2001, and 2003 surveys (93%, 97%, 95%, 90%, respectively). Similarly, ninety-one percent of faculty members

holding nontenure-stream positions at U.S. institutions are U.S. citizens. The distribution by academic rank of faculty members who are not U.S. citizens (46% assistant professors, 27% associate professors, and 27% full professors) is not similar to that of U.S. citizens (22%, 23%, 55%, respectively) in that it has many more assistant professors and fewer full professors. Most of these tenure-stream faculty members are citizens of Europe (42%), Asia (29%), Canada (15%), or Latin America (8%). Table 2c - Percentage of Women by Academic Rank Nineteen years ago women represented only 15% of all tenure-stream faculty members in graduate programs in the neural sciences. Since then their number increased steadily through the 1998 survey (24%) but it stabilized at that level subsequently; in the 2005 survey, it is 25% of the total. Furthermore, the percentage of full professors who are women is only 21%. Consequently, women faculty members are distributed in more equal numbers across the three academic ranks (31% assistant professor, 26% associate professor, 43% full professor) than are men (21%, 23%, 56%, respectively). Survey Year 86 91 98 00/01 03 05
Percent of Total
Assistant Professor 23 27 32 30 33 32
Associate Professor 20 22 27 30 28 27
Full Professor 9 13 19 17 21 21
In contrast, women represented 38% of nontenure-stream faculty members in AY2005. This number was similar to that seen in the 2000/2001 and 2003 ANDP surveys. 3. Graduate Education Table 3a – Recruitment The number of applications to graduate training programs in the neural sciences is almost three times the number per program that it was in the 1986 survey. Offers of admission rose similarly during the same time period as did the number of students matriculating per program. An apparent spike in the number of applications that was seen in the 2003 survey was not observed in the 2005 survey. Women represent 51% of the applicants, 53% of the students admitted, and 56% of those who began graduate training in the neural sciences in AY2005. Each of those numbers is notably higher than the figures reported in the AY2000-2001 surveys (38%, 44%, 47%, respectively). Students who are not U.S. citizens represent 42% of the applicants but only 19% of the students

admitted and 21% of those who began graduate training. Although students who are members of U.S. racial and ethnic minorities represent only 8% of the applicants, they constitute 11% of the students admitted and 13% of those who began graduate training. Survey Year 86 91 98 00/01 03 05
Mean per program
Number of students applied
24 42 61 66 82 65
Number of students admitted
6 10 12 14 22 16
Number of students entered
4 5 5 9 10 8
Table 3b - Academic Credentials of Entering Students The academic credentials of students entering graduate programs in the neural sciences are similar to those of students characterized in previous surveys. Mean GRE scores in the quantitative and analytical sections of the exam have generally increased over the years, whereas scores on the verbal section have decreased. The scores in the 2005 survey place incoming graduate students in approximately the 66th, 66th, and 76th percentiles, respectively, of all students who took the GRE exams, which is a little lower than the scores in the 2003 survey (average = 79th percentile). (Note that the new analytical writing component of the GRE led to a new scoring scheme.) Ninety-five percent of the students had research experience before they began graduate training, as in previous years. The incoming graduate students had a mean GPA (3.49) in their college courses between B+ and A-, as was seen in the previous surveys. Only 23% of these students had an undergraduate major in Neuroscience, Behavioral Neuroscience, or Psychobiology. Other common undergraduate majors were Biology (23%), Psychology (15%), and Chemistry or Biochemistry (6%), and an additional 8% had dual majors including one or more of these disciplines. It seems plausible that many other entering students had undergraduate majors in computer science, but unfortunately that choice was not available in the relevant survey question. Survey Year 86 91 98 00/01 03 05
Average GRE Scores
Quantitative 624 630 658 689 698 689
Analytical 624 635 650 670 670 4.88
Verbal 590 600 577 567 563 563
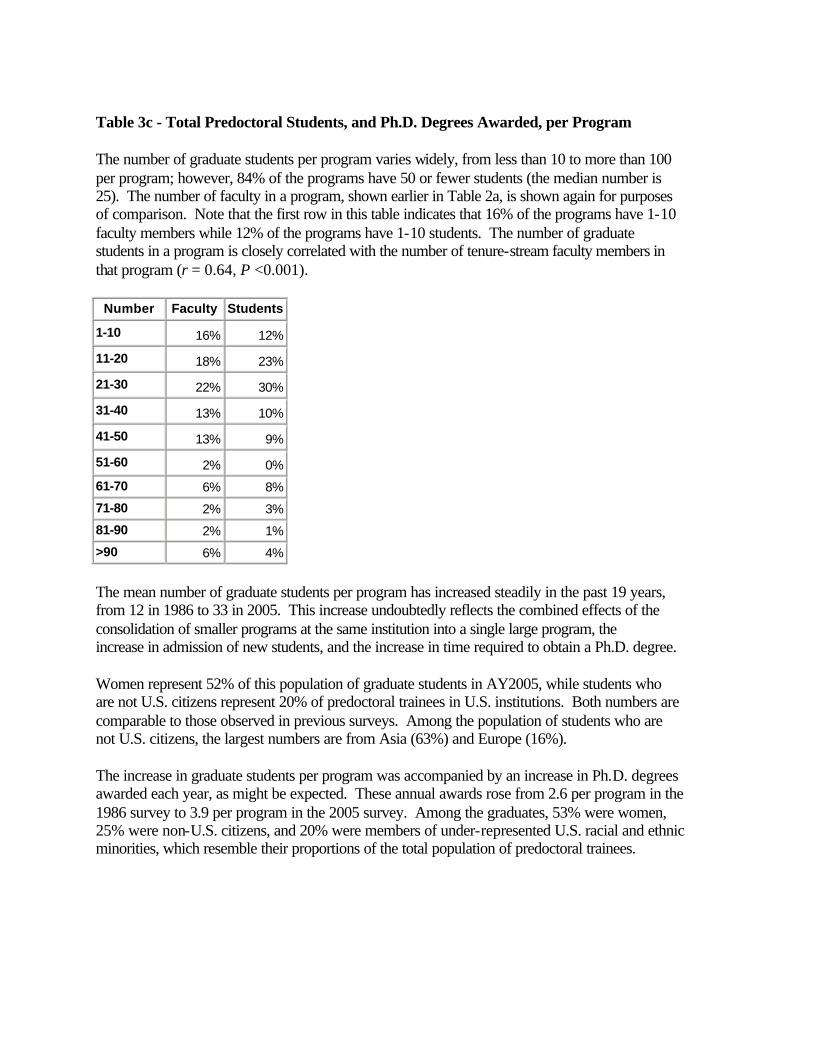
Table 3c - Total Predoctoral Students, and Ph.D. Degrees Awarded, per Program The number of graduate students per program varies widely, from less than 10 to more than 100 per program; however, 84% of the programs have 50 or fewer students (the median number is 25). The number of faculty in a program, shown earlier in Table 2a, is shown again for purposes of comparison. Note that the first row in this table indicates that 16% of the programs have 1-10 faculty members while 12% of the programs have 1-10 students. The number of graduate students in a program is closely correlated with the number of tenure-stream faculty members in that program (r = 0.64, P <0.001).
Number Faculty Students 1-10 16% 12%
11-20 18% 23%
21-30 22% 30%
31-40 13% 10%
41-50 13% 9%
51-60 2% 0%
61-70 6% 8%
71-80 2% 3%
81-90 2% 1%
>90 6% 4%
The mean number of graduate students per program has increased steadily in the past 19 years, from 12 in 1986 to 33 in 2005. This increase undoubtedly reflects the combined effects of the consolidation of smaller programs at the same institution into a single large program, the increase in admission of new students, and the increase in time required to obtain a Ph.D. degree. Women represent 52% of this population of graduate students in AY2005, while students who are not U.S. citizens represent 20% of predoctoral trainees in U.S. institutions. Both numbers are comparable to those observed in previous surveys. Among the population of students who are not U.S. citizens, the largest numbers are from Asia (63%) and Europe (16%). The increase in graduate students per program was accompanied by an increase in Ph.D. degrees awarded each year, as might be expected. These annual awards rose from 2.6 per program in the 1986 survey to 3.9 per program in the 2005 survey. Among the graduates, 53% were women, 25% were non-U.S. citizens, and 20% were members of under-represented U.S. racial and ethnic minorities, which resemble their proportions of the total population of predoctoral trainees.

Survey Year 86 91 98 00/01 03 05
Average per Program
Total predoctoral trainees
12 16 20 25 33 33
Non-U.S. citizens (%) --- 20 19 20 21 20
Ph.D. degree awarded 2.6 2.8 3.2 3.6 3.6 3.9
Ph.D. degree not awarded --- --- --- 1.3 1.1 1.1
Table 3d - Years in Program The number of years in graduate training that are required to obtain a Ph.D. degree increased substantially between the 1986 and 1991 surveys, but it has changed little since then. For students graduating in AY2005, it took 5.7 years on average to complete training, with 86% of the students doing so between 4 and 7 years. These numbers were virtually identical for U.S. citizens, for U.S. racial and ethnic minorities, and for male and female students, but they were notably different for non-U.S. citizens: only 5.1 years to degree on average, and 94% between 4 and 7 years. Only 4% of predoctoral trainees (~1.1 per program) left their graduate programs in AY2005 without obtaining a Ph.D. degree. Among them, the numbers of women (61%), U.S. racial and ethnic minorities (19%), and non-U.S. citizens (26%) were similar to their representation in the total population of predoctoral trainees. Students who left did so after 1.9 years of training, on average (89% within 3 years, 97% within 4 years). Less than half the students (41%) left with a M.S. degree. A surprisingly high number of the students who left (18%) were in an M.D./Ph.D. program, and they either returned to medical school or began their medical internship or residency. All of these numbers are comparable to those observed in the 2000/2001 and 2003 surveys. Survey Year 86 91 98 00/01 03 05
Average Years
Ph.D. awarded 4.3 5.2 5.5 5.5 5.6 5.7
Ph.D. not awarded
--- --- 2.2 2.5 2.4 1.9
Table 3e - Placement of New Graduates with a Ph.D. Degree

Upon receiving their Ph.D. degree, most graduates pursued further research training and accepted postdoctoral positions (69%), as was observed in the previous surveys. This was true of US citizens and non-U.S. citizens alike (68%, 70%, respectively). Many graduates went to medical school or began a medical internship or residency (14%); this was especially true among U.S. citizens (16% vs 8% among non-U.S. citizens). Relatively few took faculty positions (5%) or jobs in industry (4%) soon after graduation. As in previous years, very few graduates were employed outside of Neuroscience (1%) or were not yet employed (0%). Male and female graduates were similar in each of these respects. Survey Year 91 98 00/01 03 05
Percent of Total
Postdoctoral position 60 70 62 71 69
Medical School 13 15 11 16 14
Faculty position 6 5 7 3 5
Industry 12 1 8 3 4
Other 6 5 8 7 6
Employed outside the field 2 3 2 0 1
Currently unemployed 1 1 2 0 0
4. Postdoctoral Training Table 4a - Profile of Postdoctoral Trainees Most of the postdoctoral trainees (87%) have only a Ph.D. degree, as has been observed since 1986. Only 12% have a medical degree, which is similar to the results of the three previous surveys. As with the predoctoral students, the number of posdtdoctoral trainees in a program is significantly correlated with the number of tenure-stream faculty members in that program (r = 0.39, P <0.05). Survey Year 86 91 98 00/01 03 05
Percent of Total
Ph.D. 78 63 88 83 87 87
M.D. 18 25 5 9 7 8
M.D./Ph.D. 4 12 6 6 5 4
Other 0 0 1 2 1 1

Only about one-third of the programs provided information about postdoctoral trainees other than the degree(s) they obtained, which is certainly much less information than was provided about predoctoral trainees and faculty members. Perhaps such information is not yet commonly tracked by the administrative offices of graduate programs in Neuroscience. Inspection of the data from the past three surveys indicates a similar shortage of responses, and the same may be true of previous surveys as well. That caveat should be kept in mind when considering the results obtained over the years. The number of postdoctoral trainees per program in the 2005 survey (~15) is greater than the numbers seen in previous surveys (7-12). Fifty-seven percent of these trainees are not U.S. citizens, almost three times as many as there are among predoctoral trainees but not a further expansion above the progressively increasing numbers that were observed in the 1991, 1998, 2000/2001, and 2003 surveys (40%, 49%, 60%, and 64%, respectively). Among that population, the largest portions are from Asia (56%) and Europe (22%). Women constitute 40% of the foreign postdoctoral trainees, 43% of the domestic trainees, and 41% of the overall population. Table 4b - Placement from Postdoctoral Position When postdoctoral trainees leave, they typically either pursue additional training in another postdoctoral position (38%) or take a faculty position (29%). This general outcome also was seen in the previous surveys, although it is now clear that a progressive increase has occurred in the numbers who take another postdoctoral position. As in previous years, very few postdoctoral trainees leave to take employment outside of Neuroscience or are not employed. This pattern of placements was similar for U.S. citizens and non-citizens except that fewer U.S. citizens left for another postdoctoral position (22% vs 45%) and more took a faculty position (39% vs 24%). Forty-six percent of the trainees who left a postdoctoral position were women, which is close to their representation among fellows.
Survey Year 91 98 00/01 03 05
Percent of Total
Another postdoctoral position
21 30 34 37 38
Medical School 3 1 6 4 3
Faculty position 45 28 41 38 29
Industry 14 4 5 7 11
Other 14 29 9 14 15
Employed outside the field 2 1 3 0 3
Currently unemployed 1 6 1 0 1
5. Diversity

Table 5a - Minority Representation The representation of U.S. racial and ethnic minorities as a percentage of all predoctoral trainees has almost doubled since the 1991 survey. Although a comparable increase in their representation among postdoctoral trainees does not appear to have occurred, it should be noted that the figures on the left side of Table 5a are confounded by the substantial increase in the number of postdoctoral trainees at U.S. institutions who are not U.S. citizens. When the figures are expressed as a percentage of only the postdoctoral trainees who are U.S. citizens (right side of the table), it becomes clear that the training of members of U.S. racial and ethnic minorities actually have followed similar trends at the pre- and post-doctoral levels. On the other hand, minority representation in tenure-stream faculty positions has increased much more gradually over the years, and it still remains quite low. Its distribution across the three academic ranks (39% assistant professor, 20% associate professor, 40% full professor) resembles that of women tenure-stream faculty members (31%, 26%, 43%, respectively) in being under-represented at the full professor level in comparison to males (21%, 23%, 56%, respectively). However, unlike women, minority representation in nontenure-stream positions is similar to that in tenure-stream positions (11% of total, 13% of U.S. citizens).
Survey Year 86 91 98 00/01 03 05 91 98 00/01 03 05
Percent of Total Percent of Total U.S.
Predoctoral 10 9 18 18 16 16 11 22 23 20 21
Postdoctoral 22 6 11 6 8 9 10 21 16 20 21
Tenure-stream Faculty
5 6 7 8 8 8 6 7 8 9 10
Table 5b - Minority Distribution Among the U.S. racial and ethnic minority population, Asian-Americans represent the largest group of predoctoral and postdoctoral trainees, and of tenure-stream faculty, in the neural sciences. Hispanic-Americans are much less numerous in all three categories, while African-Americans are even fewer in number, and Native Americans are still fewer.

Survey Years 91 98 00/01 03 05 91 98 00/01 03 05 91 98 00/01 03 05
Percent of Total Minority
Predoctoral Postdoctoral Faculty
Asian Amer. 38 42 41 41 39 53 50 69 50 60 64 61 57 66 64
Hispanic Amer. 32 25 30 30 31 25 10 19 25 24 22 20 24 17 24
African Amer. 22 20 17 18 21 12 32 12 21 14 11 7 9 8 7
Native Amer. 0 8 2 1 2 0 4 0 0 0 0 5 1 0 0
Other 8 5 10 10 7 10 4 0 4 2 3 7 9 9 5
When funding trainees, the U.S. federal government places special emphasis on African-Americans, Hispanic-Americans, Native Americans, and Pacific Islanders among members of U.S. racial and ethnic minorities because they are under-represented in academia. Thus, it should be noted that when just these groups are considered (i.e., Asian-Americans are excluded), their representation in the 2005 survey is reduced to only 12% of predoctoral trainees who are U.S. citizens (10% of all predoctoral trainees), only 14% of postdoctoral trainees who are U.S. citizens (6% of all postdoctoral trainees), and only 4% of tenure-stream faculty members who are U.S. citizens (4% of all such faculty members). 6. Financial Support Table 6a - Stipend Sources - First Year Graduate Students Almost all predoctoral trainees in the neural sciences receive stipend support. First-year graduate students receive 56% of this support from University funds, much less often in the form of teaching assistantships than previously. The balance of their stipend is derived from a combination of training grants, research grants, and fellowships, in smaller amounts. These latter numbers have changed little in recent years but for the sharp increase in training grant funds. Survey Year 86 91 98 00/01 03 05
Percent of Total
Teaching assistantship 34 29 29 27 23 14
Other university funds 30 38 41 39 34 42
Training grants 9 10 10 15 18 26
Research grants 16 14 9 14 14 12
Fellowships 10 8 11 5 11 6

Table 6b - Stipend Sources - Advanced Graduate Students Predoctoral trainees advanced beyond their first year receive less than 30% of their support from the university. This amount has been decreasing steadily since the 1986 survey. To compensate for this change, research grants have provided increasing support of these advanced graduate students; indeed, in the 2005 survey research grants provided almost half of the total funds for stipends. Survey Year 86 91 98 00/01 03 05
Percent of Total
Teaching assistantship 31 27 29 22 18 15
Other university funds 21 21 12 12 17 14
Training grants 12 9 6 12 11 11
Research grants 24 33 37 43 40 47
Fellowships 13 10 6 11 14 13
Table 6c - Stipend Sources - Postdoctoral Trainees Research grants also are the major source of the stipends for postdoctoral trainees, as has been the case during the past 19 years. The first three ANDP surveys considered the support of all postdoctoral trainees collectively, whereas the 2000/2001 and 2003 surveys and the present survey considered U.S. and non-U.S. citizens separately. The latter results indicate the predominant dependence on research grants to support postdoctoral trainees; such grants now provide two-thirds of the stipends for U.S. citizens and almost 90% of the stipends for non-U.S. citizens
Survey Year 86 91 98 00/01
(U.S.) 00/01 (Non-U.S.)
03 (U.S.)
03 (Non-U.S.)
05 (U.S.)
05 (Non-U.S.)
Percent of Total
University funds 8 12 9 4 4 4 10 8 1
Training grants 22 16 12 11 1 19 4 9 1
Research grants 38 50 65 74 90 67 75 69 89
Fellowships 30 22 12 10 5 10 10 11 3
7. Undergraduate Programs The existence of undergraduate programs in Neuroscience is a relatively recent phenomenon. Based on information available from 27 of the 33 undergraduate program members in the ANDP, 2 (7%) programs were founded before 1980, 6 (22%) were founded between 1980 and 1989, and 19 (70%) were founded after 1989. A representative mix of older and newer programs participated in the present survey, as in the previous two surveys. i. Institutional Affiliation. Eighteen (69%) of the 26 programs are located in undergraduate colleges that do not have a Ph.D. program in Neuroscience. ii. Administrative Structure. Eighteen (69%) of the 26 programs are interdisciplinary in nature, and offer a B.S. or B.A. degree in Neuroscience. Five programs offer a B.S. or B.A. degree either in Biology or Psychology, with a specialization in Neuroscience. Only three programs are located in Departments of Neuroscience or Behavioral Neuroscience. iii. Faculty Hiring. Fifteen (58%) of the 26 programs hire faculty members for their program, which is higher than the percentage of graduate training programs that do so (47%). iv. Faculty Appointments. The average number of faculty members with tenure-stream positions in AY2005 is ~9 per program (median =6 per program). That number has changed little during the previous few years. There was only 5% turnover of positions (i.e., faculty members leaving or arriving as a percent of the total number of faculty affiliated with a program). An additional ~1 faculty position per program is outside the tenure-stream, and the turnover of faculty with such positions was 50%. v. Faculty. In AY2005, the distribution of faculty members with tenure-stream positions is 28% assistant professors, 28% associate professors, and 44% full professors. Women occupy 37%, 34%, and 19% of these positions, respectively, for a total of 28% of all tenure-stream positions. They also hold 29% of the nontenure-stream faculty positions. These numbers are generally similar to those of faculty members in graduate programs in the neural sciences. Among faculty with tenure-stream positions, 7% are members of U.S. racial and ethnic minorities and only 1% are not U.S. citizens. Among faculty with nontenure-stream positions, 12% are members of U.S. racial and ethnic minorities and all are U.S. citizens. vi. Undergraduate Students. The number of undergraduate students with Neuroscience majors per program continues to vary widely (range = 4 to 393). The median program had 30 majors (only 4 had >100), which was ~5 times the median number of faculty per program. A median of 58 Neuroscience majors per program was reported two years ago, and 22 were reported four years ago. This apparent fluctuation no doubt reflects variability in the size of the programs participating in the surveys rather than true fluctuations in the size of individual programs. On the other hand, in the latest survey there are equal numbers of males and females among the undergraduate students with majors in Neuroscience, as in previous surveys.

These results must be considered with caution because of the relatively small size of the obtained sample. Nonetheless, it should be noted that each response was similar to the one provided in the 2000, 2001, and 2003 surveys, except as noted. 8. Summary Graduate training programs in the neural sciences used to be located predominantly in Schools of Medicine or in Schools of Arts & Sciences. However, in recent years these graduate programs have been evolving towards larger, university-wide programs that link neuroscientists in multiple schools on campus. Although the administrative structure of graduate programs in the neural sciences is quite varied, most training now is conducted in interdisciplinary programs rather than in departments offering degrees in neuroscience or in other disciplines. Graduate students are much more likely to be awarded a Ph.D. degree in Neuroscience or Neurobiology than in another discipline. Graduate faculty members in the neural sciences play a substantial role in undergraduate education, both by teaching undergraduate courses and by providing opportunities for undergraduate students to become involved in their research projects. There are ~51 faculty members per program, on average, in the graduate programs surveyed. Forty-three have tenure-stream positions (85%), although the median number is 29. The annual turnover in these positions is less than 10%. Approximately half of the tenure-stream faculty members are full professors while one-fourth each are assistant professors or associate professors. The annual number of applications for graduate training in the neural sciences has almost tripled during the past 19 years and is now ~65 per program, while the number of matriculants has doubled and is now ~8 students per program. Nonetheless, the academic quality of incoming graduate students has remained high, as suggested by their undergraduate GPA (average = 3.49), their scores on the GRE (average = ~69th percentile), and their research experience. Only 23% of the incoming students had an undergraduate major in Neuroscience or Behavioral Neuroscience. Other common majors were Biology (23%), Psychology (15%), and Chemistry (6%), and an additional 8% had dual majors including one or more of these disciplines. The number of Ph.D. degrees in Neuroscience awarded annually per program has increased little in recent years and is now 3.9, while the time to degree has stabilized at ~5.7 years. Predoctoral students who are women, U.S. racial and ethnic minorities, or non-U.S. citizens are equally likely to obtain their Ph.D. degree, and in the same time frame, as one another and as the American Caucasian male majority. Most new graduates pursue further research training in postdoctoral positions (69%), while many others go to medical school (14%). Only 4% of predoctoral trainees leave the program annually without obtaining a Ph.D. degree.

They do so on average after ~2 years of graduate study, often (41%) obtaining a terminal M.S. degree. More than 90% of postdoctoral trainees in the neural sciences have a Ph.D. degree. Postdoctoral trainees usually leave their position either to accept a faculty position or to pursue further training. Almost all graduates with a Ph.D. degree in Neuroscience are employed in scientific positions, and very few are employed outside the field or are not employed at all. Women represent 50% of undergraduate Neuroscience majors, 52% of predoctoral trainees, and 41% of postdoctoral trainees, but only 25% of tenure-stream faculty members and 21% of full professors. In contrast, women represented 38% of nontenure-stream faculty members. Among U.S. citizens, members of U.S. racial and ethnic minorities represent 21% each of predoctoral trainees and postdoctoral trainees, but only 10% of tenure-stream faculty members and 13% of nontenure-stream faculty members. Most of these trainees and faculty members are Asian-American. When Asian-Americans are excluded and only under-represented U.S. racial and ethnic minorities are considered, the numbers shrink to 12%, 3%, 4%, and 5%, respectively, of U.S. citizens. Predoctoral trainees who are not U.S. citizens come predominantly from Asia and Europe. They now represent 20% of predoctoral trainees, a number that has changed little during the past 15 years. The number of postdoctoral trainees who are not U.S. citizens had been increasing progressively, from 40% in 1991 to 64% in the 2003 survey. However, the 2005 survey indicates that only 57% of the postdoctoral fellows are non-U.S. citizens. Despite that relatively large number, they occupy less than 10% of all tenure-stream graduate faculty positions in the neural sciences at U.S. institutions. Almost all predoctoral students receive stipend support, primarily from university funds (first-year students) and from research grants (more advanced students). Research grants also appear to be the major source of support for postdoctoral trainees. Much less information was available from undergraduate programs in the neural sciences, but available evidence indicates that most programs are interdepartmental in administrative structure, and most tenure-stream faculty are Caucasian male Americans (93%, 72%, 99%, respectively). The number of tenure-stream faculty positions is relatively small (~9 per program) and has not changed during the past 5 years, nor has the number of undergraduate students with majors in Neuroscience (a median of 30 per program). 9. Conclusions Neuroscience is a very attractive discipline. It is unusually multidisciplinary in nature, and has drawn significantly from fields as diverse as molecular biology, cognitive psychology, computer science, and clinical medicine. Increased recognition and appreciation of Neuroscience certainly

has been promoted by such recent developments as the "decade of the brain", the award of Nobel prizes to neuroscientists, and conspicuous progress in the diagnosis and treatment of Parkinson's disease, Alzheimer's disease, and spinal injury. These and other developments have attracted a steady increase in the number of graduate students being trained in the neural sciences. Increased recognition and appreciation of the discipline also is reflected in the likelihood that graduate students trained in the neural sciences will receive their degrees in Neuroscience or Neurobiology rather than in some other discipline, as was true 19 years ago. The finding that graduate training in the neural sciences is not confined to departments of neuroscience is in keeping with a similar trend in other biomedical sciences (e.g., Cell Biology, Pharmacology), but is in striking contrast to graduate training in the physical sciences (e.g., Chemistry, Physics). In explanation, not all schools with neuroscientists as faculty members have departments of neuroscience. Even in schools with such departments, neuroscientists may be found in many other departments, both clinical (e.g., Neurology, Psychiatry) and preclinical (e.g., Biology, Pharmacology). Neuroscientists in these other departments understandably want to interact with their colleagues elsewhere on campus, both in research centers and in graduate training programs. The resultant integration of neuroscientists across departments and across schools undoubtedly enhances the quality of those programs while making the community more collegial, more visible and attractive to students and faculty, and more influential on campus. In addition, it makes it more likely that faculty appointed in graduate and professional programs will participate in undergraduate education. Because the NIH budget doubled several years ago, substantial increases in the number and size of federally funded research grants devoted to issues in Neuroscience might be expected in consequence. Traditionally such research depends heavily on the involvement of predoctoral and postdoctoral trainees, and so a secondary increase in the number of such trainees is likely to have occurred as well. In fact, the marked increases in the number of students in Neuroscience graduate programs, seen in these surveys during the past 9 years, are consistent with that possibility. It is important to emphasize that there is little evidence that the quality of the entering graduate students has been reduced in order to expand the size of the programs, or that the goals of increasing diversity among predoctoral trainees have been compromised, or that disproportionately large numbers of foreign students are matriculating, although the percentage of postdoctoral fellows who are not U.S. citizens has risen sharply. In any case, graduate and postdoctoral programs in Neuroscience appear to be flourishing. Despite these clear indications that Neuroscience is a thriving discipline, its research and training programs face several significant challenges. Some are not unique to Neuroscience but are common within the biomedical sciences generally.7 For example, despite modest increases during the past 19 years, women still are very much under-represented as tenure-stream faculty members, especially at the full professor level, in comparison to their full representation among predoctoral trainees. At the most recent rate of increase (i.e., only 1% in the past 7 years), it will take generations, not decades, before women comprise 50% of the tenure-stream faculty members in Neuroscience. Even if one assumes a more rapid rate of turnover in faculty positions – for example, 3% of the faculty members leave each year of which 80% are men, and 6% are added annually of which 50% are women - it will take 21 years before women represent 50% of the tenure-stream faculty members. In other words, there is so much inertia in the
system, caused by a very high initial percentage of male faculty members and a low rate of turnover of tenure-stream academic positions, that it will take a long time to redress this inequality unless graduate programs become even more committed than they now are to a policy of gender equality in their faculty. Similar statements can be made regarding members of under-represented U.S. racial and ethnic minorities among faculty in graduate Neuroscience programs. Moreover, their relatively slow progress to date in receiving appropriate representation in graduate faculties has been further impeded by their continued under-representation among predoctoral and postdoctoral trainees in Neuroscience. Other issues may be more specific to training in the neural sciences at the undergraduate, predoctoral, and/or postdoctoral levels. Here are some that were addressed in this survey. Undergraduate. The finding that most tenure-stream faculty positions in undergraduate Neuroscience programs are at the associate or full professor levels suggests that Neuroscience is not being taught primarily by faculty who received graduate and postdoctoral training in recent years. This situation likely provides a challenge for faculty to provide contemporary research experiences to their students, especially in undergraduate programs located at institutions that do not have graduate programs in Neuroscience. Predoctoral. The remarkable heterogeneity in background of students entering graduate programs in the neural sciences suggests that extensive expertise in Neuroscience generally is not a significant variable in the admission process. This heterogeneity in background presents a considerable challenge for programs to design a suitable curriculum of graduate courses. Relevant undergraduate courses in Neuroscience sometimes are available on the same campus and represent an opportunity for graduate students to improve their background in the subject, though the faculty may be reluctant to encourage that option. To further complicate matters, less than half the graduate programs in the neural sciences can hire their own faculty, and therefore it seems likely that such programs have difficulty in maintaining a stable curriculum of graduate courses and research specialties. This situation likely occurs in many undergraduate programs, as well. Postdoctoral. The percentage of non-U.S. citizens among predoctoral trainees in Neuroscience has been relatively constant during the past 19 years, which indicates that their presence is not responsible for the net increase in the size of graduate programs in the neural sciences during this time. In contrast, the number of non-U.S. citizens among postdoctoral trainees in Neuroscience has increased and since the 2000/2001 surveys they have constituted more than half of that population. The financial support of postdoctoral trainees (and advanced graduate students) has become increasingly dependent on faculty research grants, especially trainees who are not U.S. citizens and therefore are not eligible for federal fellowships or support on federal training grants. Whether the National Institutes of Health will continue to allow research grants to support so many trainees is a controversial matter now under discussion.8,9 If the NIH decides to change their policy and limit the use of research funds to support trainees, then alternative funds for this purpose will have to increase or else the size of training and research programs in the neural sciences will diminish. An attractive proposal to reduce the number of trainees without

compromising the faculty research programs in which they are engaged is to develop new academic job titles and professional scientist positions for advanced postdoctoral fellows who in most respects are no longer “trainees”.9-11 Finally, a problem that cuts across all levels of training stems from the finding that faculty positions in the neural sciences are increasing more slowly than the rate at which Ph.D. degrees in Neuroscience are being awarded. Perhaps in consequence, an increasing percentage of trainees who leave one postdoctoral position are moving to another or taking a job outside of academia. It would be of interest to know whether, over the years, there actually has been a progressive increase in the total period between the time when a Ph.D. degree was earned and the time when a faculty position was secured, as seems likely, or whether the number of postdoctoral positions held has gradually increased before a permanent job was taken; unfortunately, this information has not been available from Neuroscience program administrators and therefore it has not been tracked by ANDP surveys. Note that such a trend has been documented in other biomedical sciences.12,13 Recent evidence also indicates that a rising percentage of graduating students in the biomedical sciences are employed in industry,13 which is consistent with the results of the present survey. It has always been a challenge to prepare postdoctoral fellows located in academic training programs for professional careers in nonacademic positions. It has been an even bigger challenge to develop a sound national policy regarding how many predoctoral and postdoctoral trainees there should be. One suggestion is to limit graduate training and thereby reduce the number of postdoctoral trainees seeking employment in academia.8,14 The ANDP leadership has opposed that view, pointing out that it never has been possible to accurately predict future job markets, that numerous opportunities for employment besides faculty positions always have been available, and that postdoctoral trainees almost invariably find employment in science ultimately.15 More generally, it seems inappropriate to prevent students from obtaining the training they seek in order to compete successfully for the jobs they want, it seems unwise to reduce graduate education in science at a time when life has become increasingly more complex and science-based, and it seems unfair to place limits on opportunities when some groups have not yet had a chance to take advantage of them. On the other hand, it also seems inappropriate for graduate programs not to educate trainees broadly while preparing them for diverse careers and for the uncertainty they may experience while they clarify their professional goals and evaluate relevant opportunities. 7Garrison, H.H., and Gerbi, S.A. Education and employment patterns of U.S. Ph.D.’s in the biomedical sciences. FASEB Journal 12: 139-148, 1998. 8Addressing the nation's changing needs for biomedical and behavioral scientists. Washington, D.C.: National Academy Press, 2000. [http://grants.nih.gov/training/outcomes.htm.] 9NIH statement in response to addressing the nation's changing needs for biomedical and behavioral scientists. [http://grants.nih.gov/training/nas_report/NIHResponse.htm]

10Gerbi, S.A., Garrison, H.H., and Perkins, J.A. Workforce alternatives to graduate students? Science 292: 1489-1490, 2001. 11Freeman, R., Weinstein, E., Marincola, E., Rosenbaum, J., and Solomon, F. Competition and careers in biosciences. Science 294: 2293-2294, 2001. 12Marincola, E., and Solomon, F. The career structure in biomedical research: Implications for training and trainees. The American Society for Cell Biology survey on the state of the profession. Molecular Biology of the Cell 9: 3003-3006, 1998. 13Garrison, H.H., Gerbi, S.A., and Kincade, P.W. In an era of scientific opportunity, are there opportunities for biomedical scientists? FASEB Journal 17: 2169-2173, 2003. 14Trends in the Early Careers of Life Scientists. National Research Council, National Academy Press, 1998. [http://www.nap.edu/catalog/6244.html?onpi_newsdoc091098] 15Mize, R.R., Talamo, B.R., Schoenfeld, R.I., Huffman, L.K., and Fellows, R.E. Neuroscience training at the turn of the century: a summary report of the third annual ANDP survey. Nature Neuroscience 3: 433-435, 2000.