The 2002-2003 Implant Yearbook on Orthopaedic Endoprostheses
136
Editor: Juha Nevalainen Docent, D.Med.Sc., Orthopaedic Surgeon System Analyst: Anneli Keinonen Register Secretary: Auni Mäkelä Translation Secretary: Anu Pentti The 2002-2003 Implant Yearbook on Orthopaedic Endoprostheses Finnish Arthroplasty Register
Transcript of The 2002-2003 Implant Yearbook on Orthopaedic Endoprostheses

Editor:Juha Nevalainen Docent, D.Med.Sc., Orthopaedic Surgeon
System Analyst:Anneli Keinonen
Register Secretary:Auni Mäkelä
Translation Secretary:Anu Pentti
The 2002-2003 Implant Yearbook on Orthopaedic Endoprostheses
Finnish Arthroplasty Register

Introduction
Annual Arthroplasty Report has been completed
In Finland, the tradition of registering endoprostheses is long. Data have been collected on a nationwide basis into one register already since 1980. In the history of registers, it is a long continuous period that has provided precious material for several purposes. In the end of 2003, follow-up data of 180446 joint pros-theses had been recorded in the Finnish Implant Register, which is maintained by the National Agency for Medicines. The number of follow-up years well exceeds one million.
The National Agency for Medicines has been responsible for the maintenance of the Implant Register since 1995. According to its task, the National Agency for Medicines is responsible for monitoring implants that are placed permanently in human beings. In addition, the National Agency for Medicines is responsible for promoting the safe use of medical devices.
Has the Implant Register had any influence in Finland? The use of implants has increased nearly tenfold in our country during the last twenty years. However, the number of operations does not yet meet the need experienced by the population. In the case of hip or knee arthroplasties, 100 operations annually in a popula-tion of 100 000 was earlier considered a sufficient number of operations, but today the wildest estimations of the need of operations are fourfold. However, there is a considerably high number of municipalities in Finland, where the number of arthroplasty operations has reached this level already, due to the distorted age structure in these municipalities. The National Agency for Medicines has not performed any studies on whether the open publication of operation numbers has influenced the municipalities’ decisions to buy arthroplasty operations for their population. It is, however, possible that open publication of operation numbers does improve democracy in the treatment of citizens in different parts of the country: people are able to compare numbers of operations to those in the neighbouring municipalities, which will put pressure on the allocation of resources in health care.
Has the outcome of arthroplasty surgery improved? In the mid 1990’s the exceptionally high number of revision hip arthroplasties arose attention in Finland. In order to improve the situation, the National Agency for Medicines increased the amount of information processed from the Implant Register. In part of the orthopaedic profession, open publication of data caused severe criticism, which, however, along with better results has subsided. But has there been any change in the use of implants? In 2003, ten most frequently used implant models covered 85 % of the total use. Most likely it is due to the publication of the outcome data, especially by the Nordic arthroplasty registers. Research results with good coverage are available for almost all most frequently used implants. In 1999, 24.6 % of all hip arthroplasty operations were revision operations. This year, the frequency of revision arthroplasties exceeds 20 % only in six hospital districts, and in some of these districts this can be explained by the modest increase in the number of primary operations.
The survival of certain implant models has been very good for both hip and knee implants throughout the country. The results of the general patient population of the country are well comparable with series published anywhere else. Training provided by manufacturers, importers and professional organizations has probably furthered this positive development.

The current trend is that arthroplasty surgery is moving into larger units and even to specialist centres founded especially for arthroplasty operations. This kind of development must be greeted with delight from the point of view of the authority monitoring device safety. In the public health care sector, the Ministry of Social Affairs and Health has even been willing to set recommendations for the minimum number of arthroplasty operations. The positive development of arthroplasty outcome has been influenced by several factors that cannot be separated from each other. However, it is most probable that the outcome is better in larger units, at least in a longer follow-up period. In addition, larger units provide better opportunities for follow-up and research activity.
New or re-introduced sliding pair materials along with the return of resurfacing implant will be among the most significant new phenomena in arthroplasty surgery during the next few years. Proportioned to the population, Finland has probably the world’s largest series of patients with hip resurfacing implants in an independent register’s follow-up (n=557). So far, it is not possible to draw any conclusions of the method’s outcome in the long run from a series including only one re-operation. We have a clear obligation to follow-up this method extremely closely and report the results to the orthopaedic community.
With the outcome of arthroplasty improving, there is a need to improve also the accuracy of the register used for the follow-up of arthroplasties. From the point of view of the authority monitoring device safety, the most significant task is to unambiguously identify all materials that are used in arthroplasty surgery. The National Agency for Medicines has almost completed a project on an implant database, where each com-ponent used will have an individual identifier. This is a step towards an electric data system. However, on the basis of experiments carried out in Finland it seems probable that, instead of the present system being replaced by the electric system, these two systems will be used side by side.
In order to maintain the high level of reliability of the register data, data must be checked manually twice by two different quarters before being entered to the register. Data are checked in the National Agency for Medicines before recording, and hospitals are offered an opportunity to check their own individualized data annually before the register report is run. Some of the hospitals have used the possibility (in 2003 app. 10 % of all hospitals used the opportunity). The majority of hospitals have found their total sums in the register data to be congruent with their own data.
Register data do not accumulate without systematic collection of data from hospitals. Data collection requires an effort, and usually filling up of forms takes place after the operation – when the next task is already wait-ing. Therefore, we want to thank everyone involved in the data collection process for the accuracy of data, which, considering the situation is good!
Juha NevalainenDocent, D.Med.Sc.Orthopaedic Surgeon
Petri PommelinHead of DepartmentMedical Devices

10

11
Figure G2a. Primary Total Hip Arthroplasty operations in different types of hospitals in 1993- 2003
0 %
10 %
20 %
30 %
40 %
50 %
60 %
70 %
80 %
90 %
100 %
1993 1994 1995 1996 1997 1998 1999 2000 2001 2002 2003Years
COXA
Rheumatism Foundation
Hospital Orton
Other Private Hospitals
University Hospitals
District Hospitals
Central Hospitals
1993 N=40341994 N=43721995 N=43471996 N=46951997 N=48341998 N=48341999 N=48792000 N=52302001 N=55712002 N=62572003 N=6799
Figure G2b. Primary Total Knee Arthroplasty operations in different types of hospitals in 1993 - 2003
0 %
10 %
20 %
30 %
40 %
50 %
60 %
70 %
80 %
90 %
100 %
1993 1994 1995 1996 1997 1998 1999 2000 2001 2002 2003Years
COXA
Rheumatism Foundation
Hospital Orton
Other Private Hospitals
University Hospitals
District Hospitals
Central Hospitals
1993 N=26481994 N=29661995 N=31581996 N=37881997 N=42761998 N=42401999 N=44522000 N=49132001 N=53172002 N=62902003 N=7203

12
Figure G3a. Total Hip Revision operations in different types of hospitals in 1993 - 2003
0 %
10 %
20 %
30 %
40 %
50 %
60 %
70 %
80 %
90 %
100 %
1993 1994 1995 1996 1997 1998 1999 2000 2001 2002 2003Years
COXA
Rheumatism Foundation
Hospital Orton
Other Private Hospitals
University Hospitals
District Hospitals
Central Hospitals
1993 N=9131994 N=946 1995 N=1033 1996 N=10711997 N=11151998 N=11291999 N=12002000 N=11532001 N=12262002 N=11332003 N=1211
Figure G3b. Total Knee Revision operations in different types of hospitals in 1993 - 2003
0 %
10 %
20 %
30 %
40 %
50 %
60 %
70 %
80 %
90 %
100 %
1993 1994 1995 1996 1997 1998 1999 2000 2001 2002 2003Years
COXARheumatism FoundationHospital OrtonOther Private HospitalsUniversity HospitalsDistrict HospitalsCentral Hospitals
1993 N=2241994 N=259 1995 N=299 1996 N=358 1997 N=3771998 N=4261999 N=4242000 N=4292001 N=4182002 N=5022003 N=511

13
Figure G4a. First, second and third revision operations in 2003 Total Hip Revisions
Other revisions 2,0%
1st revision, 75,9%
2nd revision, 17,8%
3rd revision 4,3%
Figure G4b. First, second and third revision operations in 2003 Total Knee Revisions
Other revisions, 1,0%
1st revision,77,7%
2nd revision, 19,4%
3rd revision, 2,0%
14
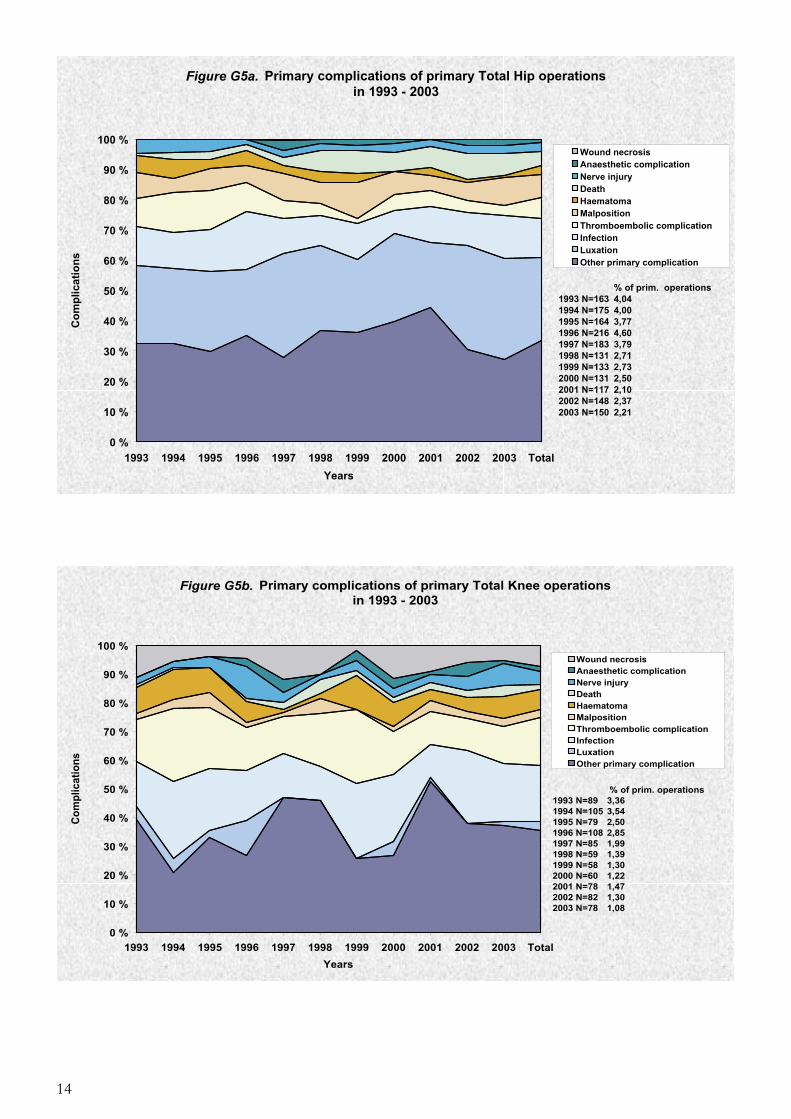
Figure G5a. Primary complications of primary Total Hip operations in 1993 - 2003
0 %
10 %
20 %
30 %
40 %
50 %
60 %
70 %
80 %
90 %
100 %
1993 1994 1995 1996 1997 1998 1999 2000 2001 2002 2003 TotalYears
Com
plic
atio
ns
Wound necrosisAnaesthetic complicationNerve injuryDeathHaematomaMalpositionThromboembolic complicationInfectionLuxationOther primary complication
1993 N=163 1994 N=175 1995 N=164 1996 N=2161997 N=1831998 N=1311999 N=1332000 N=131 2001 N=1172002 N=148 2003 N=150
% of prim. operations 4,04 4,00 3,774,603,792,712,732,502,10 2,372,21
Figure G5b. Primary complications of primary Total Knee operations in 1993 - 2003
0 %
10 %
20 %
30 %
40 %
50 %
60 %
70 %
80 %
90 %
100 %
1993 1994 1995 1996 1997 1998 1999 2000 2001 2002 2003 TotalYears
Com
plic
atio
ns
Wound necrosisAnaesthetic complicationNerve injuryDeathHaematomaMalpositionThromboembolic complicationInfectionLuxationOther primary complication
1993 N=891994 N=105 1995 N=79 1996 N=1081997 N=851998 N=591999 N=582000 N=60 2001 N=782002 N=822003 N=78
% of prim. operations 3,36 3,542,502,851,991,391,301,221,47 1,301,08

15
Figure G6. Number of hospitals performing primary and revision Total Joint Arthroplasties
39 3742
38 38 39 40
45
5148
59 6064
6865 65 65 65 65
69 70 69 6867
56 5652
2623
2831
35 3336 33
38 39
47 47 4954
58
53 53 52
5855 56
0
10
20
30
40
50
60
70
8019
80
1981
1982
1983
1984
1985
1986
1987
1988
1989
1990
1991
1992
1993
1994
1995
1996
1997
1998
1999
2000
2001
2002
2003
Years
Num
ber o
f hos
pita
ls
Primary Revision

16
Figure G7a. Hip revisions and their proportion of all primary Hip Arthroplasties
12,1
10,6
10,7
12,9
13,3
15,1
18,3
17,1
15,9
17,8
17,8
20,8
24,4
22,6
21,6
23,8
22,8
23,1
23,4 24
,6
22,0
22,0
18,1
17,8
0
200
400
600
800
1000
1200
1400
1980
1981
1982
1983
1984
1985
1986
1987
1988
1989
1990
1991
1992
1993
1994
1995
1996
1997
1998
1999
2000
2001
2002
2003
Years
Num
ber o
f rev
isio
ns
0
5
10
15
20
25
30
% o
f all
Prim
ary
Hip
Art
hrop
last
ies
Number of revision % of all Primary Hip Arthroplasties
Figure G7b. Knee revisions and their proportion of all primary Knee Arthroplasties
9,2
6,7
8,1
7,3
8,5
5,7
7,3
5,4
5,1
6,5
7,4
6,9
8,1 8,
5 8,7
9,5
9,5
8,8
10,0
9,5
8,7
7,9 8,0
7,1
0
100
200
300
400
500
600
1980
1981
1982
1983
1984
1985
1986
1987
1988
1989
1990
1991
1992
1993
1994
1995
1996
1997
1998
1999
2000
2001
2002
2003
Years
Num
ber o
f rev
isio
ns
0
2
4
6
8
10
12
% o
f all
Prim
ary
Kne
e A
rthr
opla
stie
s
Number of revision % of all Primary Knee Arthroplasties

17
Tabl
e G
8.TO
TAL
JOIN
T A
RTH
RO
PLA
STY
OPE
RA
TIO
NS
PER
FOR
MED
IN D
IFFE
REN
T H
OSP
ITA
LS IN
199
0 - 2
003
1990
1991
1992
1993
1994
1995
1996
1997
1998
1999
2000
2001
2002
2003
YHTE
ENSÄ
HO
SPIT
AL
LKM
LKM
LKM
LKM
LKM
LKM
LKM
LKM
LKM
LKM
LKM
LKM
LKM
LKM
LKM
4040
6Lo
imaa
Reg
iona
l Hos
pita
l81
5679
123
150
139
147
173
154
120
164
169
225
190
1970
4041
2S
alo
Reg
iona
l Hos
pita
l10
414
016
421
521
018
521
017
818
213
812
014
017
716
323
2640
425
Vak
ka-S
uom
i Hos
pita
l43
3663
8870
5698
5761
4835
3727
3875
740
428
Rai
sio
Reg
iona
l Hos
pita
l4
1018
130
185
164
182
118
9810
884
9670
106
1373
4043
1Tu
runm
aa H
ospi
tal
3337
3656
5661
8190
9810
211
812
311
412
211
2750
230
Turk
u U
nive
rsity
Cen
tral H
ospi
tal
9214
819
421
623
529
640
641
149
445
354
558
464
071
154
2590
545
Turk
u S
urgi
cal H
ospi
tal
--
--
--
-13
921
019
724
326
032
130
716
77
6065
1H
ospi
tal M
ehilä
inen
Tur
ku-
-4
1110
63
71
113
1319
2911
760
695
Hos
pita
l Pul
ssi
4440
3017
3533
2032
3439
6510
588
146
728
4031
3S
atak
unta
Cen
tral H
ospi
tal
111
111
188
171
251
305
257
303
326
298
332
320
324
461
3758
4041
0R
aum
a R
egio
nal H
ospi
tal
6984
8610
513
612
115
012
217
118
318
819
222
427
221
0360
682
Por
i Med
ical
Cen
tr e-
--
--
--
--
--
528
4174
4030
9K
anta
-Häm
e C
entra
l Hos
pita
l88
108
9712
011
813
717
915
414
912
124
321
721
028
922
3040
421
Riih
imäk
i Reg
iona
l Hos
pita
l8
2930
3848
3566
7378
7284
7055
5574
140
407
Loun
ais-
Häm
e R
egio
nal H
ospi
tal
5977
7871
7694
102
101
9411
110
8-
--
971
9061
4Fo
rssa
Hos
pita
l-
--
--
--
--
--
102
141
118
361
4041
3V
alke
akos
ki H
ospi
tal
4159
5665
7512
612
512
611
512
914
218
011
510
1364
4042
3V
amm
ala
Reg
iona
l Hos
pita
l5
4055
7377
8510
810
611
211
011
011
011
46
1111
5029
0Ta
mpe
re U
nive
risty
Hos
pita
l36
735
732
937
347
941
348
250
952
453
365
168
248
714
763
3390
532
Hat
anpä
ä H
ospi
tal
9410
816
619
717
816
515
719
319
117
620
618
313
62
2152
6064
4P
irkan
maa
Sur
gica
l Clin
i c-
--
--
-6
1022
3135
6044
821
660
718
CO
XA
--
--
--
--
--
--
450
1473
1923
4031
8P
äijä
t-Häm
e C
entra
l Hos
pita
l59
4861
129
135
124
125
325
369
415
377
394
422
304
3287
9029
9La
hti H
ealth
Cen
tr e10
211
382
114
114
142
204
--
--
--
-87
190
615
Hei
nola
Hea
lth C
entre
-
--
--
--
--
1023
232
4811
5
6063
5R
heum
a Fo
unda
tion
Hos
pita
l39
646
756
556
251
945
142
435
432
338
036
340
641
849
361
21
4031
4K
ymen
laak
so C
entra
l Hos
pita
l13
812
719
313
526
820
929
823
122
424
531
034
330
730
833
3640
404
Kuu
sank
oski
Reg
iona
l Hos
pita
l45
5459
7210
110
011
011
810
212
111
612
613
313
613
9390
709
Ham
ina
Hos
pita
l-
2424
3648
-24
7892
112
101
7410
710
082
0
4030
1S
outh
Kar
elia
Cen
tral H
ospi
tal
7496
108
127
138
143
217
217
154
196
191
169
172
185
2187
4031
2M
ikke
li C
entra
l Hos
pita
l77
8880
7611
686
151
156
169
207
218
318
310
333
2385
4041
8P
ieks
ämäk
i Reg
iona
l Hos
pita
l11
2617
4550
4571
709
--
--
-34
490
667
Pie
ksäm
äki H
ospi
tal
--
--
--
--
--
3667
6989
261
4030
5S
avon
linna
Cen
tral H
ospi
tal
111
111
121
118
124
113
200
192
226
238
217
234
193
143
2341
4030
4N
orth
Kar
elia
Cen
tral H
ospi
tal
107
117
138
191
226
281
267
297
280
232
396
377
487
648
4044
6071
2Itä
-Suo
mi M
edic
al C
entre
-1
33
97
68
1518
1542
2130
178
4040
2Iis
alm
i Reg
iona
l Hos
pita
l-
4456
5664
8192
111
134
180
8416
320
120
314
6940
414
Var
kaus
Reg
iona
l Hos
pita
l-
-12
1355
5574
9310
712
111
513
211
513
810
3050
250
Kuo
pio
Uni
vers
ity H
ospi
tal
282
330
574
565
554
506
579
624
671
569
730
671
799
1005
8459
6063
1H
ospi
tal L
asar
etti
2626
2313
147
1720
1722
812
723
235
4030
2C
entra
l Fin
land
Cen
tral H
ospi
tal
182
204
258
332
396
500
415
509
457
431
446
477
519
602
5728

18
1990
1991
1992
1993
1994
1995
1996
1997
1998
1999
2000
2001
2002
2003
YHTE
ENSÄ
HOSP
ITAL
LKM
LKM
LKM
LKM
LKM
LKM
LKM
LKM
LKM
LKM
LKM
LKM
LKM
LKM
LKM
9070
7Jo
kila
akso
Hos
pita
l92
101
9012
216
317
217
121
821
921
020
923
123
124
92478
4031
7S
einä
joki
Cen
tral H
ospi
tal
206
232
273
307
375
327
397
422
416
382
348
328
348
421
4782
4042
2Ä
htär
i Hos
pita
l-
--
2411
1410
533
4610
221
424
624
7952
4030
7V
aasa
Cen
tral H
ospi
tal
101
122
125
120
102
9812
116
014
612
516
921
222
117
92001
4040
8P
ieta
rsaa
ri H
ospi
tal
4055
4564
5419
4178
8971
113
109
103
103
984
4041
7S
elkä
mer
i Hos
pita
l-
--
632
2325
3830
3948
7247
-360
4031
5K
eski
-Poh
janm
aa C
entra
l Hos
pita
l11
810
616
213
213
219
715
917
323
023
923
521
622
530
82632
4041
9R
aahe
Reg
iona
l Hos
pita
l12
4336
3649
5943
4836
4841
--
-451
9064
3R
aahe
Hos
pita
l-
--
--
--
--
-16
3668
65185
4042
4O
ulas
kank
as H
ospi
tal
--
--
--
--
--
448
101
161
314
4141
3P
äivä
rinne
Hos
pita
l10
915
917
516
4-
--
--
--
--
-607
5027
5O
ulu
Uni
vers
ity H
ospi
tal
246
197
204
267
125
443
513
608
546
630
548
488
687
671
6173
9028
6K
uusa
mo
Hea
lth C
entre
Hos
pita
l-
--
--
--
-20
6126
5054
34245
6062
9H
ospi
tal o
f the
Oul
u D
eaco
ness
Inst
itut e
--
-36
202
210
165
134
145
157
122
152
196
240
1759
6063
0H
ospi
tal o
f the
Oul
u D
eaco
ness
Inst
itute
/Oul
u U
n i-
--
--
6113
1-
--
--
--
192
6067
5H
ospi
tal B
otni
a O
y-
--
--
23
3-
-1
129
1242
4031
6K
ainu
u C
entra
l Hos
pita
l11
911
112
616
917
619
020
120
918
616
315
317
424
624
72470
4031
0Lä
nsi-P
ohja
Cen
tral H
ospi
tal
7510
578
102
114
109
8112
712
214
615
615
815
316
71693
4031
1La
ppi C
entra
l Hos
pita
l55
8886
108
122
147
140
204
225
236
172
157
179
306
2225
4041
1K
emijä
rvi R
egio
nal H
ospi
tal
177
2419
5978
7329
1-
--
--
307
9029
8H
ospi
tal L
appo
nia
--
--
--
--
-32
135
9918
218
5633
4030
8Å
land
Cen
tral H
ospi
tal
--
1330
3840
3144
4443
3143
6543
465
4040
1P
orvo
o H
ospi
tal
--
--
2124
3369
6077
5686
147
157
730
4040
5Lo
hja
Reg
iona
l Hos
pita
l30
4339
5046
6372
9578
103
8490
9312
61012
4041
5Lä
nsi-U
usim
aa H
ospi
tal
3831
4857
101
107
6279
8378
9510
880
119
1086
4042
6H
yvin
kää
Hos
pita
l9
1383
129
152
142
167
142
150
200
213
230
234
258
2122
4042
9Jo
rvi H
ospi
tal
9911
914
717
121
320
422
121
121
723
021
723
128
422
52789
4043
2P
eija
s H
ospi
tal
230
5777
107
108
148
160
184
179
194
174
292
366
2078
5020
2H
US
/ Tö
ölö
Hos
pita
l / O
trhop
edic
s15
614
320
419
330
523
732
234
630
837
517
180
104
773021
5020
1H
US
/ S
urgi
cal H
ospi
tal
111
145
161
206
2-
--
--
720
717
1115
1193
4370
4035
0H
US
--
--
-36
744
555
747
252
5-
--
-2366
9015
3A
uror
a H
ospi
tal
101
9013
113
813
4-
--
--
--
--
594
9015
4K
oske
la H
ospi
tal
5468
8584
99-
--
--
--
--
390
9015
5M
alm
i Hos
pita
l23
712
1929
--
--
--
--
-90
9015
6M
aria
Hos
pita
l96
129
134
137
144
--
--
--
--
-640
6060
5H
ospi
tal D
extra
Mun
kkiv
uori
5046
2833
2124
1734
3119
2328
3020
404
6060
8E
ira H
ospi
tal
106
64
4-
--
1222
3220
5615
0322
6061
1D
iaco
r Hos
pita
l-
-4
1513
1533
2530
2811
4528
30277
6061
3O
rton
Orth
opae
dic
Hos
pita
l70
885
672
258
750
955
857
857
959
557
862
176
873
862
19018
6062
6H
ospi
tal M
ehilä
inen
Hel
sink
i63
3336
2717
2448
2925
2918
3627
22434
7160
1C
entra
l Mili
tary
Hos
pita
l10
1814
717
920
2321
1923
14-
-195
TOTA
L5603
6419
7395
8296
9008
9342
10524
11154
11217
11557
12339
13081
14910
16484
147329

19
Tabl
e H
1a.
TO
TAL
HIP
PR
OST
HES
ES U
SED
IN P
RIM
AR
Y O
PER
ATI
ON
S IN
198
0 - 2
003
FEM
OR
AL
STEM
1980
1981
1982
1983
1984
1985
1986
1987
1988
1989
1990
1991
1992
1993
1994
1995
1996
1997
1998
1999
2000
2001
2002
2003
Implanted N=
Revised N=
Dead N=
at risk N=LU
BIN
US
SP
II0
00
01
39
6131
858
874
789
292
188
691
996
294
896
290
389
097
283
397
591
113
701
831
4286
8584
EX
ETE
R U
NIV
ER
SA
L0
00
00
00
01
156
134
164
205
172
208
668
781
1093
1195
1450
1597
1743
1908
1954
1342
941
020
5810
961
BIO
ME
T C
OLL
AR
LES
S0
00
00
033
225
360
295
302
433
507
545
723
778
865
856
828
749
839
835
939
1047
1115
913
7111
6555
52LU
BIN
US
IP37
762
890
085
291
493
710
4190
355
021
112
938
4652
4626
320
11
10
01
7686
1329
5361
996
MÜ
LLE
R M
ON
OLO
G22
5817
617
517
014
721
325
023
325
624
035
539
251
247
533
215
810
40
00
00
4178
387
2182
1609
AB
G H
A0
00
00
00
00
00
057
131
210
290
286
357
492
558
513
362
226
3435
1617
532
530
16E
LITE
PLU
S F
LAN
GE
D0
00
00
00
00
00
25
2421
817
233
734
434
023
823
716
414
291
2314
212
407
1695
CH
AR
NLE
Y15
022
818
917
421
516
610
611
283
129
126
155
114
178
9318
135
10
019
129
2295
452
1333
510
BIO
ME
T C
OLL
AR
ED
00
00
00
315
6479
117
112
104
101
103
175
180
217
174
175
171
158
133
4521
2625
723
716
32LO
RD
MA
DR
EP
OR
IQ4
1228
5519
029
950
036
924
016
356
6637
161
10
00
00
00
020
3778
170
255
4M
ATH
YS
RM
ISO
ELA
S0
00
947
8010
816
726
427
327
823
319
010
955
133
00
00
00
018
2942
068
772
2A
BG
II0
00
00
00
00
00
00
00
00
00
868
332
482
528
1418
1124
1383
BIO
ME
T IN
TER
LOC
00
00
00
00
09
1517
111
279
269
147
142
120
7354
2223
229
1312
130
446
736
EX
ETE
R0
5655
160
180
206
201
192
146
034
10
00
00
00
00
00
012
3124
782
116
3S
PE
CTR
ON
EF
00
00
00
00
00
00
00
00
00
011
7015
429
355
510
837
3710
39A
NA
TOM
IC M
ES
H0
00
00
01
00
3213
221
319
516
911
564
6034
1913
61
00
1054
168
170
716
PC
A S
TAN
DA
RD
00
00
08
5431
102
9016
612
219
63
126
00
00
00
00
790
200
195
395
PC
A E
-SE
RIE
S0
00
00
02
27
615
3834
157
199
147
9822
11
20
00
731
9413
150
6LI
NK
RS
14
13
32
4411
318
615
610
643
2414
40
20
00
00
00
706
244
235
227
LUB
INU
S S
P I
610
1021
4413
412
011
884
4324
520
128
1914
43
00
00
069
923
039
277
AB
G (S
)0
00
00
00
00
00
041
152
193
119
5328
3324
1410
40
671
4724
50
MC
KE
E-A
RD
EN
103
209
192
6437
60
10
30
00
00
00
00
00
00
061
586
515
14P
RO
FILE
PO
RO
US
00
00
00
00
045
5410
657
9191
5867
150
00
00
058
469
9042
5C
HR
ISTI
AN
SE
N27
213
510
237
190
41
00
00
00
00
00
00
00
00
570
239
426
0O
MN
IFIT
HA
601
7-0
00
00
00
00
00
00
00
055
149
118
111
5556
250
569
3522
512
BIR
MIN
GH
AM
00
00
00
00
00
00
00
00
00
00
029
190
338
557
22
553
BIO
ME
T H
EA
D-N
EC
00
00
00
10
215
2940
5741
4940
5942
4640
2523
2420
553
6970
414
SP
OTO
RN
O0
00
00
023
3039
3619
1911
1031
2327
91
022
5891
7452
325
7342
5V
EC
TRA
3 S
TD0
00
00
00
00
00
00
00
00
00
5510
315
410
820
440
820
412
MÜ
LLE
R S
LS, T
IT0
00
00
00
00
00
366
9051
4535
4655
345
10
043
157
121
253
PC
A M
ER
IDIA
N0
00
00
00
00
00
00
00
02
4857
4852
4869
7239
67
2136
8B
RU
NS
WIK
166
123
5315
84
01
20
10
00
00
00
00
00
00
373
9825
916
BIO
ME
T D
YS
PLA
STI
C0
00
00
00
433
3215
3131
2128
2539
2820
2310
145
1036
984
2725
8TH
OM
PS
ON
00
00
00
00
00
00
00
01
42
2351
4411
346
5133
511
202
122
BIO
M IN
TEG
RA
L LA
TER
00
00
00
00
00
00
00
00
00
04
3044
8514
430
76
429
7B
ICH
AT
00
00
00
2210
311
559
20
31
00
00
00
00
00
305
113
135
57E
UR
O (S
)0
00
00
00
00
081
112
6829
100
00
00
00
00
300
3717
192
MÜ
LLE
R S
LS, M
ON
00
00
01
00
00
00
01
14
7412
955
80
00
027
315
4121
7LO
RD
L0F
0R0
00
00
01
00
510
613
023
21
01
00
00
00
00
269
134
104
31E
LITE
PL
RO
UN
DB
AC
K0
00
00
00
00
00
00
02
248
3539
4729
2123
1926
533
4119
1C
PT
(ZIM
ME
R)
00
00
00
00
00
00
00
00
37
3634
4322
5448
247
220
225
ELI
TE P
L H
IGH
OFF
00
00
00
00
00
00
00
00
08
4740
1933
4243
232
217
213
STA
NM
OR
E M
MA
00
00
00
00
00
00
00
00
00
318
840
6587
221
512
204
CE
RA
VE
R (S
)1
419
166
1421
184
421
168
105
74
188
55
20
021
658
6692
OM
NIF
IT H
A 1
017-
00
00
00
00
00
07
1317
3081
600
00
00
00
208
7321
114
EM
ER
AU
DE
00
00
00
00
00
00
01
01
917
58
3638
4445
204
910
185
BIC
ON
TAC
T0
00
00
00
00
010
28
53
45
1112
738
3438
2119
822
716
9M
EC
RO
BLO
CK
00
00
00
00
516
2824
2334
2221
126
21
01
00
195
3143
121
AM
L0
00
00
00
00
463
450
00
017
2127
131
10
019
224
3513
3LP
P II
00
00
00
00
00
00
00
00
00
113
2340
3373
183
312
168

20
Tabl
e H
1a.
TO
TAL
HIP
PR
OST
HES
ES U
SED
IN P
RIM
AR
Y O
PER
ATI
ON
S IN
198
0 - 2
003
FEM
OR
AL
STEM
1980
1981
1982
1983
1984
1985
1986
1987
1988
1989
1990
1991
1992
1993
1994
1995
1996
1997
1998
1999
2000
2001
2002
2003
Implanted N=
Revised N=
Dead N=
at risk N=3V
-PM
B0
00
00
00
00
08
4324
5145
11
00
00
00
217
524
7774
SU
MM
IT(D
ePuy
)0
00
00
00
00
00
00
00
00
00
00
011
153
164
12
161
BU
TELL
00
00
00
058
4524
120
00
00
00
00
00
00
139
4563
31B
IOM
ET
LMT
00
00
00
00
00
27
6145
110
00
00
00
00
126
1862
46M
ÜLL
ER
STR
AIG
HT
00
00
00
00
00
00
01
10
6333
124
02
90
125
623
96LP
P0
00
00
00
00
00
00
00
025
5146
00
00
112
35
3286
LAR
AN
GE
-LE
TOU
RN
3536
2312
52
10
02
00
00
00
00
00
00
00
116
3466
16B
ICO
NTA
CT
sem
entil
lä0
00
00
00
00
015
116
54
55
1018
84
136
211
27
2580
MS
-30
(KIR
FIX
)0
00
00
00
00
00
00
00
00
00
1425
1123
3811
11
210
8C
AD
2127
503
03
10
00
00
00
00
00
00
00
00
105
2584
0V
EC
TRA
2 S
TD0
00
00
00
00
00
00
00
00
048
2722
30
010
07
1578
BIO
ME
T C
DH
00
00
00
00
00
00
00
00
02
312
2019
1628
100
50
95M
CK
EE
RIS
KA
00
09
1517
164
21
92
24
32
31
10
00
00
9121
6010
FUR
LON
G0
00
3321
127
77
00
10
00
00
00
00
00
088
1662
10B
IOM
ET
SH
P0
00
00
00
00
00
00
00
032
2715
110
20
087
118
68V
EC
TRA
3 L
ATE
R0
00
00
00
00
00
00
00
00
00
1022
2813
982
26
74LC
O0
00
00
00
00
00
00
026
3117
30
00
00
077
024
53C
F-30
00
00
00
00
00
00
019
198
013
151
00
00
7520
2035
PR
OX
ILO
C0
00
00
00
00
00
00
00
00
00
1129
294
073
103
60TI
GE
VE
CTR
A IN
OX
00
00
00
00
00
00
00
00
00
00
00
1556
710
368
C-S
TEM
00
00
00
00
00
00
00
00
00
00
00
1752
690
069
BIO
ME
T M
ALL
OR
Y/H
EA
00
00
00
00
00
00
00
00
00
14
1011
241
692
958
SH
P L
INK
00
00
00
00
00
01
2019
196
40
00
00
00
6910
2534
MÜ
LLE
R L
ATE
RA
L0
00
00
00
00
029
311
01
04
10
00
00
067
228
37A
UTO
PH
OR
00
06
617
205
55
00
00
00
00
00
00
00
6420
2321
SF
SU
PE
RFI
NIT
OR
00
00
00
00
02
2130
70
00
00
00
00
00
6012
3117
BIO
M IN
TEG
RA
L P
/R0
00
00
00
00
00
00
00
00
12
49
1611
1659
410
45C
EN
ATO
R0
00
00
00
00
00
00
542
81
20
00
00
058
618
34FR
EE
MA
N C
ALC
AR
01
00
00
011
264
20
01
11
20
00
00
00
4923
1610
S-R
OM
RE
VIS
IO0
00
00
00
00
00
00
00
00
108
96
25
646
53
38C
OR
ME
T R
ES
UR
FAC
I N0
00
00
00
00
00
00
00
00
00
00
011
3142
10
41S
KT
SU
PE
RK
ON
ITA
N0
00
00
00
00
112
156
31
00
00
00
00
038
98
21V
ER
SY
S (Z
IMM
ER
)0
00
00
00
00
00
00
00
00
00
00
22
3337
01
36S
-RO
M (S
)0
00
00
00
00
00
00
00
02
98
36
21
334
01
33B
AS
IS P
RIM
AR
Y0
00
00
00
00
00
00
00
00
00
00
00
3434
06
28V
EC
TRA
2 L
ATE
R0
00
00
00
00
00
00
00
00
011
202
00
033
03
30P
CA
TE
XTU
RE
D0
00
00
00
00
00
00
23
125
80
00
00
030
415
11A
US
TIN
-MO
OR
E0
00
00
00
00
00
00
00
08
07
22
14
226
118
7ZI
M-M
ÜLL
ZIM
TRO
N0
00
00
00
01
01
00
00
015
90
00
00
026
35
183V
-PO
RO
PO
S0
00
00
00
00
26
00
99
00
00
00
00
026
36
17M
EC
RO
N U
NI-H
IP0
00
00
00
00
00
422
00
00
00
00
00
026
34
19T0
A0R
0A0
08
28
43
00
00
00
00
00
00
00
00
00
2516
70
LIN
K S
ATU
LAP
RO
TEE
S0
00
00
01
23
11
20
02
02
13
00
10
120
17
12M
INN
EA
PO
LIS
20
31
10
34
10
21
10
00
00
00
00
00
190
172
OM
NIF
IT S
EM
EN
TOIT
AV
00
00
00
00
00
06
10
23
52
00
00
00
192
710
LIN
K R
EK
ON
STR
UK
00
00
00
00
00
00
00
00
00
23
39
11
192
413
MC
KE
E-F
AR
RA
R3
30
72
02
01
00
00
00
00
00
00
00
018
97
2W
AG
NE
R R
EV
ISIO
00
00
00
00
00
02
11
10
01
40
32
03
182
511
ELI
TE P
LUS
CD
H0
00
00
00
00
00
00
00
01
33
22
20
417
11
15C
ON
ELO
CK
RE
VIS
IO0
00
00
00
00
00
00
00
00
00
12
43
717
02
15

21
Tabl
e H
1a.
TO
TAL
HIP
PR
OST
HES
ES U
SED
IN P
RIM
AR
Y O
PER
ATI
ON
S IN
198
0 - 2
003
FEM
OR
AL
STEM
1980
1981
1982
1983
1984
1985
1986
1987
1988
1989
1990
1991
1992
1993
1994
1995
1996
1997
1998
1999
2000
2001
2002
2003
Implanted N=
Revised N=
Dead N=
at risk N=FR
EE
MA
N (D
OU
PLE
)9
22
00
00
11
00
00
00
00
00
00
00
015
67
2S
TAN
MO
RE
11
11
53
10
00
20
00
00
00
00
00
00
155
82
PC
A M
ED
IUM
STE
M0
00
00
01
00
26
11
10
10
02
00
00
015
32
10U
LRTA
LOC
K0
00
02
84
00
00
00
00
00
00
00
00
014
48
2TU
UM
OR
IPR
OTE
ES
I0
00
01
00
02
81
00
00
00
00
00
00
012
45
3W
AG
NE
R7
32
00
00
00
00
00
00
00
00
00
00
012
97
0D
IME
NS
ION
00
00
00
00
00
16
04
01
00
00
00
00
123
45
TIG
E V
EC
TRA
INO
X L
AT
00
00
00
00
00
00
00
00
00
00
00
011
110
011
CO
RA
IL0
00
00
00
00
00
00
00
92
00
00
00
011
64
1H
AR
RIS
-PR
EC
OA
T0
00
00
00
00
00
00
08
20
00
00
00
010
14
5M
ATH
YS
CC
M S
TD0
00
00
00
00
00
00
00
00
00
00
00
1010
00
10B
IOM
ET
CU
STO
M C
DH
00
00
00
00
00
00
00
01
12
20
02
10
92
07
TITA
NIU
M1
10
50
01
00
00
00
00
00
00
00
00
08
24
2C
HA
RN
LEY
KE
RB
OU
L0
00
00
00
00
00
01
00
60
00
00
00
07
13
3B
IAS
RE
VIS
IO0
11
00
00
01
11
20
00
00
00
00
00
07
43
0ZM
R (Z
IMM
ER
)0
00
00
00
00
00
00
00
00
00
00
05
27
00
7V
IRTE
C L
ATE
R0
00
00
00
00
00
00
00
00
00
00
06
06
00
6A
BG
HA
RE
VIS
IO0
00
00
00
00
00
00
00
01
00
10
03
16
11
4L0
S0B
00
22
10
00
00
00
00
00
00
00
00
00
05
23
0S
T G
EO
RG
E2
02
01
00
00
00
00
00
00
00
00
00
05
23
0LU
BIN
US
DE
MI
00
00
10
00
00
00
00
00
10
00
11
00
42
30
ELI
TE P
LUS
RE
VIS
IO0
00
00
00
00
00
00
00
00
11
02
00
04
02
2IC
LH0
11
20
00
00
00
00
00
00
00
00
00
04
40
0E
RIK
OIS
PR
OTE
ES
I0
00
00
02
20
00
00
00
00
00
00
00
04
13
0O
MN
IFIT
RE
STO
RA
TIO
00
00
00
00
00
00
00
00
00
00
03
01
40
04
PR
OTE
ES
I ETM
10
00
20
00
00
00
00
00
00
00
00
00
30
21
VIR
TEC
STD
00
00
00
00
00
00
00
00
00
00
00
30
31
02
PC
A L
ON
G S
TEM
00
00
00
00
00
03
00
00
00
00
00
00
30
12
PC
A R
EV
ISIO
00
00
00
10
00
10
00
00
10
00
00
00
32
10
HO
WM
RE
STO
RA
TIO
N
00
00
00
00
00
00
00
00
00
00
00
30
31
02
MA
THY
S R
M H
A0
00
00
00
10
01
10
00
00
00
00
00
03
12
0B
ES
SE
R1
00
10
00
00
00
00
00
00
00
00
00
02
01
1G
ILIB
ER
TY0
10
00
10
00
00
00
00
00
00
00
00
02
01
1O
MN
IFIT
LO
NG
00
00
00
00
00
00
00
00
11
00
00
00
21
01
GU
EP
AR
01
00
00
00
00
00
00
00
00
00
00
00
11
00
CE
RA
VE
R R
EV
ISIO
00
00
00
00
00
01
00
00
00
00
00
00
10
01
WID
AL
01
00
00
00
00
00
00
00
00
00
00
00
10
10
PC
A H
NR
-PC
00
00
00
00
00
00
00
00
00
00
00
10
10
01
BIO
ME
T TA
PE
RLO
C0
00
00
00
00
00
00
00
01
00
00
00
01
00
1B
IOM
ET
RE
AC
H/M
ALL
O0
00
00
00
00
00
00
00
00
00
00
01
01
00
1O
MN
IFIT
HA
605
1-0
00
00
00
00
00
00
00
00
00
00
00
11
00
1B
ICO
NTA
CT
SD
00
00
00
00
00
00
00
00
00
00
00
10
10
01
RE
EF
(DeP
uy)
00
00
00
00
00
00
00
00
00
00
00
01
10
01
FRE
EM
AN
00
00
00
00
00
00
00
00
00
00
00
10
10
10

22
Tabl
e H
1b.
TO
TAL
HIP
PR
OST
HES
ES U
SED
IN P
RIM
AR
Y O
PER
ATI
ON
S, O
VER
100
SLI
DIN
G P
AIR
S U
SED
IN 1
996-
2003
FEM
OR
AL
STEM
AC
ETA
BU
LUM
STE
M19
9619
9719
9819
9920
0020
0120
0220
03
Implanted N=
Revised N=
Dead N=
at risk N=
EX
ETE
R U
NIV
ER
SA
LC
ON
TEM
PO
RA
RY
1110
221
646
352
478
999
111
9042
8665
282
3939
EX
ETE
R U
NIV
ER
SA
LE
XE
TER
ALL
PO
LY43
558
351
452
953
746
845
938
939
1410
755
032
57LU
BIN
US
SP
IILU
BIN
US
EC
CE
NTR
IC53
751
843
738
332
021
618
212
427
1776
484
2157
LUB
INU
S S
P II
LUB
INU
S S
TD33
834
833
734
934
927
432
727
926
0162
358
2181
AB
G H
AA
BG
II52
317
465
519
475
335
176
623
4541
140
2164
BIO
ME
T C
OLL
AR
LES
SB
IOM
ET
VIS
ION
00
124
313
370
415
411
446
2079
3249
1998
BIO
ME
T C
OLL
AR
LES
SB
IOM
ET
PFU
557
504
338
152
166
9768
7319
5563
101
1791
AB
G II
AB
G II
00
08
6832
246
947
913
4611
2013
15S
PE
CTR
ON
EF
RE
FLE
CTI
ON
ALL
PO
LY0
00
1160
125
256
452
904
734
863
ELI
TE P
LUS
FLA
NG
ED
ELI
TE P
LUS
LP
W16
515
312
911
310
067
8432
843
6412
965
0E
XE
TER
UN
IVE
RS
AL
AB
G II
352
4051
126
145
138
124
679
1245
622
BIR
MIN
GH
AM
BIR
MIN
GH
AM
00
00
029
190
338
557
22
553
LUB
INU
S S
P II
LUB
INU
S F
C0
00
052
134
185
163
534
724
503
ELI
TE P
LUS
FLA
NG
ED
ELI
TE P
LUS
OG
EE
2025
7565
100
9054
5548
414
5042
0E
LITE
PLU
S F
LAN
GE
DP
RO
FILE
DU
RA
LOC
8713
310
649
342
00
411
3265
314
PC
A M
ER
IDIA
NP
CA
VIT
ALO
CK
041
5747
5148
6972
385
720
358
EX
ETE
R U
NIV
ER
SA
LH
OW
ME
D D
OU
BLE
CU
P3
3757
3450
8178
4438
423
111
250
EX
ETE
R U
NIV
ER
SA
LTR
ILO
GY
00
1115
012
355
2810
377
1426
337
EX
ETE
R U
NIV
ER
SA
LH
GP
II10
114
612
20
00
00
369
2283
264
BIO
ME
T C
OLL
AR
ED
BIO
ME
T V
ISIO
N0
04
1996
9911
630
364
418
342
EX
ETE
R U
NIV
ER
SA
LB
IOM
EX
4955
7454
7726
1210
357
746
304
BIO
ME
T C
OLL
AR
LES
SB
IOM
ET
MA
LLO
RY
121
9980
468
00
035
421
5028
3B
IOM
ET
INTE
RLO
CB
IOM
ET
MÜ
LLE
R94
9156
4720
1916
735
020
7925
1B
IOM
ET
CO
LLA
RLE
SS
BIO
ME
X35
7975
4840
2019
932
511
1529
9V
EC
TRA
3 S
TDM
ATH
YS
RM
HA
00
034
7210
889
1531
81
1530
2E
XE
TER
UN
IVE
RS
AL
PR
OFI
LE D
UR
ALO
C84
2143
5040
2226
1329
914
3624
9B
IOM
ET
CO
LLA
RE
DB
IOM
ET
PFU
5674
6651
2323
11
295
1315
267
OM
NIF
IT H
A 6
017-
OM
NIF
IT S
EC
UR
-FIT
44
108
106
3929
00
290
911
270
BIO
ME
T C
OLL
AR
LES
SS
TAN
MO
RE
00
02
2546
8912
028
21
427
7B
IOM
ET
CO
LLA
RE
DTR
ILO
GY
1582
7173
213
01
266
928
229
SP
OTO
RN
OM
ETA
SU
L P
RE
SS
-FIT
00
00
2258
9073
243
62
235
BIO
ME
T C
OLL
AR
LES
SP
CA
VIT
ALO
CK
149
103
549
211
023
814
2120
3B
IOM
ET
CO
LLA
RLE
SS
HE
DR
OC
EL
00
842
5773
4410
234
113
220
AB
G H
AA
BG
HA
212
50
00
00
021
723
3416
0B
IOM
ET
CO
LLA
RLE
SS
BIO
ME
T E
XC
EE
D H
AP
00
00
04
9710
020
12
119
8O
MN
IFIT
HA
601
7-O
MN
IFIT
PS
L H
A51
142
80
00
00
201
248
169
EX
ETE
R U
NIV
ER
SA
LP
CA
VIT
ALO
CK
00
520
4568
3227
197
316
178
LUB
INU
S S
P II
BIO
ME
T P
FU21
2133
3148
2812
119
55
1917
1B
IOM
ET
CO
LLA
RLE
SS
BIO
ME
T O
NE
-PIE
CE
CU
P0
00
00
011
181
192
00
192
EX
ETE
R U
NIV
ER
SA
LP
CA
CE
NTR
AX
00
2450
3955
221
191
878
105
MÜ
LLE
R S
LS, M
ON
MA
THY
S R
M H
A44
8744
80
00
018
38
2914
6C
PT
(ZIM
ME
R)
TRIL
OG
Y0
00
1838
2254
4818
01
1016
9E
XE
TER
UN
IVE
RS
AL
ELI
TE P
LUS
OG
EE
2644
5433
73
90
176
1034
132
BIO
ME
T C
OLL
AR
LES
STR
ILO
GY
04
524
5233
2013
151
74
140

23
Tabl
e H
1b.
TO
TAL
HIP
PR
OST
HES
ES U
SED
IN P
RIM
AR
Y O
PER
ATI
ON
S, O
VER
100
SLI
DIN
G P
AIR
S U
SED
IN 1
996-
2003
FEM
OR
AL
STEM
AC
ETA
BU
LUM
STE
M19
9619
9719
9819
9920
0020
0120
0220
03
Implanted N=
Revised N=
Dead N=
at risk N=
BIO
ME
T C
OLL
AR
LES
SB
IOM
ET
MÜ
LLE
R6
512
1347
2221
1514
13
613
2B
ICO
NTA
CT
BIC
ON
TAC
T4
1111
638
3436
014
04
113
5LU
BIN
US
SP
IILU
BIN
US
VA
RIO
-CU
P6
57
1934
1917
3213
910
3891
MÜ
LLE
R M
ON
OLO
GM
ÜLL
ER
STD
125
54
00
00
013
45
4188
SP
EC
TRO
N E
FR
EFL
EC
TIO
N IN
TER
FIT
00
00
628
2767
128
03
125
EX
ETE
R U
NIV
ER
SA
LB
IOM
ET
VIS
ION
00
28
2722
3433
126
06
120
EX
ETE
R U
NIV
ER
SA
LO
MN
IFIT
TR
IDE
NT
00
00
00
6757
124
12
121
BIO
ME
T C
OLL
AR
LES
SB
IOM
ET
AP
OLY
(S)
00
05
433
3643
121
20
119
ELI
TE P
L H
IGH
OFF
ELI
TE P
LUS
OG
EE
02
1710
1122
2435
121
04
117
MÜ
LLE
R S
LS, T
ITM
ÜLL
ER
STD
2236
5210
01
00
121
425
92B
IOM
ET
CO
LLA
RE
DB
IOM
ET
SH
P1
2319
2122
169
912
04
411
2S
TAN
MO
RE
MM
AB
IOM
ET
AP
OLY
(S)
00
00
014
3168
113
35
105
MÜ
LLE
R S
TRA
IGH
TM
ÜLL
ER
STD
6333
124
00
00
112
519
88E
LITE
PL
RO
UN
DB
AC
KE
LITE
PLU
S L
PW
2217
1925
57
56
106
1719
70B
IOM
ET
CO
LLA
RLE
SS
PR
OFI
LE D
UR
ALO
C0
109
923
1833
010
27
194
EM
ER
AU
DE
WE
BE
R M
ETA
SU
L9
175
89
1217
2310
07
291
LPP
IILP
P M
YLL
ER
TYY
PP
I0
01
1117
127
5210
02
197

24
Tabl
e H
2. H
IP P
RO
STH
ESES
, OVE
R 1
00 IM
PLA
NTS
REM
OVE
D IN
198
0 - 2
003
FEM
OR
AL
STEM
1980
1981
1982
1983
1984
1985
1986
1987
1988
1989
1990
1991
1992
1993
1994
1995
1996
1997
1998
1999
2000
2001
2002
2003
Removed N= LU
BIN
US
IP5
521
3222
4271
8299
115
108
119
144
112
126
7579
6373
6560
5031
2016
19TH
OM
PS
ON
1518
89
1222
2522
1748
3860
7164
8373
4574
6354
5242
4441
1000
LUB
INU
S S
P II
00
00
00
00
22
917
2843
5459
6871
9882
7584
8077
849
CH
RIS
TIA
NS
EN
2539
4653
5563
7237
3258
3522
3422
1717
208
83
101
11
679
CH
AR
NLE
Y11
84
1025
2521
2227
3027
3946
4951
3630
3932
3028
2828
1866
4B
RU
NS
WIK
1717
2626
2929
3138
2638
4048
4232
2120
1812
410
97
43
547
MA
THY
S R
M IS
OE
LAS
00
00
20
69
1114
1819
1129
2250
5859
5046
3239
3424
533
MÜ
LLE
R M
ON
OLO
G2
05
410
1111
713
1320
1723
3425
4133
2929
2723
3625
1945
7LO
RD
MA
DR
EP
OR
IQ0
00
10
67
1118
3419
2142
3944
2213
1416
2014
115
736
4E
XE
TER
UN
IVE
RS
AL
00
00
00
00
00
21
410
68
1322
2236
4856
4674
348
AU
STI
N-M
OO
RE
31
34
54
127
79
116
1721
1918
1418
2727
2026
2011
310
LUB
INU
S S
P I
00
00
10
13
67
115
149
1233
3533
2320
2224
1924
302
BIO
ME
T C
OLL
AR
LES
S0
00
00
00
25
69
1123
2220
2418
1424
2925
1220
1628
0LI
NK
RS
00
01
00
01
09
715
2623
2122
3023
1521
915
1817
273
EX
ETE
R0
02
15
812
816
1216
2520
2312
1315
166
1712
1010
526
4M
CK
EE
-FA
RR
AR
108
915
1010
1315
1211
1514
1517
1210
96
51
22
14
226
ELI
TE P
LUS
FLA
NG
ED
00
00
00
00
00
00
00
28
1418
3127
2834
2425
211
MC
KE
E-A
RD
EN
47
54
96
75
813
1818
1216
1113
810
113
75
31
204
LOR
D L
.F.R
.0
00
00
00
00
02
319
166
1517
137
511
53
312
5B
ICH
AT
00
00
00
02
34
613
175
127
116
106
55
44
120
BIO
ME
T IN
TER
LOC
00
00
00
00
00
00
03
513
1515
710
1218
1110
119
BIO
ME
T C
OLL
AR
ED
00
00
00
00
01
33
04
33
711
1620
1010
176
114

25

26

27
Figure H5. Primary and revision Total Hip Arthroplasty operations in 1980 - 2003
1211
1133
216
195
165
1115
1129
1071
1033
946 12
00
1226
143
1153
253
313 469
482
467
508
572 72
6
903
913
1556
5571
5230
1185
3487
2074
1814
1670 19
00
2567 28
11 2938
2859 32
07
3700 40
34
4879
4834
4834
4695
4347
4372
6257
6799
0
1000
2000
3000
4000
5000
6000
7000
8000
900019
80
1981
1982
1983
1984
1985
1986
1987
1988
1989
1990
1991
1992
1993
1994
1995
1996
1997
1998
1999
2000
2001
2002
2003
Years
Num
ber
of o
pera
tions
PrimaryRevision
Figure H6. Primary indications for Total Hip Arthroplasties in 1980 - 2003
0 %
10 %
20 %
30 %
40 %
50 %
60 %
70 %
80 %
90 %
100 %
1980
1981
1982
1983
1984
1985
1986
1987
1988
1989
1990
1991
1992
1993
1994
1995
1996
1997
1998
1999
2000
2001
2002
2003
Years
% o
f ind
icat
ions
Congenital luxation of the hip
Other illnesses
Other arthritides
Rheumatoid arthritis
Secondary arthrosis
Primary arthrosis

28
Figure H7a. Fixation technique in primary Total Hip Arthroplasties in 1993 - 2003 FEMORAL COMPONENT
Cemented
Cementless
0 %
10 %
20 %
30 %
40 %
50 %
60 %
70 %
80 %
90 %
100 %
1993 1994 1995 1996 1997 1998 1999 2000 2001 2002 2003Years
% o
f prim
ary
oper
atio
ns
Figure H7b. Fixation technique in primary Total Hip Arthroplasties in 1993 - 2003 ACETABULAR COMPONENT
Cemented
Cementless
0 %
10 %
20 %
30 %
40 %
50 %
60 %
70 %
80 %
90 %
100 %
1993 1994 1995 1996 1997 1998 1999 2000 2001 2002 2003Years
% o
f prim
ary
oper
atio
ns

29
Figure H8a. Age distribution of Total Hip Arthroplasty operations in 1999 - 2003, FEMALE
0
5
10
15
20
25
30
35
40
45
50
0-29 30-39 40-49 50-59 60-69 70-79 80-Age
% o
f prim
ary
oper
atio
ns
1999 2000 2001 2002 2003
Figure H8b. Age distribution of Total Hip Arthroplasty operations in 1999 - 2003, MALE
0
5
10
15
20
25
30
35
40
45
50
0-29 30-39 40-49 50-59 60-69 70-79 80-Age
% o
f prim
ary
oper
atio
ns
1999 2000 2001 2002 2003

30

31
Figure H10. Number of hospitals performing Total Hip Arthroplasties in 1980-2003
3936
4238 38 39 40
43
48 48
5760
6467
64 65 64 64 6569 68 69 6867
52
43
48
2622
283034 33 35 32
36 37
46 46 4852
5553 52 51
48 49 49
0
10
20
30
40
50
60
70
8019
80
1981
1982
1983
1984
1985
1986
1987
1988
1989
1990
1991
1992
1993
1994
1995
1996
1997
1998
1999
2000
2001
2002
2003
Years
Num
ber o
f hos
pita
ls
Primary Revision
Figure H11. Indications for Total Hip Arthroplasty revisions in 1993 - 2003
0 %
10 %
20 %
30 %
40 %
50 %
60 %
70 %
80 %
90 %
100 %
1993 1994 1995 1996 1997 1998 1999 2000 2001 2002 2003Years
% o
f rev
isio
n in
dica
tions
Fracture of prosth. + other reason
Fracture of bone
Malposition of prosthesis
Luxation
Infection
Loosening of acetabular component
Loosening of femoral component
Loosening of both component

32
Figure H12a. The most common types of removed femoral components in Total Hip Arthroplasty operations in 1996 - 2003
0 %
10 %
20 %
30 %
40 %
50 %
60 %
70 %
80 %
90 %
100 %
1996 1997 1998 1999 2000 2001 2002 2003Years
% o
f pro
sthe
ses
OTHER FEMOLAR COMPONETS
AUSTIN-MOORE
LUBINUS SP I
ELITE PLUS FLANGED
MÜLLER MONOLOG
CHARNLEY
EXETER UNIVERSAL
MATHYS RM ISOELAS
THOMPSON
LUBINUS IP
LUBINUS SP II
Figure H12b. The most common types of removed acetabular components in Total Hip Arthroplasty operations in 1996 - 2003
0 %
10 %
20 %
30 %
40 %
50 %
60 %
70 %
80 %
90 %
100 %
1996 1997 1998 1999 2000 2001 2002 2003Years
% o
f pro
sthe
ses
OTHER ACETABULAR COMPONETS
PCA PEGGED
EXETER ALL POLY
BIOMET ROMANUS
MATHYS RM
HGP II
CHARNLEY LPW
BIOMET TTAP
LORD
BIOMET PFU
LUBINUS STD

33
Figure H13. Previous operation year in Total Hip Arthroplasty revisions in 2003
0,440,70
0,17 0,35
1,83
2,71
3,40
2,01
5,76
6,72
7,85
6,546,02
4,80
3,58
5,24
4,364,71
5,67
10,30
8,73
0,79
2,97
4,36
0
2
4
6
8
10
1219
80
1981
1982
1983
1984
1985
1986
1987
1988
1989
1990
1991
1992
1993
1994
1995
1996
1997
1998
1999
2000
2001
2002
2003
Operation year
% o
f rev
isio
ns (N
=114
6;-8
0-03
)

34
Figure H14a . The most common types of femoral componets used in Total Hip Arthroplasty revisions in 1996 - 2003
0 %
10 %
20 %
30 %
40 %
50 %
60 %
70 %
80 %
90 %
100 %
1996 1997 1998 1999 2000 2001 2002 2003Years
% o
f pro
sthe
ses
OTHER FEMORAL COMPONETSCONELOCK REVISIOBIOMET HEAD-NECWAGNER REVISIOABG HA REVISIOLINK REKONSTRUKBIOMET MALLORY/HEADBIOMET COLLARLESSBIOM INTEGRAL P/RLUBINUS SP IIEXETER UNIVERSALBIOMET COLLARED
Figure H14b. The most common types of acetabular componets used in Total Hip Arthroplasty revisions in 1996 - 2003
0 %
10 %
20 %
30 %
40 %
50 %
60 %
70 %
80 %
90 %
100 %
1996 1997 1998 1999 2000 2001 2002 2003Years
% o
f pro
sthe
ses
OTHER ACETABULAR COMPONETSPCA VITALOCKBIOMET SHPHGP IIELITE PLUS LPWTRILOGYABG IILUBINUS STDEXETER ALL POLYCONTEMPORARYLUBINUS ECCENTRICBIOMET PFUBIOMET VISION

35
Figure H15. The most commonly used cemented hip prostheses in primary arthrosis in 1996-2003, 90-100% scale
90 %
91 %
92 %
93 %
94 %
95 %
96 %
97 %
98 %
99 %
100 %
0 1 2 3 4 5 6 7 8 9 10Years
Surv
ival
%
96-03, N=12984
CI_MAX
CI_MIN
EXETER UNIVERSAL + EXETER CONTENPORARYEXETER UNIVERSAL + EXETER ALL POLYLUBINUS SP II + LUBINUS ECCENTRIC
LUBINUS SP II + LUBINUS STDSPECTRON EF + RFLECTION ALL POLYELITE PLUS FLANGED + ELITE PLUS LPW
Figure H16. The most commonly used cementless hip prostheses in primary arthrosis in 1996-2003, 90-100% scale
90 %
91 %
92 %
93 %
94 %
95 %
96 %
97 %
98 %
99 %
100 %
0 1 2 3 4 5 6 7 8 9 10Years
Surv
ival
%
96-03, N=6206
CI_MAX
CI_MIN
ABG HA + ABG IIBIOMET COLLARLESS + BIOMET VISIONBIOMET COLLARLESS + BIOMET PFUABG II + ABG II

36
Figure H17. The most commonly used cemented hip prostheses in rheumatoid arthritis in 1996-2003, 90-100% scale
90 %
91 %
92 %
93 %
94 %
95 %
96 %
97 %
98 %
99 %
100 %
0 1 2 3 4 5 6 7 8 9 10Years
Surv
ival
%
96-03, N=834
CI_MAX
CI_MIN
EXETER UNIVERSAL + EXETER CONTEMPORARYEXETER UNIVERSAL + EXETER ALL POLYLUBINUS SP II + LUBINUS ECCENTRICLUBINUS SP II + LUBINUS STD
Figure H18. The most commonly used cementless hip prostheses in rheumatoid arthritis in 1996-2003, 90-100% scale
90 %
91 %
92 %
93 %
94 %
95 %
96 %
97 %
98 %
99 %
100 %
0 1 2 3 4 5 6 7 8 9 10Years
Surv
ival
%
96-03, N=380
CI_MAX
CI_MIN
ABG HA + ABG IIBIOMET COLLARLESS + BIOMET PFUBIOMET COLLARLESS + BIOMET VISIONABG II + ABG II

37
Figure H19. The most commonly used cemented hip prostheses in first revision in 1996-2003, 90-100% scale
90 %
91 %
92 %
93 %
94 %
95 %
96 %
97 %
98 %
99 %
100 %
0 1 2 3 4 5 6 7 8 9 10Years
Surv
ival
% 96-03, N=609
CI_MAX
CI_MIN
LUBINUS SP II + LUBINUS ECCENTRICEXETER UNIVERSAL + EXETER ALL POLYLUBINUS SP II + LUBINUS STDEXETER UNIVERSAL + EXETER CONTEMPORARY
Figure H20. The most commonly used cementless hip prostheses in first revision in 1996-2003, 90-100% scale
90 %
91 %
92 %
93 %
94 %
95 %
96 %
97 %
98 %
99 %
100 %
0 1 2 3 4 5 6 7 8 9 10Years
Surv
ival
%
96-03, N=434
CI_MAX
CI_MIN
BIOMET INTEGRAL P/R + BIOMET VISIONBIOMET COLLARED + BIOMET PFUBIOMET COLLARED + BIOMET VISION

38
Figure H21a. ABG II + ABG II cup hip prosthesis in primary arthrosisin 1999-2003, 90-100% scale
90 %
91 %
92 %
93 %
94 %
95 %
96 %
97 %
98 %
99 %
100 %
0 1 2 3 4 5 6 7 8 9 10Years
Surv
ival
%
99 - 03, N=1092
CI_MAX
CI_MIN
Figure H21c. ABG II + ABG II cup hip prosthesis, annual use in primary arthrosis in 1999 - 2003
0
100
200
300
400
500
1999 2000 2001 2002 2003Years
Num
ber o
f ope
ratio
ns

39
Figure H21d. ABG II + ABG II cup hip prosthesis, age and gender, all indicationsin 1999-2003
0
100
200
300
0-29 30-39 40-49 50-59 60-69 70-79 80-Age
Num
ber o
f ope
ratio
ns
MALEFEMALE
Figure H21e. ABG II + ABG II cup hip prosthesis, indications for operations in 1999 - 2003
0
100
200
300
400
500
600
1999 2000 2001 2002 2003Years
Num
ber o
f ope
ratio
ns
Other revision
Girdlestone
Change of prosthesis
Congenital luxation of the hip
Other illness
Other arthritides
Rheumatoid arthritis
Secondary arthrosis
Primary arthrosis

40
Figure H21f. ABG II + ABG II cup hip prosthesis in 1999 - 2003, indications for first revision
0
5
10
15
20
25
30
1999 2000 2001 2002 2003Years
Num
ber o
f ope
ratio
ns
Fracture of prosth. + other reason
Fracture of bone
Malposition of prosthesis
Luxation
Infection
Loosening of acetabular component
Loosening of femoral component
Loosening of both components
Figure H21g. ABG II + ABG II cup hip prosthesis, survival of annually installed prostheses at the end of 2003
0 %
10 %
20 %
30 %
40 %
50 %
60 %
70 %
80 %
90 %
100 %
1999 2000 2001 2002 2003Years
In follow-up, N = 1315
Dead, N = 20
Revised, N = 11

41

42
Figure H22a. EXETER UNIVERSAL + ABG II cup hip prosthesis in primary arthrosis in 1996-2003, 90-100% scale
90 %
91 %
92 %
93 %
94 %
95 %
96 %
97 %
98 %
99 %
100 %
0 1 2 3 4 5 6 7 8 9 10Years
Surv
ival
%
96-03, N=612
CI_MAX
CI_MIN
Figure H22c. EXETER UNIVERSAL + ABG II cup hip prosthesis, annual use in primary arthrosis in 1996 - 2003
0
20
40
60
80
100
120
140
160
180
200
1996 1997 1998 1999 2000 2001 2002 2003Years
Num
ber o
f ope
ratio
ns

43
Figure H22d. EXETER UNIVERSAL + ABG II cup hip prosthesis, age and gender, all indications in 1996-2003
0
20
40
60
80
100
120
140
160
180
200
220
0-29 30-39 40-49 50-59 60-69 70-79 80-Age
Num
ber o
f ope
ratio
ns
MALEFEMALE
Figure H22e. EXETER UNIVERSAL + ABG II cup hip prosthesis, indications for operations in 1996- 2003
0
20
40
60
80
100
120
140
160
180
200
1996 1997 1998 1999 2000 2001 2002 2003Years
Num
ber o
f ope
ratio
ns
Other revision
Girdlestone
Change of prosthesis
Congenital luxation of the hip
Other illness
Other arthritides
Rheumatoid arthritis
Secondary arthrosis
Primary arthrosis

44
Figure H22f. EXETER UNIVERSAL + ABG II cup hip prosthesis, indications for first revision in 1996 - 2003
0
2
4
6
8
10
12
14
16
18
20
1996 1997 1998 1999 2000 2001Years
Num
ber o
f ope
ratio
ns Fracture of prosth. + other reason
Fracture of bone
Malposition of prosthesis
Luxation
Infection
Loosening of acetabular component
Loosening of femoral component
Loosening of both components
Figure H22g. EXETER UNIVERSAL + ABG II cup hip prosthesis, survival of annually installed prostheses at the end of 2003
0 %
10 %
20 %
30 %
40 %
50 %
60 %
70 %
80 %
90 %
100 %
1996 1997 1998 1999 2000 2001 2002 2003Years
In follow-up, N = 622
Dead, N = 45
Revised, N = 12

45

46
Figure H23a. BIOMET COLLARLESS + BIOMET VISION cup hip prosthesis in primary arthrosis in 1998-2003, 90-100% scale
90 %
91 %
92 %
93 %
94 %
95 %
96 %
97 %
98 %
99 %
100 %
0 1 2 3 4 5 6 7 8 9 10Years
Surv
ival
%
98 - 03, N=1624
CI_MAX
CI_MIN
Figure H23c. BIOMET COLLARLESS + BIOMET VISION cup hip prosthesis, annual use in primary arthrosis in 1998 - 2003
0
100
200
300
400
500
1998 1999 2000 2001 2002 2003Years
Num
ber o
f ope
ratio
ns

47
Figure H23d. BIOMET COLLARLESS + BIOMET VISION cup hip prosthesis, age and gender, all indications in 1998-2003
0
100
200
300
400
500
0-29 30-39 40-49 50-59 60-69 70-79 80-Age
Num
ber o
f ope
ratio
ns
MALEFEMALE
Figure H23e. BIOMET COLLARLESS + BIOMET VISION cup hip prosthesis, indications for operations in 1998 - 2003
0
100
200
300
400
500
600
1998 1999 2000 2001 2002 2003Years
Num
ber o
f ope
ratio
ns
Other revision
Girdlestone
Change of prosthesis
Congenital luxation of the hip
Other illness
Other arthritides
Rheumatoid arthritis
Secondary arthrosis
Primary arthrosis

48
Figure H23f. BIOMET COLLARLESS + BIOMET VISION cup hip prosthesis in 1998 - 2003, indications for first revision
0
2
4
6
8
10
12
14
16
18
20
1998 1999 2000 2001 2002 2003Years
Num
ber o
f ope
ratio
ns Fracture of prosth. + other reasonFracture of boneMalposition of prosthesisLuxationInfectionLoosening of acetabular componentLoosening of femoral componentLoosening of both components
Figure H23g. BIOMET COLLARLESS + BIOMET VISION cup hip prosthesis, survival of annually installed prostheses at the end of 2003
0 %
10 %
20 %
30 %
40 %
50 %
60 %
70 %
80 %
90 %
100 %
1998 1999 2000 2001 2002 2003Years
In follow-up, N = 1998
Dead, N =49
Revised, N = 32

49

50
Figure H24a. EXETER UNIVERSAL + EXETER All Poly cup hip prosthesis in primary arthrosis in 1996-2003, 90-100% scale
90 %
91 %
92 %
93 %
94 %
95 %
96 %
97 %
98 %
99 %
100 %
0 1 2 3 4 5 6 7 8 9 10Years
Surv
ival
%
96 - 03, N=3423
CI_MAX
CI_MIN
Figure H24c. EXETER UNIVERSAL + EXETER All Poly cup hip prosthesis, annual use in primary arthrosis in 1996 - 2003
0
100
200
300
400
500
1996 1997 1998 1999 2000 2001 2002 2003Years
Num
ber o
f ope
ratio
ns

51
Figure H24d. EXETER UNIVERSAL + EXETER All Poly cup hip prosthesis, age and gender, all indications in 1996-2003
0
100
200
300
400
500
600
700
800
900
1000
1100
1200
1300
1400
1500
1600
0-29 30-39 40-49 50-59 60-69 70-79 80-Age
Num
ber o
f ope
ratio
ns
MALEFEMALE
Figure H24e. EXETER UNIVERSAL + EXETER All Poly cup hip prosthesis, indications for operations in 1996 - 2003
0
100
200
300
400
500
600
700
1996 1997 1998 1999 2000 2001 2002 2003Years
Num
ber o
f ope
ratio
ns
Other revision
Girdlestone
Change of prosthesis
Congenital luxation of the hip
Other illness
Other arthritides
Rheumatoid arthritis
Secondary arthrosis
Primary arthrosis

52
Figure H24f. EXETER UNIVERSAL + EXETER All Poly cup hip prosthesis in 1996 - 2003, indications for first revision
0
5
10
15
20
25
30
35
40
45
50
1996 1997 1998 1999 2000 2001 2002 2003Years
Num
ber o
f ope
ratio
ns Fracture of prosth. + other reason
Fracture of bone
Malposition of prosthesis
Luxation
Infection
Loosening of acetabular component
Loosening of femoral component
Loosening of both components
Figure H24g. EXETER UNIVERSAL + EXETER All Poly cup hip prosthesis, survival of annually installed prostheses at the end of 2003
0 %
10 %
20 %
30 %
40 %
50 %
60 %
70 %
80 %
90 %
100 %
1996 1997 1998 1999 2000 2001Years
In follow-up, N = 3257
Dead, N = 550
Revised, N = 107

53

54
Figure H25a. EXETER UNIVERSAL + CONTEMPORARY cup hip prosthesis in primary arthrosis in 1996-2003, 90-100% scale
90 %
91 %
92 %
93 %
94 %
95 %
96 %
97 %
98 %
99 %
100 %
0 1 2 3 4 5 6 7 8 9 10Years
Surv
ival
%
96 - 03, N=3618
CI_MAX
CI_MIN
Figure H25c. EXETER UNIVERSAL + CONTEMPORARY cup hip prosthesis, annual use in primary arthrosis in 1996 - 2003
0
100
200
300
400
500
600
700
800
900
1000
1100
1200
1996 1997 1998 1999 2000 2001 2002 2003Years
Num
ber o
f ope
ratio
ns

55
Figure H25d. EXETER UNIVERSAL + CONTEMPORARY cup hip prosthesis, age and gender, all indications in 1996-2003
0
200
400
600
800
1000
1200
1400
1600
0-29 30-39 40-49 50-59 60-69 70-79 80-Age
Num
ber o
f ope
ratio
ns
MALEFEMALE
Figure H25e. EXETER UNIVERSAL + CONTEMPORARY cup hip prosthesis, indications for operations in 1996 - 2003
0
100
200
300
400
500
600
700
800
900
1000
1100
1200
1300
1400
1996 1997 1998 1999 2000 2001 2002 2003Years
Num
ber o
f ope
ratio
ns
Other revision
Girdlestone
Change of prosthesis
Congenital luxation of the hip
Other illness
Other arthritides
Rheumatoid arthritis
Secondary arthrosis
Primary arthrosis

56
Figure H25f. EXETER UNIVERSAL + CONTEMPORARY cup hip prosthesis in 1996 - 2003, indications for first revision
0
2
4
6
8
10
12
14
16
18
20
22
24
26
28
30
1996 1997 1998 1999 2000 2001 2002 2003Years
Num
ber o
f ope
ratio
ns Fracture of prosth. + other reason
Fracture of bone
Malposition of prosthesis
Luxation
Infection
Loosening of acetabular component
Loosening of femoral component
Loosening of both components
Figure H25g. EXETER UNIVERSAL + CONTEMPORARY cup hip prosthesis, survival of annually installed prostheses at the end of 2003
0 %
10 %
20 %
30 %
40 %
50 %
60 %
70 %
80 %
90 %
100 %
1996 1997 1998 1999 2000 2001 2002 2003Years
In follow-up, N = 3939
Dead, N = 282
Revised, N = 65

57

58
Figure H26a. LUBINUS SP II + LUBINUS Std cup hip prosthesis in primary arthrosis in 1996-2003, 90-100% scale
90 %
91 %
92 %
93 %
94 %
95 %
96 %
97 %
98 %
99 %
100 %
0 1 2 3 4 5 6 7 8 9 10Years
Surv
ival
%
96 - 03, N=2188
CI_MAX
CI_MIN
Figure H26c. LUBINUS SP II + LUBINUS Std cup hip prosthesis, annual use in primary arthrosis in 1996 - 2003
0
100
200
300
400
500
1996 1997 1998 1999 2000 2001 2002 2003Years
Num
ber o
f ope
ratio
ns
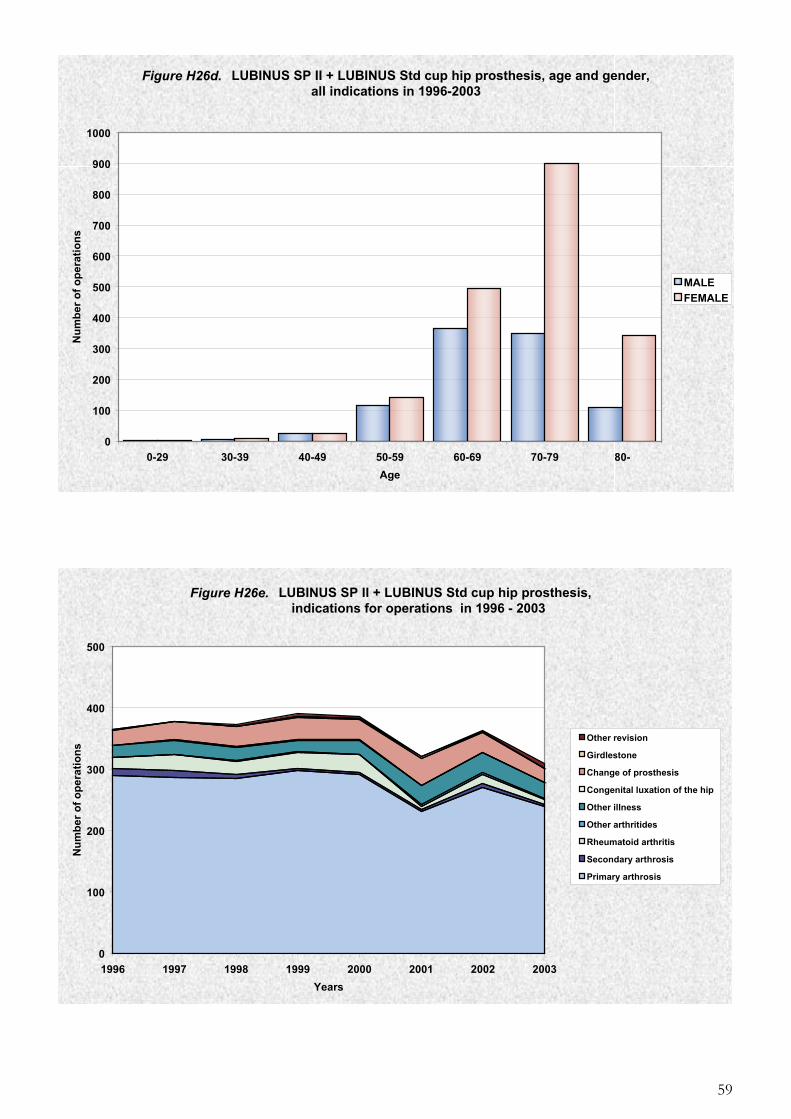
59
Figure H26d. LUBINUS SP II + LUBINUS Std cup hip prosthesis, age and gender, all indications in 1996-2003
0
100
200
300
400
500
600
700
800
900
1000
0-29 30-39 40-49 50-59 60-69 70-79 80-Age
Num
ber o
f ope
ratio
ns
MALEFEMALE
Figure H26e. LUBINUS SP II + LUBINUS Std cup hip prosthesis, indications for operations in 1996 - 2003
0
100
200
300
400
500
1996 1997 1998 1999 2000 2001 2002 2003Years
Num
ber o
f ope
ratio
ns
Other revision
Girdlestone
Change of prosthesis
Congenital luxation of the hip
Other illness
Other arthritides
Rheumatoid arthritis
Secondary arthrosis
Primary arthrosis

60
Figure H26f. LUBINUS SP II + LUBINUS Std cup hip prosthesis in 1996 - 2003, indications for first revision
0
5
10
15
20
1996 1997 1998 1999 2000 2001 2002 2003Years
Num
ber o
f ope
ratio
ns Fracture of prosth. + other reason
Fracture of bone
Malposition of prosthesis
Luxation
Infection
Loosening of acetabular component
Loosening of femoral component
Loosening of both components
Figure H26g. LUBINUS SP II + LUBINUS Std cup hip prosthesis, survival of annually installed prostheses at the end of 2003
0 %
10 %
20 %
30 %
40 %
50 %
60 %
70 %
80 %
90 %
100 %
1996 1997 1998 1999 2000 2001 2002 2003Years
In follow-up, N = 2182
Dead, N = 358
Revised, N = 61

61

62
Figure H27a. LUBINUS SP II + LUBINUS FC cup hip prosthesis in primary arthrosis in 2000-2003, 90-100% scale
90 %
91 %
92 %
93 %
94 %
95 %
96 %
97 %
98 %
99 %
100 %
0 1 2 3 4 5 6 7 8 9 10Years
Surv
ival
%
2000-2003, N=455
CI_MAX
CI_MIN
Figure H27c. LUBINUS SP II + LUBINUS FC cup hip prosthesis, annual use in primary arthrosis in 2000 - 2003
0
20
40
60
80
100
120
140
160
180
2000 2001 2002 2003Years
Num
ber o
f ope
ratio
ns

63
Figure H27d. LUBINUS SP II + LUBINUS FC cup hip prosthesis, age and gender, all indications in 2000-2003
0
50
100
150
200
0-29 30-39 40-49 50-59 60-69 70-79 80-Age
Num
ber o
f ope
ratio
ns
MALEFEMALE
Figure H27e. LUBINUS SP II + LUBINUS FC cup hip prosthesis, indications for operations in 2000 - 2003
0
100
200
300
400
500
2000 2001 2002 2003Years
Num
ber o
f ope
ratio
ns
Other revision
Girdlestone
Change of prosthesis
Congenital luxation of the hip
Other illness
Other arthritides
Rheumatoid arthritis
Secondary arthrosis
Primary arthrosis

64
Figure H27f. LUBINUS SP II + LUBINUS FC cup hip prosthesis, indications for first revision in 2000 - 2003
0
1
2
3
4
5
6
7
8
9
10
2000 2001 2002 2003Years
Num
ber o
f ope
ratio
ns
Fracture of prosth. + other reason
Fracture of bone
Malposition of prosthesis
Luxation
Infection
Loosening of acetabular component
Loosening of femoral component
Loosening of both components
Figure H27g. LUBINUS SP II + LUBINUS FC cup hip prosthesis, survival of annually installed prostheses at the end of 2003
0 %
10 %
20 %
30 %
40 %
50 %
60 %
70 %
80 %
90 %
100 %
2000 2001 2002 2003Years
In follow-up, N = 503
Dead, N = 24
Revised, N = 7

65

66
Figure H28a. SPECTRON EF + REFLECTION All poly cup hip prosthesis in primary arthrosis in 1999-2003, 90-100% scale
90 %
91 %
92 %
93 %
94 %
95 %
96 %
97 %
98 %
99 %
100 %
0 1 2 3 4 5 6 7 8 9 10Years
Surv
ival
%
99 - 03, N=791
CI_MAX
CI_MIN
Figure H28c. SPECTRON EF + REFLECTION All poly cup hip prosthesis, annual use in primary arthrosis in 1999 - 2003
0
50
100
150
200
250
300
350
400
1999 2000 2001 2002 2003Years
Num
ber o
f ope
ratio
ns

67
Figure H28d. SPECTRON EF + REFLECTION All poly cup hip prosthesis, age and gender, all indications in 1999 - 2003
0
50
100
150
200
250
300
350
400
0-29 30-39 40-49 50-59 60-69 70-79 80-Age
Num
ber o
f ope
ratio
ns
MALEFEMALE
Figure H28e. SPECTRON EF + REFLECTION All poly cup hip prosthesis, indications for operations in 1999 - 2003
0
50
100
150
200
250
300
350
400
450
500
1999 2000 2001 2002 2003Years
Num
ber o
f ope
ratio
ns
Other revision
Girdlestone
Change of prosthesis
Congenital luxation of the hip
Other illness
Other arthritides
Rheumatoid arthritis
Secondary arthrosis
Primary arthrosis

68
Figure H28f. SPECTRON EF + REFLECTION All poly cup hip prosthesis, indications for first revision in 1999 - 2003
0
5
10
15
20
25
30
1999 2000 2001 2002 2003Years
Num
ber o
f ope
ratio
ns
Fracture of prosth. + other reason
Fracture of bone
Malposition of prosthesis
Luxation
Infection
Loosening of acetabular component
Loosening of femoral component
Loosening of both components
Figure H28g. SPECTRON EF + REFLECTION All poly cup hip prosthesis, survival of annually installed prostheses at the end of 2003
0 %
10 %
20 %
30 %
40 %
50 %
60 %
70 %
80 %
90 %
100 %
1999 2000 2001 2002 2003Years
In follow-up, N = 863
Dead, N = 34
Revised, N = 7

69

70
Figure H29a. LUBINUS SP II + LUBINUS ECCENTRIC cup hip prosthesis in primary arthrosis in 1996-2003, 90-100% scale
90 %
91 %
92 %
93 %
94 %
95 %
96 %
97 %
98 %
99 %
100 %
0 1 2 3 4 5 6 7 8 9 10Years
Surv
ival
%
96 - 03, N=2260
CI_MAX
CI_MIN
Figure H29c. LUBINUS SP II + LUBINUS ECCENTRIC cup hip prosthesis, annual use in primary arthrosis in 1996 - 2003
0
100
200
300
400
500
1996 1997 1998 1999 2000 2001 2002 2003Years
Num
ber o
f ope
ratio
ns

71
Figure H29d. LUBINUS SP II + LUBINUS ECCENTRIC cup hip prosthesis, age andgender, all indications in 1996-2003
0
100
200
300
400
500
600
700
800
900
1000
1100
1200
0-29 30-39 40-49 50-59 60-69 70-79 80-Age
Num
ber o
f ope
ratio
ns
MALEFEMALE
Figure H29e. LUBINUS SP II + LUBINUS ECCENTRIC cup hip prosthesis, indications for operations in 1996 - 2003
0
100
200
300
400
500
600
700
800
1996 1997 1998 1999 2000 2001 2002 2003Years
Num
ber o
f ope
ratio
ns
Other revision
Girdlestone
Change of prosthesis
Congenital luxation of the hip
Other illness
Other arthritides
Rheumatoid arthritis
Secondary arthrosis
Primary arthrosis

72
Figure H29f. LUBINUS SP II + LUBINUS ECCENTRIC cup hip prosthesis, indications for first revision in 1996 - 2003
0
5
10
15
20
25
30
1996 1997 1998 1999 2000 2001 2002 2003Years
Num
ber o
f ope
ratio
ns Fracture of prosth. + other reason
Fracture of bone
Malposition of prosthesis
Luxation
Infection
Loosening of acetabular component
Loosening of femoral component
Loosening of both components
Figure H29g. LUBINUS SP II + LUBINUS ECCENTRIC cup hip prosthesis, survival of annually installed prostheses at the end of 2003
0 %
10 %
20 %
30 %
40 %
50 %
60 %
70 %
80 %
90 %
100 %
1996 1997 1998 1999 2000 2001 2002 2003Years
In follow-up, N = 2157
Dead, N = 484
Revised, N = 76

73

74
Figure H30a. BIRMINGHAM + BIRMINGHAM cup hip prosthesis in primary arthrosis in 2001-2003, 90-100% scale
90 %
91 %
92 %
93 %
94 %
95 %
96 %
97 %
98 %
99 %
100 %
0 1 2 3 4 5 6 7 8 9 10Years
Surv
ival
%
2001-2003, N=449
CI_MAX
CI_MIN
Figure H30c. BIRMINGHAM + BIRMINGHAM cup hip prosthesis, annual use in primary arthrosis in 2001 - 2003
0
50
100
150
200
250
300
350
400
2001 2002 2003Years
Num
ber o
f ope
ratio
ns

75
Figure H30d. BIRMINGHAM + BIRMINGHAM cup hip prosthesis, age and gender, all indications in 2001-2003
0
50
100
150
200
0-29 30-39 40-49 50-59 60-69 70-79 80-Age
Num
ber o
f ope
ratio
ns
MALEFEMALE
Figure H30e. BIRMINGHAM + BIRMINGHAM cup hip prosthesis, indications for operations in 2001 - 2003
0
50
100
150
200
250
300
350
400
2001 2002 2003Years
Num
ber o
f ope
ratio
ns
Other revision
Girdlestone
Change of prosthesis
Congenital luxation of the hip
Other illness
Other arthritides
Rheumatoid arthritis
Secondary arthrosis
Primary arthrosis

76
Figure H30f. BIRMINGHAM + BIRMINGHAM cup hip prosthesis, indications for first revision in 2001 - 2003
0
1
2
3
4
5
6
7
8
9
10
2001 2002 2003Years
Num
ber o
f ope
ratio
ns
Fracture of prosth. + other reason
Fracture of bone
Malposition of prosthesis
Luxation
Infection
Loosening of acetabular component
Loosening of femoral component
Loosening of both components
Figure H30g. BIRMINGHAM + BIRMINGHAM cup hip prosthesis, survival of annually installed prostheses at the end of 2003
0 %
10 %
20 %
30 %
40 %
50 %
60 %
70 %
80 %
90 %
100 %
2001 2002 2003Years
In follow-up, N = 554
Dead, N = 2
Revised, N = 1

77

78
Figure H31a. LUBINUS SP II hip prosthesis in primary arthrosis in 1989-2003, 50-100% scale
50 %
60 %
70 %
80 %
90 %
100 %
0 1 2 3 4 5 6 7 8 9 10 11 12 13 14 15Years
Surv
ival
%
89-93, N=351094-98, N=389999-03, N=3131CI_MAXCI_MIN
Figure H31b. EXETER UNIVERSAL hip prosthesis in primary arthrosis in 1989-2003, 50-100% scale
50 %
60 %
70 %
80 %
90 %
100 %
0 1 2 3 4 5 6 7 8 9 10 11 12 13 14 15Years
Surv
ival
%
89-93, N=64894-98, N=312599-03, N=6986CI_MAXCI_MIN

79
Figure H31c. BIOMET COLLARLESS hip prosthesis in primary arthrosis in1989-2003, 50-100% scale
50 %
60 %
70 %
80 %
90 %
100 %
0 1 2 3 4 5 6 7 8 9 10 11 12 13 14 15Years
Surv
ival
%
89-93, N=159594-98, N=308999-03, N=3432CI_MAXCI_MIN
Figure H31d. BIOMET COLLARED hip prosthesis in primary arthrosis in 1989-2003, 50-100% scale
50 %
60 %
70 %
80 %
90 %
100 %
0 1 2 3 4 5 6 7 8 9 10 11 12 13 14 15Years
Surv
ival
%
89-93, N=17494-98, N=46899-03, N=441CI_MAXCI_MIN

80
Figure H31e. ABG HA hip prosthesis in primary arthrosis in 1994-2003, 50-100% scale
50 %
60 %
70 %
80 %
90 %
100 %
0 1 2 3 4 5 6 7 8 9 10 11 12 13 14 15Years
Surv
ival
%
94-98, N=1366
99-03, N=1450
CI_MAX
CI_MIN
Figure H31f. ABG II hip prosthesis in primary arthrosis in 1999-2003, 50-100% scale
50 %
60 %
70 %
80 %
90 %
100 %
0 1 2 3 4 5 6 7 8 9 10 11 12 13 14 15Years
Surv
ival
%
99-03, N=1141
CI_MAX
CI_MIN

81
Figure H31g. ELITE PLUS FLANGED hip prosthesis in primary arthrosis in1994-2003, 50-100% scale
50 %
60 %
70 %
80 %
90 %
100 %
0 1 2 3 4 5 6 7 8 9 10 11 12 13 14 15Years
Surv
ival
%
94-98, N=1137
99-03, N=700
CI_MAX
CI_MIN
Figure H31h. SPECTRON EF hip prosthesis in primary arthrosis in 1999-2003, 50-100% scale
50 %
60 %
70 %
80 %
90 %
100 %
0 1 2 3 4 5 6 7 8 9 10 11 12 13 14 15Years
Surv
ival
%
99-03, N=955
CI_MAX
CI_MIN

82
Figure H32. The most common bone cements used in Hip Arthroplasties in 1996-2003
0 %
10 %
20 %
30 %
40 %
50 %
60 %
70 %
80 %
90 %
100 %
1996 1997 1998 1999 2000 2001 2002 2003Operation years
Prop
ortio
n of
cem
ents
use
d OTHER CEMENTSSIMPLEX TOBRAMYPALACOS RCMW 3GSULCEM 3PALACOSSIMPLEXSIMPLEX PSIMPLEX ANTIBPALACOS C
Figure H33. The most common antibiotic prophylaxis used in Hip Primary operations in 1996-2003
0 %
10 %
20 %
30 %
40 %
50 %
60 %
70 %
80 %
90 %
100 %
1996 1997 1998 1999 2000 2001 2002 2003Operation years
Prop
ortio
n of
ant
ibio
tics
used OTHER ANTIBIOTICS
DALACIN
DICLOCIL
ROCEPHALIN
STAFLOCIL
EKVACILLIN
LIFUROX
KEFURION
ZINACEF

83
Figure H34. Allograft, Autograft and Xenograft in Hip Revisions in 1996-2003
0
100
200
300
400
500
600
1996 1997 1998 1999 2000 2001 2002 2003
Num
ber o
f ope
ratio
ns
Allograft Autograft Autograft+allograft Xenograft

84
Tabl
e K
1.TO
TAL
KN
EE P
RO
STH
ESES
USE
D IN
PR
IMA
RY
OPE
RA
TIO
NS
IN 1
980
- 200
3
FEM
OR
AL
STEM
1980
1981
1982
1983
1984
1985
1986
1987
1988
1989
1990
1991
1992
1993
1994
1995
1996
1997
1998
1999
2000
2001
2002
2003
Implanted N=
Revised N=
Dead N=
at risk N=
DU
RA
CO
N0
00
00
00
00
00
017
588
710
3410
9314
1216
3416
0316
3216
1619
1821
1025
4117
655
525
2272
1485
8A
GC
V2
00
00
03
3411
326
429
136
032
242
357
861
077
310
5612
7213
1512
9112
5311
4612
3711
8013
521
623
2508
1039
0P
.F.C
SIG
MA
00
00
00
00
00
00
00
00
00
291
555
586
627
650
940
3649
5822
755
52P
.F.C
PR
ES
S F
ITT
00
00
00
00
017
9814
924
522
528
925
632
040
019
00
00
00
2189
134
580
1475
NE
XG
EN
(CR
)0
00
00
00
00
00
00
00
059
126
103
187
233
332
554
464
2058
1811
819
22P
CA
00
021
5214
830
331
334
627
419
017
210
00
00
00
00
00
1685
367
1038
280
TOW
NLE
Y12
618
922
020
425
422
918
413
918
235
00
00
00
00
00
00
015
9119
311
6623
2N
EX
GE
N (L
PS
)0
00
00
00
00
00
00
00
00
5611
614
526
127
133
836
815
5512
7914
64M
ILLE
R-G
ALA
NTE
II0
00
00
00
11
44
2622
630
125
728
927
412
538
00
00
015
4611
246
796
7A
RG
E0
00
00
00
00
00
00
00
00
015
622
327
320
934
826
414
7325
9113
57P
CA
/MO
DU
LAR
00
00
02
01
337
242
550
555
3026
52
00
00
00
014
5316
860
168
4M
ILLE
R-G
ALA
NTE
I0
01
00
024
138
216
258
191
173
139
6881
230
00
00
00
013
1233
861
436
0O
XFO
RD
UN
ICO
MP
AR
TME
NTA
L P
HA
SE
30
00
00
00
00
00
00
00
00
00
1711
518
934
039
110
5236
1610
00P
ER
FOR
MA
NC
E0
00
00
00
00
057
9634
5859
134
189
234
6513
30
00
942
7224
962
1M
AX
IM P
RIM
AR
Y0
00
00
00
00
00
00
00
00
030
107
193
150
123
219
822
1456
752
SY
NA
TOM
IC T
OW
NLE
Y0
00
00
2037
117
189
163
131
6147
166
00
00
00
00
078
717
546
015
2P
.F.C
SIG
MA
STA
BIL
OIT
U0
00
00
00
00
00
00
00
00
07
2480
9717
034
872
612
3068
4TC
IV0
00
00
00
00
17
4756
130
183
127
5830
100
00
00
649
5025
234
7A
NA
ME
TRIC
6313
210
610
174
5524
219
60
00
00
00
00
00
00
059
181
473
37A
MK
00
00
00
00
780
7972
2230
3354
6478
4313
00
00
575
7621
028
9P
CA
-INTE
RA
X D
I0
00
00
00
00
00
01
1569
184
141
788
00
00
049
656
135
0FR
EE
MA
N-S
WA
NS
S0
00
03
318
3015
1220
4165
3389
6932
130
00
00
044
330
192
221
DU
RA
CO
N S
TAB
ILIZ
ER
BO
X0
00
00
00
00
00
00
00
06
1419
1745
8310
913
843
117
2838
6M
ILLE
R-G
/UN
ICO
ND
00
00
00
00
00
213
4040
6239
3519
2712
1416
74
330
5354
223
EN
DO
MO
DE
LL-L
INK
00
11
02
811
1610
2413
1511
38
922
3021
2628
2715
301
3210
616
3K
INE
MA
TIC
STA
B0
00
4980
7437
431
01
00
00
00
00
00
00
028
521
223
41A
GC
V2
STA
BIL
OIT
U0
00
00
00
00
00
00
00
04
513
1737
3763
5923
53
1621
6A
GC
DU
AL
AR
TIC
ULA
R0
00
00
00
00
00
01
721
1914
1919
2130
3024
921
413
4715
4D
UR
AC
ON
/MO
DU
LAR
STA
00
00
00
00
00
00
00
00
75
1123
2123
4863
201
1021
170
GE
NE
SIS
II0
00
00
00
00
00
00
00
00
018
5053
4126
1220
03
1418
3P
CA
/UN
ICO
ND
YLA
R0
00
00
23
2341
3838
428
00
10
00
00
00
019
699
7720
NA
TUR
AL-
KN
EE
00
00
00
00
00
00
05
919
4072
210
00
00
166
732
127
SE
AR
CH
00
00
00
00
00
00
00
00
912
3634
2740
00
158
1310
135
OR
THO
ME
T0
00
00
00
00
01
050
6735
00
00
00
00
015
333
7050
DU
RA
CO
N/D
EM
I0
00
00
00
00
00
00
1726
2823
2419
63
00
014
627
2891
GU
EP
AR
(HIN
GE
D)
2724
2611
148
65
31
04
51
12
00
00
00
00
138
1911
72
P.F
.C S
IGM
A T
C3
00
00
00
00
00
00
00
00
00
1219
1725
2540
138
215
121
MIL
LER
-G I/
PR
EC
OA
T0
00
00
00
00
014
968
170
00
00
00
00
013
520
6451
KIN
EM
ATI
C R
OT
HIN
G0
00
02
833
137
24
1110
45
82
64
00
00
011
916
8617
MA
XIM
PS
00
00
00
00
00
00
00
00
00
80
036
2148
113
14
108
PC
A/IN
TER
AX
00
00
00
10
00
019
1338
279
20
00
00
00
109
1037
62S
T.G
EO
RG
2513
2319
97
00
02
00
00
02
31
11
00
00
106
2470
12K
INE
MA
TIC
00
00
21
211
4627
43
10
00
00
00
00
00
979
6523
OX
FOR
D M
EN
ISC
EA
L P
HA
SE
II0
00
00
00
00
013
1925
198
33
12
00
00
093
1828
47S
EA
RC
H E
VO
LUTI
ON
00
00
00
00
00
00
00
00
00
00
02
4838
880
088
EN
DO
MO
DE
LL-S
C0
01
03
03
69
226
72
03
10
00
00
00
063
1922
22IC
LH2
3327
00
00
00
00
00
00
00
00
00
00
062
352
7FR
EE
MA
N-S
AM
UE
LS1
111
31
20
225
40
02
00
00
00
00
00
052
335
14S
PH
ER
OC
EN
TRIC
1515
63
00
00
00
00
00
00
00
00
00
00
395
380

85
Tabl
e K
1.TO
TAL
KN
EE P
RO
STH
ESES
USE
D IN
PR
IMA
RY
OPE
RA
TIO
NS
IN 1
980
- 200
3
FEM
OR
AL
STEM
1980
1981
1982
1983
1984
1985
1986
1987
1988
1989
1990
1991
1992
1993
1994
1995
1996
1997
1998
1999
2000
2001
2002
2003
Implanted N=
Revised N=
Dead N=
at risk N=
RO
TAG
LID
E/C
OR
IN0
00
00
00
00
00
00
246
43
00
00
00
037
215
20K
IRS
CN
ER
/UN
ICO
ND
00
00
00
00
00
73
710
62
10
00
00
00
368
1117
TRIC
ON
00
00
00
84
08
150
00
00
00
00
00
00
3510
150
MA
RM
OR
98
50
31
01
31
10
00
00
00
00
00
00
325
261
NE
XG
EN
(LC
CK
)0
00
00
00
00
00
00
00
00
00
17
67
1031
22
0S
YN
ATO
MIC
+DO
ME
00
00
013
142
00
00
00
10
00
00
00
00
3010
200
TUU
MO
RIP
RO
TEE
SI
00
00
00
01
00
10
31
80
04
25
41
00
303
1215
KIN
EM
AX
RO
TATI
NG
HIN
GE
00
00
00
00
00
03
01
00
01
68
52
12
291
820
P.F
.C S
TAB
ILO
ITU
00
00
00
00
00
00
00
00
913
50
00
00
270
720
DU
RA
CO
N/R
OTA
TIN
G H
I0
00
00
00
00
00
00
00
00
00
00
57
1325
12
0LI
NK
00
20
19
64
10
00
00
00
00
00
00
00
231
148
LOTU
S3
80
12
40
20
00
00
00
00
00
00
00
020
1014
0G
EO
ME
DIC
56
18
00
00
00
00
00
00
00
00
00
00
207
170
R.B
RIG
HA
M/U
NIC
ON
DY
00
00
00
00
00
13
77
00
10
00
00
00
196
50
RM
C12
15
00
00
00
00
00
00
00
00
00
00
018
017
1LI
NK
T.A
.C.K
.0
00
00
00
00
00
03
39
30
00
00
00
018
16
11A
GC
DU
AL
AR
TIC
ULA
R 2
000
00
00
00
00
00
00
00
00
00
00
01
312
160
016
PR
ES
ER
VA
TIO
N U
NI K
NE
E0
00
00
00
00
00
00
00
00
00
00
00
1414
00
14LC
S-P
OR
O (D
EP
UY
)0
00
00
00
00
05
80
10
00
00
00
00
014
17
6S
YN
ATO
MIC
00
00
00
10
00
03
90
00
00
00
00
00
134
72
OR
THO
PLA
NT
I0
00
00
00
00
02
92
00
00
00
00
00
013
610
0M
BK
(ZIM
ME
R)
00
00
00
00
00
00
00
00
00
08
40
00
120
111
GE
NE
SIS
I0
00
00
00
00
00
00
00
00
06
15
00
012
01
11S
+G (O
RTH
OP
LAN
T)0
00
00
00
00
00
45
20
00
00
00
00
011
36
2A
MK
/CO
RD
INA
TE0
00
00
00
00
00
00
00
25
40
00
00
011
25
4A
TTE
NB
OR
OU
GH
02
60
11
00
00
00
00
00
00
00
00
00
100
91
RIC
HA
RD
S1
01
01
21
00
01
10
10
00
00
00
00
09
17
1P
.F.C
TC
30
00
00
00
00
00
00
00
00
63
00
00
09
01
8P
CA
/RE
VIS
IO0
00
00
01
00
00
15
00
00
00
00
00
07
12
4M
AX
IM C
ON
STR
AIN
ED
00
00
00
00
00
00
00
00
00
10
01
32
71
15
DE
AN
E5
01
00
00
00
00
00
00
00
00
00
00
06
23
1C
SR
/UN
ICO
ND
YLA
R0
00
00
00
02
30
00
00
00
00
00
00
05
22
1H
MR
S R
OTA
TIN
G H
ING
E0
00
00
00
00
00
00
00
00
00
01
00
45
10
4A
MK
STA
BIL
IZE
D0
00
00
00
00
00
00
00
02
11
00
00
04
00
4A
GC
150
00
00
00
00
01
00
20
10
00
00
00
00
04
10
3P
ER
FOR
MA
NC
E S
TAB
ILO
ITU
00
00
00
00
00
00
00
00
31
00
00
00
41
21
PR
OTE
ES
I ETM
00
01
00
10
00
00
00
00
00
00
00
00
20
11
GE
OP
ATE
LLA
MA
G1
00
01
00
00
00
00
00
00
00
00
00
02
11
0LI
NK
EN
DO
MO
DE
LL A
NTI
LUK
SA
TIO
00
00
00
00
00
00
00
00
00
01
00
01
21
01
FIN
N-K
NE
E C
US
TOM
00
00
00
00
00
00
00
00
00
10
01
00
20
11
S-R
OM
00
00
00
00
00
00
00
00
00
00
00
02
20
02
AR
GE
STA
BIL
OIT
U0
00
00
00
00
00
00
00
00
00
01
01
02
00
2N
EX
GE
N R
otat
ing
Hin
ge0
00
00
00
00
00
00
00
00
00
00
00
22
00
2R
OTA
-FLE
X II
00
00
00
00
00
11
00
00
00
00
00
00
20
20
SC
HA
NTA
-SO
LIR
00
10
00
00
00
00
00
00
00
00
00
00
10
10
GS
P/A
LLO
PR
O0
00
00
00
00
00
00
00
10
00
00
00
01
01
0

86
Tabl
e K
2.K
NEE
PR
OST
HES
ES, O
VER
50
IMPL
AN
TS R
EMO
VED
IN 1
980
- 200
3
PRO
STH
ESES
1980
1981
1982
1983
1984
1985
1986
1987
1988
1989
1990
1991
1992
1993
1994
1995
1996
1997
1998
1999
2000
2001
2002
2003
Removed N=
AG
C V
20
00
00
00
00
20
711
1521
1220
2841
3548
5669
5742
2D
UR
AC
ON
00
00
00
00
00
00
04
1019
1833
4943
4248
7164
401
PC
A0
00
00
03
610
1514
1523
2731
2731
2218
2418
2016
1333
3M
ILLE
R-G
I0
00
00
00
04
512
1014
2417
2920
2617
1714
1313
2025
5TO
WN
LEY
13
37
125
512
1113
1420
1514
1514
1316
810
73
118
240
SY
NA
TOM
IC T
OW
NLE
Y0
00
00
01
02
312
69
616
1514
1714
1613
1510
1418
3P
CA
/MO
DU
LAR
00
00
00
00
00
07
718
1611
815
1813
910
58
145
PC
A/U
NIC
ON
DY
LAR
00
00
00
01
12
54
912
1015
99
44
34
55
102
P.F
.C P
RE
SS
FIT
T0
00
00
00
00
00
02
37
57
414
815
711
1710
0M
ILLE
R-G
II0
00
00
00
00
00
14
66
915
137
911
36
696
AN
AM
ETR
IC2
04
43
64
25
47
12
76
45
42
43
22
083
AM
K0
00
00
00
00
01
12
22
45
86
68
97
667
P.F
.C S
IGM
A0
00
00
00
00
00
00
00
00
00
77
1214
2161
PE
RFO
RM
AN
CE
00
00
00
00
00
02
13
13
45
46
63
108
56E
ND
O M
OD
ELL
-LIN
K0
00
00
00
20
23
33
40
34
25
17
55
655
MIL
LER
-G/U
NIC
ON
D0
00
00
00
00
00
00
00
05
43
1311
62
1054
GE
OM
ED
IC5
01
36
24
20
34
54
13
31
31
10
10
053
OX
FOR
D M
EN
ISC
EA
L P
HA
SE
II0
00
00
00
00
00
03
11
10
02
34
819
1052
PC
A-IN
TER
AX
DI
00
00
00
00
00
00
00
13
58
65
55
66
50

87

88

89
Figure K5. Primary and revision Total Knee Arthroplasty operations in 1980 - 2003
511
502
224
181
126
113
846254553443
429
27
418
424
259
299
358 42
6
377
29 36 31
7203
6290
4452
4240
4276
3788
3158
2966
2648
2230
1525
1284
1223
1001
749
594
503
422
444
1819
295
4913
5317
432
0
1000
2000
3000
4000
5000
6000
7000
800019
80
1981
1982
1983
1984
1985
1986
1987
1988
1989
1990
1991
1992
1993
1994
1995
1996
1997
1998
1999
2000
2001
2002
2003
Years
Num
ber o
f ope
ratio
ns
PrimaryRevision
Figure K6. Primary indications for Total Knee Arthroplasties in 1980 - 2003
0 %
10 %
20 %
30 %
40 %
50 %
60 %
70 %
80 %
90 %
100 %
1980
1981
1982
1983
1984
1985
1986
1987
1988
1989
1990
1991
1992
1993
1994
1995
1996
1997
1998
1999
2000
2001
2002
2003
Years
% o
f ind
icat
ions
Other illnesses
Other arthritides
Rheumatoid arthritis
Secondary arthrosis
Primary arthrosis

90
Figure K7a. Fixation technique in primary Total Knee Arthroplasties in 1993 - 2003 FEMORAL COMPONENT
Cemented
Cementless
0 %
10 %
20 %
30 %
40 %
50 %
60 %
70 %
80 %
90 %
100 %
1993 1994 1995 1996 1997 1998 1999 2000 2001 2002 2003Years
% o
f prim
ary
oper
atio
ns
Figure K7b. Fixation technique in primary Total Knee Arthroplasties in 1993 - 2003 TIBIAL COMPONENT
Cemented
Cementless
0 %
10 %
20 %
30 %
40 %
50 %
60 %
70 %
80 %
90 %
100 %
1993 1994 1995 1996 1997 1998 1999 2000 2001 2002 2003Years
% o
f prim
ary
oper
atio
ns

91
Figure K8a. Age distribution of Total Knee Arthroplasty operations in 1999-2003, FEMALE
0
5
10
15
20
25
30
35
40
45
50
55
0-29 30-39 40-49 50-59 60-69 70-79 80-Age
% o
f prim
ary
oper
atio
ns
1999 2000 2001 2002 2003
Figure K8b. Age distribution of Total Knee Arthroplasty operations in 1999-2003, MALE
0
5
10
15
20
25
30
35
40
45
50
55
0-29 30-39 40-49 50-59 60-69 70-79 80-Age
% o
f prim
ary
oper
atio
ns
1999 2000 2001 2002 2003

92

93
Figure K10. Number of hospitals performing Total Knee Arthroplasties in 1980-2003
21 2119
23 22 23
29
35
4043
51
5659
64 63 64 63 63 6466
70 69
6463
46 4751
8 81211 12 12 13
16
2218
26 2832
4143
41
46 45 46 47 48
0
10
20
30
40
50
60
70
8019
80
1981
1982
1983
1984
1985
1986
1987
1988
1989
1990
1991
1992
1993
1994
1995
1996
1997
1998
1999
2000
2001
2002
2003
Years
Num
ber o
f hos
pita
ls
Primary Revision
Figure K11. Indications for Total Knee Arthroplasty revisions in 1993 - 2003
0 %
10 %
20 %
30 %
40 %
50 %
60 %
70 %
80 %
90 %
100 %
1993 1994 1995 1996 1997 1998 1999 2000 2001 2002 2003Years
% o
f rev
isio
n in
dica
tions
Patella complicationFracture of prosth. + other reasonFracture of boneMalposition of prosthesisLuxationInfectionLoosening of tibial componentLoosening of femoral componentLoosening of both component

94
Figure K12. The most common types of removed knee prostheses in 1993 - 2003
0 %
10 %
20 %
30 %
40 %
50 %
60 %
70 %
80 %
90 %
100 %
1993 1994 1995 1996 1997 1998 1999 2000 2001 2002 2003Years
% o
f pro
sthe
ses
OTHER TYPESP.F.C PRESS FITTTOWNLEYPCA/MODULARSYNATOMIC TOWNLEYMILLER-G IPCADURACONAGC V2
Figure K13. Previous operation year in Total Knee Arthroplasty revisions in 2003
0,00 0,00 0,21 0,42 0,42
1,48 1,482,11
4,22 4,434,85
4,01
5,70
7,38
3,594,43
2,53
6,33
10,97
16,67
12,24
0,42
3,59
2,53
0
2
4
6
8
10
12
14
16
18
1980
1981
1982
1983
1984
1985
1986
1987
1988
1989
1990
1991
1992
1993
1994
1995
1996
1997
1998
1999
2000
2001
2002
2003
Operation year
% o
f rev
isio
ns (N
=474
;-80-
03)

95
Figure K14. The most common types of knee revision prostheses used in 1993- 2003
0 %
10 %
20 %
30 %
40 %
50 %
60 %
70 %
80 %
90 %
100 %
1993 1994 1995 1996 1997 1998 1999 2000 2001 2002 2003Years
% o
f pro
sthe
ses
OTHER TYPES
P.F.C SIGMA
AGC V2
NEXGEN (CR)
ENDO MODELL-LINK
DURACON/MODULAR STA
DURACON
AGC DUAL ARTICULAR
Figure K15. Three most commonly used cemented knee prostheses in primary arthrosis 1994-2003, 50-100% scale
50 %
60 %
70 %
80 %
90 %
100 %
0 1 2 3 4 5 6 7 8 9 10 11 12 13 14 15Years
Surv
ival
%
94-98, N=7306
99-03, N=15789
CI_MAX
CI_MIN
DURACONAGC V2P.F.C SIGMA

96
Figure K17. Three most commonly used cemented knee prostheses in rheumatoid arthritis 1994-2003, 50-100% scale
50 %
60 %
70 %
80 %
90 %
100 %
0 1 2 3 4 5 6 7 8 9 10 11 12 13 14 15Years
Surv
ival
%
94-98, N=1176
99-03, N=1317
CI_MAX
CI_MIN
DURACONAGC V2NEXGEN (LPS)
Figure K19. Four most commonly used cemented knee prostheses in first revisions 1994-2003, 50-100% scale
50 %
60 %
70 %
80 %
90 %
100 %
0 1 2 3 4 5 6 7 8 9 10 11 12 13 14 15Years
Surv
ival
%
94-98, N=335
99-03, N=468
CI_MAX
CI_MIN
AGC DUAL ARTICENDO MODELL-LINKDURACON/MODULAR STADURACON

97
Figure K20a. AGC V2 knee prosthesis in primary arthrosis in 1989-2003, 50-100% scale
50 %
60 %
70 %
80 %
90 %
100 %
0 1 2 3 4 5 6 7 8 9 10 11 12 13 14 15Years
Surv
ival
%
89-93, N=110694-98, N=401799-03, N=5314CI_MAXCI_MIN
Figure K20b. AGC V2 knee prosthesis in primary arthrosis in 1989-2003, 90-100% scale
90 %
91 %
92 %
93 %
94 %
95 %
96 %
97 %
98 %
99 %
100 %
0 1 2 3 4 5 6 7 8 9 10 11 12 13 14 15Years
Surv
ival
%
89-93, N=110694-98, N=401799-03, N=5314CI_MAXCI_MIN

98
Figure K20c. AGC V2 knee prosthesis, annual use in primary arthrosis in 1986 - 2003
0
200
400
600
800
1000
1200
1986
1987
1988
1989
1990
1991
1992
1993
1994
1995
1996
1997
1998
1999
2000
2001
2002
2003
Years
Num
ber o
f ope
ratio
ns
Figure K20d. AGC V2 knee prosthesis, age and gender, all indications in 1986-2003
0
500
1000
1500
2000
2500
3000
3500
4000
4500
5000
5500
0-29 30-39 40-49 50-59 60-69 70-79 80-Age
Num
ber o
f ope
ratio
ns
MALEFEMALE

99
Figure K20e. AGC V2 knee prosthesis, indications for operations in 1986- 2003
0
200
400
600
800
1000
1200
1400
160019
86
1987
1988
1989
1990
1991
1992
1993
1994
1995
1996
1997
1998
1999
2000
2001
2002
2003
Years
Num
ber o
f ope
ratio
ns Other revision
Girdlestone
Change of prosthesis
Other illness
Other arthritides
Rheumatoid arthritis
Secondary arthrosis
Primary arthrosis
Figure K20f. AGC V2 knee prosthesis, indications for first revisionin 1986 - 2003
0
10
20
30
40
50
60
70
80
90
100
1986
1987
1988
1989
1990
1991
1992
1993
1994
1995
1996
1997
1998
1999
2000
2001
2002
2003
Years
Num
ber o
f ope
ratio
ns Patellar complicationFracture of prosth. + other reasonFracture of boneMalposition of prosthesisLuxationInfectionLoosening of tibial componentLoosening of femoral componentLoosening of both components

100
Figure K20g. AGC V2 knee prosthesis, survival of annually installed prostheses at the end of 2003
0 %
10 %
20 %
30 %
40 %
50 %
60 %
70 %
80 %
90 %
100 %
1986
1987
1988
1989
1990
1991
1992
1993
1994
1995
1996
1997
1998
1999
2000
2001
2002
2003
Years
In follow-up, N = 10587
Dead, N = 2507
Revised, N = 408

101
Figure K21a. ARGE knee prosthesis in primary arthrosisin 1999-2003, 50-100% scale
50 %
60 %
70 %
80 %
90 %
100 %
0 1 2 3 4 5 6 7 8 9 10 11 12 13 14 15Years
Surv
ival
%
99-03, N=1208
CI_MAX
CI_MIN
Figure K21b. ARGE knee prosthesis in primary arthrosisin 1999-2003, 90-100% scale
90 %
91 %
92 %
93 %
94 %
95 %
96 %
97 %
98 %
99 %
100 %
0 1 2 3 4 5 6 7 8 9 10 11 12 13 14 15Years
Surv
ival
%
99-03, N=1208
CI_MAX
CI_MIN

102
Figure K21c. ARGE knee prosthesis, annual use in primary arthrosis in 1998 - 2003
0
50
100
150
200
250
300
350
1998 1999 2000 2001 2002 2003Years
Num
ber o
f ope
ratio
ns
Figure K21d. ARGE knee prosthesis, age and gender, all indications in 1998-2003
0
50
100
150
200
250
300
350
400
450
500
550
600
0-29 30-39 40-49 50-59 60-69 70-79 80-Age
Num
ber o
f ope
ratio
ns
MALEFEMALE

103
Figure K21e. ARGE knee prosthesis, indications for operations in 1998 - 2003
0
100
200
300
400
500
1998 1999 2000 2001 2002 2003Years
Num
ber o
f ope
ratio
ns Other revision
Change of prosthesis
Other illness
Other arthritides
Rheumatoid arthritis
Secondary arthrosis
Primary arthrosis
Figure K21f. ARGE knee prosthesis, indications for first revisionin 1998 - 2003
0
5
10
15
20
25
30
35
40
45
50
1998 1999 2000 2001 2002 2003Years
Num
ber o
f ope
ratio
ns Patellar complication
Fracture of prosth. + other reason
Malposition of prosthesis
Luxation
Infection

104
Figure K21g. ARGE knee prosthesis, survival of annually installed prostheses at the end of 2003
0 %
10 %
20 %
30 %
40 %
50 %
60 %
70 %
80 %
90 %
100 %
1998 1999 2000 2001 2002 2003Years
In follow-up, N = 1354
Dead, N = 91
Revised, N = 25

105
Figure K22a. DURACON knee prosthesis in primary arthrosisin 1994-2003, 50-100% scale
50 %
60 %
70 %
80 %
90 %
100 %
0 1 2 3 4 5 6 7 8 9 10 11 12 13 14 15Years
Surv
ival
%
94-98, N=5751
99-03, N=8792
CI_MAX
CI_MIN
Figure K22b. DURACON knee prosthesis in primary arthrosisin 1994-2003, 90-100% scale
90 %
91 %
92 %
93 %
94 %
95 %
96 %
97 %
98 %
99 %
100 %
0 1 2 3 4 5 6 7 8 9 10 11 12 13 14 15Years
Surv
ival
%
94-98, N=5751
99-03, N=8792
CI_MAX
CI_MIN

106
Figure K22c. DURACON knee prosthesis, annual use in primary arthrosis in 1992 - 2003
0
200
400
600
800
1000
1200
1400
1600
1800
2000
2200
2400
1992 1993 1994 1995 1996 1997 1998 1999 2000 2001 2002 2003Years
Num
ber o
f ope
ratio
ns
Figure K22d. DURACON knee prosthesis, age and gender, all indications in 1992-2003
0
500
1000
1500
2000
2500
3000
3500
4000
4500
5000
5500
6000
6500
7000
0-29 30-39 40-49 50-59 60-69 70-79 80-Age
Num
ber o
f ope
ratio
ns
MALEFEMALE

107
Figure K22e. DURACON knee prosthesis, indications for operationsin 1992 - 2003
0
200
400
600
800
1000
1200
1400
1600
1800
2000
2200
2400
2600
1992 1993 1994 1995 1996 1997 1998 1999 2000 2001 2002 2003Years
Num
ber o
f ope
ratio
ns
Other revision
Girdlestone
Change of prosthesis
Other illness
Other arthritides
Rheumatoid arthritis
Secondary arthrosis
Primary arthrosis
Figure K22f. DURACON knee prosthesis, indications for first revisionin 1992 - 2003
0
10
20
30
40
50
60
70
80
90
100
1992 1993 1994 1995 1996 1997 1998 1999 2000 2001 2002 2003Years
Num
ber o
f ope
ratio
ns Patellar complicationFracture of prosth. + other reasonFracture of boneMalposition of prosthesisLuxationInfectionLoosening of tibial componentLoosening of femoral componentLoosening of both components

108
Figure K22g. DURACON knee prosthesis, survival of annually installed prostheses at the end of 2003
0 %
10 %
20 %
30 %
40 %
50 %
60 %
70 %
80 %
90 %
100 %
1992 1993 1994 1995 1996 1997 1998 1999 2000 2001 2002 2003Years
In follow-up, N = 14776
Dead, N = 2257
Revised, N = 516

109
Figure K23a. MAXIM PRIMARY knee prosthesis in primary arthrosisin 1999-2003, 50-100% scale
50 %
60 %
70 %
80 %
90 %
100 %
0 1 2 3 4 5 6 7 8 9 10 11 12 13 14 15Years
Surv
ival
%
99-03, N=722
CI_MAX
CI_MIN
Figure K23b. MAXIM PRIMARY knee prosthesis in primary arthrosisin 1999-2003, 90-100% scale
90 %
91 %
92 %
93 %
94 %
95 %
96 %
97 %
98 %
99 %
100 %
0 1 2 3 4 5 6 7 8 9 10 11 12 13 14 15Years
Surv
ival
%
99-03, N=722
CI_MAX
CI_MIN

110
Figure K23c. MAXIM PRIMARY knee prosthesis, annual use in primary arthrosis in 1998 - 2003
0
50
100
150
200
250
1998 1999 2000 2001 2002 2003Years
Num
ber o
f ope
ratio
ns
Figure K23d. MAXIM PRIMARY knee prosthesis, age and gender, all indications in 1998-2003
0
50
100
150
200
250
300
350
0-29 30-39 40-49 50-59 60-69 70-79 80-Age
Num
ber o
f ope
ratio
ns
MALEFEMALE

111
Figure K23e. MAXIM PRIMARY knee prosthesis, indications for operationsin 1998 - 2003
0
50
100
150
200
250
300
1998 1999 2000 2001 2002 2003Years
Num
ber o
f ope
ratio
ns
Other revision
Girdlestone
Change of prosthesis
Other illness
Other arthritides
Rheumatoid arthritis
Secondary arthrosis
Primary arthrosis
Figure K23f. MAXIM PRIMARY knee prosthesis, indications for first revisionin 1998 - 2003
0
5
10
15
20
25
30
35
40
45
50
1998 1999 2000 2001 2002 2003Years
Num
ber o
f ope
ratio
ns
Patellar complication
Fracture of prosth. + other reason
Malposition of prosthesis
Infection

112
Figure K23g. MAXIM PRIMARY knee prosthesis, survival of annually installed prostheses at the end of 2003
0 %
10 %
20 %
30 %
40 %
50 %
60 %
70 %
80 %
90 %
100 %
1998 1999 2000 2001 2002 2003Years
In follow-up, N =752
Dead, N = 56
Revised, N = 14

113
Figure K24a. NEXGEN (CR) knee prosthesis in primary arthrosisin 1999-2003, 50-100% scale
50 %
60 %
70 %
80 %
90 %
100 %
0 1 2 3 4 5 6 7 8 9 10 11 12 13 14 15Years
Surv
ival
%
99-03, N=1617
CI_MAX
CI_MIN
Figure K24b. NEXGEN (CR) knee prosthesis in primary arthrosisin 1999-2003, 90-100% scale
90 %
91 %
92 %
93 %
94 %
95 %
96 %
97 %
98 %
99 %
100 %
0 1 2 3 4 5 6 7 8 9 10 11 12 13 14 15Years
Surv
ival
%
99-03, N=1617
CI_MAX
CI_MIN

114
Figure K24c. NEXGEN (CR) knee prosthesis, annual use in primary arthrosis in 1996 - 2003
0
50
100
150
200
250
300
350
400
450
500
550
1996 1997 1998 1999 2000 2001 2002 2003Years
Num
ber o
f ope
ratio
ns
Figure K24d. NEXGEN (CR) knee prosthesis, age and gender, all indications in 1996-2003
0
100
200
300
400
500
600
700
800
0-29 30-39 40-49 50-59 60-69 70-79 80-Age
Num
ber o
f ope
ratio
ns
MALEFEMALE

115
Figure K24e. NEXGEN (CR) knee prosthesis, indications for operations in 1996 - 2003
0
50
100
150
200
250
300
350
400
450
500
550
600
1996 1997 1998 1999 2000 2001 2002 2003Years
Num
ber o
f ope
ratio
ns
Other revision
Change of prosthesis
Rheumatoid arthritis
Other arthritides
Other illness
Secondary arthrosis
Primary arthrosis
Figure K24f. NEXGEN (CR) knee prosthesis, indications for first revisionin 1996 - 2003
0
5
10
15
20
25
30
35
40
45
50
1996 1997 1998 1999 2000 2001 2002 2003Years
Num
ber o
f ope
ratio
ns
Patellar complicationFracture of prosth. + other reasonFracture of boneMalposition of prosthesisLuxationInfectionLoosening of tibial componentLoosening of femoral componentLoosening of both components

116
Figure K24g. NEXGEN (CR) knee prosthesis, survival of annually installed prostheses at the end of 2003
0 %
10 %
20 %
30 %
40 %
50 %
60 %
70 %
80 %
90 %
100 %
1996 1997 1998 1999 2000 2001 200 2003Years
In follow-up, N = 1922
Dead, N = 118
Revised, N = 18

117
Figure K25a. NEXGEN (LPS) knee prosthesis in primary arthrosisin 1999-2003, 50-100% scale
50 %
60 %
70 %
80 %
90 %
100 %
0 1 2 3 4 5 6 7 8 9 10 11 12 13 14 15Years
Surv
ival
%
99-03, N=1149
CI_MAX
CI_MIN
Figure K25b. NEXGEN (LPS) knee prosthesis in primary arthrosisin 1999-2003, 90-100% scale
90 %
91 %
92 %
93 %
94 %
95 %
96 %
97 %
98 %
99 %
100 %
0 1 2 3 4 5 6 7 8 9 10 11 12 13 14 15Years
Surv
ival
%
99-03, N=1149
CI_MAX
CI_MIN

118
Figure K25c. NEXGEN (LPS) knee prosthesis, annual use in primary arthrosis in 1997 - 2003
0
50
100
150
200
250
300
350
1997 1998 1999 2000 2001 2002 2003Years
Num
ber o
f ope
ratio
ns
Figure K25d. NEXGEN (LPS) knee prosthesis, age and gender, all indications in 1997-2003
0
50
100
150
200
250
300
350
400
450
500
550
0-29 30-39 40-49 50-59 60-69 70-79 80-Age
Num
ber o
f ope
ratio
ns
MALEFEMALE

119
Figure K25e. NEXGEN (LPS) knee prosthesis, indications for operationsin 1997 - 2003
0
50
100
150
200
250
300
350
400
450
500
1997 1998 1999 2000 2001 2002 2003Years
Num
ber o
f ope
ratio
ns
Other revision
Change of prosthesis
Other illness
Other arthritides
Rheumatoid arthritis
Secondary arthrosis
Primary arthrosis
Figure K25f. NEXGEN (LPS) knee prosthesis, indications for first revisionin 1997 - 2003
0
5
10
15
20
25
30
35
40
45
50
1997 1998 1999 2000 2001 2002 2003Years
Num
ber o
f ope
ratio
ns
Fracture of prosth. + other reason
Malposition of prosthesis
Luxation
Infection

120
Figure K25g. NEXGEN (LPS) knee prosthesis, survival of annually installed prostheses at the end of 2003
0 %
10 %
20 %
30 %
40 %
50 %
60 %
70 %
80 %
90 %
100 %
1997 1998 1999 2000 2001 2002 2003Years
In follow-up, N = 1464
Dead, N = 79
Revised, N = 12

121
Figure K26a. P.F.C SIGMA knee prosthesis in primary arthrosisin 1999-2003, 50-100% scale
50 %
60 %
70 %
80 %
90 %
100 %
0 1 2 3 4 5 6 7 8 9 10 11 12 13 14 15Years
Surv
ival
%
99-03, N=3077
CI_MAX
CI_MIN
Figure K26b. P.F.C SIGMA knee prosthesis in primary arthrosisin 1999-2003, 90-100% scale
90 %
91 %
92 %
93 %
94 %
95 %
96 %
97 %
98 %
99 %
100 %
0 1 2 3 4 5 6 7 8 9 10 11 12 13 14 15Years
Surv
ival
%
99-03, N=3077
CI_MAX
CI_MIN

122
Figure K26c. P.F.C SIGMA knee prosthesis, annual use in primary arthrosis in 1998 - 2003
0
200
400
600
800
1000
1998 1999 2000 2001 2002 2003Years
Num
ber o
f ope
ratio
ns
Figure K26d. P.F.C SIGMA knee prosthesis, age and gender, all indications in 1998-2003
0
200
400
600
800
1000
1200
1400
0-29 30-39 40-49 50-59 60-69 70-79 80-Age
Num
ber o
f ope
ratio
ns
MALEFEMALE

123
Figure K26e. P.F.C SIGMA knee prosthesis, indications for operations in 1998- 2003
0
100
200
300
400
500
600
700
800
900
1000
1998 1999 2000 2001 2002 2003Years
Num
ber o
f ope
ratio
ns
Other revision
Girdlestone
Change of prosthesis
Other illness
Other arthritides
Rheumatoid arthritis
Secondary arthrosis
Primary arthrosis
Figure K26f. P.F.C SIGMA knee prosthesis, indications for first revisionin 1998 - 2003
0
5
10
15
20
25
30
35
40
45
50
1998 1999 2000 2001 2002 2003Years
Num
ber o
f ope
ratio
ns
Patellar complication
Fracture of prosth. + other reason
Malposition of prosthesis
Luxation
Infection
Loosening of tibial component
Loosening of femoral component
Loosening of both components

124
Figure K26g. P.F.C SIGMA knee prosthesis, survival of annually installed prostheses at the end of 2003
0 %
10 %
20 %
30 %
40 %
50 %
60 %
70 %
80 %
90 %
100 %
1998 1999 2000 2001 2002 2003Years
In follow-up, N = 3337
Dead, N = 227
Revised, N = 58

125
Figure K27a. P.F.C SIGMA STAB. knee prosthesis in primary arthrosisin 1999-2003, 50-100% scale
50 %
60 %
70 %
80 %
90 %
100 %
0 1 2 3 4 5 6 7 8 9 10 11 12 13 14 15Years
Surv
ival
%
99-03, N=574
CI_MAX
CI_MIN
Figure K27b. P.F.C SIGMA STAB. knee prosthesis in primary arthrosisin 1999-2003, 90-100% scale
90 %
91 %
92 %
93 %
94 %
95 %
96 %
97 %
98 %
99 %
100 %
0 1 2 3 4 5 6 7 8 9 10 11 12 13 14 15Years
Surv
ival
%
99-03, N=574
CI_MAX
CI_MIN

126
Figure K27c. P.F.C SIGMA STAB. knee prosthesis, annual use in primary arthrosis in 1998 - 2003
0
100
200
300
400
500
1998 1999 2000 2001 2002 2003Years
Num
ber o
f ope
ratio
ns
Figure K27d. P.F.C SIGMA STAB. knee prosthesis, age and gender, all indications in 1998-2003
0
50
100
150
200
250
300
0-29 30-39 40-49 50-59 60-69 70-79 80-Age
Num
ber o
f ope
ratio
ns
MALEFEMALE

127
Figure K27e. P.F.C SIGMA STAB. knee prosthesis, indications for operations in 1998- 2003
0
100
200
300
400
500
1998 1999 2000 2001 2002 2003Years
Num
ber o
f ope
ratio
ns
Other revision
Girdlestone
Change of prosthesis
Other illness
Other arthritides
Rheumatoid arthritis
Secondary arthrosis
Primary arthrosis
Figure K27f. P.F.C SIGMA STAB. knee prosthesis, indications for first revisionin 1998 - 2003
0
5
10
15
20
25
30
35
40
45
50
1998 1999 2000 2001 2002 2003Years
Num
ber o
f ope
ratio
ns
Patellar complication
Fracture of prosth. + other reason
Malposition of prosthesis
Luxation
Infection
Loosening of tibial component
Loosening of femoral component
Loosening of both components

128
Figure K27g. P.F.C SIGMA STAB. knee prosthesis, survival of annually installed prostheses at the end of 2003
0 %
10 %
20 %
30 %
40 %
50 %
60 %
70 %
80 %
90 %
100 %
1998 1999 2000 2001 2002 2003Years
In follow-up, N = 691
Dead, N =30
Revised, N =12

129
Figure K31. The most common bone cements used in Knee Arthroplasties in 1996-2003
0 %
10 %
20 %
30 %
40 %
50 %
60 %
70 %
80 %
90 %
100 %
1996 1997 1998 1999 2000 2001 2002 2003Operation years
Prop
ortio
n of
cem
ents
use
d OTHER CEMENTS
CMW 2
PALACOS R
CMW 3G
PALACOS
SIMPLEX P
SIMPLEX
SIMPLEX ANTIB
PALACOS C
Figure K32. The most common antibiotic prophylaxis used in Knee Primary operations in 1996-2003
0 %
10 %
20 %
30 %
40 %
50 %
60 %
70 %
80 %
90 %
100 %
1996 1997 1998 1999 2000 2001 2002 2003Operation years
Prop
ortio
n of
ant
ibio
tics
used OTHER ANTIBIOTICS
CLAFORANROCEPHALINDICLOCILDALACINSTAFLOCILEKVACILLINKEFURIONLIFUROXZINACEF
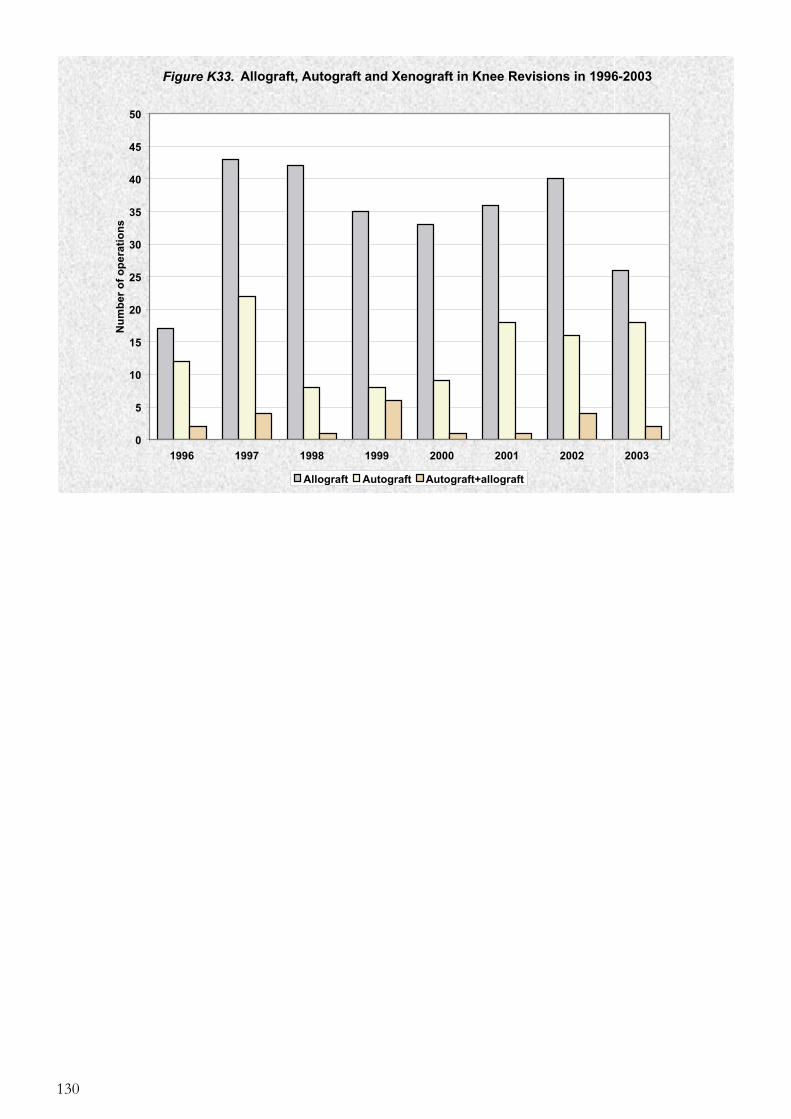
130
Figure K33. Allograft, Autograft and Xenograft in Knee Revisions in 1996-2003
0
5
10
15
20
25
30
35
40
45
50
1996 1997 1998 1999 2000 2001 2002 2003
Num
ber o
f ope
ratio
ns
Allograft Autograft Autograft+allograft

131
Figure O1a. Primary and revision arthroplasties of other joints, upper extremity in 1980 - 2003
0
20
40
60
80
100
120
140
160
180
200
220
240
260
280
30019
80
1981
1982
1983
1984
1985
1986
1987
1988
1989
1990
1991
1992
1993
1994
1995
1996
1997
1998
1999
2000
2001
2002
2003
Num
ber o
f ope
ratio
ns
Shoulder Mcp Elbow Other
Figure O1b. Primary and revision arthroplasties of other joints, lower extremity in 1980-2003
0
10
20
30
40
50
60
70
80
90
100
1980
1981
1982
1983
1984
1985
1986
1987
1988
1989
1990
1991
1992
1993
1994
1995
1996
1997
1998
1999
2000
2001
2002
2003
Num
ber o
f ope
ratio
ns
Femoropatellar joint only Ankle Mtp

132
Figure O2. Primary indications for arthroplasties of other joints in 1980-2003
0
100
200
300
400
500
600
70019
80
1981
1982
1983
1984
1985
1986
1987
1988
1989
1990
1991
1992
1993
1994
1995
1996
1997
1998
1999
2000
2001
2002
2003
Years
Num
ber o
f ope
ratio
ns
Other illness
Other arthritides
Rheumatoid arthritis
Secondary arthrosis
Primary arthrosis

133
Figure O3a. Indications for revision of other joints in 1993-2003
0
20
40
60
80
100
12019
93
1994
1995
1996
1997
1998
1999
2000
2001
2002
2003
Years
Num
ber o
f ope
ratio
ns Fracture of prosth. + other reason
Fracture of bone
Malposition of prosthesis
Luxation
Infection
Loosening of distal component
Loosening of proximal component
Loosening of both components
Figure O3b. Revision operations of other joints in 1980-2003
0
20
40
60
80
100
120
1980
1981
1982
1983
1984
1985
1986
1987
1988
1989
1990
1991
1992
1993
1994
1995
1996
1997
1998
1999
2000
2001
2002
2003
Years
Num
ber o
f ope
ratio
ns
Change of prosthesis
Remove of prosthesis
Other revision
Girdlestone

134
Figure O4. Previous operation year of first revision in other joints in 2003
0,93 0,93 0,93
4,635,56
2,783,70
4,63 4,63
9,2610,19
4,63
7,41
20,37
5,56
0,93
6,486,48
0
5
10
15
20
2519
86
1987
1988
1989
1990
1991
1992
1993
1994
1995
1996
1997
1998
1999
2000
2001
2002
2003
Operation year
% o
f rev
isio
ns (N
=108
;-86-
03)
Figure O5. Number of hospitals performing Elbow and Shoulder Arthroplasties in 1980-2003
1
3
1 12
1
43
5 56
56
89
23
27
25
11
14
11 1110 10
15
11
6
0
2
4
2 2
57
8 8
1011
8
10
13
17
19
21
25
22 22
20
0
5
10
15
20
25
30
1980
1981
1982
1983
1984
1985
1986
1987
1988
1989
1990
1991
1992
1993
1994
1995
1996
1997
1998
1999
2000
2001
2002
2003
Years
Num
ber o
f hos
pita
ls
Elbow Shoulder

135
Figure O6. Shoulder prosthesis in primary operations in 1989-2003, 50-100% scale
50 %
60 %
70 %
80 %
90 %
100 %
0 1 2 3 4 5 6 7 8 9 10 11 12 13 14 15Years
Surv
ival
%
89-93, N=28794-99, N=84099-03, N=1126CI_MAXCI_MIN
Figure O7. Elbow prosthesis in primary operations in 1989-2003, 50-100% scale
50 %
60 %
70 %
80 %
90 %
100 %
0 1 2 3 4 5 6 7 8 9 10 11 12 13 14 15Years
Surv
ival
%
89-93, N=33394-98, N=53199-03, N=452CI_MAXCI_MIN

136

137

138

139
Indentity number of patientDate of operationObject of operation
Reason for operation
Type of implanted prosthesis(femoral and acetabularcomponent)
-
1 Rheumatoid arthritis2 Other arthritis3 Primary arthrosis4 Congenital luxation
of the hip
5 Other illness**6 Change of prosthesis7 Removal of prosthesis8 Secondary arthrosis
9 Removal of previousprosthesis (Girdlestone)
0 Other revision(e.g. liner change)
1 Hip2 Knee3 Femoropatellar joint only4 Ankle5 Mtp
6 Shoulder7 Elbow8 Lunatum9 Scaphoideum10 Other construction **
11 Cmc12 Mcp13 Ip14 Jaw joint15 Other **
Joint 1 Right 2 Left
femur acetabulum*Brandname:
*
Type (Chrome, Titanium, Ceram. etc.)Cap 1 Fixed
2 ModularDiameter of cap ______ mm
National Agency for MedicinesImplant Register/EndoprosthesesP.O. Box 5500301 HELSINKI
NOTIFICATION TO THE IMPLANT REGISTERORTOPAEDIC ENDOPROSTHESES
Hospital
Type of prosthesis to be changedor removed, and date of previousoperation
Revision operation
Date
*
Fixation of the prosthesis
Name and telephone number ofperson in chargeComments **
Primary complications
Bone graft
Prophylactic antimicrobialdrug therapy
Brand of cement used
0 Anaesthetic complication1 Infection2 Haematoma3 Tromboembolism4 Dissatisfactory position of prosthesis
malposition
5 Luxation6 Nerve injury7 Other primary complication **8 Death9 Wound necrosis
CementedCementless
Hip prosthesis
femur12
acetabulum34
Knee prosthesis
femur56
tibia78
Patellarcomponentimplanted
910
Otherprosthesis
1112
Method of cementation1 Ordinary 2 Pressurized
Method of mixing cement2 Centrifuge1 Ordinary 3 Vacuum
BrandnameAntimicrobial 2 No1 Yes
femur acetabulum*
2 allograft1 autograft 3 xenograft
Brandname:
Reason for revision:1 Loosening (prox.comp.)2 Loosening (dist. comp.)3 Infection4 Luxation5 Malposition of prosthesis
6 Fracture of bone7 Fracture of prosthesis9 Patellar complication8 Other reason,
please specify **
Brandname
Pleace attach the prosthesis stickers on the reverse side !

140
HOW TO COMPLETE THE NOTIFICATION
Please fill in the notification legibly by hand in print.
Hospital is indicated by giving the numerical code of the hospital
The identity number of the patient must be given in full.
Enter the date of operation in day, month, year order.
Object of operation. Please tick the box indicating the side and joint in question, for example the right hip.Provide additional information on items 10 and 15 under Comments.
Please choose one alternative only in the section Reason for operation.
In the section Type of prosthesis, please use the general brand name of the implanted prosthesis forboth the femoral and acetabular components. In the event that a combination of components from two typesof prosthesis has been used for the hip prosthesis, enter the femoral component before the acetabularcomponent. The easiest way to indicate the type of prosthesis used is to attach the surplus stickers from the prosthesis package, if not needed for the case record on the reverse side of the form.(This also enables the use of the bar code.)
Revision operationWhen a revision operation is performed on a previously implanted endoprosthesis, indicate the main complication necessitating the operation with a tick in the appropriate box.
Enter the brandname of the femoral or acetabular components of the prosthesis to be changed or removedin the section Type of prosthesis to be changed or removed. Enter the date of the previousoperation, if known.
Indicate the manner of fixation, cemented or cementless in the section Fixation of the prosthesis.Indicate the method of cementation and the mixing technique with a tick in the appropriate box. If a patellar component has been implanted with the knee prosthesis, please indicated the method of fixation.The brand name of the cement used should be given in full (e.g. Palacos C. Centamycin).
If a bone graft has been used, please indicate its type, i.e. autograft, allograft or xenograft, etc.
Enter the brand name of the microbial drug used in the section Prophylactic microbial medication.
For the purposes of this notification, a primary complication refers to a post-operative complicationdiagnosed in the patient before his discharge from hospital. Please report complications diagnosedin a patient after his discharge on a separate form entitled NOTIFICATION TO THE IMPLANTREGISTER; LONG-TERM COMPLICATIONS.
Enter a tick in box 8, if the patient died while in hospital.
Enter the name and telephone number of the person filling the form in the section Person in charge, in case further details are needed.
CommentsIf the alternatives given in the notification are not applicable to the case in question, or additionalinformation is required, supply such information under this heading or on a separate sheet.

141
National Agency for MedicinesImplant Register/EndoprosthesesP.O. Box 5500301 HELSINKI
NOTIFICATION TO THE IMPLANT REGISTERLONG-TERM COMPLICATIONS
Joint 1 Right 2 Left
-Indentity number of patient
Date of operation
Object of operation
Type of implanted prosthesis(femoral and acetabularcomponent) femur acetabulum
Brandname:
1 Hip2 Knee3 Femoropatellar joint only4 Ankle5 Mtp
6 Shoulder7 Elbow8 Lunatum9 Scaphoideum10 Other construction **
11 Cmc12 Mcp13 Ip14 Jaw joint15 Other **
Notifying unit andtelephone
Comments *
Long-term complications Date of diagnosis of long-term complication
Signature
1 Infection2 Luxation3 Wear of articulated parts4 Breakage of prosthesis5 Other, please specify

142
HOW TO COMPLETE THE NOTIFICATION
Please fill in the notification legibly by hand in print.
Hospital is indicated by giving the numerical code of the hospital.
The identity number of the patient must be given in full.
Enter the date of operation in day, month, year order.
Object of operation. Please tick the box indicating the side and joint in question, for example the right hip.Provide additional information on items 10 and 15 under Comments.
In the section Type of prosthesis, please use the general brand name of the implanted prosthesis for both thefemoral and acetabular components. In the event that a combination of components from two types of prosthesishas been used for the hip prosthesis, mentioned the femoral component before the acetabular component.
Long-term complication:Please report complications arising in a patient after his discharge from hospital as follows:Infection when confirmed.Luxation when ascertained for the first time. Repeated luxations need not be notified.Wear of the articulating parts (e.g. polyethylene, ceramics, metal).Fracture of prosthesis (i.e. endurance failure of metal, breakage of ceramic parts, rupture of silicone.)
Do not report aseptic loosening as a complication.
Enter the name of the unit diagnosing the long-term complication in section Notifying unit. Sign the notificationand enter a telephone number for further enquiries.
CommentsUse this section, if the alternatives given in the notification are not applicable to a particular case, or additionaldetails are required.