The 1997-98 Report of Degrees Awarded by the … 1997-98 Report of Degrees Awarded by the University...
21
The 1997-98 Report of Degrees Awarded by the University of Missouri P&B 98-23 Planning & Budget Analytical Studies 104 University Hall University of Missouri - System Dr. Steve Chatman Director of Analytical Studies University of Missouri System September 1998 [email protected] 573-882-3400 http://www.system.missouri.edu/planning
-
Upload
vuongkhuong -
Category
Documents
-
view
214 -
download
0
Transcript of The 1997-98 Report of Degrees Awarded by the … 1997-98 Report of Degrees Awarded by the University...
The 1997-98 Report of Degrees Awarded by the University of Missouri
P&B 98-23
Planning & BudgetAnalytical Studies
104 University HallUniversity of Missouri - System
Dr. Steve ChatmanDirector of Analytical StudiesUniversity of Missouri System
September 1998
http://www.system.missouri.edu/planning

The 1997-98 Report of Degrees Awarded by the University of Missouri
This report discusses the annual number of degrees awarded by the University of MissouriSystem from fiscal year 1978-79 (FY79) through fiscal year 1997-98 (FY98). The figures andtables of this report display the distribution of awards by campus and level (Table 1), by campuscollege (Tables 2.1-2.4), and by campus college department (Tables 3.1-3.4). In addition, thelong-term trend of degrees awarded is shown graphically by campus (Figure 1) and by degreelevel within campus (Figure 2). Degrees awarded are reported by department in the accompanyingdocument Department Detail Summary. In all cases, academic degree programs that have movedfrom one unit to another and units that have moved from one school to another have beenreported as if they had always been where they are now. The official annual reporting period isfrom July 1 to June 30 of the following calendar year. For example, FY98 includes summer andfall graduates from 1997 and the spring graduates of 1998. The data tables of the report showpercentage annual change from FY97 to FY98 and FY98 relative to the prior 5-year and 10-yearaverages. Collectively, these statistics help to communicate whether recent change in productionis short- or long-term. Please note the axis scale range when considering graphs.
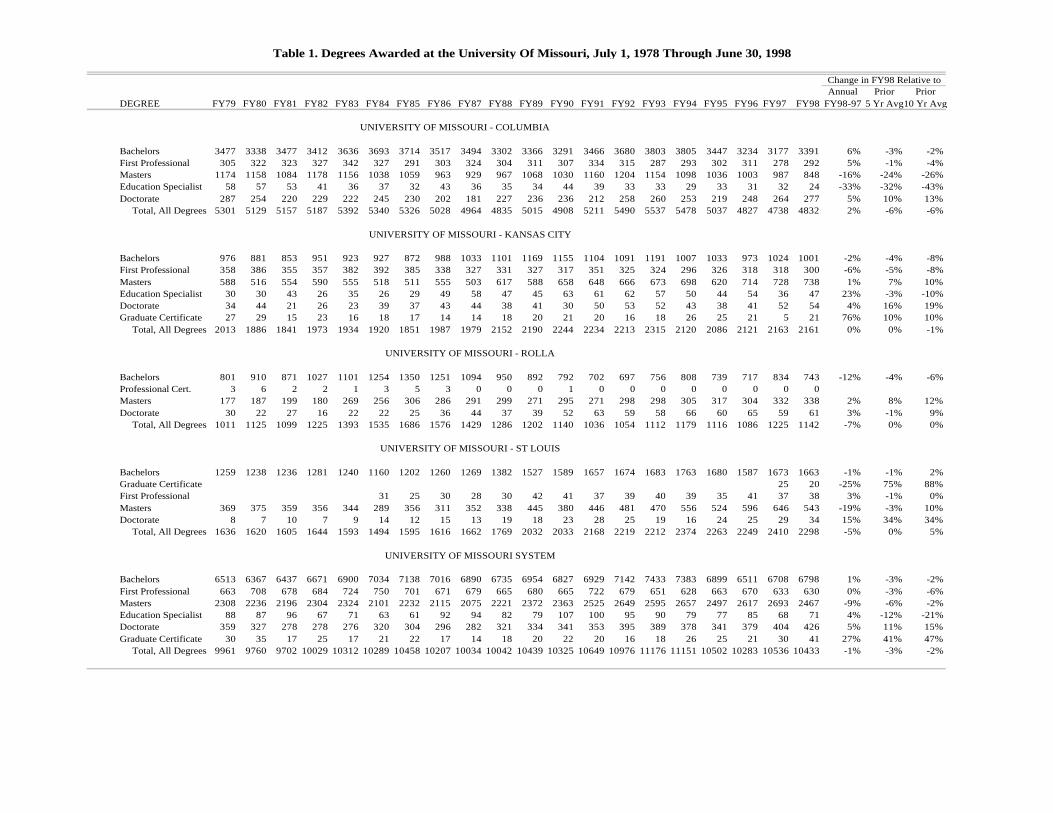
While the principal application of these data is to respond to inquiries about specificprograms, a 20-year perspective provides a unique opportunity to examine one very importantaspect of the University’s academic contribution. The past 20 years was a period when thetraditional pool of potential students declined by about 31% (Statistical Abstract for Missouri,Table A-9) even though the population of Missouri increased by about 10% (Statistical Abstractfor Missouri, A-6). The period also included two economic downturns when annual state taxrevenue increased very little, one near 1980 and the other in the early 1990s (Statistical Abstractfor Missouri, Table G-1). Given these changes and the many other changes that have occurred inMissouri over the most recent 20 years, the overall stability of number of degrees awarded isremarkable. In FY79, the University of Missouri awarded 9,961 degrees and 20 years later, it awarded 10,433. These endpoints are relatively close in size to the 20-year annual average of10,363. Said another way, from a high in FY93 (11,176) to a low in FY81 (9,702), the range wasonly 1,474 degrees, 661 below the average to 813 above. In comparison with the prior 5- and 10-year periods, overall degree production in FY98 was less, but within 3%.
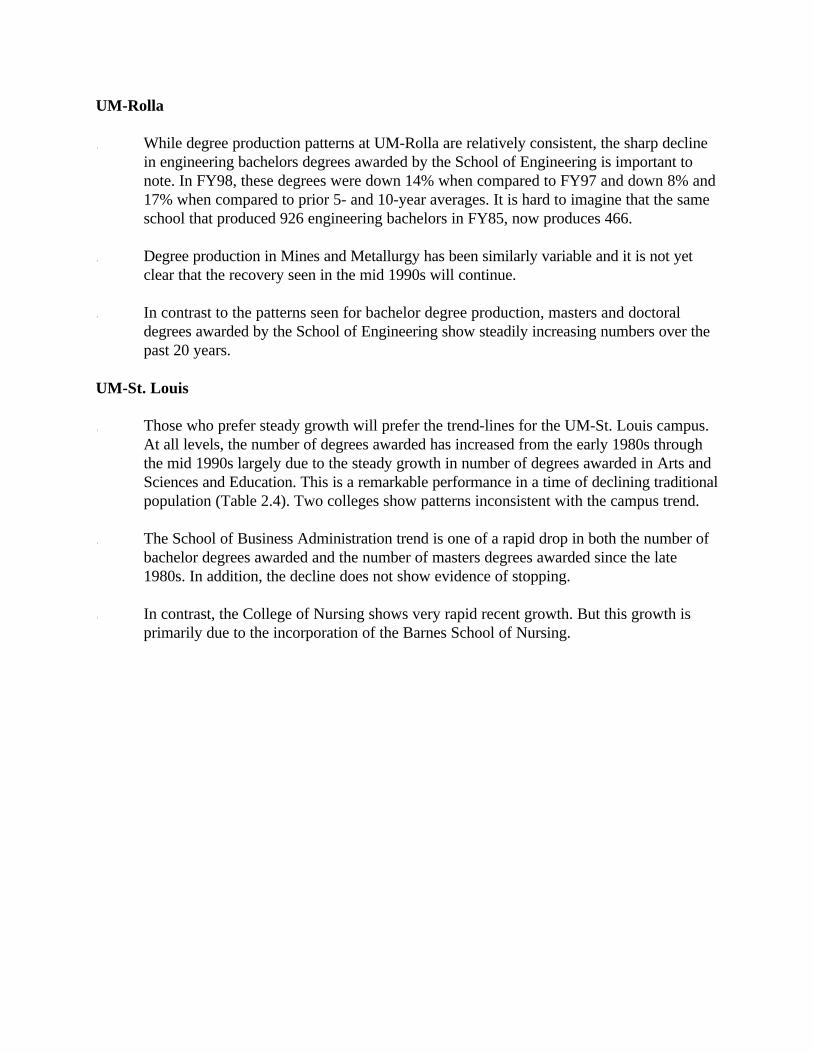
The Figure 1 charts show that all campuses have managed to generally maintain degreeproduction levels over a 20 year period when there was a very sharp decline in number oftraditional students.
On the other hand, the plot of degrees awarded over time is fairly irregular, showing moreannual variation in production than should probably be expected of a well definedenrollment management plan. Perhaps efforts to decrease annual variation should beconsidered.
When the System’s pattern of ups and downs without clear overall increase or decrease, isviewed in terms of its campus components, several features become clear (see Figure 1).
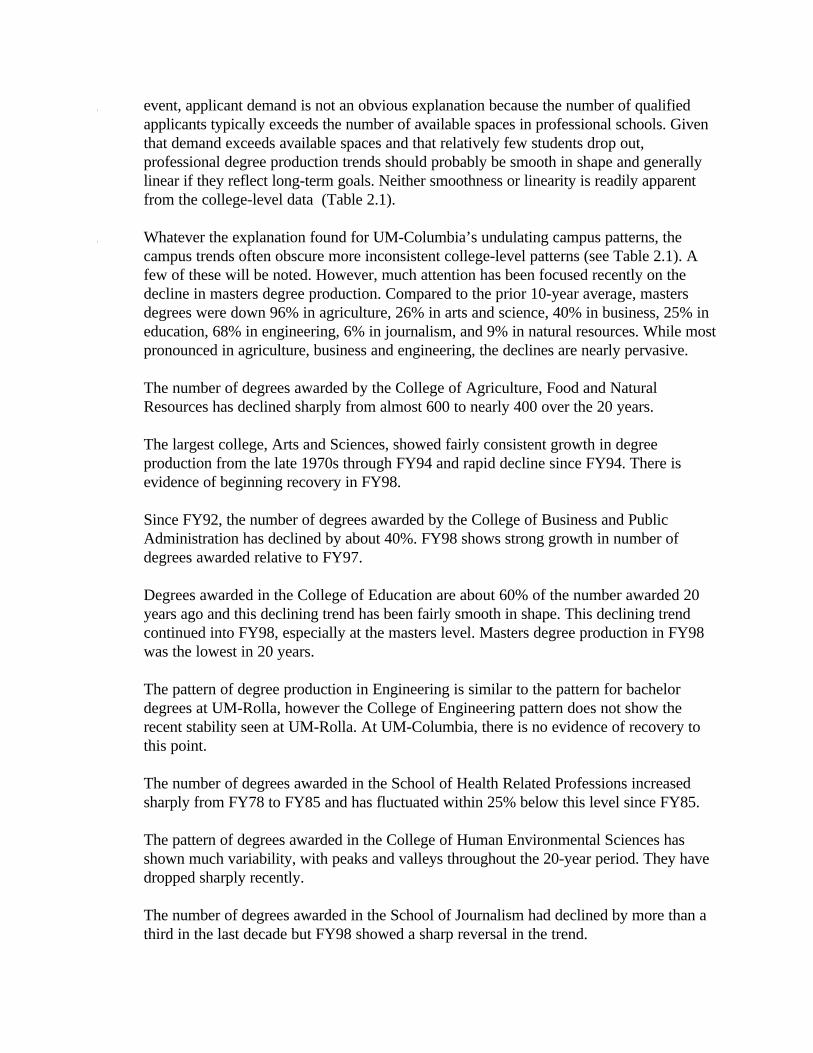
While the overall pattern of annual degrees awarded by UM-Columbia is fairly flat, annualchange has been surprisingly erratic and recent history shows beginning recovery from asharply declining trend. In other words, the 1-year change is positive, but comparisons to5- and 10-year averages are negative.
The trend of annual number of degrees awarded by UM-Kansas City is fairly flat and inFY98 is within about 150 of the number awarded in FY79. Even comparison of a singleyear’s degree production (FY98) with the prior year and prior 5- and prior 10-yearaverages, shows little to no change.
Degrees awarded by UM-Rolla show a relatively smooth pattern of increase throughFY85, a smooth declining pattern through FY91, and a fairly stable pattern from FY91through FY98. Annual change showed sharp decline in FY98, but FY98 was at the 5- and10-year averages. Therefore, degree production was very stable given a longerperspective.
The one campus with clear and consistent long-term growth in number of degreesawarded is UM-St. Louis. From a low of 1,494 in FY84, the number of degrees awardedannually has steadily increased to 2,298 in FY98 (54%). There was some drop-off in FY98as a result of an almost 20% drop in number of masters degrees awarded.
The pattern of degrees awarded by level within campus is interesting and in some casescounterintuitive (see Figure 2). Some of these patterns are discussed below.
UM-Columbia
The UM-Columbia campus is the largest campus of the University system and therefore,the recent sharp decline in number of bachelor and masters degrees awarded may be ofspecial concern. The bachelor degree line shows beginning recovery in FY98, but themasters degree line shows even sharper decline in FY98. While slightly below 5- and 10-year averages, bachelor degrees did increase by 6% from FY97 to FY98. On the otherhand, masters degrees were down 16% in 1-year and down about 25% compared to 5-and 10-year averages.
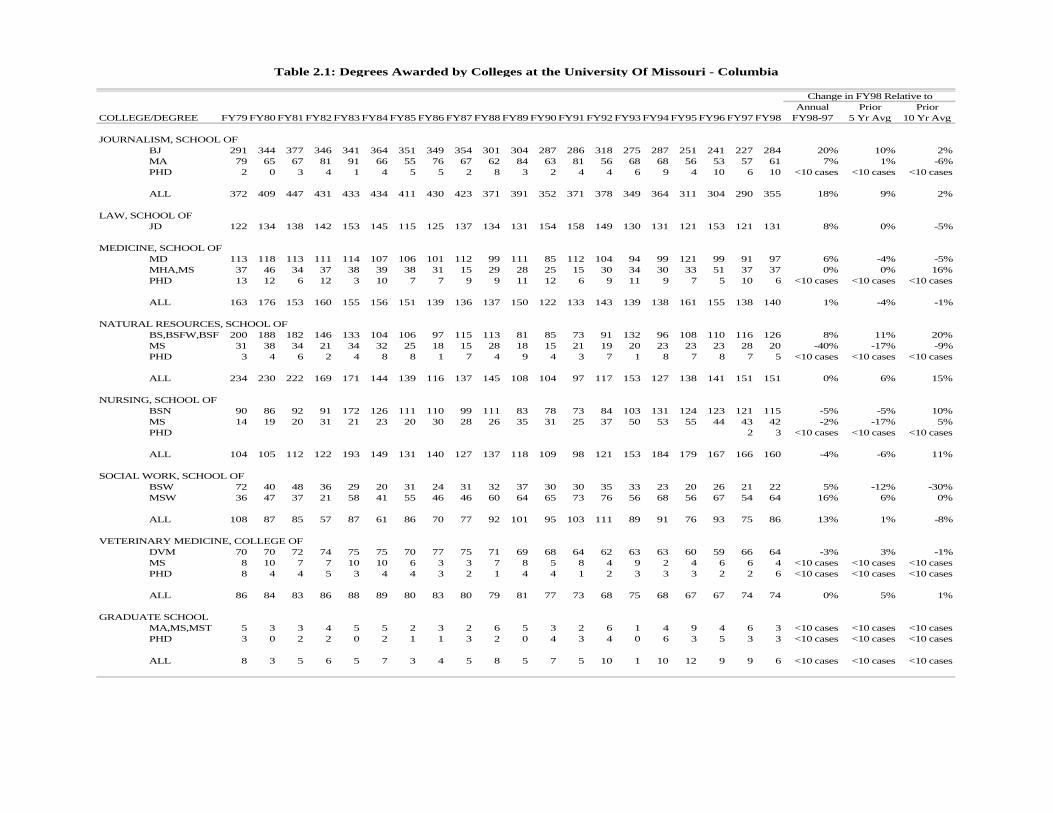
Unlike bachelor, masters and doctoral degree production that might reasonably vary withthe size of the traditional college-going population, first professional degree production(e.g., doctors of medicine, law and veterinary medicine) would seem to be more clearlydependent upon total population. Total Missouri population has increased by 10% overthis 20-year period and first professional degrees might have been expected to increaseaccordingly. That has not been the case. Either the demand has changed because ofchanges in the professions, the admitted classes are smaller because of increasedstandards, or enrollment and degree production is a function of some unknown. In any
event, applicant demand is not an obvious explanation because the number of qualifiedapplicants typically exceeds the number of available spaces in professional schools. Giventhat demand exceeds available spaces and that relatively few students drop out,professional degree production trends should probably be smooth in shape and generallylinear if they reflect long-term goals. Neither smoothness or linearity is readily apparentfrom the college-level data (Table 2.1).
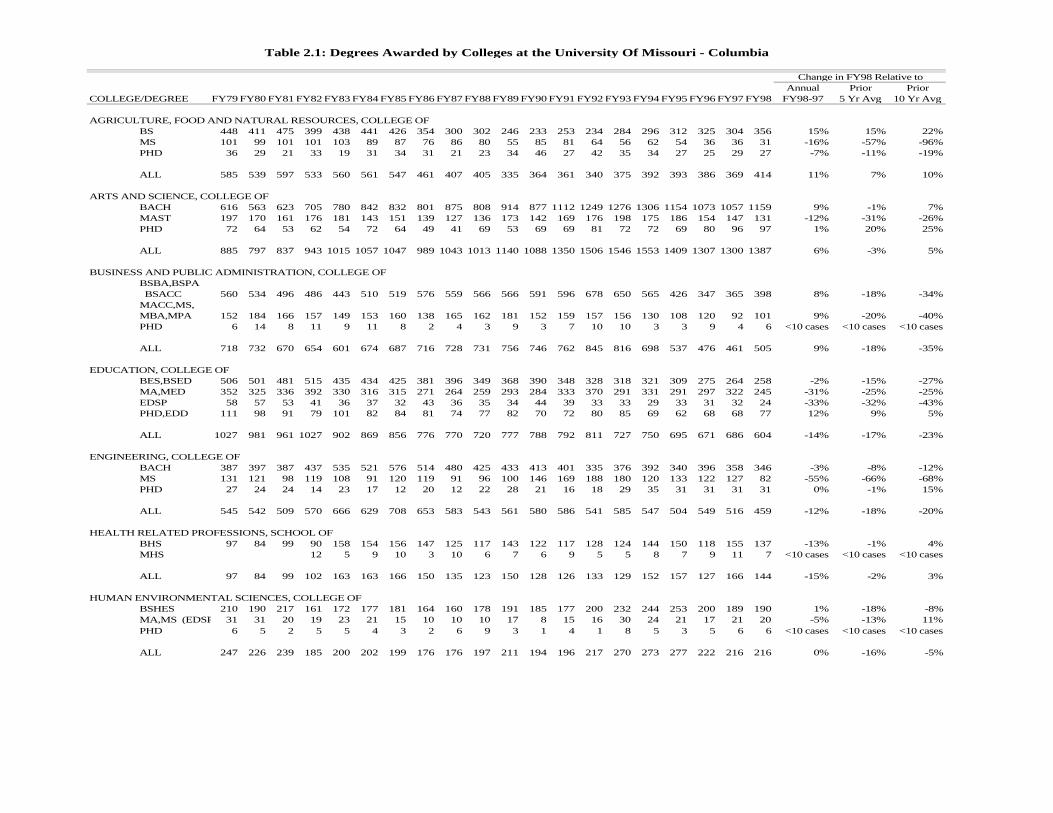
Whatever the explanation found for UM-Columbia’s undulating campus patterns, thecampus trends often obscure more inconsistent college-level patterns (see Table 2.1). Afew of these will be noted. However, much attention has been focused recently on thedecline in masters degree production. Compared to the prior 10-year average, mastersdegrees were down 96% in agriculture, 26% in arts and science, 40% in business, 25% ineducation, 68% in engineering, 6% in journalism, and 9% in natural resources. While mostpronounced in agriculture, business and engineering, the declines are nearly pervasive.
The number of degrees awarded by the College of Agriculture, Food and NaturalResources has declined sharply from almost 600 to nearly 400 over the 20 years.
The largest college, Arts and Sciences, showed fairly consistent growth in degreeproduction from the late 1970s through FY94 and rapid decline since FY94. There isevidence of beginning recovery in FY98.
Since FY92, the number of degrees awarded by the College of Business and PublicAdministration has declined by about 40%. FY98 shows strong growth in number ofdegrees awarded relative to FY97.
Degrees awarded in the College of Education are about 60% of the number awarded 20years ago and this declining trend has been fairly smooth in shape. This declining trendcontinued into FY98, especially at the masters level. Masters degree production in FY98was the lowest in 20 years.
The pattern of degree production in Engineering is similar to the pattern for bachelordegrees at UM-Rolla, however the College of Engineering pattern does not show therecent stability seen at UM-Rolla. At UM-Columbia, there is no evidence of recovery tothis point.
The number of degrees awarded in the School of Health Related Professions increasedsharply from FY78 to FY85 and has fluctuated within 25% below this level since FY85.
The pattern of degrees awarded in the College of Human Environmental Sciences hasshown much variability, with peaks and valleys throughout the 20-year period. They havedropped sharply recently.
The number of degrees awarded in the School of Journalism had declined by more than athird in the last decade but FY98 showed a sharp reversal in the trend.
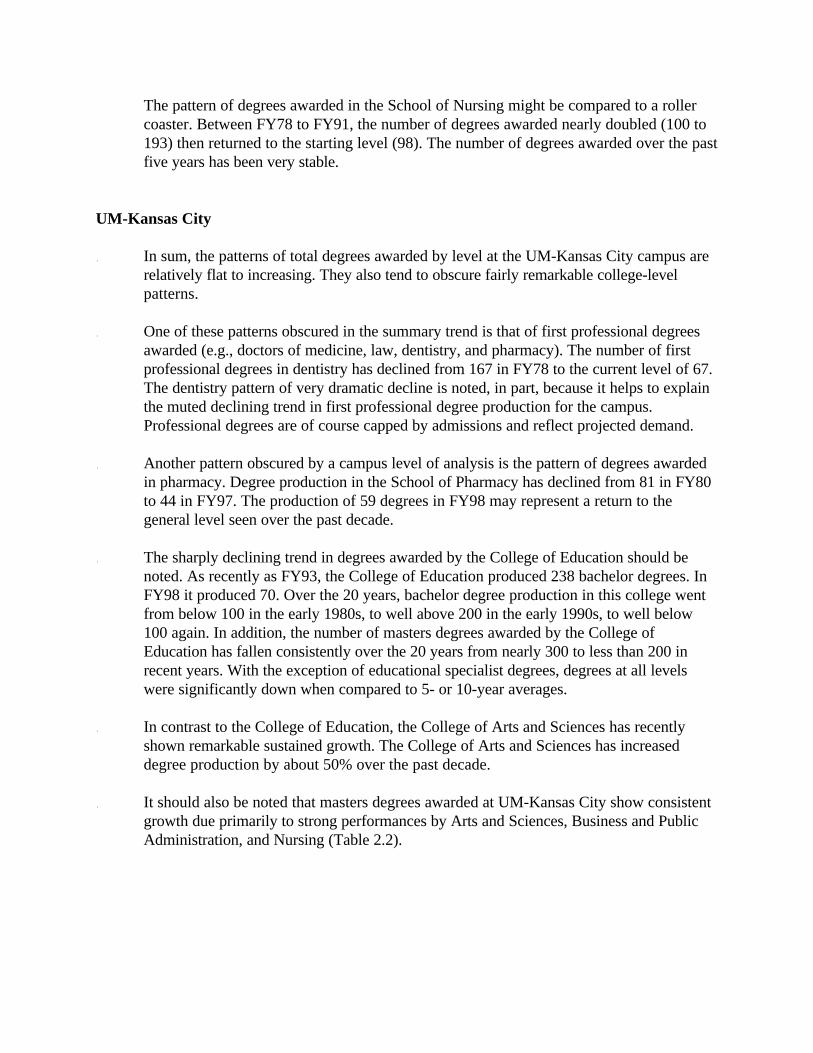
The pattern of degrees awarded in the School of Nursing might be compared to a rollercoaster. Between FY78 to FY91, the number of degrees awarded nearly doubled (100 to193) then returned to the starting level (98). The number of degrees awarded over the pastfive years has been very stable.
UM-Kansas City
In sum, the patterns of total degrees awarded by level at the UM-Kansas City campus arerelatively flat to increasing. They also tend to obscure fairly remarkable college-levelpatterns.
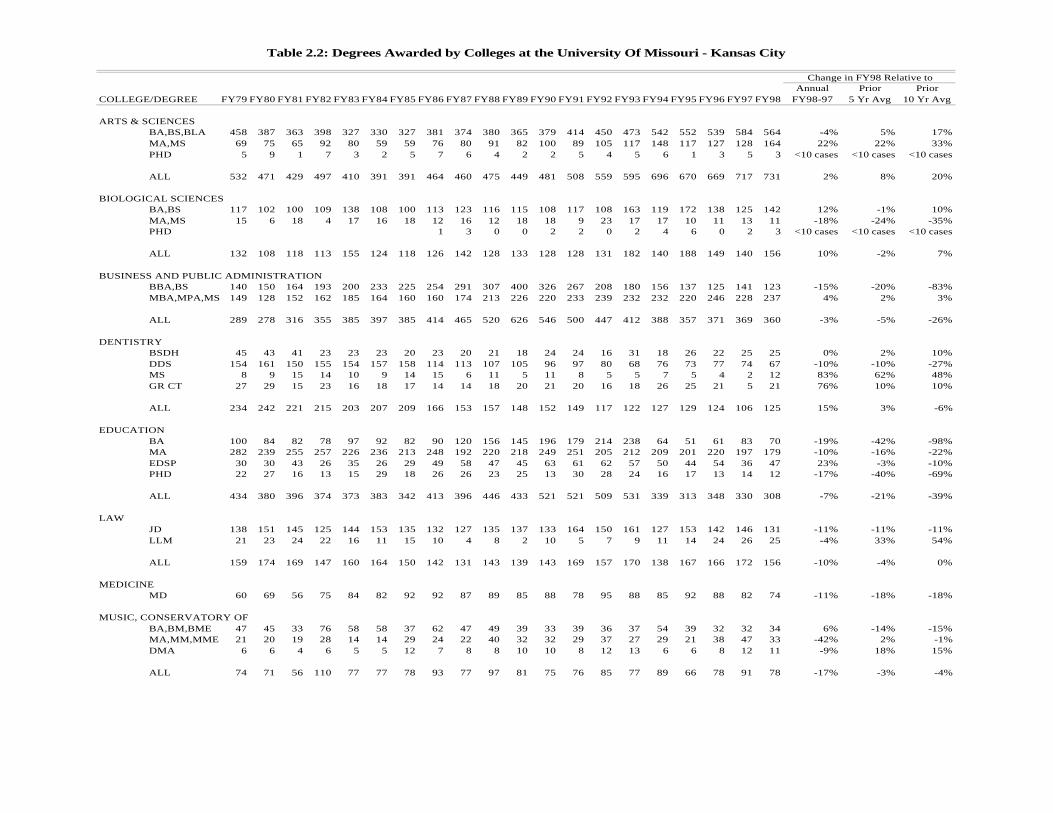
One of these patterns obscured in the summary trend is that of first professional degreesawarded (e.g., doctors of medicine, law, dentistry, and pharmacy). The number of firstprofessional degrees in dentistry has declined from 167 in FY78 to the current level of 67.The dentistry pattern of very dramatic decline is noted, in part, because it helps to explainthe muted declining trend in first professional degree production for the campus.Professional degrees are of course capped by admissions and reflect projected demand.
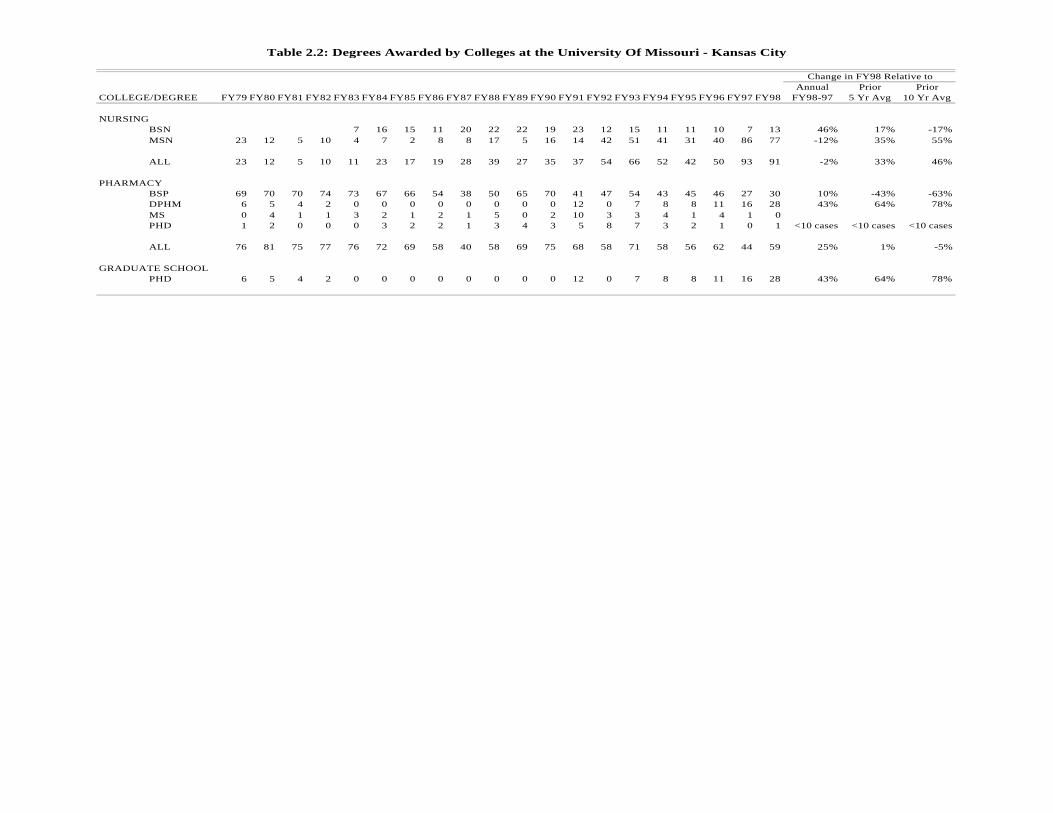
Another pattern obscured by a campus level of analysis is the pattern of degrees awardedin pharmacy. Degree production in the School of Pharmacy has declined from 81 in FY80to 44 in FY97. The production of 59 degrees in FY98 may represent a return to thegeneral level seen over the past decade.
The sharply declining trend in degrees awarded by the College of Education should benoted. As recently as FY93, the College of Education produced 238 bachelor degrees. InFY98 it produced 70. Over the 20 years, bachelor degree production in this college wentfrom below 100 in the early 1980s, to well above 200 in the early 1990s, to well below100 again. In addition, the number of masters degrees awarded by the College ofEducation has fallen consistently over the 20 years from nearly 300 to less than 200 inrecent years. With the exception of educational specialist degrees, degrees at all levelswere significantly down when compared to 5- or 10-year averages.
In contrast to the College of Education, the College of Arts and Sciences has recentlyshown remarkable sustained growth. The College of Arts and Sciences has increaseddegree production by about 50% over the past decade.
It should also be noted that masters degrees awarded at UM-Kansas City show consistentgrowth due primarily to strong performances by Arts and Sciences, Business and PublicAdministration, and Nursing (Table 2.2).
UM-Rolla
While degree production patterns at UM-Rolla are relatively consistent, the sharp declinein engineering bachelors degrees awarded by the School of Engineering is important tonote. In FY98, these degrees were down 14% when compared to FY97 and down 8% and17% when compared to prior 5- and 10-year averages. It is hard to imagine that the sameschool that produced 926 engineering bachelors in FY85, now produces 466.
Degree production in Mines and Metallurgy has been similarly variable and it is not yetclear that the recovery seen in the mid 1990s will continue.
In contrast to the patterns seen for bachelor degree production, masters and doctoraldegrees awarded by the School of Engineering show steadily increasing numbers over thepast 20 years.
UM-St. Louis
Those who prefer steady growth will prefer the trend-lines for the UM-St. Louis campus.At all levels, the number of degrees awarded has increased from the early 1980s throughthe mid 1990s largely due to the steady growth in number of degrees awarded in Arts andSciences and Education. This is a remarkable performance in a time of declining traditionalpopulation (Table 2.4). Two colleges show patterns inconsistent with the campus trend.
The School of Business Administration trend is one of a rapid drop in both the number of
bachelor degrees awarded and the number of masters degrees awarded since the late1980s. In addition, the decline does not show evidence of stopping.
In contrast, the College of Nursing shows very rapid recent growth. But this growth isprimarily due to the incorporation of the Barnes School of Nursing.
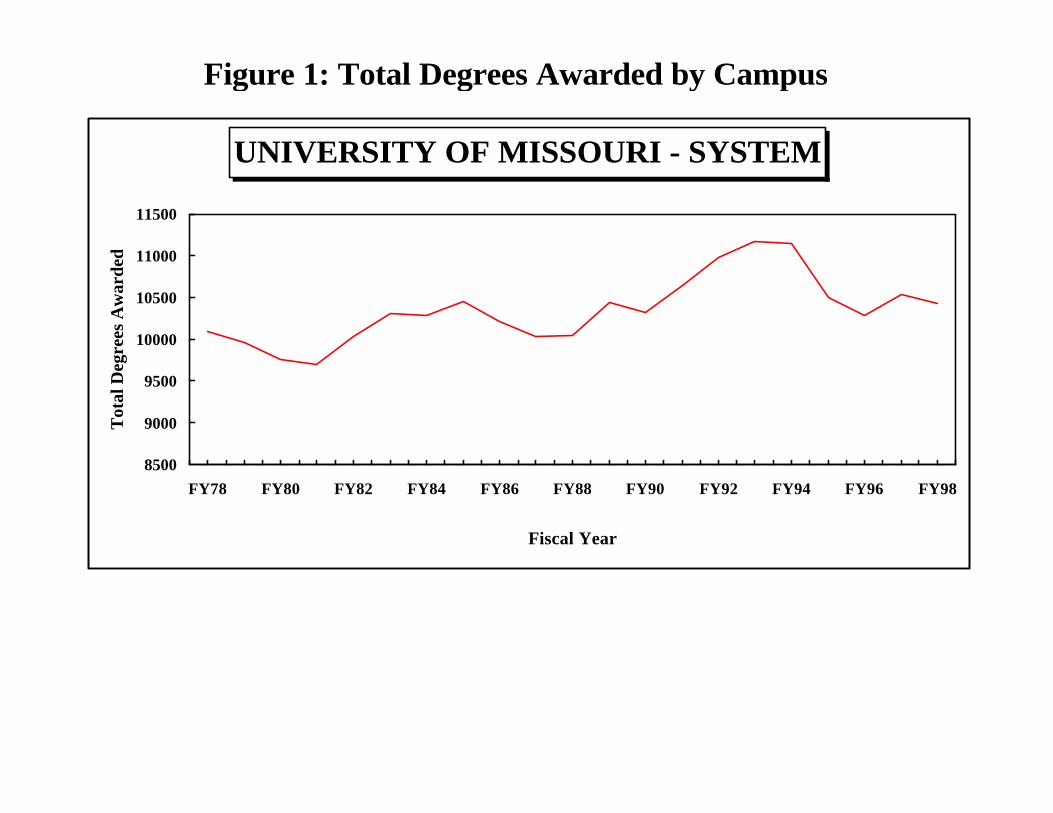
Figure 1: Total Degrees Awarded by Campus
UNIVERSITY OF MISSOURI - SYSTEM
8500
9000
9500
10000
10500
11000
11500
FY78 FY80 FY82 FY84 FY86 FY88 FY90 FY92 FY94 FY96 FY98
Fiscal Year
Tot
al D
egre
es A
war
ded

UNIVERSITY OF MISSOURI - KANSAS CITY
1400
1500
1600
1700
1800
1900
2000
2100
2200
2300
2400
FY78 FY80 FY82 FY84 FY86 FY88 FY90 FY92 FY94 FY96 FY98
Fiscal Year
To
tal
Deg
rees
Aw
ard
ed
UNIVERSITY OF MISSOURI - COLUMBIA
4200
4400
4600
4800
5000
5200
5400
5600
FY78 FY80 FY82 FY84 FY86 FY88 FY90 FY92 FY94 FY96 FY98
Fiscal Year
Tota
l D
egre
es A
ward
ed
Figure 1: Total Degrees Awarded by Campus
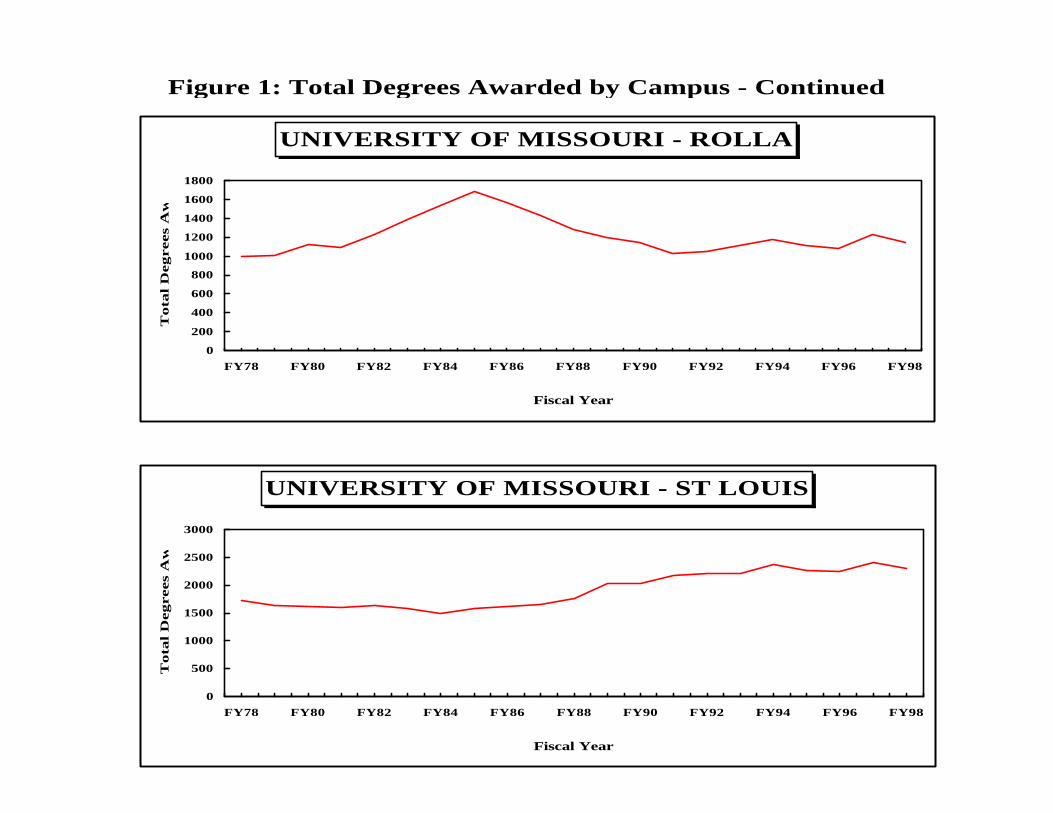
Figure 1: Total Degrees Awarded by Campus - Continued
UNIVERSITY OF MISSOURI - ROLLA
0
200
400
600
800
1000
1200
1400
1600
1800
FY78 FY80 FY82 FY84 FY86 FY88 FY90 FY92 FY94 FY96 FY98
Fiscal Year
Tota
l D
egrees
Aw
ard
ed
UNIVERSITY OF MISSOURI - ST LOUIS
0
500
1000
1500
2000
2500
3000
FY78 FY80 FY82 FY84 FY86 FY88 FY90 FY92 FY94 FY96 FY98
Fiscal Year
Tota
l D
eg
rees
Aw
ard
ed
Figure 2: Degrees Awarded by Campus and Degree Level
UNIVERSITY OF MISSOURI SYSTEM
Bachelor Degrees
5800
6000
6200
6400
6600
6800
7000
7200
7400
7600
FY78 FY81 FY84 FY87 FY90 FY93 FY96
Masters Degrees
1600
1800
2000
2200
2400
2600
2800
FY78 FY81 FY84 FY87 FY90 FY93 FY96
First Professional Degrees
560580600620640660680700720740760
FY78 FY81 FY84 FY87 FY90 FY93 FY96
Doctoral Degrees
150
200
250
300
350
400
450
FY78 FY81 FY84 FY87 FY90 FY93 FY96
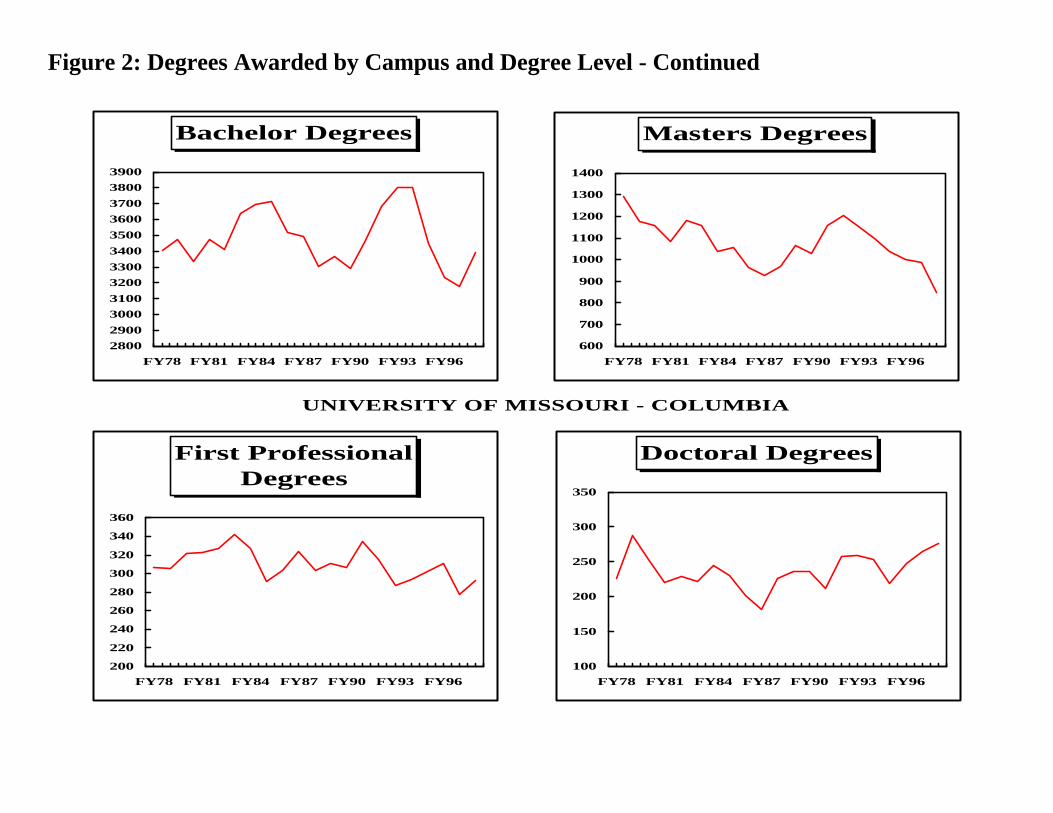
Figure 2: Degrees Awarded by Campus and Degree Level - Continued
UNIVERSITY OF MISSOURI - COLUMBIA
Masters Degrees
600
700
800
900
1000
1100
1200
1300
1400
FY78 FY81 FY84 FY87 FY90 FY93 FY96
Doctoral Degrees
100
150
200
250
300
350
FY78 FY81 FY84 FY87 FY90 FY93 FY96
Bachelor Degrees
2800
2900
3000
3100
3200
3300
3400
3500
3600
3700
3800
3900
FY78 FY81 FY84 FY87 FY90 FY93 FY96
First Professional Degrees
200
220
240
260
280
300
320
340
360
FY78 FY81 FY84 FY87 FY90 FY93 FY96

Figure 2: Degrees Awarded by Campus and Degree Level - Continued
UNIVERSITY OF MISSOURI - KANSAS CITY
Masters Degrees
400
450
500
550
600
650
700
750
800
FY78 FY81 FY84 FY87 FY90 FY93 FY96
First Professional Degrees
200
250
300
350
400
450
FY78 FY81 FY84 FY87 FY90 FY93 FY96
Doctoral Degrees
0
10
20
30
40
50
60
70
FY78 FY81 FY84 FY87 FY90 FY93 FY96
Bachelor Degrees
700
800
900
1000
1100
1200
1300
FY78 FY81 FY84 FY87 FY90 FY93 FY96
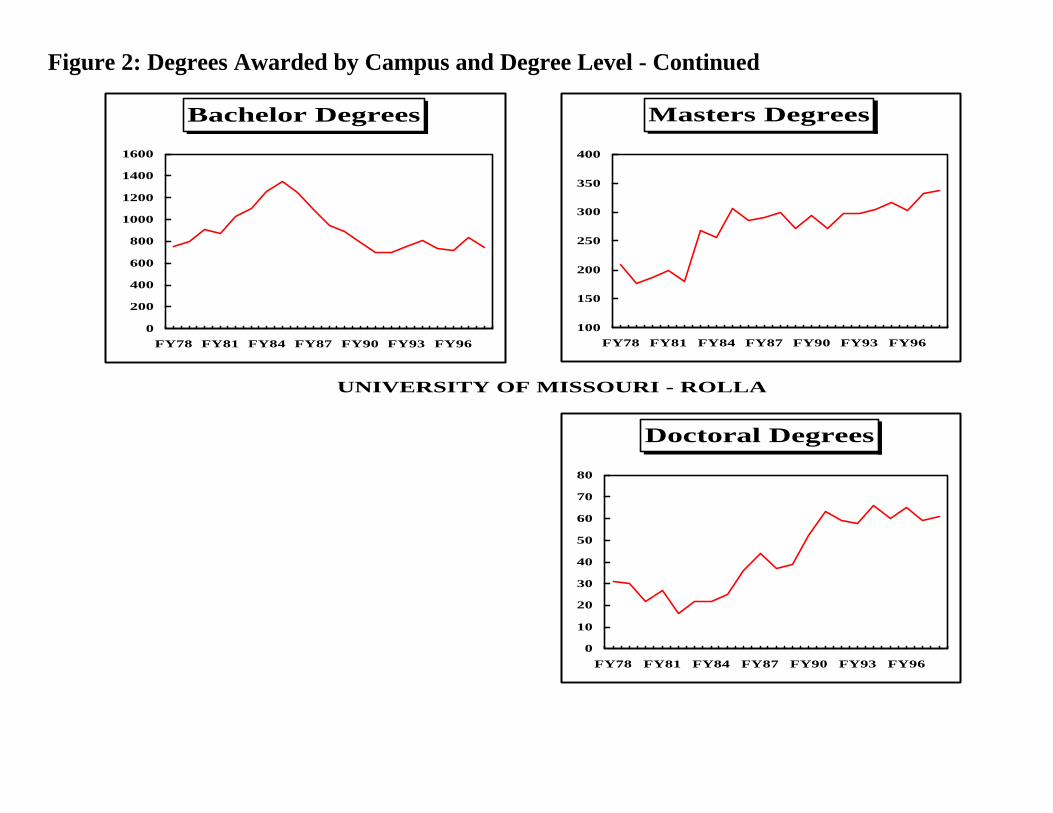
Figure 2: Degrees Awarded by Campus and Degree Level - Continued
UNIVERSITY OF MISSOURI - ROLLA
Bachelor Degrees
0
200
400
600
800
1000
1200
1400
1600
FY78 FY81 FY84 FY87 FY90 FY93 FY96
Masters Degrees
100
150
200
250
300
350
400
FY78 FY81 FY84 FY87 FY90 FY93 FY96
Doctoral Degrees
0
10
20
30
40
50
60
70
80
FY78 FY81 FY84 FY87 FY90 FY93 FY96
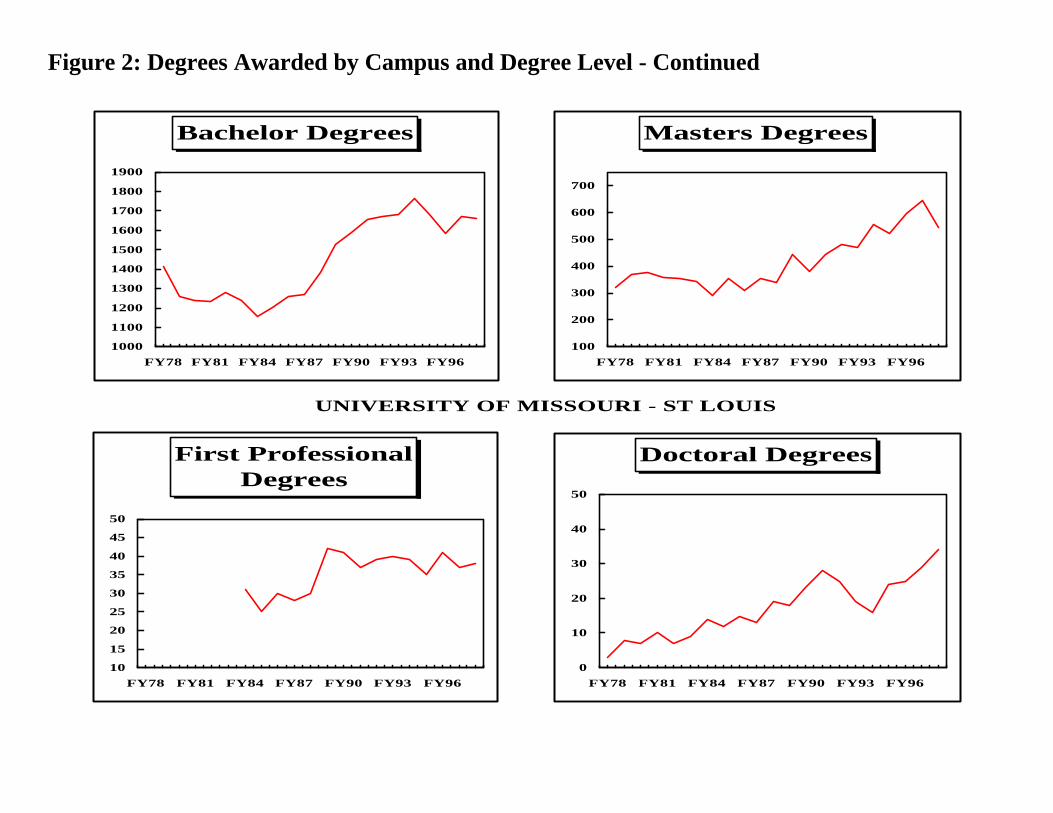
Figure 2: Degrees Awarded by Campus and Degree Level - Continued
UNIVERSITY OF MISSOURI - ST LOUIS
Bachelor Degrees
1000
1100
1200
1300
1400
1500
1600
1700
1800
1900
FY78 FY81 FY84 FY87 FY90 FY93 FY96
Masters Degrees
100
200
300
400
500
600
700
FY78 FY81 FY84 FY87 FY90 FY93 FY96
First Professional Degrees
10
15
20
25
30
35
40
45
50
FY78 FY81 FY84 FY87 FY90 FY93 FY96
Doctoral Degrees
0
10
20
30
40
50
FY78 FY81 FY84 FY87 FY90 FY93 FY96
Annual Prior PriorDEGREE FY79 FY80 FY81 FY82 FY83 FY84 FY85 FY86 FY87 FY88 FY89 FY90 FY91 FY92 FY93 FY94 FY95 FY96 FY97 FY98 FY98-97 5 Yr Avg10 Yr Avg
UNIVERSITY OF MISSOURI - COLUMBIA
Bachelors 3477 3338 3477 3412 3636 3693 3714 3517 3494 3302 3366 3291 3466 3680 3803 3805 3447 3234 3177 3391 6% -3% -2%First Professional 305 322 323 327 342 327 291 303 324 304 311 307 334 315 287 293 302 311 278 292 5% -1% -4%Masters 1174 1158 1084 1178 1156 1038 1059 963 929 967 1068 1030 1160 1204 1154 1098 1036 1003 987 848 -16% -24% -26%Education Specialist 58 57 53 41 36 37 32 43 36 35 34 44 39 33 33 29 33 31 32 24 -33% -32% -43%Doctorate 287 254 220 229 222 245 230 202 181 227 236 236 212 258 260 253 219 248 264 277 5% 10% 13% Total, All Degrees 5301 5129 5157 5187 5392 5340 5326 5028 4964 4835 5015 4908 5211 5490 5537 5478 5037 4827 4738 4832 2% -6% -6%
UNIVERSITY OF MISSOURI - KANSAS CITY
Bachelors 976 881 853 951 923 927 872 988 1033 1101 1169 1155 1104 1091 1191 1007 1033 973 1024 1001 -2% -4% -8%First Professional 358 386 355 357 382 392 385 338 327 331 327 317 351 325 324 296 326 318 318 300 -6% -5% -8%Masters 588 516 554 590 555 518 511 555 503 617 588 658 648 666 673 698 620 714 728 738 1% 7% 10%Education Specialist 30 30 43 26 35 26 29 49 58 47 45 63 61 62 57 50 44 54 36 47 23% -3% -10%Doctorate 34 44 21 26 23 39 37 43 44 38 41 30 50 53 52 43 38 41 52 54 4% 16% 19%Graduate Certificate 27 29 15 23 16 18 17 14 14 18 20 21 20 16 18 26 25 21 5 21 76% 10% 10% Total, All Degrees 2013 1886 1841 1973 1934 1920 1851 1987 1979 2152 2190 2244 2234 2213 2315 2120 2086 2121 2163 2161 0% 0% -1%
UNIVERSITY OF MISSOURI - ROLLA
Bachelors 801 910 871 1027 1101 1254 1350 1251 1094 950 892 792 702 697 756 808 739 717 834 743 -12% -4% -6%Professional Cert. 3 6 2 2 1 3 5 3 0 0 0 1 0 0 0 0 0 0 0 0Masters 177 187 199 180 269 256 306 286 291 299 271 295 271 298 298 305 317 304 332 338 2% 8% 12%Doctorate 30 22 27 16 22 22 25 36 44 37 39 52 63 59 58 66 60 65 59 61 3% -1% 9% Total, All Degrees 1011 1125 1099 1225 1393 1535 1686 1576 1429 1286 1202 1140 1036 1054 1112 1179 1116 1086 1225 1142 -7% 0% 0%
UNIVERSITY OF MISSOURI - ST LOUIS
Bachelors 1259 1238 1236 1281 1240 1160 1202 1260 1269 1382 1527 1589 1657 1674 1683 1763 1680 1587 1673 1663 -1% -1% 2%Graduate Certificate 25 20 -25% 75% 88%First Professional 31 25 30 28 30 42 41 37 39 40 39 35 41 37 38 3% -1% 0%Masters 369 375 359 356 344 289 356 311 352 338 445 380 446 481 470 556 524 596 646 543 -19% -3% 10%Doctorate 8 7 10 7 9 14 12 15 13 19 18 23 28 25 19 16 24 25 29 34 15% 34% 34% Total, All Degrees 1636 1620 1605 1644 1593 1494 1595 1616 1662 1769 2032 2033 2168 2219 2212 2374 2263 2249 2410 2298 -5% 0% 5%
UNIVERSITY OF MISSOURI SYSTEM
Bachelors 6513 6367 6437 6671 6900 7034 7138 7016 6890 6735 6954 6827 6929 7142 7433 7383 6899 6511 6708 6798 1% -3% -2%First Professional 663 708 678 684 724 750 701 671 679 665 680 665 722 679 651 628 663 670 633 630 0% -3% -6%Masters 2308 2236 2196 2304 2324 2101 2232 2115 2075 2221 2372 2363 2525 2649 2595 2657 2497 2617 2693 2467 -9% -6% -2%Education Specialist 88 87 96 67 71 63 61 92 94 82 79 107 100 95 90 79 77 85 68 71 4% -12% -21%Doctorate 359 327 278 278 276 320 304 296 282 321 334 341 353 395 389 378 341 379 404 426 5% 11% 15%Graduate Certificate 30 35 17 25 17 21 22 17 14 18 20 22 20 16 18 26 25 21 30 41 27% 41% 47% Total, All Degrees 9961 9760 9702 10029 10312 10289 10458 10207 10034 10042 10439 10325 10649 10976 11176 11151 10502 10283 10536 10433 -1% -3% -2%
Change in FY98 Relative to
Table 1. Degrees Awarded at the University Of Missouri, July 1, 1978 Through June 30, 1998
Annual Prior PriorCOLLEGE/DEGREE FY79 FY80 FY81 FY82 FY83 FY84 FY85 FY86 FY87 FY88 FY89 FY90 FY91 FY92 FY93 FY94 FY95 FY96 FY97 FY98 FY98-97 5 Yr Avg 10 Yr Avg
AGRICULTURE, FOOD AND NATURAL RESOURCES, COLLEGE OFBS 448 411 475 399 438 441 426 354 300 302 246 233 253 234 284 296 312 325 304 356 15% 15% 22%MS 101 99 101 101 103 89 87 76 86 80 55 85 81 64 56 62 54 36 36 31 -16% -57% -96%PHD 36 29 21 33 19 31 34 31 21 23 34 46 27 42 35 34 27 25 29 27 -7% -11% -19%
ALL 585 539 597 533 560 561 547 461 407 405 335 364 361 340 375 392 393 386 369 414 11% 7% 10%
ARTS AND SCIENCE, COLLEGE OFBACH 616 563 623 705 780 842 832 801 875 808 914 877 1112 1249 1276 1306 1154 1073 1057 1159 9% -1% 7%MAST 197 170 161 176 181 143 151 139 127 136 173 142 169 176 198 175 186 154 147 131 -12% -31% -26%PHD 72 64 53 62 54 72 64 49 41 69 53 69 69 81 72 72 69 80 96 97 1% 20% 25%
ALL 885 797 837 943 1015 1057 1047 989 1043 1013 1140 1088 1350 1506 1546 1553 1409 1307 1300 1387 6% -3% 5%
BUSINESS AND PUBLIC ADMINISTRATION, COLLEGE OFBSBA,BSPA BSACC 560 534 496 486 443 510 519 576 559 566 566 591 596 678 650 565 426 347 365 398 8% -18% -34%MACC,MS,MBA,MPA 152 184 166 157 149 153 160 138 165 162 181 152 159 157 156 130 108 120 92 101 9% -20% -40%PHD 6 14 8 11 9 11 8 2 4 3 9 3 7 10 10 3 3 9 4 6 <10 cases <10 cases <10 cases
ALL 718 732 670 654 601 674 687 716 728 731 756 746 762 845 816 698 537 476 461 505 9% -18% -35%
EDUCATION, COLLEGE OFBES,BSED 506 501 481 515 435 434 425 381 396 349 368 390 348 328 318 321 309 275 264 258 -2% -15% -27%MA,MED 352 325 336 392 330 316 315 271 264 259 293 284 333 370 291 331 291 297 322 245 -31% -25% -25%EDSP 58 57 53 41 36 37 32 43 36 35 34 44 39 33 33 29 33 31 32 24 -33% -32% -43%PHD,EDD 111 98 91 79 101 82 84 81 74 77 82 70 72 80 85 69 62 68 68 77 12% 9% 5%
ALL 1027 981 961 1027 902 869 856 776 770 720 777 788 792 811 727 750 695 671 686 604 -14% -17% -23%
ENGINEERING, COLLEGE OFBACH 387 397 387 437 535 521 576 514 480 425 433 413 401 335 376 392 340 396 358 346 -3% -8% -12%MS 131 121 98 119 108 91 120 119 91 96 100 146 169 188 180 120 133 122 127 82 -55% -66% -68%PHD 27 24 24 14 23 17 12 20 12 22 28 21 16 18 29 35 31 31 31 31 0% -1% 15%
ALL 545 542 509 570 666 629 708 653 583 543 561 580 586 541 585 547 504 549 516 459 -12% -18% -20%
HEALTH RELATED PROFESSIONS, SCHOOL OFBHS 97 84 99 90 158 154 156 147 125 117 143 122 117 128 124 144 150 118 155 137 -13% -1% 4%MHS 12 5 9 10 3 10 6 7 6 9 5 5 8 7 9 11 7 <10 cases <10 cases <10 cases
ALL 97 84 99 102 163 163 166 150 135 123 150 128 126 133 129 152 157 127 166 144 -15% -2% 3%
HUMAN ENVIRONMENTAL SCIENCES, COLLEGE OFBSHES 210 190 217 161 172 177 181 164 160 178 191 185 177 200 232 244 253 200 189 190 1% -18% -8%MA,MS (EDSP) 31 31 20 19 23 21 15 10 10 10 17 8 15 16 30 24 21 17 21 20 -5% -13% 11%PHD 6 5 2 5 5 4 3 2 6 9 3 1 4 1 8 5 3 5 6 6 <10 cases <10 cases <10 cases
ALL 247 226 239 185 200 202 199 176 176 197 211 194 196 217 270 273 277 222 216 216 0% -16% -5%
Change in FY98 Relative to
Table 2.1: Degrees Awarded by Colleges at the University Of Missouri - Columbia
Annual Prior PriorCOLLEGE/DEGREE FY79 FY80 FY81 FY82 FY83 FY84 FY85 FY86 FY87 FY88 FY89 FY90 FY91 FY92 FY93 FY94 FY95 FY96 FY97 FY98 FY98-97 5 Yr Avg 10 Yr Avg
JOURNALISM, SCHOOL OFBJ 291 344 377 346 341 364 351 349 354 301 304 287 286 318 275 287 251 241 227 284 20% 10% 2%MA 79 65 67 81 91 66 55 76 67 62 84 63 81 56 68 68 56 53 57 61 7% 1% -6%PHD 2 0 3 4 1 4 5 5 2 8 3 2 4 4 6 9 4 10 6 10 <10 cases <10 cases <10 cases
ALL 372 409 447 431 433 434 411 430 423 371 391 352 371 378 349 364 311 304 290 355 18% 9% 2%
LAW, SCHOOL OFJD 122 134 138 142 153 145 115 125 137 134 131 154 158 149 130 131 121 153 121 131 8% 0% -5%
MEDICINE, SCHOOL OFMD 113 118 113 111 114 107 106 101 112 99 111 85 112 104 94 99 121 99 91 97 6% -4% -5%MHA,MS 37 46 34 37 38 39 38 31 15 29 28 25 15 30 34 30 33 51 37 37 0% 0% 16%PHD 13 12 6 12 3 10 7 7 9 9 11 12 6 9 11 9 7 5 10 6 <10 cases <10 cases <10 cases
ALL 163 176 153 160 155 156 151 139 136 137 150 122 133 143 139 138 161 155 138 140 1% -4% -1%
NATURAL RESOURCES, SCHOOL OFBS,BSFW,BSF 200 188 182 146 133 104 106 97 115 113 81 85 73 91 132 96 108 110 116 126 8% 11% 20%MS 31 38 34 21 34 32 25 18 15 28 18 15 21 19 20 23 23 23 28 20 -40% -17% -9%PHD 3 4 6 2 4 8 8 1 7 4 9 4 3 7 1 8 7 8 7 5 <10 cases <10 cases <10 cases
ALL 234 230 222 169 171 144 139 116 137 145 108 104 97 117 153 127 138 141 151 151 0% 6% 15%
NURSING, SCHOOL OFBSN 90 86 92 91 172 126 111 110 99 111 83 78 73 84 103 131 124 123 121 115 -5% -5% 10%MS 14 19 20 31 21 23 20 30 28 26 35 31 25 37 50 53 55 44 43 42 -2% -17% 5%PHD 2 3 <10 cases <10 cases <10 cases
ALL 104 105 112 122 193 149 131 140 127 137 118 109 98 121 153 184 179 167 166 160 -4% -6% 11%
SOCIAL WORK, SCHOOL OFBSW 72 40 48 36 29 20 31 24 31 32 37 30 30 35 33 23 20 26 21 22 5% -12% -30%MSW 36 47 37 21 58 41 55 46 46 60 64 65 73 76 56 68 56 67 54 64 16% 6% 0%
ALL 108 87 85 57 87 61 86 70 77 92 101 95 103 111 89 91 76 93 75 86 13% 1% -8%
VETERINARY MEDICINE, COLLEGE OFDVM 70 70 72 74 75 75 70 77 75 71 69 68 64 62 63 63 60 59 66 64 -3% 3% -1%MS 8 10 7 7 10 10 6 3 3 7 8 5 8 4 9 2 4 6 6 4 <10 cases <10 cases <10 casesPHD 8 4 4 5 3 4 4 3 2 1 4 4 1 2 3 3 3 2 2 6 <10 cases <10 cases <10 cases
ALL 86 84 83 86 88 89 80 83 80 79 81 77 73 68 75 68 67 67 74 74 0% 5% 1%
GRADUATE SCHOOLMA,MS,MST 5 3 3 4 5 5 2 3 2 6 5 3 2 6 1 4 9 4 6 3 <10 cases <10 cases <10 casesPHD 3 0 2 2 0 2 1 1 3 2 0 4 3 4 0 6 3 5 3 3 <10 cases <10 cases <10 cases
ALL 8 3 5 6 5 7 3 4 5 8 5 7 5 10 1 10 12 9 9 6 <10 cases <10 cases <10 cases
Table 2.1: Degrees Awarded by Colleges at the University Of Missouri - Columbia
Change in FY98 Relative to
Annual Prior PriorCOLLEGE/DEGREE FY79 FY80 FY81 FY82 FY83 FY84 FY85 FY86 FY87 FY88 FY89 FY90 FY91 FY92 FY93 FY94 FY95 FY96 FY97 FY98 FY98-97 5 Yr Avg 10 Yr Avg
ARTS & SCIENCESBA,BS,BLA 458 387 363 398 327 330 327 381 374 380 365 379 414 450 473 542 552 539 584 564 -4% 5% 17%MA,MS 69 75 65 92 80 59 59 76 80 91 82 100 89 105 117 148 117 127 128 164 22% 22% 33%PHD 5 9 1 7 3 2 5 7 6 4 2 2 5 4 5 6 1 3 5 3 <10 cases <10 cases <10 cases
ALL 532 471 429 497 410 391 391 464 460 475 449 481 508 559 595 696 670 669 717 731 2% 8% 20%
BIOLOGICAL SCIENCESBA,BS 117 102 100 109 138 108 100 113 123 116 115 108 117 108 163 119 172 138 125 142 12% -1% 10%MA,MS 15 6 18 4 17 16 18 12 16 12 18 18 9 23 17 17 10 11 13 11 -18% -24% -35%PHD 1 3 0 0 2 2 0 2 4 6 0 2 3 <10 cases <10 cases <10 cases
ALL 132 108 118 113 155 124 118 126 142 128 133 128 128 131 182 140 188 149 140 156 10% -2% 7%
BUSINESS AND PUBLIC ADMINISTRATIONBBA,BS 140 150 164 193 200 233 225 254 291 307 400 326 267 208 180 156 137 125 141 123 -15% -20% -83%MBA,MPA,MS 149 128 152 162 185 164 160 160 174 213 226 220 233 239 232 232 220 246 228 237 4% 2% 3%
ALL 289 278 316 355 385 397 385 414 465 520 626 546 500 447 412 388 357 371 369 360 -3% -5% -26%
DENTISTRYBSDH 45 43 41 23 23 23 20 23 20 21 18 24 24 16 31 18 26 22 25 25 0% 2% 10%DDS 154 161 150 155 154 157 158 114 113 107 105 96 97 80 68 76 73 77 74 67 -10% -10% -27%MS 8 9 15 14 10 9 14 15 6 11 5 11 8 5 5 7 5 4 2 12 83% 62% 48%GR CT 27 29 15 23 16 18 17 14 14 18 20 21 20 16 18 26 25 21 5 21 76% 10% 10%
ALL 234 242 221 215 203 207 209 166 153 157 148 152 149 117 122 127 129 124 106 125 15% 3% -6%
EDUCATIONBA 100 84 82 78 97 92 82 90 120 156 145 196 179 214 238 64 51 61 83 70 -19% -42% -98%MA 282 239 255 257 226 236 213 248 192 220 218 249 251 205 212 209 201 220 197 179 -10% -16% -22%EDSP 30 30 43 26 35 26 29 49 58 47 45 63 61 62 57 50 44 54 36 47 23% -3% -10%PHD 22 27 16 13 15 29 18 26 26 23 25 13 30 28 24 16 17 13 14 12 -17% -40% -69%
ALL 434 380 396 374 373 383 342 413 396 446 433 521 521 509 531 339 313 348 330 308 -7% -21% -39%
LAWJD 138 151 145 125 144 153 135 132 127 135 137 133 164 150 161 127 153 142 146 131 -11% -11% -11%LLM 21 23 24 22 16 11 15 10 4 8 2 10 5 7 9 11 14 24 26 25 -4% 33% 54%
ALL 159 174 169 147 160 164 150 142 131 143 139 143 169 157 170 138 167 166 172 156 -10% -4% 0%
MEDICINEMD 60 69 56 75 84 82 92 92 87 89 85 88 78 95 88 85 92 88 82 74 -11% -18% -18%
MUSIC, CONSERVATORY OFBA,BM,BME 47 45 33 76 58 58 37 62 47 49 39 33 39 36 37 54 39 32 32 34 6% -14% -15%MA,MM,MME 21 20 19 28 14 14 29 24 22 40 32 32 29 37 27 29 21 38 47 33 -42% 2% -1%DMA 6 6 4 6 5 5 12 7 8 8 10 10 8 12 13 6 6 8 12 11 -9% 18% 15%
ALL 74 71 56 110 77 77 78 93 77 97 81 75 76 85 77 89 66 78 91 78 -17% -3% -4%
Change in FY98 Relative to
Table 2.2: Degrees Awarded by Colleges at the University Of Missouri - Kansas City
Annual Prior PriorCOLLEGE/DEGREE FY79 FY80 FY81 FY82 FY83 FY84 FY85 FY86 FY87 FY88 FY89 FY90 FY91 FY92 FY93 FY94 FY95 FY96 FY97 FY98 FY98-97 5 Yr Avg 10 Yr Avg
NURSINGBSN 7 16 15 11 20 22 22 19 23 12 15 11 11 10 7 13 46% 17% -17%MSN 23 12 5 10 4 7 2 8 8 17 5 16 14 42 51 41 31 40 86 77 -12% 35% 55%
ALL 23 12 5 10 11 23 17 19 28 39 27 35 37 54 66 52 42 50 93 91 -2% 33% 46%
PHARMACYBSP 69 70 70 74 73 67 66 54 38 50 65 70 41 47 54 43 45 46 27 30 10% -43% -63%DPHM 6 5 4 2 0 0 0 0 0 0 0 0 12 0 7 8 8 11 16 28 43% 64% 78%MS 0 4 1 1 3 2 1 2 1 5 0 2 10 3 3 4 1 4 1 0PHD 1 2 0 0 0 3 2 2 1 3 4 3 5 8 7 3 2 1 0 1 <10 cases <10 cases <10 cases
ALL 76 81 75 77 76 72 69 58 40 58 69 75 68 58 71 58 56 62 44 59 25% 1% -5%
GRADUATE SCHOOLPHD 6 5 4 2 0 0 0 0 0 0 0 0 12 0 7 8 8 11 16 28 43% 64% 78%
Table 2.2: Degrees Awarded by Colleges at the University Of Missouri - Kansas City
Change in FY98 Relative to

Annual Prior PriorCOLLEGE/DEGREE FY79 FY80 FY81 FY82 FY83 FY84 FY85 FY86 FY87 FY88 FY89 FY90 FY91 FY92 FY93 FY94 FY95 FY96 FY97 FY98 FY98-97 5 Yr Avg 10 Yr Avg
ARTS AND SCIENCES, COLLEGE OFBA,BS 126 127 127 132 166 179 210 216 202 137 153 136 102 124 120 132 125 127 154 149 -3% 12% 12%MS,MST 37 34 31 26 71 68 74 78 66 49 40 44 50 48 50 67 57 55 49 51 4% -9% 0%PHD 15 8 12 11 8 5 7 12 15 7 14 19 16 11 17 24 8 16 17 20 15% 18% 26%
ALL 178 169 170 169 245 252 291 306 283 193 207 199 168 183 187 223 190 198 220 220 0% 7% 11%
ENGINEERING, SCHOOL OFBS 516 593 585 713 727 847 926 835 756 704 656 586 509 488 528 518 475 454 530 466 -14% -8% -17%PDD (2) 2 4 1 1 1 1 2 3 0 0 0 1MS 112 122 146 132 168 153 189 171 183 190 195 223 196 207 231 212 230 219 262 264 1% 13% 18%PHD,DE 11 8 5 2 7 14 10 17 20 22 20 21 36 38 25 36 37 34 30 30 0% -8% 0%
ALL 641 727 737 848 903 1015 1127 1026 959 916 871 831 741 733 784 766 742 707 822 760 -8% -1% -4%
MINES AND METALLURGY, SCHOOL OFBS 159 190 159 182 208 228 214 200 136 109 83 70 91 85 108 158 139 136 150 128 -17% -8% 12%MS 28 31 22 22 30 35 43 37 42 60 36 28 25 43 17 26 30 30 21 23 9% -8% -37%PHD,DE 4 6 10 3 7 3 8 7 9 8 5 12 11 10 16 6 15 15 12 11 -9% -16% 0%
ALL 191 227 191 207 245 266 265 244 187 177 124 110 127 138 141 190 184 181 183 162 -13% -9% 4%
Change in FY98 Relative to
Table 2.3: Degrees Awarded by Colleges at the University Of Missouri - Rolla

Annual Prior PriorCOLLEGE/DEGREE FY79 FY80 FY81 FY82 FY83 FY84 FY85 FY86 FY87 FY88 FY89 FY90 FY91 FY92 FY93 FY94 FY95 FY96 FY97 FY98 FY98-97 5 Yr Avg 10 Yr Avg
ARTS AND SCIENCES, COLLEGE OFBACH 468 433 440 421 404 414 425 376 402 439 477 507 549 560 595 628 639 619 666 671 1% 6% 15%MA,MS,MFA 48 75 50 59 60 51 53 56 59 47 69 56 66 84 91 95 94 111 92 123 25% 21% 35%GR CT 12 12 0% 80% 90%PHD 5 6 7 5 5 10 10 10 8 13 10 14 14 18 14 8 18 14 22 25 12% 39% 42%
ALL 521 514 497 485 469 475 488 442 469 499 556 577 629 662 700 731 751 744 792 831 5% 11% 20%
BUSINESS ADMINISTRATION, SCHOOL OFBSBA ,BSAcc 558 592 585 603 615 572 570 623 624 644 711 750 673 664 638 671 499 445 418 403 -4% -33% -52%GR CT 4 2 <10 cases <10 cases <10 casesMAcc,MBA 76 73 73 74 96 67 89 94 80 83 107 93 102 97 111 111 106 89 88 68 -29% -49% -45%
ALL 634 665 658 677 711 639 659 717 704 727 818 843 775 761 749 782 605 534 510 473 -8% -34% -50%
EDUCATION, SCHOOL OFBSED 209 177 176 193 150 112 131 163 143 195 226 226 295 299 334 350 342 307 347 336 -3% 0% 13%MED 239 223 230 215 182 170 209 157 206 201 264 225 271 290 258 324 292 337 350 298 -17% -5% 6%EDD 3 1 3 2 4 4 2 5 5 6 8 9 14 7 5 8 6 10 7 9 <10 cases <10 cases <10 cases
ALL 451 401 409 410 336 286 342 325 354 402 498 460 580 596 597 682 640 654 704 643 -9% -2% 10%
NURSING, COLLEGE OFBNS 9 19 22 37 49 65 62 71 75 85 39 41 120 140 148 144 -3% 32% 41%MSN 10 17 39 106 46 -130% 25% 63%
ALL 9 19 22 37 49 65 62 71 75 85 39 51 137 179 254 190 -34% 31% 46%
OPTOMETRY, SCHOOL OFOD 31 25 30 28 30 42 41 37 39 40 39 35 41 37 38 3% -1% 0%MS 1 2 3 1 0PHD 1 0 0
ALL 31 25 30 28 30 42 41 37 39 40 40 37 45 38 38 0% -5% -2%
GRADUATE SCHOOLMPPA, MS 6 4 6 8 6 1 5 4 7 7 5 6 7 10 10 15 13 17 9 8 <10 cases <10 cases <10 casesGR CT 9 6 <10 cases <10 cases <10 cases
ALL 6 4 6 8 6 1 5 4 7 7 5 6 7 10 10 15 13 17 18 14 -29% -4% 23%
EVENING COLLEGEBGS 24 36 35 64 62 43 54 61 51 39 51 35 65 66 77 73 79 74 88 95 7% 18% 32%
EVENING COLLEGE -- ENGINEERINGBSEE 1 2 6 14 57% 87% 94%
Change in FY98 Relative to
Table 2.4: Degrees Awarded by Colleges at the University Of Missouri - St. Louis