The 1990’s Financial Crises in Nordic Countries · The 1990’s Financial Crises in Nordic...
32
SUOMEN PANKKI | FINLANDS BANK | BANK OF FINLAND The 1990’s Financial Crises in Nordic Countries Seppo Honkapohja, Bank of Finland
Transcript of The 1990’s Financial Crises in Nordic Countries · The 1990’s Financial Crises in Nordic...

SUOMEN PANKKI | FINLANDS BANK | BANK OF FINLAND
The 1990’s Financial Crises in Nordic
Countries
Seppo Honkapohja,
Bank of Finland

SUOMEN PANKKI | FINLANDS BANK | BANK OF FINLAND
I. Introduction
19 crises in advanced countries since WWII (before the
current)
1990’s crises in Finland, Norway and Sweden are
among the ”big five”
In 1990-93 bank loss provisions (of lending):
2.9 % in Denmark,
3.4 % in Finland,
2.7 % in Norway
4.8 % in Sweden

SUOMEN PANKKI | FINLANDS BANK | BANK OF FINLAND
All Nordic countries provided public support to their
banks
Crises in Finland, Norway, and Sweden became
systemic
Crisis remained non-systemic in Denmark

SUOMEN PANKKI | FINLANDS BANK | BANK OF FINLAND
Outline of Talk
Main developments
Reasons for the crises
Crisis management
Lessons
---------------------------
My perspective

SUOMEN PANKKI | FINLANDS BANK | BANK OF FINLAND
II. Main Developments
II.1 The Real Economies
-8
-6
-4
-2
0
2
4
6
8
1980 1985 1990 1995 2000 2005
Finland Sweden Norway
%
Sources: Eurostat and IMF.
Figure 1. Real GDP growth

SUOMEN PANKKI | FINLANDS BANK | BANK OF FINLAND
Finland and Sweden
Overheating in 2nd half of 1980’s
Recession with negative growth in early 1990’s
Recovery, then good performance
Note: Finnish developments more extreme
----------------------------
Norway had an earlier upswing, recession in 1987, but
no (significant) negative growth
Fairly slow recovery, then good performance

SUOMEN PANKKI | FINLANDS BANK | BANK OF FINLAND
-10
-5
0
5
10
15
20
1980 1985 1990 1995 2000 2005
Finland Sweden Norway
% of GDP
Source: European Commission.
Figure 2. Current account

SUOMEN PANKKI | FINLANDS BANK | BANK OF FINLAND
Current account
Finland had major CA deficits in 1980s and early 1990s
Smaller but fairly persistent CA deficits for Sweden
Norway had CA surpluses, except in 2nd half of 1980s
after decline of oil prices in 1986

SUOMEN PANKKI | FINLANDS BANK | BANK OF FINLAND
II.2 Financial developments
0
50
100
150
200
250
300
350
1980 1985 1990 1995 2000 2005
Finland Sweden Norway
Index, 1980 = 100
Nominal house prices deflated using the consumer price index.
Sources: Statistics Finland, Statistics Sweden, Norges Bank and Bank of Finland.
Figure 4. Real house prices

SUOMEN PANKKI | FINLANDS BANK | BANK OF FINLAND
0
500
1000
1500
2000
2500
3000
3500
1980 1985 1990 1995 2000 2005
Finland Sweden Norway
Index, 1980 = 100
Nominal share prices deflated using the consumer price index.
Source: IMF.
Figure 5. Real share prices

SUOMEN PANKKI | FINLANDS BANK | BANK OF FINLAND
House prices
Strong boom and subsequent decline in Finland and
Norway
Long decline in Norway
less pronounced and slow movements in Sweden
Stock prices
Strong movements in Finland and Sweden in late 80’s
and early 90’s
Little movement in Norway during the boom and crisis

SUOMEN PANKKI | FINLANDS BANK | BANK OF FINLAND
-20
-10
0
10
20
30
40
50
1980 1985 1990 1995 2000 2005
Finland Sweden Norway
%
Sources: OECD and Bank of Finland.
Figure 6. Lending growth

SUOMEN PANKKI | FINLANDS BANK | BANK OF FINLAND
Bank lending
(percent of GDP)
Strong increase during the 80’s boom
Major decline with the onset of the recession
Finland and Sweden had negative lending growth for 2-3
years in early 90’s

SUOMEN PANKKI | FINLANDS BANK | BANK OF FINLAND
-1
0
1
2
3
4
5
6
7
1980 1985 1990 1995 2000
Commercial banks Savings banks Cooperative banks
% of balance sheet total
Sources: Drees and Pazarbasioglu (1998) and OECD.
Figure 7. Loan loss provisions in Finland

SUOMEN PANKKI | FINLANDS BANK | BANK OF FINLAND
-1
0
1
2
3
4
5
6
7
1980 1985 1990 1995 2000
Commercial banks Savings banks Cooperative banks
% of balance sheet total
Sources: Drees and Pazarbasioglu (1998) and OECD.
Figure 8. Loan loss provisions in Sweden

SUOMEN PANKKI | FINLANDS BANK | BANK OF FINLAND
-1
0
1
2
3
4
5
6
7
1980 1985 1990 1995 2000
Commercial banks Savings banks
% of balance sheet total
Sources: Drees and Pazarbasioglu (1998) and OECD.
Figure 9. Loan loss provisions in Norway

SUOMEN PANKKI | FINLANDS BANK | BANK OF FINLAND
III. Reasons for the Crises
Focus on Finland (deepest crisis)
III. 1 Boom
Finnish boom caused by
– financial market deregulation (with problematic elements)
– Freeing of capital movements, with attempt to tight monetary
policy under fixed exchange rate
– Upswing in western economies (bad timing)
Swedish boom similar, but milder
Norway: boom cut short by oil price decline in 1986

SUOMEN PANKKI | FINLANDS BANK | BANK OF FINLAND
III. 2 Bust
Negative international shocks
– slow growth in the west
– collapse of Soviet Union -> huge decline in trade with
Russians
– German unification led to high real interest rates
(Figures)
Domestic policy
– Domestic monetary policy very restrictive because of
defence of fixed exchange rate
Finland started to recover in 1993-94

SUOMEN PANKKI | FINLANDS BANK | BANK OF FINLAND
-2
0
2
4
6
8
10
12
14
-2
0
2
4
6
8
10
12
14
1985 1990 1995 2000 2005
Real interest rate in Finland* (LHS)
Interest rate differential to Germany (RHS)
% Percentage points
* Nominal interest rate - consumer price inflation.
Sources: Reuters and Bank of Finland.
Figure 10. Real interest rate in Finland and interest rate differential to Germany (3-month rates)

SUOMEN PANKKI | FINLANDS BANK | BANK OF FINLAND
90
95
100
105
110
115
120
125
130
135
140
1980 1985 1990 1995
Index, 1982 = 100
Trade-weighted currency index. Rising curve indicates FIM depreciation.
Source: Bank of Finland.
Figure 11. Bank of Finland currency index

SUOMEN PANKKI | FINLANDS BANK | BANK OF FINLAND
The recession was largely similar but smaller in Sweden,
except Sweden had no trade with Soviet Union
Swedish industry was also more modernized than
Finnish industry
Norway: recession in 1987-88 because of oil price
decline and restrictive policies; only slow recovery

SUOMEN PANKKI | FINLANDS BANK | BANK OF FINLAND
III. Reasons for the Crisis
Problems in financial deregulation
– bad timing with international business cycle upswing
– Bank laws and bank supervision were outdated (tightening only
in 1991)
– Tax system favored debt financing
– Lending rates freed before deposit rates
– fixed exchange rate system
International dimension for Finnish and Swedish crises
=> ”twin crises”

SUOMEN PANKKI | FINLANDS BANK | BANK OF FINLAND
IV. Crisis management
Finland
– 1st measure: Bank of Finland took control of Skopbank in
September 1991
– Public support: preferred capital certificates to banks, with strict
requirements
– Government set up the crisis management agency
– Policy-makers made promises to guarantee banks’ obligations,
also further public support
– Support to be converted into shares if not repaid

SUOMEN PANKKI | FINLANDS BANK | BANK OF FINLAND
Finland (continued)
– Banks became profitable again in 1996
– Improved efficiency (staff halved, etc.)
– Major restructuring of banking system:
• savings banks largely disappeared,
• one big commercial bank was merged to another
– Nowadays 60 percent of banks owned by foreigners
=> Biggest part of the crisis was in Savings Banks

SUOMEN PANKKI | FINLANDS BANK | BANK OF FINLAND
Sweden
– Crisis erupted in autumn 1991 with Första
Sparbanken; government gave a loan and FS merged
with other savings banks
– Nordbanken (3rd largest comm. bank) was 71% govt
owned and had to be recapitalized
– Many banks made heavy credit losses
– In autumn 1992 blanket creditor guarantee by
government
– Crisis resolution agency set up, public support with
strict criteria in risk reduction and efficiency

SUOMEN PANKKI | FINLANDS BANK | BANK OF FINLAND
Sweden (continued)
– Some banks did not need public support
In the end nearly all support went into two banks,
Gotabanken and Nordeabank.
- Nordeabank became a pan-Nordic bank ”Nordea”
SUOMEN PANKKI | FINLANDS BANK | BANK OF FINLAND
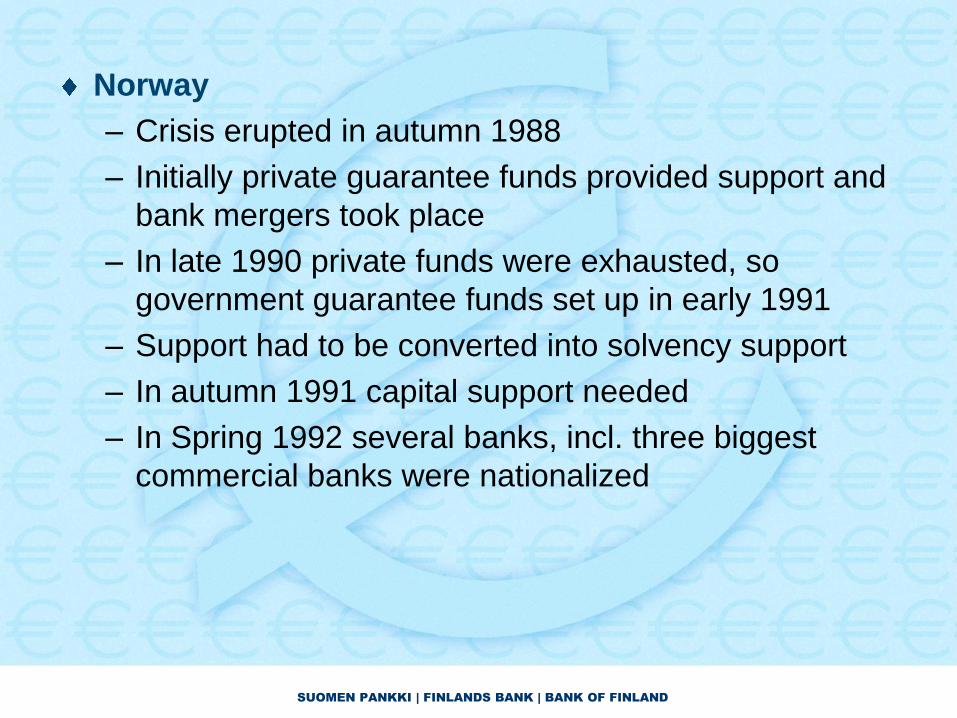
Norway
– Crisis erupted in autumn 1988
– Initially private guarantee funds provided support and
bank mergers took place
– In late 1990 private funds were exhausted, so
government guarantee funds set up in early 1991
– Support had to be converted into solvency support
– In autumn 1991 capital support needed
– In Spring 1992 several banks, incl. three biggest
commercial banks were nationalized

SUOMEN PANKKI | FINLANDS BANK | BANK OF FINLAND
Norway (continued):
– no blanket guarantee by government, but specific
announcements about securing depositors and
creditors
– Banks situation started to improved in 1993
– One of nationalized banks was sold in 1995 and two
other banks were sold later
– Government still owns 34 percent of one bank
=> In the end the Norwegian tax payer made money out
of the crisis (not so in Finland and Sweden)

SUOMEN PANKKI | FINLANDS BANK | BANK OF FINLAND
Gross cost Net cost
Finland 9.0 (% of 1997
GDP)
5.3 (% of 1997
GDP)
Norway 2.0 (% of 1997
GDP),
3.4 (present
value , % of
2001 GDP)
-0.4 (present
value, % of
2001 GDP)
Sweden 3.6 (% of 1997
GDP)
0.2 (% of 1997
GDP)

SUOMEN PANKKI | FINLANDS BANK | BANK OF FINLAND
V. Lessons
Prevention of major crisis is first priority; stability-
oriented macro policies
How to diagnose an overheating situation?
– rapid credit expansion
– strong increase in leverage
– big external deficits in open economies
Political-economy reasons can be a major obstacle in
prevention

SUOMEN PANKKI | FINLANDS BANK | BANK OF FINLAND
Crisis management
– Maintaining confidence in banking system is crucial
– Broad political support; political guarantees to banks’ obligations
in Finland and Sweden but not in Norway
Role of central banks
– Liquidity support in Norway and Sweden
– Bank of Finland had to take over a problem bank

SUOMEN PANKKI | FINLANDS BANK | BANK OF FINLAND
Crisis resolution agencies in all three countries- Administrative separation from central bank and ministry of
finance
- Capital injections to banks
- Guiding of restructuring of the banking system
- Treatment of ”old shareholders” was mixed
Asset management companies (”bad banks”) to deal
with non-performing assets– Norway: banks had their own bad banks
– Finland and Sweden had public agencies
=> Nordic practices in crisis resolution have been
praised afterwards.


![[Nordic Built Challenge 17.12.2013] Trine Pertou Mach, Nordic Built: Nordic Built](https://static.fdocuments.in/doc/165x107/547174dcb4af9f980a8b4ad9/nordic-built-challenge-17122013-trine-pertou-mach-nordic-built-nordic-built.jpg)