The 106th ESGI - Universiteit Utrecht · Important Locations 1. Boothzaal of Utrecht University...
16
The 106th ESGI (SWI 2015) Study Group Mathematics with Industry http://www.projects.science.uu.nl/swi2015/ January 26-30, 2015 Sponsors of SWI2015
Transcript of The 106th ESGI - Universiteit Utrecht · Important Locations 1. Boothzaal of Utrecht University...

The 106th ESGI (SWI 2015)
Study Group Mathematics with Industry http://www.projects.science.uu.nl/swi2015/
January 26-30, 2015
Sponsors of SWI2015

Important Locations 1. Boothzaal of Utrecht University Library (UBU), Heidelberglaan
3, Utrecht
2. Freudenthal Building (mathematics department), Budapestlaan 6, Utrecht
3. Mitland hotel, Ariënslaan 1, Utrecht. Tel: +31 30 271 5824
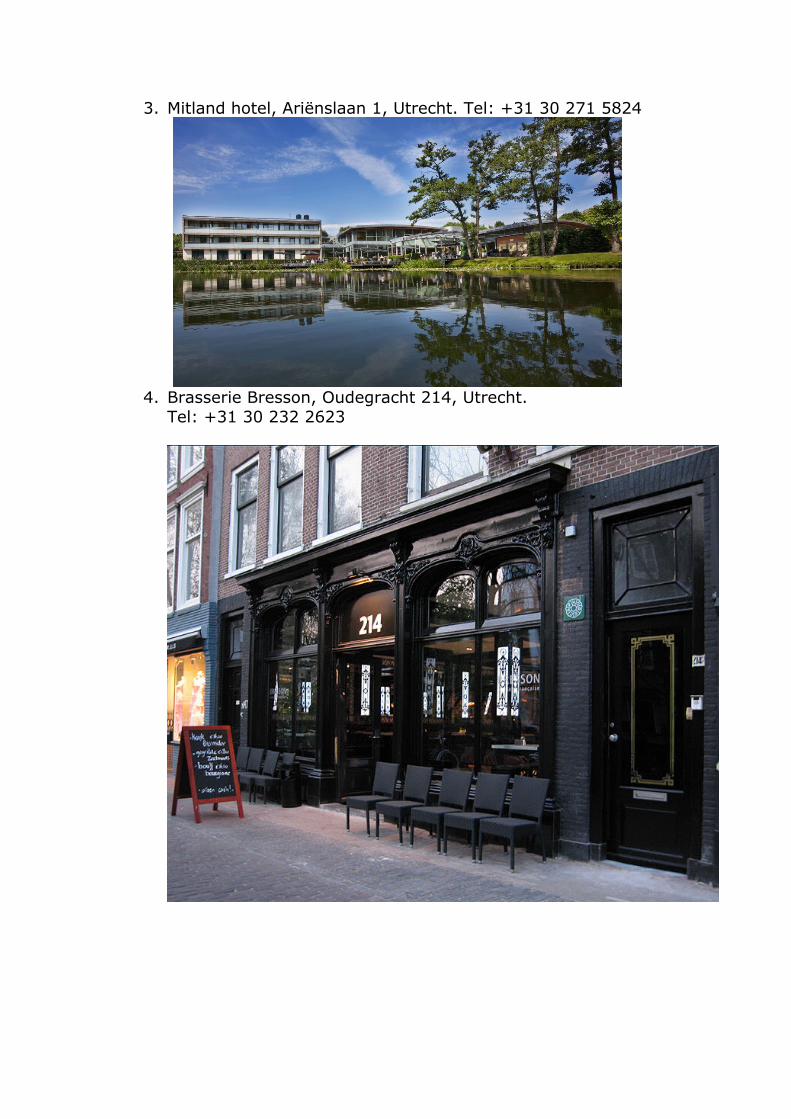
4. Brasserie Bresson, Oudegracht 214, Utrecht.
Tel: +31 30 232 2623

Map Uithof
Legend
Freudenthal Building
University Library

Map Utrecht
Legend
Freudenthal Building
University Library
Hotel Mitland
Brasserie Bresson

Hotel Mitland area
Legend
Hotel Mitland
Bus-stop "Oorsprongpark"
Bus stop "Sartreweg"

Area Restaurant "Brasserie Bresson"
Naamloze laag
Bus stop "Janskerkhof"
Brasserie Bresson

Travel Directions 1. To the University Library Uithof by car
You enter De Uithof from the north side via Universiteitsweg. You will pass a number of traffic lights. Keep driving straight on until you reach a T-junction where you turn right. Next to the University Library is a car park. Parking is not free of charge. The entrance of the car park is at the back of the building, on Cambridgelaan 108. The main entrance of the University Library is on Heidelberglaan 3. To the University Library Uithof by public transport See also: http://www.9292ov.nl/ From/to Utrecht Central Station: buses 28 and 12(s). These buses leave every three to five minutes. The bus journey will take about fifteen to twenty minutes. You get off the bus at the bus stop Heidelberglaan. The main entrance of the University Library is on Heidelberglaan 3. From/to Mitland hotel: Walk to the bus stop “Oorsprongpark”. Take bus 128 or 228 to “the Uithof, P+R” or walk to bus stop “Sartreweg” and take bus 30 towards “de Uithof”. In both cases exit at the bus stop “Heidelberglaan”.
2. To the Freudenthal building by car You enter De Uithof from the north side via Universiteitsweg. Turn right into the Leuvenlaan, 150m before the first travel lights. Take the first road to the right (after 500m), the Budapestlaan. The Freudenthalbuilding is on the left. There is a parking place in front of the building. In case the parking place is full, continue driving on the Budapestlaan, you are forced to turn left, after 150m, there is another parking place on the left. To the Freudenthal building by public transport See travel directions to the University Library, but exit at bus stop “Botanische Tuinen”.
3. To Mitland hotel by car See http://www.mitland.nl/en/about-mitland/route.htm To Mitland hotel by public transport From Utrecht Central Station
Bus number 28 direction: De Uithof P+R or Bus number 77 direction: Bilthoven;
Bus-stop Oorsprongpark* From UBU or the Freudenthal building: Bus 128 or bus 228. Bus-stop “Oorsprongpark”
From Bus stop “Oorsprongpark” Cross the railway crossing
Fourth street to the left (Karel Doormanlaan) Turn first right to go under the fly-over (Ariënslaan) Mitland Hotel Utrecht is on the right after 50 meters
*From bus-stop Oorsprongpark it is about 10 minutes walking. More information: http://9292.nl/en
4. To Brasserie Bresson by public transport Take bus 28 from bus stop “Botanical Gardens”. Depart at bus stop “Janskerkhof”. (Back to Mitland hotel, take bus 28 and depart at “Oorsprongpark”).

Dining In the vicinity of Mitland, there aren't a great deal of restaurant options, aside from those inside the hotel itself. A reasonable option that is a short walk away is a seafood restaurant De Kust (F.C. Dondersstraat 2). If you have more money, need to get out of the hotel and don't want to walk that far, there is the Belgian restaurant Goesting (Veeartsenijpad 150). Going west along Biltstraat and walking straight takes you directly into town after about 25 minutes. Along the way, among several options is one decent Surinamese Javanese restaurant Pomo (Wittevrouwenstraat 22), serving cuisine that might be difficult to find outside of the Netherlands. Once you are in the historic centre, there are many options, for instance along Oudegracht, though sometimes these prioritise canal-side atmosphere more than culinary quality. To help separate the wheat from the chaff, you can try browsing the website iens.nl (which has an English language option). Note that options on the campus De Uithof are limited, and you'd be better off boarding the bus into town. If you are desperate for a bite (or a drink) after the cafeterias close, there is The Basket (Genevelaan 8).
Internet access Utrecht University offers 2 options:
• eduroam (only works if you have arranged it via your home institution beforehand)
• UU-visitor, a password-free network

Schedule Monday, January 26
09.30-10.00 Arrival and coffee/tea
Boothzaal of Utrecht University Library
10.00-10.10 Opening by Marjan Oudeman
(President, Executive Board of Utrecht University)
10.10-10.20 Welcome by Tobias Müller (Chair of the organising committee)
10.20-11.35 Company presentations by KNMI, Philips & NM Group
11.35-11.50 Coffee/Tea
11.50-13.05 Company presentations by NKI, Mobidot & SKF
13.05-14.00 Lunch 14.00-14.30 Group arrangements
14.30-17.00 Group discussion with company representatives
Boothzaal of Utrecht University Library & Freudenthal building
17.00-19.00 Reception Library of Freudenthal Building (7th floor)
Tuesday, January 27
09.00-12.30 Group discussion Freudenthal Building
12.30-13.30 Lunch Room 611, Freudenthal Building
13.30-17.30 Group discussion Freudenthal Building
Wednesday, January 28 09.00-12.30 Group discussion Freudenthal Building
12.30-13.30 Lunch Room 611, Freudenthal Building
13.30-17.00 Group discussion Freudenthal Building
17.00-18.00 Interim report to other groups Room 611, Freudenthal Building
18.30- Conference dinner Brasserie Bresson
Thursday, January 29 09.00-12.30 Group discussion Freudenthal Building
12.30-13.30 Lunch Room 611, Freudenthal Building
13.30-18.30 Group discussion + preparation presentation Freudenthal Building 18.30-19.30 Pizza and drinks
19.30-21.00 Preparation presentation
Friday, January 30
09.00-10.30 Group presentations KNMI, Philips & NM Group
Boothzaal of Utrecht University Library
10.30-11.00 Coffee/tea
11.00-12.30 Group presentations NKI, Mobidot & SKF
12.30-12.35 Closing 12.35- Lunch

Problems
Problem 1: KNMI, Royal Netherlands Meteorological Institute
Synchronizing numerical models of the atmosphere to
improve weather and climate predictions
Systems as diverse as clocks, singing crickets, cardiac pacemakers, firing neurons and applauding audiences exhibit a tendency to operate in synchrony. The phenomenon that dynamical systems synchronise their behaviour by some form of information exchange is known as synchronisation. In recent years, the concept of synchronisation is being applied in weather and climate research.
Observed synchronous behaviour of different regional climates is being studied by regarding the climate system as a hierarchy of many coupled subsystems with complex non-linear feedbacks and forcings.
In weather prediction one tries to reconstruct the total state of the atmosphere on the basis of a relatively small set of observations that are spread in space and time. A dynamical model of the atmosphere is used to interpolate between the datapoints. This process is called data-assimilation. But from another perspective it can be viewed as an attempt to synchronise the model state with the state of the atmosphere by exchanging state information.
By connecting different atmosphere models a new, synchronised solution emerges that by training the connections can be closer to the observed solution than any of the individual model solutions. This approach is called super modelling and has the promise to improve weather and climate predictions. KNMI has been pioneering the super modelling approach and interesting mathematical problems have emerged from this research.
1. Through trial and error it has been found that often just a part of the state vector needs to be exchanged between the models in order for the models to synchronise on a common solution. But which phase space coordinates are most effective? So far only linear nudging terms have been considered as the mathematical form of the connections but there might be other forms of connections that are more effective. For data-assimilation purposes it would be very helpful to know where and what should be measured in order to achieve the best synchronisation between the model state and the real atmosphere.
2. It has been found that when models are strongly connected, all models synchronise their behaviour. For very weak connections the models each trace their own attractor. For intermediate values of connection strengths however the models synchronise on solutions that are very different from the individual solutions and in some cases a fixed point of periodic solution is found. Why does this happen and why for these intermediate connection strengths?
3. What is the best training strategy for the connections of the super model so that the synchronised solution is closest to the truth? We have pioneered a few approaches but fresh ideas are welcome!

Problem 2: Philips Healthcare
Patient Adaptive Compressed Sensing
The sampling density function in Compressed Sensing can best be optimized once the k-space density is known for the object under investigation. This is characterized by an MRI scan (fast pre-acquired data set), from which the k-space extent is estimated by a Fourier Transform. In addition, the data is acquired with multiple, spatially-localized, coil elements which impose a weighting function to k-space.
The optimal k-space trajectory for the required sampling density in Compressed Sensing in multi-coil acquisitions must also be constrained to match available gradient system capabilities: gradient amplitude, slew rate, and bandwidth (6kHz for example). The target is development of a demonstrator algorithm to derive the most efficient object specific k-space trajectory for Compressed Sensing. Further k-space weighting may be imposed by relaxation effects, a.k.a. T2/T2* effects. Such additional weighting could potentially be taken into account after development of the basic algorithm.
We are interested in 2 flavours:
1. samples constrained on a Cartesian grid,
2. free traversal of 3D k-space.
The envisaged algorithm should work 'real time' with our PDF, i.e. complete within say 15 ms on state of art Intel hardware.

Problem 3: NM Group
Power Line Route Optimisation in a finite spatial grid
Building new infrastructure such as transmission lines, roads, rail, etc. is always a source of controversy. High voltage transmission lines blight the landscape they are constructed on, bringing social, environmental and economic detriment to the areas they run through, equally they form the fabric of modern infrastructure enabling efficient transfer of power across the country. As such it is vital that optimal routes are chosen. Optimal routing provides a cost effective, socially acceptable and environmentally friendly route. Determining the route for new line build is a complex issue and routing criteria/ engineering specification vary from place to place. Network Mapping (NM) has experience in the optimum spotting of towers after the route corridor has been defined (vertical routing), this expertise led us to realise that there is potential to reduce saving in the construction of new lines if Network Mapping is also involved in the generation of the route corridor (horizontal routing). This SWI problem is concerned with the development of systematic and robust methodology for routing new infrastructure, ideally taking into consideration all the relevant factors involved in the siting of power lines in the particular area of interest.
Topographic, societal and other factors would be imported as geospatial datasets. These would be assigned user determined weightings, and for each set of weightings would inform the most appropriate route selection. The initial analysis would consider all possible route choices, under the chosen weighting, and identify the optimum route selection. This is called the 'macro routing stage'. This has currently been developed to a Proof of Concept stage using the A* algorithm, with a modified heuristic which includes a goal seek logic (although we are not tied to maintaining this particular methodology).
The next stage is to use more precise geospatial datasets to inform the route selection, and also considers cost to land (or site a support) at a particular location, and the cost to jump, or oversail conductor over a particular location.
The next step considers joining all the chosen landing locations together by straight lines, thus taking fractions of each spatial location and ensuring the optimal route is still chosen.
The final step is to consider the removal or reduction of the angles through which the power line is being asked to turn at each landing point, weighing up the reduction in materials allowed by this modification against a potentially sub-optimal routing choice.

Problem 4: NKI (National Cancer Institute)
Accurate dose delivery for radiation therapy: adapting treatment to daily anatomy
For radiation oncology we treat patients with head and neck tumours over the course of 6-7 weeks. This treatment is usually based on one CT scan prior to treatment. We use that as an input for dose calculations in the patient based on a collapsed cone superposition algorithm. To optimise the dose distribution we use an inverse optimisation algorithm, all in commercial software. Typically, the computation and optimisation times require about 1-2 hours for this patient group. This is translated to settings of the linear accelerator that is used to deliver the dose to the patient.
From experience we know that the daily posture of the patients is not the same as it was during the CT scan. We already have tools to compute the deformation vector field to map one posture to the other. Our request is to devise clever ways to translate this deformation to adjusted settings of the linear accelerator, such that the intended dose is delivered despite the different patient anatomy. The deformations may include tumour shrinkage or swelling of healthy tissue.

Problem 5: Mobidot
Mobility profiling from Smartphone sensordata: confidently know how people travel
Our SWI problem formulation focusses on advancing the quality of our data derivation. Mobidot infers the route, role, objective and mode of transportation from Smartphone data. Smartphones possess a variety of sensors, including GPS, mobile telephone (4G) and wi-fi signals, accelerometer-based mode, etc. that can be used to determine the motion and position of the user, when coupled with geographic databases.
The continual monitoring and recording of data from Smartphone sensors and the comparison with online geographic databases strains battery usage, and hence a sensing strategy must be devised to optimize information gathering with minimal energy usage. The first objective of the SWI problem is to optimize data measurement quality against battery usage. Sub-objectives:
1. Devise an optimal scheduling plan for sensing, for instance, regularly via a Smartphone in `heartbeat' operating mode that detects changes in travel patterns. Detection of optional triggers, adjustment of sensing intervals depending on transportation mode inferred.
2. Develop a method to filter data on the mobile site in such a way that the crucial information is contained, while the redundant information is thrown away, yet maintaining the performance of the trip analysis (route, mode, role, objective).
3. Develop methods for inferring motion given sparse data (intermittent or incomplete).
The second objective of the SWI problem is to detect obvious errors in the automatically derived role, objective and mode detection as already performed by the central software platform of Mobidot:
1. Identify, based on the provided dataset including Smartphone sensor data (GPS, telephone and accelerometer), (online) geographic databases, and the already inferred information by Mobidot, what the obvious cases are where the automatic inference is likely to be in error.
2. Minimize false inferences (`ghost trips'). These are displacements that are detected by the system, but which are not really made by the end-user. A potential reason is GPS drift or a series of inaccurate locations.
Mobidot will provide all relevant and needed data to be able to develop data deduction improvements and test approaches and methods. This includes sample Smartphone multi-sensor data, sensor energy usage stats and samples of resulting anonimised mobility profiles.

Problem 6: SKF
Statistical modelling of mechanical bearing life testing
The goal is to model and optimize bearing life testing time under constraints. The constraints are from various kinds:
• Number of available test machines (each machine has 2 test positions): K • Number of life tests to be run: N • Statistical distribution assumed for individual bearing life: Weibull (L10,β) • Assessed precision: expected maximum ratio between confidence bounds
on life parameters
The parameters that need to be optimized are:
• The number of samples / machines per each test (can differ from one test to another)
• The order of the tests • The individual test strategy (censoring, replacement...) • Bias correction method for the Maximum Likelihood Estimation used for
the confidence bounds calculation (when deviating from the type II censoring scheme)
In order to assess the last point, Monte Carlo simulations are needed, where random test data following specific test scenarios should be generated. The impact on the final result of the bias due to the generated test data should be quantified as well as a feasible strategy to minimize this effect.