“that’s what i want.”
72
Capital One Financial Corporation 1999 Annual Report 99 “that’s what i want.” capital one 1999 annual report
Transcript of “that’s what i want.”

Capital O
ne Financial Corporation
1999 Annual R
eport
99
“that’s whati want.”
capital one 1999 annual report
2980 Fairview Park DriveSuite 1300Falls Church, VA 22042-4525
703.205.1000
www.capitalone.com

Do you remember what it felt like to turn 10 years old?
For a whole day, the entire universe seemed to revolve around you.
If we could translate that feeling into a mission statement, we would because our world revolves around you.
Where other companies aim to “meet or exceed” the expectations of their
associates,customers and shareholders …
our goal is to absolutely blow your doors off.
Capital One. “that’s what i want.”

empwe
our associates
The best of the best. That’s who we recruit,and that’s what they expect us to be. So
we’ve made Capital One a terrific place to work.
We give associates big opportunities. We invest
in their growth andreward great performance.
Compensation and benefits are highly innovative. We’re
proud that 15,500 smart,energetic, committed
individuals — the kind of people who could work
anywhere — say Capital One.
“that’s what i want.”

ower

Equity Ownership. After two years of waiting, Joe and Jan Ferguson went overseas to bring home an adoptiveson — only to have the arrangements fall through. “It was devastating to come home empty-handed,” Joe says.“The Company’s employee benefit plan paid part of the cost, but the rest of the money we’d spent to get thatfar had tapped out our savings.” A few weeks later, the Fergusons were presented with an opportunity to adopta baby about to be born in a local hospital. “My stock options made it possible. I don’t know how we wouldhave done it otherwise. Our son Ryan is now two. He’s healthy, smart and happy — the love of our life.”
options for a better lifeJOE FERGUSON, COMMUNICATION SPECIALIST. CHESTER, VIRGINIA

A Piece of the Action. Bill joined in 1994, after graduating from college. Promoted three times, he manages amarketing budget of well over $100 million. “I came because of the people and the culture,” he says. “TheCompany has grown fast because everybody is encouraged to go out and add value. Through stock ownershipand options programs, there’s an opportunity to create substantial value for yourself as well.” Like many seniormanagers, Bill has traded half his bonus for options and recently traded his options for the next two years inexchange for the possibility of even bigger rewards in the future.
opportunityBILL CILLUFFO, DIRECTOR, MARKETING & ANALYSIS. VIENNA, VIRGINIA

infinite possibilitiesGo-For-It Culture. An Eagle Scout and former U.S. Army major, Bill came to Capital One in 1997 as a site opera-tions manager. After two promotions he now manages a team of technicians who provide computer support toall of Capital One’s U.S. buildings. “I came here because I could see that everything was wide open. You don’thave to do the same thing the same way every time. When you think you’ve found a better way, you can try it.One reason children are so much fun is that they believe anything is possible. Capital One is like that.”
BILL FORD, MANAGER, SITE OPERATIONS. RICHMOND, VIRGINIA

96%91% of our associates told an independent survey firmthey think Capital One is afun place to work.
For the second time, a surveyin FORTUNESM named us one ofthe 100 Best Companies toWork for in America.
say they are proud towork for Capital One.
Our scores for
work-family balance andperformance-
based pay are amongthe best in
corporateAmerica.

to

wowwe
want
ourcustomers
Each of our customerstakes a unique journeythrough Capital One. Every account is custom-fitted to the individual’scircumstances. We market to our customers’practical needs, theirpersonal passions, theirstages of life. We build strong, lastingrelationships throughhigh-value products and first-class service. Now 24 million customers sayCapital One.
“that’s what i want.”

ADAM GEFFNER. PLYMOUTH MEETING, PENNSYLVANIA
www.capitalone.com. Capital One is a leader in online credit cards. Setting up a Capital One account on theInternet takes less than 60 seconds, and new customers can immediately shop online. Our Web site alsoexpands service options. “The online payment system was one of the main reasons I signed up with Capital One,” says Adam Geffner, a telecom coordinator. “The Web site gives me account information when I want it. And the statements are very current, which allows me to do a better job of managing my finances.”
webcentricityADAM GEFFNER. PLYMOUTH MEETING, PENNSYLVANIA

a helping handCustomer Focus. When three hurricanes blew through North Carolina last September, they also blew a holethrough the family budget of Quentin and Denise Memmelaar. Bad roads and washed-out bridges kept Quentinfrom work for three weeks. “I called Capital One to explain that we had no money coming in,” Denise says.“We just needed a little time to get back on our feet. Capital One really came through for us. For two monthsthey let us make payments of $10 a month and didn’t charge interest.”
DENISE MEMMELAAR AND HER DAUGHTER, TARA. SNOW HILL, NORTH CAROLINA

Fixed Rates. “We live off the beaten path, so credit cards are a real lifeline for us,” says Barbara, who isexecutive director of Historic Rugby, a restored Victorian village that draws 60,000 visitors a year. Her husband,John Gilliat, is Rugby’s property director. “Capital One is a partner we know we can count on. It is the onlycredit card company we’ve dealt with in a long time that hasn’t thrown us any curves, like rate increases orunexpected fees.”
BARBARA STAGG AND JOHN GILLIAT. RUGBY, TENNESSEE
a square deal

Capital One profitablyserves customers acrossthe credit spectrum.
Capital One has 24 million customers — more than AOL®, FidelityInvestments®or Charles Schwab®.
ConsumerReports®rates ourMilesOneSM
PlatinumVisa, the #1 travelreward credit card. No wonder.Miles areredeemableon any air-line. Noblackoutperiods. Low fixedrate.
customers a day.19,000
In 1999, we added

rewawe’ve
our investors
With our Information-Based Strategy, we have
reinvented the credit card industry and created
explosive growth for Capital One. Our financial
performance has set records across the board
in our five years as a public company.
Our radically new approach and its superior
results have led our institutional and individual
investors to say,Capital One.
“that’s what i want.”

rded

a winning teamIntellectual Capital. Kent is in the business of picking winners. The mutual fund he manages, NeubergerBerman’s Focus Fund, owns 2,767,500 shares of Capital One stock, and Kent personally owns 112,000 shares.“What sold me is that the senior managers truly believe that recruiting the right people is the most importantjob they do. Successful companies are like championship teams. They attract winning people. And that’s amajor reason they keep on winning.”
KENT SIMONS, PORTFOLIO MANAGER, NEUBERGER BERMAN. NEW YORK, NEW YORK
81%of associatesown our stock
or options

a brilliant futureEducation and Retirement Savings. Sid decided to invest in Capital One soon after the Company’s first annualmeeting. “Marcy and I were there because she was already a stockholder,” Sid recalls. “I had been working asa logistics consultant, so I immediately recognized the uniqueness of the Company’s strategy and the sophisti-cation of its approach to information technology. I think Capital One has a great future. In the meantime, ourshares have appreciated enough to help put our son James through college and medical school.”
SID AND MARCY PASKOWITZ, INDIVIDUAL INVESTORS. MCLEAN, VIRGINIA
compound annualrevenue growth
for 5 years:
44%

a place at the topGrowth, Year After Year. For a security analyst, there is no higher professional honor than a spot on one ofInstitutional Investor® magazine’s annual all-star lists. In the financial services category, Tom Brown headedthe list 8 times between 1989 and 1997. “I recommended Capital One’s stock in the very beginning, and nowthat I'm a portfolio manager focused on the financial services industry, it’s still my #1 pick,” he says. “It now hasa broader product line, a deeper management team and a stronger infrastructure. It also has proven that its infor-mation-based strategy is a superior radar system for directing the Company to its most profitable opportunities.”
369%growth in
customers since1995
TOM BROWN, SECOND CURVE CAPITAL. NEW YORK, NEW YORK

20%Our earnings growth andreturn on equity have topped
for five years in a row.
In 1999,we won four
AlexanderHamilton
Awards, given byTreasury & Risk
Management ®
magazine forexcellence in financial
management.Our treasurydepartment
took first prize.
Between our IPO in 1994 and year-end 1999,our revenues increased 512%.

Richard D. Fairbank
Chairman and Chief Executive Officer
Nigel W. Morris
President and Chief Operating Officer

Capital One turned five in November, and in every year since its public offering, it has setfinancial records across the board. We are especially proud of consistently meeting two ofour most ambitious annual goals, a 20%-plus increase in earnings per share and a 20%-plusreturn on equity. We have delivered both for five consecutive years, a record matched by only10 of the country’s 10,000 public companies.
Other highlights:
• We started as a U.S. credit card company. We now have a growing international business. We also market auto loans, installment loans, deposit accounts, other con-sumer financial products and wireless phone service.
• In 1994, we had 5 million customers. Today we have 24 million, giving us one of thelargest customer bases in the world and a large, ready-made market for our other products.
• We’re one of the fastest-growing financial service companies on the Internet.
Even after this high-velocity growth, we believe our opportunities are broader and brighterthan ever. But what we want most for Capital One goes well beyond making the most ofopportunities. We want to build one of the world’s truly great companies. That is the dreamat the heart of all we do. We want Capital One to be great in every way that matters — greatas a place to work, great at innovation and customer service, great as a financial performerand a corporate citizen. And we want this greatness to endure.
to our shareholders and friends:
What we want for Capital One

To ensure that it will, we often forgo short-run gains to achieve long-term success. Our marketing investment, which funds testing and product rollouts, is huge: the $732 millionwe invested in 1999 was 127% of our pretax earnings. Our capital base significantly exceedsthe regulatory requirements for a “well-capitalized” financial institution.
As in the past, our growth will be driven by our information-based strategy (IBS), which wecreated 12 years ago. IBS links our database (one of the world’s largest) to prize-winninginformation technology and highly sophisticated analytics. With IBS we scientifically testideas before taking them to market, and we tailor the product to the individual customer.Before IBS, issuers priced all cards at 19.8% and denied credit to applicants whose risk pro-files did not fit narrow parameters. The testing and customizing made possible with IBS havetransformed the credit card industry by dramatically reducing credit costs for most con-sumers and by making credit cards available for the first time to millions of people.
IBS allows us to reach hard-to-find customers in thousands of “microsegments” and offerthem innovative, high-value products tailored to their needs. We have built a thriving business in the superprime market — the country’s most blue-chip customers. We also successfully market to the needs and passions of sports fans, music lovers, newlyweds, newparents, and hundreds of other lifestyle and lifestage groups. And we market profitably to theunderserved — customers traditionally overlooked by our competitors.
With IBS we can innovate constantly. And rapid, substantive innovation is essential to great-ness. The winners in an increasingly competitive world will be the companies that offer thebest buys, offer them first and move on when competitors move in. Capital One’s innovationmachine is running smoothly at very high speed: in 1999, we tested 36,114 new ideas, 25%more than in 1998.
IBS has generated consistently high returns for Capital One and has helped us maintain excel-lent credit quality. Our profitability in 1999 was one of the highest among major issuers, andour charge-off rate was the very lowest.
While we are enjoying explosive growth in the U.S. credit card business, we have also beensuccessful in exporting IBS to other markets. We now operate in Canada and the UnitedKingdom and are actively testing in other countries. In addition, we continue to diversifybeyond credit cards. Our 1998 acquisition of Summit Acceptance Corporation has given usa beachhead in auto finance, a market almost twice the size of the credit card business. Ourinstallment loan business grew by 45% in 1999.
financial summary
(in millions)
11.7 16.7 23.7
97 98 99
total accounts
(in billions)
$14.2 $17.4 $20.2
97 98 99
managed loans
$18.06 $38.33 $48.19
97 98 99
year-end stock price
$0.93 $1.32 $1.72
97 98 99
diluted earnings per share
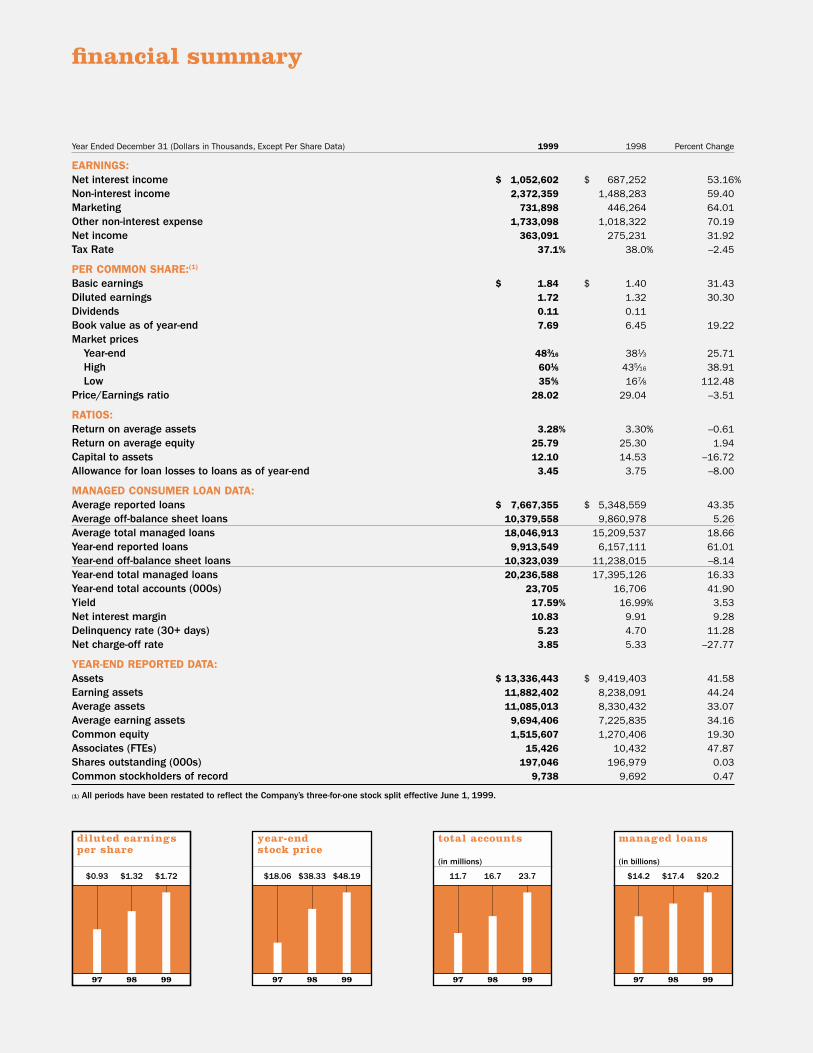
Year Ended December 31 (Dollars in Thousands, Except Per Share Data) 1999 1998 Percent Change
EARNINGS:Net interest income $ 1,052,602 $ 687,252 53.16%Non-interest income 2,372,359 1,488,283 59.40Marketing 731,898 446,264 64.01Other non-interest expense 1,733,098 1,018,322 70.19Net income 363,091 275,231 31.92Tax Rate 37.1% 38.0% –2.45
PER COMMON SHARE:(1)
Basic earnings $ 1.84 $ 1.40 31.43Diluted earnings 1.72 1.32 30.30Dividends 0.11 0.11Book value as of year-end 7.69 6.45 19.22Market prices
Year-end 483⁄16 381⁄3 25.71High 601⁄6 435⁄16 38.91Low 354⁄5 167⁄8 112.48
Price/Earnings ratio 28.02 29.04 –3.51
RATIOS:Return on average assets 3.28% 3.30% –0.61Return on average equity 25.79 25.30 1.94Capital to assets 12.10 14.53 –16.72Allowance for loan losses to loans as of year-end 3.45 3.75 –8.00
MANAGED CONSUMER LOAN DATA:Average reported loans $ 7,667,355 $ 5,348,559 43.35Average off-balance sheet loans 10,379,558 9,860,978 5.26Average total managed loans 18,046,913 15,209,537 18.66Year-end reported loans 9,913,549 6,157,111 61.01Year-end off-balance sheet loans 10,323,039 11,238,015 –8.14Year-end total managed loans 20,236,588 17,395,126 16.33Year-end total accounts (000s) 23,705 16,706 41.90Yield 17.59% 16.99% 3.53Net interest margin 10.83 9.91 9.28Delinquency rate (30+ days) 5.23 4.70 11.28Net charge-off rate 3.85 5.33 –27.77
YEAR-END REPORTED DATA:Assets $ 13,336,443 $ 9,419,403 41.58Earning assets 11,882,402 8,238,091 44.24Average assets 11,085,013 8,330,432 33.07Average earning assets 9,694,406 7,225,835 34.16Common equity 1,515,607 1,270,406 19.30Associates (FTEs) 15,426 10,432 47.87Shares outstanding (000s) 197,046 196,979 0.03Common stockholders of record 9,738 9,692 0.47
(1) All periods have been restated to reflect the Company’s three-for-one stock split effective June 1, 1999.

Profits from cross-selling have tripled in the last two years. In 1999, 57% of new customersbought at least one other product from us. The products we cross-sell are best in class. Wedon’t market a product until our associates try it and say they’re satisfied with it.
The magnitude of Capital One’s potential is best appreciated in the context of two of thebiggest business revolutions of our time — direct marketing and the Internet. Capital One isat the forefront of both because it excels at data mining, testing, customizing and innovat-ing. Financial services are ideal for direct marketing, and customer interactions produce anendless stream of information for research and development.
On the Internet, IBS works at unprecedented speeds. Testing and customizing happen in realtime. Approvals take less than a minute instead of a week. Account numbers are assignedwith approvals, so customers can use their cards online immediately. We’re a leader in onlinecredit cards. The Internet also expands opportunities for account servicing and cross-selling,and it opens the way for new online products and services. As we move into these new areas,we remain deeply committed to protecting the privacy of customer information on theInternet, in our database and throughout our marketing and customer service operations.
Knowing that there are no great companies without great people, we make recruiting our toppriority. The people we attract are talented, entrepreneurial individuals with big dreams oftheir own. They come for the big opportunities they see in a high-growth company with a cul-ture that prizes performance more than time and grade. Capital One’s 15,500 associates arefirst-rate at work and in their communities, where they volunteer their creativity, energy andtime. These contributions, plus financial support from Capital One, are making a difference incountless nonprofit programs, especially for children and families at risk.
For five years, Capital One has created great opportunities for associates, great products forcustomers and great returns for investors. We expect the next five years to be just as excit-ing. We have a winning strategy as well as the market power and the momentum for continuedstrong growth. Most important, we have the people who can help us realize our dream of great-ness. It has been said that you can tell a lot about people by the company they keep. Weagree. We’re proud to be judged by the company we keep. We invite you to join us in pursuingour dream.
Richard D. Fairbank Nigel W. MorrisChairman and Chief Executive Officer President and Chief Operating Officer

hyper–growth.
To describe ourtrajectory overthe last fiveyears, we had toinvent a word:
Revenuesgrewfrom$628million to $3.8billion.Up 512%.
Our ranks grew from2,500 associates to 15,500. Up 532%.
Customer base grew from 5 million to 24 million. Up 369%.

1999 financial presentation
27 Selected Financial and Operating Data
28 Management’s Discussion and Analysis of Financial Condition and Results of Operations
45 Selected Quarterly Financial Data
46 Management’s Report on ConsolidatedFinancial Statements and InternalControls Over Financial Reporting
47 Report of Independent Auditors
48 ConsolidatedFinancial Statements
52 Notes to Consolidated Financial Statements

27
Five-Year Year Ended December 31 Compound (Dollars in Thousands, Except Per Share Data) 1999 1998 1997 1996 1995 Growth Rate
Income Statement Data:Interest income $ 1,593,484 $ 1,111,536 $ 717,985 $ 660,483 $ 457,409 43.85%Interest expense 540,882 424,284 341,849 294,999 249,396 42.00Net interest income 1,052,602 687,252 376,136 365,484 208,013 44.87Provision for loan losses 382,948 267,028 262,837 167,246 65,895 65.62Net interest income after provision
for loan losses 669,654 420,224 113,299 198,238 142,118 37.91Non-interest income 2,372,359 1,488,283 1,069,130 763,424 553,043 42.99Non-interest expense 2,464,996 1,464,586 876,976 713,182 497,430 45.02Income before income taxes 577,017 443,921 305,453 248,480 197,731 31.49Income taxes 213,926 168,690 116,072 93,213 71,220 32.92Net income $ 363,091 $ 275,231 $ 189,381 $ 155,267 $ 126,511 30.68Dividend payout ratio 5.69% 7.46% 10.90% 13.24% 12.55%
Per Common Share:(1)
Basic earnings $ 1.84 $ 1.40 $ .96 $ .78 $ .64 30.83%Diluted earnings 1.72 1.32 .93 .77 .64 29.08Dividends .11 .11 .11 .11 .08Book value as of year-end 7.69 6.45 4.55 3.72 3.02Average common shares 197,593,371 196,768,929 198,209,691 198,682,893 197,072,514Average common and common
equivalent shares 210,682,740 208,765,296 202,952,592 201,075,699 199,176,852
Selected Average Balances:Securities $ 2,027,051 $ 1,877,276 $ 1,650,961 $ 1,147,079 $ 962,624 100.46%Allowance for loan losses (269,375) (214,333) (132,728) (83,573) (69,939) 32.31Total assets 11,085,013 8,330,432 6,568,937 5,568,960 4,436,055 33.34Interest-bearing deposits 2,760,536 1,430,042 958,885 1,046,122 769,688 137.87Borrowings 6,078,480 5,261,588 4,440,393 3,623,104 2,952,162 21.59Stockholders’ equity 1,407,899 1,087,983 824,077 676,759 543,364 42.50
Selected Year-End Balances:Securities $ 1,968,853 $ 2,080,980 $ 1,475,354 $ 1,358,103 $ 1,244,195Consumer loans 9,913,549 6,157,111 4,861,687 4,343,902 2,921,679Allowance for loan losses (342,000) (231,000) (183,000) (118,500) (72,000)Total assets 13,336,443 9,419,403 7,078,279 6,467,445 4,759,321Interest-bearing deposits 3,783,809 1,999,979 1,313,654 943,022 696,037Borrowings 6,961,014 5,481,593 4,526,550 4,525,216 3,301,672Stockholders’ equity 1,515,607 1,270,406 893,259 740,391 599,191
Managed Consumer Loan Data:Average reported loans $ 7,667,355 $ 5,348,559 $ 4,103,036 $ 3,651,908 $ 2,940,208 27.38%Average off-balance sheet loans 10,379,558 9,860,978 8,904,146 7,616,553 6,149,070 21.56Average total managed loans 18,046,913 15,209,537 13,007,182 11,268,461 9,089,278 23.83Interest income 3,285,736 2,583,872 2,045,967 1,662,990 1,192,100 34.97Year-end total managed loans 20,236,588 17,395,126 14,231,015 12,803,969 10,445,480 22.36Year-end total accounts (000s) 23,705 16,706 11,747 8,586 6,149 36.25Yield 17.59% 16.99% 15.73% 14.76% 13.12%Net interest margin 10.83 9.91 8.81 8.16 6.27Delinquency rate 5.23 4.70 6.20 6.24 4.20Net charge-off rate 3.85 5.33 6.59 4.24 2.25
Operating Ratios:Return on average assets 3.28% 3.30% 2.88% 2.79% 2.85%Return on average equity 25.79 25.30 22.98 22.94 23.28Equity to assets (average) 12.70 13.06 12.55 12.15 12.25Allowance for loan losses to
loans as of year-end 3.45 3.75 3.76 2.73 2.86
(1) All periods have been restated to reflect the Company’s three-for-one stock split effective June 1, 1999.
selected financial and operating data

28
INTRODUCTION
Capital One Financial Corporation (the “Corporation”) is a hold-
ing company whose subsidiaries provide a variety of products
and services to consumers using its Information-Based Strategy
(“IBS”). The principal subsidiaries are Capital One Bank (the
“Bank”), which offers credit card products, and Capital One,
F.S.B. (the “Savings Bank”), which offers consumer lending
products (including credit cards) and deposit products. The
Corporation and its subsidiaries are collectively referred to as
the “Company.” As of December 31, 1999, the Company had
23.7 million accounts and $20.2 billion in managed consumer
loans outstanding and was one of the largest providers of Mas-
terCard and Visa credit cards in the world.
The Company’s profitability is affected by the net interest
income and non-interest income earned on earning assets, con-
sumer usage patterns, credit quality, the level of marketing
expense and operating efficiency. The Company’s revenues con-
sist primarily of interest income on consumer loans and
securities, and non-interest income consisting of servicing
income on securitized loans, fees (such as annual membership,
cash advance, cross-sell, interchange, overlimit, past-due and
other fee income, collectively “fees”) and gains on the securiti-
zations of loans. The Company’s primary expenses are the costs
of funding assets, credit losses, operating expenses (including
salaries and associate benefits), marketing expenses and
income taxes.
Significant marketing expenses (e.g., advertising, printing,
credit bureau costs and postage) to implement the Company’s
new product strategies are incurred and expensed prior to the
acquisition of new accounts while the resulting revenues are
recognized over the life of the acquired accounts. Revenues rec-
ognized are a function of the response rate of the initial
marketing program, usage and attrition patterns, credit quality
of accounts, product pricing and effectiveness of account man-
agement programs.
EARNINGS SUMMARY
The following discussion provides a summary of 1999 results
compared to 1998 results and 1998 results compared to 1997
results. Each component is discussed in further detail in sub-
sequent sections of this analysis.
Year Ended December 31, 1999 Compared
to Year Ended December 31, 1998
Net income of $363.1 million, or $1.72 per share, for the year
ended December 31, 1999, compares to net income of $275.2
million, or $1.32 per share, in 1998. The 32% increase in net
income of $87.9 million is primarily the result of an increase in
both asset and account volumes and an increase in net interest
margin. Net interest income increased $365.4 million, or 53%,
as average earning assets increased 34% and the net interest
margin increased to 10.86% from 9.51%. The provision for loan
losses increased $115.9 million, or 43%, as the average
reported consumer loans increased 43%, offset by the reported
net charge-off rate decrease to 3.59% in 1999 from 4.24% in
1998. Non-interest income increased $884.1 million, or 59%,
primarily due to the increase in average managed accounts of
42%. Increases in marketing expenses of $285.6 million, or
64%, and salaries and benefits expense of $303.8 million, or
64%, reflect the increase in marketing investment in existing
and new product opportunities and the cost of operations to
manage the growth in the Company’s accounts and products
offered. Average managed consumer loans grew 19% for the
year ended December 31, 1999, to $18.0 billion from $15.2 bil-
lion for the year ended December 31,
1998, and average accounts grew
42% for the same period to 19.6 mil-
lion from 13.8 million as a result
of the continued success of the
Company’s marketing and account
management strategies.
Year Ended December 31, 1998
Compared to Year Ended
December 31, 1997
Net income of $275.2 million, or
$1.32 per share, for the year ended
December 31, 1998, compares to
net income of $189.4 million, or
$.93 per share, in 1997. The 45%
increase in net income of $85.9 mil-
lion is primarily the result of an
increase in both asset and account
volumes and an increase in net inter-
est margin. Net interest income
management’s discussion and analysis of financialcondition and results of operations
(in millions)
$189 $275 $363
97 98 99
net income
(in percentages)
23 25 26
97 98 99
return onaverage equity

29
increased $311.1 million, or 83%, as average earning assets
increased 26% and the net interest margin increased to 9.51%
from 6.54%. The provision for loan losses increased $4.2 mil-
lion, or 2%, as the reported charge-off rate decreased to 4.24%
in 1998 from 4.83% in 1997, offset by average reported con-
sumer loans increasing 30%. Non-interest income increased
$419.2 million, or 39%, primarily due to the increase in aver-
age managed accounts of 39%. Increases in marketing
expenses of $221.4 million, or 98%, and salaries and benefits
expense of $187.1 million, or 65% reflect the increase in mar-
keting investment in existing and new product opportunities and
the cost of operations to manage the growth in the Company’s
accounts and products offered. Average managed consumer
loans grew 17% for the year ended December 31, 1998, to
$15.2 billion from $13.0 billion for the year ended December
31, 1997, and average accounts grew 39% for the same period
to 13.8 million from 9.9 million as a result of the continued suc-
cess of the Company’s marketing and account management
strategies.
MANAGED CONSUMER LOAN PORTFOLIO
The Company analyzes its financial performance on a managed
consumer loan portfolio basis. Managed consumer loan data
adds back the effect of off-balance sheet consumer loans. The
Company also evaluates its interest rate exposure on a man-
aged portfolio basis.
The Company’s managed consumer loan portfolio is com-
prised of reported and off-balance sheet loans. Off-balance
sheet loans are those which have been securitized and
accounted for as sales in accordance with Statement of Finan-
cial Accounting Standards (“SFAS”) No. 125, “Accounting for
Transfers and Servicing of Financial Assets and Extinguishments
of Liabilities” (“SFAS 125”), and are not assets of the Company.
Therefore, those loans are not shown on the balance sheet.
Table 1 summarizes the Company’s managed consumer
loan portfolio.
table 1: MANAGED CONSUMER LOAN PORTFOLIO
Year Ended December 31 (In Thousands) 1999 1998 1997 1996 1995
Year-End Balances:
Reported consumer loans $ 9,913,549 $ 6,157,111 $ 4,861,687 $ 4,343,902 $ 2,921,679
Off-balance sheet consumer loans 10,323,039 11,238,015 9,369,328 8,460,067 7,523,801
Total managed consumer loan portfolio $ 20,236,588 $ 17,395,126 $ 14,231,015 $ 12,803,969 $ 10,445,480
Average Balances:
Reported consumer loans $ 7,667,355 $ 5,348,559 $ 4,103,036 $ 3,651,908 $ 2,940,208
Off-balance sheet consumer loans 10,379,558 9,860,978 8,904,146 7,616,553 6,149,070
Total managed consumer loan portfolio $ 18,046,913 $ 15,209,537 $ 13,007,182 $ 11,268,461 $ 9,089,278
Since 1990, the Company has actively engaged in con-
sumer loan securitization transactions. Securitization involves
the transfer by the Company of a pool of loan receivables to an
entity created for securitizations, generally a trust or other spe-
cial purpose entity (“the trusts”). The credit quality of the
receivables is supported by credit enhancements, which may be
in various forms including a letter of credit, a cash collateral
guaranty or account, or a subordinated interest in the receiv-
ables in the pool. Certificates ($10.3 billion outstanding as of
December 31, 1999) representing undivided ownership inter-
ests in the receiv-
ables are sold to the
public through an
underwritten offering
or to private investors
in private placement
transactions. The Com-
pany receives the pro-
ceeds of the sale.
(in billions)
$10.4 $12.8 $14.2 $17.4 $20.2
95 96 97 98 99
managed loans

30
The Company retains an interest in the trusts (“seller’s in-
terest”) equal to the amount of the receivables transferred to
the trust in excess of the principal balance of the certificates.
The Company’s interest in the trusts varies as the amount of the
excess receivables in the trusts fluctuates as the accounthold-
ers make principal payments and incur new charges on the se-
lected accounts. The securitization generally results in the
removal of the receivables, other than the seller’s interest, from
the Company’s balance sheet for financial and regulatory ac-
counting purposes.
The Company’s relationship with its customers is not
affected by the securitization. The Company acts as a servicing
agent and receives a fee.
Collections received from securitized receivables are used
to pay interest to certificateholders, servicing and other fees,
and are available to absorb the investors’ share of credit losses.
Amounts collected in excess of that needed to pay the above
amounts are remitted to the Company, as described in Servic-
ing and Securitizations Income.
Certificateholders in the Company’s securitization program
are generally entitled to receive principal payments either
through monthly payments during an amortization period or in
one lump sum after an accumulation period. Amortization may
begin sooner in certain circumstances, including if the annual-
ized portfolio yield (consisting, generally, of interest and fees)
for a three-month period drops below the sum of the certificate
rate payable to investors, loan servicing fees and net credit
losses during the period.
Prior to the commencement of the amortization or accu-
mulation period, all principal payments received on the trusts’
receivables are reinvested in new re-
ceivables to maintain the principal
balance of certificates. During the
amortization period, the investors’
share of principal payments is paid
to the certificateholders until they
are paid in full. During the accumu-
lation period, the investors’ share of
principal payments is paid into a
principal funding account designed
to accumulate amounts so that the
certificates can be paid in full on the
expected final payment date.
Table 2 indicates the impact of
the consumer loan securitizations on
average earning assets, net interest
margin and loan yield for the periods
presented. The Company intends to
continue to securitize consumer loans.
(in percentages)
8.81 9.91 10.83
97 98 99
managed netinterest margin
(in percentages)
15.73 16.99 17.59
97 98 99
managed loan yield
table 2: OPERATING DATA AND RATIOS
Year Ended December 31 (Dollars in Thousands) 1999 1998 1997
Reported:
Average earning assets $ 9,694,406 $ 7,225,835 $ 5,753,997
Net interest margin 10.86% 9.51% 6.54%
Loan yield 19.33 18.75 15.11
Managed:
Average earning assets $ 20,073,964 $ 17,086,813 $ 14,658,143
Net interest margin 10.83% 9.91% 8.81%
Loan yield 17.59 16.99 15.73
RISK ADJUSTED REVENUE AND MARGIN
The Company’s products are designed with the objective of max-
imizing revenue for the level of risk undertaken. Management
believes that comparable measures for external analysis are the
risk adjusted revenue and risk adjusted margin of the managed
portfolio. Risk adjusted revenue is defined as net interest
income and non-interest income less net charge-offs. Risk
adjusted margin measures risk adjusted revenue as a percent-

31
age of average earning assets. It con-
siders not only the loan yield and net
interest margin, but also the fee
income associated with these prod-
ucts. By deducting net charge-offs,
consideration is given to the risk
inherent in these differing products.
The Company markets its card
products to specifically targeted con-
sumer populations. The terms of
each card product are actively managed in an effort to maxi-
mize return at the consumer level, reflecting the risk and
expected performance of the account. For example, card prod-
uct terms typically include the ability to reprice individual
accounts upwards or downwards based on the consumer’s
performance. In addition, since 1998, the Company has aggres-
sively marketed low non-introductory rate cards to consumers
with the best established credit profiles to take advantage of
the favorable risk return characteristics of this consumer type.
Industry competitors have continuously solicited the Company’s
customers with similar interest rate strategies. Management
believes the competition has put, and will continue to put, addi-
tional pressure on the Company’s pricing strategies.
By applying its IBS and in response to dynamic competitive
pressures, the Company also targets a significant amount of its
marketing expense to other credit card product opportunities.
Examples of such products include secured cards and other cus-
tomized card products including
affinity and co-branded cards, stu-
dent cards and other cards targeted
to certain markets that are under-
served by the Company’s competi-
tors. These products do not have a
significant, immediate impact on
managed loan balances; rather they
typically consist of lower credit limit
accounts and balances that build
over time. The terms of these cus-
tomized card products tend to in-
clude annual membership fees and
higher annual finance charge rates.
The profile of the consumers tar-
geted for these products, in some
cases, may also tend to result in
higher account delinquency rates
and consequently higher past-due
and overlimit fees as a percentage of
loan receivables outstanding than the
low non-introductory rate products.
Table 3 provides income statement data and ratios for the
Company’s managed consumer loan portfolio. The causes of
increases and decreases in the various components of risk
adjusted revenue are discussed in further detail in subsequent
sections of this analysis.
(in billions)
$1.2 $1.9 $3.1
97 98 99
managed riskadjusted revenue
(in percentages)
8.26 11.41 15.69
97 98 99
managed riskadjusted margin
(in billions)
$2.1 $2.8 $3.8
97 98 99
managed revenue
table 3: MANAGED RISK ADJUSTED REVENUE
Year Ended December 31 (Dollars in Thousands) 1999 1998 1997
Managed Income Statement:
Net interest income $ 2,174,726 $ 1,692,894 $ 1,292,315
Non-interest income 1,668,381 1,066,413 775,516
Net charge-offs (694,073) (810,306) (856,704)
Risk adjusted revenue $ 3,149,034 $ 1,949,001 $ 1,211,127
Ratios:(1)
Net interest margin 10.83% 9.91% 8.81%
Non-interest income 8.31 6.24 5.29
Net charge-offs (3.45) (4.74) (5.84)
Risk adjusted margin 15.69% 11.41% 8.26%
(1) As a percentage of average managed earning assets.

32
NET INTEREST INCOME
Net interest income is interest and past-due fees earned from
the Company’s consumer loans and securities less interest
expense on borrowings, which include interest-bearing deposits,
other borrowings and borrowings from senior and deposit notes.
Reported net interest income for the year ended
December 31, 1999, was $1.1 billion compared to $687.3 mil-
lion for 1998, representing an increase of $365.4 million, or
53%. Net interest income increased as a result of both growth
in earning assets and an increase in the net interest margin.
Average earning assets increased 34% for the year ended
December 31, 1999, to $9.7 billion from $7.2 billion for the year
ended December 31, 1998. The reported net interest margin
increased to 10.86% in 1999, from 9.51% in 1998 primarily
attributable to a 58 basis point increase in the yield on con-
sumer loans to 19.33% for the year ended December 31, 1999,
from 18.75% for the year ended December 31, 1998. The yield
on consumer loans increased primarily due to an increase in the
amount and frequency of past-due fees as compared to the
prior year, continued growth in the Company’s portfolio of higher
yielding products and repricings of low introductory rate loans
during late 1998 and early 1999.
The managed net interest margin for the year ended
December 31, 1999, increased to 10.83% from 9.91% for the
year ended December 31, 1998. This increase was primarily the
result of a 60 basis point increase in consumer loan yield for
the year ended December 31, 1999, as well as a decrease of 26
basis points in borrowing costs to 5.79% in 1999, from 6.05%
in 1998. The increase in consumer loan yield to 17.59% for the
year ended December 31, 1999, from 16.99% in 1998 princi-
pally reflected increases in the amount and frequency of
past-due fees and growth in higher yielding loans.
Reported net interest income for the year ended
December 31, 1998 was $687.3 million, compared to
$376.1 million for 1997, representing an increase of
$311.1 million, or 83%. Net interest income increased as a
result of growth in earning assets and an increase in the net
interest margin. Average earning assets increased 26% for the
year ended December 31, 1998, to $7.2 billion from $5.8 billion
for 1997. The reported net interest margin increased to 9.51%
in 1998, from 6.54% in 1997 and was primarily attributable to
a 364 basis point increase in the yield on consumer loans to
18.75% for the year ended December 31, 1998, from 15.11%
for the year ended December 31, 1997. The yield on consumer
loans increased primarily due to an increase in the amount and
frequency of past-due fees as compared to the prior year. In
addition, the Company’s continued shift to higher yielding prod-
ucts, offset by growth in low non-introductory rate products,
contributed to the increase in yield on consumer loans during
the same periods.
The managed net interest margin for the year ended
December 31, 1998, increased to 9.91% from 8.81% for the
year ended December 31, 1997. This increase was primarily the
result of a 126 basis point increase in consumer loan yield for
the year ended December 31, 1998, offset by an increase of
nine basis points in borrowing costs for the same period, as
compared to 1997. The increase in consumer loan yield to
16.99% for the year ended December 31, 1998, from 15.73%
in 1997 principally reflected increases in the amount and fre-
quency of past-due fees and growth in higher yielding loans. The
average rate paid on borrowed funds increased slightly reflect-
ing the Company’s shift to more fixed rate funding to match the
increase in fixed rate consumer loan products.
Table 4 provides average balance sheet data, an analysis of
net interest income, net interest spread (the difference between
the yield on earning assets and the cost of interest-bearing lia-
bilities) and net interest margin for each of the years ended
December 31, 1999, 1998 and 1997.

33
table 4: STATEMENTS OF AVERAGE BALANCES, INCOME AND EXPENSE, YIELDS AND RATES
Year Ended December 31 1999 1998 1997Average Income/ Yield/ Average Income/ Yield/ Average Income/ Yield/
(Dollars in Thousands) Balance Expense Rate Balance Expense Rate Balance Expense Rate
Assets:Earning assets
Consumer loans(1) $ 7,667,355 $ 1,482,371 19.33% $ 5,348,559 $ 1,003,122 18.75% $ 4,103,036 $ 619,785 15.11%
Securities available for sale 1,852,826 105,438 5.69 1,628,164 94,436 5.80 1,289,592 78,542 6.09
Other 174,225 5,675 3.26 249,112 13,978 5.61 361,369 19,658 5.44
Total earning assets 9,694,406 $ 1,593,484 16.44% 7,225,835 $ 1,111,536 15.38% 5,753,997 $ 717,985 12.48%
Cash and due from banks 17,046 4,385 (2,636)
Allowance for loan losses (269,375) (214,333) (132,728)
Premises and equipment, net 366,709 201,173 181,610
Other 1,276,227 1,113,372 768,694
Total assets $ 11,085,013 $ 8,330,432 $ 6,568,937
Liabilities and Equity:Interest-bearing liabilities
Deposits $ 2,760,536 $ 137,792 4.99% $ 1,430,042 $ 67,479 4.72% $ 958,885 $ 41,932 4.37%
Other borrowings 1,687,042 100,392 5.95 1,473,949 96,130 6.52 721,405 46,068 6.39
Senior and deposit notes 4,391,438 302,698 6.89 3,787,639 260,675 6.88 3,718,988 253,849 6.83
Total interest-bearing liabilities 8,839,016 $ 540,882 6.12% 6,691,630 $ 424,284 6.34% 5,399,278 $ 341,849 6.33%
Other 838,098 550,819 345,582
Total liabilities 9,677,114 7,242,449 5,744,860
Equity 1,407,899 1,087,983 824,077
Total liabilities and equity $ 11,085,013 $ 8,330,432 $ 6,568,937
Net interest spread 10.32% 9.04% 6.15%
Interest income to average
earning assets 16.44 15.38 12.48
Interest expense to average
earning assets 5.58 5.87 5.94
Net interest margin 10.86% 9.51% 6.54%
(1) Interest income includes past-due fees on loans of approximately $478,918, $301,979 and $132,297 for the years ended December 31, 1999, 1998 and 1997,respectively.

34
SERVICING AND SECURITIZATIONS INCOME
In accordance with SFAS 125, the Company records gains or
losses on the securitizations of consumer loan receivables on
the date of sale based on the estimated fair value of assets sold
and retained and liabilities incurred in the sale. Gains represent
the present value of estimated excess cash flows the Company
has retained over the estimated outstanding period of the
receivables and are included in servicing and securitizations
income. This excess cash flow essentially represents an “inter-
est only” (“I/O”) strip, consisting of the excess of finance charges
and past-due fees over the sum of the return paid to certifi-
cateholders, estimated contractual servicing fees and credit
losses. However, exposure to credit losses on the securitized
loans is contractually limited to these cash flows.
Servicing and securitizations income increased $397.3 mil-
lion, or 50%, to $1.2 billion for the year ended December 31,
1999, from $789.8 million in 1998. This increase was prima-
rily due to a decrease in net charge-offs on such loans as a
result of improved general economic trends in consumer credit,
increased purchase volume, membership and overlimit fees, as
well as a slight increase in average off-balance sheet consumer
loans.
Servicing and securitizations income increased $107.5 mil-
lion, or 16%, to $789.8 million for the year ended December 31,
1998, from $682.3 million for 1997. This increase was prima-
rily due to an increase of 11% in average off-balance sheet
consumer loans. Also contributing to this increase were
decreased charge-offs on such loans as a result of improving
consumer credit.
Certain estimates inherent in the determination of the fair
value of the I/O strip are influenced by factors outside the
Company’s control, and as a result, such estimates could mate-
rially change in the near term. Any future gains that will be
recognized in accordance with SFAS 125 will be dependent on
the timing and amount of future securitizations. The Company
table 5: INTEREST VARIANCE ANALYSIS
Year Ended December 31 1999 vs. 1998 1998 vs. 1997
Increase Change Due to(1) Increase Change Due to(1)
(In Thousands) (Decrease) Volume Yield/Rate (Decrease) Volume Yield/Rate
Interest Income:
Consumer loans $ 479,249 $ 447,414 $ 31,835 $ 383,337 $ 213,453 $ 169,884
Securities available for sale 11,002 12,814 (1,812) 15,894 19,789 (3,895)
Other (8,303) (3,466) (4,837) (5,680) (6,281) 601
Total interest income 481,948 401,413 80,535 393,551 206,040 187,511
Interest Expense:
Deposits 70,313 66,199 4,114 25,547 22,007 3,540
Other borrowings 4,262 13,140 (8,878) 50,062 49,060 1,002
Senior and deposit notes 42,023 41,619 404 6,826 4,713 2,113
Total interest expense 116,598 131,870 (15,272) 82,435 81,941 494
Net interest income(1) $ 365,350 $ 258,291 $ 107,059 $ 311,116 $ 111,967 $ 199,149
(1) The change in interest due to both volume and yield/rates has been allocated in proportion to the relationship of the absolute dollar amounts of the change ineach. The changes in income and expense are calculated independently for each line in the table. The totals for the volume and yield/rate columns are not thesum of the individual lines.
INTEREST VARIANCE ANALYSIS
Net interest income is affected by changes in the average inter-
est rate earned on earning assets and the average interest rate
paid on interest-bearing liabilities. In addition, net interest
income is affected by changes in the volume of earning assets
and interest-bearing liabilities. Table 5 sets forth the dollar
amount of the increases (decreases) in interest income and
interest expense resulting from changes in the volume of earn-
ing assets and interest-bearing liabilities and from changes in
yields and rates.

35
will continuously assess the performance of new and existing
securitization transactions as estimates of future cash flows
change.
OTHER NON-INTEREST INCOME
Interchange income increased $57.8 million, or 67%, to
$144.3 million for the year ended December 31, 1999, from
$86.5 million in 1998. Service charges and other fees increased
to $1.0 billion, or 70%, for the year ended December 31, 1999
compared to $612.0 million for the year ended December 31,
1998. These increases were primarily due to a 42% increase in
the average number of accounts for the year ended December 31,
1999, from 1998, an increase in purchase volume, an increase
in interchange rates received by the Company and a shift to
more fee-intensive products.
Interchange income increased $37.5 million, or 76%, to
$86.5 million for the year ended December 31, 1998, from
$49.0 million in 1997. Service charges and other fees increased
to $612.0 million, or 81%, for the year ended December 31,
1998 compared to $337.8 million for the year ended December
31, 1997. These increases were due to a 39% increase in the
average number of accounts for the year ended December 31,
1998, from 1997, an increase in charge volume, a shift to more
fee-intensive products and changes in the terms of overlimit
fees charged.
NON-INTEREST EXPENSE
Non-interest expense for the year ended December 31, 1999,
increased $1.0 billion, or 68%, to $2.5 billion from $1.5 billion
for the year ended December 31, 1998. Contributing to the
increase in non-interest expense were marketing expenses
which increased $285.6 million, or
64%, to $731.9 million in 1999, from
$446.3 million in 1998. The increase
in marketing expenses during 1999
reflects the Company’s continued
identification of and investments in
opportunities for growth. Salaries
and associate benefits increased
$303.8 million, or 64%, to $780.2
million in 1999, from $476.4 million
in 1998, as the Company added approximately 5,000 associates
to our staffing levels to manage the growth in the Company’s
accounts. All other non-interest expenses increased $411.0 mil-
lion, or 76%, to $952.9 million for the year ended December 31,
1999, from $541.9 million in 1998. The increase in other non-
interest expense, as well as the increase in salaries and
associate benefits, was primarily a result of a 42% increase in
the average number of accounts for the year ended December 31,
1999 and the Company’s continued exploration and testing of
new products and markets.
Non-interest expense for the year ended December 31,
1998 increased $587.6 million, or 67%, to $1.5 billion from
$877.0 million for the year ended December 31, 1997. Con-
tributing to the increase in non-interest expense were marketing
expenses which increased $221.4 million, or 98%, to
$446.3 million in 1998, from $224.8 million in 1997. The
increase in marketing expenses during 1998 reflects the Com-
pany’s continued identification of and investments in
opportunities for growth. Salaries and associate benefits
increased $187.1 million, or 65%, to $476.4 million in 1998
from $289.3 million in 1997, as the Company added approx-
imately 4,500 associates to manage the growth in the
Company’s accounts. This increase also reflects an additional
$45.3 million in compensation expense associated with the
Company’s associate stock plans compared to the prior year. All
other non-interest expenses increased $179.1 million, or 49%, to
$541.9 million for the year ended December 31, 1998 from
$362.8 million in 1997. The increase in other non-interest
expenses was primarily the result of a 39% increase in the aver-
age number of accounts for the year ended December 31, 1998.
INCOME TAXES
The Company’s income tax rate was 37%, 38% and 38%, for the
years ended December 31, 1999, 1998 and 1997, respectively.
The effective rate includes both state and federal income tax
components.
ASSET QUALITY
The asset quality of a portfolio is generally a function of the ini-
tial underwriting criteria used, levels of competition, account
(in millions)
$225 $446 $732
97 98 99
marketinginvestment

36
DELINQUENCIES
Table 6 shows the Company’s consumer loan delinquency trends
for the years presented on a reported and managed basis. The
entire balance of an account is con-
tractually delinquent if the minimum
payment is not received by the pay-
ment due date. Delinquencies not only
have the potential to impact earn-
ings if the account charges off, they
also are costly in terms of the per-
sonnel and other resources dedi-
cated to resolving the delinquencies.
The 30-plus day delinquency
rate for the reported consumer
loan portfolio increased to 5.92%
as of December 31, 1999, from
4.70% as of December 31, 1998.
The 30-plus day delinquency rate for
the managed consumer loan port-
folio was 5.23% as of December 31,
1999, up from 4.70% as of Decem-
ber 31, 1998.
management activities and demographic concentration, as well
as general economic conditions. The seasoning of the accounts
is also an important factor as accounts tend to exhibit a rising
trend of delinquency and credit losses as they season. As of
December 31, 1999 and 1998, 60% and 59% of managed
accounts, respectively, representing 51% of the total managed
loan balance, were less than eighteen months old. Accordingly,
it is likely that the Company’s managed loan portfolio could
experience increased levels of delinquency and credit losses as
the average age of the Company’s accounts increases.
Changes in the rates of delinquency and credit losses can
also result from a shift in the product mix. As discussed in “Risk
Adjusted Revenue and Margin,” certain other customized card
products have, in some cases, higher delinquency and higher
charge-off rates. In the case of secured card loans, collateral, in
the form of cash deposits, reduces any ultimate charge-offs. The
costs associated with higher delinquency and charge-off rates
are considered in the pricing of individual products.
During 1999, general economic conditions for consumer
credit remained stable as industry levels of charge-offs (includ-
ing bankruptcies) and delinquencies both decreased. These
trends have positively impacted the Company’s 1999 results.
table 6: DELINQUENCIES
December 31 1999 1998 1997 1996 1995% of % of % of % of % of
Total Total Total Total Total (Dollars in Thousands) Loans Loans Loans Loans Loans Loans Loans Loans Loans Loans
Reported:Loans outstanding $ 9,913,549 100.00% $ 6,157,111 100.00% $ 4,861,687 100.00% $ 4,343,902 100.00% $ 2,921,679 100.00%
Loans delinquent:30–59 days 236,868 2.39 123,162 2.00 104,216 2.14 96,819 2.23 65,711 2.25
60–89 days 129,251 1.30 67,504 1.10 64,217 1.32 55,679 1.28 38,311 1.31
90 or more days 220,513 2.23 98,798 1.60 99,667 2.05 111,791 2.57 79,694 2.73
Total $ 586,632 5.92% $ 289,464 4.70% $ 268,100 5.51% $ 264,289 6.08% $ 183,716 6.29%
Managed:Loans outstanding $ 20,236,588 100.00% $ 17,395,126 100.00% $ 14,231,015 100.00% $ 12,803,969 100.00% $ 10,445,480 100.00%
Loans delinquent:30–59 days 416,829 2.06 329,239 1.89 327,407 2.30 279,787 2.19 165,306 1.58
60–89 days 238,476 1.18 182,982 1.05 213,726 1.50 162,668 1.27 92,665 .89
90 or more days 403,464 1.99 305,589 1.76 340,887 2.40 356,700 2.78 181,243 1.73
Total $ 1,058,769 5.23% $ 817,810 4.70% $ 882,020 6.20% $ 799,155 6.24% $ 439,214 4.20%
(in percentages)
6.20 4.70 5.23
97 98 99
managed 30+ daydelinquency rate
(in percentages)
6.59 5.33 3.85
97 98 99
managed netcharge-off rate

37
NET CHARGE-OFFS
Net charge-offs include the principal amount of losses (exclud-
ing accrued and unpaid finance charges, fees and fraud losses)
less current period recoveries. The Company charges off credit
card loans (net of any collateral) at 180 days past due.
For the year ended December 31, 1999, the managed net
charge-off rate decreased 148 basis points to 3.85%. For the
year ended December 31, 1999, the reported net charge-off
rate decreased 65 basis points to 3.59%. The decreases in man-
aged and reported net charge-off rates were the result of
improved general economic trends in consumer credit per-
formance as well as improved recovery efforts. The impact was
less apparent in the reported net charge-offs due to changes in
the composition of the reported portfolio compared to the off-
balance sheet portfolio. Table 7 shows the Company’s net
charge-offs for the years presented on a reported and man-
aged basis.
The Company’s objective is to optimize the profitability of
each account within acceptable risk characteristics. The Com-
pany takes measures as necessary, including requiring collateral
on certain accounts and other marketing and account man-
agement techniques, to maintain the Company’s credit quality
standards and to manage the risk of loss on existing accounts.
See “Risk Adjusted Revenue and Margin” for further discussion.
table 7: NET CHARGE-OFFS
Year Ended December 31 (Dollars in Thousands) 1999 1998 1997 1996 1995
Reported:
Average loans outstanding $ 7,667,355 $ 5,348,559 $ 4,103,036 $ 3,651,908 $ 2,940,208
Net charge-offs 275,470 226,531 198,192 132,590 59,618
Net charge-offs as a percentage of average loans outstanding 3.59% 4.24% 4.83% 3.63% 2.03%
Managed:
Average loans outstanding $ 18,046,913 $ 15,209,537 $ 13,007,182 $ 11,268,461 $ 9,089,278
Net charge-offs 694,073 810,306 856,704 477,732 204,828
Net charge-offs as a percentage of average loans outstanding 3.85% 5.33% 6.59% 4.24% 2.25%
PROVISION AND ALLOWANCE FOR LOAN LOSSES
The allowance for loan losses is maintained at an amount esti-
mated to be sufficient to absorb probable future losses, net of
recoveries (including recovery of collateral), inherent in the exist-
ing reported loan portfolio. The provision for loan losses is the
periodic cost of maintaining an adequate allowance. Manage-
ment believes that the allowance for loan losses is adequate to
cover anticipated losses in the reported homogeneous con-
sumer loan portfolio under current conditions. There can be no
assurance as to future credit losses that may be incurred in con-
nection with the Company’s consumer loan portfolio, nor can
there be any assurance that the loan loss allowance that has
been established by the Company will be sufficient to absorb
such future credit losses. The allowance is a general allowance
applicable to the entire reported homogeneous consumer loan
portfolio, including the Company’s international portfolio which
to date has performed with relatively lower loss and delinquency
rates than the overall portfolio.
The amount of allowance necessary is determined prima-
rily based on a migration analysis of delinquent and current
accounts. In evaluating the sufficiency of the allowance for loan
losses, management also takes into consideration the following
factors: recent trends in delinquencies and charge-offs includ-
ing bankrupt, deceased and recovered amounts; historical
trends in loan volume; forecasting uncertainties and size of
credit risks; the degree of risk inherent in the composition of
the loan portfolio; economic conditions; credit evaluations and
underwriting policies. Additional information on the Company’s

Internationally, the Company has funding programs
designed for foreign investors or to raise funds in foreign cur-
rencies. The Company has accessed the international
securitization market for a number of years with both US$ and
foreign denominated transactions. Both of the Company’s com-
mitted revolving credit facilities offer foreign currency funding
options. The Bank has established a $1.0 billion Euro Medium
Term Note program that is targeted to non-U.S. investors. The
Company funds its foreign assets by directly or synthetically bor-
rowing or securitizing in the local currency to mitigate the
financial statement effect of currency translation.
38
allowance for loan loss policy can be found in Note A to the
Consolidated Financial Statements.
Table 8 sets forth the activity in the allowance for loan
losses for the periods indicated. See “Asset Quality,” “Delin-
For the year ended December 31, 1999, the provision for
loan losses increased to $382.9 million, or 43%, from the 1998
provision for loan losses of $267.0 million as average reported
loans increased by 43%. The Company increased the allowance
for loan losses by $111.0 million during 1999 due to the
increase in the delinquency rate, the growth in reported loans
and the increase in the dollar amount of net charge-offs.
For the year ended December 31, 1998, the provision for
loan losses increased to $267.0 million, or 2%, from the 1997
provision for loan losses of $262.8 million as average reported
loans increased by 30%, offset by general improvements in con-
sumer credit performance. The Company increased the
allowance for loan losses by $48.0 million during 1998 prima-
rily due to the growth in reported loans.
FUNDING
The Company has established access to a wide range of domes-
tic funding alternatives, in addition to securitization of its con-
sumer loans. The Company primarily issues senior unsecured
debt of the Bank through its $8 billion bank note program, of
which $3.6 billion was outstanding as of December 31, 1999,
with original terms of one to ten years. During 1999, the Bank
continued to expand its fixed income investor base by launching
$925 million of benchmark underwritten senior note transac-
tions. The Corporation continued to access the capital markets
with a $225 million seven-year senior note.
funding (in millions)
total funding: $10,745 total funding: $7,481
December 31, 1999 December 31, 1998
$3,784$2,780
$2,230$1,951
$2,000 $1,742
$2,478$1,261
interest-bearing depositsother borrowings
senior notes <3 yearssenior notes >3 years
table 8: SUMMARY OF ALLOWANCE FOR LOAN LOSSES
Year Ended December 31 (Dollars in Thousands) 1999 1998 1997 1996 1995
Balance at beginning of year $ 231,000 $ 183,000 $ 118,500 $ 72,000 $ 68,516
Provision for loan losses 382,948 267,028 262,837 167,246 65,895
Acquisitions/other 3,522 7,503 (2,770) (18,887) (11,504)
Charge-offs (400,143) (294,295) (223,029) (115,159) (64,260)
Recoveries 124,673 67,764 27,462 13,300 13,353
Net charge-offs (275,470) (226,531) (195,567) (101,859) (50,907)
Balance at end of year $ 342,000 $ 231,000 $ 183,000 $ 118,500 $ 72,000
Allowance for loan losses to loans at end of year 3.45% 3.75% 3.76% 2.73% 2.86%
quencies” and “Net Charge-Offs” for a more complete analysis
of asset quality.

39
Company had $3.8 billion in interest-bearing deposits, with
maturities up to ten years.
Table 9 reflects the costs of other borrowings of the Com-
pany as of and for each of the years ended December 31, 1999,
1998 and 1997.
table 9: SHORT-TERM BORROWINGS
Maximum Outstanding Outstanding Average Year-End
as of any as of Average Interest Interest(Dollars in Thousands) Month-End Year-End Outstanding Rate Rate
1999
Federal funds purchased and resale agreements $ 1,491,463 $ 1,240,000 $ 1,046,475 5.33% 5.84%
Other 193,697 97,498 175,593 8.42 3.97
Total $ 1,337,498 $ 1,222,068 5.77% 5.70%
1998
Federal funds purchased and resale agreements $ 1,451,029 $ 1,227,000 $ 1,169,952 6.09% 5.53%
Other 417,279 417,279 206,204 8.44 6.58
Total $ 1,644,279 $ 1,376,156 6.44% 5.80%
1997
Federal funds purchased and resale agreements $ 999,200 $ 705,863 $ 503,843 5.54% 5.75%
Other 160,144 90,249 128,033 8.71 7.09
Total $ 796,112 $ 631,876 6.18% 5.90%
Table 10 shows the maturities of certificates of deposit in
denominations of $100,000 or greater (large denomination
CDs) as of December 31, 1999.
table 10: MATURITIES OF DOMESTIC LARGE
DENOMINATION CERTIFICATES — $100,000 OR MORE
December 31, 1999 (Dollars in Thousands) Balance Percent
3 months or less $ 205,630 19.11%
Over 3 through 6 months 106,435 9.89
Over 6 through 12 months 254,858 23.68
Over 12 months 509,153 47.32
Total $ 1,076,076 100.00%
Additional information regarding funding can be found in
Note E to the Consolidated Financial Statements.
LIQUIDITY
Liquidity refers to the Company’s ability to meet its cash needs.
The Company meets its cash requirements by securitizing
assets, gathering deposits and issuing debt. As discussed in
“Managed Consumer Loan Portfolio,” a significant source of li-
quidity for the Company has been the securitization of consumer
loans. Maturity terms of the existing securitizations vary from
2000 to 2008 and typically have accumulation periods during
which principal payments are aggregated to make payments to
investors. As payments on the loans are accumulated and are
no longer reinvested in new loans, the Company’s funding
requirements for such new loans increase accordingly. The
The Company has significantly expanded its retail deposit
gathering efforts through both direct and broker marketing
channels. The Company uses its IBS capabilities to test
and market a variety of retail deposit origination strategies,
including the Internet, as well as to develop customized
account management programs. As of December 31, 1999, the

As such amounts amortize or are otherwise paid, the Com-
pany believes it can securitize consumer loans, purchase federal
funds and establish other funding sources to fund the amorti-
zation or other payment of the securitizations in the future,
although no assurance can be given to that effect. Additionally,
the Company maintains a portfolio of high-quality securities
such as U.S. Treasuries and other U.S. government obligations,
commercial paper, interest-bearing deposits with other banks,
federal funds and other cash equivalents in order to provide ade-
quate liquidity and to meet its ongoing cash needs. As of
December 31, 1999, the Company had $2.0 billion of such
securities.
Liability liquidity is measured by the Company’s ability to
obtain borrowed funds in the financial markets in adequate
amounts and at favorable rates. As of December 31, 1999, the
Company, the Bank and the Savings Bank collectively had over
$1.6 billion in unused commitments, under its credit facilities,
available for liquidity needs.
CAPITAL ADEQUACY
The Bank and the Savings Bank are subject to capital adequacy
guidelines adopted by the Federal Reserve Board (the “Federal
Reserve”) and the Office of Thrift Supervision (the “OTS”) (col-
lectively, the “regulators”), respectively. The capital adequacy
guidelines and the regulatory framework for prompt corrective
action require the Bank and the Savings Bank to maintain spe-
cific capital levels based upon quantitative measures of their
assets, liabilities and off-balance sheet items.
The most recent notifications received from the regulators
categorized the Bank and the Savings Bank as “well-capitalized.”
As of December 31, 1999, there are no conditions or events
since the notifications discussed above that management
believes have changed either the Bank or the Savings Bank’s
capital category.
During 1996, the Bank received regulatory approval and
established a branch office in the United Kingdom. In connec-
tion with such approval, the Company committed to the Federal
Reserve that, for so long as the Bank maintains a branch in the
United Kingdom, the Company will maintain a minimum Tier 1
Leverage ratio of 3.0%. As of December 31, 1999 and 1998,
the Company’s Tier 1 Leverage ratio was 12.79% and 13.49%,
respectively.
Additional information regarding capital adequacy can be
found in Note J to the Consolidated Financial Statements.
DIVIDEND POLICY
Although the Company expects to reinvest a substantial portion
of its earnings in its business, the Company intends to continue
to pay regular quarterly cash dividends on the Common Stock.
The declaration and payment of dividends, as well as the
amount thereof, is subject to the discretion of the Board of
Directors of the Company and will depend upon the Company’s
results of operations, financial condition, cash requirements,
future prospects and other factors deemed relevant by the
Board of Directors. Accordingly, there can be no assurance that
the Corporation will declare and pay any dividends. As a holding
company, the ability of the Company to pay dividends is depend-
ent upon the receipt of dividends or other payments from its
subsidiaries. Applicable banking regulations and provisions that
may be contained in borrowing agreements of the Company or
40
occurrence of certain events may cause the securitization trans-
actions to amortize earlier than scheduled, which would
accelerate the need for funding.
Table 11 shows the amounts of investor principal from
off-balance sheet securitized consumer loans that are expected
to amortize, or be otherwise paid over the periods indicated,
based on outstanding securitized consumer loans as of Jan-
uary 1, 2000. As of December 31, 1999 and 1998, 51% and
65%, respectively, of the Company’s total managed loans were
securitized.
table 11: SECURITIZATIONS — AMORTIZATION TABLE
(Dollars in Thousands) 2000 2001 2002 2003 2004–2008
Balance at beginning of year $ 10,319,400 $ 8,125,365 $ 6,062,870 $ 4,108,738 $ 3,248,517
Less repayment amounts (2,194,035) (2,062,495) (1,954,132) (860,221) (3,248,517)
Balance at end of year $ 8,125,365 $ 6,062,870 $ 4,108,738 $ 3,248,517 $ —

41
its subsidiaries may restrict the ability of the Company’s sub-
sidiaries to pay dividends to the Corporation or the ability of the
Corporation to pay dividends to its stockholders.
OFF-BALANCE SHEET RISK
The Company is subject to off-balance sheet risk in the normal
course of business including commitments to extend credit,
reduce the interest rate sensitivity of its securitization transac-
tions and its off-balance sheet financial instruments. The
Company enters into interest rate swap agreements in the man-
agement of its interest rate exposure. The Company also enters
into forward foreign currency exchange contracts and currency
swaps to reduce its sensitivity to changing foreign currency
exchange rates. These off-balance sheet financial instruments
involve elements of credit, interest rate or foreign currency
exchange rate risk in excess of the amount recognized on the
balance sheet. These instruments also present the Company
with certain credit, market, legal and operational risks. The
Company has established credit policies for off-balance sheet
instruments as it has for on-balance sheet instruments.
Additional information regarding off-balance sheet finan-
cial instruments can be found in Note N to the Consolidated
Financial Statements.
INTEREST RATE SENSITIVITY
Interest rate sensitivity refers to the change in earnings that
may result from changes in the level of interest rates. To the
extent that managed interest income and expense do not
respond equally to changes in interest rates, or that all rates
do not change uniformly, earnings could be affected. The
Company’s managed net interest income is affected by changes
in short-term interest rates, primarily the London InterBank
Offering Rate, as a result of its issuance of interest-bearing
deposits, variable rate loans and variable rate securitizations.
The Company manages and mitigates its interest rate sensitiv-
ity through several techniques which include, but are not limited
to, changing the maturity, repricing and distribution of assets
and liabilities and entering into interest rate swaps.
The Company measures exposure to its interest rate risk
through the use of a simulation model. The model generates a
distribution of possible twelve-month managed net interest
income outcomes based on (i) a set of plausible interest rate
scenarios, as determined by management based upon historical
trends and market expectations, (ii) all existing financial instru-
ments, including swaps, and (iii) an estimate of ongoing
business activity over the coming twelve months. The Company’s
asset/liability management policy requires that based on this
distribution there be at least a 95% probability that managed
net interest income achieved over the coming twelve months
will be no more than 3% below the mean managed net interest
income of the distribution. As of December 31, 1999, the
Company was in compliance with the policy; more than 99% of
the outcomes generated by the model produced a managed net
interest income of no more than 1.3% below the mean out-
come. The interest rate scenarios evaluated as of December 31,
1999 included scenarios in which short-term interest rates rose
in excess of 400 basis points or fell by as much as 175 basis
points over twelve months.
The analysis does not consider the effects of the changed
level of overall economic activity associated with various inter-
est rate scenarios. Further, in the event of a rate change of large
magnitude, management would likely take actions to further
mitigate its exposure to any adverse impact. For example, man-
agement may reprice interest rates on outstanding credit card
loans subject to the right of the consumers in certain states to
reject such repricing by giving timely written notice to the
Company and thereby relinquishing charging privileges. How-
ever, the repricing of credit card loans may be limited by
competitive factors as well as certain legal constraints.
Interest rate sensitivity at a point in time can also be ana-
lyzed by measuring the mismatch in balances of earning assets
and interest-bearing liabilities that are subject to repricing in
future periods.
Table 12 reflects the interest rate repricing schedule
for earning assets and interest-bearing liabilities as of Decem-
ber 31, 1999.
SUBSEQUENT EVENTS
On February 22, 2000, the Company’s Board of Directors
approved the repurchase of up to 10,000,000 shares of the
Company’s common stock over the next two years, in addition
to the 2,250,000 shares then remaining under the Company’s
repurchase programs approved in 1997 and 1998. As of Feb-
ruary 29, 2000, the Company had 10,846,400 shares available
for repurchase under these programs.

42
table 12: INTEREST RATE SENSITIVITY
Within >180 Days– >1 Year– OverAs of December 31, 1999 Subject to Repricing (Dollars in Millions) 180 Days 1 Year 5 Years 5 Years
Earning assets:
Interest-bearing deposits at other banks $ 112
Securities available for sale 246 $ 210 $ 1,025 $ 375
Consumer loans 4,632 7 5,275
Total earning assets 4,990 217 6,300 375
Interest-bearing liabilities:
Interest-bearing deposits 1,406 717 1,598 63
Other borrowings 2,715 65
Senior notes 631 135 2,709 706
Total interest-bearing liabilities 4,752 917 4,307 769
Non-rate related assets (1,137)
Interest sensitivity gap 238 (700) 1,993 (1,531)
Impact of swaps 1,930 (287) (1,350) (293)
Impact of consumer loan securitizations (5,018) (274) 5,893 (601)
Interest sensitivity gap adjusted for impact of securitizations and swaps $ (2,850) $ (1,261) $ 6,536 $ (2,425)
Adjusted gap as a percentage of managed assets –12.06% –5.33% 27.65% –10.26%
Adjusted cumulative gap $ (2,850) $ (4,111) $ 2,425 $ —
Adjusted cumulative gap as a percentage of managed assets –12.06% –17.39% 10.26% 0.00%
BUSINESS OUTLOOKEarnings, Goals and Strategies
This business outlook section summarizes the Company’s expec-
tations for earnings for the year ending December 31, 2000, and
its primary goals and strategies for continued growth. The state-
ments contained in this section are based on management’s
current expectations. Certain statements are forward looking and,
therefore, actual results could differ materially. Factors, which
could materially influence results, are set forth throughout this
section and in the Company’s Annual Report on Form 10-K for
the year ended December 31, 1999 (Part I, Item 1, Risk Factors).
The Company has set targets, dependent on the factors set
forth below, to achieve a 25% return on equity in 2000 and to
increase its earnings per share in 2000 by approximately 30%
over 1999 earnings per share. As discussed elsewhere in this
report and below, the Company’s actual earnings are a function
of its revenues (net interest income and non-interest income on
its earning assets), consumer usage and payment patterns,
credit quality of its earning assets (which affects fees and
charge-offs), marketing expenses and operating expenses.
Product and Market Opportunities
The Company’s strategy for future growth has been, and is
expected to continue to be, to apply its proprietary IBS to its lend-
ing business as well as to other businesses, both financial and
non-financial, including telecommunications and Internet serv-
ices. The Company will seek to identify new product opportunities
and to make informed investment decisions regarding new and
existing products. The Company’s lending and other financial and
non-financial products are subject to competitive pressures, which
management anticipates will increase as these markets mature.
Lending
Lending includes credit card and other consumer lending prod-
ucts, including automobile financing. Credit card opportunities
include, and are expected to continue to include, a wide variety
of highly customized products with interest rates, credit lines and
other features specifically tailored for numerous consumer pop-
ulations. The Company expects continued growth across a broad
spectrum of new and existing customized products, which are
distinguished by a varied range of credit lines, pricing structures
and other characteristics. For example, the Company’s low non-
introductory rate products, which are marketed to consumers

43
with the best established credit profiles, are characterized by
higher credit lines, lower yields and an expectation of lower delin-
quencies and credit losses than the traditional low introductory
rate balance transfer products. On the other hand, certain other
customized card products are characterized by lower credit lines,
higher yields (including fees) and in some cases, higher delin-
quencies and credit losses than the Company’s traditional
products. These products also involve higher operational costs
but exhibit better response rates, less adverse selection, less
attrition and a greater ability to reprice than the Company’s tra-
ditional introductory rate products. More importantly, as a whole,
all of these customized products continue to have less volatile
returns than the traditional products in recent market conditions.
Telecommunications
The Company markets telecommunications services through its
subsidiary America One Communications, Inc. (“America One”). In
the first half of 1999, America One’s primary business, the reselling
of analog and digital wireless services through direct marketing
channels, began experiencing significant competitive pressures in
its core wireless markets. In response to these changing market
conditions, the Company decreased its marketing investment in
America One during the second half of 1999 and has been testing
wireless products and services in other markets that are not being
adequately served by the major telecommunications competitors.
Management remains optimistic that, over time, its strategy can
be successful in the wireless telecommunications industry. Accord-
ingly, marketing investment may increase in the future.
International Expansion
The Company has expanded its existing operations outside of
the United States and has experienced growth in the number of
accounts and loan balances in its international business. To
date, the Company’s principal operations outside of the United
States have been in the United Kingdom, with additional oper-
ations in Canada. To support the continued growth of its United
Kingdom business and any future business in Europe, the Com-
pany opened a new operations center in Nottingham, England in
July 1998 and expanded it in early 1999. The Company antici-
pates entering and doing business in additional countries from
time to time as opportunities arise.
The Company will continue to apply its IBS in an effort to
balance the mix of credit card products with other financial and
non-financial products and services to optimize profitability
within the context of acceptable risk. The Company’s growth
through expansion and product diversification will be affected
by the ability to internally build or acquire the necessary opera-
tional and organizational infrastructure, recruit experienced
personnel, fund these new businesses and manage expenses.
Although management believes it has the personnel, financial
resources and business strategy necessary for continued suc-
cess, there can be no assurance that the Company’s results of
operations and financial condition in the future will reflect its
historical financial performance.
Marketing Investment
The Company expects its 2000 marketing expenses to exceed
1999’s expense level, as the Company continues to invest in its
various credit card products and services, brand development and
other financial and non-financial products and services. Increas-
ing marketing expenses have historically led to the growth of
accounts and revenues that, in turn, have enabled the Company
to meet or exceed its earnings per share and return on equity tar-
gets for the last five years. The Company cautions, however, that
an increase in marketing expenses does not necessarily equate
to a comparable increase in outstanding balances or accounts
based on historical results. As the Company’s portfolio continues
to grow, generating balances and accounts to offset attrition
requires increasing amounts of marketing. Intense competition in
the credit card market has resulted in a decrease in credit card
response rates and has reduced the productivity of marketing dol-
lars invested in that line of business. In addition, the cost to
acquire new accounts varies across product lines and is expected
to rise as the Company moves beyond the domestic card busi-
ness. With competition affecting the profitability of traditional
introductory rate card products, the Company has been allocating,
and expects to continue to allocate, a greater portion of its mar-
keting expense to other customized credit card products and
other financial and non-financial products. For example, the cost
to acquire an America One wireless account traditionally has
included the cost of providing a free phone to the customer, and
consequently has been substantially more than the cost to
acquire a credit card account. The Company intends to continue
a flexible approach in its allocation of marketing expenses. The
Company is also developing a brand marketing strategy to sup-
plement current strategies and is investigating opportunities on
the Internet. The actual amount of marketing investment is sub-
ject to a variety of external and internal factors, such as
competition in the consumer credit and wireless service indus-
tries, general economic conditions affecting consumer credit
performance, the asset quality of the Company’s portfolio and the
identification of market opportunities across product lines that
exceed the Company’s targeted rates of return on investment.
The amount of marketing expense allocated to various
products or businesses will influence the characteristics of the
Company’s portfolio as various products or businesses are

44
characterized by different account growth, loan growth and
asset quality characteristics. The Company currently expects
continued strong account growth and loan growth in 2000.
Actual growth, however, may vary significantly depending on the
Company’s actual product mix and the level of attrition on the
Company’s managed portfolio, which is primarily affected by
competitive pressures.
Impact of Delinquencies, Charge-Offs and Attrition
The Company’s earnings are particularly sensitive to delinquen-
cies and charge-offs on the Company’s portfolio and to the level
of attrition due to competition in the credit card industry. As
delinquency levels fluctuate, the resulting amount of past-due
and overlimit fees, which are significant sources of revenue for
the Company, will also fluctuate. Further, the timing of revenues
from increasing or decreasing delinquencies precedes the
related impact of higher or lower charge-offs that ultimately
result from varying levels of delinquencies. Delinquencies and
net charge-offs are impacted by general economic trends in con-
sumer credit performance, including bankruptcies, the degree
of seasoning of the Company’s portfolio and the product mix.
As of December 31, 1999, the Company had the lowest net
charge-off rate among the top ten credit card issuers in the United
States. However, management expects delinquencies to increase
moderately through 2000 and that, as a result, charge-offs will
also increase in 2000. Management cautions that delinquency
and charge-off levels are not always predictable and may vary
from projections. In the case of an economic downturn or reces-
sion, delinquencies and charge-offs are likely to increase more
quickly. In addition, competition in the credit card industry, as
measured by the volume of mail solicitations, declined in 1999
but remains very high. Competition can affect the Company’s
earnings by increasing attrition of the Company’s outstanding
loans (thereby reducing interest and fee income) and by making
it more difficult to retain and attract more profitable customers.
The Year 2000 Issue
The year 2000 problem is a result of computer systems using
two digits rather than four digits to define an applicable year. The
Company uses a significant number of internal computer soft-
ware programs and operating systems across its entire
organization. In addition, the Company depends on its external
business vendors to provide external services for its operations.
As of February 29, 2000, the Company had not experienced
material difficulties with either our internal systems or vendors
arising from the advent of the year 2000. The Company will con-
tinue to monitor its systems and address any issues that might
arise. As of December 31, 1999, the Company had spent approx-
imately $14.5 million for remediation of year 2000 issues. The
Company expects to spend an additional $500,000 in 2000 to
continue to monitor its systems for year 2000 compliance.
Cautionary Factors
The Company’s strategies and objectives outlined above, and the
other forward-looking statements contained in this section,
involve a number of risks and uncertainties. The Company cau-
tions readers that any forward-looking information is not a
guarantee of future performance and that actual results could
differ materially. In addition to the factors discussed above,
among the other factors that could cause actual results to differ
materially are the following: continued intense competition from
numerous providers of products and services which compete
with the Company’s businesses; with respect to financial and
other products, changes in the Company’s aggregate accounts
or consumer loan balances and the growth rate thereof, includ-
ing changes resulting from factors such as shifting product mix,
amount of actual marketing expenses made by the Company
and attrition of accounts and loan balances; an increase in credit
losses (including increases due to a worsening of general eco-
nomic conditions); the ability of the Company to continue to
securitize its credit cards and consumer loans and to otherwise
access the capital markets at attractive rates and terms to fund
its operations and future growth; difficulties or delays in the
development, production, testing and marketing of new products
or services; losses associated with new products or services or
expansion internationally; financial, legal, regulatory or other dif-
ficulties that may affect investment in, or the overall
performance of, a product or business, including changes in exist-
ing laws to regulate further the credit card and consumer loan
industry and the financial services industry, in general (including
the flexibility of financial services companies to use and share
data); the amount of, and rate of growth in, the Company’s
expenses (including salaries and associate benefits and mar-
keting expenses) as the Company’s business develops or
changes or as it expands into new market areas; the availability
of capital necessary to fund the Company’s new businesses; the
ability of the Company to build the operational and organiza-
tional infrastructure necessary to engage in new businesses or
to expand internationally; the ability of the Company to recruit
experienced personnel to assist in the management and opera-
tions of new products and services; and other factors listed from
time to time in the Company’s SEC reports, including, but not lim-
ited to, the Annual Report on Form 10-K for the year ended
December 31, 1999 (Part I, Item 1, Risk Factors).

45
selected quarterly financial data
1999 1998
Fourth Third Second First Fourth Third Second First(Unaudited) Quarter Quarter Quarter Quarter Quarter Quarter Quarter Quarter
Summary of Operations:(In Thousands)
Interest income $ 450,604 $ 412,036 $ 377,773 $ 353,071 $ 298,947 $ 283,109 $ 271,438 $ 258,042
Interest expense 154,798 135,807 128,288 121,989 117,601 107,984 103,599 95,100
Net interest income 295,806 276,229 249,485 231,082 181,346 175,125 167,839 162,942
Provision for loan losses 120,000 114,061 74,301 74,586 54,580 67,569 59,013 85,866
Net interest income after provision
for loan losses 175,806 162,168 175,184 156,496 126,766 107,556 108,826 77,076
Non-interest income 654,623 621,063 572,047 524,626 456,476 386,955 328,953 315,899
Non-interest expense 681,185 629,421 606,137 548,253 466,034 381,598 329,951 287,003
Income before income taxes 149,244 153,810 141,094 132,869 117,208 112,913 107,828 105,972
Income taxes 51,372 58,448 53,616 50,490 44,539 42,907 40,975 40,269
Net income $ 97,872 $ 95,362 $ 87,478 $ 82,379 $ 72,669 $ 70,006 $ 66,853 $ 65,703
Per Common Share:(1)
Basic earnings $ .50 $ .48 $ .44 $ .42 $ .37 $ .36 $ .34 $ .33
Diluted earnings .47 .45 .41 .39 .35 .33 .32 .32
Dividends .03 .03 .03 .03 .03 .03 .03 .03
Market prices
High 5427⁄32 573⁄4 601⁄6 5125⁄64 4113⁄16 435⁄16 414⁄5 275⁄16
Low 357⁄8 354⁄5 46 365⁄16 171⁄4 272⁄3 277⁄16 167⁄8
Average common shares (000s) 197,252 197,423 197,643 197,239 196,990 197,178 196,611 196,284
Average common and common
equivalent shares (000s) 210,284 210,142 211,499 209,991 209,056 210,035 208,582 205,245
Average Balance Sheet Data: (In Millions)
Consumer loans $ 8,620 $ 7,791 $ 7,406 $ 6,832 $ 5,758 $ 5,623 $ 5,213 $ 4,786
Allowance for loan losses (312) (273) (254) (239) (231) (216) (213) (197)
Securities 2,348 1,898 1,831 2,047 2,155 1,626 1,826 1,922
Other assets 1,728 1,803 1,663 1,511 1,511 1,473 1,280 1,025
Total assets $ 12,384 $ 11,219 $ 10,646 $ 10,151 $ 9,193 $ 8,506 $ 8,106 $ 7,536
Interest-bearing deposits $ 3,649 $ 3,002 $ 2,271 $ 2,101 $ 1,886 $ 1,369 $ 1,193 $ 1,266
Other borrowings 2,038 1,333 1,600 1,778 1,704 1,594 1,417 1,175
Senior and deposit notes 4,259 4,494 4,621 4,190 3,742 3,819 3,906 3,683
Other liabilities 945 929 780 780 649 575 553 462
Stockholders’ equity 1,493 1,461 1,374 1,302 1,212 1,149 1,037 950
Total liabilities and equity $ 12,384 $ 11,219 $ 10,646 $ 10,151 $ 9,193 $ 8,506 $ 8,106 $ 7,536
(1) All periods have been restated to reflect the Company’s three-for-one stock split effective June 1, 1999.
The above schedule is a tabulation of the Company’s unaudited quarterly results for the years ended December 31, 1999 and 1998. The Company’s common sharesare traded on the New York Stock Exchange under the symbol COF. In addition, shares may be traded in the over-the-counter stock market. There were 9,738 and9,692 common stockholders of record as of December 31, 1999 and 1998, respectively.

46
The Management of Capital One Financial Corporation is
responsible for the preparation, integrity and fair presentation of
the financial statements and footnotes contained in this Annual
Report. The Consolidated Financial Statements have been pre-
pared in accordance with accounting principles generally
accepted in the United States and are free of material mis-
statement. The Company also prepared other information
included in this Annual Report and is responsible for its accu-
racy and consistency with the financial statements. In situations
where financial information must be based upon estimates and
judgments, they represent the best estimates and judgments of
Management.
The Consolidated Financial Statements have been audited
by the Company’s independent auditors, Ernst & Young LLP,
whose independent professional opinion appears separately.
Their audit provides an objective assessment of the degree to
which the Company’s Management meets its responsibility for
financial reporting. Their opinion on the financial statements is
based on auditing procedures, which include reviewing account-
ing systems and internal controls and performing selected tests
of transactions and records as they deem appropriate. These
auditing procedures are designed to provide reasonable assur-
ance that the financial statements are free of material
misstatement.
Management depends on its accounting systems and
internal controls in meeting its responsibilities for reliable finan-
cial statements. In Management’s opinion, these systems and
controls provide reasonable assurance that assets are safe-
guarded and that transactions are properly recorded and
executed in accordance with Management’s authorizations. As
an integral part of these systems and controls, the Company
maintains a professional staff of internal auditors that conducts
operational and special audits and coordinates audit coverage
with the independent auditors.
The Audit Committee of the Board of Directors, composed
solely of outside directors, meets periodically with the internal
auditors, the independent auditors and Management to review
the work of each and ensure that each is properly discharging
its responsibilities. The independent auditors have free access
to the Committee to discuss the results of their audit work and
their evaluations of the adequacy of accounting systems and
internal controls and the quality of financial reporting.
There are inherent limitations in the effectiveness of inter-
nal controls, including the possibility of human error or the
circumvention or overriding of controls. Accordingly, even effec-
tive internal controls can provide only reasonable assurance
with respect to reliability of financial statements and safe-
guarding of assets. Furthermore, because of changes in
conditions, internal control effectiveness may vary over time.
The Company assessed its internal controls over financial
reporting as of December 31, 1999, in relation to the criteria
described in the “Internal Control-Integrated Framework” issued
by the Committee of Sponsoring Organizations of the Treadway
Commission. Based on this assessment, the Company believes
that as of December 31, 1999, in all material respects, the
Company maintained effective internal controls over financial
reporting.
management’s report on consolidated financial statements and internal controls over financial reporting
Richard D. Fairbank Nigel W. Morris David M. Willey
Chairman and Chief President and Chief Senior Vice President, Corporate
Executive Officer Operating Officer Financial Management

47
THE BOARD OF DIRECTORS AND STOCKHOLDERS
CAPITAL ONE FINANCIAL CORPORATION
We have audited the accompanying consolidated balance
sheets of Capital One Financial Corporation as of December 31,
1999 and 1998, and the related consolidated statements of
income, changes in stockholders’ equity, and cash flows for each
of the three years in the period ended December 31, 1999.
These financial statements are the responsibility of the
Company’s management. Our responsibility is to express an
opinion on these financial statements based on our audits.
We conducted our audits in accordance with auditing stan-
dards generally accepted in the United States. Those standards
require that we plan and perform the audit to obtain reasonable
assurance about whether the financial statements are free of
material misstatement. An audit includes examining, on a test
McLean, Virginia
January 18, 2000
basis, evidence supporting the amounts and disclosures in the
financial statements. An audit also includes assessing the
accounting principles used and significant estimates made by
management, as well as evaluating the overall financial state-
ment presentation. We believe that our audits provide a
reasonable basis for our opinion.
In our opinion, the financial statements referred to above
present fairly, in all material respects, the consolidated financial
position of Capital One Financial Corporation at December 31,
1999 and 1998, and the consolidated results of its operations
and its cash flows for each of the three years in the period
ended December 31, 1999, in conformity with accounting prin-
ciples generally accepted in the United States.
report of independent auditors

48
December 31 (Dollars in Thousands, Except Per Share Data) 1999 1998
Assets:Cash and due from banks $ 134,065 $ 15,974
Federal funds sold and resale agreements 261,800
Interest-bearing deposits at other banks 112,432 22,393
Cash and cash equivalents 246,497 300,167
Securities available for sale 1,856,421 1,796,787
Consumer loans 9,913,549 6,157,111
Less: Allowance for loan losses (342,000) (231,000)
Net loans 9,571,549 5,926,111
Premises and equipment, net 470,732 242,147
Interest receivable 64,637 52,917
Accounts receivable from securitizations 661,922 833,143
Other 464,685 268,131
Total assets $ 13,336,443 $ 9,419,403
Liabilities:Interest-bearing deposits $ 3,783,809 $ 1,999,979
Other borrowings 2,780,466 1,742,200
Senior notes 4,180,548 3,739,393
Interest payable 116,405 91,637
Other 959,608 575,788
Total liabilities 11,820,836 8,148,997
Commitments and Contingencies
Stockholders’ Equity:Preferred stock, par value $.01 per share; authorized
50,000,000 shares, none issued or outstanding
Common stock, par value $.01 per share; authorized
300,000,000 shares, 199,670,421 and 199,670,376
issued as of December 31, 1999 and 1998, respectively 1,997 1,997
Paid-in capital, net 613,590 598,167
Retained earnings 1,022,296 679,838
Cumulative other comprehensive income (31,262) 60,655
Less: Treasury stock, at cost; 2,624,006 and 2,690,910 shares
as of December 31, 1999 and 1998, respectively (91,014) (70,251)
Total stockholders’ equity 1,515,607 1,270,406
Total liabilities and stockholders’ equity $ 13,336,443 $ 9,419,403
See Notes to Consolidated Financial Statements.
consolidated balance sheets

52
note a
SIGNIFICANT ACCOUNTING POLICIES
Organization and Basis of Presentation
The Consolidated Financial Statements include the accounts of
Capital One Financial Corporation (the “Corporation”) and its
subsidiaries. The Corporation is a holding company whose sub-
sidiaries provide a variety of products and services to
consumers. The principal subsidiaries are Capital One Bank (the
“Bank”), which offers credit card products, and Capital One,
F.S.B. (the “Savings Bank”), which offers consumer lending prod-
ucts (including credit cards) and deposit products. The
Corporation and its subsidiaries are collectively referred to as
the “Company.”
The accompanying Consolidated Financial Statements have
been prepared in accordance with generally accepted account-
ing principles (“GAAP”) that require management to make
estimates and assumptions that affect the amounts reported in
the financial statements and accompanying notes. Actual
results could differ from these estimates. All significant inter-
company balances and transactions have been eliminated.
Certain prior years’ amounts have been reclassified to conform
to the 1999 presentation.
On April 29, 1999, the Company’s Board of Directors
approved a three-for-one split of the common stock of the Cor-
poration. The stock split was effected through a 200 percent
stock distribution on June 1, 1999 to stockholders of record on
May 20, 1999. For periods prior to the effective date of the stock
split, outstanding shares and per share data contained in this
report have been restated to reflect the impact of the stock split.
The following is a summary of the significant accounting
policies used in preparation of the accompanying Consolidated
Financial Statements.
Cash and Cash Equivalents
Cash and cash equivalents include cash and due from banks,
federal funds sold and resale agreements and interest-bearing
deposits at other banks. Cash paid for interest for the years
ended December 31, 1999, 1998 and 1997, was $516,114,
$401,095 and $353,763, respectively. Cash paid for income
taxes for the years ended December 31, 1999, 1998 and 1997,
was $216,438, $202,112 and $131,052, respectively.
Securities Available for Sale
Debt securities for which the Company does not have the posi-
tive intent and ability to hold to maturity are classified as
securities available for sale. These securities are stated at fair
value, with the unrealized gains and losses, net of tax, reported
as a component of cumulative other comprehensive income.
The amortized cost of debt securities is adjusted for amortiza-
tion of premiums and accretion of discounts to maturity. Such
amortization or accretion is included in other interest income.
Consumer Loans
The Company recognizes finance charges and fee income
on loans according to the contractual provisions of the credit
agreements. When, based on historic performance of the port-
folio, payment in full of finance charge and fee income is not
expected, the estimated uncollectible portion of previously
accrued amounts are reversed against current period income.
Annual membership fees and direct loan origination costs are
deferred and amortized over one year on a straight-line basis.
Deferred fees (net of deferred costs) were $243,172 and
$140,242 as of December 31, 1999 and 1998, respectively.
The Company charges off credit card loans (net of any collat-
eral) at 180 days past due. Bankrupt consumers’ accounts are
generally charged off within thirty days of receipt of the bank-
ruptcy petition.
Allowance for Loan Losses
The allowance for loan losses is maintained at the amount esti-
mated to be sufficient to absorb probable future losses, net of
recoveries (including recovery of collateral), inherent in the exist-
ing reported portfolio. The provision for loan losses is the
periodic cost of maintaining an adequate allowance. The
amount of allowance necessary is determined primarily based
on a migration analysis of delinquent and current accounts. In
evaluating the sufficiency of the allowance for loan losses, man-
agement also takes into consideration the following factors:
recent trends in delinquencies and charge-offs including bank-
rupt, deceased and recovered amounts; historical trends in loan
volume; forecasting uncertainties and size of credit risks; the
degree of risk inherent in the composition of the loan portfolio;
economic conditions; credit evaluations and underwriting policies.
notes to consolidated financial statements(Currencies in Thousands, Except Per Share Data)

53
Securitizations
The Company records gains or losses on the securitization of con-
sumer loan receivables on the date of sale based on the
estimated fair value of assets sold and retained and liabilities
incurred in the sale. Gains represent the present value of esti-
mated cash flows the Company has retained over the estimated
outstanding period of the receivables. This excess cash flow
essentially represents an “interest only”(“I/O”) strip, consisting of
the excess of finance charges and past-due fees over the sum of
the return paid to certificateholders, estimated contractual serv-
icing fees and credit losses. The I/O strip is carried at fair value
in accounts receivable from securitizations, with changes in the
fair value reported as a component of cumulative other compre-
hensive income. Certain estimates inherent in the determination
of the fair value of the I/O strip are influenced by factors outside
the Company’s control, and as a result, such estimates could
materially change in the near term. The gains on securitizations
are included in servicing and securitizations income.
Off-Balance Sheet Financial Instruments
The nature and composition of the Company’s assets and lia-
bilities and off-balance sheet items expose the Company to
interest rate risk. The Company’s foreign currency denominated
assets and liabilities expose it to foreign currency exchange rate
risk. To mitigate these risks, the Company uses certain types of
derivative financial instruments. The Company enters into inter-
est rate swap agreements (“interest rate swaps”) in the
management of its interest rate exposure. All of the Company’s
interest rate swaps are designated and effective as hedges of
specific existing or anticipated assets or liabilities. The Company
enters into forward foreign currency exchange contracts
(“f/x contracts”) and currency swaps to reduce its sensitivity
to changing foreign currency exchange rates. All of the Com-
pany’s f/x contracts and currency swaps are designated and
effective as hedges of specific assets or liabilities. The Company
does not hold or issue derivative financial instruments for trad-
ing purposes.
Swap agreements involve the periodic exchange of pay-
ments over the life of the agreements. Amounts paid or received
on interest rate and currency swaps are recorded on an accrual
basis as an adjustment to the related income or expense of the
item to which the agreements are designated. As of December
31, 1999 and 1998, the related amounts payable to counter-
parties were $4,748 and $2,463, respectively. Changes in the
fair value of interest rate swaps are not reflected in the accom-
panying financial statements, where designated to existing or
anticipated assets or liabilities and where swaps effectively mod-
ify or reduce interest rate sensitivity.
F/x contracts represent an agreement to exchange a spec-
ified notional amount of two different currencies at a specified
exchange rate on a specified future date. Changes in the fair
value of f/x contracts and currency swaps are recorded in the
period in which they occur as foreign currency gains or losses in
other non-interest income, effectively offsetting the related
gains or losses on the items to which they are designated.
Realized and unrealized gains or losses at the time of
termination, sale or repayment of a derivative contract are
recorded in a manner consistent with its original designation.
Amounts are deferred and amortized as an adjustment to the
related income or expense over the original period of exposure,
provided the designated asset or liability continues to exist, or
in the case of anticipated transactions, is probable of occurring.
Realized and unrealized changes in the fair value of swaps
or f/x contracts, designated with items that no longer exist or
are no longer probable of occurring, are recorded as a compo-
nent of the gain or loss arising from the disposition of the
designated item.
Interest rate and foreign currency exchange rate risk man-
agement contracts are generally expressed in notional principal
or contract amounts that are much larger than the amounts
potentially at risk for nonperformance by counterparties. In the
event of nonperformance by the counterparties, the Company’s
credit exposure on derivative financial instruments is equal to
the gross unrealized gains on the outstanding contracts.
At December 31, 1999, the gross unrealized gains in the port-
folio were $83,314. The Company actively monitors the credit
ratings of its counterparties. Under the terms of certain swaps,
each party may be required to pledge collateral if the mar-
ket value of the swaps exceeds an amount set forth in the
agreement or in the event of a change in its credit rating. At
December 31, 1999, $58,717 of such collateral has been
pledged to the Company.

54
Premises and Equipment
Premises and equipment are stated at cost less accumulated
depreciation and amortization. Depreciation and amortization
expense are computed generally by the straight-line method
over the estimated useful lives of the assets. Useful lives for
premises and equipment are as follows: buildings and
improvements — 5–39 years; furniture and equipment — 3–10
years; computers and software — 3 years.
Marketing
The Company expenses marketing costs as incurred.
Credit Card Fraud Losses
The Company experiences fraud losses from the unauthorized
use of credit cards. Transactions suspected of being fraudulent
are charged to non-interest expense after a sixty-day investiga-
tion period.
Income Taxes
Deferred tax assets and liabilities are determined based on dif-
ferences between the financial reporting and tax bases of assets
and liabilities, and are measured using the enacted tax rates
and laws that will be in effect when the differences are expected
to reverse.
Comprehensive Income
As of December 31, 1999, cumulative other comprehensive
income, net of tax, consisted of $32,608 in net unrealized losses
on securities and $1,346 in foreign currency translation adjust-
ments. As of December 31, 1998 and 1997, cumulative other
comprehensive income, net of tax, consisted of $63,260 and
$2,612 in net unrealized gains on securities and $(2,605) and
$(73) in foreign currency translation adjustments, respectively.
As of December 31, 1999, substantially all of the net unrealized
loss on securities was comprised of gross unrealized losses.
Segments
The Company maintains three distinct business segments: lend-
ing, telecommunications and “other.” The lending segment is
comprised primarily of credit card lending activities. The telecom-
munications segment consists primarily of direct marketing
wireless service. “Other” consists of various non-lending new busi-
ness initiatives, none of which exceed the quantitative thresholds
for reportable segments in Statement of Financial Accounting
Standards (“SFAS”) No. 131, “Disclosures about Segments of
an Enterprise and Related Information” (“SFAS 131”).
The accounting policies of these reportable segments are
the same as those described above. Management measures the
performance of its business segments on a managed basis and
makes resource allocation decisions based upon several fac-
tors, including income before taxes, less indirect expenses.
Lending is the Company’s only reportable business segment,
based on the definitions provided in SFAS 131. Substantially all
of the Company’s reported assets, revenues and income are
derived from the lending segment in all periods presented.
All revenue is generated from external customers and is
predominantly derived in the United States. Revenues and oper-
ating losses from international operations comprised less than
6% and 7% of total managed revenues and operating income,
respectively, for the year ended December 31, 1999.
Recent Accounting Pronouncements
In June 1999, the FASB issued SFAS No. 137, “Accounting for
Derivative Instruments and Hedging Activities — Deferral of the
Effective Date of FASB Statement No. 133” (“SFAS 137”), which
defers the effective date of SFAS No. 133, “Accounting for Deriv-
ative Instruments and Hedging Activities” (together “SFAS 133
as amended”) to all fiscal quarters of all fiscal years beginning
after June 15, 2000. SFAS 133 as amended will require the
Company to recognize all derivatives on the balance sheet at
fair value. Derivatives that are not hedges must be adjusted to
fair value through earnings. If the derivative is a hedge, depend-
ing on the nature of the hedge, changes in the fair value of
derivatives will either be offset against the change in fair value
of the hedged assets, liabilities or firm commitments through
earnings or recognized in other comprehensive income until the
hedged item is recognized in earnings. The ineffective portion of
a derivative’s change in fair value will be immediately recog-
nized in earnings. The adoption of SFAS 133 as amended is not
expected to have a material effect on the results of the Com-
pany’s operations.

55
Maturity Schedule
Market Amortized1 Year 1–5 5–10 Over 10 Value Cost
or Less Years Years Years Totals Totals
December 31, 1999
Commercial paper $ 24,927 $ 24,927 $ 24,927
U.S. Treasury and other U.S. government agency obligations 437,697 $ 1,014,335 1,452,032 1,471,783
Collateralized mortgage obligations $ 37,421 $ 299,846 337,267 345,619
Mortgage backed securities 5,293 13,828 19,121 19,426
Other 19,443 1,361 441 1,829 23,074 23,254
Total $ 482,067 $ 1,020,989 $ 51,690 $ 301,675 $ 1,856,421 $ 1,885,009
December 31, 1998
Commercial paper $ 117,395 $ 117,395 $ 117,395
U.S. Treasury and other U.S. government agency obligations 125,831 $ 1,072,109 $ 17,051 1,214,991 1,196,313
Collateralized mortgage obligations 25,877 $ 401,443 427,320 426,485
Mortgage backed securities 8,337 7,265 15,602 15,210
Other 76 1,360 589 19,454 21,479 21,356
Total $ 243,302 $ 1,081,806 $ 43,517 $ 428,162 $ 1,796,787 $ 1,776,759
December 31, 1997
Commercial paper $ 187,145 $ 187,145 $ 187,145
U.S. Treasury and other U.S. government agency obligations 400,929 $ 589,899 $ 2,506 993,334 989,707
Collateralized mortgage obligations $ 18,969 18,969 18,629
Mortgage backed securities 13,278 9,960 23,238 22,966
Other 330 526 19,128 19,984 20,008
Total $ 588,074 $ 603,507 $ 3,032 $ 48,057 $ 1,242,670 $ 1,238,455
Weighted Average Yields1 Year 1–5 5–10 Over 10
or Less Years Years Years
December 31, 1999
Commercial paper 6.19%
U.S. Treasury and other U.S. government agency obligations 5.77 5.69%
Collateralized mortgage obligations 6.18% 5.98%
Mortgage backed securities 5.05 6.62
Other 6.32 3.87 6.45 6.89
Total 5.81% 5.69% 6.30% 5.99%
Weighted average yields were determined based on amortized cost.
note b
SECURITIES AVAILABLE FOR SALE
Securities available for sale as of December 31, 1999, 1998 and 1997 were as follows:

56
note e
BORROWINGS
Borrowings as of December 31, 1999 and 1998 were as follows:
1999 1998
Weighted WeightedAverage Average
Outstanding Rate Outstanding Rate
Interest-bearing
Deposits $ 3,783,809 5.34% $ 1,999,979 4.77%
Other borrowings
Secured borrowings $ 1,344,790 6.65%
Junior subordinated capital income securities 98,178 7.76 $ 97,921 6.77%
Federal funds purchased and resale agreements 1,240,000 5.84 1,227,000 5.53
Other short-term borrowings 97,498 3.97 417,279 6.58
Total $ 2,780,466 $ 1,742,200
Senior Notes
Bank — fixed rate $ 3,409,652 6.71% $ 3,268,182 6.29%
Bank — variable rate 221,999 6.74 146,998 5.89
Corporation 548,897 7.20 324,213 7.17
Total $ 4,180,548 $ 3,739,393
Interest-bearing Deposits
As of December 31, 1999, the aggregate amount of interest-
bearing deposits with accounts equal to or exceeding $100 was
$1,076,076.
Secured Borrowings
In November 1999, the Bank entered into an agreement to
transfer a pool of consumer loans totaling up to $500,000.
Proceeds from the transfer were recorded as a secured bor-
rowing. The facility accrues interest based on commercial paper
rates and matures in 2000; however, it may be extended for
additional one-year periods through 2008. The outstanding
balance on the secured borrowing at December 31, 1999,
was $245,625.
note c
ALLOWANCE FOR LOAN LOSSES
The following is a summary of changes in the allowance for loan
losses:
Year Ended December 31, 1999 1998 1997
Balance at beginning of year $ 231,000 $ 183,000 $ 118,500
Provision for loan losses 382,948 267,028 262,837
Acquisitions/other 3,522 7,503 (2,770)
Charge-offs (400,143) (294,295) (223,029)
Recoveries 124,673 67,764 27,462
Net charge-offs (275,470) (226,531) (195,567)
Balance at end of year $ 342,000 $ 231,000 $ 183,000
note d
PREMISES AND EQUIPMENT
Premises and equipment as of December 31, 1999 and 1998
were as follows:
December 31, 1999 1998
Land $ 10,168 $ 10,168
Buildings and improvements 197,434 126,205
Furniture and equipment 448,742 254,070
Computer software 86,626 41,084
In process 54,874 23,325
797,844 454,852
Less: Accumulated depreciation and amortization (327,112) (212,705)
Total premises and equipment, net $ 470,732 $ 242,147
Depreciation and amortization expense was $122,778,
$75,005 and $63,537, for the years ended December 31, 1999,
1998 and 1997, respectively.

57
In October 1999, the Bank entered into a £750,000 revolv-
ing credit facility collateralized by a security interest in certain
consumer loans of the Company. Interest on the facility is based
on commercial paper rates or London InterBank Offering Rates
(“LIBOR”). The facility matures in 2000. At December 31, 1999,
£500,000 ($809,100 equivalent) was outstanding under the
facility.
In May 1999, Summit Acceptance Corporation, a subsidiary
of the Company, entered into an agreement to transfer a pool of
consumer loans totaling $350,000. Proceeds from the transfer
were recorded as a secured borrowing. Principal payments on
the borrowing are based on principal collections net of losses
on the transferred consumer loans. The borrowing accrues
interest based on commercial paper rates and matures on June
15, 2006 or earlier depending upon the repayment of the under-
lying consumer loans. At December 31, 1999, $290,065 of the
secured borrowing was outstanding.
Junior Subordinated Capital Income Securities
In January 1997, Capital One Capital I, a subsidiary of the Bank
created as a Delaware statutory business trust, issued
$100,000 aggregate amount of Floating Rate Junior Subordi-
nated Capital Income Securities that mature on February 1,
2027. The securities represent a preferred beneficial interest in
the assets of the trust.
Other Short-Term Borrowings
In May 1999, the Company entered into a four-year, $1,200,000
unsecured revolving credit arrangement (the “Credit Facility”).
The Credit Facility is comprised of two tranches: a $810,000
Tranche A facility available to the Bank and the Savings Bank,
including an option for up to $250,000 in multicurrency avail-
ability, and a $390,000 Tranche B facility available to the
Corporation, the Bank and the Savings Bank, including an option
for up to $150,000 in multicurrency availability. Each tranche
under the facility is structured as a four-year commitment and
is available for general corporate purposes. All borrowings under
the Credit Facility are based on varying terms of LIBOR. The
Bank has irrevocably undertaken to honor any demand by the
lenders to repay any borrowings which are due and payable by
the Savings Bank but have not been paid. Any borrowings under
the Credit Facility will mature on May 24, 2003; however,
the final maturity of each tranche may be extended for three
additional one-year periods with the lenders’ consent. As of
December 31, 1999 and 1998, the Company had no outstand-
ings under the Credit Facility or its predecessor facility.
In August 1997, the Company entered into a three-year,
$350,000 equivalent unsecured revolving credit arrangement
(the “UK/Canada Facility”), which is being used to finance the
Company’s expansion in the United Kingdom and Canada. The
UK/Canada Facility is comprised of two tranches: a Tranche A
facility in the amount of £156,458 ($249,800 equivalent based
on the exchange rate at closing) and a Tranche B facility in the
amount of C$139,609 ($100,200 equivalent based on the
exchange rate at closing). An amount of £34,574 or C$76,910
($55,200 equivalent based on the exchange rates at closing)
may be transferred between the Tranche A facility and the
Tranche B facility, respectively, upon the request of the Company.
In the second quarter of 1998, the Company requested the
transfer of the £34,574 from the Tranche A facility to the
Tranche B facility. Each tranche under the facility is structured
as a three-year commitment. All borrowings under the UK/
Canada Facility are based on varying terms of LIBOR. The Cor-
poration serves as the guarantor of all borrowings under the
UK/Canada Facility. There were no outstandings under the UK/
Canada Facility as of December 31, 1999. As of December 31,
1998, the Company had a total of $166,345 outstanding under
the UK/Canada Facility ($66,400 under Tranche A and $99,945
under Tranche B).
Bank Notes
Under the Company’s bank note program, the Bank from time
to time may issue senior bank notes at fixed or variable rates
tied to LIBOR with maturities from 30 days to 30 years. The
aggregate principal amount available for issuance under the
program is $8,000,000 (of which, up to $200,000 may be sub-
ordinated bank notes). There were no subordinated bank notes
issued or outstanding as of December 31, 1999 and 1998.
The Bank has established a program for the issuance of
debt instruments to be offered outside of the United States.
Under this program, the Bank from time to time may issue
instruments in the aggregate principal amount of $1,000,000
equivalent outstanding at any one time ($5,000 outstanding as
of December 31, 1999 and 1998). Instruments under this pro-
gram may be denominated in any currency or currencies.
The Corporation has three shelf registration statements
under which the Corporation from time to time may offer and
sell (i) senior or subordinated debt securities, consisting of
debentures, notes and/or other unsecured evidences, (ii) pre-
ferred stock, which may be issued in the form of depository
shares evidenced by depository receipts and (iii) common stock.

58
The amount of securities registered is limited to a $1,550,000
aggregate public offering price or its equivalent (based on the
applicable exchange rate at the time of sale) in one or more for-
eign currencies, currency units or composite currencies as shall
be designated by the Corporation. At December 31, 1999, the
Corporation had existing unsecured senior debt outstanding
under the shelf registrations of $550,000 including $125,000
maturing in 2003, $225,000 maturing in 2006, and $200,000
maturing in 2008.
Interest-bearing deposits, other borrowings and senior
notes as of December 31, 1999, mature as follows:
Interest-bearing OtherDeposits Borrowings Senior Notes Total
2000 $ 2,122,572 $ 2,317,706 $ 765,716 $ 5,205,994
2001 574,853 263,021 899,136 1,737,010
2002 283,163 56,151 565,000 904,314
2003 266,803 46,459 949,874 1,263,136
2004 473,345 295,000 768,345
Thereafter 63,073 97,129 705,822 866,024
Total $ 3,783,809 $ 2,780,466 $ 4,180,548 $ 10,744,823
note f
ASSOCIATE BENEFIT AND STOCK PLANS
The Company sponsors a contributory Associate Savings Plan
in which substantially all full-time and certain part-time associ-
ates are eligible to participate. The Company makes contribu-
tions to each eligible employee’s account, matches a portion of
associate contributions and makes discretionary contributions
based upon the Company meeting a certain earnings per share
target. The Company’s contributions to this plan were $27,157,
$16,357 and $10,264 for the years ended December 31, 1999,
1998 and 1997, respectively.
The Company has five stock-based compensation plans.
The Company applies Accounting Principles Board Opinion
No. 25, “Accounting for Stock Issued to Employees” (“APB 25”)
and related Interpretations in accounting for its stock-based
compensation plans. In accordance with APB 25, no compen-
sation cost has been recognized for the Company’s fixed stock
options, since the exercise price of all options equals or exceeds
the market price of the underlying stock on the date of grant,
nor for the Associate Stock Purchase Plan (the “Purchase
Plan”), which is considered to be noncompensatory. For the
performance-based option grants discussed below, compensa-
tion cost is measured as the difference between the exercise
price and the target stock price required for vesting and is rec-
ognized over the estimated vesting period. The Company
recognized $44,542, $70,038 and $24,772 of compensation
cost relating to its associate stock plans for the years ended
December 31, 1999, 1998 and 1997, respectively.
On April 29, 1999, the Company’s Board of Directors
approved a three-for-one stock split of the common stock of the
Corporation. The stock split was effected through a 200 percent
stock distribution on June 1, 1999, to the stockholders of record
on May 20, 1999. Consistent with the terms of the Company’s
stock-based compensation plans, the number of shares subject
to the plans and the respective exercise prices have been
adjusted accordingly and are reflected herein for all periods
presented.
SFAS No. 123, “Accounting for Stock-Based Compensation”
(“SFAS 123”) requires, for companies electing to continue to fol-
low the recognition provisions of APB 25, pro forma information
regarding net income and earnings per share, as if the recogni-
tion provisions of SFAS 123 were adopted for stock options
granted subsequent to December 31, 1994. For purposes of pro
forma disclosure, the fair value of the options was estimated at
the date of grant using a Black-Scholes option-pricing model
with the weighted average assumptions described below and is
amortized to expense over the options’ vesting period.
Year Ended December 31, 1999 1998 1997
Assumptions
Dividend yield .24% .32% .82%
Volatility factors of expected market price of stock 45% 40% 40%
Risk-free interest rate 5.29% 5.44% 6.27%
Expected option lives (in years) 5.4 5.2 4.5
Pro Forma Information
Net income $ 325,701 $ 287,637 $ 186,003
Basic earnings per share $ 1.65 $ 1.46 $ 0.94
Diluted earnings per share $ 1.55 $ 1.38 $ 0.92
Under the 1994 Stock Incentive Plan, the Company has
reserved 43,112,640 common shares as of December 31, 1999,
for issuance in the form of incentive stock options, nonstatutory
stock options, stock appreciation rights, restricted stock and
incentive stock. The exercise price of each stock option issued to

59
date equals or exceeds the market price of the Company’s stock
on the date of grant. Each option’s maximum term is ten years.
The number of shares available for future grants was 2,191,884,
2,178,669 and 293,442 as of December 31, 1999, 1998 and
1997, respectively. Other than the performance-based options
discussed below, options generally vest annually over three to
five years and expire beginning November 2004.
In April 1999, the Company established the 1999 Stock
Incentive Plan. Under the plan, the Company has reserved
600,000 common shares for issuance in the form of nonstatu-
tory stock options. The exercise price of each stock option
equals or exceeds the market price of the Company’s stock on
the date of grant. The maximum term of each option is ten
years. The number of shares available for future grant was
283,800 as of December 31, 1999. All options granted under
the plan to date were granted on April 29, 1999 and expire on
April 29, 2009. These options vested immediately upon the
optionee’s execution of an intellectual property protection agree-
ment with the Company.
In April 1999, the Company’s Board of Directors approved
a stock option grant to senior management (“EntrepreneurGrant
IV”). This grant was composed of 7,636,107 options to certain
key managers (including 1,884,435 options to the Company’s
Chief Executive Officer [“CEO”] and Chief Operating Officer
[“COO”]) with an exercise price equal to the fair market value
on the date of grant. The CEO and COO gave up their salaries for
the year 2001 and their annual cash incentives, annual option
grants and Senior Executive Retirement Plan contributions for
the years 2000 and 2001 in exchange for their Entrepreneur-
Grant IV options. Other members of senior management gave
up all potential annual stock option grants for 1999 and 2000
in exchange for this one-time grant. All options under this grant
will vest on April 29, 2008, or earlier if the common stock’s fair
market value is at or above $100 per share for at least ten
trading days in any thirty consecutive calendar day period on or
before June 15, 2002, or upon a change of control of the Com-
pany. These options will expire on April 29, 2009.
In April 1998, upon stockholder approval, a 1997 stock
option grant to senior management (“EntrepreneurGrant II”)
became effective at the December 18, 1997 market price of
$16.25 per share. This grant included 3,429,663 performance-
based options granted to certain key managers (including
2,057,265 options to the Company’s CEO and COO), which
vested in April 1998 when the market price of the Company’s
stock remained at or above $28.00 for at least ten trading days
in a thirty consecutive calendar day period. The grant also
included 671,700 options which vest in full, regardless of the
stock price, on December 18, 2000, or immediately upon a
change in control of the Company.
In April 1999 and 1998, the Company granted 1,045,362
and 1,335,252 options, respectively, to all associates not
granted options in the EntrepreneurGrant II or Entrepreneur-
Grant IV. Certain associates were granted options in exchange
for giving up future compensation. Other associates were
granted a set number of options. These options were granted
at the then market price of $56.46 and $31.71 per share,
respectively, and vest, in full, on April 29, 2002 and April 30,
2001, respectively, or immediately upon a change in control of
the Company.
In June 1998, the Company’s Board of Directors approved
a grant to executive officers (“EntrepreneurGrant III”). This grant
consisted of 2,611,896 performance-based options granted to
certain key managers (including 2,000,040 options to the Com-
pany’s CEO and COO), which were approved by the stockholders
in April 1999, at the then market price of $33.77 per share. The
Company’s CEO and COO gave up 300,000 and 200,010 vested
options (valued at $8,760 in total), respectively, in exchange for
their EntrepreneurGrant III options. Other executive officers gave
up future cash compensation for each of the next three years in
exchange for the options. All options made under this grant will
vest if the Company’s stock reaches $58.33 per share for at
least ten trading days in a thirty consecutive calendar day period
by June 11, 2001, or immediately upon a change in control of
the Company.
In April 1996, upon stockholder approval, a 1995 stock
option grant to the Company’s CEO and COO became effective.
This grant was for performance-based options to purchase
7,500,000 common shares at the September 15, 1995, mar-
ket price of $9.73 per share. Vesting of the options was depend-
ent on the fair market value of the common stock remaining at
or above specified levels for at least ten trading days in any
thirty consecutive calendar day period. Fifty percent of the
options vested in January 1997 when the Company’s stock
reached $12.50 per share; 25% vested in October 1997 when
the stock reached $14.58 per share; and the remaining 25%
vested in January 1998 when the stock reached $16.67
per share.

60
The Company maintains two non-associate directors stock
incentive plans, the 1995 Non-Employee Directors Stock Incen-
tive Plan and the 1999 Non-Employee Directors Stock Incentive
Plan. The 1995 plan originally authorized 1,500,000 shares of
the Company’s common stock for the automatic grant of
restricted stock and stock options to eligible members of the
Company’s Board of Directors. However, in April 1999, the Com-
pany terminated the 1995 plan. The options vest after one year
and their maximum term is ten years. The exercise price of each
option equals the market price of the Company’s stock on the
date of grant. As of December 31, 1999, there was no out-
standing restricted stock under this plan.
In April 1999, the Company established the 1999 Non-
Employee Directors Stock Incentive Plan. The plan authorizes a
maximum of 525,000 shares of the Company’s common stock
for the grant of nonstatutory stock options to eligible members
of the Company’s Board of Directors. In April 1999, all non-
employee directors of the Company were given the option to
receive performance-based options under this plan in lieu
of their annual cash retainer and their time-vesting options
for each of 1999, 2000 and 2001. As a result, 497,490
performance-based options were granted to certain non-
employee directors of the Company. The options vest in full if,
on or before June 15, 2002, the market value of the Company’s
stock equals or exceeds $100 per share for ten trading days in
a thirty consecutive calendar day period. All options vest imme-
diately upon a change of control of the Company. As of
December 31, 1999, 27,510 shares were available for grant
under this plan. All options under this plan have a maximum
term of ten years. The exercise price of each option equals or
exceeds the market price of the Company’s stock on the date of
grant.
A summary of the status of the Company’s options as of
December 31, 1999, 1998 and 1997, and changes for the years
then ended is presented below:
1999 1998 1997Weighted- Weighted- Weighted-
Average Average AverageOptions Exercise Price Options Exercise Price Options Exercise Price (000s) Per Share (000s) Per Share (000s) Per Share
Outstanding at beginning of year 29,139 $ 15.99 21,375 $ 9.22 17,682 $ 7.97
Granted 10,541 55.71 10,350 27.97 4,770 13.63
Exercised (2,111) 11.44 (2,226) 6.76 (645) 6.92
Canceled (511) 38.17 (360) 17.32 (432) 10.05
Outstanding at end of year 37,058 $ 27.24 29,139 $ 15.99 21,375 $ 9.22
Exercisable at end of year 19,635 $ 12.16 17,898 $ 10.16 11,445 $ 8.14
Weighted-average fair value of options granted during the year $ 25.92 $ 11.82 $ 5.34
The following table summarizes information about options outstanding as of December 31, 1999:
Options Outstanding Options ExercisableNumber Weighted-Average Weighted-Average Number Weighted-Average
Outstanding Remaining Exercise Price Exercisable Exercise PriceRange of Exercise Prices (000s) Contractual Life Per Share (000s) Per Share
$4.31–$6.46 4,639 4.89 years $ 5.39 4,639 $ 5.39
$6.47–$9.70 416 6.09 8.17 416 8.17
$9.71–$14.56 11,001 6.11 10.50 9,958 10.23
$14.57–$21.85 4,321 7.96 16.07 3,276 16.10
$21.86–$32.79 1,331 8.39 31.66 174 31.47
$32.80–$49.20 5,816 8.84 37.17 813 36.84
$49.21–$60.00 9,534 9.35 56.41 359 56.42

61
Under the Company’s Purchase Plan, associates of the
Company are eligible to purchase common stock through
monthly salary deductions of a maximum of 15% and a mini-
mum of 1% of monthly base pay. To date, the amounts deducted
are applied to the purchase of unissued common or treasury
stock of the Company at 85% of the current market price.
Shares may also be acquired on the market. An aggregate of
3,000,000 common shares has been authorized for issuance
under the Purchase Plan, of which 1,379,037 shares were avail-
able for issuance as of December 31, 1999.
On November 16, 1995, the Board of Directors of the Com-
pany declared a dividend distribution of one Right for each
outstanding share of common stock. As amended, each Right
entitles a registered holder to purchase from the Company one
three-hundredth of a share of the Company’s authorized Cumu-
lative Participating Junior Preferred Stock (the “Junior Preferred
Shares”) at a price of $200 per one three-hundredth of a share,
subject to adjustment. The Company has reserved 1,000,000
shares of its authorized preferred stock for the Junior Preferred
Shares. Because of the nature of the Junior Preferred Shares’
dividend and liquidation rights, the value of the one three-
hundredth interest in a Junior Preferred Share purchasable upon
exercise of each Right should approximate the value of one
share of common stock. Initially, the Rights are not exercisable
and trade automatically with the common stock. However, the
Rights generally become exercisable and separate certificates
representing the Rights will be distributed, if any person or group
acquires 15% or more of the Company’s outstanding common
stock or a tender offer or exchange offer is announced for the
Company’s common stock. Upon such event, provisions would
also be made so that each holder of a Right, other than the
acquiring person or group, may exercise the Right and buy com-
mon stock with a market value of twice the $200 exercise price.
The Rights expire on November 29, 2005, unless earlier
redeemed by the Company at $0.01 per Right prior to the time
any person or group acquires 15% of the outstanding common
stock. Until the Rights become exercisable, the Rights have no
dilutive effect on earnings per share.
In July 1997, the Company’s Board of Directors voted to
repurchase up to six million shares of the Company’s common
stock to mitigate the dilutive impact of shares issuable under its
benefit plans, including its Purchase Plan, dividend reinvestment
plan and stock incentive plans. In July 1998, the Company’s
Board of Directors voted to increase this amount by an addi-
tional 4.5 million shares of the Company’s common stock. For
the years ended December 31, 1999, 1998 and 1997, the Com-
pany repurchased 2,250,000, 2,687,400 and 3,955,923 shares,
respectively, under this program. Certain treasury shares have
been reissued in connection with the Company’s benefit plans.
note g
OTHER NON-INTEREST EXPENSE
Year Ended December 31, 1999 1998 1997
Professional services $ 145,398 $ 66,591 $ 47,671
Collections 101,000 59,503 23,216
Bankcard association assessments 33,301 23,163 16,074
Fraud losses 22,476 10,278 16,749
Other 131,928 74,740 40,568
Total $ 434,103 $ 234,275 $ 144,278

62
note h
INCOME TAXES
Deferred income taxes reflect the net tax effects of temporary
differences between the carrying amounts of assets and liabil-
ities for financial reporting purposes and the amounts used for
income tax purposes. Significant components of the Company’s
deferred tax assets and liabilities as of December 31, 1999 and
1998, were as follows:
December 31, 1999 1998
Deferred tax assets:
Allowance for loan losses $ 117,375 $ 75,738
Finance charge, fee and otherincome receivables 111,599 57,913
Stock incentive plan 51,680 35,949
State taxes, net of federal benefit 15,131 7,310
Other 43,495 24,770
Subtotal 339,280 201,680
Valuation allowance (20,763) (14,168)
Total deferred tax assets 318,517 187,512
Deferred tax liabilities:
Securitizations 44,557 29,728
Deferred revenue 97,397 10,255
Other 17,110 7,814
Total deferred tax liabilities 159,064 47,797
Net deferred tax assets before unrealized losses (gains) on securities 159,453 139,715
Unrealized losses (gains) on securities 13,369 (38,772)
Net deferred tax assets $ 172,822 $ 100,943
During 1999, the Company increased its valuation
allowance by $11,935 for certain state and international loss
carryforwards generated during the year. This increase in the
valuation allowance was partially offset by a decrease of $5,340
resulting from a change in tax regulations that will allow for
the recognition of the benefits of certain acquired net operat-
ing losses.
Significant components of the provision for income taxes
attributable to continuing operations were as follows:
Year Ended December 31, 1999 1998 1997
Federal taxes $ 232,910 $ 244,536 $ 138,877
State taxes 754 471 393
Deferred income taxes (19,738) (76,317) (23,198)
Income taxes $ 213,926 $ 168,690 $ 116,072
The reconciliation of income tax attributable to continuing
operations computed at the U.S. federal statutory tax rate to
income tax expense was:
Year Ended December 31, 1999 1998 1997
Income tax at statutory federal tax rate 35.00% 35.00% 35.00%
Other 2.07 3.00 3.00
Income taxes 37.07% 38.00% 38.00%
note i
EARNINGS PER SHARE
The following table sets forth the computation of basic and
diluted earnings per share:
Year Ended December 31,(Shares in Thousands) 1999 1998 1997
Numerator:
Net income $ 363,091 $ 275,231 $ 189,381
Denominator:
Denominator for basic earnings per share —Weighted-average shares 197,594 196,769 198,210
Effect of dilutive securities:Stock options 13,089 11,990 4,734
Restricted stock 6 9
Dilutive potential common shares 13,089 11,996 4,743
Denominator for diluted earnings per share —Adjusted weighted-average shares 210,683 208,765 202,953
Basic earnings per share $ 1.84 $ 1.40 $ 0.96
Diluted earnings per share $ 1.72 $ 1.32 $ 0.93

63
Options to purchase approximately 5,200,000, 6,436,000
and 2,848,000 shares of common stock during 1999, 1998 and
1997, respectively, were not included in the computation of
diluted earnings per share because the options’ exercise prices
were greater than the average market price of the common
shares and, therefore, their inclusion would be antidilutive.
note j
REGULATORY MATTERS
The Bank and the Savings Bank are subject to capital adequacy
guidelines adopted by the Federal Reserve Board (the “Federal
Reserve”) and the Office of Thrift Supervision (the “OTS”) (col-
lectively, the “regulators”), respectively. The capital adequacy
guidelines and the regulatory framework for prompt corrective
action require the Bank and the Savings Bank to maintain spe-
cific capital levels based upon quantitative measures of their
assets, liabilities and off-balance sheet items. The inability to
meet and maintain minimum capital adequacy levels could
result in the regulators taking actions that could have a mate-
rial effect on the Company’s consolidated financial statements.
Additionally, the regulators have broad discretion in applying
higher capital requirements. Regulators consider a range of fac-
tors in determining capital adequacy, such as an institution’s
size, quality and stability of earnings, interest rate risk exposure,
risk diversification, management expertise, asset quality, li-
quidity and internal controls.
The most recent notifications received from the regulators
categorized the Bank and the Savings Bank as “well-capitalized.”
To be categorized as “well-capitalized,” the Bank and the Sav-
ings Bank must maintain minimum capital ratios as set forth
in the following table. As of December 31, 1999, there were no
conditions or events since the notifications discussed above that
management believes would have changed either the Bank or
the Savings Bank’s capital category.
To Be “Well-Capitalized”
Minimum For Under PromptCapital Corrective
Adequacy ActionRatios Purposes Provisions
December 31, 1999
Capital One BankTier 1 Capital 10.64% 4.00% 6.00%
Total Capital 13.11 8.00 10.00
Tier 1 Leverage 11.13 4.00 5.00
Capital One, F.S.B.Tier 1 Capital 9.06% 4.00% 6.00%
Total Capital 10.69 8.00 10.00
Tier 1 Leverage 8.08 4.00 5.00
December 31, 1998
Capital One BankTier 1 Capital 11.38% 4.00% 6.00%
Total Capital 13.88 8.00 10.00
Tier 1 Leverage 10.24 4.00 5.00
Capital One, F.S.B.Tier 1 Capital 11.28% 4.00% 6.00%
Total Capital 13.87 12.00 10.00
Tier 1 Leverage 9.46 8.00 5.00
During 1996, the Bank received regulatory approval and
established a branch office in the United Kingdom. In connec-
tion with such approval, the Company committed to the Federal
Reserve that, for so long as the Bank maintains a branch in the
United Kingdom, the Company will maintain a minimum Tier 1
Leverage ratio of 3.0%. As of December 31, 1999 and 1998,
the Company’s Tier 1 Leverage ratio was 12.79% and 13.49%,
respectively.
Additionally, certain regulatory restrictions exist that limit
the ability of the Bank and the Savings Bank to transfer funds
to the Corporation. As of December 31, 1999, retained earnings
of the Bank and the Savings Bank of $281,500 and $61,900,
respectively, were available for payment of dividends to the Cor-
poration without prior approval by the regulators. The Savings
Bank, however, is required to give the OTS at least thirty days
advance notice of any proposed dividend and the OTS, in its dis-
cretion, may object to such dividend.

64
note k
COMMITMENTS AND CONTINGENCIES
As of December 31, 1999, the Company had outstanding lines
of credit of approximately $55,500,000 committed to its cus-
tomers. Of that total commitment, approximately $35,300,000
was unused. While this amount represented the total available
lines of credit to customers, the Company has not experienced,
and does not anticipate, that all of its customers will exercise
their entire available line at any given point in time. The Com-
pany generally has the right to increase, reduce, cancel, alter or
amend the terms of these available lines of credit at any time.
Certain premises and equipment are leased under agree-
ments that expire at various dates through 2008, without taking
into consideration available renewal options. Many of these
leases provide for payment by the lessee of property taxes,
insurance premiums, cost of maintenance and other costs. In
some cases, rentals are subject to increase in relation to a cost
of living index. Total rental expense amounted to $37,685,
$18,242 and $13,644 for the years ended December 31, 1999,
1998 and 1997, respectively.
Future minimum rental commitments as of December 31,
1999, for all non-cancelable operating leases with initial or
remaining terms of one year or more are as follows:
2000 $ 39,379
2001 39,232
2002 36,564
2003 33,508
2004 23,787
Thereafter 112,321
Total $ 284,791
In 1998, the Company entered into a five-year lease of five
facilities in Tampa, Florida and Richmond, Virginia. Monthly rent
on the facilities is based on a fixed rate of 6.87% per annum
applied to the cost of the buildings included in the lease of
$86.8 million. The Company has two one-year renewal options
under the terms of the lease. If, at the end of the lease term, the
Company does not purchase all of the properties, the Company
would guarantee a residual value to the lessor of up to approx-
imately 84% of the cost of the buildings.
In 1999, the Company entered into two three-year agree-
ments for the lease of four facilities located in Tampa, Florida
and Federal Way, Washington. Monthly rent commences upon
completion of each of the buildings and is based on LIBOR rates
applied to the funded cost of the facilities. At December 31,
1999, one of the facilities had been completed and rent pay-
ments had commenced. The Company has a one-year renewal
option under the terms of the leases. If, at the end of each lease
term, the Company does not purchase all of the properties
under each of the leases, the Company would guarantee a
residual value to the lessor of up to approximately 85% of the
cost of the buildings in that lease agreement. The total funded
amount under both agreements was $55,201 at December 31,
1999, with an aggregate commitment of up to $120 million.
In connection with the transfer of substantially all of Signet
Bank’s credit card business to the Bank in November 1994, the
Company and the Bank agreed to indemnify Signet Bank (which
was acquired by First Union on November 30, 1997) for certain
liabilities incurred in litigation arising from that business, which
may include liabilities, if any, incurred in the purported class
action case described below.
During 1995, the Company and the Bank became involved
in a purported class action suit relating to certain collection
practices engaged in by Signet Bank and, subsequently, by the
Bank. The complaint in this case alleges that Signet Bank
and/or the Bank violated a variety of California state statutes
and constitutional and common law duties by filing collection
lawsuits, obtaining judgements and pursuing garnishment pro-
ceedings in the Virginia state courts against defaulted credit
card customers who were not residents of Virginia. This case
was filed in the Superior Court of California in the County of
Alameda, Southern Division, on behalf of a class of California
residents. The complaint in this case seeks unspecified statu-
tory damages, compensatory damages, punitive damages,
restitution, attorneys’ fees and costs, a permanent injunction
and other equitable relief.
In early 1997, the California court entered judgement in
favor of the Bank on all of the plaintiffs’ claims. The plaintiffs
appealed the ruling to the California Court of Appeals First Appel-
late District Division 4. In early 1999, the Court of Appeals
affirmed the trial court’s ruling in favor of the Bank on six counts,
but reversed the trial court’s ruling on two counts of the plain-
tiffs’ complaint. The California Supreme Court rejected the
Bank’s Petition for Review of the remaining two counts and
remitted them to the trial court for further proceedings. In August
1999, the trial court denied without prejudice plaintiffs’ motion
to certify a class on the one remaining common law claim. In
November 1999, the United States Supreme Court denied the

65
Bank’s writ of certiorari on the remaining two counts, declining
to exercise its discretionary power to review these issues.
Because no specific measure of damages is demanded in
the complaint of the California case and the trial court entered
judgement in favor of the Bank before the parties completed
any significant discovery, an informed assessment of the ulti-
mate outcome of this case cannot be made at this time.
Management believes, however, that there are meritorious
defenses to this lawsuit and intends to defend it vigorously.
The Company is commonly subject to various other pend-
ing and threatened legal actions arising from the conduct of its
normal business activities. In the opinion of management, the
ultimate aggregate liability, if any, arising out of any pending or
threatened action will not have a material adverse effect on the
consolidated financial condition of the Company. At the present
time, however, management is not in a position to determine
whether the resolution of pending or threatened litigation will
have a material effect on the Company’s results of operations in
any future reporting period.
note l
RELATED PARTY TRANSACTIONS
In the ordinary course of business, executive officers and direc-
tors of the Company may have consumer loans issued by the
Company. Pursuant to the Company’s policy, such loans are
issued on the same terms as those prevailing at the time for
comparable loans to unrelated persons and do not involve more
than the normal risk of collectibility.
note m
SECURITIZATIONS
The Company securitized in transactions accounted for as sales
$2,586,517 ($47,642 international), $4,616,972 ($245,752
international) and $2,114,695 of consumer loan receivables
for the years ended December 31, 1999, 1998 and 1997,
respectively. As of December 31, 1999, receivables under secu-
ritizations outstanding consisted of $2,482,246 of retained
(“seller’s”) interests and $10,319,400 of investors’ undivided
interests, maturing from 2000 to 2008.
The terms of securitizations require the Company to main-
tain a certain level of assets, retained by the trust, as credit
support for the securitization. These amounts are included in
accounts receivable from securitizations and were $262,819
and $263,426 as of December 31, 1999 and 1998, respectively.
note n
OFF-BALANCE SHEET FINANCIAL INSTRUMENTS
The Company has entered into interest rate swaps to effectively
convert certain interest rates on bank notes from variable to
fixed. The pay-fixed, receive-variable swaps, which had a notional
amount totaling $157,000 as of December 31, 1999, will
mature from 2001 to 2007 to coincide with maturities of the
variable bank notes to which they are designated. The Company
has also entered into amortizing notional interest rate swaps to
effectively convert certain interest rates on fixed rate consumer
loans from fixed to variable, thereby reducing the interest rate
sensitivity of loan securitizations. These pay-fixed, receive-
variable interest rate swaps, which had an amortizing notional
amount totaling $2,789,000 as of December 31, 1999, will fully
amortize between 2004 and 2006 to coincide with the esti-
mated attrition of the fixed rate consumer loans to which they
are designated. The Company also had a pay-fixed, receive-
variable interest rate swap with an amortizing notional amount
of C$208,000, which will amortize through 2003 to coincide
with the estimated attrition of the fixed rate Canadian dollar
consumer loans to which it is designated.
The Company has also entered into currency swaps that
effectively convert fixed rate pound sterling interest receipts to
fixed rate U.S. dollar interest receipts on pound sterling denom-
inated assets. These currency swaps had notional amounts
totaling $260,000 as of December 31, 1999, and mature from
2001 to 2005, coinciding with the repayment of the assets to
which they are designated.
The Company has entered into f/x contracts to reduce the
Company’s sensitivity to foreign currency exchange rate changes
on its foreign currency denominated assets and liabilities. As of
December 31, 1999, the Company had f/x contracts with notional
amounts totaling $1,058,000 that mature in 2000 to coincide
with the repayment of the assets to which they are designated.

66
note o
SIGNIFICANT CONCENTRATION OF CREDIT RISK
The Company is active in originating consumer loans, primarily
in the United States. The Company reviews each potential cus-
tomer’s credit application and evaluates the applicant’s financial
history and ability and willingness to repay. Loans are made
primarily on an unsecured basis; however, certain loans require
collateral in the form of cash deposits. International consumer
loans are originated primarily in Canada and the United King-
dom. The geographic distribution of the Company’s consumer
loans was as follows:
December 31, 1999 1998
Percentage PercentageGeographic Region: Loans of Total Loans of Total
South $ 6,751,599 33.36% $ 5,868,386 33.74%
West 4,037,714 19.95 3,609,952 20.75
Northeast 3,362,044 16.62 3,032,061 17.43
Midwest 3,644,444 18.01 2,992,334 17.20
International 2,440,787 12.06 1,892,393 10.88
20,236,588 100.00% 17,395,126 100.00%
Less securitized balances (10,323,039) (11,238,015)
Total $ 9,913,549 $ 6,157,111
note p
DISCLOSURES ABOUT FAIR VALUE
OF FINANCIAL INSTRUMENTS
The following discloses the fair value of financial instruments
as of December 31, 1999 and 1998, whether or not recognized
in the balance sheets. In cases where quoted market prices are
not available, fair values are based on estimates using present
value or other valuation techniques. Those techniques are sig-
nificantly affected by the assumptions used, including the
discount rate and estimates of future cash flows. In that regard,
the derived fair value estimates cannot be substantiated by
comparison to independent markets and, in many cases, could
not be realized in immediate settlement of the instrument. As
required under GAAP, these disclosures exclude certain finan-
cial instruments and all non-financial instruments. Accordingly,
the aggregate fair value amounts presented do not represent
the underlying value of the Company.
The following methods and assumptions were used by the
Company in estimating the fair value of its financial instruments
as of December 31, 1999 and 1998:
Cash and Cash Equivalents
The carrying amounts of cash and due from banks, federal
funds sold and resale agreements and interest-bearing deposits
at other banks approximated fair value.
Securities Available for Sale
The fair value of securities available for sale was determined
using current market prices. See Note B for fair values by type
of security.
Consumer Loans
The net carrying amount of consumer loans, including the Com-
pany’s seller’s interest in securitized consumer loan receivables,
approximated fair value due to the relatively short average life
and variable interest rates on a substantial number of these
loans. This amount excluded any value related to account
relationships.
Interest Receivable
The carrying amount approximated fair value.
Accounts Receivable from Securitizations
The carrying amount approximated fair value.
Borrowings
The book value of interest-bearing deposits, secured borrowings,
federal funds purchased and resale agreements, and other
short-term borrowings approximates fair value. The fair value of
the junior subordinated capital income securities was $84,199
and $77,672 at December 31, 1999 and 1998, respectively, and
is determined based on quoted market prices. The fair value of
senior notes was $4,075,825 and $3,769,000 as of December
31, 1999 and 1998, respectively, and is determined based on
quoted market prices.
Interest Payable
The carrying amount approximated fair value.
Off-Balance Sheet Financial Instruments
The fair value was the estimated net amount that the Company
would have (paid)/received to terminate the interest rate swaps,
currency swaps and f/x contracts at the respective dates, taking
into account the forward yield curve on the swaps and the for-
ward rates on the currency swaps and f/x contracts. As of
December 31, 1999 and 1998, the estimated fair value was
$80,566 and ($64,713), respectively.

67
note q
CAPITAL ONE FINANCIAL CORPORATION (PARENT COMPANY ONLY) CONDENSED FINANCIAL INFORMATION
Balance Sheets at December 31, 1999 1998
Assets:
Cash and cash equivalents $ 5,846 $ 10,887
Investment in subsidiaries 1,428,754 1,211,255
Loans to subsidiaries(1) 609,176 375,396
Other 81,169 62,316
Total assets $ 2,124,945 $ 1,659,854
Liabilities:
Senior notes $ 548,897 $ 324,213
Borrowings from subsidiaries 46,802 54,200
Other 13,639 11,035
Total liabilities 609,338 389,448
Stockholders’ equity 1,515,607 1,270,406
Total liabilities and stockholders’ equity $ 2,124,945 $ 1,659,854
(1) As of December 31, 1999 and 1998, includes $11,350 and $108,400, respectively, of cash invested at the Bank instead of the open market.
Statements of Income for the Year Ended December 31, 1999 1998 1997
Interest from temporary investments $ 32,191 $ 12,485 $ 11,352
Interest expense (41,011) (18,212) (11,067)
Dividends, principally from bank subsidiaries 220,001 260,000 228,000
Non-interest income 39 893 56
Non-interest expense (6,274) (2,700) (409)
Income before income taxes and equity in undistributed earnings of subsidiaries 204,946 252,466 227,932
Income tax benefit 5,721 2,863 25
Equity in undistributed earnings (loss) of subsidiaries 152,424 19,902 (38,576)
Net income $ 363,091 $ 275,231 $ 189,381

68
Statements of Cash Flows for the Year Ended December 31, 1999 1998 1997
Operating Activities:
Net income $ 363,091 $ 275,231 $ 189,381
Adjustments to reconcile net income to net cash provided by operating activities:
Equity in undistributed (earnings) loss of subsidiaries (152,424) (19,902) 38,576
Decrease (increase) in other assets 4,236 (56,682) (2,183)
Increase in other liabilities 2,604 1,365 3,290
Net cash provided by operating activities 217,507 200,012 229,064
Investing Activities:
Purchases of securities available for sale (26,836)
Proceeds from maturities of securities available for sale 11,658
Increase in investment in subsidiaries (115,233) (172,119) (83,366)
Increase in loans to subsidiaries (233,780) (167,889) (102,507)
Net cash used for investing activities (364,191) (340,008) (185,873)
Financing Activities:
Increase in borrowings from subsidiaries (7,398) 50,900 3,300
Issuance of senior notes 224,684 199,213
Dividends paid (20,653) (20,533) (20,638)
Purchases of treasury stock (107,104) (91,672) (52,314)
Net proceeds from issuances of common stock 14,028 12,143 6,509
Proceeds from exercise of stock options 38,086 629 4,082
Net cash provided by (used for) financing activities 141,643 150,680 (59,061)
Increase (decrease) in cash and cash equivalents (5,041) 10,684 (15,870)
Cash and cash equivalents at beginning of year 10,887 203 16,073
Cash and cash equivalents at end of year $ 5,846 $ 10,887 $ 203

69
CAPITAL ONE FINANCIAL CORPORATION
BOARD OF DIRECTORS
Richard D. FairbankChairman and Chief Executive OfficerCapital One Financial Corporation
Nigel W. MorrisPresident and Chief Operating OfficerCapital One Financial Corporation
W. Ronald Dietz*Managing PartnerCustomer Contact Solutions, LLC
James A. Flick, Jr.*President and Chief Executive OfficerDome Corporation
Patrick W. Gross*Founder and Chairman, Executive CommitteeAmerican Management Systems, Inc.
James V. Kimsey**Founding CEO and Chairman EmeritusAmerica Online, Inc.
Stanley I. Westreich**PresidentWestfield Realty, Inc.
CAPITAL ONE FINANCIAL CORPORATION
EXECUTIVE OFFICERS
Richard D. FairbankChairman and Chief Executive Officer
Nigel W. MorrisPresident and Chief Operating Officer
Marjorie M. ConnellySr. Vice President, Credit Card Operations
Matthew J. CooperSr. Vice President, Marketing and Analysis
John G. Finneran, Jr.Sr. Vice President, General Counsel and Corporate Secretary
Dennis H. LibersonSr. Vice President, Human Resources
William J. McDonaldSr. Vice President, Brand Management
Peter A. SchnallSr. Vice President, Marketing and Analysis
Michael ShraderSr. Vice President, Sales
David M. WilleySr. Vice President, Corporate Financial Management
directors and officers
*Audit Committee**Compensation Committee

49
Year Ended December 31 (In Thousands, Except Per Share Data) 1999 1998 1997
Interest Income:Consumer loans, including fees $ 1,482,371 $ 1,003,122 $ 619,785
Securities available for sale 105,438 94,436 78,542
Other 5,675 13,978 19,658
Total interest income 1,593,484 1,111,536 717,985
Interest Expense:Deposits 137,792 67,479 41,932
Other borrowings 100,392 96,130 46,068
Senior and deposit notes 302,698 260,675 253,849
Total interest expense 540,882 424,284 341,849
Net interest income 1,052,602 687,252 376,136
Provision for loan losses 382,948 267,028 262,837
Net interest income after provision for loan losses 669,654 420,224 113,299
Non-Interest Income:Servicing and securitizations 1,187,098 789,844 682,345
Service charges and other fees 1,040,944 611,958 337,755
Interchange 144,317 86,481 49,030
Total non-interest income 2,372,359 1,488,283 1,069,130
Non-Interest Expense:Salaries and associate benefits 780,160 476,389 289,322
Marketing 731,898 446,264 224,819
Communications and data processing 264,897 150,220 98,135
Supplies and equipment 181,663 112,101 82,874
Occupancy 72,275 45,337 37,548
Other 434,103 234,275 144,278
Total non-interest expense 2,464,996 1,464,586 876,976
Income before income taxes 577,017 443,921 305,453
Income taxes 213,926 168,690 116,072
Net income $ 363,091 $ 275,231 $ 189,381
Basic earnings per share $ 1.84 $ 1.40 $ 0.96
Diluted earnings per share $ 1.72 $ 1.32 $ 0.93
Dividends paid per share $ 0.11 $ 0.11 $ 0.11
See Notes to Consolidated Financial Statements.
consolidated statements of income

50
CumulativeOther Total
Common Stock Paid-In Retained Comprehensive Treasury Stockholders’(Dollars in Thousands, Except Per Share Data) Shares Amount Capital, Net Earnings Income Stock Equity
Balance, December 31, 1996 198,975,783 $ 1,990 $ 480,056 $ 256,397 $ 1,948 $ 740,391Comprehensive income:
Net income 189,381 189,381Other comprehensive income,
net of income tax:Unrealized gains on securities,
net of income taxes of $481 532 532Foreign currency
translation adjustments 59 59Other comprehensive income 591 591
Comprehensive income 189,972Cash dividends — $.11 per share (20,638) (20,638)Purchases of treasury stock $ (52,314) (52,314)Issuances of common stock 305,400 3 2,753 2,201 4,957Exercise of stock options 390,870 4 2,612 1,466 4,082Common stock issuable
under incentive plan 24,772 24,772Other items, net (363) 2,037 2,037Balance, December 31, 1997 199,671,690 1,997 512,230 425,140 2,539 (48,647) 893,259Comprehensive income:
Net income 275,231 275,231Other comprehensive income,
net of income tax:Unrealized gains on securities,
net of income taxes of $37,170 60,648 60,648Foreign currency translation
adjustments (2,532) (2,532)Other comprehensive income 58,116 58,116
Comprehensive income 333,347Cash dividends — $.11 per share (20,533) (20,533)Purchases of treasury stock (91,672) (91,672)Issuances of common stock 35,381 26,745 62,126Exercise of stock options 4,500 (23,683) 43,323 19,640Common stock issuable
under incentive plan 70,038 70,038Other items, net (5,814) 4,201 4,201Balance, December 31, 1998 199,670,376 1,997 598,167 679,838 60,655 (70,251) 1,270,406Comprehensive income:
Net income 363,091 363,091Other comprehensive income,
net of income tax:Unrealized losses on securities,
net of income tax benefit of $58,759 (95,868) (95,868)
Foreign currency translation adjustments 3,951 3,951
Other comprehensive income (91,917) (91,917)Comprehensive income 271,174Cash dividends — $.11 per share (20,653) (20,653)Purchases of treasury stock (107,104) (107,104)Issuances of common stock (1,628) 9,833 8,205Exercise of stock options (38,422) 76,508 38,086Common stock issuable
under incentive plan 49,236 49,236Other items, net 45 6,237 20 6,257Balance, December 31, 1999 199,670,421 $ 1,997 $ 613,590 $ 1,022,296 $ (31,262) $ (91,014) $ 1,515,607
See Notes to Consolidated Financial Statements.
consolidated statements of changes in stockholders’ equity

51
Year Ended December 31 (In Thousands) 1999 1998 1997
Operating Activities:Net income $ 363,091 $ 275,231 $ 189,381
Adjustments to reconcile net income to cash
provided by operating activities:
Provision for loan losses 382,948 267,028 262,837
Depreciation and amortization, net 172,623 108,173 72,674
Stock compensation plans 49,236 70,056 24,878
(Increase) decrease in interest receivable (11,720) (141) 26,707
Decrease (increase) in accounts receivable from securitizations 65,208 (133,771) (86,261)
Increase in other assets (157,685) (121,951) (49,964)
Increase (decrease) in interest payable 24,768 22,667 (11,914)
Increase in other liabilities 383,820 293,266 97,914
Net cash provided by operating activities 1,272,289 780,558 526,252
Investing Activities:Purchases of securities available for sale (871,355) (1,251,713) (1,275,900)
Proceeds from sales of securities available for sale 719,161 112,277 483,592
Proceeds from maturities of securities available for sale 42,995 606,532 450,787
Proceeds from securitizations of consumer loans 2,586,517 4,616,972 2,114,695
Net increase in consumer loans (6,763,580) (6,144,640) (2,875,908)
Recoveries of loans previously charged off 124,673 67,764 27,462
Additions of premises and equipment, net (350,987) (153,024) (51,602)
Net cash used for investing activities (4,512,576) (2,145,832) (1,126,874)
Financing Activities:Net increase in interest-bearing deposits 1,783,830 686,325 370,632
Net increase in other borrowings 1,038,010 735,288 362,557
Issuances of senior and deposit notes 1,453,059 1,323,700 529,977
Maturities of senior and deposit notes (1,012,639) (1,218,162) (891,436)
Dividends paid (20,653) (20,533) (20,638)
Purchases of treasury stock (107,104) (91,672) (52,314)
Net proceeds from issuances of common stock 14,028 12,143 6,509
Proceeds from exercise of stock options 38,086 629 4,082
Net cash provided by financing activities 3,186,617 1,427,718 309,369
(Decrease) increase in cash and cash equivalents (53,670) 62,444 (291,253)
Cash and cash equivalents at beginning of year 300,167 237,723 528,976
Cash and cash equivalents at end of year $ 246,497 $ 300,167 $ 237,723
See Notes to Consolidated Financial Statements.
consolidated statements of cash flows

70
corporate information
Corporate Office2980 Fairview Park Drive, Suite 1300Falls Church, VA 22042-4525(703) 205-1000www.capitalone.com
Annual MeetingThursday, April 27, 2000, 10:00 a.m. Eastern TimeFairview Park Marriott Hotel3111 Fairview Park DriveFalls Church, VA 22042
Principal Financial ContactPaul PaquinVice President, Investor RelationsCapital One Financial Corporation2980 Fairview Park Drive, Suite 1300Falls Church, VA 22042-4525(703) 205-1039
Copies of Form 10-K filed with the Securitiesand Exchange Commission are available withoutcharge, upon written request to Paul Paquinat the above address.
Common StockListed on New York Stock ExchangeStock Symbol COFMember of S&P 500
Corporate Registrar/Transfer AgentFirst Chicago Trust, a division of EquiserveP.O. Box 2500Jersey City, NJ 07303-2500Telephone: (800) 446-2617Fax: (201) 222-4892For hearing impaired:(201) 222-4955E-mail: equiserve.comInternet: www.equiserve.com
Independent AuditorsErnst & Young LLP

end table
car
a good time
night out
handbag
ties
fabulous dinner
party in my honor
designer clothes
tuba
talking to my mom
groceries
football
lawn mower
closet organizers
mp3 player
computer
rental car
low interest loan
personal organizer
talking to my mom
toys for christmas
wireless phone
time with my honey
jacket
canoe
laptop
ride to work
kitchen toys
curtains
lambskin seat covers
calling my dad
a good deal
my way
a smile
new perspective
books for the semester
cordless drill
a chance
unicycle
espresso maker
birthday cake
a fabulous dinner
party in my honor
flying lessons
talking to my mom
trip to the lake
camera
flowers
balance
vise grip
office supplies
week in hawaii
personal organizer
antique books
necklace for my wife
birthday presents
plane tickets
salad spinner
vacation
crochet yarn
time with my honey
financial control
my car fixed
drum kit
theater tickets
a french dictionary
pup tent
blueberry pie
seeds for the garden
reupholstered sofas
tango lessons
being in touch
sushi dinner
glass animals
vase
spoiler
skateboard
tennis shoes
aquarium
a good book
manicure
computer
week in hawaii
call for help
toys for christmas
dvd player
catcher’s mitt
lunch with an old
friend
online access
cello
tv
airplane tickets
work bench
food mill
satellite dish
opera tickets
curtains
cheesecake
saddle
groceries
call to my dad
new suit
tires
ride to work
massage
emergency assistance
night out
root canal
photos framed
night out
handbag
night of dancing
birthday cake
designer clothes
rubber boots
a facial
necklace
the day off
modem
better financing
personal shopper
full tank
grill
magazines
sandwich
frequent flyer miles
cd player
trip to the circus
day in the sun
baby clothes
pool table
mother’s day present
movie tickets
thank-you notes
watercolor set
business cards
calculator
blender
surround sound
dozen roses
yearly check-up
wind-up toy
wet bar
computer disks
skateboard
sewing machine
video camera
table saw
stamps
film developing
rod and reel
good laugh
white socks
exotic vacation
good read
barbeque
good investment
keeping in touch
engagement ring
art books
challenges
snow shovel
rowboat
stereo
diapers
day at the fair
puppy
flute
dinner out
porch
karate lessons
leaf blower
watch
stiletto heels
microwave
new uniform
work of art
bus ticket
steak dinner
red shoes
ice cream maker
leather pants
knitting needles
excitement
18 holes
the early bird spe-
cial
cologne
family reunion
balloons
parakeet
kiddy pool
saxophone
tickets to the game
ten-speed bike
catching up with afriend
pony
remodeling
rocking horse
weekend in vegas
rocket
marble tub
ballet lesson
season tickets
bowling ball
working from home
cowboy hat
haircut
electric blanket
compass
lawn gnomes
fruit basket
my cap and gown
dominoes
jungle gym
cross trainers
box of chocolates
snow globe
online freedom
umbrella
italian lessons
back deck
band saw
chat with sis
his and hers towels
directions on the
road
belgian chocolate
surfboard
down comforter
new glasses
financial freedom
wwf tickets
talking to home
cruise
tinted windows
entertainment system
golf clubs
camp for the kids
champagne
vitamins
hearing grandpa’s voice
pedicure
free weights
gardening tools
bakeware
cooking help from mom
equalizer
platform shoes
dog collar
drive to jasper
flag
trench coat
ice chest
porcelain figurines
wool sweater
time with the grandkids
markers
lawn tractor
watch
baby clothes
washer/dryer
opportunity
play clothes
baseball cards
mag wheels
jeans
fog lights
dry cleaning
clarinet
air conditioner
connections
a good boss
museum visit
corsage
scale
kettle
ukulele
a better view
board game
blue ribbon
map
year’s news
tool belt
blocks
abacus
pool
egg timer
game of pool
tropical fish
calendar
ping pong table
good fortune
piggy bank
alarm clock
train tickets
kaleidoscope
walkie-talkies
cavity filled
nose job
aromatherapy
yo-yo
video game
lunch box
picnic
blinds
new saddle
carpool
knick-knacks
wine glasses
stove
fax machine
tennis racket
kick boxing lessons
area rug
checkers
tune-up
fireplace
long johns
jog in the park
pearl necklace
family vacation
doll
golf bag
dinnerware
fountain pen
fedora
chess set
cookbook
flatware
cuff links
leather jacket
desk
teapot
skateboard
guitar lessons
shoe polish
autographed jersey
binoculars
tuxedo
charm bracelet
answering machine
electronic organizer
banjo
mixer
lobster pot
luggage
talking to my kids
guest soaps
a day at the spa
breakfast in bed
florida vacation
diamond earrings
fishing pole
framed mirror
shocks
week in san francisco
stationery
phone call home
moving expenses
software
cutting board
new portfolio
miniskirt
work boots
valentine
gym membership
beach chair
suit
tiramisu
electric blanket
shave
desk lamp
lounge wear
cookware
closet fixtures
riding boots
club chair
chandelier
claw-foot tub
sculpture
barware
painting
digital camera
alarm system
lunch on the town
call the babysitter
bedroom set
hubcaps
id bracelet
new mouse
stress ball
snow board
sailing lessons
school clothes
hearing my brother
high return on savings
capped teeth
dinner with my family
service
down pillows
raft
flower box
top hat
coffee grinder
gas grill
pottery
tai chi classes
ballet lesson
organic groceries
emergency dental work
phone i can afford
wig
scuba gear
new desk
swim fins
lab coat
free-range chicken
faux-fur coat
contact lenses
financial control
medicine
walk in the rain
robot dog
easel
monogrammed shirt
towels
cappuccino machine
steamer trunk
crib
party dress
whitewalls
software
internet hookup
rare orchid
world’s best foun-
tain pen
flowers
graphing calculator
globe
ten cds
picture frames
datebook
trip to london
collectibles
invitation
roller blades
bowtie
heart pendant
waterproof watch
skis
reporting a win
tent
camping trip
lantern
yoga class
straight teeth
dictionary
butterfly
cooking lessons
yellow note pads
cd case
vest
pastry
riding lessons
train set
corkboard
mittens
t-square
paper dolls
contact lenses
tube top
jelly beans
ottoman
drive to the shore
reflexology
shade
flamenco dancing
lessons
goldfish
alarm system
tricycle
picture book
company
dye job
remote access
cheese grater
oil paints
father’s day card
lobster
telescope
bread maker
man-made pond
crystal bowl
furnished basement
ownership
penny-whistle
family dinner
pocket protector
gold star
sled
kitten
fruit tart
good conversation
snow tires
basketball shoes
father’s day present
movie camera
medical supplies
tools
filing cabinet
truck
briefcase
crystal ball
my own web site
21-speed bike
palmtop computer
cell phone
duvet cover
golf bag
scooter
coffee maker
chocolate cake
safe
gloves
cash advance
sail cloth
educational cd-roms
fins
subscriptions
trip abroad
roof repairs
music stand
firewood
mixing bowls
lunch box
club chairs
bikini
stethoscope
plants for the garden
jumpers
padlock
antique maps
rollerblades
candles
theme park tickets
iron
tire swing
bicycle built for
two
breakfast out
swim mask
bathroom scale
boda bag
plumber’s wrench
bread
medicine ball
soccer ball
watering can
backpack
dog food
car insurance
violin
bagel toaster
chinese lanterns
banjo
soup ladle
baseball mitt
cat food
metronome
ice maker
baseball cap
tape dispenser
fridge
cat toys
dollhouse
sandbox
wedding rings
encyclopedia
a baby crib
kitty litter
litter box
treadmill
space heater
my class ring
leather wallet
dinette set
skis
go-go boots
ski boots
moccasins
lift tickets
mittens
gloves
bread machine
knife set
butcher block
butterfly net
mood ring
camping stove
coffee table
tassel loafers
penny loafers
hiking boots
slide projector
bicycle helmet
parka
armoire
snuggly
swing set
fishing vest
billiard table
wool scarf
snow tires
swim trunks
language lessons
microphone
monitor
fire extinguisher
first-aid kit
secret call
theater tickets
concert tickets
home spa
trip to Beijing
pda
my prescription
filled
trade magazines
candy dish
color printer
laser printer
scanner
hard disk drive
juice glasses
theme park tickets
trip to the zoo
car financing
emergency credit
to make a difference
options
new products
low rates
fixed rates
technology
helping mom
seeing my cousins
teamwork
power suit
leisure suit
pants suit
smoking jacket
dangly earrings
growth
hat stand
hockey stick
museum membership
thermos
ruby slippers
pashmina shawl
porcelain filling
water filter system
swing set
internet access
spare tire
camping trip
universal remote
slippers
cat scratching post
mini-blinds
home gym
new dentures
running shoes
bigger hard drive
make-over
roof repairs
stereo components
windsurfer
better rates
to travel
indoor tree
horse
beeper
sconces
panda calendar
lacrosse stick
amethyst ring
silk stockings
microscope
bridgework
garden hose
dirt bike
dsl service
packages delivered
dozen roses
big screen tv
answering machine
snow tires
bifocals
pink shirt
make-up case
grandfather clock
sunglasses
satellite dish
cabinet re-facing
boogie board
electric guitar
braces
motor home
cable modem
cowboy hat
pool toys
dresser
trip to germany
computer games
coat rack
capped teeth
lawn flamingo
pet bed
shoes
director’s chair
notebooks
snow blower
the farmer’s almanac
cb radio
raincoat
surfboard
acoustic guitar
museum membership
chaps
vanity
dishwasher
towel warmer
sushi dinner
action figures
pea coat
wingback chair
new pillows
cockatoo
baseball bat
teething toys
eyelash curler
pet leash
fiberoptic light
mission-style furniture
mud flaps
food processor
night stands
corduroy pants
bridgework
kayak
more ram
headphones
turkish carpet
sun hat
toy glider
camera bag
pressure cooker
fruitcake
boxer shorts
lobster clambake
movie posters
needlepoint kit
audio tape
catnip
sports memorabilia
hair clips
rabbit
windbreaker
homemade wreath
portable stereo
silk pajamas
water skis
fog-free goggles
copy machine
heart rate monitor
laser pointer
skateboard
junior golf clubs
plants
educational toys
bath salts
carpet
camping gear
car computer kit
golf shoes
polo shirts
video phone
fax machine
big screen tv
paper shredder
child car seat
marionette
cactus
parrot
habitrail
hot-melt glue gun
sportscoat
joystick
pager
radar detector
workbench
marine radio
new saddle
taking the carpool
wine glasses
stove
fax machine
tennis racket
kick boxing lessons
area rug
checkers
date book
trip to london
invitation
roller blades
heart pendant
waterproof watch
yoga lessons
tent
train set
lantern
yoga class
straight teeth
dictionary
butterfly net
cooking lessons
yellow note pads
cd case
vest
pastry
corkboard
mittens
paper dolls
contact lenses
tube top
jelly beans
ottoman
drive to the shore
reflexology
shade
flamenco dancing lessons
goldfish
alarm system
tricycle
picture book
good company
tune-up
fireplace
long johns
jog in the park
pearl necklace
family vacation
doll
golf bag
fountain pen
kitty litter
litter box
treadmill
space heater
my class ring
leather wallet
dinette set
skis
go-go boots
ski boots
moccasins
lift tickets
mittens
gloves
bread machine
knife set
butcher block
butterfly net
mood ring
camping stove
coffee table
tassel loafers
penny loafers
hiking boots
slide projector
bicycle helmet
parka
armoire
snuggly
swing set
fishing vest
billiard table
wool scarf
snow tires
swim trunks
language lessons
microphone
monitor
fire extinguisher
first-aid kit
secret call
theater tickets
concert tickets
pet bed
shoes
notebooks
snow blower
the farmer’s almanac
action figures
pea coat
wing back chair
work of art
bus ticket
steak dinner
red shoes
ice cream maker
leather pants
knitting needles
excitement
18 holes
the early bird special
cologne
family reunion
balloons
parakeet
kiddy pool
saxophone
tickets to the game
ten-speed bike
catchingup withafriend
pony
remodeling
rocking horse
weekend in vegas
rocket
marble tub
ballet lesson
season tickets
bowling ball
working from home
cowboy hat
haircut
lobster pot
luggage
guest soaps
a day at the spa
breakfast in bed
florida vacation
diamond earrings
fishing pole
bridesmaid dress
color printer
framed mirror
space heater
my class ring
leather wallet
dinette set
end tables
movie tickets
massaging shower head
dry cleaning
antique maps
mother’s day present
fog lights
beeper
heart pendant
week in cancun
world map
vanity
dishwasher
sushi dinner
microphone
monitor
fire extinguisher
vest
knitting needles
day off
modem
better financing
personal shopper
full tank
backyard grill
magazines
sandwiches
lantern
yoga class
straight teeth
dictionary
cheese graters
oil paints
father’s day gifts
lobster
telescope
man-made pond
pink shirt
make-up case
grandfather clock
sunglasses
satellite dish
cabinet re-facing
boogie board
rare orchid
world’s bestfountainpen
flowers
cologne
family reunion
balloons
parakeet
kiddy pool
saxophone
tickets to the game
ten-speed bike
catching up with a
friend
pony
remodeling
rocking horse
weekend in vegas
rocket
marble tub
ballet lesson
season tickets
bowling ball
working from home
cowboy hat
haircut
electric blanket
compass
lawn gnomes
fruit basket
my cap and gown
dominoes
jungle gym
cross trainers
box of chocolates
snow globe
online freedom
umbrella
italian lessons
back deck
snow tires
basketball shoes
father’s day present
movie camera
medical supplies
tools
filing cabinet
truck
briefcase
crystal ball
my own web site
21-speed bike
palmtop computer
wireless phone
duvet cover
golf bag
scooter
coffee maker
chocolate cake
safe
gloves
cash advance
tires
ride to work
massage
emergency assistance
night out
root canal
photos framed
night out
handbag
night of dancing
birthday cake
designer clothes
talking to my mom
facial
faster modem
better financing
sauna
personal shopper
full tank
grill
magazines
sandwich
miles for dollars spent
cd player
robot dog
trip to the zoo
easel
towels
cappuccino machine
steamer trunk
crib
bookshelves
party dress
whitewalls
software
internet hookup
rare orchid
graphing calculator
globe
ten cds
picture frames
secret call
theater tickets
concert tickets
home spa
trip to beijing
stools
my prescription filled
trade magazines
candy dish
laser printer
scanner
hard disk drive
juice glasses
theme park tickets
car financing
emergency credit
to make a difference
options
new products
low rates
fixed rates
technology
helping mom
seeing my cousins
acoustic guitar
chaps
vanity
dishwasher
towel warmer
sushi dinner
action figures
pea coat
wingback chair
new pillows
cockatoo
baseball bat
teething toys
eyelash curler
pet leash
fiber-optic light
mission-stylefurniture
mud flaps
food processor
night stands
corduroy pants
bridgework
kayak
more ram
headphones
turkish carpet
sun hat
swim mask
bathroom scale
boda bag
bread
medicine ball
soccer ball
watering can
backpack
dog food
toaster
violin
bagel toaster
chinese lanterns
banjo
soup ladle
baseball mitt
cat food
metronome
ice maker
ukulele
better view
board game
blue ribbon
fish tank
year’s news
tool belt
blocks
abacus
pool
egg timer
game of pool
tropical fish
calendar
ping pong table
good fortune
piggy bank
alarm clock
train tickets
kaleidoscope
walkie-talkies
cavity filled
nose job
aromatherapy
yo-yo
end table
car
good time
night out
handbag
ties
party in my honor
designer clothes
talking to my mom
groceries
football
lawn mower
closet organizers
mp3 player
computer
closingadealatthebeach
rental car
low interest rate
personal organizer
talking to my mom
toys for christmas
lunch with an old friend
piano
insurance
pogo stick
trampoline
shrubs
baguettes
gps for my boat
house paint
linens
perfume
aquarium
pet toys
jumper cables
monkey
thesaurus
atlas
software
hot tub
painting lessons
wallpaper
sunglasses
flowers
business cards
waterproof watch
water skis
french lessons
tuxedo rental
a truck bed liner
towel warmer
emergency credit
bulletin board
commercial stove
talking to my kids
unabridged dictionary
camping dishes
a family reunion
cd case
the early bird special
washer/dryer
massaging shower head
a wall unit
last year,
(Including the skateboard that soon-to-be-10-year-oldJimmy Fowler saw his Mom sneak into the back seat with the rest of the groceries.)
we helped our customers complete more than 392,458,011 transactions.
©2000 Capital One Trademarks referenced herein are property of their respective owners.