Thanks For Joining - Department of Energy · What is Benchmarking? Benchmarking is the process of...
48
1 This is the US DOE TAP Webcast – Introduction to Benchmarking: Starting a Benchmarking Plan We will begin shortly! For the best audio quality, please dial in using your telephone and place your phone on mute. We will have a Q&A session at the end. If you have a question during the presentation, please type it in the questions window in the control panel to the right. Toll: +1 (951) 266-6126 Access Code: 520-707-895 Audio PIN: Shown after joining the Webinar Thanks For Joining
-
Upload
vuongtuyen -
Category
Documents
-
view
215 -
download
0
Transcript of Thanks For Joining - Department of Energy · What is Benchmarking? Benchmarking is the process of...

1
This is the US DOE TAP Webcast – Introduction to
Benchmarking: Starting a Benchmarking Plan
We will begin shortly!
For the best audio quality, please dial in using your telephone
and place your phone on mute. We will have a Q&A session at
the end. If you have a question during the presentation, please
type it in the questions window in the control panel to the right.
Toll: +1 (951) 266-6126
Access Code: 520-707-895
Audio PIN: Shown after joining the Webinar
Thanks For Joining

Introduction to Benchmarking: Starting a
Benchmarking Plan
Technical Assistance Program
February 21st, 2013
3
Agenda
1. Welcome & overview
2. The benefits of benchmarking and creating a benchmarking plan
3. Resources for creating a benchmarking plan
4. Hillsboro, Oregon’s benchmarking program
5. New opportunities available for technical assistance
6. Question & answers
3

4
What is the Technical Assistance Program?
• DOE’s Technical Assistance Program (TAP) provides state,
local, and tribal officials with resources to advance
successful, high-impact, and long-lasting clean energy
policies, programs, and projects
• TAP supports one of EERE’s key missions – taking clean
energy to scale through high impact efforts
• TAP has been around for over a decade and handled
thousands of inquiries – most recently TAP had been focused
on supporting Recovery Act grantees
– One-on-one assistance
– Online resource library & webinars
– Facilitation of peer exchange
5
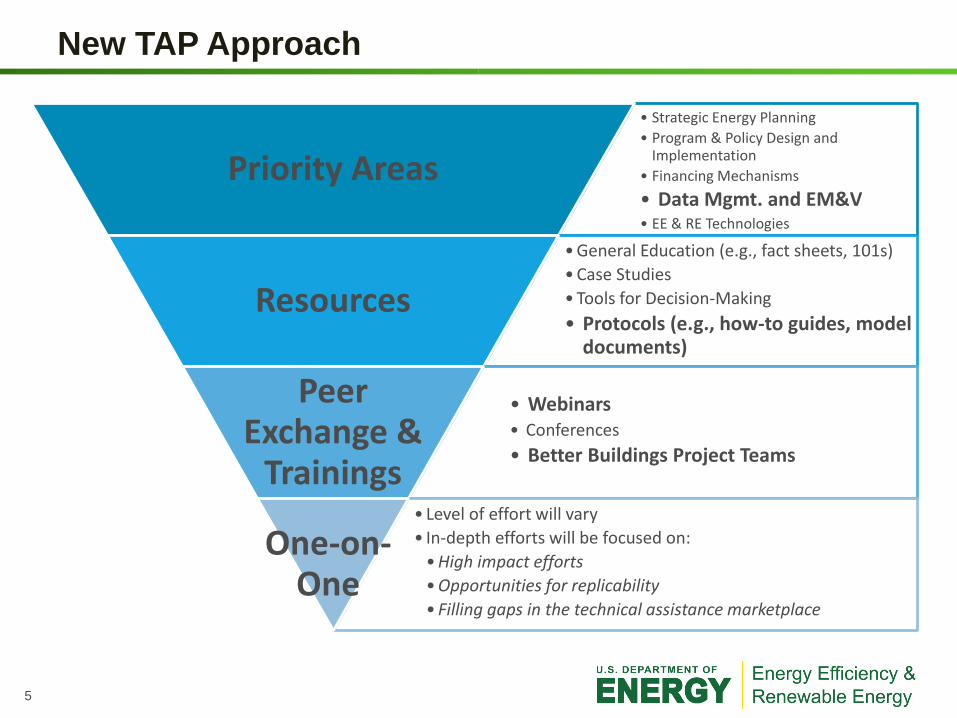
New TAP Approach
• Strategic Energy Planning
• Program & Policy Design and Implementation
• Financing Mechanisms
• Data Mgmt. and EM&V • EE & RE Technologies
Priority Areas
• General Education (e.g., fact sheets, 101s)
• Case Studies
• Tools for Decision-Making
• Protocols (e.g., how-to guides, model documents)
Resources
• Webinars • Conferences
• Better Buildings Project Teams
Peer Exchange &
Trainings • Level of effort will vary
• In-depth efforts will be focused on:
• High impact efforts
• Opportunities for replicability
• Filling gaps in the technical assistance marketplace
One-on-One

6
Data Management and EM&V as a Priority Area
• Resources: – Designing a Benchmarking Plan live now on the Solution Center!
– Also rolling out a Data Management and Evaluation portal on the Solution Center in May
• Peer Exchange & Trainings: – One-time national peer exchange – join us for follow up session,
Planning for Energy Benchmarking, next Wednesday
– Long-term small group peer exchange – join the Better Buildings Alliance Project Team for Data Management Approaches, kicking off on Wednesday, March 20th
– National webinar trainings, including – Benchmarking Outreach and Data Collection Techniques (Internal), Benchmarking Outreach and Data Collection Techniques (External, March and April
• One-on-one Assistance
7
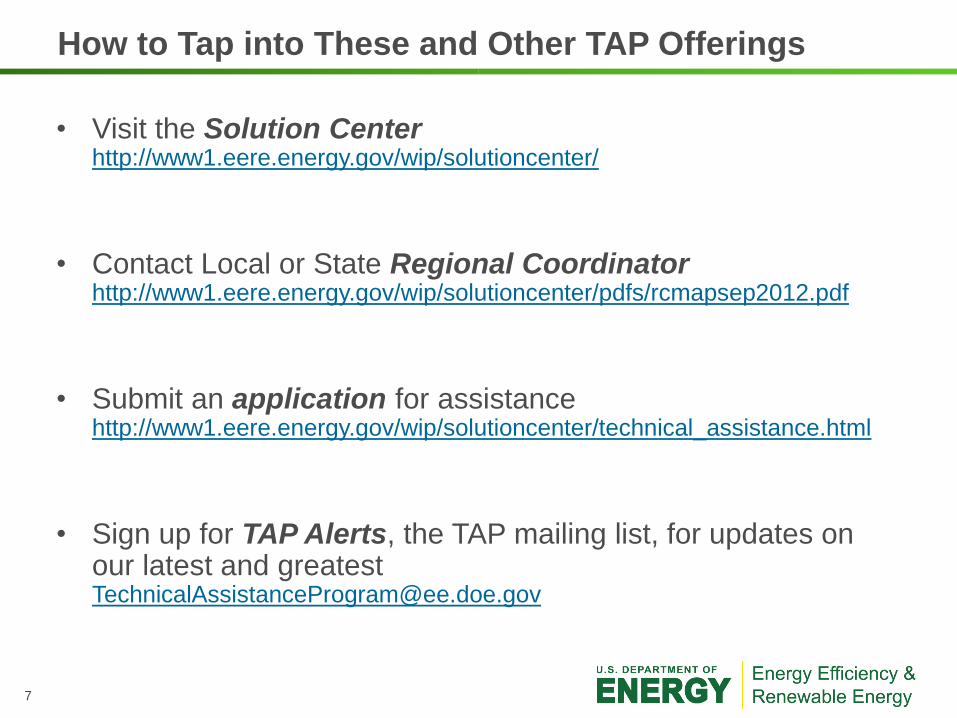
• Visit the Solution Center http://www1.eere.energy.gov/wip/solutioncenter/
• Contact Local or State Regional Coordinator http://www1.eere.energy.gov/wip/solutioncenter/pdfs/rcmapsep2012.pdf
• Submit an application for assistance http://www1.eere.energy.gov/wip/solutioncenter/technical_assistance.html
• Sign up for TAP Alerts, the TAP mailing list, for updates on our latest and greatest [email protected]
How to Tap into These and Other TAP Offerings
8
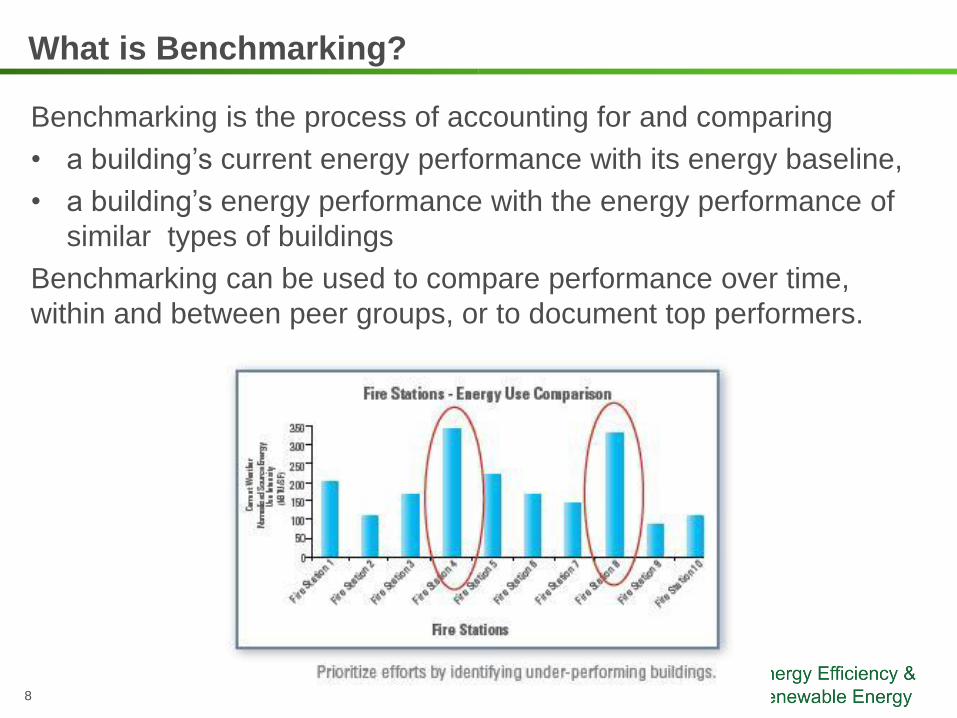
What is Benchmarking?
Benchmarking is the process of accounting for and comparing
• a building’s current energy performance with its energy baseline,
• a building’s energy performance with the energy performance of
similar types of buildings
Benchmarking can be used to compare performance over time,
within and between peer groups, or to document top performers.

9
• Proactive approach to managing energy use
• Continuous improvement as a part of a strategic energy
management plan
• Identify billing errors
• Verify pre- and post-project energy use, GHG emissions, and
energy costs
• Communicating results in meaningful terms
• Assess effectiveness of current operations, policies and practices
• Assist in planning: set goals, targets, and timelines
• Participation in energy challenges or benchmarking programs
The Benefits of Benchmarking
10
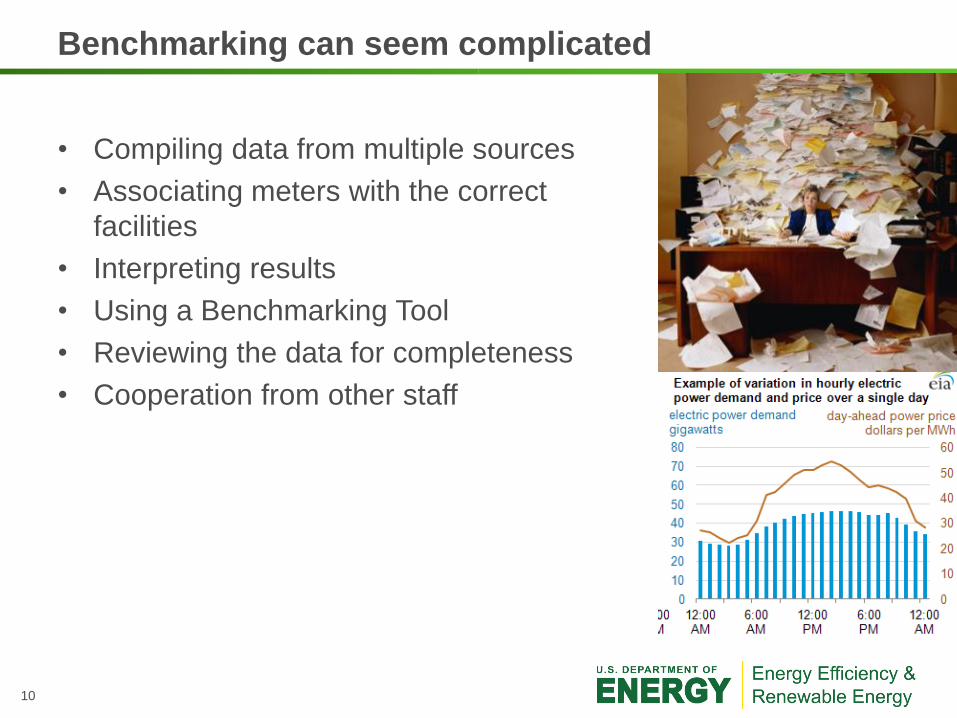
• Compiling data from multiple sources
• Associating meters with the correct
facilities
• Interpreting results
• Using a Benchmarking Tool
• Reviewing the data for completeness
• Cooperation from other staff
Benchmarking can seem complicated
11
Being thoughtful about Benchmarking
• Creating a benchmarking plan allows for
a strategic approach to the
benchmarking process
• Avoid pitfalls of the piecemeal process
(lack of data needed for the tool or for
the results), stalled out cooperation,
inability to benchmark against others
• Speak the language of those interested
• Allow for room to grow capabilities

12
• Establish the Goal for Benchmarking
• Secure Buy-in from Leadership
• Build a Benchmarking Team
• Identify the Output Metrics Needed to Support the
Benchmarking Goal
• Identifying the Data Input Requirements
• Select a Benchmarking Tool
• Determine a Collection Method
• Consider the Data Verification Process
• Evaluate Analysis Techniques
• Communicate the Plan and Formalize the Process
• Planning for Change
Resource Guide Layout

13
• Framework for planning a benchmarking
program
• Follows a progression of steps to set up a
benchmarking program
• Organizations can work through
chronologically or select the appropriate
sections
• Embedded with tips and resources
appropriate to each section
• Particularly useful for organizations using
Portfolio Manager,
Using the Resource Guide

14
Establish the Goal
• Energy Management Strategy
• Demonstrating the results from energy efficiency projects
and programs
• Participation in a benchmarking program

15
Secure Buy-in from Leadership
• A critical element of success is the involvement of top management. – Secure buy in from top management for initial
endorsement
– Ensure top management is a part of regular review and communication
• Present the case for benchmarking to demonstrate the value
– Provide list of benefits that benchmarking offers
– Present significance of energy costs to demonstrate need for energy data management
Energy expenditures average more than $2 per square foot in commercial and government buildings, making energy a cost worth managing. By making energy performance measurable and visible, building owners can improve the efficiency of their buildings, which can drive new investment and create an estimated 5 to 15 green jobs per $1 million invested.

16
Making the Case for Benchmarking

17
Build a Benchmarking Team
• Establish the Benchmarking Program
Coordinator/Project Manager
• One or more person may be required
• Clearly define the role of the Program
Coordinator
• Identify key personnel in the organization to
implement the benchmarking plan
• Involve personnel with familiarity to the energy
data and whose work will be affected by the
benchmarking program. Good candidates
include:
• Maintenance
• Operations
• Purchasing
• Human Resources
• Environmental, Health and Safety
• IT

18
Collecting and tracking benchmarking data can be a substantial
effort. When appropriate:
• Look for “pro bono” help with analysis from local stakeholders
(e.g., interns or college/university expertise, non-profits, and
local weatherization agencies).
• Use this part of the project as a professional development
opportunity for a local government’s financial analysts or
junior engineers.
• Hire consultants such as energy service companies (ESCOs)
or third-party providers.
• Incorporate benchmarking into energy efficiency projects and
contracts. Some ESCOs will offer free benchmarking as a
way of developing business opportunities.
Tips for Building a Benchmarking Team

19
Identify the Output Metrics Needed
Metric Application
Btu per square foot Any building
Btu per employee Office building
Btu per unit of product Assembly plant
Btu per pound of product Manufacturer
Btu per pound of product processed Refinery
Btu per number of beds occupied Hotel or hospital
Kilowatt-hours per square foot Lighting
Kilowatts per ton Chilled water efficiency
Watts per cubic foot of airflow per minute HVAC systems
Courtesy: E Source
• The benchmarking goals determine the benchmarking metric. • Determine the granularity and frequency of the output metrics required. Select a level
of detail and frequency that is achievable that contains enough resolution for meaningful analysis. The output metrics should be appropriate for the audiences to whom the results are communicated.
• What is it that will demonstrate progress or success?
Some common Energy Use Intensities (EUI’s) are shown below:

20
Identifying the Data Input Requirements
• Identify the data inputs needed to generate the output metrics required – Account for data inputs required by the benchmarking tool.
• (see the Portfolio Manager Data Collection Worksheet for data requirement examples)
– Account for all energy sources — (kWh, mMBtu, Mcf, lbs of steam, etc.).
– Map out data availability and data access
– Incorporate facility characteristics
• Select data inputs that will assist in analyzing energy use for decision making, even if not required to produce the outputs deemed important. Consider including: – Operating characteristics – document the characteristics that can affect the
energy use in a building.
– Production units – document the production rate of facilities to compare with energy or environmental metrics.
– Cost – financial metrics are rarely excluded from the decision making process.
– Energy project milestones – Verifying pre and post savings from energy efficiency projects requires an understanding of project timelines.

21
General Building Information
• Facility name
• Year built
• Building address (ZIPCODE!)
Space Use Attributes (General Office)
• Gross floor area (SF)
• Weekly operating hours
• # of workers on main shift
• # of personal computers
• Percent of floor area that is air conditioned(>=50%, <50%, or none)
• Percent of floor area that is heated (>=50%, <50%, or none)
http://www.energystar.gov/index.cfm?c=evaluate_performance.bus_portfoliomanager_benchmarking
Sample Data inputs – General Office

22
Select a Benchmarking Tool
• Benchmarking tools range from simple spreadsheets to custom designed web-based platforms.
• Demonstrating progress towards the Benchmarking goal should dictate selection
• Compare functionality of tools: – Outputs generated
– Data inputs and frequency required
– Data entry methods
– Data display capabilities
– Cost
– Usability and Support
– Compatibility

23
• Free, online, benchmarking tool for existing buildings
• Whole-building ACTUAL Energy Performance Score and
benchmarking data
• Measures and Tracks energy intensity, cost, emissions
• Normalizes for weather, operating hours, occupant density,
plug load
• Provides ENERGY STAR Label for Buildings
Check it out:
Energystar.gov/benchmark
ENERGY STAR’s Portfolio Manager

24
Determine a Data Collection Method
• Select a collection method that addresses how the data is
currently managed.
• Data can be collected and aggregated in several ways.
Common techniques:
Portfolio Manager strategies for data collection
Approach Concept Relevant tools
Centralized Create a central account to host all
organization benchmarking data.
Department/facility data is shared with the
benchmarking coordinator/team for input
Use the Portfolio Manager Data Collection
Worksheet, Portfolio Manager Import Templates,
or Portfolio Manager Multi-meter update to
collect data from departments for manual upload
of uploading by ENERGY STAR Decentralized Create a central account to host all
organization benchmarking data. Create
separate accounts for department or
facility managers to benchmark their
subset of buildings. Use the sharing
function in the tool to transfer
benchmarking data to the central account
Provide department benchmarking staff with
Facility sharing instructions. Benchmarking staff
may also find the Portfolio Manager Data
Collection Worksheet, Portfolio Manager Import
Templates, or Portfolio Manager Multi-meter
update useful in their own data entry process

25
Consider the Data Verification Process
• Establish Quality Assurance/Quality Control (QA/QC) plan
• Consider : – Range checking for high or low EUI values
– Comparing the reported footprint with building inventory lists or real property data
– Checking that the appropriate facility type is selected for facilities
– Ensure realistic footprints and names (no gross rounding or ‘sample facilities’)
– Use ‘Alerts in Portfolio Manager’ or flag 1 and 100’s
– Sample utility bills
– 3rd party verification
– Protocol of gaps in data
• Use the verification process to promote accurate and transparent reporting.
• Training staff can often be one of the best forms of ensuring quality reporting from the ground up.
26
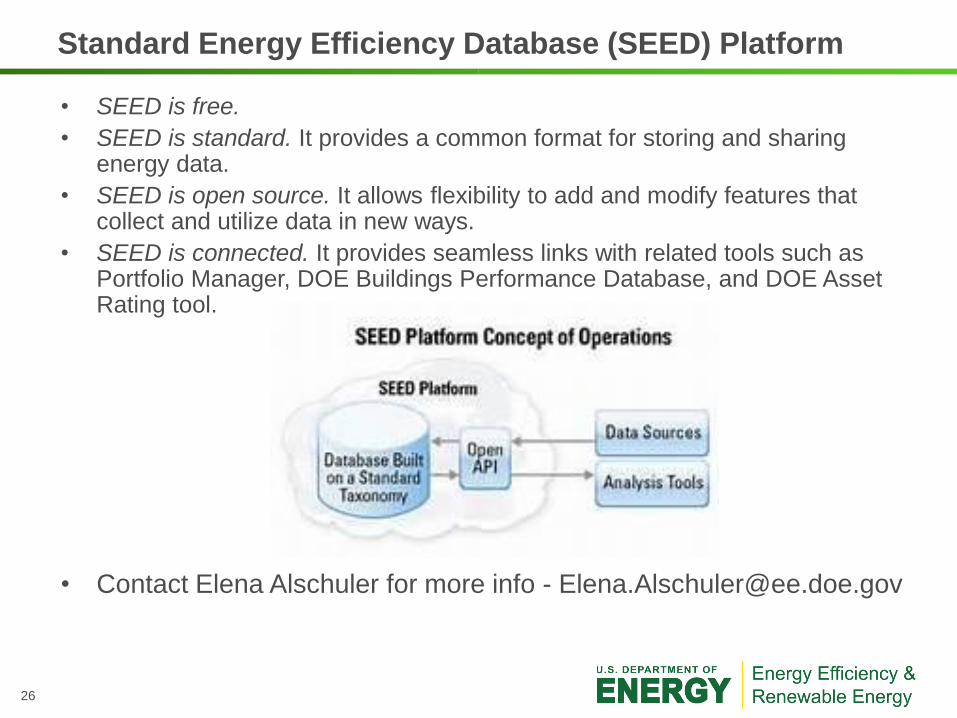
• SEED is free.
• SEED is standard. It provides a common format for storing and sharing energy data.
• SEED is open source. It allows flexibility to add and modify features that collect and utilize data in new ways.
• SEED is connected. It provides seamless links with related tools such as Portfolio Manager, DOE Buildings Performance Database, and DOE Asset Rating tool.
• Contact Elena Alschuler for more info - [email protected]
Standard Energy Efficiency Database (SEED) Platform
27
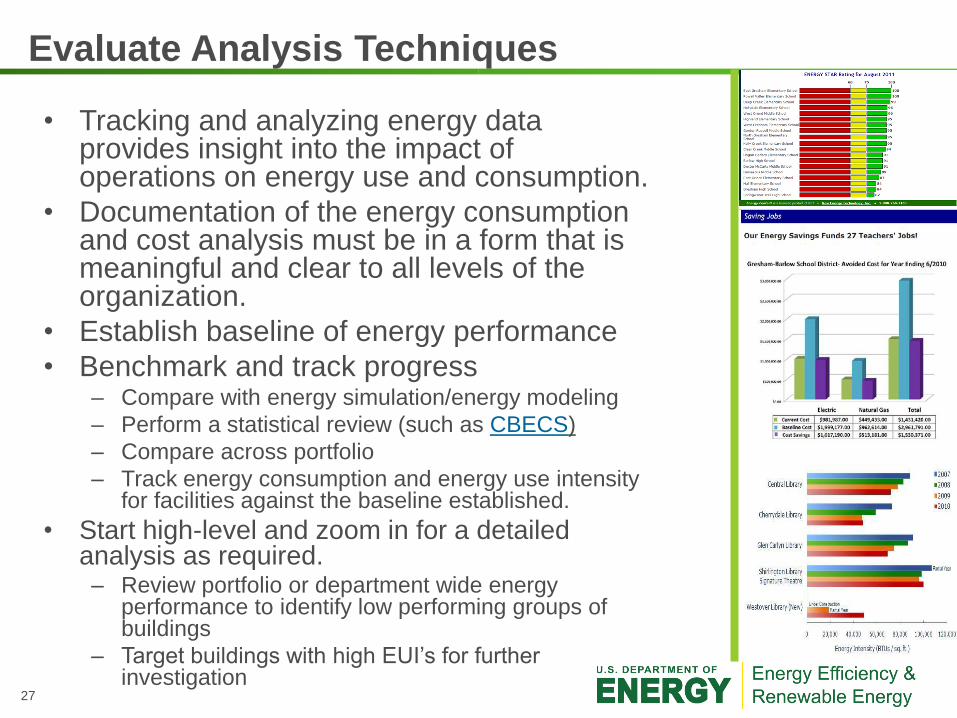
Evaluate Analysis Techniques
• Tracking and analyzing energy data provides insight into the impact of operations on energy use and consumption.
• Documentation of the energy consumption and cost analysis must be in a form that is meaningful and clear to all levels of the organization.
• Establish baseline of energy performance
• Benchmark and track progress – Compare with energy simulation/energy modeling
– Perform a statistical review (such as CBECS)
– Compare across portfolio
– Track energy consumption and energy use intensity for facilities against the baseline established.
• Start high-level and zoom in for a detailed analysis as required. – Review portfolio or department wide energy
performance to identify low performing groups of buildings
– Target buildings with high EUI’s for further investigation
28
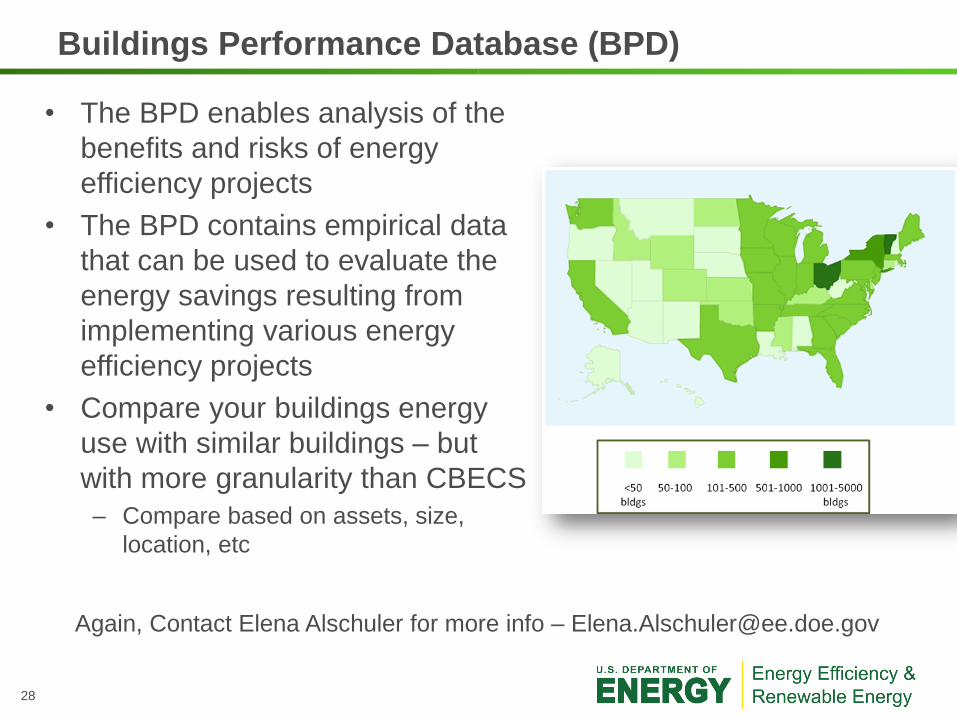
• The BPD enables analysis of the
benefits and risks of energy
efficiency projects
• The BPD contains empirical data
that can be used to evaluate the
energy savings resulting from
implementing various energy
efficiency projects
• Compare your buildings energy
use with similar buildings – but
with more granularity than CBECS
– Compare based on assets, size,
location, etc
Buildings Performance Database (BPD)
Again, Contact Elena Alschuler for more info – [email protected]

29
Communicate the plan and formalize the process
• Developing a formal process and communicating the plan can be an
important aspect of the benchmarking program.
• Demonstrate stability by highlighting top management support
• Present the value of benchmarking beyond just another exercise
• Clearly identify roles and goals to ensure transparency and outline
expectations
• Empower participants
•Provide training for benchmarking tool
•Incorporate into existing operations
• Include involved 3rd party organizations
• Utility account representatives – to assist with data access
• Vendors – to include energy project timelines and existing data

30
• Set timelines for deliverables • Nothing motivates like a deadline
• Clear expectations with opportunity for input ensure timely completion
and reduce stall outs
• Schedule check-ins and share results regularly
• Build momentum
• Assess status
• Add accountability
• Solicit feedback
Communicate the plan and formalize the process (cont.)

31
• Set schedule for regular re-appraisal of benchmark portfolio with respect to strategic plan objectives
• Check in with stakeholders
• Re-evaluate other tools and service providers newly on the market or revamped that may enhance your benchmarking activities.
• Revisit spending/funding needed to continue benchmarking program.
• Evaluate current capabilities and any additional training or staffing needed (could include temporary help such as interns for data entry)
• Identify what is not included in the plan and what changes/modifications could happen by the next update
• Publish revised benchmarking plan
Planning for Change

Energy Benchmarking
EERE Webinar February 21, 2013
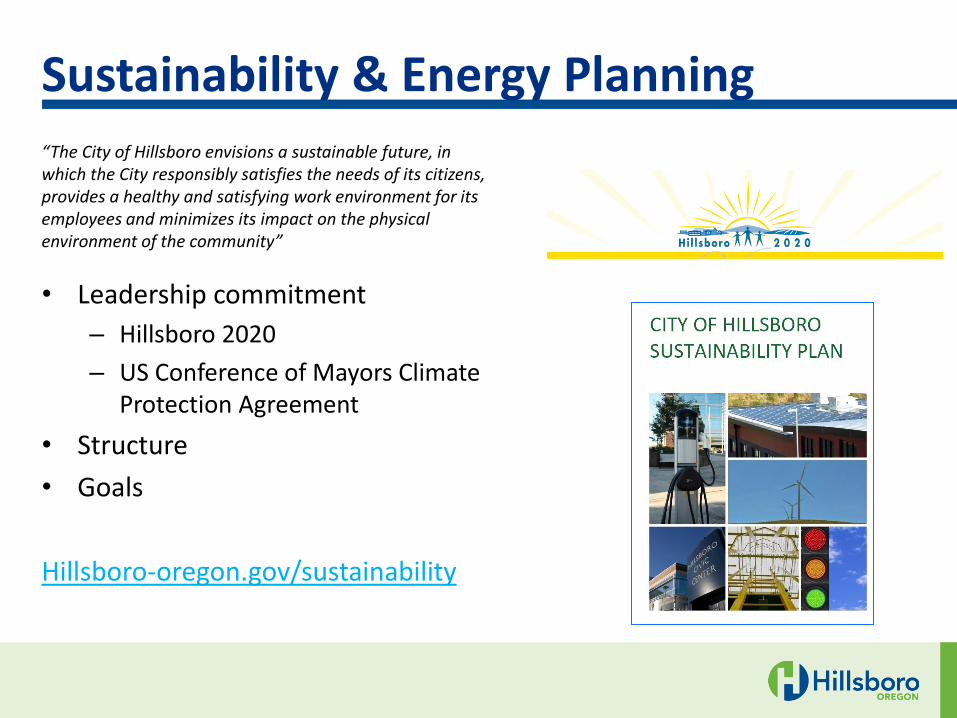
Sustainability & Energy Planning
“The City of Hillsboro envisions a sustainable future, in which the City responsibly satisfies the needs of its citizens, provides a healthy and satisfying work environment for its employees and minimizes its impact on the physical environment of the community”
• Leadership commitment
– Hillsboro 2020
– US Conference of Mayors Climate Protection Agreement
• Structure
• Goals
Hillsboro-oregon.gov/sustainability

Energy Goals
Policy:
• 100% of City development investments meet a standard
set for sustainable development, and City promotes and
encourages sustainable development by others
• 100% of applicable City policies incorporate the
principles of sustainability
• All city facilities constructed or renovated shall meet
current Leadership in Energy and Environmental Design
(LEED) standards or better, unless cost prohibitive based
on Return on Investment (ROI) or cost/benefit analysis
Energy and air quality:
• 60% reduced City facility energy consumption per
square foot (2007 baseline)
• 100% of electricity and natural gas sourced from
renewable sources for City facilities and exterior
lighting infrastructure
• 80% reduction in greenhouse gas emissions; 100%
of remaining emissions offset (2007 baseline)
• 80% production of energy for City facilities from
renewable energy sources
• 100% fossil fuel-free staff vehicles and 40%
reduction for other exempt vehicles (non-passenger
emergency response, etc.) [Based on available
technologies and cost effectiveness] (2007 baseline)
• All City facilities zero net energy consumption, if
feasible based on Return on Investment (ROI) or
cost/benefit analysis
Materials management:
• Achieve a rate of construction material consumption that
meets internal standards for sustainability
• 100% of all inputs purchased by the City are sourced
from sustainable sources or meet internally established
criteria (e.g., zero waste, zero toxins) where
technologically and financially feasible
• Zero toxic emissions
• 100% recycling of waste from City operations
• Zero construction and maintenance waste (no waste
from construction and maintenance activities is sent to
landfill). May be accomplished via public/private
partnerships
Natural Resources:
• 25% reduction in water consumption by City
facilities against established baseline (including re-
use and other measures) (2007 baseline)

Energy Goal +
2011 Better Buildings Challenge
• 20% reduced energy intensity by 2020 (2009
baseline)
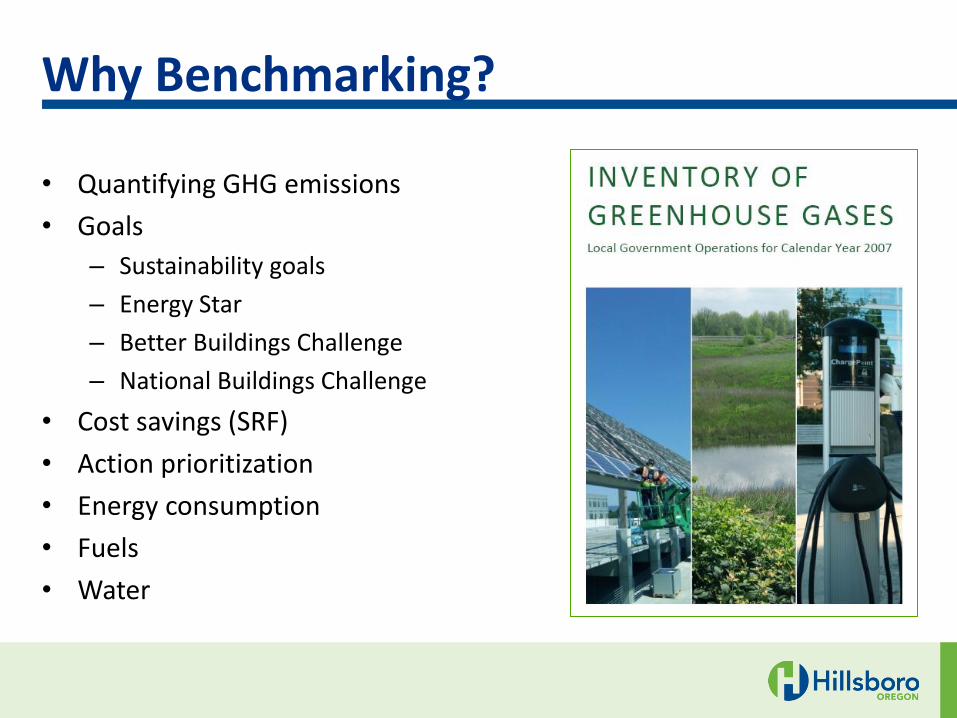
Why Benchmarking?
• Quantifying GHG emissions
• Goals
– Sustainability goals
– Energy Star
– Better Buildings Challenge
– National Buildings Challenge
• Cost savings (SRF)
• Action prioritization
• Energy consumption
• Fuels
• Water

Selecting Baselines and Metrics
• Energy consumption/ Sq ft
• Energy intensity
• % renewable energy from renewables
• % of facility energy generated by renewables
• % fossil fuel free staff vehicles
• Tons GHG emissions
• % facilities meeting green
building standard
2,186
1,035 N/A 23
10,430
375 254
1,538
14,000
7,617
0
2,000
4,000
6,000
8,000
10,000
12,000
14,000
MT
CO
2e
Scope 1 Scope 2 Scope 3

Selecting Tools & Processes
• Portfolio Manager
– Tracking
– Reporting (internal and external)
– Prioritization
– Performance measurement
• Staff Roles
• How data was/is collected
• How data is verified

Selecting Tools & Processes
• Utility Trac Plus
• New building controls
• Energy Management
Plan
– Enhanced process
– Regular reporting
– Roles/responsibilities
– Education
– Communication

Thank You
“The City of Hillsboro envisions a sustainable future, in which the City responsibly satisfies the needs of its citizens, provides a healthy and satisfying work environment for its employees and minimizes its impact on the physical environment of the community”
hillsboro-oregon.gov/sustainability

Better Buildings Alliance
Opportunity for governments to work collaboratively with DOE to advance their clean energy goals
Helps members sustain success of ARRA funded work
Leverages DOE expertise
Provides forum to engage with peers around actionable steps
Public sector Project Teams focus on strategic target areas:
– Community Strategic Energy planning
– Data Management Approaches
– Finance Strategies
– Energy Savings Performance Contracts (ESPC)
– Technical areas (lighting, HVAC, plug loads, data centers, etc.)
41

Alliance Members Agree to:
Commit
– Assign a representative
– Share energy savings goals, encouraged to be
an annual goal of >2%
Act
– Work to achieve goals and monitor progress
– Participate in at least one BBA workgroup or
activity
Share
– Provide annual updates on energy savings and
progress toward meeting goals
– Share your successes and help other members
replicate your results
42
DOE Agrees To: Assist
– Provide information and resources to help
members meet energy goals
– Work with members to create new resources and
tools
Connect
– Provide a neutral, third-party platform for peers to
build solutions
– Connect members with financial allies for financing
solutions
Inform
– Keep members informed through regular BBA
communications and webinar series
– Provide access to DOE and trusted third-party
resources
43

Data Management Approaches Project Team
Will equip members with knowledge, tools, peer-
exchange, and feedback to develop data
management practices
Leverage existing data management materials
Sessions held via facilitated webinar
Participants will execute data management
practices in real time as they are discussed in WG
sessions
Insights participants gain through process will be
shared with peers during Project Team meetings
Sessions starting in March
44

http://www1.eere.energy.gov/buildings/betterbuildings/bba/bba-index.html
45

46
Questions about the Better Buildings Alliance?
For more information on the Better Buildings Alliance,
please send questions to
46

47
If you have questions or comments, let us know what you think
Type questions in the Question box in the control box on the right
Question and Answer Time

48
Slides will be posted on the Solution Center
http://www1.eere.energy.gov/wip/solutioncenter/
The “Designing a Benchmarking Plan” resource guide will be
posted online:
http://www1.eere.energy.gov/wip/solutioncenter/pdfs/tap_designi
ng_a_benchmarking_plan.pdf
More questions? Contact Joel Blaine – [email protected]
Thank you for participating