Thames Water Reporting Criteria Annual Performance Report ...
49
1 31 March 2021. Version 1.0 Thames Water Reporting Criteria Annual Performance Report 2020-21 31 March 2021 Version 1.0
Transcript of Thames Water Reporting Criteria Annual Performance Report ...

1
31 March 2021. Version 1.0
Thames Water
Reporting Criteria
Annual Performance Report
2020-21
31 March 2021
Version 1.0

Thames Water Reporting Criteria
Annual performance report 2020-21
2
31 March 2021. Version 1.0
Thames Water Reporting Criteria
The following Reporting Criteria are used for Selected Information within the Thames Water
Annual Performance Report 2020-21. The Selected Information comprises the following:
• 3A: Water and Retail performance commitments – column ‘4: Performance level – actual
current reporting year’ and column ‘5: PCL met’
• 3B: Wastewater performance commitments – column ‘4: Performance level – actual
current reporting year’ and column ‘5 – PCL – met’
• 3C: Customer measure of experience (C-Mex) – Line: ‘3C.3: Annual C-Mex Score’
• 3D: Developer services measure of experience (D-Mex) – Line: ‘3D.3: D-Mex score’
• 3E: Non-financial performance commitments – column ‘4: Performance level – actual
current reporting year’ and column ‘5: PCL met’
The Reporting Criteria identifies notifications to Ofwat as a permitted way of disclosing Thames
Water's interpretation of the PR19 Final Determination as well as any deviations from other
regulatory guidance documents.
Thames Water Reporting Criteria
Annual performance report 2020-21
3
31 March 2021. Version 1.0
Contents
Section 3A: Water and Retail Performance Commitments ........................................................ 5
BW06a: Water quality compliance ....................................................................................... 5
BW03: Water supply interruptions ....................................................................................... 6
BW04: Leakage .................................................................................................................. 6
BW05: Per capita consumption ........................................................................................... 8
BW01: Mains repairs ........................................................................................................ 10
BW02: Unplanned outage ................................................................................................. 10
BW07: Properties at risk of receiving low pressure ............................................................. 11
BW08: Acceptability of water to consumers ....................................................................... 12
BW09: Water quality events .............................................................................................. 13
BW10: Reducing risk of lead ............................................................................................. 14
DW02: Security of supply index SoSI ................................................................................. 15
DWS01: Power resilience .................................................................................................. 17
DWS02: SEMD - Securing our sites (2020-25 projects) ..................................................... 17
DWS03: SEMD - Securing our sites (legacy projects) ........................................................ 17
ER01: Unregistered household properties ......................................................................... 18
ER02: Empty household properties (‘void properties’) ........................................................ 18
EW01: Abstraction incentive mechanism (AIM) .................................................................. 19
EWS08: Empty business properties ................................................................................... 20
M01: Installing new smart meters in London ...................................................................... 21
M02: Replacing existing meters with smart meters in London ............................................. 22
Section 3B: Wastewater Performance Commitments ............................................................. 23
CS03: Internal sewer flooding ........................................................................................... 23
ES01: Pollution Incidents .................................................................................................. 24
CS02: Sewer Collapses .................................................................................................... 24
CS01: Treatment work compliance ................................................................................... 25
CS04: Clearance of blockages .......................................................................................... 26
CS05: Sewage pumping station availability ........................................................................ 27
DS02: Surface water management .................................................................................... 28
ES02: Environmental measures delivered .......................................................................... 28
ES03: Sludge treated before disposal ................................................................................ 30
ET01: Readiness to receive tunnel flow at Beckton STW .................................................... 30
ET04: Critical asset readiness for the London Tideway Tunnels (LTT) ................................. 31
EWS01: Enhancing biodiversity ......................................................................................... 32

Thames Water Reporting Criteria
Annual performance report 2020-21
4
31 March 2021. Version 1.0
EWS02: Smarter water catchment initiatives ...................................................................... 33
EWS03: Renewable energy produced ............................................................................... 33
ET07: Managing early handback of Tideway project land ................................................... 34
Section 3C: Customer Measure of Experience (C-MeX) ........................................................ 35
AR01: C-MeX ................................................................................................................... 35
Section 3D: Developer Measure of Experience (D-MeX) ........................................................ 37
AWS01: D-MeX ................................................................................................................ 37
Section 3E: Non-financial Performance Commitments ........................................................... 38
DW01: Risk of severe restrictions in a drought ................................................................... 38
AR06: Priority services for customers in vulnerable circumstances ..................................... 39
DS01: Risk of sewer flooding in a storm ............................................................................. 41
AR05: Percentage of satisfied vulnerable customers .......................................................... 41
AWS02: Proactive customer engagement ......................................................................... 42
BW11: Responding to major trunk mains bursts ................................................................. 42
ER03: Households on the Thames Water social tariff .......................................................... 43
ET02: Effective stakeholder engagement ........................................................................... 43
ET05: Establish an effective system operator for the London Tideway Tunnels .................... 44
ET06: Maximising the value of Tideway project land sales .................................................. 45
EWS04: Natural Capital Accounting .................................................................................. 46
AR07: BSI standard for fair, flexible and inclusive services ................................................. 46
NEP01: Delivery of water industry national environment programme requirements .............. 47
DWMP: Drainage and wastewater management plans (DWMPs) ........................................ 47
CC: Understanding the risk of flooding and level of resilience within the Counters Creek
catchment ........................................................................................................................ 48

Thames Water Reporting Criteria
Annual performance report 2020-21
5
31 March 2021. Version 1.0
Section 3A: Water and Retail Performance Commitments
The following Reporting Criteria are used for water and retail performance commitments.
Performance commitment BW06a: Water quality compliance
Unit of measure Numerical CRI score, reported to two decimal places
Boundaries There are no specific exclusions, however, there are some
special rules on calculation of the impact score defined within
the DWI procedure.
Reporting criteria
This measure is the water quality measure for water quality compliance. The measure is
expressed as a numerical compliance risk index (CRI) score and is based on the calendar
year (1 January 2020 - 31 December 2020).
The definition for this performance commitment is set by the Drinking Water Inspectorate
(DWI) in collaboration with the industry as per the following guidance:
https://www.ofwat.gov.uk/publication/dwi-compliance-risk-index-cri-definition/
A CRI score is calculated for every individual compliance failure within all water supply zones,
authorised supply points, treatment works and service reservoirs. The annual CRI for the
company, for the calendar year, is the sum of the individual CRI scores for every compliance
failure reported during that year.
The calculation for each individual compliance failure is as follows:
i. Water supply zones: CRI = (Parameter Score * Assessment Score * Population
affected) / Total company population served
ii. Supply Points and treatment works: CRI = (Parameter Score * Assessment Score *
volume supplied (m3/day)) / Total daily volume supplied by the company (m3/day)
iii. Service reservoirs: CRI = (Parameter Score * Assessment Score * reservoir capacity
(m3)) / Total service reservoir capacity of the company (m3)
• A water supply zone is defined as the defined as the largest area of a water company’s
supply system where all customers have the same supply risk.
- A supply point is defined as an individual point of service on the customer premises (i.e.
a customer tap).
• A treatment works is defined as a site or plant whereby processes and technologies
used to remove contaminants from water are carried out.
• A service reservoir is defined as a place or structure where water from a water treatment
works is stored for delivery to other service reservoirs for distribution to the consumers of
a water supply district
• The parameter score is based on different criteria reflective of the nature of the
parameter. This can include human health concerns, aesthetic concerns or regulatory
impact concerns
• The assessment score is based on an assessment by the DWI of how well the wellbeing
and interests of consumers were protected by best practice in management of
compliance failures.
The list of scores associated with the parameters and assessment criteria are defined within
the DWI guidance.

Thames Water Reporting Criteria
Annual performance report 2020-21
6
31 March 2021. Version 1.0
Performance commitment BW03: Water supply interruptions
Unit of measure Hours:minutes:seconds (HH:MM:SS) per property per year,
reported to zero decimal places.
Boundaries The performance measure only accounts for interruptions
greater than or equal to 3 hours in duration. Any interruptions
less than 3 hours are excluded from the measure.
Interruptions as a result of planned (e.g. planned
maintenance) and unplanned interruptions (e.g. an asset
failure) are included in the performance results.
Reporting criteria
This measure relates to the average number of minutes lost per customer for the whole
customer base for water supply interruptions that lasted three hours or more in the financial
year (1 April 2020 - 31 March 2021). The metric is calculated as follows:
(Total number of properties with interrupted supply > or = to 3 hours x the full duration of the
interruption in minutes) / Total number of properties supplied with water at 31 March 2021.
An interruption is defined as when a customer is without a continuous supply of water and the
supply has been interrupted for greater than 3 hours.
• A property is defined as one which is connected to the company's water distribution
system.
• The duration of an interruption is defined as the amount of time which passes between
the start time and stop time of an event.
• The start time is defined as when water is lost from the first cold water tap at a property.
• The stop time is defined as when the company is satisfied that water has been fully
restored to an acceptable pressure to the affected property(ies) and water is restored to
the first cold water tap at a property.
Performance commitment BW04: Leakage
Unit of measure Percentage reduction from 2019-20 baseline, reported to one
decimal place.
The volumetric levels resulting from the application of the
percentage reduction in megalitres per day (Ml/d) reported to
one decimal place.
Boundaries Leakage includes any uncontrolled losses between Thames
Water’s treatment works and the customer’s stop tap. This
includes trunk mains, service reservoirs, flow monitoring
zones and customer supply pipes.
It does not include internal plumbing losses.
The annual average leakage level is calculated by Thames
Water in line with the final reporting guidance for PR19 –
Leakage, published on 27 March 2018, with exception of the
following aspects of the guidance:
1. Household night use:

Thames Water Reporting Criteria
Annual performance report 2020-21
7
31 March 2021. Version 1.0
5d – Evidence that survey is representative (based on
demography, property type or other factors) of the company
as a whole.
5e – Sample size is sufficient to capture continuous and
intermittent night use with reasonable confidence
5f – Continual monitoring and maintenance of individual
household monitors (IHM) and small area monitors (SAMs)
For the reporting year 2020/21, Thames Water used the
historic night use allowances calculated from the Domestic
Water Use Study (DWUS) and TestDWUS which do not
satisfy the above requirement.
Reporting criteria
This measure is the percentage reduction of three-year average leakage in megalitres per
day (Ml/d) from the 2019/20 baseline. It is reported to one decimal place.
Percentage reduction (for the report year) = ((2019/20 baseline – Three-year average
Leakage (for the report year)/ 2019/20 baseline)) * 100
Three-year average Leakage (for the report year) is calculated from annual average values
for the reporting year and two preceding years and expressed in Ml/d.
2019/20 baseline is calculated as the mean of the annual average leakage for 2019/20,
2018/19 and 2017/18 and expressed in Ml/d.
Where this calculation results in a positive value, it corresponds to the outperformance of
leakage in Ml/d. Where this calculation results in a negative value it corresponds to the
underperformance of leakage in Ml/d.
Annual average leakage is defined as the sum of distribution system leakage, including
customer supply pipe leakage, plus service reservoir losses and trunk mains leakage.
Distribution system leakage is calculated by establishing the baseline leakage through
minimum nightlines. Minimum nightlines are measured at the flow monitoring zone level as a
minimum flow during the fixed hour period (3am to 4am). Any residual flow after legitimate
night use is assumed to be leakage.
Legitimate night use is an estimate of genuine use of water during the night-time.
Components of night use include the night use of measured and unmeasured households,
commercial measured, unmeasured and assessed non-household night use and operational
night use such as that of sewage treatment works. It also includes allowances for wastage
occurring at void properties and night use of occupied void properties.
Due to pressure variations during the day and the sensitivity of leakage to pressure, night-
time leakage (nightlines - legitimate night use) needs adjustment to arrive at a daily average
leakage flow. This adjustment deals with the effect of pressure variations and is known as the
T-Factor. The T-Factor is calculated as average daily pressure divided by night pressure and
multiplied by 24 hours. The T-factor is calculated on flow monitoring zone levels using the
average pressure from all pressure loggers located within the zone. Night pressure is
calculated as average for the period of 3am to 4am; day pressure - average for the whole 24-
hour period.

Thames Water Reporting Criteria
Annual performance report 2020-21
8
31 March 2021. Version 1.0
A water resources zone is defined as the largest area of a water company’s supply system
where all customers have the same supply risk. Trunk mains are defined as the length of
mains between from the start of the distribution system and the flow monitoring zones.
Transfer mains leakage is estimated based on the length of main, multiplied by the assessed
leakage rate per kilometre of main.
Reservoir leakage is calculated based on reservoir drop tests. For reservoirs where drop
tests are not available the capacity and reservoir type are used to estimate leakage. Reservoir
type is made up of three categories, brick, concrete and other. Leakage for each reservoir is
calculated by the capacity-leakage relationship for each reservoir type and then summed to
give total reservoir leakage.
Leakage is reported as a post-Maximum Likelihood Estimation (MLE) weighted average
Ml/day over the year. The MLE technique is used to distribute the volume of any
unaccounted-for water in the water balance calculation. Unaccounted for water occurs when
the distribution input and the sum of the components of the water balance do not reconcile.
To reconcile the water balance, the MLE method is used to distribute the unaccounted-for
water according to the uncertainty in the components of the water balance.
The total level of leakage is defined in the final reporting guidance for PR19 – Leakage,
published on 27 March 2018: https://www.ofwat.gov.uk/publication/reportingguidance-
leakage/
Performance commitment BW05: Per capita consumption
Unit of measure Percentage reduction from 2019-20 baseline, reported to one
decimal place.
The volumetric levels resulting from the application of the
percentage reduction in litres/person/day (l/p/d) reported to
one decimal place.
Boundaries The PCC level is calculated in line with the Final reporting
guidance for PR19 – Per Capita Consumption, published on
27 March 2018, with exception of the following aspects of the
guidance:
1. Unmeasured household consumption
4a – Monitors follow principles set out in the UKWIR Report
‘Best Practice for unmeasured per- capita consumption
monitors 1999’ and the more recent report ‘Future Estimation
of Unmeasured Household Consumption’, UKWIR 2017
4c – Evidence that survey is representative (based on
demography, property type or other factors) of the company
as a whole; valid data available from at least 80% of monitors
as an annual average
For the reporting year 2020-21, Thames Water used the
2019/20 baseline level of unmeasured consumption in
London obtained from the Domestic Water Use Study
(DWUS) and used data from smart metered properties to
estimate the change in consumption between 2019/20 and
2020/21 for all property types other than flats in large blocks.

Thames Water Reporting Criteria
Annual performance report 2020-21
9
31 March 2021. Version 1.0
This approach does not comply with the above requirements
of the reporting guidance.
Reporting criteria
This measure is a performance movement (PM) of the three-year average per capita
consumption (PCC) values against the baseline.
PM (for the report year) = ((PCC baseline – Three year average PCC (for the report year)/
PCC baseline)) * 100
Three-year average PCC (for the report year) is calculated from annual average values for
the reporting year and two preceding years and expressed in litres/person/day (l/p/d).
PCC baseline is calculated as the mean of the annual average PCC for 2019/20, 2018/19
and 2017/18 and expressed in litres/person/day (l/p/d).
Where this calculation results in a positive value, it corresponds to an outperformance of PCC
in l/p/d. Where this calculation results in a negative value it corresponds to an
underperformance of PCC in l/p/d.
PCC is calculated using the following formula:
PCC = (Measured Household consumption + Unmeasured Household Consumption) / Total
household population
It is reported as the annual arithmetic mean per capita consumption expressed in litres per
person per day (l/p/d). The measure uses post MLE (maximum likelihood estimation) data for
measured household consumption and unmeasured household consumption.
Measured Household consumption is the volume of water used by each measured household
within Thames Water's area, including meter under-registration but excluding supply pipe
leakage. It is calculated from Thames Water's billing system, including actual reads and
estimated reads.
Unmeasured Household consumption is the volume of water used by each unmeasured
household excluding supply pipe leakage. It is calculated from average unmeasured per
household consumption (PHC expressed in l/household/day) multiplied by the number of
unmeasured households.
Per capita consumption (PCC) is defined in the Final reporting guidance for PR19 – Per
Capita Consumption, published on 27 March 2018:
https://www.ofwat.gov.uk/publication/reporting-guidance-per-capita-consumption/

Thames Water Reporting Criteria
Annual performance report 2020-21
10
31 March 2021. Version 1.0
Performance commitment BW01: Mains repairs
Unit of measure Number of repairs per 1,000km of mains, reported to one
decimal place.
Boundaries The performance commitment excludes communication and
supply pipes.
Reporting criteria
Mains repairs is defined in the reporting guidance for PR19 – Mains Repairs per 1,000km,
published on 27 March 2018.
https://www.ofwat.gov.uk/publication/reporting-guidance-mains-repairs-per-1,000km/
The measure is reported as the number of mains repairs per thousand kilometres of the entire
water main network.
Mains repairs – This includes all physical repair work to mains from which water is lost.
Mains length – This is the length of all pipes conveying treated water around the distribution
point but not including communication pipes or supply pipes
Mains repairs are reported separately for pro-active and reactive repairs. Pro-active repairs
are those completed by the company as a result of the company’s active leakage control
(ALC) or its own leak detection activity. Reactive repairs are those that are completed as a
result of a customer contact (made using any communication channel) informing the
company of a leak.
Performance commitment BW02: Unplanned outage
Unit of measure Percentage of peak week production capacity, reported to
two decimal places
Boundaries The performance measure only accounts for outages relating
to unplanned causes such as asset failure. Outages relating
to planned causes such as when assets are taken out of
supply or made unavailable for supply to enable planned
maintenance or capital works to be completed are excluded
from the measure.
Additional exclusions from the measure are:
- Excluded sites: Sites not in service as per the annual
production plan, sites used only in the case of an emergency
or sites only required to be in service during a dry year.
- Outages of 24 hours or less in duration.
- Outages where we have proactively restricted abstraction or
production from a given WTW because of variable raw water
quality.
- Outages caused by raw water quality outside of the normal
operating band for a given works.
- Outages caused or prolonged by extreme weather events.
Reporting criteria
This measure is defined as the annualised unavailable flow, based on the peak week
production capacity (or PWPC), for each company. This measure is proportionate to both the
frequency of asset failure as well as the criticality and scale of the assets that are causing an
outage.
Thames Water Reporting Criteria
Annual performance report 2020-21
11
31 March 2021. Version 1.0
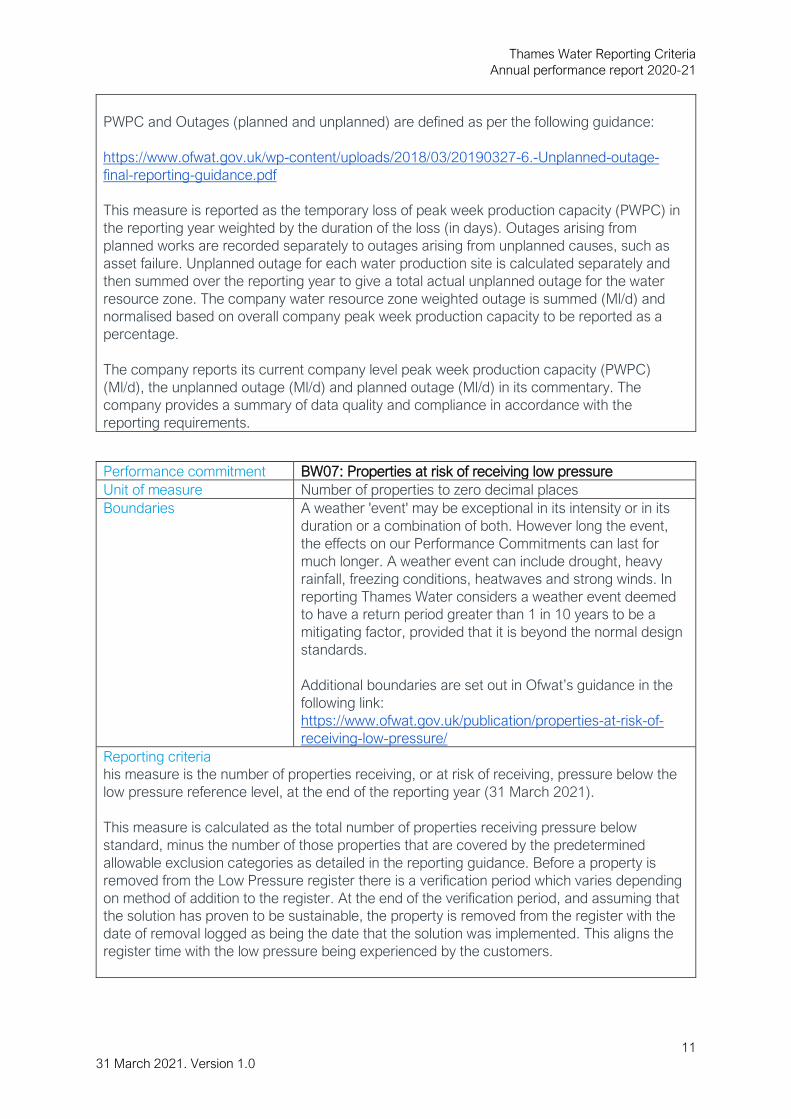
PWPC and Outages (planned and unplanned) are defined as per the following guidance:
https://www.ofwat.gov.uk/wp-content/uploads/2018/03/20190327-6.-Unplanned-outage-
final-reporting-guidance.pdf
This measure is reported as the temporary loss of peak week production capacity (PWPC) in
the reporting year weighted by the duration of the loss (in days). Outages arising from
planned works are recorded separately to outages arising from unplanned causes, such as
asset failure. Unplanned outage for each water production site is calculated separately and
then summed over the reporting year to give a total actual unplanned outage for the water
resource zone. The company water resource zone weighted outage is summed (Ml/d) and
normalised based on overall company peak week production capacity to be reported as a
percentage.
The company reports its current company level peak week production capacity (PWPC)
(Ml/d), the unplanned outage (Ml/d) and planned outage (Ml/d) in its commentary. The
company provides a summary of data quality and compliance in accordance with the
reporting requirements.
Performance commitment BW07: Properties at risk of receiving low pressure
Unit of measure Number of properties to zero decimal places
Boundaries A weather 'event' may be exceptional in its intensity or in its
duration or a combination of both. However long the event,
the effects on our Performance Commitments can last for
much longer. A weather event can include drought, heavy
rainfall, freezing conditions, heatwaves and strong winds. In
reporting Thames Water considers a weather event deemed
to have a return period greater than 1 in 10 years to be a
mitigating factor, provided that it is beyond the normal design
standards.
Additional boundaries are set out in Ofwat’s guidance in the
following link:
https://www.ofwat.gov.uk/publication/properties-at-risk-of-
receiving-low-pressure/
Reporting criteria
his measure is the number of properties receiving, or at risk of receiving, pressure below the
low pressure reference level, at the end of the reporting year (31 March 2021).
This measure is calculated as the total number of properties receiving pressure below
standard, minus the number of those properties that are covered by the predetermined
allowable exclusion categories as detailed in the reporting guidance. Before a property is
removed from the Low Pressure register there is a verification period which varies depending
on method of addition to the register. At the end of the verification period, and assuming that
the solution has proven to be sustainable, the property is removed from the register with the
date of removal logged as being the date that the solution was implemented. This aligns the
register time with the low pressure being experienced by the customers.

Thames Water Reporting Criteria
Annual performance report 2020-21
12
31 March 2021. Version 1.0
Low pressure reference level is defined in the reporting guidance published 11 December,
2017 ‘Properties at risk of receiving low pressure’:
https://www.ofwat.gov.uk/publication/properties-at-risk-ofreceiving-low-pressure
Performance commitment BW08: Acceptability of water to consumers
Unit of measure Number of consumer contacts per 1,000 population, reported
to two decimal places.
Boundaries The following list of water quality customer contacts are
excluded from this measure:
• Consumer contacts related to water supplied by another
water company.
• Contacts from school children and college students
seeking information to help them with an educational
assignment.
• Contacts from representatives of consumers such as a
local councillor or an MP usually relate to a water quality
incident or to a consumer’s complaint and inclusion of
these would duplicate information already recorded.
• Contacts found to relate to a private supply of water and
not the company’s public water supply.
• Consumer contacts received in the course of managing
a notified water quality event.
A further list of excluded contact types is defined within the
DWI guidance
Reporting criteria
This measure relates to the number of times the company is contacted by consumers due to
the taste and odour of drinking water, or due to drinking water not being clear, or consumer
reporting illness due to drinking water, reported per 1,000 population.
The calculation of the measure is as follows:
((the number of contacts for appearance, taste/odour and illness) * 1,000) / the resident
population as supplied to the Drinking Water Inspectorate (DWI).
The consumer contact classification guidance is defined by the DWI in the following:
https://www.ofwat.gov.uk/publication/dwi-letter-customer-contacts-about-water-quality-
appearance/
Appearance consists of the following categories:
Discoloured water – brown/black/orange, discoloured water – blue/green, particles, white-air,
white-chalk and animalcules.
Taste/Odour consists of the following categories:
Chlorine, earthy/musty, petrol/diesel and other taste/odour.
Illness consists of the following categories:
Gastroenteritis, oral, skin and medical opinion

Thames Water Reporting Criteria
Annual performance report 2020-21
13
31 March 2021. Version 1.0
The company reports consumer contacts separately for appearance, and taste and odour for
the Discover Water website.
Performance commitment BW09: Water quality events
Unit of measure Number of events (category 3, 4 and 5) to zero decimal
places
Boundaries The measure excludes:
• Category 3, 4 and 5 events that do not require the
company to issue “restriction of use” advice, and those
that do not prompt customers to directly contact the
company by telephone, letter, email or website in
response to a problem.
• Category 1 and 2 events
Reporting criteria
This performance commitment is a measure of the number of category 3, 4 and 5 water
quality events that have impacted customers. The DWI set out event notification criteria in
their document “Guidance on the notification of events, August 2009”. The company’s
internal triggers apply this guidance to enable it to be consistent in its event notifications.
Impacted customers are defined by events where:
• the company issues restriction of use advice (or the DWI considers the company should
have taken such action); or
• where one or more customers directly contacts the company by telephone, letter, email
or website in response to a problem.
Each event is independently assessed by the DWI which assigns it a category score. The
following category definitions are as follows:
• ‘Category 1. Not significant’ – least potential negative impact on public confidence in the
water supply.
• ‘Category 2. Minor’ – some potential for negative impact on public confidence in the
water supply, but not requiring significant level of investigation.
• ‘Category 3. Significant’ – potential for negative impact on public confidence in the water
supply requiring a detailed investigation and assessment of the event by a warranted
inspector.
• ‘Category 4. Serious’ – significant potential for negative impact on public confidence in
the water supply requiring a detailed investigation and assessment of the event by a
warranted Inspector, possibly with additional internal and external support (to be
determined on initial assessment of the circumstances of the event).
• ‘Category 5. Major’ - significant potential for negative impact on public confidence in the
water supply requiring a detailed investigation and assessment of the event by a
warranted Inspector with additional internal and external support at all seniority levels (to
be determined on initial assessment of the circumstances of the event).

Thames Water Reporting Criteria
Annual performance report 2020-21
14
31 March 2021. Version 1.0
Performance commitment BW10: Reducing risk of lead
Unit of measure The cumulative number of lead communication pipes
replaced annually, reported to zero decimal places.
Boundaries Only lead pipes replaced within the four mentioned categories
are counted within the target. Lead pipes replaced by other
synergistic work such as leakage are not counted under this
programme.
The performance commitment also excludes lead
communication pipes replaced as part of other rehabilitation
programmes that are not in the ‘hotspot’ areas.
Reporting criteria
This performance commitment is defined as the cumulative number of lead communication
pipes replaced in the 2020-25 period.
This performance commitment includes replacements that will result from:
1. Customer requests for communication pipe replacements (reactive activities);
2. Failed samples (reactive activities);
3. Targeted replacements in ‘hot-spots’ (proactive activities); and
4. Social homes and establishments with vulnerable customers including those at primary
schools, nurseries and similar establishments (proactive activities)
Replacements at customers' request are defined as all lead communication pipes
replacements where the customer has requested replacement under Regulation 30(4)(b) of
the Water Supply (Water Quality) Regulations and where the customer intends to replace or
has replaced their supply pipe.
Replacements on failed samples are defined as all lead communication pipes replacements
where water quality sampling test results have shown the lead content to be higher than the
acceptable threshold (10μg).
Replacements in targeted areas or ‘hotspots’ are defined as replacements of communication
pipes to properties falling within water supply zones which Thames Water has identified (in
accordance with methodology confirmed by DWI), as high risk of having lead pipework, and
which have been listed and issued to the Lead Pipe Replacement (LPR) Team. This includes
communication pipes, replaced as part of water mains rehabilitation programmes, which
serve properties within hotspot areas.
Replacements at social homes and establishments with vulnerable customers are defined as
replacements of lead communication pipes to primary schools and nurseries or other similar
establishments across the supply area. As of the 31 March 2021 only replacements
undertaken at schools and nurseries were reported under this category, as no work has been
done work at any “similar establishments”.

Thames Water Reporting Criteria
Annual performance report 2020-21
15
31 March 2021. Version 1.0
Performance commitment DW02: Security of supply index SoSI
Unit of measure SOSI score to zero decimal places
Boundaries None
Reporting criteria
The Security of Supply index (SoSI) is a score reflecting a company’s ability to meet its
planned levels of service for average demand in a dry year at the end of the financial year (31
March 2021). The SoSI score can range from negative scores to 100. A score of less than
100 demonstrates that Thames Water would have to impose demand restrictions on its
customers more frequently than set out in its levels of service.
The level of service is set with the following frequencies of occurrence and types of water use
restrictions:
• Level 1 (1 year in 5 on average) – Intensive media campaign;
• Level 2 (1 year in 10 on average) – Sprinkle / unattended hosepipe ban, enhanced
media campaign;
• Level 3 (1 year in 20 on average) – Temporary Use Ban (formerly hosepipe ban),
Drought Direction 2011 (formerly non-essential use bans) requiring granting of an
Ordinary Drought Order; and
• Level 4 (Never) – If extreme measures (such as standpipes and rota cuts) were
necessary their implementation would require the granting of an Emergency Drought
Order.
SoSI is scored for the whole company based on a weighted sum of the six individual Water
Resource Zones (WRZs). A water resources zone is defined as the largest area of a water
company’s supply system where all customers have the same supply risk.
The methodology to derive the index score is set out below:
Calculate the Water available for use (WAFU).
WAFU is defined as WRZ deployable output less reductions including climate change,
sustainability reductions, network constraints and reductions made for outage allowance.
Deployable output is defined as a measure of Thames Water's capability to put water into the
supply network in drought conditions. This capability is limited by a number of factors such as
abstraction licences, treatment network constraints and water resource shortages. Estimation
of deployable input is performed through Water Resources Management models used to
understand how the current water supply system would work effectively in past droughts.
Sustainability reductions are reductions in abstraction licence volume agreed with the
Environment Agency (EA) for environmentally sustainable purposes.
Outage is defined as a temporary loss of Deployable Output that is retrievable. The outage
allowance number for a given sub-zone is the worst of the monthly ‘95th percentile’ actual
outages numbers for that sub-zone.
Calculate the Dry Year Available Headroom per WRZ
Dry Year Available Headroom is defined as WAFU adjusted for Bulk Imports/Exports to and
from other companies less adjusted dry year Distribution Input.
Bulk water exports and imports include treated and untreated exports and imports but
excludes non-potable supplies.
Dry Year Distribution input (DI) is defined as the average DI recorded during the year
adjusted by a dry year uplift. Weather dependent models of usage and leakage are used to

Thames Water Reporting Criteria
Annual performance report 2020-21
16
31 March 2021. Version 1.0
generate a range of demand scenarios at the WRZ level, using a number of years of weather
and demand data.
The dry-year demand is defined as the demand observed under the joint conditions of a 1 in 5
summer and a 1 in 5 winter.
Calculate the Target Headroom
Target headroom is defined as 'the minimum buffer that water companies are required to
maintain between supply and demand in order to account for current and future uncertainties
in supply and demand'.
The target headroom model is used to calculate the threshold minimum acceptable
headroom, catering for uncertainties in the overall supply demand balance and agreed levels
of service, which would trigger the need for water management options to increase water
available for use or decrease demand. Thames Water uses a statistical technique called
Monte Carlo analysis to examine uncertainties used in the Target Headroom calculation and
the possible range of values that specific elements of supply and demand forecast could take.
Calculate the surplus / deficit expressed as a percentage per WRZ
Surplus / deficit is defined as a difference between the Dry Year Available Headroom and
Target Available Headroom.
The surplus or deficit expressed as a percentage per WRZ is calculated by dividing the
surplus or deficit value in megalitres per day (Ml/d) by the sum of Adjusted Dry Year
Distribution Input and Target Headroom.
Calculate the percentage of population with headroom deficit by dividing the population per
zone with the deficit by the total company population. Where the zone is not in deficit, zero
should be entered in ‘percentage of total population with headroom deficit’.
Zonal population is the total average resident population in a water resource zone.
Calculate the zonal index per WRZ
Zonal index is defined as a percentage deficit (step 4) squared multiplied by the percentage
of population affected (step 5) and multiplied by 100.
Calculate the final companywide SoSI as 1 minus the sum of zonal scores and then multiplied
by 100.
The components of the Security of Supply Index calculation are annual averages and peak
week values in Ml/d. As SoSI is a measure of the company’s ability to supply water in a dry
year, the Ml/d volumes are then adjusted for any weather effect to give the right return
periods (the dry year Ml/d volume of water available). The score reported is the lower of the
two scores produced by annual averages and peak week values in Ml/d.

Thames Water Reporting Criteria
Annual performance report 2020-21
17
31 March 2021. Version 1.0
Performance commitment DWS01: Power resilience
Unit of measure Number of sites to zero decimal places
Boundaries None
Reporting criteria
The cumulative number of key power dependent sites that are made resilient to power
disturbances or interruptions over three hours from the distribution network operators from 1
April 2020 to 31 March 2025. 47 power dependent sites were identified during PR19 and this
measure reports progress against these 47 sites. These are listed in our PR19 Final
Determination.
The key power dependent sites in this performance commitment only include:
• water and sewage treatment works;
• water booster stations and sewerage pumping stations with greater than 500kW
installed power; and
• water booster stations without standby generation and with greater than 200 directly
fed properties.
Performance commitment DWS02: SEMD - Securing our sites (2020-25 projects)
Unit of measure Percentage to one decimal place
Boundaries Legacy projects that are outstanding from the 2020-25
period, which are covered by PR19TMS_DWS03 (‘SEMD -
Securing our sites (legacy projects)’) are excluded.
Reporting criteria
This measure relates to the percentage of an agreed number of specified sites brought into
compliance with Security and Emergency Measures Direction (SEMD) requirements and
assessed against a set of criteria agreed with Defra from 1 April 2020.
This performance commitment only applies to a list of 28 borehole sites agreed between the
company and Defra. This is the same measure that Defra request the water industry use
when reporting to them. Full compliance is assessed against criteria established by Defra.
Percentage compliance of specified sites with SEMD requirements assessed against a set of
criteria, as agreed with Defra. These sites will be assessed as compliant or not compliant. The
schemes are considered complete and compliant when all project milestones have been
completed, exit criteria has been met and the benefits have been realised, as set out in the
defined project scope at initiation.
Performance commitment DWS03: SEMD - Securing our sites (legacy projects)
Unit of measure Percentage to one decimal place
Boundaries New projects which were not due in the 2015-20 period are
excluded.
Reporting criteria
The percentage of an agreed number of specified projects brought into compliance with
Security and Emergency Measures Direction (SEMD) requirements and assessed against a
set of criteria agreed with Defra.
The performance commitment only includes the 264 legacy projects, from the 591 agreed at
PR14, which remain outstanding in the 2020-25 period. Full compliance is assessed against
criteria established by Defra.

Thames Water Reporting Criteria
Annual performance report 2020-21
18
31 March 2021. Version 1.0
The schemes are considered complete when all project milestones have been completed, exit
criteria has been met and the benefits have been realised, as set out in the defined project
scope at initiation. Percentage compliance of specified projects with SEMD requirements
assessed against a set of criteria, as agreed with Defra. These sites will be assessed as
compliant or not compliant.
Performance commitment ER01: Unregistered household properties
Unit of measure Process completed’ or ‘Process not completed’
Boundaries This measure excludes any Boundary Properties/Water only
Companies (WOC's) where TW are responsible for Waste
Only. This measure also excludes any charge points that do
not relate to a physical property e.g. Kiosks and
Hereditaments and Troughs.
Reporting criteria
This performance commitment assesses if the company has completed all processes to find
unregistered household properties.
Unregistered household properties (also known as ‘gap sites’) are properties where water
and/or wastewater services are being consumed, but the property is not in the company’s
system and is therefore not billed. This performance commitment is to ensure that the
company has robust and consistent processes in place in order to minimise the number of
unregistered properties within its region. The company will use third party datasets to cross
reference with its billing system on a quarterly basis in order to identify mismatches in the
properties registered.
The process includes:
• A defined team will be responsible for downloading external data and using it to cross
reference against internal records. The team will analyse this data to identify any sites
that appear on the external data, but not on the company’s systems (and therefore
appear to be unregistered). The team will be responsible for monitoring progress of sites
being confirmed as being put into charge or confirmed as not existing;
• confirmed unregistered sites will be passed on to the relevant teams to input into the
system and take further steps to bring into charge, as appropriate; and
• the company will use a minimum of three data sources in each quarter. These sources
are not defined, but are likely to include examples such as Experian, Royal Mail postcode
address file (PAF), Land Registry etc. These will be reviewed further for suitability and
quality as the company starts testing the process.
The final reported measure is noted as either, 'Process completed' or 'Process not
completed'.
Performance commitment ER02: Empty household properties (‘void properties’)
Unit of measure Percentage of household properties classed as void, to two
decimal places.
Boundaries This measure excludes non-household properties. Properties
that are not billed as it is uneconomical to do so are not
counted.
Uneconomical is defined as the incremental cost of sending a
bill and the normal incremental cost of processing a payment
Thames Water Reporting Criteria
Annual performance report 2020-21
19
31 March 2021. Version 1.0
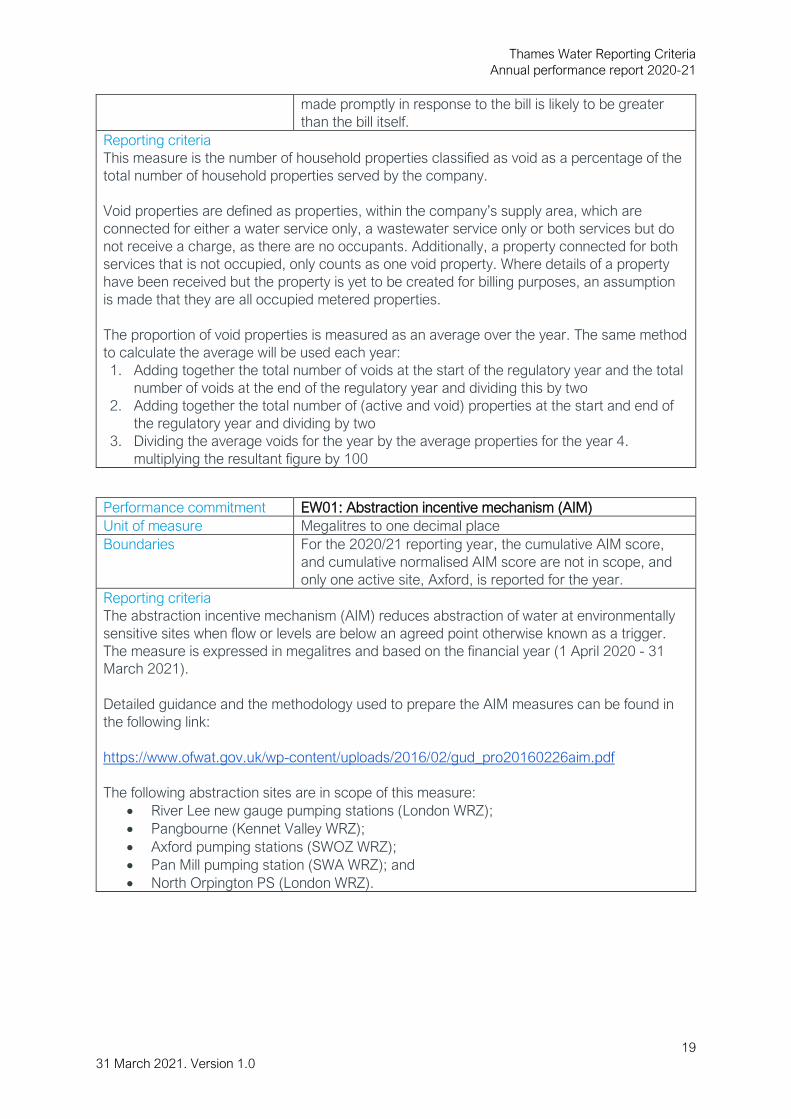
made promptly in response to the bill is likely to be greater
than the bill itself.
Reporting criteria
This measure is the number of household properties classified as void as a percentage of the
total number of household properties served by the company.
Void properties are defined as properties, within the company’s supply area, which are
connected for either a water service only, a wastewater service only or both services but do
not receive a charge, as there are no occupants. Additionally, a property connected for both
services that is not occupied, only counts as one void property. Where details of a property
have been received but the property is yet to be created for billing purposes, an assumption
is made that they are all occupied metered properties.
The proportion of void properties is measured as an average over the year. The same method
to calculate the average will be used each year:
1. Adding together the total number of voids at the start of the regulatory year and the total
number of voids at the end of the regulatory year and dividing this by two
2. Adding together the total number of (active and void) properties at the start and end of
the regulatory year and dividing by two
3. Dividing the average voids for the year by the average properties for the year 4.
multiplying the resultant figure by 100
Performance commitment EW01: Abstraction incentive mechanism (AIM)
Unit of measure Megalitres to one decimal place
Boundaries For the 2020/21 reporting year, the cumulative AIM score,
and cumulative normalised AIM score are not in scope, and
only one active site, Axford, is reported for the year.
Reporting criteria
The abstraction incentive mechanism (AIM) reduces abstraction of water at environmentally
sensitive sites when flow or levels are below an agreed point otherwise known as a trigger.
The measure is expressed in megalitres and based on the financial year (1 April 2020 - 31
March 2021).
Detailed guidance and the methodology used to prepare the AIM measures can be found in
the following link:
https://www.ofwat.gov.uk/wp-content/uploads/2016/02/gud_pro20160226aim.pdf
The following abstraction sites are in scope of this measure:
• River Lee new gauge pumping stations (London WRZ);
• Pangbourne (Kennet Valley WRZ);
• Axford pumping stations (SWOZ WRZ);
• Pan Mill pumping station (SWA WRZ); and
• North Orpington PS (London WRZ).

Thames Water Reporting Criteria
Annual performance report 2020-21
20
31 March 2021. Version 1.0
Performance commitment EWS08: Empty business properties
Unit of measure Number of properties to zero decimal places
Boundaries Properties should only be counted if it is billed as a result of
the notification. Only properties meeting following criteria will
be reported under this performance commitment:
• property status had been changed to Occupied by
Thames Water using the Vacancy Change Application
(VCA) process; or
• property status had been changed to Occupied by
Retailer, following an intervention by Thames Water
VCA process is described in the Market Arrangements Code
(MAC) and the Wholesale Retail Code (WRC). that govern the
non-household retail market.
Reporting criteria
This measure is the number of non-household properties recorded as Void in Central Market
Operating System (CMOS), which the company identifies as Occupied and which are
subsequently billed. The information on location and evidence of occupancy is then passed
on to the retailer in order that they challenge occupancy status and bring the property into
billing.
The following properties will be included towards the EWS08 Empty Business Properties
performance commitment:
• Properties that were in Vacant status in CMOS for 6 months on the 1st April 2020 and
are retrospectively changed to Occupied for a period of 6 months or longer, even if this
period has not yet been fully billed to the Retailer.
• Properties that were Vacant for 6 months and are retrospectively changed to Occupied
for less than 6 months and will be monitored until they reach the 6-month requirement at
which point they would be included in the performance result, even if the 6 months
period has not yet been fully billed to the Retailer.
Thames Water consider that the record of the wholesaler billing the retailer is sufficient to
meet the requirement of “subsequently billed” . Thames Water notes Ofwat’s ruling on this,
which stated “We confirm that Thames Water’s record of billing the retailer can be used to
satisfy the ‘subsequently billed’ requirement" and Thames Water's interpretation is that this
does not require them to wait until after final settlement (16 months) in order to include the
premises into the EWS08 performance result.
If work around identification of the occupied property took place in the previous reporting
year, it can still be claimed in the following year as soon the property meets the ODI eligibility
criteria.(e.g. If work took place in 2020/21 to identify occupied status, it will be eligible for
inclusion in 2021/22 at the time when the ODI requirements are met). Commentary will be
provided to Ofwat to outline the number of properties included for the PC that were initially
identified as a potential lead in the previous year to ensure transparency of reporting. With
regards to the end of the reporting period, any claims for the final year (March 2025) will only
include those that meet the eligibility criteria within the reporting period.

Thames Water Reporting Criteria
Annual performance report 2020-21
21
31 March 2021. Version 1.0
Performance commitment M01: Installing new smart meters in London
Unit of measure Number of smart meters to zero decimal places
Boundaries This measure only applies to residential customers’ meters
and excludes business customers’ meters.
A smart meter can only be counted once in the five-year
period for a property. For example, if a smart meter fails within
the five years and is replaced, it cannot be recounted towards
this performance commitment.
This measure excludes the installation of new smart meters
for new connections and excludes the replacement of existing
basic meters with smart meters.
Reporting criteria
This measure relates to the cumulative number of new smart meters installed in the London
water resources zone (WRZ) from 1 April 2020. We define new smart meters in this
performance commitment as new meter installations that use Advanced metering
infrastructure (AMI) technology that enables them to be read remotely through an integrated
system of smart meters, communications networks, and data management systems.
This system will comply with the company’s obligations under competition law and have the
capability to:
• Record consumption data and comply with the appropriate regulations governing cold
water meters.
• Allow ready access to this data by customers (directly or via contractors/agents) and
the company at near real time, with data updated daily at a minimum, and made
available at a minimum granularity of 1 hour intervals, or such greater frequency
and/or granularity as reasonably requested by the customer or its contractors/agents.
• Enable the capability for automated leak alarms to be communicated to the customer
and company.
• Transfer consumption data to the company remotely without requiring access to the
meter or property.
• Communicate with the internet.
Existing meters are defined as meters that were installed in the Thames Water network prior
to 1 April 2020 without smart meter capability.
The performance commitment measures the total number of smart meters installed in the
reporting year (1 April 2020 - 31 March 2021) for the following categories of meters defined
by the company:
• meter installed at a property that previously paid unmetered charges. This includes
residential customers that have opted for a meter or where the company has
selectively installed a meter); and
• small bulk meters, that provide additional benefit to meters already installed – i.e. not
replacements of bulk meters.
The total performance commitment levels relate to the installation of smart meters on existing
connections only.

Thames Water Reporting Criteria
Annual performance report 2020-21
22
31 March 2021. Version 1.0
Performance commitment M02: Replacing existing meters with smart meters in London
Unit of measure Number of smart meters to zero decimal places
Boundaries This measure only applies to residential customers’ meters
and excludes business customers’ meters.
A smart meter can only be counted once in the five-year
period for a property. For example, if a smart meter fails within
the five years and is replaced, it cannot be recounted towards
this measure.
Reporting criteria
This measure relates to the cumulative number of existing installed meters replaced with
smart meters per reporting year in the London water resources zone (WRZ) from 1 April
2020.
Replacement smart meters are defined as replacement meter installations that use Advanced
metering infrastructure (AMI) technology that enables them to be read remotely through an
integrated system of smart meters, communications networks, and data management
systems.
Existing meters are defined as meters that were installed in the Thames Water network prior
to 1 April 2020 without smart meter capability.
This system will comply with the company’s obligations under competition law and have the
capability to:
• Record consumption data and comply with the appropriate regulations governing cold
water meters.
• Allow ready access to this data by customers (directly or via contractors/agents) and
the company at near real time, with data updated daily at a minimum, and made
available at a minimum granularity of 1 hour intervals, or such greater frequency
and/or granularity as reasonably requested by the customer or its contractors/agents.
• Enable the capability for automated leak alarms to be communicated to the customer
and company.
• Transfer consumption data to the company remotely without requiring access to the
meter or property.
• Communicate with the internet.
The performance commitment measures the total number of installed existing basic meters
replaced in the reporting year (1 April 2020 - 31 March 2021) for smart meters.

Thames Water Reporting Criteria
Annual performance report 2020-21
23
31 March 2021. Version 1.0
Section 3B: Wastewater Performance Commitments
The following Reporting Criteria are used for wastewater performance commitments.
Performance commitment CS03: Internal sewer flooding
Unit of measure Number of incidents per 10,000 sewer connections reported
to two decimal places.
Boundaries Exclusions to the measure include the following:
• Coastal flooding;
• Ground water which has not originated from a public
sewer;
• Flooding from water mains etc.;
• Incidents caused by highway drains; or
• Incidents caused by private assets (including drains).
The Water UK “Guide to Transfer of Private Sewers
Regulations 2011”, published on 30th September 2011
shall be applied to assess if the flooding incident should
be attributed to the undertaker or a private asset such as
a drain.
Reporting criteria
The internal sewer flooding measure is defined in the reporting guidance for PR19 – Sewer
Flooding, published on 28 April:
https://www.ofwat.gov.uk/publication/reporting-guidancesewer-flooding/
The measure is calculated as the number of internal sewer flooding incidents normalised per
10,000 sewer connections including sewer flooding due to severe weather events.
Companies might also want to present their performance commitments in absolute numbers
to make it easier for customers and stakeholders to understand.
The definitive service levels are those expressed as the values normalised per 10,000 sewer
connections.
The list below gives examples of what parts of buildings shall be included in the internal
flooding category:
• The main parts of the building;
• Conservatories;
• Basements and cellars (even if unoccupied);
• Areas below suspended floors;
• Lift shafts;
• Stairwell/lobby area of flats (to be counted as 1 flooded property);
• Any shared car parking areas beneath the main building where access to the parking
area is from within the building (to be counted as 1 flooded property);
• Studios and workshops, which are an integral part of the main building;
• Porches; or
• Garages which are an integral part of the house with an adjoining door to the
occupied building.

Thames Water Reporting Criteria
Annual performance report 2020-21
24
31 March 2021. Version 1.0
Performance commitment ES01: Pollution Incidents
Unit of measure Number of pollution incidents per 10,000 km of the
wastewater network reported to two decimal places.
Boundaries Category 4 incidents are excluded from the measure. The
definitions of these are also set out in the Environment
Agency guidance link.
Reporting criteria
This measure relates to the total number of pollution incidents (categories 1 to 3) per
10,000km of sewer length for which the company is responsible in a calendar year (1 January
2020 to 31 December 2020).
The measure specifically records the Category 1 to 3 pollution incidents to the water
environment from failures on foul sewers, combined sewer overflows, sewage pumping
stations, rising mains, storm tanks, sewage treatment works, other water industry premises
and polluted surface water outfalls. This measure will be reported as both the absolute
number of pollution incidents and a normalised value of pollution incidents per 10,000km of
sewer.
Category 1, 2 and 3 pollution incidents are defined as:
Category 1 – Major, serious, persistent and/or extensive impact or effect on the environment,
people and/or property
Category 2 – Significant impact or effect on the environment, people and/or property
Category 3 – Minor or minimal impact or effect on the environment, people and/or property
The total sewer length for the company is defined in the following guidance for PR19:
https://www.ofwat.gov.uk/wp-content/uploads/2017/12/WatCoPerfEPAmethodology_v3-Nov-
2017-Final.pdf
The determination of the category of an incident is made by the Environment Agency. Further
information can be found in the following Environment Agency guidance:
https://www.ofwat.gov.uk/wp-content/uploads/2017/12/20171129-Incidents-and-their-
classification-the-Common-Incident-Classification-Scheme-CICS-23.09.16.pdf
Performance commitment CS02: Sewer Collapses
Unit of measure Number of collapses per 1,000km of sewer network, reported
to two decimal places.
Boundaries Exclusions are as defined in the guidance
Reporting criteria
Sewer collapses is defined in the reporting guidance - sewer collapses per 1,000km
(updated), published on 4 April 2019:
https://www.ofwat.gov.uk/publication/reporting-guidance-sewer-collapses-per-1,000km/
Number of sewer collapses per thousand kilometres of all sewers that have not been
identified proactively by the company and causing an impact on service to customers or the
environment. (1 April 2020 - 31 March 2021)

Thames Water Reporting Criteria
Annual performance report 2020-21
25
31 March 2021. Version 1.0
As stated in the Ofwat guidance a collapse will only be included for this performance
commitment where both the following actions have occurred:
• There has been a failure to a sewer which is confirmed as the root cause of the
resulting customer contact for impact on service or escape (flooding or pollution),
leading to the detection of a collapse; and
• This has resulted in the need to replace or repair the pipe to reinstate normal
service.
The measure includes:
• rising mains;
• pipe bridges;
• failures on the infrastructure network, including inputs into the inlet of treatment works
and terminal pumping station rising mains; and
• all public sewer and lateral collapses recorded by the company inclusive of those
incidents that have been reported as flooding or pollution failures, if the primary cause
of the flooding or pollution was a sewer collapse.
Per the guidance, collapses should be reported in the year that the collapse was reported,
rather than the date that the repair work has been completed. Currently the data is provided
based on the 'Activity Raised Date' within the system. This should be populated when work is
requested after an incident is reported, however there is a delay between a potential collapse
being reported, the activity being requested and then also following this the verification of
whether this is actually a collapse (rather than a blockage or other incident type). Therefore
filtering only based on the 'Activity Raised Date' is likely to mean that collapses from the prior
period will be included, and collapses at the end of the reporting period will be excluded in
this reporting period and shown within the next year.
Performance commitment CS01: Treatment work compliance
Unit of measure Percentage compliance, reported to two decimal places.
Boundaries None
Reporting criteria
This measure is the percentage of treatment works with discharges compliant with numeric
environmental permits in each year.
The discharge permit compliance metric is reported as the number of failing sites (as a
percentage of the total number of discharges) and not the number of failing discharges. This
is based on the calendar year (1 January 2020 - 31 December 2020). It is a measure of the
capability of the company’s wastewater and water treatment works to treat and dispose of
wastewater in line with the company’s discharge permit conditions. It is calculated as follows:
(B - A) / B * 100
Where:
A = No. of sites (STWs and WTWs) with numeric limits confirmed as failing relevant conditions
in the calendar year; and
B = No. of discharges on the EA register during the calendar year (in force).
A non-compliant discharge is defined as a level of concentration of a parameter in a
wastewater/water quality sample taken at a treatment works that falls out of the acceptable
level as defined in the individual treatment works permit.

Thames Water Reporting Criteria
Annual performance report 2020-21
26
31 March 2021. Version 1.0
A sample is defined as a wastewater/water quality sample in line with the Environment
Agency guidance, as set out in the links below. The samples are tested for the concentration
of a range of parameters as set out the individual permits for each treatment works. The
samples are taken at the designated sampling point at each sewage treatment works and are
carried out under a UKAS accredited process.
The measure is governed by guidance and regulations issued by the Environment Agency
which can be found in the following links:
https://www.gov.uk/government/publications/water-companies-operator-self-monitoring-osm-
environmental-permits/water-companies-operator-self-monitoring-osm-environmental-
permits; and
https://www.gov.uk/government/publications/waste-water-treatment-works-treatment-
monitoring-and-compliance-limits/waste-water-treatment-works-treatment-monitoring-and-
compliance-limits
https://www.ofwat.gov.uk/wp-content/uploads/2017/12/WatCoPerfEPAmethodology_v3-Nov-
2017-Final.pdf
Performance commitment CS04: Clearance of blockages
Unit of measure Number of sewer blockages to zero decimal places
Boundaries The following are excluded from the blockages reporting
figure:
1. Duplicate records where more than one sewer blockage
clearance has been recorded for the same clearance
activity in the same sewer (located within 250 metres)
and within the same hour.
2. Hydraulic overloads incidents
3. Activities where no clearance was required or blockage
detected.
4. Jobs identified as pro-active slit or blockage removal
5. Sewer blockages occurring in privately owned sewers
6. 50% adjustment on disputes over ownership of sewers
where the outcome is not available.
Reporting criteria
This measure is the total number of sewer blockages on the company’s sewer network
(including sewers transferred in 2011) in a reporting year.
A blockage is an obstruction in a sewer which causes a reportable problem (not caused by
hydraulic overload), such as flooding or discharge to a watercourse, unusable sanitation,
surcharged sewers or odour.
The reported figure is the number of sewer blockages cleared in the year because the
blockages are not confirmed to be reportable blockage (i.e. could be a duplicate/privately-
owned) until it has been cleared and reviewed. Thames Water consider that this process is
sufficient to meet the definition of the 'total number of sewer blockages on the company's
sewer network in a reporting year'.

Thames Water Reporting Criteria
Annual performance report 2020-21
27
31 March 2021. Version 1.0
Performance commitment CS05: Sewage pumping station availability
Unit of measure Percentage to one decimal place
Boundaries The measure excludes:
• terminal sewage pumping stations, i.e. pumping stations
located within the boundary of sewage treatment works;
• pumping stations where asset availability is not reported
through SCADA. (Typically because they are recently
adopted S105a pumping stations.); and
• local package sewage pumping stations that are
designed to protect individual properties from flooding
following heavy rainfall.
Reporting criteria
This measure is the average asset availability of pumps in network catchment sewage
pumping stations across the company’s region in the reporting year (1 April 2020 - 31 March
2021). The performance commitment includes all sewerage pumping stations that are
reported dynamically through the company’s Supervisory Control And Data Acquisition
(SCADA) system. This equates to about 2,800 pumping stations with 6,000 pumps in total
and 95% of its larger sewage pumps. This number includes all installed pumps in the SCADA
connected facilities including those that are rarely used.
- A sewage pumping station is defined as a site used to move wastewater to higher elevations
in order to allow transport by gravity flow.
Weekly data sets are collated for monthly reporting from SCADA. The weekly data is then
averaged over 52 weekly points in the reporting year to give the average weekly asset
availability of pumps within the Waste Network catchment sewage pumping stations. This is
expressed as a percentage value.
Availability is calculated as:
Availability (%) = ((total pumps – total unavailable pumps) / total pumps)) x 100
Where:
• ‘total pumps’ = total number of installed pumps matching method definition
• ‘total unavailable pumps’ = pumps unavailable through maintenance (or status
suppressed) + pumps where SCADA status is unavailable or failed or inhibited
Extreme events, such as severe flooding, can prevent access to our sites for extended
periods of time for health and safety reasons. Where Thames Water are unable to access and
repair a pump due to reasonable exceptional circumstances, Thames Water will record and
report these incidents and make a suitable adjustment to the reported availability to reflect
the extenuating circumstances outside normal operating conditions.

Thames Water Reporting Criteria
Annual performance report 2020-21
28
31 March 2021. Version 1.0
Performance commitment DS02: Surface water management
Unit of measure Number of hectares to two decimal places
Boundaries This performance commitment is not applicable for
contributing area which already drain to surface/foul sewer
networks.
Any schemes on site delivery before 31 March 2020.
Reporting criteria
The hectares of surface area disconnected from the combined sewer system or from which
the flow of surface water is attenuated by a sustainable drainage system from 1 April 2020.
The company will measure the total ‘effective contributing area’, that is, the area that
generates surface water which communicates with its assets, which is then through
appropriate surface water management diverted and passes through either a sustainable
drainage system or new surface water system that does not communicate with combined
sewers.
As per the PR19 Final Determination the company will prioritise the areas where it seeks to
reduce the flow to its combined sewer network by combining four different approaches:
• headroom capacity assessment using the 21st century drainage programme approach,
modified to improve accuracy where specific issues exist within catchments e.g.
groundwater infiltration and basements;
• fifty-year resilience approach as developed by the 21st century drainage programme;
• historical modelling using information from the company’s sewer flooding history
database, pollutions database and past studies; and
• pipe volume capacity – using the company’s known map of sewers. Calculating the total
volume of storage within the sewer network and comparing it to the population or
expected inflow at appropriate points.
Each of the above is used to develop a thematic map whereby the company differentiates
between sewer drainage area catchments (SDACs) with relatively high or low headroom.
These maps are then reviewed for accuracy by the company’s asset planning team. The
company may supplement the above prioritisation approach or propose new more accurate
approaches than the one specified above. However, any amendments to the prioritisation
approach must be robustly justified and in line with surface water management best
practices.
Any outperformance or underperformance payments will be calculated and applied based on
the cumulative total in 2024-25.
Performance commitment ES02: Environmental measures delivered
Unit of measure Number of WINEP schemes completed each year to zero
decimal places
Boundaries This performance commitment excludes schemes that were
uncertain on 11 June 2019 “amber schemes”.
The WINEP also lists the Thames Tideway Tunnel as an
environmental measure, for delivery in the 2020-25 period.
However, achieving that output is not part of this performance
commitment as it forms part of the Thames Tideway Tunnel
price control.

Thames Water Reporting Criteria
Annual performance report 2020-21
29
31 March 2021. Version 1.0
The measure also excludes three non-WINEP schemes under
section 101A of the Water Industry Act 1991.
For the 2020/21 reporting period, due to Covid-19, the
completion date for all schemes was extended from March to
September 2021. This was agreed with the EA. In light of this,
Thames Water has reported a forecast figure which includes
schemes they have completed and schemes which they are
on-track to deliver by the extended deadline of September
2021.
Reporting criteria
The measure is the cumulative number of ‘green’ WINEP schemes completed since 1 April
2020. This metric measures compliance with the requirements of the WINEP and is limited to
the schemes with ‘green’ status as at 11 June 2019.
The company’s agreed measures can be divided into the following eight main categories:
• Wastewater treatment works upgrades – Investment to enhance wastewater treatment
to improve or protect the quality of the receiving waterbody;
• Monitoring and investigation schemes – Investment to understand better how the
company’s operational activities may impact on the environment and how these could be
improved to reduce this impact.
• Conservation schemes – Investment to meet specific conservation measures to reduce
the company’s impact on protected sites or biodiversity.
• Investigations into emerging risks – Investment to understand emerging risks facing the
water industry such as microplastics and antimicrobial resistance or to understand if
abstractions are having a negative impact on ecology;
• Catchment management activities – Investment to manage pesticides, nitrates and
herbicides in surface and groundwaters through catchment activities;
• Alleviating low flows – Investment to investigate or undertake work to alleviate the
impacts that the company’s abstractions have on low flows;
• Reducing environmental impact of river structures – Investment to improve fish passage
in waterbodies through work on the company’s assets where they have been proven to
be a blocker; and
• Addressing invasive non-native species (INNS) – Investment to investigate and
implement measures reduce the risk of INNS associated with the company’s activities.
The full list of included schemes and relevant WINEP driver codes is provided in:
https://www.ofwat.gov.uk/publication/pr19-winepprogramme-annual-update-for-2019/
For the purposes of this performance commitment, only the total number of “green” measures
delivered will matter, rather than the specifics of which exact ones.
Any site where the regulatory obligation has been discharged by the Environment Agency
should be considered as being delivered.
The company secures confirmation from the Environment Agency that performance has been
correctly reported. The view of the Environment Agency will be definitive.

Thames Water Reporting Criteria
Annual performance report 2020-21
30
31 March 2021. Version 1.0
Performance commitment ES03: Sludge treated before disposal
Unit of measure Percentage to one decimal place
Boundaries Sludge exported out of the company’s region is excluded if it
is treated before disposal.
This is estimated using the best available data whereby
location of farms is used to determine the number of farms we
export to that are based outside our region.
Reporting criteria
The percentage of sludge sent to treatment prior to disposal. Sewage sludge is a product of
the wastewater treatment process.
As per the PR19 Final Determination the performance commitment is defined as the
percentage of wastewater sludge treated before disposal, where treatment includes
chemical, biological and thermal processes. This includes all sludge collected from
wastewater network plus and any third party sludge (such as sludge traded in from other
water companies) that has been either transported by road, pipeline or indigenous collocated
sludge, and treated at one of the company’s sludge treatment centres (STCs).
Performance commitment ET01: Readiness to receive tunnel flow at Beckton STW
Unit of measure Number of full months after the SCCD, with the first month
running from the day after the SCCD. Zero decimal places.
Boundaries The Tideway programme is on track to deliver to regulatory
dates, with tunnel construction completed and commissioning
started by 17 October 2022. In the event of tunnel
construction being delayed it would not be in customers’
interests to deliver the inlet modifications ahead of these
being required. In these circumstances the company would
not qualify for underperformance payments against the 17
October 2022 date. Instead, if delays in construction result in
a change in the SCCD, the revised SCCD will be the relevant
date for calculating underperformance payments.
Reporting criteria
This measure is the delivery of the capital works associated with the inlet works under
solution reference S29184 in the PR19 capital programme, which is part of the upgrade to
the Beckton sewage treatment works (STW). Every full month of delay beyond the SCCD will
result in underperformance payments. However, the SCCD has been changed from 17
October 2022 to the 2 October 2023. Therefore, underperformance payments will not apply
until 2022/23.
The scheme has been designed in outline during the 2015- 20 period and is due for detailed
design after the company’s PR19 final determination. The exact scope to be delivered,
therefore, is still evolving as detailed design has not yet been completed so the achievement
of the performance commitment is based upon the completion of the scheme, as will be
confirmed and agreed through detailed design and construction. The indicative outline design
scope is shown below.
The scope of this capital project includes a number of elements at Beckton STW. The current
indicative scope (from outline design) includes:
• 2 new grit lanes and associated grit removal equipment, along with 2 new 50 mm 1D
trash screens installed upstream;

Thames Water Reporting Criteria
Annual performance report 2020-21
31
31 March 2021. Version 1.0
• 8 new 15 - 20 mm 1D bar screens installed downstream of the trash screens and
upstream of the grit channels (6 existing and 2 new channels);
• new duty/standby trash and screenings transfer belt or screw conveyors, screenings
compactors and skip compactors for the 50 mm 1D trash screens;
• new duty/standby screenings transfer screw conveyors, screenings compactors and
skip compactors for the 15 – 20 mm bar screens;
• new grit removal, handling and washing plant along with associated equipment;
• new standby generation;
• clear accumulated grit and debris from intermediate northern outfall sewer (NOS)
barrels; and
• modify existing control philosophy to allow all available plant to operate to minimise the
hydraulic impact on the NOS, minimise deposition of solids and potentially reduce peak
solids loading during first flush scenarios.
The unit of measurement for this performance commitment shall be the beneficial use delivery
of the scheme. For the purposes of this performance commitment, "delivery" shall be defined
as the date of the Benefits Fulfilled (BenF) form, which forms part of the project completion
document suite within our standard workflow process. The ‘BenF’ form is dated and signed by
the relevant approvers and hence forms an auditable basis of measurement of scheme
delivery. The outcome, that will be part of the BenF sign off, will be the provision of sufficient
assets such that, during out of service scenarios, the Inlet Works operates in accordance with
Thames Water Asset Standards and good operating practice.
Performance commitment ET04: Critical asset readiness for the London Tideway
Tunnels (LTT)
Unit of measure Number of full months to zero decimal places
Boundaries None
Reporting criteria
This measure is the number of full months, in the reporting year, that readiness is reported as
‘insufficient readiness’, after the SCCD. This performance commitment incentivises the
company to ensure enabling works are completed and critical assets are sufficiently ready in
advance of the SCCD. Every full month of delay beyond the SCCD will result in
underperformance payments.
‘Sufficient readiness’ means that the company will:
1. Complete and deliver against an Integrated Operating Plan, setting out how it will operate
the London Tideway Tunnel assets in a timely, coordinated and integrated manner, and
in compliance with relevant environmental permits, consents and the London Tideway
Tunnels Operating Techniques.
2. Demonstrate to stakeholders that critical assets are ready to operate in compliance with
the London Tideway Tunnels Operating Techniques and support timely system
commissioning. This will be achieved through advanced preparation of critical assets
reporting aligned with the Tideway Project Master Programme, the System
Commissioning Plan and readiness for the system commissioning commencement.
This involves the following critical assets (some of which are in the company’s wider
wastewater network):
• Operational resilience of Beckton sewage treatment works (STW) to treat sustained
peak flow for extended periods – for the avoidance of doubt, this excludes the inlet works
dealt with in performance commitment ET01;

Thames Water Reporting Criteria
Annual performance report 2020-21
32
31 March 2021. Version 1.0
• Reliable operation of Beckton STW Tideway sewage pumping station (SPS);Reliable and
accessible flow data from Abbey Mills SPS to Beckton STW;
• Reliable and accessible level and flow data from Greenwich SPS to Crossness STW;
• Reliable flow control at Abbey Mills SPS;
• Reliable flow control at Greenwich SPS;
• Certified Commissioning Ready Tideway Tunnel to Beckton STW Flow Transfer System;
• Certified Commissioning Ready Tideway Storm Bypass Tunnel;
• Certified Commissioning Ready Tideway combined sewer overflow (CSO) Overflow
Shaft;
• Reliable operation of key SPSs with an interface to TTT that are considered critical to the
adequate functioning of the London sewerage system.
The SCCD has been changed from 17 October 2022 to the 2 October 2023. Therefore,
underperformance payments will not apply until 2022/23. The sources of information required
for the measurement and tracking of this Performance Commitment are: -
• Tideway monthly reporting to the Interface Committee – For SCCD target date for the
Performance Commitment
• TWUL Level 1 Programme PAWS 5c – For Integrated Operating Plan Completion
• TWUL Level 1 Programme – For Construction completion forecasts
• LTT Requirement Document – For Critical Asset Definition of Integrated Operating
Requirements
• Critical Asset Grid – For Forecast Critical Asset Sufficient Readiness Dates and Critical
Asset Notice status
• Tideway Certification Process – For Compliance of Asset with Interface Agreement
obligations for Critical Asset readiness.
The method statement includes a process diagram that illustrates the process for establishing
and then approving readiness of TWUL assets for the operation of the London Tideway
Tunnels system (LTT). The process is split into 4 distinct stages and obligations are contained
within the Interface Agreement, Liaison Agreement, Joint Approach Agreement to Handover
and Acceptance and PR19 Final Determinations Thames Water Performance Commitment
Appendix . These stages are:
1. Integrated Operating Plan
2. Critical Asset Status Assessment
3. Critical Asset Reporting
4. Certification
Performance commitment EWS01: Enhancing biodiversity
Unit of measure Biodiversity units to zero decimal places
Boundaries None
Reporting criteria
This measure is the cumulative net gain in biodiversity units at the company’s 253 sites of
biodiversity interest (SBIs) plus any net change from additional land where specific
biodiversity offsetting measures have been implemented from 1 April 2020.
Biodiversity units are as defined by the Defra Offsetting Metric. Calculation of biodiversity
units is done through application of the Defra Biodiversity Offsetting tool. Net gain is
measured by comparing the total biodiversity units at Thames Water's 253SBIs at the end of
2019/20 to the total biodiversity units at the 253 SBIs plus any net change from additional

Thames Water Reporting Criteria
Annual performance report 2020-21
33
31 March 2021. Version 1.0
land where specific biodiversity offsetting measures have been implemented at the end of
2024/25.
The latest version of the Biodiversity Offsetting Tool available will be applied for each
year of assessment, with the original baseline position rescored using the same tool for
consistency and direct comparison wherever the scoring system has changed.
Biodiversity Net Gain (BNG) assessment for the year ending 31 March 2021 has been
performed by AECOM Ltd (third party) commissioned by Thames Water. The purpose of the
assessment is to quantify the increase of biodiversity units across 61 of its Sites of
Biodiversity Interest (SBI) where habitat enhancement measures have been put in place on
site to improve the biodiversity value of the habitats. The BNG assessment has been
undertaken using Thames Water Net Gain Assessment Tool produced by AECOM in 2018.
The assessment involves making a comparison between the biodiversity value of habitats
present for each site prior to works (i.e. the ‘baseline’) and following the enhancement works
(i.e. ‘post intervention’).
Performance commitment EWS02: Smarter water catchment initiatives
Unit of measure Number of catchments to zero decimal places
Boundaries None
Reporting criteria
Number of catchments that have an agreed catchment plan (which extends for at least 10
years) created in collaboration with the company’s partners for each catchment as evidenced
by formal support by relevant stakeholders and delivery of the actions set out in the
catchment plan for the relevant reporting year. The term ‘partner’ used in the AMP7 Final
Determination refers to the external ‘steering group members’.
Delivery of the company’s smarter water catchments initiative to undertake whole-river
catchment interventions designed to address multiple environmental issues simultaneously.
Initiatives will be delivered in partnership with at least one other organisation within the
company’s operational area.
The company has identified three river catchments (Crane, Evenlode and Chess) where it
considers there are multiple environmental challenges or issues that have relevance to its
activities and in which the company has already have established working relationships with
local stakeholders and catchment partnerships.
Thames Water will publish assurance by an appropriately qualified external third party that:
• all appropriate stakeholders in a catchment have been approached to be engaged in the
partnership in each catchment;
• all partners agreed to the catchment management plan;
• all actions have been delivered in the report year; and
• the contribution by other organisations delivered additional benefit.
Performance commitment EWS03: Renewable energy produced
Unit of measure Gigawatt hours (GWh) to zero decimal places
Boundaries None
Reporting criteria
The measure is the Gigawatt hours (GWh) of renewable energy produced from the
company’s operational business.

Thames Water Reporting Criteria
Annual performance report 2020-21
34
31 March 2021. Version 1.0
The aim of the measure is for the company to increase the amount of renewable energy
(electricity, heat and gas) produced from its operational business. Renewable energy comes
from sources such as biofuel, biomass/biogas, geothermal, hydropower, solar energy, tidal
power, heat and wind power.
The company will measure the gross and net output of each of its renewable generators using
smart metering which meets the Elexon Code of Practice 4 (CoP4) industry standard. The
methodology for reporting all renewable energy generation is defined by the industry standard
UK Water Industry Research Ltd (UKWIR) Carbon Accounting Workbook published on 8 May
2019.
Performance commitment ET07: Managing early handback of Tideway project land
Unit of measure Number of months to zero decimal places
Boundaries None
Reporting criteria
The measure is the number of months early that the company receives land back from
Tideway once necessary works related to the Thames Tideway Tunnel have been completed.
This performance commitment is aligned to the Joint Approach to Handover and System
Acceptance (the ‘Joint Approach’) agreed between Thames Water and Tideway in April
2019, which divides 21 sites into 90 handback areas.
The list of relevant handback areas as an annex to the PR19 final determinations: Thames
Water – Outcomes performance commitment appendix:
https://www.ofwat.gov.uk/publication/pr19-final-determinations-thames-water-outcomes-
performance-commitment-appendix/
It includes 87 handback areas instead of 90 as listed in the Joint Approach agreed between
Thames Water and Tideway because three areas relating to Dormay Street are not intended
to be handed back.
It has been agreed that the target date for handback of each of the handback areas will be
three full months after that area has been certified as being ready for handback. The actual
target date will, in all cases, be three full months after certification, whenever certification
occurs. Outperformance payments will apply based on the number of full months before the
target date that the land is received by the company. The company will have one full month
after the target date before underperformance payments apply. Underperformance payments
will therefore apply based on the number of full months after one full month after the target
date that the land is received by the company.
This performance commitment is measured by the net total number of full months before the
target date for each handback area that the company accepts the land. This means that the
company will report the total number of months before the target date for each handback
area that the company receives the land less the total number of months after one month
after the target date for each handback area that the company receives the land. On this
basis, performance commitment levels can be negative.

Thames Water Reporting Criteria
Annual performance report 2020-21
35
31 March 2021. Version 1.0
Section 3C: Customer Measure of Experience (C-MeX)
The following Reporting Criteria are used for customer measure of experience.
Performance commitment AR01: C-MeX
Unit of measure Score out of 100 to two decimal places
Boundaries The following exclusions are applied to the data submitted to
Agent:
a) outbound contacts;
b) deceased customers;
c) non-customer Contacts;
d) non-household or private network customers;
e) developer services;
f) ex-directory;
g) wrong numbers - contacts from customers who have
contacted Thames Water when they should have contacted
another organisation;
h) contractor 0.5% rule - customer contacts from external
service providers who take less than 0.5% of total calls for a
business unit;
i) Feedback requests - customer contacts that are returned
on or alongside company requests for feedback or surveys;
j) for social media postings, customer comments exclusively
about another customer’s posting should not be included;
k) enquiries from CCWater on behalf of a customer; and
l) Ofwat DNCs.
Reporting criteria
This measure is the customer measure of experience (C-MeX) and is a measure of customer
satisfaction.
A company’s C-MeX score is calculated as the weighted average of customer satisfaction
(CSAT) scores from customer service (CS) and customer experience (CE) surveys. The
customer measure of experience is a customer satisfaction survey of a randomly selected
sample of a company’s overall residential customer base which asks them how satisfied they
are with their company and the customer measure of satisfaction is a customer satisfaction
survey of a sample of residential customers who have contacted their company which asks
them how satisfied they are with how the company has handled their issue.
C-MeX score is calculated as 50% ∗ CS-𝐶𝑆𝐴𝑇 + 50% ∗ 𝐶𝐸-𝐶𝑆𝐴𝑇
Thames Water is notified via email to the nominated individual(s) by 1000hrs on the Monday
morning of the week following the designated period. All inbound customer contacts for the
previous week are provided to Accent, via the online portal, by 1700hrs on Tuesday of the
same week. This includes all contact methods on digital and non-digital channels (including
where digital contacts made where an email address is not present, and non-digital contacts
made where a telephone number is not present). The channel sources offered by Thames are
CIS, CRM, Social Media, RightNow, Spring, Webchat and OAM. Customers who opted as
DNC for Thames Water are submitted to Ofwat agent in line with C-MeX guidance. Only
customer contacts who are opted for DNC for Ofwat are excluded. Contacts received by third
parties and contractors working on behalf of the Thames Water (i.e. Advantis, Moorcroft etc)

Thames Water Reporting Criteria
Annual performance report 2020-21
36
31 March 2021. Version 1.0
are also included (if volume is above 0.5% of total volume received by Thames) in line with
Ofwat guidance.
The company will provide a statement that confirms whether the company offered at least five
communication channels for receiving customer contacts and complaints and at least three
online channels throughout the reporting year.

Thames Water Reporting Criteria
Annual performance report 2020-21
37
31 March 2021. Version 1.0
Section 3D: Developer Measure of Experience (D-MeX)
The following Reporting Criteria are used for developer measure of experience.
Performance commitment AWS01: D-MeX
Unit of measure Score out of 100 to two decimal places
Boundaries In line with Ofwat guidance, the following can be excluded
from the qualitative submission for D-Mex:
a) Ofwat DNCs'
b) Transactions where there is an ongoing dispute with the
customer of such severity that approaching the customer to
take part in a survey may not be appropriate.
https://www.ofwat.gov.uk/wp-content/uploads/2020/03/D-
MeX-guidance-for-2020-25.pdf
Reporting criteria
D-MeX is a measure of customer satisfaction. A company’s overall D-MeX score is calculated
from two components that contribute equally:
• qualitative D-MeX score, based on the ratings provided by developer services customers
who transacted with the company throughout the reporting year to a customer
satisfaction survey; and
• quantitative D-MeX score, based on the company’s performance against a set of
selected Water UK performance metrics throughout the reporting year.
The survey results which are used to calculate the qualitative component of the company’s D-
MeX score will be supplied by a survey agent appointed by Ofwat. This is supplied out of 100
to form the score for the qualitative component of D-MeX.
The set of Water UK performance metrics which are used to calculate the quantitative
component of the company’s D-MeX score, are set out in the link below. Note that there was
a change in the metrics reported in October 2020. Therefore, the document below shows the
set of metrics reportable from 1 April to 30 September 2020 and 1 October 2020 to 31
March 2021. Therefore, the overall D-MeX score comprises of the results from both halves of
the year.
https://www.ofwat.gov.uk/wp-content/uploads/2020/07/Changing-the-Water-UK-metrics-in-
D-MeX-our-decisions.pdf
The Water UK metrics are designed to measure compliance against Levels of Service (LoS)
to customers. Each metric has a target cycle time which is set by Water UK, these are
measured from the receipt of the application or the relevant date where all payments and
information has been received. Compliance is calculated using the total completed within
target divided by the total completed in period. These metrics apply to both waste and clean
water journeys provided by the Developer Services & Wholesale Market Services
Departments. For each metric, a percentage is reported and a simple average of these
metrics is taken. This is rescaled to be out of 100 to form the score for the quantitative
component of D-MeX.
The company will report the process the company has taken to assure itself that its
performance against the selected Water UK metrics in D-MeX are an accurate reflection of its
underlying performance in the reporting year, and any findings that indicate this is not the
case.
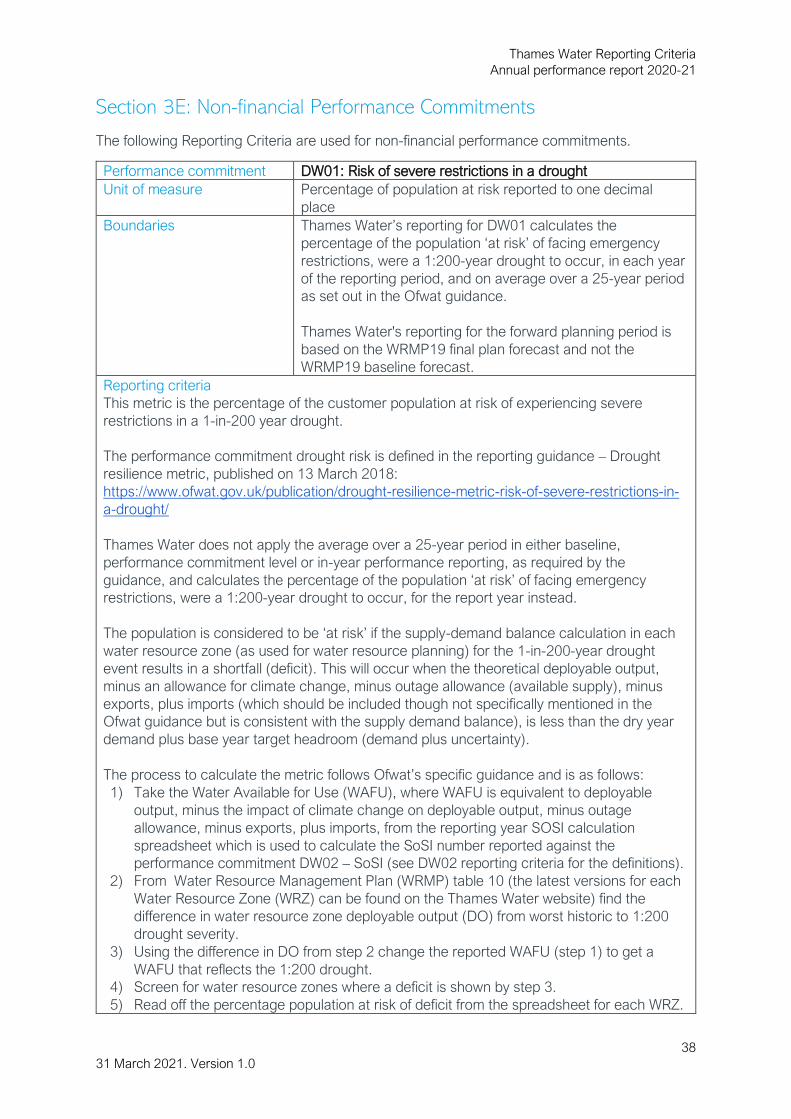
Thames Water Reporting Criteria
Annual performance report 2020-21
38
31 March 2021. Version 1.0
Section 3E: Non-financial Performance Commitments
The following Reporting Criteria are used for non-financial performance commitments.
Performance commitment DW01: Risk of severe restrictions in a drought
Unit of measure Percentage of population at risk reported to one decimal
place
Boundaries Thames Water’s reporting for DW01 calculates the
percentage of the population ‘at risk’ of facing emergency
restrictions, were a 1:200-year drought to occur, in each year
of the reporting period, and on average over a 25-year period
as set out in the Ofwat guidance.
Thames Water's reporting for the forward planning period is
based on the WRMP19 final plan forecast and not the
WRMP19 baseline forecast.
Reporting criteria
This metric is the percentage of the customer population at risk of experiencing severe
restrictions in a 1-in-200 year drought.
The performance commitment drought risk is defined in the reporting guidance – Drought
resilience metric, published on 13 March 2018:
https://www.ofwat.gov.uk/publication/drought-resilience-metric-risk-of-severe-restrictions-in-
a-drought/
Thames Water does not apply the average over a 25-year period in either baseline,
performance commitment level or in-year performance reporting, as required by the
guidance, and calculates the percentage of the population ‘at risk’ of facing emergency
restrictions, were a 1:200-year drought to occur, for the report year instead.
The population is considered to be ‘at risk’ if the supply-demand balance calculation in each
water resource zone (as used for water resource planning) for the 1-in-200-year drought
event results in a shortfall (deficit). This will occur when the theoretical deployable output,
minus an allowance for climate change, minus outage allowance (available supply), minus
exports, plus imports (which should be included though not specifically mentioned in the
Ofwat guidance but is consistent with the supply demand balance), is less than the dry year
demand plus base year target headroom (demand plus uncertainty).
The process to calculate the metric follows Ofwat’s specific guidance and is as follows:
1) Take the Water Available for Use (WAFU), where WAFU is equivalent to deployable
output, minus the impact of climate change on deployable output, minus outage
allowance, minus exports, plus imports, from the reporting year SOSI calculation
spreadsheet which is used to calculate the SoSI number reported against the
performance commitment DW02 – SoSI (see DW02 reporting criteria for the definitions).
2) From Water Resource Management Plan (WRMP) table 10 (the latest versions for each
Water Resource Zone (WRZ) can be found on the Thames Water website) find the
difference in water resource zone deployable output (DO) from worst historic to 1:200
drought severity.
3) Using the difference in DO from step 2 change the reported WAFU (step 1) to get a
WAFU that reflects the 1:200 drought.
4) Screen for water resource zones where a deficit is shown by step 3.
5) Read off the percentage population at risk of deficit from the spreadsheet for each WRZ.

Thames Water Reporting Criteria
Annual performance report 2020-21
39
31 March 2021. Version 1.0
For this performance commitment, the position for AMP7, based on Thames Water's current
WRMP, is that London will be in 1:200 deficit, and all the other WRZs will not be. Given that
this is the case, Thames Water's performance in relation to the target will be dependent on
London’s population as a proportion of our whole company population. Thames Water's
current assumption is that population growth will be in line with our WRMP 2019 forecast.
The certainty grade has been assigned based on an assessment taken from the Atkins
Confidence Grading Assessment guidance. It is made up of two parts:
1. The methodological rigour or sophistication of the drought definition process; and
2. Risk score – which is how close each company may come to implementing restrictions.
For the first element Thames Water has selected an overall company level grading of C
because all WRZs apart from London have a classification of C. London has been assigned
category A because a sophisticated and comprehensive stochastic based analysis has been
undertaken for this WRZ. Although London is the largest WRZ comprising approximately 70%
of the company population, we have chosen to assign an overall classification of C as this is
what is applied to the majority of our WRZs.
For the risk score we have applied the methodology set out in Drought resilience metric
guidance, published y Ofwat on 13 March 2018.
Performance commitment AR06: Priority services for customers in vulnerable
circumstances
Unit of measure PSR reach: percentage of applicable households, reported to
one decimal place.
Actual contacts: percentage of applicable households,
reported to one decimal place.
Attempted contacts: percentage of applicable households,
reported to one decimal place.
Boundaries On PSR Data-Checking, it is appropriate to exclude
households that have been added within the last two years on
the company’s PSR. This is because these entries should be
up to date and therefore we would not expect companies to
attempt to contact households until after they have been on
the PSR for over two years.
The reporting of PSR measures is done at a household level.
Multiple occupiers within our PSR will only count each
household once when reporting this data line and Thames
Water will report individuals separately.
Reporting criteria
This performance commitment is defined in the following reporting guidance:
https://www.ofwat.gov.uk/publication/pr19-draft-determinations-reporting-guidance-common-
performance-commitment-for-the-priority-service-register/

Thames Water Reporting Criteria
Annual performance report 2020-21
40
31 March 2021. Version 1.0
The Priority Services Register (PSR) performance commitment measures the number of
households on the company’s PSR as a proportion of all households in the company’s region.
This performance commitment consists of the following criteria:
● PSR Reach: This is defined as the percentage of households that the company supplies
with water and/or wastewater services which are registered on the company’s PSR. This is
calculated as follows:
(Number of households on the PSR as at 31 March 2021 / Total number of households
served as at 31 March 2021) x 100
● PSR Actual Contacts: This is defined as the percentage of distinct households on the PSR
that the company has actually contacted over a two-year period.
This is calculated as follows:
(Distinct households on the PSR where the company had actual contact over a two-year
period as at 31 March 2021 / Total number of households on the PSR over a two-year period
as at 31 March 2021) x 100
An ‘actual contact’ refers to a circumstance where the company has made a proactive
attempt to engage with a customer in a household on the PSR, and has received a response
which has allowed it to re-confirm personal information and update its PSR where necessary,
to improve the accuracy of customer data that it holds. It also includes instances where
Thames Water has received confirmation from a third party that a customer in a household on
the PSR has been contacted, and the refreshed information is used by the company to
update its own records.
● PSR Attempted Contacts: This is defined as the percentage of distinct households on the
PSR that the company has attempted to contact over a two-year period. This is calculated as
follows:
(Distinct households on the PSR which the company has attempted to contact over a two-
year period as at 31 March 2021 / Total number of households on the PSR over a two year
period as at 31 March 2021) x 100
An 'attempted contact' is defined as a ‘proactive attempt’ to engage with a customer in a
household on the PSR, or a representative of the customer, (for example, their attorney or
nominated third party contact) to establish whether they are still receiving the right support’.
Attempted contact volumes include actual contact volumes. This also applies to customer
updates made on a reactive basis, where the customer makes contact with the company. If
no actual contact is made then two proactive contacts on Thames Water's behalf by email,
letter, SMS or phone will count as an attempted contact.
Thames Water consider the changes in the following data fields in the billing system to count
towards the actual contact target as this data supports the delivery of a tailored priority
service:
• Address
• Phone number
• Priority Service Circumstance
• Priority Service Services

Thames Water Reporting Criteria
Annual performance report 2020-21
41
31 March 2021. Version 1.0
• Alternative contact details
• Date of confirmation, where no change confirmed to these details
Thames Water provide the following information as part of their commentary to Ofwat:
● PSR Reach: Thames Water will present PSR membership by separately reporting annual
figures for households registered to receive support through PSR services for a)
communication, b) support with mobility and access restrictions, c) support with supply
interruption, d) support with security, and e) support with other needs. Where a company has
provided ‘support with other needs’ the company will explain what types of needs have been
included in this category.
● PSR Data-Checking: Thames Water will report the number of households added and
removed from the PSR if the data is not available on the number of individuals. Where
possible, the company reports the corresponding figure for individuals alongside this.
Performance commitment DS01: Risk of sewer flooding in a storm
Unit of measure Percentage of population at risk, reported to two decimal
places.
Boundaries Exclusions are as defined in the guidance
Reporting criteria
Risk of sewer flooding in a storm is defined within the guidance titled, Reporting guidance –
Risk of sewer flooding in a storm, published on 4 April 2019:
https://www.ofwat.gov.uk/publication/reporting-guidance-risk-of-sewer-flooding-in-a-storm/
This measure will record the percentage of the region’s population at risk from internal
hydraulic flooding from a 1 in 50-year storm, based on modelled predictions.
Performance commitment AR05: Percentage of satisfied vulnerable customers
Unit of measure Percentage to zero decimal places
Boundaries None
Reporting criteria
This is a measure of how satisfied vulnerable customers on the company’s PSR are with the
services they receive.
The performance is measured for the reporting year (1 April 2020 - 31 March 2021) using the
existing Rant and Rave survey, which captures customer satisfaction ratings (CSAT).
Responses are extracted from those customers on the Priority Services Register (PSR).
There are 5 responses as follows:
• very satisfied,
• satisfied
• neither satisfied nor dissatisfied
• unsatisfied
• very unsatisfied
For the purposes of the measure, only those who respond that they are “very satisfied” or
“satisfied” will be counted toward the total.

Thames Water Reporting Criteria
Annual performance report 2020-21
42
31 March 2021. Version 1.0
The survey should be planned and carried out following social research best practice, for
example any sections of a relevant code such as that published by the Market Research
Society. The sample size should be selected to give a reasonable statistical significance for
the purpose of the performance commitment.
Performance commitment AWS02: Proactive customer engagement
Unit of measure Number of contacts to zero decimal places
Boundaries The Net Promoter Score (NPS) measure per the Final
Determination is no longer in use. This is due to the
introduction of the C-Mex measure being used to measure
customer satisfaction and engagement.
Reporting criteria
This measure is the total number of proactive customer contacts in the reporting year (1 April
2020 - 31 March 2021). The measure is calculated as the total of the following types of
customer contacts:
• households who receive a smarter home visit;
• business premises receiving a smarter business visit;
• households which actively participate in the Greenredeem scheme;
• schools receiving a water audit;
• customers receiving a customer visit as a result of abnormal water usage patterns;
• lead communication pipes replaced, including contact with the customer on the potential
health impacts of lead customer owned pipes and plumbing; and
• wastewater behaviour campaigns - generated off a range of proactive demand reduction
activities, including smarter home and business visits, smart meter data and digital
customer engagement / campaigns.
Virtual smarter home and education visits are included in this measure.
The company will report each of the sub-measures separately for transparency and will at
least once during the five-year period publish a report to assess the benefits resulting from
the performance commitment, as far as possible based on primary evidence. This will include
the relative success of different activity types and approaches. The company should also
consider other ways to share learning with other companies and wider stakeholders.
Performance commitment BW11: Responding to major trunk mains bursts
Unit of measure Average lost time per customer in hours:minutes:seconds
Boundaries The performance measure only accounts for interruptions
greater than or equal to 3 hours in duration. Any interruptions
less than 3 hours are excluded from the measure.
Reporting criteria
This measure relates to the average number of minutes lost per customer for the whole
customer base for water supply interruptions that lasted three hours or more in the financial
year (1 April 2020 - 31 March 2021) where the cause is identified as failure of a trunk main (≥
18"). The metric can be calculated as follows:
The average number of minutes are as defined in BW03: Water supply interruptions but are
only included for those interruptions where the cause is identified as failure of a trunk main (≥
18").

Thames Water Reporting Criteria
Annual performance report 2020-21
43
31 March 2021. Version 1.0
Performance commitment ER03: Households on the Thames Water social tariff
Unit of measure Number of households to zero decimal places
Boundaries None
Reporting criteria
The measure is the number of households on the company’s new enhanced tiered social tariff
at the end of the financial year, billed directly and indirectly. This includes all discount bands
within the new social tariff (including the bandings for 25%, 50% or 75% reductions) and
customers who have not yet been transferred to the new scheme but receive reduced tariffs
from pre-existing legacy schemes such as Watersure+.
The number reported comprises of:
1. The volume of customers receiving financial assistance through WaterHelp who are
directly billed, or indirectly billed via a Local Authority or Housing Association (LAHA), for
wastewater and water, or water only service.
2. The volume of customers receiving financial assistance through WaterHelp who are
indirectly billed by WOC and WASC companies on our behalf.
Performance commitment ET02: Effective stakeholder engagement
Unit of measure The score to one decimal place.
(The score attained is a simple average of scores from
interviewees)
Boundaries None
Reporting criteria
This measure relates to the effectiveness of engagement activities with key stakeholders in
the Thames Tideway Tunnel (TTT) project at 31 March 2021. The main objective of this
engagement is to gain regular and impartial understanding and monitoring of key
stakeholders’ views on the company’s performance and interaction on the TTT project. The
surveys are carried out by an appropriately qualified external third-party stakeholder research
company. The stakeholders are:
• Bazalgette Tunnel Limited (Tideway);
• the Environment Agency (EA);
• the Department for Environment, Food and Rural Affairs (DEFRA);
• the Independent Technical Assessor (ITA); and
• the Consumer Council for Water (CCWater).
The average score of responses to the survey is determined based on the following scale:
• 6 – extremely well;
• 5 – very well;
• 4 – quite well;
• 3 – quite poorly;
• 2 – very poorly; or
• 1 – extremely poorly.

Thames Water Reporting Criteria
Annual performance report 2020-21
44
31 March 2021. Version 1.0
Performance commitment ET05: Establish an effective system operator for the London
Tideway Tunnels
Unit of measure Percentage completion to zero decimal places
Boundaries None
Reporting criteria
This measure is the percentage completion of the development of the organisational design
and of the systems and capability required to deliver the London Tideway Tunnels Operating
Techniques (LTTOT). This performance commitment includes the development of the
management system and associated operational team for the LTTOT by 31 March 2022, on
the current SCCD of 17 October 2022. If the SCCD changes, the date of 31 March 2022 will
also change to a date 6 months before the revised SCCD.
The following key enablers will need to have been delivered or substantially progressed in
order to secure the achievement of this performance commitment:
System set-up and procedures:
• Development of written documents required for Tideway’s System Commissioning Plan;
• Development of the management system for O&M of the London Tideway Tunnels
system;
• Plan for engagement with the EA on the Operating Techniques and securing any further
required Environmental Permits for CSOs;
• Asset management plans including criticality analysis.
Organisational readiness:
Establishment of the system operator team for the London Tideway Tunnels.
Organisational design confirmed, and recruitment progressed to support training prior to
System Commissioning Commencement. The benchmark for this organisational capability
and capacity shall be defined by a management system that can be externally assessed as
progressing towards certification under a suitable international standard for an appropriate
management system (such as ISO14001 or similar).
The SCCD has been changed from 17 October 2022 to the 2 October 2023. Therefore, the
target date for the development of the management system and associated operational team
for the LTTOT is now 31 March 2023. The source of information for this Performance
Commitment is the TWUL Thames Tideway Tunnel Level 1 Programme. An update of the One
LTT Integrated Management System Implementation Programme is provided Monthly by the
Integrated Management System Development Manager. The plan is consolidated within the
overall programme and when complete is approved by the System Operator project
manager. Other sources are provided by the Progressive Assurance Workstreams.
A baseline is established for the activities within the System Operator plan. Each individual
activity is then progressed monthly and the Percentage of Completion (POC) of the Plan
being reported against the established baseline to achieve the target dates specified with the
Performance Commitment. The forecast System Commissioning Commencement Date
(SCDD) is provided quarterly by Tideway. Agreed change to the SCCD triggers a revised
target for completion of the activities associated with this Performance Commitment.
Progress is assessed against each item with POC determined against key milestones. Overall
completion percentage is calculated using the table noted in the method statement.

Thames Water Reporting Criteria
Annual performance report 2020-21
45
31 March 2021. Version 1.0
Performance commitment ET06: Maximising the value of Tideway project land sales
Unit of measure £m to one decimal place
Boundaries The measure excludes any sites not included in the 12 plots
scheduled to be sold in the 2020-25 period.
Reporting criteria
The measure is the total net profit or loss made on the actual sale of any of the 12 plots
related to the Thames Tideway Tunnel project that are scheduled to be sold in the 2020-25
period.
This is the difference between the baseline value and sale value (or net proceeds) of each
plot subject to adjustments.
The net profit or loss per plot is defined as:
Net profit or loss = net proceeds - baseline value
The net proceeds are the proceeds from the sale of the relevant plot after adjusting for the
costs, receipts and savings reasonably attributable to or connected with the relevant disposal
which shall include associated costs related to the Project Land, such as compensation and
mitigation costs, to the extent that such costs, receipts and savings were not previously
allowed for when a Relevant Determination was made.
The baseline value is defined as:
Baseline value = (P * A)
• P = the percentage of land that is sold. This is the £m value of the land that is sold
divided by the £m value of the land that is sold plus the £m value of the land that is not
sold.
• A = the acquisition price paid by the company when acquiring the plot (in £m).
The company will report its performance as the sum of the net profit or loss of all plots sold in
that year. No adjustment is made for inflation within this performance commitment.
The surplus land acquired to date and scheduled for disposal in the 2020-25 period is as
follows:
• Camelford House, Albert Embankment
• Chambers Wharf, Bermondsey
• Whiffin Wharf, Carnwath Riverside
• Carnwath Industrial Estate, Carnwath Riverside
• Cringle Wharf, Kirtling Street
• 80 Kirtling Street, Battersea
• 2a Battersea Park Road, Battersea
• 88 Kirtling Street (ex V&A Stores)
• 8 Brooks Court, Battersea
• 1 Brooks Court, Battersea
• Oyster Pier, Mooring berths 1, 2 & 3
• Oyster Pier, Mooring berths 5 & 6

Thames Water Reporting Criteria
Annual performance report 2020-21
46
31 March 2021. Version 1.0
Performance commitment EWS04: Natural Capital Accounting
Unit of measure Percentage to one decimal place
Boundaries None
Reporting criteria
This measure is the percentage of the company’s landholdings, as a percentage of total
appointed business landholdings, where natural capital stocks are assessed and reported
publicly at 31 March each year. The company measures and reports the amount of natural
capital it has at its sites. Natural capital may include stocks of species, ecological
communities, soils, freshwaters, land and minerals.
WSP (third party) was appointed to perform a natural capital assessment for 100% of Thames
Water's land holdings. The scope of this natural capital assessment covers all Thames Water
land holdings which comprises many small to medium-sized sites across large parts of
Greater London, Luton, the Thames Valley, Surrey, Gloucestershire, Wiltshire and Kent.
Thames Water owns a variety of sites including reservoirs, water treatment works,
recreational sites and nature reserves covering an area of just over 6,500 hectares.
The natural capital concept chosen for this assessment essentially describes the natural
environment in the surroundings as a valuable resource or range of assets all people and
businesses depend upon. Natural capital is the sum of Thames Water's ecosystems, species,
freshwater, land, soils, minerals, air and seas. These natural capital assets provide people
with valuable goods and services, called ecosystem services, which include food, clean air
and water, wildlife, energy, wood, recreation and protection from hazards. The results of the
assessment were presented in a report from WSP to Thames Water, which shows the list of
all site names assessed, their respective areas (ha) and the aggregated scores for each of
the ecosystem services identified. The reporting figure in the APR is based on the results
noted in the report.
Performance commitment AR07: BSI standard for fair, flexible and inclusive services
Unit of measure Text (achieved or not achieved, or maintained or not
maintained)
Boundaries None
Reporting criteria
This measure assesses the quality of the company’s Priority Services Register scheme via the
British Standard for Inclusive Service Provision certification BS 18477.
To meet this performance commitment, the company must achieve the BS 18477 standard
by 2020-21 and maintain it for the rest of the period 2021-25. If this certification from BSI is
not in place on 31 March of the reporting year, the performance commitment has not been
met.
The performance commitment applies each reporting year, and demonstration that the
certification is in place must be tested and reported each reporting year. The BS 18477
certification is awarded by the BSI Group (also known as the British Standards Institution). In
the event that BSI Group cease providing certification for BS 18477 during the period 2020-
25, the company should adopt any standard designed to directly succeed the existing
standard. If one is not available, it will assess whether there exists other appropriate
standards that can be used as an alternative independently assessed indicator of the quality
of support for customers in vulnerable circumstances.

Thames Water Reporting Criteria
Annual performance report 2020-21
47
31 March 2021. Version 1.0
Performance commitment NEP01: Delivery of water industry national environment
programme requirements
Unit of measure Text stating either “met” or “not met”.
Boundaries No specific exclusions
For the 2020/21 reporting period, due to Covid-19, the
completion date for all schemes was extended from March to
September 2021. This was agreed with the EA.
Reporting criteria
This measure tracks the completion of required schemes in each year, as per the latest
WINEP programme published by DEFRA. If any scheme is not delivered by the time specified
in the WINEP tracker titled “Completion Date (DD/MM/YY)”, the company will report “not
met”. All WINEP schemes will be included including those reported under other performance
commitments.
The performance commitment measures against the latest WINEP tracker in the reporting
period (1 April 2020 - 31 March 2021) in which performance is being reported. Therefore,
performance for the reporting period is based on the latest WINEP programme on 31 March
2021 and the schemes which have been delivered by this date.
The company secures confirmation from the Environment Agency (EA) that performance has
been correctly reported. The view of the EA will be definitive. The company reports all
requirements that it has not met in its Annual Performance Report (APR) and set out any
interactions this performance measure has with any of its other performance commitments.
Performance commitment DWMP: Drainage and wastewater management plans
(DWMPs)
Unit of measure The cumulative percentage of catchments in which the
company implements the Level 1 water company DWMP,
reported to zero decimal places.
Boundaries None
Reporting criteria
A Drainage and Wastewater Management Plan (‘DWMP’) is a long-term, adaptive plan of
wastewater service, developed to provide a resilient service to our customers that protects
and enhances the environment. This measure relates to cumulative percentage of
catchments in which Thames Water operates, the company implements the Level 1 water
company DWMP in accordance with the guideline: A framework for the production of
Drainage and Wastewater Management Plans, published September 2018 and updated May
2019. Link to framework:
https://www.water.org.uk/policy-topics/managing-sewage-and-drainage/drainage-and-
wastewater-management-plans/
The percentage will be calculated as a simple average of the catchments that are completed
according to the guidelines and published divided by the total number of catchments and
expressed as a percentage.
Level 1 planning aims to provide a strategic, long-term plan for drainage and wastewater
resilience and associated investment over the plan period. Level 1 planning ties the Level 3
and Level 2 plans together resulting in:
• the baseline planning objectives,

Thames Water Reporting Criteria
Annual performance report 2020-21
48
31 March 2021. Version 1.0
• an assessment of risks and vulnerability of the drainage and wastewater systems,
• the actions proposed to mitigate those risks, and
• the investments necessary to deliver the outcomes identified.
Partnership working and collaborative planning involving the relevant stakeholders is one of
the key elements of developing DWMPs.
Performance commitment CC: Understanding the risk of flooding and level of resilience
within the Counters Creek catchment
Unit of measure Text stating either “met” or “not met”
Boundaries None
Reporting criteria
Performance on this measure will be “Met” or “Fail” and will be measured at the end of the
2023–2024 reporting year. There are two elements to this measure:
• by no later than the end of July 2023, the company must deliver a fully assured report,
for the Counters Creek catchment (the Report), which sets out its understanding of the
risk in the catchment and outlines its long-term strategy for alleviating flooding in the
area; and
• the company must report annually, via its annual performance report, on how it is
managing its network to ensure long-term resilience and reduce flood risk for customers,
and how it is progressively developing its understanding of flood risk in the catchment.
If the company is not able to deliver these two elements, the performance commitment will be
marked as, “Fail”. The Report must detail how the company will manage long term flood
alleviation in the catchment. It must outline the current risks as well as the long-term strategy
for the area. It must demonstrate how the company has developed a sufficient level of
understanding of the risk of flooding and level of resilience within the Counters Creek
catchment to provide confidence in its proposals.
It is expected that the company will undertake a holistic approach, giving due consideration to
the full spectrum of risks, maintenance activities and potential solutions available to deliver
long term customer value.

Thames Water Reporting Criteria
Annual performance report 2020-21
49
31 March 2021. Version 1.0