THAILAND Initial Household Survey, 2005 Minister of Finance
171
THAILAND Initial Household Survey, 2005 Minister of Finance Data Summary
Transcript of THAILAND Initial Household Survey, 2005 Minister of Finance

THAILAND Initial Household Survey, 2005
Minister of Finance
Data Summary

Minister of Finance Initial Household Survey 2005
2
Thailand Initial Household Survey, 2005
Minister of Finance
Index
Section I. Household ID ................................................................................................................. 3 Section II. Risk Response ............................................................................................................... 6 Section IV. Household Composition ............................................................................................... 10 Section V. Occupation ................................................................................................................... 14 Section VI. Occupational History .................................................................................................... 18 Section VII. Children Living Outside the House .............................................................................. 20 Section VIII. Residential Patterns ..................................................................................................... 25 Section IX. Parents’ characteristics ................................................................................................ 38 Section X. Inheritance ................................................................................................................... 47 Section XI. Household Assets ........................................................................................................ 50 Section XII. Agricultural Assets ....................................................................................................... 59 Section XIII. Household Business .................................................................................................... 69 Section XIV. Housing and Landholdings .......................................................................................... 73 Section XV. Expenditure .................................................................................................................. 82 Section XVI. Income ......................................................................................................................... 86 Section XVII. Borrowing ................................................................................................................... 121 Section XVIII. Lending ...................................................................................................................... 127 Section XIX. Savings ...................................................................................................................... 132 Section XX. General Questions ..................................................................................................... 146 Section XXI. Hypothetical Situation ................................................................................................ 148 Section XXII. Institutions and organizations .................................................................................... 150

Minister of Finance Initial Household Survey 2005
3
Total number of households surveyed by province
Province Freq. Percent Cum. Chachoeng 240 16.7 16.7Buriram 240 16.7 33.3Lop Buri 240 16.7 50.0Sisaket 240 16.7 66.7Phrae 240 16.7 83.3Satun 240 16.7 100.0Total 1,440 100.0
Section I. Household ID
Relationship of respondent to the head of the households (CVR7)
Relationship to head Chachoeng Buriram Lop Buri Sisaket Phrae Satun Total Head 66.7 69.6 71.7 52.5 64.6 48.8 62.3 Spouse 25.0 25.4 21.7 38.8 29.2 41.7 30.3 Brother or sister 1.3 1.3 0.4 0.4 0.4 0.4 0.7 Son or daughter 5.4 2.9 3.3 5.4 3.8 6.7 4.6 Son or daughter-in-law - 0.4 0.8 2.1 - - 0.6 Grandchild - - 0.8 - 0.4 - 0.2 Parent 1.3 - 1.3 - 1.3 2.1 1.0 Other relation & hh member 0.4 0.4 - 0.8 0.4 0.4 0.4 Not hh member - - - - - - - Total 100.0 100.0 100.0 100.0 100.0 100.0 100.0 Obs. 240 240 240 240 240 240 1,440
Sex of respondent (CVR8)
Sex Chachoeng Buriram Lop Buri Sisaket Phrae Satun Total Male 32.5 25.0 29.2 29.2 30.4 38.8 30.8 Female 67.5 75.0 70.8 70.8 69.6 61.3 69.2 Total 100.0 100.0 100.0 100.0 100.0 100.0 100.0 Obs. 240 240 240 240 240 240 1,440

Minister of Finance Initial Household Survey 2005
4
How many years has the household head lived in the village? (CVR10)
Province Obs Mean Std. Dev. Min Max Chachoeng 240 34.4 18.3 1 91 Buriram 240 39.0 18.2 3 77 Lop Buri 240 29.1 16.7 1 71 Sisaket 240 36.3 18.6 1 90 Phrae 240 33.5 18.3 2 78 Satun 240 30.5 18.1 1 75 Total 1,440 33.8 18.3 1 91
Years Chachoeng Buriram LopBuri Sisaket Phrae Satun Total 0.01 to 10 11.7 7.1 17.5 8.8 12.5 16.3 12.3
10.01 to 20 15.8 14.6 20.8 16.3 17.9 20.8 17.7 20.01 to 30 17.1 14.2 19.6 17.5 14.6 17.1 16.7 30.01 to 40 19.6 15.4 18.3 16.3 17.5 17.1 17.4 40.01 to 50 16.3 19.6 11.3 16.7 17.9 12.5 15.7 50.01 to 60 12.1 16.3 8.8 14.2 13.3 9.2 12.3 60.01 to 70 4.6 10.0 3.3 6.3 5.0 5.8 5.8 Above 70 2.9 2.9 0.4 4.2 1.3 1.3 2.2
Total 100.0 100.0 100.0 100.0 100.0 100.0 100.0 Obs. 240 240 240 240 240 240 1,440
What is the current marital status of the household head? (CVR11)
Marital status of head Chachoeng Buriram LopBuri Sisaket Phrae Satun Total Never married 9.2 5.4 4.6 1.3 9.2 2.9 5.4 Married 62.1 75.0 69.6 75.4 70.8 82.9 72.6 Separated 6.7 3.8 6.7 3.3 3.3 1.3 4.2 Divorced 7.1 4.2 5.8 4.6 4.6 4.6 5.1 Widowed 15.0 11.7 13.3 15.4 12.1 8.3 12.6 Total 100.0 100.0 100.0 100.0 100.0 100.0 100.0 Obs. 240 240 240 240 240 240 1,440

Minister of Finance Initial Household Survey 2005
5
How many years has (or did) the household head’s spouse lived in the village? (CVR12)
Province Obs Mean Std. Dev. Min Max Chachoeng 211 27.4 17.9 0 76 Buriram 224 33.2 18.3 0 77 LopBuri 223 25.2 16.9 0 66 Sisaket 235 33.5 17.9 0 75 Phrae 213 29.4 17.2 0 72 Satun 224 26.5 17.0 0 74 Total 1,330 29.2 17.8 0 77
Years Chachoeng Buriram LopBuri Sisaket Phrae Satun Total 0.01 to 10 21.3 12.9 26.0 12.8 16.9 21.9 18.6
10.01 to 20 22.3 17.0 21.1 17.4 20.7 24.6 20.5 20.01 to 30 17.1 20.1 17.5 19.6 16.9 18.3 18.3 30.01 to 40 17.1 17.9 16.1 14.5 16.0 15.6 16.2 40.01 to 50 9.0 12.5 11.7 16.6 16.4 9.4 12.6 50.01 to 60 10.0 11.2 4.9 13.6 10.8 6.7 9.5 60.01 to 70 2.4 6.7 2.7 4.7 1.9 3.1 3.6 70.01 to100 0.9 1.8 0.0 0.9 0.5 0.4 0.8
Total 100.0 100.0 100.0 100.0 100.0 100.0 100.0 Obs. 211 224 223 235 213 224 1,330

Minister of Finance Initial Household Survey 2005
6
Section II. Risk Response
Of the last 5 years, what was the best year for household income? (RR1)
Best income year Chachoeng Buriram LopBuri Sisaket Phrae Satun Total Last year 5.0 13.8 12.1 16.3 3.3 26.7 12.8 Two years ago 5.8 11.7 10.8 15.8 3.3 6.3 9.0 Three years ago 6.3 14.6 7.5 17.5 1.7 3.8 8.5 Four years ago 5.8 14.2 10.0 6.7 1.3 2.5 6.7 Five years ago 8.3 20.0 14.6 10.0 1.3 7.5 10.3 No changes in income 68.8 25.8 45.0 33.8 89.2 53.3 52.6 Total 100.0 100.0 100.0 100.0 100.0 100.0 100.0 Obs. 240 240 240 240 240 240 1,440
Why? (RR2a)
First reason Chachoeng Buriram LopBuri Sisaket Phrae Satun Total Fire destroys house and equipment - - - - 3.8 - 0.1 Bad year for household business - - 0.8 - - - 0.1 Lower educational expenses - 1.1 - - - 0.9 0.4 Lower expenses for some other reason 12.0 14.0 16.7 1.9 - 9.8 10.3 Children finish school and go to work 13.3 3.4 6.8 8.2 - - 5.6 Children send money home 2.7 8.4 4.5 4.4 - - 4.4 Get a better main job 8.0 10.7 12.1 1.9 26.9 21.4 11.0 Have an additional occupation 16.0 7.9 9.1 11.9 7.7 1.8 8.9 High price for output 2.7 5.1 3.8 18.2 19.2 34.8 13.0 Good weather for farming - 3.4 - 8.2 - 1.8 3.1 High crop yield for another reason - 1.7 2.3 1.9 - 5.4 2.2 Able to borrow 1.3 5.1 3.0 10.7 3.8 1.8 5.0 High land prices - 1.1 0.8 - - - 0.4 Worked more days in current occupation 24.0 15.7 17.4 10.7 7.7 11.6 14.8 High demand for product 9.3 7.9 10.6 4.4 7.7 1.8 6.7 Other 10.7 14.6 12.1 17.6 23.1 8.9 13.8 Total 100.0 100.0 100.0 100.0 100.0 100.0 100.0 Obs. 75 178 132 159 26 112 682
Was this a good year for many of the households in the village? (RR3)
Chachoeng Buriram LopBuri Sisaket Phrae Satun Total Yes 28.0 24.7 38.2 11.9 44.4 48.7 29.4 No 72.0 75.3 61.8 88.1 55.6 51.3 70.6 Total 100.0 100.0 100.0 100.0 100.0 100.0 100.0 Obs. 75 178 131 159 27 113 683

Minister of Finance Initial Household Survey 2005
7
Of the last 5 years, what was the worst year for household income? (RR4)
Worst income year Chachoeng Buriram LopBuri Sisaket Phrae Satun Total Last year 23.3 47.5 46.7 23.8 6.3 15.0 27.1 Two years ago 7.9 8.8 11.7 15.4 2.5 6.3 8.8 Three years ago 6.3 8.8 8.8 12.1 1.7 12.9 8.4 Four years ago 3.3 5.8 3.8 10.4 0.0 9.6 5.5 Five years ago 3.8 10.0 7.1 10.8 2.1 7.9 6.9 No changes in income 55.4 19.2 22.1 27.5 87.5 48.3 43.3 Total 100.0 100.0 100.0 100.0 100.0 100.0 100.0 Obs. 240 240 240 240 240 240 1,440
Why? (RR5a)
First reason Chachoeng Buriram LopBuri Sisaket Phrae Satun Total Flood - 1.5 - 8.0 - 0.8 2.2 Not enough rainfall 0.9 6.7 3.7 10.3 - 3.2 5.3 Pets destroy crop - 1.0 - 0.6 - - 0.4 Crop yield low for some other reason 0.9 2.6 1.1 2.9 6.7 10.5 3.4 Fire destroys house and equipment - - 0.5 - - 0.8 0.2 Low price for output - 1.5 0.5 9.8 3.3 29.8 7.2 High input prices 7.5 6.7 10.7 4.6 10.0 4.8 7.1 Education expenses are higher 13.1 16.5 9.6 10.9 6.7 2.4 10.8 Need extra money for ceremony - 0.5 - - - - 0.1 Income lower because of retirement 1.9 3.1 4.3 1.7 3.3 0.8 2.6 High investment costs 21.5 17.0 18.7 13.8 10.0 8.1 15.7 High expenses because of illness 6.5 9.8 5.3 9.2 3.3 6.5 7.5 Building expenses are higher 0.9 0.5 1.1 0.6 - - 0.6 Death in family 4.7 2.6 1.6 1.1 - 1.6 2.1 Worked fewer days in current occupation 14.0 13.4 16.0 11.5 10.0 13.7 13.6 Bad year for household business 21.5 11.9 24.1 11.5 30.0 8.1 15.9 Lost money from gambling - - - 0.6 - - 0.1 Unable to repay debts 1.9 0.5 0.5 0.6 - 0.8 0.7 Lower expenses for some other reason - - - - - 0.8 0.1 Other 4.7 4.1 2.1 2.3 16.7 7.3 4.3 Total 100.0 100.0 100.0 100.0 100.0 100.0 100.0 Obs. 107 194 187 174 30 124 816

Minister of Finance Initial Household Survey 2005
8
Was this a bad year for many of the households in the village? (RR6)
rr6 Chachoeng Buriram LopBuri Sisaket Phrae Satun Total Yes 36.4 35.6 51.1 10.9 32.3 30.1 33.0 No 63.6 64.4 48.9 89.1 67.7 69.9 67.0 Obs. 100.0 100.0 100.0 100.0 100.0 100.0 100.0 Total 107 194 184 174 31 123 813
What did your household do in the worst year of the last five to get by? First most important reason (RR9a)
First most important Chachoeng Buriram LopBuri Sisaket Phrae Satun Total Sell/eat rice in storage - 6.2 - 14.9 - 4.0 5.3 Spend less on household items, food, etc. 22.4 12.4 11.2 4.6 13.3 12.9 11.9 Spend less on inputs 1.9 - 1.6 - - 0.8 0.7 Sell jewelry 1.9 - 2.1 1.7 - 1.6 1.3 Sell land - 1.5 - - - 1.6 0.6 Work harder than in a normal year 8.4 2.1 4.3 6.3 3.3 10.5 5.6 Do additional occupation 2.8 4.1 1.1 6.9 3.3 4.0 3.8 Use savings 26.2 33.5 9.6 14.4 43.3 37.1 23.9 Get help from government 0.9 - - - - - 0.1 Help from relatives in village (not money) 3.7 2.6 - 3.4 - - 1.8 Help from relatives in village (money) 2.8 3.1 0.5 2.3 3.3 0.8 2.0 Help from relatives out of village (not money) 0.9 - - 1.1 - - 0.4 Help from relatives out of village (money) 5.6 6.7 3.7 2.9 3.3 - 3.9 Help from non-relatives in village (not money) - 1.0 - 1.1 - 0.8 0.6 Help from non-relatives in village (money) 0.9 - - - - 0.8 0.2 Help from non-relatives out of village (money) - - - - - 1.6 0.2 Borrow from BAAC group members - - 0.5 - - - 0.1 Borrow from BAAC - 1.5 1.6 8.6 10.0 - 2.9 Borrow from supplier of inputs out of the village - 0.5 - - - - 0.1 Borrow from moneylender in village 2.8 3.1 0.5 - - 2.4 1.6 Borrow from moneylender out of village 0.9 1.5 1.1 - - - 0.7 Borrow from village store owner - 0.5 - - - - 0.1 Borrow from PCG - 0.5 0.5 - - 1.6 0.5 Borrow from village fund 7.5 12.9 56.7 22.4 13.3 15.3 24.6 Borrow from Agricultural cooperative - 0.5 - 1.7 - 3.2 1.0 Borrow from commercial bank 3.7 0.5 1.6 2.3 - 0.8 1.6 Migrate for 6 of more months for work - - - 0.6 3.3 - 0.2 Sell livestock or equipment - 1.0 0.5 1.7 - - 0.7 Other 6.5 4.1 2.7 2.9 3.3 - 3.2 Total 100.0 100.0 100.0 100.0 100.0 100.0 100.0 Obs. 107 194 187 174 30 124 816

Minister of Finance Initial Household Survey 2005
9
Livestock or equipment
What did you sell? (RR10a)
rr10a Chachoeng Buriram LopBuri Sisaket Phrae Satun Total Buffalo - - - 1.3 - - 0.2 Cows - 2.5 0.4 4.2 - - 1.2 Buffalo & cows - - - 0.4 - - 0.1 Pigs - 0.8 - 0.4 - - 0.2 Poultry - 0.4 0.8 - 0.4 - 0.3 Buffalo & poultry - 0.4 - - - - 0.1 Other 0.8 - - - - - 0.1 Total 0.8 4.2 1.3 6.3 0.4 - 2.2 Obs. 240 240 240 240 240 240 1,440
Did you sell more / the same / less than in a normal year? (RR10b)
rr10b Chachoeng Buriram LopBuri Sisaket Phrae Satun Total More 50.0 20.0 - 33.3 - - 25.8 Same - 30.0 - 13.3 - - 16.1 Less - 20.0 66.7 13.3 - - 19.4 In a normal year sell none 50.0 30.0 33.3 40.0 100.0 - 38.7 Total 100.0 100.0 100.0 100.0 100.0 - 100.0 Obs. 2 10 3 15 1 - 31
Did you sell earlier / same time / later than in a normal year? (RR10c)
rr10c Chachoeng Buriram LopBuri Sisaket Phrae Satun Total Earlier - 10.0 - 13.3 - - 9.7 Same time - 30.0 66.7 53.3 - - 41.9 Later 50.0 30.0 - - - - 12.9 In a normal year sell none 50.0 30.0 33.3 33.3 100.0 - 35.5 Total 100.0 100.0 100.0 100.0 100.0 - 100.0 Obs. 2 10 3 15 1 0 31
Migration
In a year when income is normal do any household members usually migrate to work for a period of less than 6 months? (RR11a)
rr11a Chachoeng Buriram LopBuri Sisaket Phrae Satun Total Yes 0.4 3.8 1.7 2.9 6.3 2.1 2.8 No 99.6 96.3 98.3 97.1 93.8 97.9 97.2 Total 100.0 100.0 100.0 100.0 100.0 100.0 100.0 Obs. 240 240 240 240 240 240 1,440

Minister of Finance Initial Household Survey 2005
10
Migration (Cont.)
In a year when income is normal do any household members usually migrate to work for a period of 6 or more months? (RR11b)
rr11b Chachoeng Buriram LopBuri Sisaket Phrae Satun Total Yes 2.9 7.9 4.6 5.0 17.9 7.5 7.6 No 97.1 92.1 95.4 95.0 82.1 92.5 92.4 Total 100.0 100.0 100.0 100.0 100.0 100.0 100.0 Obs. 240 240 240 240 240 240 1,440
Section IV. Household Composition Total number of household members (HC1)
Province Obs Mean Std. Dev. Min Max Chachoeng 240 4.4 2.3 1 15Buriram 240 4.4 1.7 1 12LopBuri 240 4.1 1.9 1 12Sisaket 240 4.6 1.9 1 12Phrae 240 3.5 1.5 1 9Satun 240 4.6 1.6 1 10Total 1,440 4.3 1.9 1 15
hh members Chachoeng Buriram LopBuri Sisaket Phrae Satun Total 1 6.7 1.7 4.2 1.3 6.3 0.4 3.4 2 13.8 9.2 14.6 10.0 21.3 4.6 12.2 3 19.2 20.8 19.2 19.2 22.9 17.1 19.7 4 17.5 25.8 25.4 26.3 27.5 32.5 25.8 5 17.5 22.5 17.9 14.6 12.9 23.3 18.1 6 8.3 11.7 8.3 11.7 5.8 9.2 9.2 7 9.2 2.5 5.8 9.6 2.5 7.9 6.3 8 2.1 3.8 2.1 4.2 0.4 2.1 2.4 9 3.3 0.8 1.3 2.1 0.4 1.7 1.6
10 1.7 0.8 0.4 0.4 - 1.3 0.8 11 - - 0.4 0.4 - - 0.1 12 - 0.4 0.4 0.4 - - 0.2 13 0.4 - - - - - 0.1 15 0.4 - - - - - 0.1
Total 100.0 100.0 100.0 100.0 100.0 100.0 100.0 Obs. 240 240 240 240 240 240 1,440

Minister of Finance Initial Household Survey 2005
11
How is each household member related to the household head? (HC3)
Relationship to household head Chachoeng Buriram LopBuri Sisaket Phrae Satun Total Head 22.9 22.9 24.1 21.9 28.4 21.6 23.5Spouse 14.4 17.4 17.1 16.7 20.1 18.0 17.2Brother or sister 3.3 2.3 3.3 0.6 2.0 2.2 2.3Son or daughter 33.5 32.7 32.8 33.2 30.5 45.5 34.9Son in law or daughter 2.8 4.6 2.9 5.5 2.1 2.6 3.5Grandchild 14.6 13.0 13.7 17.8 7.2 5.6 12.1Parent 3.5 2.7 3.5 1.5 3.8 3.3 3.0Other relation and household member 4.9 4.5 2.6 2.8 5.8 1.1 3.5Obs. 100.0 100.0 100.0 100.0 100.0 100.0 100.0Total 1,052 1,048 995 1,103 844 1,109 6,151
What is the sex of each household member? (HC4)
Sex Chachoeng Buriram LopBuri Sisaket Phrae Satun Total Male 46.5 47.6 46.4 47.3 42.9 51.2 47.2 Female 53.5 52.4 53.6 52.7 57.1 48.8 52.8 Total 100.0 100.0 100.0 100.0 100.0 100.0 100.0 Obs. 1,052 1,048 995 1,103 844 1,109 6,151
How old was each household member on their last birthday? (HC5)
Province Obs Mean Std. Dev. Min Max Chachoeng 1,052 36.2 21.4 0 97Buriram 1,048 34.2 20.5 0 98LopBuri 995 34.5 20.7 0 87Sisaket 1,103 33.1 20.8 0 92Phrae 843 36.3 19.9 0 87Satun 1,109 31.0 19.3 0 89Total 6,150 34.1 20.5 0 98
Years Chachoeng Buriram LopBuri Sisaket Phrae Satun Total 0.01 to 10 12.8 14.7 14.0 17.7 12.7 15.8 14.7
10.01 to 20 16.5 16.9 17.0 17.4 15.2 18.9 17.120.01 to 30 14.8 16.0 16.3 12.2 11.2 20.4 15.330.01 to 40 13.8 12.4 12.8 15.5 13.9 13.5 13.740.01 to 50 13.6 14.6 14.3 14.2 19.9 12.5 14.750.01 to 60 13.7 13.9 13.5 12.5 16.8 10.6 13.360.01 to 70 8.6 7.7 8.5 6.4 6.4 5.8 7.270.01 to 80 5.0 2.9 3.3 2.9 3.7 2.1 3.3Above 80 1.1 0.9 0.4 1.1 0.2 0.5 0.7
Total 100.0 100.0 100.0 100.0 100.0 100.0 100.0Obs. 1,052 1,048 995 1,103 843 1,109 6,150

Minister of Finance Initial Household Survey 2005
12
Is the household member in school now? (HC6)
hc6 Chachoeng Buriram LopBuri Sisaket Phrae Satun Total Yes 25.9 25.3 26.9 32.7 26.8 29.0 27.9No 74.1 74.7 73.1 67.3 73.2 71.0 72.1Total 100.0 100.0 100.0 100.0 100.0 100.0 100.0Obs. 1,010 1,009 950 1,055 807 1,061 5,892
What is the highest grade of school that each household member has completed? (HC7)
Grade Chachoeng Buriram LopBuri Sisaket Phrae Satun Total No school 3.5 7.7 4.4 2.0 1.2 6.7 4.4 P.1 2.1 1.8 3.1 3.2 2.5 3.0 2.6 P.2 2.3 2.7 2.5 2.3 1.9 2.5 2.4 P.3 3.3 3.1 1.8 2.9 1.9 2.9 2.7 P.4 23.7 23.5 25.7 27.6 26.9 21.0 24.6 P.5 3.3 1.7 2.1 1.3 1.7 1.9 2.0 P.6 7.6 9.1 9.7 11.6 7.1 15.2 10.2 P.7 1.7 1.3 1.6 1.2 2.5 1.6 1.6 M or MS 1 2.3 2.0 1.5 2.8 1.6 2.5 2.1 M or MS 2 1.7 1.7 2.1 1.8 2.6 1.9 1.9 M or MS 3 11.8 10.3 10.9 9.7 10.8 10.9 10.7 M or MS 4 1.0 1.3 1.2 1.4 1.0 1.0 1.2 M or MS 5 1.7 1.4 1.6 2.5 2.9 2.2 2.0 M or MS 6 7.9 8.9 8.3 8.7 10.0 7.9 8.6 M or MS 7 0.1 0.2 - - - - 0.1 PWC 1 0.5 - - - 0.2 0.1 0.1 PWC 2 0.7 0.6 1.2 0.2 0.6 0.6 0.6 PWC 3 0.7 0.6 0.8 0.8 0.6 0.3 0.6 PWS 1 4.1 3.4 4.2 1.6 5.2 1.8 3.3 PWS 2 0.4 0.4 0.4 0.8 0.4 1.1 0.6 PWT 1 4.0 2.6 5.5 2.8 3.6 3.0 3.6 PWT 2 - 0.3 0.6 - - 0.4 0.2 Univ.1 0.6 1.2 0.6 0.6 0.9 0.4 0.7 Univ.2 1.2 2.8 0.2 1.6 1.5 1.2 1.4 Univ.3 0.5 1.1 1.3 0.7 1.1 1.6 1.0 Univ.4 10.1 9.5 6.1 6.3 7.2 4.8 7.3 Other 3.5 0.9 2.6 5.6 4.1 3.4 3.4 Total 100.0 100.0 100.0 100.0 100.0 100.0 100.0 Obs. 1,004 1,008 950 1,054 806 1,057 5,879
What system of grades was in place when the household member went to school? (HC8)
Educational system Chachoeng Buriram LopBuri Sisaket Phrae Satun Total Esther old system 35.1 34.1 36.9 36.2 52.2 29.8 36.9 New 64.5 65.8 62.8 63.7 47.6 68.9 62.7 Temple 0.4 0.1 0.3 0.1 0.3 - 0.2 Pornor - - - - - 1.2 0.2 Total 100.0 100.0 100.0 100.0 100.0 100.0 100.0 Obs. 975 928 908 1,022 788 975 5,596

Minister of Finance Initial Household Survey 2005
13
Has the household member received any adult education? (HC9)
Adult education Chachoeng Buriram LopBuri Sisaket Phrae Satun Total Yes 2.7 2.7 1.9 1.4 3.0 3.1 2.4 No 97.3 97.3 98.1 98.6 97.0 96.9 97.6 Total 100.0 100.0 100.0 100.0 100.0 100.0 100.0 Obs. 1,010 1,009 950 1,055 807 1,059 5,890
Besides formal schooling has the household member received any training? (HC10)
Other training Chachoeng Buriram LopBuri Sisaket Phrae Satun Total Yes 20.9 24.2 20.8 9.6 33.0 21.8 21.2No 79.1 75.8 79.2 90.4 67.0 78.2 78.8Total 100.0 100.0 100.0 100.0 100.0 100.0 100.0Obs. 1,010 1,009 950 1,055 807 1,060 5,891

Minister of Finance Initial Household Survey 2005
14
Section V. Occupation Primary occupation
What was household member’s primary occupation over the past 12 months? (OC1)
Primary occupation Chachoeng Buriram LopBuri Sisaket Phrae Satun Total In school 17.9 20.4 19.0 21.9 19.1 20.2 19.8 Trader 15.3 15.2 14.6 9.7 11.3 7.4 12.2 Inactive, retired or no secondary occupation 15.0 9.4 8.2 8.9 8.0 7.3 9.5 Shopkeeper (store owner) 8.6 5.1 9.6 6.1 4.7 4.5 6.5 Government official 2.9 9.7 6.2 2.8 5.0 1.6 4.7 Rice farmer 0.1 5.4 1.2 15.1 1.1 1.4 4.1 Factory worker 7.2 1.5 7.9 0.8 1.4 4.1 3.8 Teacher 2.0 1.5 0.7 1.4 1.9 2.7 1.7 Administrative or managerial job 4.5 1.7 0.9 0.3 0.8 1.6 1.7 Cleaner or janitor 0.9 1.1 1.1 1.9 1.2 0.3 1.1 Mechanic 0.7 0.8 0.9 1.2 0.4 0.5 0.8 Clerical worker 1.6 1.0 0.5 0.2 0.4 0.7 0.8 Construction work out of village but in Changwat 0.5 0.6 0.8 1.0 0.5 0.6 0.7 Raise livestock: pig, cow - 1.3 0.5 1.5 0.3 0.2 0.6 Construction work in village 0.2 0.6 0.4 0.1 0.3 1.9 0.6 Policeman 0.2 0.7 0.7 0.4 0.4 0.6 0.5 Nurse 0.7 0.3 0.1 0.2 0.8 0.9 0.5 Accountant 1.1 0.4 0.1 0.4 0.4 0.4 0.5 Electrician 0.3 0.3 0.5 0.7 0.1 1.0 0.5 Farmer growing a different crop - 0.3 - 1.2 0.1 0.5 0.4 Orchard farmer 0.3 0.1 - - 0.3 1.4 0.4 Raise fish other than shrimp 1.5 - - 0.2 - 0.2 0.3 Raise livestock: chicken or duck 0.2 - 0.8 0.3 - - 0.2 Construction work in another Changwat 0.3 0.1 0.1 - - - 0.1 Corn farmer - - 0.2 - 0.3 - 0.1 Construction work in Bangkok 0.1 0.2 - - - - 0.1 Rice miller - 0.1 0.1 0.1 - - 0.1 Shrimp farmer - - - - - 0.1 0.0 Other 17.8 22.1 24.9 23.5 41.1 39.7 27.9 Total 100.0 100.0 100.0 100.0 100.0 100.0 100.0 Obs. 917 894 856 909 737 934 5,247

Minister of Finance Initial Household Survey 2005
15
Primary occupation (Cont.)
What type of worker is household member in this job? (OC1b)
Type of worker Chachoeng Buriram LopBuri Sisaket Phrae Satun Total Owner of business 29.9 29.0 32.7 36.7 28.1 28.1 30.8 Unpaid family worker 22.4 25.8 24.4 32.9 19.7 30.0 26.1 Employee-daily wages 12.4 6.4 15.6 7.9 16.0 15.7 12.3 Employee-monthly wage 27.6 24.0 18.5 14.1 13.8 18.0 19.4 Employee-piece rate, in house 0.7 1.4 1.0 0.5 7.1 0.3 1.7 Employee-piece rate, out of house 0.5 3.3 0.2 0.8 5.0 4.0 2.3 Government worker 6.5 10.0 7.5 6.8 10.2 4.0 7.4 Other - - 0.2 0.2 - - 0.1 Total 100.0 100.0 100.0 100.0 100.0 100.0 100.0 Obs. 615 628 623 629 537 677 3,709
For how many years has household member been doing this type of work? (OC1d)
Province Obs Mean Std. Dev. Min Max Chachoeng 753 14.4 13.0 0 62Buriram 712 12.9 12.4 0 60LopBuri 691 15.6 14.1 0 64Sisaket 709 18.0 14.9 1 74Phrae 595 14.6 12.3 0 54Satun 745 20.0 15.8 0 64Total 4205 16.0 14.1 0 74 Chachoeng Buriram LopBuri Sisaket Phrae Satun Total
0.01 to 1 9.8 11.4 9.0 4.8 8.1 5.2 8.0 1.01 to 5 23.5 26.5 22.0 19.5 22.4 17.7 21.9 5.01 to 10 20.8 23.3 19.4 18.9 21.2 15.8 19.9
10.01 to 15 10.9 6.6 10.7 10.2 11.3 10.9 10.1 15.01 to 20 10.2 10.5 12.6 13.1 9.7 10.5 11.1 20.01 to 30 13.1 11.7 11.4 14.8 15.0 14.4 13.4 30.01 to 40 6.9 5.2 7.7 8.5 8.9 11.4 8.1 40.01 to 50 3.1 3.9 4.2 6.8 3.0 9.8 5.2 50.01 to 60 1.5 0.8 2.6 2.5 0.5 3.8 2.0 Above 60 0.1 - 0.4 1.0 - 0.5 0.4
Total 100.0 100.0 100.0 100.0 100.0 100.0 100.0 Obs. 753 712 691 709 595 745 4,205

Minister of Finance Initial Household Survey 2005
16
Secondary occupation
What was household member’s secondary occupation? (OC2a)
secondary occupation Chachoeng Buriram LopBuri Sisaket Phrae Satun Total Inactive or Retired 90.6 79.6 91.6 64.9 86.7 82.9 82.5 Rice farmer - 5.1 0.6 11.8 5.8 6.2 4.9 Raise livestock: pig, cow - 0.9 0.1 6.6 0.8 1.7 1.7 Trader 1.6 1.3 1.3 2.4 0.9 0.4 1.4 Shopkeeper (store owner) 1.0 1.9 0.5 2.4 0.4 1.0 1.2 Farmer growing a different crop - 0.1 - 2.3 - 0.9 0.6 Orchard farmer 0.4 0.3 0.6 0.3 0.7 0.4 0.5 In school 0.4 0.7 0.6 0.3 0.3 0.2 0.4 Construction work in village 0.1 0.3 - 0.4 0.4 0.3 0.3 Administrative or managerial job 0.2 0.9 0.1 0.1 - 0.1 0.2 Raise livestock: chicken or duck 0.3 0.3 0.2 0.3 - 0.1 0.2 Construction work out of village but in Changwat - 0.6 0.1 0.4 0.1 - 0.2 Raise fish other than shrimp 0.3 - - - - 0.5 0.2 Rice miller - 0.2 0.1 0.2 - - 0.1 Factory worker 0.1 0.3 - - 0.1 - 0.1 Teacher 0.1 0.1 0.1 - 0.3 - 0.1 Government official 0.1 0.3 0.1 - - - 0.1 Cleaner or janitor 0.2 0.1 - - - 0.1 0.1 Corn farmer - - 0.1 0.2 - - 0.1 Mechanic - - - - 0.1 0.1 0.0 Clerical worker 0.1 - 0.1 - - - 0.0 Electrician - 0.1 - - - 0.1 0.0 Construction work in another Changwat 0.1 - - - - - 0.0 Accountant 0.1 - - - - - 0.0 Other 4.0 6.6 3.7 7.2 3.3 4.9 5.0 Total 100.0 100.0 100.0 100.0 100.0 100.0 100.0 Obs. 917 894 856 909 737 934 5,247
What type of worker is household member in this job? (OC2b)
Type of worker Chachoeng Buriram LopBuri Sisaket Phrae Satun Total Owner of business 35.8 34.1 37.3 31.0 39.6 45.6 36.0 Unpaid family worker 34.6 43.2 20.9 56.6 33.3 41.1 44.1 Employee-daily wages 19.8 10.2 23.9 8.5 8.3 5.7 10.5 Employee-monthly wage 3.7 3.4 3.0 0.9 1.0 3.2 2.2 Employee-piece rate, in house 1.2 2.3 9.0 0.6 8.3 1.3 2.6 Employee-piece rate, out of house 4.9 6.3 3.0 1.6 6.3 3.2 3.7 Government worker - 0.6 3.0 0.6 3.1 - 0.9 Total 100.0 100.0 100.0 100.0 100.0 100.0 100.0 Obs. 81 176 67 316 96 158 894

Minister of Finance Initial Household Survey 2005
17
Which of the following village positions does household member hold? (OC3)
Codes: A No positions B Headman C Assistant headman D Kamnan E Assistant Kamnan F PCG committee member G Rice Bank committee member H Head of BAAC group I Member of women’s group committee J Member of housewife’s group committee K Member of village committee L Member of tambon committee M Member of Marketing Demonstration Center committee N Health volunteer O Other
Village position Chachoeng Buriram LopBuri Sisaket Phrae Satun Total A 91.3 89.9 91.5 95.3 92.5 98.0 93.1 O 1.6 3.8 3.4 1.7 2.0 0.6 2.2 N 3.2 2.5 0.9 1.0 1.1 0.5 1.5 K 1.6 2.1 1.4 1.0 2.0 0.5 1.4 C 0.1 0.1 0.5 0.1 0.5 - 0.2
K,O 0.2 0.1 0.6 0.2 - - 0.2 K,N 0.4 0.3 - - 0.1 0.1 0.2 N,O 0.1 0.3 0.2 - 0.3 - 0.2
Other 1.4 0.8 1.5 0.8 1.4 0.2 1.0 Total 100.0 100.0 100.0 100.0 100.0 100.0 100.0 Obs. 917 894 856 909 737 934 5,247

Minister of Finance Initial Household Survey 2005
18
Section VI. Occupational History
Has household member had any other primary occupation besides the one they are doing now? (OH1)
oh1 Chachoeng Buriram LopBuri Sisaket Phrae Satun Total Yes 51.9 57.9 50.3 42.7 54.7 23.2 46.4 No 48.1 42.1 49.7 57.3 45.3 76.8 53.6 Total 100.0 100.0 100.0 100.0 100.0 100.0 100.0 Obs. 915 893 855 908 737 934 5,242
What was household member’s previous primary occupation? (OH2a)
Prior occupation #1 Chachoeng Buriram LopBuri Sisaket Phrae Satun Total Inactive or retired 0.2 - 1.4 0.8 1.2 - 0.6 In school - 0.2 - - 0.2 0.5 0.1 Rice farmer 4.0 20.1 16.0 34.5 11.7 6.5 15.9 Corn farmer - - 2.8 0.8 0.7 - 0.7 Shrimp farmer 0.6 - 0.2 - - 1.8 0.3 Raise fish other than shrimp 0.4 - - - - 1.8 0.2 Orchard farmer 3.6 0.2 0.7 - 0.2 3.2 1.2 Farmer growing a different crop 1.1 0.2 0.2 - 0.5 0.5 0.4 Raise livestock: pig, cow - 1.0 0.5 2.1 0.2 0.9 0.7 Construction work in village 0.2 1.7 0.7 - 1.2 4.6 1.2 Construction work out of village but in Changwat 1.9 2.1 3.3 1.5 1.0 1.4 1.9 Construction work in another Changwat 0.4 - 0.7 0.3 - 1.8 0.4 Construction work in Bangkok 0.6 0.8 1.6 0.5 0.5 - 0.7 Rice miller 0.4 0.2 0.9 - - - 0.3 Shopkeeper (store owner) 3.8 2.5 2.3 3.9 2.5 2.8 3.0 Factory worker 12.4 8.5 8.6 11.3 4.0 5.5 8.7 Mechanic 1.1 1.4 0.9 0.5 1.5 - 1.0 Clerical worker 2.7 2.5 0.9 1.5 1.2 0.9 1.8 Administrative or managerial job 3.8 3.7 2.3 - 1.2 2.8 2.4 Nurse - 0.4 - - - - 0.1 Teacher 3.2 2.1 1.4 4.6 4.7 0.9 2.9 Policeman 0.4 0.4 0.2 1.0 0.5 0.5 0.5 Government official 2.9 7.5 5.1 2.8 3.0 0.9 4.1 Accountant 0.2 1.5 1.4 0.5 0.7 0.5 0.9 Electrician 0.4 0.2 0.2 0.5 1.0 0.5 0.5 Cleaner or janitor 0.8 1.9 1.4 0.8 1.0 0.5 1.2 Trader 24.4 15.7 9.8 11.9 14.6 12.9 15.3 Other 30.3 25.1 36.3 20.1 46.4 48.4 32.9 Total 100.0 100.0 100.0 100.0 100.0 100.0 100.0 Obs. 475 517 430 388 403 217 2,430

Minister of Finance Initial Household Survey 2005
19
For how many years was your primary occupation? (OH2b)
Province Obs Mean Std. Dev. Min Max Chachoeng 475 18.9 14.3 1 70 Buriram 517 19.2 15.6 1 70 LopBuri 430 19.7 14.3 1 64 Sisaket 388 22.3 15.4 1 70 Phrae 403 17.6 13.1 1 64 Satun 217 19.2 15.5 1 61 Total 2,430 19.5 14.8 1 70
Years Chachoeng Buriram LopBuri Sisaket Phrae Satun Total
0.01 to 5 16.0 24.2 16.5 12.4 21.6 19.8 18.5 5.01 to 10 24.0 16.1 18.8 15.5 18.9 24.4 19.2
10.01 to 20 25.7 22.6 26.5 27.8 24.6 22.1 25.0 20.01 to 30 13.9 13.0 15.8 16.8 19.1 8.3 14.9 30.01 to 40 11.4 12.6 10.9 12.6 9.4 13.4 11.6 40.01 to 50 5.9 7.5 9.1 9.8 4.7 8.3 7.4 50.01 to 60 2.3 3.1 1.9 3.4 1.5 3.2 2.5 60.01 to 70 0.8 1.0 0.5 1.8 0.2 0.5 0.8 Above 70 - - - - - - -
Total 100.0 100.0 100.0 100.0 100.0 100.0 100.0 Obs. 475 517 430 388 403 217 2,430 Have you ever seriously considered changing your primary occupation (or the main crop that you grow) and been unable to do so? (OH5)
oh5 Chachoeng Buriram LopBuri Sisaket Phrae Satun Total Yes 4.2 6.3 0.4 0.4 0.4 2.9 2.4 No 95.4 93.3 99.2 99.6 99.6 97.1 97.4 . 0.4 0.4 0.4 - - - 0.2 Total 100.0 100.0 100.0 100.0 100.0 100.0 100.0 Obs. 240 240 240 240 240 240 1,440

Minister of Finance Initial Household Survey 2005
20
Section VII. Children Living Outside the House
How many children of the head and/or the spouse live outside the house? (Kh1)
Province Obs Mean Std. Dev. Min Max Chachoeng 240 1.2 1.7 0 9 Buriram 240 1.2 1.6 0 9 LopBuri 240 1.2 1.4 0 7 Sisaket 240 1.5 1.8 0 10 Phrae 240 0.8 1.0 0 5 Satun 240 0.5 1.0 0 8 Total 1,440 1.0 1.5 0 10
# of Children Chachoeng Buriram LopBuri Sisaket Phrae Satun Total
0 48.8 46.3 45.0 42.9 48.8 75.8 51.3 1 21.3 22.1 18.8 18.8 26.7 11.7 19.9 2 13.3 17.9 21.3 15.4 18.8 7.9 15.8 3 6.7 7.1 9.2 9.2 4.2 1.7 6.3 4 5.0 2.9 3.3 6.3 0.4 2.1 3.3 5 2.1 0.8 1.7 3.3 1.3 0.4 1.6
More than 5 2.9 2.9 0.8 4.2 0.0 0.4 1.9 Total 100.0 100.0 100.0 100.0 100.0 100.0 100.0 Obs. 240 240 240 240 240 240 1,440 What was the child’s age at their last birthday? (Kh4)
Province Obs Mean Std. Dev. Min Max Chachoeng 269 34.3 9.8 2 60 Buriram 263 32.7 7.8 15 55 LopBuri 265 33.7 8.0 12 53 Sisaket 341 33.2 8.6 11 66 Phrae 169 31.0 7.3 14 52 Satun 81 31.3 7.0 21 54 Total 1,388 33.0 8.4 2 66
Age Chachoeng Buriram LopBuri Sisaket Phrae Satun Total 0.01 to 10 1.1 - - - - - 0.2
10.01 to 20 4.8 4.6 3.8 3.2 3.6 - 3.7 20.01 to 30 32.3 37.6 32.1 38.1 50.9 53.1 38.2 30.01 to 40 37.5 41.8 43.8 39.3 34.3 37.0 39.6 40.01 to 50 19.3 14.4 19.2 16.1 10.1 8.6 15.9 50.01 to 60 4.8 1.5 1.1 2.6 1.2 1.2 2.3 60.01 to 70 - - - 0.6 - - 0.1 Above 70 - - - - - - -
Total 100.0 100.0 100.0 100.0 100.0 100.0 100.0 Obs. 269 263 265 341 169 81 1,388

Minister of Finance Initial Household Survey 2005
21
What is the child’s sex? (kh4a)
Sex Chachoeng Buriram Lop Buri Sisaket Phrae Satun Total Male 51.8 47.9 45.3 56.9 50.3 49.4 50.8 Female 48.2 52.1 54.7 43.1 49.7 50.6 49.2 Total 100.0 100.0 100.0 100.0 100.0 100.0 100.0 Obs. 276 263 265 341 169 81 1,395
What is the highest grade of school that the child has completed? (Kh5)
Grade Chachoeng Buriram Lop Buri Sisaket Phrae Satun Total no school 0.4 1.9 0.4 - - - 0.5 P.1 0.4 1.5 - 0.9 1.2 3.7 0.9 P.2 1.8 - 0.4 - - 1.2 0.5 P.3 - - 0.4 0.3 - - 0.1 P.4 9.5 8.8 10.2 9.7 3.0 2.5 8.3 P.5 0.7 0.8 0.4 0.3 - 3.7 0.6 P.6 9.5 11.5 9.8 18.8 3.6 25.9 12.4 P.7 0.7 0.4 1.1 0.6 - - 0.6 M or MS 1 1.5 1.1 0.4 - 0.6 - 0.6 M or MS 2 0.7 2.3 0.4 2.3 0.6 2.5 1.4 M or MS 3 10.2 14.5 11.0 14.4 7.7 4.9 11.6 M or MS 4 0.4 - 0.4 - - 2.5 0.3 M or MS 5 0.7 1.1 1.5 0.6 - 1.2 0.9 M or MS 6 14.2 11.5 9.5 12.3 18.9 13.6 12.9 M or MS 8 - - - - 1.2 - 0.1 PWC 1 - - - 0.3 - 1.2 0.1 PWC 2 - 0.8 - 0.3 0.6 - 0.3 PWC 3 9.8 3.8 7.6 2.9 3.6 2.5 5.4 PWS 1 - - - 0.6 - - 0.1 PWS 2 6.2 9.5 16.3 8.2 11.8 11.1 10.2 PWT 1 - - - - - - - PWT 2 0.4 - - 0.6 0.6 - 0.3 Univ.1 0.4 0.4 - 0.3 3.0 - 0.6 Univ.2 0.7 1.5 0.4 0.6 0.6 1.2 0.8 Univ.3 0.7 0.8 0.8 1.2 1.2 1.2 0.9 Univ.4 28.7 26.3 26.9 22.9 40.2 21.0 27.4 Other 2.5 1.5 2.3 2.1 1.8 - 1.9 Total 100.0 100.0 100.0 100.0 100.0 100.0 100.0 Obs. 275 262 264 341 169 81 1,392
Minister of Finance Initial Household Survey 2005
22
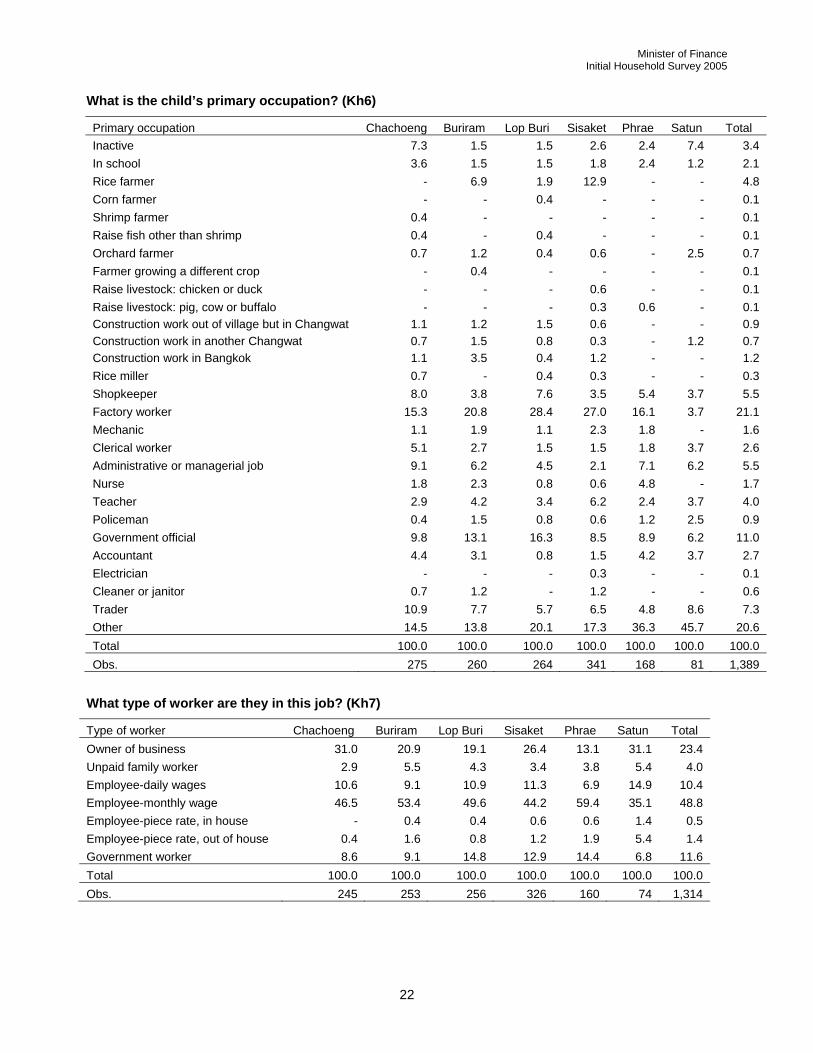
What is the child’s primary occupation? (Kh6)
Primary occupation Chachoeng Buriram Lop Buri Sisaket Phrae Satun Total Inactive 7.3 1.5 1.5 2.6 2.4 7.4 3.4 In school 3.6 1.5 1.5 1.8 2.4 1.2 2.1 Rice farmer - 6.9 1.9 12.9 - - 4.8 Corn farmer - - 0.4 - - - 0.1 Shrimp farmer 0.4 - - - - - 0.1 Raise fish other than shrimp 0.4 - 0.4 - - - 0.1 Orchard farmer 0.7 1.2 0.4 0.6 - 2.5 0.7 Farmer growing a different crop - 0.4 - - - - 0.1 Raise livestock: chicken or duck - - - 0.6 - - 0.1 Raise livestock: pig, cow or buffalo - - - 0.3 0.6 - 0.1 Construction work out of village but in Changwat 1.1 1.2 1.5 0.6 - - 0.9 Construction work in another Changwat 0.7 1.5 0.8 0.3 - 1.2 0.7 Construction work in Bangkok 1.1 3.5 0.4 1.2 - - 1.2 Rice miller 0.7 - 0.4 0.3 - - 0.3 Shopkeeper 8.0 3.8 7.6 3.5 5.4 3.7 5.5 Factory worker 15.3 20.8 28.4 27.0 16.1 3.7 21.1 Mechanic 1.1 1.9 1.1 2.3 1.8 - 1.6 Clerical worker 5.1 2.7 1.5 1.5 1.8 3.7 2.6 Administrative or managerial job 9.1 6.2 4.5 2.1 7.1 6.2 5.5 Nurse 1.8 2.3 0.8 0.6 4.8 - 1.7 Teacher 2.9 4.2 3.4 6.2 2.4 3.7 4.0 Policeman 0.4 1.5 0.8 0.6 1.2 2.5 0.9 Government official 9.8 13.1 16.3 8.5 8.9 6.2 11.0 Accountant 4.4 3.1 0.8 1.5 4.2 3.7 2.7 Electrician - - - 0.3 - - 0.1 Cleaner or janitor 0.7 1.2 - 1.2 - - 0.6 Trader 10.9 7.7 5.7 6.5 4.8 8.6 7.3 Other 14.5 13.8 20.1 17.3 36.3 45.7 20.6 Total 100.0 100.0 100.0 100.0 100.0 100.0 100.0 Obs. 275 260 264 341 168 81 1,389
What type of worker are they in this job? (Kh7)
Type of worker Chachoeng Buriram Lop Buri Sisaket Phrae Satun Total Owner of business 31.0 20.9 19.1 26.4 13.1 31.1 23.4 Unpaid family worker 2.9 5.5 4.3 3.4 3.8 5.4 4.0 Employee-daily wages 10.6 9.1 10.9 11.3 6.9 14.9 10.4 Employee-monthly wage 46.5 53.4 49.6 44.2 59.4 35.1 48.8 Employee-piece rate, in house - 0.4 0.4 0.6 0.6 1.4 0.5 Employee-piece rate, out of house 0.4 1.6 0.8 1.2 1.9 5.4 1.4 Government worker 8.6 9.1 14.8 12.9 14.4 6.8 11.6 Total 100.0 100.0 100.0 100.0 100.0 100.0 100.0 Obs. 245 253 256 326 160 74 1,314

Minister of Finance Initial Household Survey 2005
23
How many times did the child send you money during the past 12 months? (kh9)
Times Chachoeng Buriram Lop Buri Sisaket Phrae Satun Total 0 53.7 49.3 60.4 45.7 64.0 65.4 54.5 1 4.9 3.6 2.2 5.4 3.9 2.9 4.0 2 5.2 3.2 1.8 8.9 4.4 6.7 5.1 3 3.8 5.0 3.6 3.1 4.9 3.8 4.0 4 1.4 4.3 2.9 2.0 2.0 1.0 2.4 5 3.5 2.2 1.1 4.0 2.5 1.9 2.7 6 4.2 1.1 2.5 1.4 1.5 1.0 2.1 7 0.3 0.4 0.4 2.3 - - 0.7 8 - 1.4 0.4 0.9 1.0 - 0.7 9 - - - 0.9 - - 0.2
10 2.1 2.2 1.1 1.7 - 1.9 1.5 11 18.5 26.6 23.4 23.7 15.3 12.5 21.3
12 or more 2.4 0.7 0.4 - 1.0 2.9 1.0 Total 100.0 100.0 100.0 100.0 100.0 100.0 100.0 Obs. 287 278 278 350 203 104 1,500
Approximately how much money did the child send you in total over the past 12 months? (kh10)
Thai Baht of 2005
Province Obs Mean Std. Dev. Min Max Chachoeng 133 17,950 28,612 500 240,000 Buriram 141 26,501 90,608 100 1,060,000 Lop Buri 110 28,847 90,093 500 940,000 Sisaket 190 17,988 37,448 500 360,000 Phrae 73 19,229 29,192 500 180,000 Satun 39 13,236 13,378 500 48,000 Total 686 21,334 52,856 100 1060,000
Thai Baht of 2005 Chachoeng Buriram Lop Buri Sisaket Phrae Satun Total 0.01 to 500 0.8 0.7 0.9 1.1 2.7 2.6 1.2
500.01 to 1,000 5.3 3.5 1.8 3.2 6.8 5.1 3.9 1,000.01 to 2,000 6.0 8.5 3.6 5.8 6.8 12.8 6.6 2,000.01 to 3,000 12.0 8.5 4.5 5.3 4.1 10.3 7.3 3,000.01 to 4,000 4.5 4.3 1.8 3.2 6.8 5.1 3.9 4,000.01 to 5,000 7.5 6.4 7.3 7.4 6.8 10.3 7.3 5,000.01 to 10,000 22.6 13.5 17.3 22.1 13.7 7.7 17.9
10,000.01 to 20,000 15.8 22.7 28.2 26.3 19.2 20.5 22.7 20,000.01 to 30,000 9.8 13.5 11.8 13.7 17.8 12.8 13.0 30,000.01 to 40,000 6.0 7.1 10.0 7.4 6.8 7.7 7.4 40,000.01 to 50,000 1.5 2.1 3.6 2.6 2.7 5.1 2.6 50,000.01 to 100,000 6.0 6.4 7.3 1.1 1.4 - 4.1
100,000.01 to 150,000 1.5 2.1 0.9 - 2.7 - 1.2 Above 150,000 0.8 0.7 0.9 1.1 1.4 - 0.9
Total 100.0 100.0 100.0 100.0 100.0 100.0 100.0
Obs. 133 141 110 190 73 39 686

Minister of Finance Initial Household Survey 2005
24
How many times did you send the child money during the past 12 months? (kh11)
Times Chachoeng Buriram Lop Buri Sisaket Phrae Satun Total 0 92.0 89.9 87.4 94.0 73.9 77.8 87.8 1 1.0 1.8 1.4 2.0 3.0 - 1.7 2 1.0 1.8 - 0.6 1.5 1.9 1.0 3 0.3 0.7 1.4 0.3 1.5 - 0.7 4 0.7 - 0.7 0.3 1.0 0.9 0.5 5 - 0.7 1.4 - 0.5 - 0.5 6 - 0.4 - - 0.5 0.9 0.2 7 - - 0.4 - - 0.9 0.1 9 - - - 0.3 - 0.9 0.1
10 0.7 - 1.4 - - 0.9 0.5 11 3.1 3.2 4.0 2.6 16.6 15.7 5.9
12 or more 1.0 1.4 1.8 - 2.5 - 1.1 Total 100.0 100.0 100.0 100.0 100.0 100.0 100.0 Obs. 287 278 278 350 199 108 1,500
Approximately how much money did you send the child in total over the past 12 months? (Kh12)
Thai Baht of 2005
Province Obs Mean Std. Dev. Min Max Chachoeng 23 34,735 32,609 2,000 114,000 Buriram 28 32,614 34,308 1,000 120,000 Lop Buri 35 21,677 26,559 500 96,000 Sisaket 21 24,286 18,254 2,000 72,000 Phrae 56 44,316 46,679 500 246,000 Satun 27 22,982 20,466 2,000 60,000 Total 190 32,016 32,580 500 246,000
Thai Baht of 2005 Chachoeng Buriram Lop Buri Sisaket Phrae Satun Total 0.01 to 500 - - 2.9 - 1.8 - 1.1
500.01 to 1,000 - 3.6 8.6 - 8.9 - 4.7 1,000.01 to 2,000 4.3 14.3 14.3 9.5 5.4 14.8 10.0 2,000.01 to 3,000 - 3.6 2.9 - - 3.7 1.6 3,000.01 to 4,000 13.0 - 5.7 4.8 - 3.7 3.7 4,000.01 to 5,000 4.3 - 8.6 - 1.8 3.7 3.2 5,000.01 to 10,000 8.7 14.3 14.3 4.8 12.5 11.1 11.6
10,000.01 to 20,000 13.0 14.3 8.6 28.6 8.9 18.5 13.7 20,000.01 to 30,000 17.4 14.3 8.6 28.6 5.4 18.5 13.2 30,000.01 to 40,000 4.3 10.7 - 4.8 7.1 7.4 5.8 40,000.01 to 50,000 8.7 - 11.4 14.3 16.1 - 9.5 50,000.01 to 100,000 21.7 21.4 14.3 4.8 25.0 18.5 18.9
100,000.01 to 150,000 4.3 3.6 - - 3.6 - 2.1 Above 150,000 - - - - 3.6 - 1.1
Total 100.0 100.0 100.0 100.0 100.0 100.0 100.0 Obs. 23 28 35 21 56 27 190

Minister of Finance Initial Household Survey 2005
25
Section VIII. Residential Patterns
Head’s Relatives
Is the head’s mother living? (rp1a - A)
rp1 Chachoeng Buriram Lop Buri SiSaket Phrae Satun Total No 61.3 62.1 49.2 64.2 62.1 46.3 57.5 Yes 38.8 37.9 50.8 35.8 37.9 53.8 42.5
Total 100.0 100.0 100.0 100.0 100.0 100.0 100.0 Obs. 240 240 240 240 240 240 1,440
Is the head’s father living? (rp1a - B)
rp1 Chachoeng Buriram Lop Buri SiSaket Phrae Satun Total No 76.7 77.1 74.2 80.4 77.5 63.3 74.9 Yes 23.3 22.9 25.8 19.6 22.5 36.7 25.1
Total 100.0 100.0 100.0 100.0 100.0 100.0 100.0 Obs. 240 240 240 240 240 240 1,440
How many sons does the head have? (rp1a – C)
rp1 Chachoeng Buriram Lop Buri SiSaket Phrae Satun Total 0 30.4 26.7 25.8 19.2 38.8 27.1 28.0 1 32.1 38.8 45.4 37.9 44.2 30.8 38.2 2 20.8 25.8 20.4 25.4 15.4 30.8 23.1 3 10.4 6.3 6.7 10.8 1.3 8.3 7.3 4 4.2 1.7 1.3 5.8 0.4 2.1 2.6 5 1.7 0.8 0.4 - - 0.8 0.6 6 0.4 - - 0.8 - - 0.2
Total 100.0 100.0 100.0 100.0 100.0 100.0 100.0 Obs. 240 240 240 240 240 240 1,440
How many daughters does the head have? (rp1a – D)
rp1 Chachoeng Buriram Lop Buri SiSaket Phrae Satun Total 0 29.6 25.4 28.3 15.0 30.8 30.4 26.6 1 35.8 35.8 36.3 41.3 46.7 42.1 39.7 2 22.5 27.9 24.6 32.1 17.5 17.5 23.7 3 6.7 7.5 8.3 9.2 3.8 6.3 6.9 4 2.5 0.8 2.1 1.3 1.3 2.9 1.8 5 1.7 0.8 - 0.8 - 0.8 0.7 6 0.8 1.3 - 0.4 - - 0.4 7 - 0.4 0.4 - - - 0.1 9 0.4 - - - - - 0.1
Total 100.0 100.0 100.0 100.0 100.0 100.0 100.0 Obs. 240 240 240 240 240 240 1,440

Minister of Finance Initial Household Survey 2005
26
Head’s Relatives (Cont.)
How many older brothers does the head have? (rp1a – E)
rp1 Chachoeng Buriram Lop Buri SiSaket Phrae Satun Total 0 51.7 51.3 56.3 51.3 57.1 49.6 52.9 1 27.5 23.8 23.3 30.8 29.2 28.8 27.2 2 12.9 12.1 12.1 8.3 9.6 10.8 11.0 3 4.2 6.7 5.0 5.0 2.5 6.3 4.9 4 2.1 2.9 2.1 2.9 0.4 1.7 2.0 5 1.3 1.3 0.8 1.3 1.3 2.5 1.4 6 - 0.4 0.4 - - - 0.1 7 - 1.3 - - - - 0.2 8 0.4 0.4 - - - - 0.1 .b - - - 0.4 - 0.4 0.1
Total 100.0 100.0 100.0 100.0 100.0 100.0 100.0 Obs. 240 240 240 240 240 240 1,440
How many younger brothers does the head have? (rp1a – F)
rp1 Chachoeng Buriram Lop Buri SiSaket Phrae Satun Total 0 46.7 45.8 48.3 40.0 51.7 50.4 47.2 1 25.4 25.0 27.9 25.4 23.3 23.8 25.1 2 15.8 15.4 16.3 17.1 18.3 12.9 16.0 3 7.5 9.2 3.8 11.3 4.2 6.7 7.1 4 2.9 2.1 2.1 3.8 0.8 2.5 2.4 5 0.8 1.7 0.8 1.7 0.8 2.1 1.3 6 0.4 0.4 0.8 0.4 0.4 0.4 0.5 7 - 0.4 - 0.4 - 0.8 0.3 8 0.4 - - - - - 0.1 .b - - - - - 0.4 0.1 .c - - - - 0.4 - 0.1
Total 100.0 100.0 100.0 100.0 100.0 100.0 100.0 Obs. 240 240 240 240 240 240 1,440
How many older sisters does the head have? (rp1a – G)
rp1 Chachoeng Buriram Lop Buri SiSaket Phrae Satun Total 0 42.5 49.6 49.6 51.3 54.6 55.0 50.4 1 33.8 22.9 29.2 24.6 27.1 22.1 26.6 2 13.8 15.4 12.1 15.8 11.3 14.2 13.8 3 6.3 7.5 3.8 5.4 5.0 5.4 5.6 4 2.5 2.9 2.9 1.7 1.7 2.5 2.4 5 0.4 0.8 1.7 1.3 - 0.4 0.8 6 0.8 0.8 0.8 - - - 0.4 7 - - - - 0.4 - 0.1 .b - - - - - 0.4 0.1
Total 100.0 100.0 100.0 100.0 100.0 100.0 100.0 Obs. 240 240 240 240 240 240 1,440

Minister of Finance Initial Household Survey 2005
27
Head’s Relatives (Cont.)
How many younger sisters does the head have? (rp1a – H)
rp1 Chachoeng Buriram Lop Buri SiSaket Phrae Satun Total 0 50.0 46.7 44.6 39.2 47.5 42.9 45.1 1 26.7 25.4 30.0 27.9 30.0 26.7 27.8 2 12.9 12.9 15.8 17.9 14.6 16.7 15.1 3 5.4 7.9 5.4 9.6 4.6 7.5 6.7 4 3.3 3.8 2.5 5.0 2.5 2.9 3.3 5 1.3 1.7 1.3 - 0.8 1.3 1.0 6 0.4 1.3 0.4 0.4 - 1.3 0.6 7 - - - - - 0.4 0.1 9 - 0.4 - - - - 0.1 .b - - - - - 0.4 0.1
Total 100.0 100.0 100.0 100.0 100.0 100.0 100.0 Obs. 240 240 240 240 240 240 1,440
RP2A – RP4A
A. Parents
Do they live in the head’s house? (rp2a)
rp2 Chachoeng Buriram Lop Buri Sisaket Phrae Satun Total Yes 6.7 5.6 7.3 4.4 6.5 6.9 6.2 No 93.3 94.4 92.7 95.6 93.5 93.1 93.8 Total 100.0 100.0 100.0 100.0 100.0 100.0 100.0 Obs. 480 480 480 480 480 480 2,880
Do they live in the head’s village, but not in the head’s house? (rp3a)
rp3 Chachoeng Buriram Lop Buri Sisaket Phrae Satun Total Yes 10.2 10.4 11.7 7.7 13.1 21.5 12.4 No 89.8 89.6 88.3 92.3 86.9 78.5 87.6 Total 100.0 100.0 100.0 100.0 100.0 100.0 100.0 Obs. 480 480 480 480 480 480 2,880
Do they live in the head’s tambon, but not in the head’s village? (rp4a)
rp4 Chachoeng Buriram Lop Buri Sisaket Phrae Satun Total Yes 3.8 4.2 2.9 4.2 2.3 6.3 3.9 No 96.3 95.8 97.1 95.8 97.7 93.8 96.1 Total 100.0 100.0 100.0 100.0 100.0 100.0 100.0 Obs. 480 480 480 480 480 480 2,880

Minister of Finance Initial Household Survey 2005
28
Head’s Relatives (Cont.)
B. Sons and daughters
How many live in the head’s house? (rp2a)
rp2 Chachoeng Buriram Lop Buri Sisaket Phrae Satun Total 0 51.5 49.8 51.5 41.9 60.6 37.7 48.8 1 32.7 33.8 36.7 42.5 33.3 36.3 35.9 2 11.3 13.8 9.0 14.8 5.6 20.4 12.5 3 3.5 2.7 2.9 0.8 0.4 4.2 2.4 4 0.6 - - - - 1.3 0.3 5 0.2 - - - - 0.2 0.1 6 0.2 - - - - - 0.0
Total 100.0 100.0 100.0 100.0 100.0 100.0 100.0 Obs. 480 480 480 480 480 480 2,880
How many live in the head’s village, but not in the head’s house? (rp3a)
rp3 Chachoeng Buriram Lop Buri Sisaket Phrae Satun Total 0 91.7 94.6 94.0 91.5 96.5 92.5 93.4 1 5.2 4.6 5.2 6.7 3.3 5.8 5.1 2 1.7 0.8 0.4 1.5 0.2 1.5 1.0 3 0.8 - 0.2 0.2 - 0.2 0.2 4 0.4 - 0.2 0.2 - - 0.1 6 0.2 - - - - - 0.0
Total 100.0 100.0 100.0 100.0 100.0 100.0 100.0 Obs. 480 480 480 480 480 480 2,880
How many live in the head’s tambon, but not in the head’s village? (rp4a)
rp4 Chachoeng Buriram Lop Buri Sisaket Phrae Satun Total 0 94.8 95.2 97.7 96.7 97.3 98.8 96.7 1 4.4 4.0 2.3 2.5 2.5 1.0 2.8 2 0.6 0.4 - 0.6 0.2 0.2 0.4 3 0.2 0.4 - 0.2 - - 0.1
Total 100.0 100.0 100.0 100.0 100.0 100.0 100.0 Obs. 480 480 480 480 480 480 2,880

Minister of Finance Initial Household Survey 2005
29
Head’s Relatives (Cont.)
C. Brothers and Sisters
How many live in the head’s house? (rp2a)
rp2 Chachoeng Buriram Lop Buri Sisaket Phrae Satun Total 0 97.0 98.0 97.6 99.7 98.2 97.5 98.0 1 2.6 1.5 2.0 0.3 1.8 1.6 1.6 2 0.4 0.4 0.3 - - 0.3 0.2 3 - 0.1 - - - 0.1 0.0 4 - - 0.1 - - 0.1 0.0 . - - - - - 0.4 0.1
Total 100.0 100.0 100.0 100.0 100.0 100.0 100.0 Obs. 960 960 960 960 960 960 5,760
How many live in the head’s village, but not in the head’s house? (rp3a)
rp3 Chachoeng Buriram Lop Buri Sisaket Phrae Satun Total 0 85.0 82.9 88.4 83.0 81.6 75.8 82.8 1 10.8 11.4 8.5 12.0 13.8 15.9 12.1 2 2.8 3.5 1.7 3.8 3.3 4.7 3.3 3 0.8 1.2 1.2 0.9 0.8 1.7 1.1 4 0.4 0.6 0.1 0.3 0.5 0.8 0.5 5 0.1 0.2 0.1 - - 0.4 0.1 6 - - - - - 0.1 0.0 7 - 0.2 - - - 0.1 0.1 . - - - - - 0.4 0.1
Total 100.0 100.0 100.0 100.0 100.0 100.0 100.0 Obs. 960 960 960 960 960 960 5,760
How many live in the head’s tambon, but not in the head’s village? (rp4a)
rp4 Chachoeng Buriram Lop Buri Sisaket Phrae Satun Total 0 88.7 91.2 93.5 88.4 95.0 88.2 90.8 1 7.6 5.9 4.8 8.1 3.4 6.5 6.1 2 2.5 1.4 1.0 2.5 1.0 3.2 1.9 3 0.7 0.7 0.4 0.4 0.4 1.5 0.7 4 0.4 0.4 0.1 0.4 0.1 0.1 0.3 5 - 0.2 0.1 0.1 - 0.1 0.1 6 0.1 - - - - - 0.0 7 - 0.1 - - - - 0.0 8 - 0.1 - - - - 0.0 . - - - - - 0.4 0.1
Total 100.0 100.0 100.0 100.0 100.0 100.0 100.0 Obs. 960 960 960 960 960 960 5,760

Minister of Finance Initial Household Survey 2005
30
Spouse’s Relatives
Is the spouse’s mother living? (rp5a - A)
rp5 Chachoeng Buriram Lop Buri SiSaket Phrae Satun Total No 50.4 54.6 50.0 60.0 52.1 41.3 51.4 Yes 32.5 39.2 40.8 37.5 35.0 51.3 39.4 .a 7.5 0.8 3.3 0.4 3.3 4.6 3.3 .b 0.4 - 0.4 0.4 0.4 - 0.3 .c 9.2 5.4 5.4 1.7 9.2 2.9 5.6
Total 100.0 100.0 100.0 100.0 100.0 100.0 100.0 Obs. 240 240 240 240 240 240 1,440
Is the spouse’s father living? (rp5a - B)
rp5 Chachoeng Buriram Lop Buri SiSaket Phrae Satun Total No 68.3 67.9 71.3 75.0 69.6 52.1 67.4 Yes 14.6 25.8 19.6 22.5 17.5 40.4 23.4 .a 7.5 0.8 3.3 0.4 3.3 4.6 3.3 .b 0.4 - 0.4 0.4 0.4 - 0.3 .c 9.2 5.4 5.4 1.7 9.2 2.9 5.6
Total 100.0 100.0 100.0 100.0 100.0 100.0 100.0 Obs. 240 240 240 240 240 240 1,440
How many older brothers does the spouse have? (rp5a – C)
rp5 Chachoeng Buriram Lop Buri SiSaket Phrae Satun Total 0 47.5 53.3 53.3 47.5 47.5 49.2 49.7 1 21.7 20.0 19.6 21.7 19.6 26.3 21.5 2 9.6 13.3 9.2 18.3 12.1 10.4 12.2 3 2.1 4.6 5.4 5.4 4.2 5.4 4.5 4 1.3 2.1 1.3 2.1 2.9 0.8 1.7 5 0.4 - 1.7 - 0.4 - 0.4 6 - 0.4 - 0.8 - 0.4 0.3 7 - - - 0.4 - - 0.1 9 0.4 - - 0.4 - - 0.1 .a 7.5 0.8 3.3 0.4 3.3 4.6 3.3 .b 0.4 - 0.8 0.8 0.8 - 0.5 .c 9.2 5.4 5.4 2.1 9.2 2.9 5.7
Total 100.0 100.0 100.0 100.0 100.0 100.0 100.0 Obs. 240 240 240 240 240 240 1,440

Minister of Finance Initial Household Survey 2005
31
Spouse’s Relatives (Cont.)
How many younger brothers does the spouse have? (rp5a – D)
rp5 Chachoeng Buriram Lop Buri SiSaket Phrae Satun Total 0 35.4 50.0 40.8 45.0 45.8 39.2 42.7 1 27.1 20.4 26.3 20.8 23.8 25.8 24.0 2 13.3 14.6 14.2 20.0 11.3 16.7 15.0 3 4.2 4.6 6.3 5.4 5.0 7.1 5.4 4 2.5 1.7 1.7 4.2 0.4 2.5 2.2 5 0.4 1.7 0.8 1.3 0.4 0.8 0.9 6 - 0.4 - - - 0.4 0.1 8 - - 0.4 - - - 0.1
10 - 0.4 - - - - 0.1 .a 7.5 0.8 3.3 0.4 3.3 4.6 3.3 .b 0.4 - 0.8 0.8 0.8 - 0.5 .c 9.2 5.4 5.4 2.1 9.2 2.9 5.7
Total 100.0 100.0 100.0 100.0 100.0 100.0 100.0 Obs. 240 240 240 240 240 240 1,440
How many older sisters does the spouse have? (rp5a – E)
rp5 Chachoeng Buriram Lop Buri SiSaket Phrae Satun Total 0 44.2 47.1 42.9 44.6 47.1 44.2 45.0 1 24.2 21.3 28.3 24.6 19.6 29.6 24.6 2 7.5 15.8 13.8 15.0 12.1 10.0 12.4 3 5.4 6.7 3.3 10.0 5.0 4.6 5.8 4 0.8 2.1 2.1 0.8 1.7 3.3 1.8 5 0.4 0.8 - 1.3 0.8 0.8 0.7 6 0.4 - - 0.4 0.4 - 0.2 .a 7.5 0.8 3.3 0.4 3.3 4.6 3.3 .b 0.4 - 0.8 0.8 0.8 - 0.5 .c 9.2 5.4 5.4 2.1 9.2 2.9 5.7
Total 100.0 100.0 100.0 100.0 100.0 100.0 100.0 Obs. 240 240 240 240 240 240 1,440
How many younger sisters does the spouse have? (rp5a – F)
rp5 Chachoeng Buriram Lop Buri SiSaket Phrae Satun Total 0 39.6 42.9 40.0 37.9 45.4 35.8 40.3 1 20.0 24.2 28.3 27.5 24.2 27.5 25.3 2 15.0 15.4 10.8 17.1 10.8 13.3 13.8 3 5.0 6.7 7.1 9.2 4.2 6.7 6.5 4 1.7 2.1 1.7 3.3 1.3 6.3 2.7 5 1.3 1.3 2.1 1.3 - 2.1 1.3 6 0.4 0.8 - 0.4 0.4 0.4 0.4 7 - 0.4 0.4 - 0.4 0.4 0.3 .a 7.5 0.8 3.3 0.4 3.3 4.6 3.3 .b 0.4 - 0.8 0.8 0.8 - 0.5 .c 9.2 5.4 5.4 2.1 9.2 2.9 5.7
Total 100.0 100.0 100.0 100.0 100.0 100.0 100.0 Obs. 240 240 240 240 240 240 1,440
Minister of Finance Initial Household Survey 2005
32
Spouse’s Relatives (Cont.)
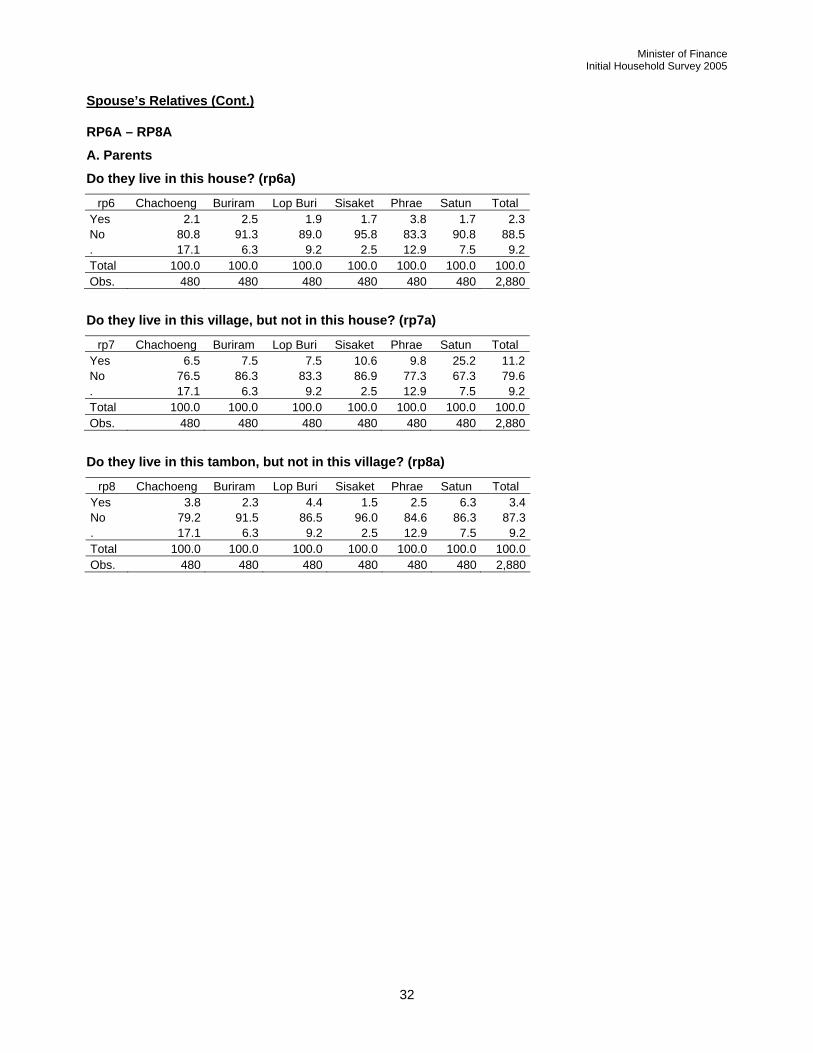
RP6A – RP8A
A. Parents
Do they live in this house? (rp6a)
rp6 Chachoeng Buriram Lop Buri Sisaket Phrae Satun Total Yes 2.1 2.5 1.9 1.7 3.8 1.7 2.3 No 80.8 91.3 89.0 95.8 83.3 90.8 88.5 . 17.1 6.3 9.2 2.5 12.9 7.5 9.2 Total 100.0 100.0 100.0 100.0 100.0 100.0 100.0 Obs. 480 480 480 480 480 480 2,880
Do they live in this village, but not in this house? (rp7a)
rp7 Chachoeng Buriram Lop Buri Sisaket Phrae Satun Total Yes 6.5 7.5 7.5 10.6 9.8 25.2 11.2 No 76.5 86.3 83.3 86.9 77.3 67.3 79.6 . 17.1 6.3 9.2 2.5 12.9 7.5 9.2 Total 100.0 100.0 100.0 100.0 100.0 100.0 100.0 Obs. 480 480 480 480 480 480 2,880
Do they live in this tambon, but not in this village? (rp8a)
rp8 Chachoeng Buriram Lop Buri Sisaket Phrae Satun Total Yes 3.8 2.3 4.4 1.5 2.5 6.3 3.4 No 79.2 91.5 86.5 96.0 84.6 86.3 87.3 . 17.1 6.3 9.2 2.5 12.9 7.5 9.2 Total 100.0 100.0 100.0 100.0 100.0 100.0 100.0 Obs. 480 480 480 480 480 480 2,880

Minister of Finance Initial Household Survey 2005
33
Spouse’s Relatives (Cont.)
C. Brothers and Sisters
How many live in this house? (rp6a)
rp6 Chachoeng Buriram Lop Buri Sisaket Phrae Satun Total 0 81.5 93.3 89.8 95.6 85.2 92.3 89.6 1 0.8 0.4 0.6 1.0 1.3 0.2 0.7 2 0.6 - - - - - 0.1 3 - - - - 0.2 - 0.0 . 17.1 6.3 9.6 3.3 13.3 7.5 9.5
Total 100.0 100.0 100.0 100.0 100.0 100.0 100.0 Obs. 480 480 480 480 480 480 2,880
How many live in this village, but not in this house? (rp7a)
rp7 Chachoeng Buriram Lop Buri Sisaket Phrae Satun Total 0 70.0 80.8 81.5 77.7 70.8 67.3 74.7 1 7.9 8.1 5.0 11.0 10.4 16.0 9.8 2 3.8 2.9 2.5 6.0 2.9 4.0 3.7 3 1.0 0.8 1.3 1.5 2.1 3.3 1.7 4 0.2 0.8 - 0.4 0.4 1.5 0.6 5 - - 0.2 - - 0.4 0.1 6 - 0.2 - - - - 0.0 . 17.1 6.3 9.6 3.3 13.3 7.5 9.5
Total 100.0 100.0 100.0 100.0 100.0 100.0 100.0 Obs. 480 480 480 480 480 480 2,880
How many live in this tambon, but not in this village? (rp8a)
rp8 Chachoeng Buriram Lop Buri Sisaket Phrae Satun Total 0 76.7 87.5 83.5 85.8 81.5 82.9 83.0 1 4.4 4.4 5.2 8.1 4.4 6.0 5.4 2 1.3 1.0 1.3 1.9 0.6 2.3 1.4 3 0.6 0.6 0.2 0.4 - 0.2 0.4 4 - 0.2 - 0.2 - 0.8 0.2 5 - - 0.2 0.2 0.2 0.2 0.1 . 17.1 6.3 9.6 3.3 13.3 7.5 9.5
Total 100.0 100.0 100.0 100.0 100.0 100.0 100.0 Obs. 480 480 480 480 480 480 2,880
Head or spouse’s parents out of the tambon
In the past 12 months, have you or anyone in your household shared rice with the head or spouse’s parents? (rp9)
rp9 Chachoeng Buriram Lop Buri SiSaket Phrae Satun Total Yes 16.7 22.5 25.0 25.4 12.5 18.3 20.1 No 8.8 13.3 20.0 8.3 11.3 12.5 12.4 .c 74.6 64.2 55.0 66.3 76.3 69.2 67.6 Total 100.0 100.0 100.0 100.0 100.0 100.0 100.0 Obs. 240 240 240 240 240 240 1,440

Minister of Finance Initial Household Survey 2005
34
Head or spouse’s parents out of the tambon (Cont.)
In the past 12 months, have the head or spouse’s parents shared rice with you or anyone else in your household? (rp10)
rp10 Chachoeng Buriram Lop Buri SiSaket Phrae Satun Total Yes 15.0 21.7 22.1 24.6 12.5 17.5 18.9 No 10.4 14.2 22.9 9.2 11.3 13.3 13.5 .c 74.6 64.2 55.0 66.3 76.3 69.2 67.6 Total 100.0 100.0 100.0 100.0 100.0 100.0 100.0 Obs. 240 240 240 240 240 240 1,440
In the past 12 months, have your or anyone in your household helped the head or spouse’s parents with free labor? (rp11)
rp11 Chachoeng Buriram Lop Buri SiSaket Phrae Satun Total Yes 2.9 13.3 7.5 11.7 13.3 17.5 11.0 No 22.5 22.5 37.5 22.1 10.4 13.3 21.4 .c 74.6 64.2 55.0 66.3 76.3 69.2 67.6 Total 100.0 100.0 100.0 100.0 100.0 100.0 100.0 Obs. 240 240 240 240 240 240 1,440
In the past 12 months, have the head or spouse’s parents helped you or anyone else in your household with free labor? (rp12)
rp12 Chachoeng Buriram Lop Buri SiSaket Phrae Satun Total Yes 2.5 8.8 6.3 8.8 12.9 15.4 9.1 No 22.9 27.1 38.8 25.0 10.8 15.4 23.3 .c 74.6 64.2 55.0 66.3 76.3 69.2 67.6 Total 100.0 100.0 100.0 100.0 100.0 100.0 100.0 Obs. 240 240 240 240 240 240 1,440
In the past 12 months, have your or anyone in your household helped the head or spouse’s parents with money? (rp13)
rp13 Chachoeng Buriram Lop Buri SiSaket Phrae Satun Total Yes 6.7 22.1 13.8 6.3 15.0 18.8 13.8 No 18.8 13.8 31.3 27.5 8.8 12.1 18.7 .c 74.6 64.2 55.0 66.3 76.3 69.2 67.6 Total 100.0 100.0 100.0 100.0 100.0 100.0 100.0 Obs. 240 240 240 240 240 240 1,440
In the past 12 months, have the head or spouse’s parents helped you or anyone else in your household with money? (rp14)
rp14 Chachoeng Buriram Lop Buri SiSaket Phrae Satun Total Yes 2.5 15.4 7.9 3.8 12.1 15.0 9.4 No 22.9 20.4 37.1 30.0 11.7 15.8 23.0 .c 74.6 64.2 55.0 66.3 76.3 69.2 67.6 Total 100.0 100.0 100.0 100.0 100.0 100.0 100.0 Obs. 240 240 240 240 240 240 1,440

Minister of Finance Initial Household Survey 2005
35
Head and spouse’s relatives in the village and the tambon
In the past 12 months, has anyone in your house shared rice with anyone of the relatives who live in the village or the tambon? (rp15)
rp15 Chachoeng Buriram Lop Buri SiSaket Phrae Satun Total Yes 49.2 65.4 56.3 73.3 66.7 53.8 60.8 No 25.0 12.1 20.4 8.8 10.0 37.9 19.0 .c 25.8 22.5 23.3 17.9 23.3 8.3 20.2 Total 100.0 100.0 100.0 100.0 100.0 100.0 100.0 Obs. 240 240 240 240 240 240 1,440
In the past 12 months, have any of the relatives who live in the village or tambon shared rice with any of the people who live in this house? (rp16)
rp16 Chachoeng Buriram Lop Buri SiSaket Phrae Satun Total Yes 49.6 64.6 55.4 73.8 65.0 52.5 60.1 No 24.6 12.9 21.3 8.3 11.7 39.2 19.7 .c 25.8 22.5 23.3 17.9 23.3 8.3 20.2 Total 100.0 100.0 100.0 100.0 100.0 100.0 100.0 Obs. 240 240 240 240 240 240 1,440
Head and spouse’s relatives in the village and the tambon (Cont.)
In the past 12 months, has anyone in your house done labor exchange with any of the relatives who live in the village or tambon? (rp17)
rp17 Chachoeng Buriram Lop Buri SiSaket Phrae Satun Total Yes 22.9 42.5 20.8 46.3 55.4 45.4 38.9 No 51.3 35.0 55.8 35.8 21.3 46.3 40.9 .c 25.8 22.5 23.3 17.9 23.3 8.3 20.2 Total 100.0 100.0 100.0 100.0 100.0 100.0 100.0 Obs. 240 240 240 240 240 240 1,440
In the past 12 months, has anyone in your house let any of the relatives who live in the village or tambon use farm equipment owned by people in this house for free? (rp18)
rp18 Chachoeng Buriram Lop Buri SiSaket Phrae Satun Total Yes 7.5 16.3 1.7 22.1 12.1 25.0 14.1 No 66.7 61.3 75.0 60.0 64.6 66.7 65.7 .c 25.8 22.5 23.3 17.9 23.3 8.3 20.2 Total 100.0 100.0 100.0 100.0 100.0 100.0 100.0 Obs. 240 240 240 240 240 240 1,440
In the past 12 months, has anyone in your house gotten free use of farm equipment owned by the relatives who live in the village or tambon? (rp19)
rp19 Chachoeng Buriram Lop Buri SiSaket Phrae Satun Total Yes 2.9 14.6 0.4 18.3 7.1 22.1 10.9 No 71.3 62.9 76.3 63.8 69.6 69.6 68.9 .c 25.8 22.5 23.3 17.9 23.3 8.3 20.2 Total 100.0 100.0 100.0 100.0 100.0 100.0 100.0 Obs. 240 240 240 240 240 240 1,440

Minister of Finance Initial Household Survey 2005
36
Head and spouse’s relatives in the village and the tambon (Cont.)
In the past 12 months, has anyone in your house helped any of the relatives who live in the village or tambon with money? (rp20)
rp20 Chachoeng Buriram Lop Buri SiSaket Phrae Satun Total Yes 24.2 49.2 24.2 15.0 44.6 50.4 34.6 No 50.0 28.3 52.5 67.1 32.1 41.3 45.2 .c 25.8 22.5 23.3 17.9 23.3 8.3 20.2 Total 100.0 100.0 100.0 100.0 100.0 100.0 100.0 Obs. 240 240 240 240 240 240 1,440
In the past 12 months, have any of relatives who live in the village or tambon helped anyone in this house with money? (rp21)
rp21 Chachoeng Buriram Lop Buri SiSaket Phrae Satun Total Yes 28.3 51.7 28.3 20.8 46.7 52.1 38.0 No 45.8 25.8 48.3 61.3 30.0 39.6 41.8 .c 25.8 22.5 23.3 17.9 23.3 8.3 20.2 Total 100.0 100.0 100.0 100.0 100.0 100.0 100.0 Obs. 240 240 240 240 240 240 1,440
Non-relatives inside the village and tambon
In the past 12 months, have you or anyone in your household shared rice with non-relatives in the village or the tambon? (rp22)
rp22 Chachoeng Buriram Lop Buri SiSaket Phrae Satun Total Yes 56.3 65.4 73.8 57.1 76.3 37.9 61.1 No 43.8 34.6 26.3 42.9 23.8 62.1 38.9 Total 100.0 100.0 100.0 100.0 100.0 100.0 100.0 Obs. 240 240 240 240 240 240 1,440
In the past 12 months, have any non-relatives in the village or the tambon shared rice with you or anyone else in your household? (rp23)
rp23 Chachoeng Buriram Lop Buri SiSaket Phrae Satun Total Yes 55.4 64.6 72.5 57.5 75.4 35.4 60.1 No 44.6 35.4 27.5 42.5 24.6 64.6 39.9 Total 100.0 100.0 100.0 100.0 100.0 100.0 100.0 Obs. 240 240 240 240 240 240 1,440
In the past 12 months, have you or anyone in your household helped non-relatives in the village or the tambon with free labor? (rp24)
rp24 Chachoeng Buriram Lop Buri SiSaket Phrae Satun Total Yes 30.8 38.8 26.3 36.3 68.8 32.9 39.0 No 69.2 61.3 73.8 63.8 31.3 67.1 61.0 Total 100.0 100.0 100.0 100.0 100.0 100.0 100.0 Obs. 240 240 240 240 240 240 1,440

Minister of Finance Initial Household Survey 2005
37
Non-relatives inside the village and tambon (Cont.)
In the past 12 months, have any non-relatives in the village or the tambon helped you or anyone in your household with free labor? (rp25)
rp25 Chachoeng Buriram Lop Buri SiSaket Phrae Satun Total Yes 28.8 37.5 25.8 32.1 67.5 32.1 37.3 No 71.3 62.5 74.2 67.9 32.5 67.9 62.7 Total 100.0 100.0 100.0 100.0 100.0 100.0 100.0 Obs. 240 240 240 240 240 240 1,440
In the past 12 months, have you or anyone in your household let non-relatives in the village or the tambon use farm equipment for free? (rp26)
rp26 Chachoeng Buriram Lop Buri SiSaket Phrae Satun Total Yes 2.1 9.6 0.8 12.1 7.5 14.6 7.8 No 97.9 90.4 99.2 87.9 92.5 85.4 92.2 Total 100.0 100.0 100.0 100.0 100.0 100.0 100.0 Obs. 240 240 240 240 240 240 1,440
In the past 12 months, have any non-relatives in the village or the tambon let you or anyone in your household use farm equipment for free? (rp27)
rep27 Chachoeng Buriram Lop Buri SiSaket Phrae Satun Total Yes 2.1 9.6 0.8 11.7 6.7 14.2 7.5 No 97.9 90.4 99.2 88.3 93.3 85.8 92.5 Total 100.0 100.0 100.0 100.0 100.0 100.0 100.0 Obs. 240 240 240 240 240 240 1,440
In the past 12 months, have your or anyone in your household helped non-relatives in the village or the tambon with money? (rp28)
rp28 Chachoeng Buriram Lop Buri SiSaket Phrae Satun Total Yes 25.8 45.0 16.3 4.6 42.9 27.5 27.0 No 74.2 55.0 83.8 95.4 57.1 72.5 73.0 Total 100.0 100.0 100.0 100.0 100.0 100.0 100.0 Obs. 240 240 240 240 240 240 1,440
In the past 12 months, have any non-relatives in the village or the tambon helped you or anyone in your household with money? (rp29)
rp29 Chachoeng Buriram Lop Buri SiSaket Phrae Satun Total Yes 21.3 46.3 16.7 5.4 37.9 30.0 26.3 No 78.8 53.8 83.3 94.6 62.1 70.0 73.8 Total 100.0 100.0 100.0 100.0 100.0 100.0 100.0 Obs. 240 240 240 240 240 240 1,440

Minister of Finance Initial Household Survey 2005
38
Section IX. Parents’ characteristics
Head’s Parents
What was head’s father’s primary occupation during most of his life? (pw1)
Occupation Chachoeng Buriram Lop Buri SiSaket Phrae Satun Total Inactive or retired - 0.8 0.8 0.4 0.8 0.8 0.6 Rice farmer 23.8 55.4 35.4 73.8 44.6 14.2 41.2 Corn farmer 0.8 0.4 3.3 - 1.7 - 1.0 Shrimp farmer - - 0.4 - - - 0.1 Raise fish other than shrimp 1.7 - - - - - 0.3 Orchard farmer 7.9 1.3 0.8 0.4 0.8 6.3 2.9 Farmer growing a different crop 1.3 1.3 2.9 0.4 0.4 0.4 1.1 Raise livestock: chicken or duck 0.8 - - - - - 0.1 Raise livestock: pig, cow or buffalo - - 1.3 - 0.4 0.4 0.4 Construction work in village 0.4 - 0.4 - 0.8 1.7 0.6 Construction work out of village but in changwat 0.4 0.4 1.7 - 0.4 - 0.5 Construction work in another changwat - 0.4 2.1 - 0.4 - 0.5 Rice miller 0.4 - - - - - 0.1 Shopkeeper 5.0 1.7 9.2 2.5 0.8 2.9 3.7 Factory worker - 0.8 0.8 0.4 - - 0.4 Mechanic - 0.8 0.4 0.4 - 0.4 0.4 Clerical worker 0.8 - - - - - 0.1 Administrative or managerial job 2.1 0.4 - - 0.4 0.8 0.6 Teacher 2.9 2.9 0.8 1.3 0.8 0.4 1.5 Policeman 0.8 3.8 0.4 1.3 2.5 0.4 1.5 Government official 4.6 8.8 6.3 1.7 5.0 0.8 4.5 Accountant - - - - 0.4 - 0.1 Electrician - 0.4 0.4 - - 0.4 0.2 Cleaner or janitor - - - 0.4 0.4 - 0.1 Trader 27.1 9.6 10.8 12.5 12.5 12.9 14.2 Other 17.5 10.8 20.0 4.2 25.4 56.7 22.4 .a 1.7 - - - - - 0.3 .b - - 1.7 - 1.3 0.4 0.6 .c - - - 0.4 - - 0.1 Total 100.0 100.0 100.0 100.0 100.0 100.0 100.0 Obs. 240 240 240 240 240 240 1,440
How much schooling did head’s father complete? (pw2)
Education Chachoeng Buriram Lop Buri SiSaket Phrae Satun Total No education 35.8 24.6 23.8 17.5 13.8 54.2 28.3 Less than Elementary 15.8 12.5 8.8 3.3 8.8 8.3 9.6 Elementary grade 4 38.3 46.3 52.1 72.1 55.0 30.0 49.0 More than Elementary 7.5 16.7 11.7 5.8 16.7 4.6 10.5 .a 1.7 - - - - - 0.3 .b 0.8 - 3.8 0.8 5.8 2.9 2.4 .c - - - 0.4 - - 0.1 Total 100.0 100.0 100.0 100.0 100.0 100.0 100.0 Obs. 240 240 240 240 240 240 1,440

Minister of Finance Initial Household Survey 2005
39
Head’s Parents (Cont.)
What was head’s mother’s primary occupation during most of his life? (pw1)
Occupation Chachoeng Buriram Lop Buri SiSaket Phrae Satun Total Inactive or retired 3.3 2.5 1.7 0.8 0.4 1.7 1.7 Rice farmer 24.6 57.5 35.8 76.7 44.6 15.0 42.4 Corn farmer 0.4 0.4 3.3 - 1.7 - 1.0 Shrimp farmer - - 0.4 - - - 0.1 Raise fish other than shrimp 1.7 - - - - - 0.3 Orchard farmer 8.3 0.8 0.8 0.4 0.8 4.6 2.6 Farmer growing a different crop 1.3 0.8 2.9 - 0.4 0.4 1.0 Raise livestock: chicken or duck 0.8 - - - - - 0.1 Raise livestock: pig, cow or buffalo - - 1.7 - 0.4 0.4 0.4 Construction work in the village - - 0.4 - - - 0.1 Construction work out of the village but in changwat 0.4 - 0.8 - - - 0.2 Construction work in another changwat 0.4 - 0.4 - - - 0.1 Rice miller 0.4 - 0.4 - - - 0.1 Shopkeeper 5.4 1.7 9.6 2.1 0.4 3.3 3.8 Factory worker 0.8 - 0.4 - - 0.4 0.3 Administrative or managerial job 0.4 - - - - - 0.1 Teacher 0.4 1.7 0.4 0.4 0.8 - 0.6 Government official - 0.8 0.4 0.8 0.8 0.4 0.6 Cleaner or janitor - - 0.4 0.4 - 0.4 0.2 Trader 33.8 20.8 17.9 13.8 19.6 15.4 20.2 Other 15.8 12.9 21.3 4.2 28.3 57.5 23.3 .a 1.7 - - - - - 0.3 .b - - 0.8 - 1.7 0.4 0.5 .c - - - 0.4 - - 0.1 Total 100.0 100.0 100.0 100.0 100.0 100.0 100.0 Obs. 240 240 240 240 240 240 1,440
How much schooling did head’s mother complete? (pw2)
Education Chachoeng Buriram Lop Buri SiSaket Phrae Satun Total No education 45.4 37.5 32.5 18.3 19.6 59.6 35.5 Less than Elementary 16.7 13.3 9.2 3.3 7.9 7.9 9.7 Elementary grade 4 33.3 45.0 50.8 74.6 62.1 27.9 49.0 More than Elementary 2.1 4.2 3.8 2.5 5.4 1.3 3.2 .a 1.7 - - - - - 0.3 .b 0.8 - 3.8 0.8 5.0 3.3 2.3 .c - - - 0.4 - - 0.1 Total 100.0 100.0 100.0 100.0 100.0 100.0 100.0 Obs. 240 240 240 240 240 240 1,440

Minister of Finance Initial Household Survey 2005
40
Head’s Parents (Cont.)
How much land did head’s parents own? (pw4)
Rai
Province Obs Mean Std. Dev. Min Max Chachoeng 183 18.5 40.0 0.0 300Buriram 240 25.1 47.7 0.1 500Lop Buri 217 20.2 53.4 0.0 500SiSaket 174 22.0 33.0 0.0 270Phrae 226 5.5 16.7 0.1 200Satun 205 10.0 12.6 0.0 100Total 1,245 16.8 38.0 0.0 500
Rai Chachoeng Buriram Lop Buri SiSaket Phrae Satun Total Equal to 0 - - - 4.6 - 0.4 0.8 0.01 to 1 33.8 23.8 46.3 9.6 52.9 16.7 30.5 1.01 to 2 4.2 4.6 5.4 2.9 5.8 7.5 5.1 2.01 to 3 2.1 2.9 1.3 1.3 6.3 8.3 3.7 3.01 to 4 2.5 2.1 1.3 2.1 2.9 2.5 2.2 4.01 to 5 1.3 4.2 - 2.5 3.8 7.1 3.1 5.01 to 10 8.8 11.3 8.3 12.1 12.9 20.0 12.2
10.01 to 15 3.8 7.5 3.3 4.6 5.4 7.5 5.4 15.01 to 20 2.9 10.0 5.0 10.4 0.4 6.7 5.9 20.01 to 30 4.6 10.8 5.8 10.8 1.3 4.2 6.3 30.01 to 40 2.5 7.1 1.7 2.5 - 2.1 2.6 40.01 to 50 3.3 5.8 2.9 2.1 0.8 1.7 2.8 50.01 to 60 1.3 3.3 0.4 2.1 0.4 0.4 1.3 60.01 to 100 2.5 3.8 6.7 3.3 0.8 0.4 2.9 Above 100 2.9 2.9 2.1 1.7 0.4 - 1.7
.a 20.8 - - - 0.4 - 3.5
.b 2.9 - 9.6 27.5 5.4 14.6 10.0 Total 100.0 100.0 100.0 100.0 100.0 100.0 100.0 Obs. 240 240 240 240 240 240 1,440

Minister of Finance Initial Household Survey 2005
41
Head’s Parents (Cont.)
How did head’s parents acquire this land? (pw5)
Codes A Purchased B Inherited C Cleared D Land Reform Program E Rented land F From a relative G Other MI Missing Value NA Not Applicable RF Refuse to answer
land Chachoeng Buriram Lop Buri SiSaket Phrae Satun Total A 17.5 18.8 22.1 7.9 6.7 10.8 14.0
A,B 1.3 1.7 0.4 1.7 2.1 3.3 1.7 A,B,C - 1.3 - - - - 0.2 A,B,E 0.4 - - - - - 0.1 A,C - - - - - 0.4 0.1 A,E - 0.4 - - - - 0.1 B 27.1 52.9 40.0 53.8 78.3 35.0 47.9
B,C - 1.7 0.4 0.4 0.4 2.1 0.8 B,C,E - 0.4 - - - - 0.1 B,E 0.4 0.4 - - 0.4 - 0.2 C 1.7 13.8 6.3 2.1 0.8 27.9 8.8
C,E - 0.4 - - - - 0.1 D 0.8 - - - - - 0.1
DK 1.7 - 5.8 28.8 2.9 12.1 8.5 E 32.5 7.9 17.5 1.3 6.7 6.7 12.1
E,F - - 0.8 - - - 0.1 F 1.7 - 1.3 0.4 1.3 - 0.8 G 0.4 0.4 2.5 0.4 - 1.3 0.8
NA - - 2.9 3.3 - 0.4 1.1 RF 14.6 - - - 0.4 - 2.5
Total 100.0 100.0 100.0 100.0 100.0 100.0 100.0 Obs. 240 240 240 240 240 240 1,440

Minister of Finance Initial Household Survey 2005
42
Spouse’s parents
What was spouse’s father’s primary occupation during most of his life? (pw1)
Occupation Chachoeng Buriram Lop Buri SiSaket Phrae Satun Total Inactive or retired 0.8 0.4 0.4 0.8 - - 0.4 Rice farmer 22.5 60.8 36.3 73.3 40.4 14.6 41.3 Corn farmer 0.8 - 3.8 - 1.7 - 1.0 Raise fish other than shrimp 0.8 - - - - 0.8 0.3 Orchard farmer 5.8 0.8 - 1.7 0.8 4.6 2.3 Farmer growing a different crop 2.1 0.4 0.8 - 0.8 0.4 0.8 Raise livestock: chicken or duck - - - - - 0.4 0.1 Raise livestock: pig, cow or buffalo - - 0.4 - 0.4 0.8 0.3 Construction work in the village 0.8 1.3 0.8 - 1.3 0.8 0.8 Construction work out of the village but in changwat 0.4 1.3 0.8 0.4 0.8 - 0.6 Construction work in another changwat - - - - 0.8 - 0.1 Rice miller 0.4 - - - 0.4 - 0.1 Shopkeeper 2.5 1.7 7.9 2.5 1.3 0.8 2.8 Factory worker 0.4 - 1.7 - - 0.8 0.5 Mechanic 0.8 - - - - 0.4 0.2 Administrative or managerial job 1.7 0.4 0.4 - - - 0.4 Teacher 0.4 2.5 1.3 2.9 1.3 - 1.4 Policeman 2.1 2.5 0.4 - 1.7 - 1.1 Government official 3.3 5.8 5.0 2.9 4.2 1.7 3.8 Accountant - 0.4 - - - - 0.1 Cleaner or janitor - - - - 0.4 - 0.1 Trader 23.3 9.2 8.3 11.3 8.8 13.3 12.4 Other 14.2 5.4 16.7 1.3 19.6 51.3 18.1 .a 6.7 1.3 2.5 0.4 2.5 4.2 2.9 .b 0.8 0.4 7.1 1.3 3.8 2.1 2.6 .c 9.2 5.4 5.4 1.3 9.2 2.9 5.6 Total 100.0 100.0 100.0 100.0 100.0 100.0 100.0 Obs. 240 240 240 240 240 240 1,440
How much schooling did spouse’s father complete? (pw2)
education Chachoeng Buriram Lop Buri SiSaket Phrae Satun Total No education 32.1 26.7 21.7 13.3 13.3 45.0 25.4 Less than Elementary 13.8 10.4 7.9 3.8 7.5 8.8 8.7 Elementary grade 4 30.8 44.6 39.2 73.3 50.4 32.5 45.1 More than Elementary 4.6 11.7 8.8 6.3 10.0 3.3 7.4 .a 8.3 1.3 2.5 0.4 2.5 4.2 3.2 .b 1.3 - 14.6 1.7 7.1 3.3 4.7 .c 9.2 5.4 5.4 1.3 9.2 2.9 5.6 Total 100.0 100.0 100.0 100.0 100.0 100.0 100.0 Obs. 240 240 240 240 240 240 1,440

Minister of Finance Initial Household Survey 2005
43
Spouse’s parents (Cont.)
What was spouse’s mother’s primary occupation during most of his life? (pw1)
Occupation Chachoeng Buriram Lop Buri SiSaket Phrae Satun Total Inactive or retired 4.6 1.7 - 1.3 0.4 0.8 1.5 Rice farmer 24.2 62.1 35.4 76.7 40.8 14.6 42.3 Corn farmer 0.8 - 3.8 - 1.7 - 1.0 Raise fish other than shrimp 0.8 - - - - 0.8 0.3 Orchard farmer 5.4 0.8 - 1.3 0.8 4.2 2.1 Farmer growing a different crop 2.5 0.4 0.8 - 1.3 0.4 0.9 Raise livestock: chicken or duck - - - - - 0.4 0.1 Raise livestock: pig, cow or buffalo - - 0.4 - - 0.8 0.2 Construction work in the village 1.3 - - - - - 0.2 Construction work out of the village but in changwat - - 0.8 0.4 - - 0.2 Rice miller - - - - 0.4 - 0.1 Shopkeeper 2.5 2.1 7.5 2.9 1.3 0.8 2.9 Factory worker 0.4 - 0.8 - - 0.8 0.4 Mechanic 0.4 - - - - 0.4 0.1 Administrative or managerial job 0.4 - - - - 0.4 0.1 Teacher - 0.4 - 0.8 0.4 - 0.3 Government official 0.4 1.3 1.7 0.4 1.3 - 0.8 Cleaner or janitor 1.3 - - - - - 0.2 Trader 25.8 16.7 12.5 12.1 13.3 15.8 16.0 Other 12.5 7.5 20.8 1.3 22.9 50.8 19.3 .a 6.7 1.3 2.5 0.4 2.5 4.2 2.9 .b 0.8 0.4 7.5 1.3 3.8 1.7 2.6 .c 9.2 5.4 5.4 1.3 9.2 2.9 5.6 Total 100.0 100.0 100.0 100.0 100.0 100.0 100.0 Obs. 240 240 240 240 240 240 1,440
How much schooling did spouse’s mother complete? (pw2)
pw2 Chachoeng Buriram Lop Buri SiSaket Phrae Satun Total No education 35.8 35.4 23.8 15.8 15.8 50.8 29.6 Less than Elementary 15.0 12.5 7.9 5.0 7.1 8.3 9.3 Elementary grade 4 29.6 40.4 42.1 74.6 53.8 27.5 44.7 More than Elementary 0.8 5.0 3.8 1.3 4.2 2.5 2.9 .a 8.3 1.3 2.5 0.4 2.5 4.2 3.2 .b 1.3 - 14.6 1.7 7.5 3.8 4.8 .c 9.2 5.4 5.4 1.3 9.2 2.9 5.6 Total 100.0 100.0 100.0 100.0 100.0 100.0 100.0 Obs. 240 240 240 240 240 240 1,440

Minister of Finance Initial Household Survey 2005
44
Spouse’s parents (Cont.)
How much land did spouse’s parents own? (pw4)
Rai
Province Obs Mean Std. Dev. Min Max Chachoeng 136 24.4 91.0 0.0 1,000Buriram 219 21.1 28.7 0.1 200Lop Buri 171 13.7 24.6 0.0 200SiSaket 178 23.7 34.9 0.0 260Phrae 182 4.9 11.9 0.1 100Satun 181 8.4 12.7 0.0 100Total 1,067 15.9 40.3 0.0 1,000
Rai Chachoeng Buriram Lop Buri SiSaket Phrae Satun Total Equal to 0 - - - 4.6 - 0.8 0.9 0.01 to 1 22.9 18.8 33.8 8.8 42.9 18.3 24.2 1.01 to 2 3.3 5.4 6.3 2.5 4.2 8.3 5.0 2.01 to 3 2.1 1.7 0.4 1.7 2.5 7.1 2.6 3.01 to 4 0.4 1.7 1.7 1.7 4.6 3.8 2.3 4.01 to 5 2.9 3.8 0.8 0.8 4.2 5.8 3.1 5.01 to 10 5.8 17.1 4.6 14.2 10.4 16.3 11.4
10.01 to 15 2.1 5.8 3.3 9.6 2.5 5.4 4.8 15.01 to 20 4.2 7.9 6.7 6.7 2.5 3.8 5.3 20.01 to 30 5.4 9.6 4.2 8.8 0.4 2.9 5.2 30.01 to 40 - 3.8 2.5 3.8 0.4 1.3 1.9 40.01 to 50 2.5 9.2 2.5 3.8 0.4 0.4 3.1 50.01 to 60 - 2.1 2.1 1.7 - - 1.0 60.01 to 100 3.8 2.9 2.1 4.6 0.8 1.3 2.6 Above 100 1.3 1.7 0.4 1.3 - - 0.8
.a 30.4 2.5 2.5 0.4 2.9 4.2 7.2
.b 3.8 0.8 21.3 24.2 12.1 17.5 13.3
.c 9.2 5.4 5.0 1.3 9.2 2.9 5.5 Total 100.0 100.0 100.0 100.0 100.0 100.0 100.0 Obs. 240 240 240 240 240 240 1,440

Minister of Finance Initial Household Survey 2005
45
Spouse’s parents (Cont.)
How did spouse’s parents acquire this land? (pw5)
Codes A Purchased B Inherited C Cleared D Land Reform Program E Rented land F From a relative G Other MI Missing Value NA Not Applicable RF Refuse to answer
pw5 Chachoeng Buriram Lop Buri SiSaket Phrae Satun Total A 17.5 18.8 22.1 7.9 6.7 10.8 14.0
A,B 1.3 1.7 0.4 1.7 2.1 3.3 1.7 A,B,C - 1.3 - - - - 0.2 A,B,E 0.4 - - - - - 0.1 A,C - - - - - 0.4 0.1 A,E - 0.4 - - - - 0.1 B 27.1 52.9 40.0 53.8 78.3 35.0 47.9
B,C - 1.7 0.4 0.4 0.4 2.1 0.8 B,C,E - 0.4 - - - - 0.1 B,E 0.4 0.4 - - 0.4 - 0.2 C 1.7 13.8 6.3 2.1 0.8 27.9 8.8
C,E - 0.4 - - - - 0.1 D 0.8 - - - - - 0.1
DK 1.7 - 5.8 28.8 2.9 12.1 8.5 E 32.5 7.9 17.5 1.3 6.7 6.7 12.1
E,F - - 0.8 - - - 0.1 F 1.7 - 1.3 0.4 1.3 - 0.8 G 0.4 0.4 2.5 0.4 - 1.3 0.8
NA - - 2.9 3.3 - 0.4 1.1 RF 14.6 - - - 0.4 - 2.5
Total 100.0 100.0 100.0 100.0 100.0 100.0 100.0 Obs. 240 240 240 240 240 240 1,440
Compared to other people in your village, would you say that your household is? (Pw6a)
pw6a Chachoeng Buriram Lop Buri SiSaket Phrae Satun Total Among the poorest hh in the village 8.8 9.6 11.3 4.6 2.1 15.8 8.7 Around the middle in terms of wealth 87.9 87.9 84.6 95.0 97.5 83.3 89.4 Among the richest hh in the village 3.3 2.5 4.2 0.4 0.4 0.8 1.9 Total 100.0 100.0 100.0 100.0 100.0 100.0 100.0 Obs. 240 240 240 240 240 240 1,440

Minister of Finance Initial Household Survey 2005
46
Which of the following statements best describe your household? Of the households in the village who are in the middle in terms of wealth, my household is: (Pw6b)
pw6b Chachoeng Buriram Lop Buri SiSaket Phrae Satun Total Among the poor 3.3 7.1 5.4 2.5 2.9 7.9 4.9 Among the middle 80.8 73.8 71.7 91.3 92.9 73.3 80.6 Among the rich 3.8 7.1 7.5 1.3 1.7 2.1 3.9 .c 12.1 12.1 15.4 5.0 2.5 16.7 10.6 Total 100.0 100.0 100.0 100.0 100.0 100.0 100.0 Obs. 240 240 240 240 240 240 1,440
Compared to other people in the head’s parents village, would you say that the head’s parents were/are? (Pw7a)
pw7a Chachoeng Buriram Lop Buri SiSaket Phrae Satun Total Among the poorest hh in the village 8.8 12.5 13.3 6.3 3.3 17.5 10.3 Around the middle in terms of wealth 84.2 81.7 77.9 92.5 94.6 80.8 85.3 Among the richest hh in the village 6.7 5.8 7.5 1.3 1.7 0.4 3.9 .b 0.4 - 1.3 - 0.4 0.8 0.5 .c - - - - - 0.4 0.1 Total 100.0 100.0 100.0 100.0 100.0 100.0 100.0 Obs. 240 240 240 240 240 240 1,440
Which of the following statements best describe the head’s parents households? Of the households in the village who are in the middle in terms of wealth, the head’s parents were/are: (Pw7b)
pw7b Chachoeng Buriram Lop Buri SiSaket Phrae Satun Total Among the poor 1.7 5.0 3.8 2.9 2.5 5.0 3.5 Among the middle 80.0 71.3 69.6 87.9 90.4 73.8 78.8 Among the rich 2.5 5.0 4.6 1.7 1.7 2.1 2.9 .a - 0.4 - - - - 0.1 .b 0.4 - 1.3 - 0.4 0.8 0.5 .c 15.4 18.3 20.8 7.5 5.0 18.3 14.2 Total 100.0 100.0 100.0 100.0 100.0 100.0 100.0 Obs. 240 240 240 240 240 240 1,440
Compared to other people in the spouse’s parents village, would you say that the spouse’s parents were/are? (Pw8a)
pw8a Chachoeng Buriram Lop Buri SiSaket Phrae Satun Total Among the poorest hh in the village 10.0 15.0 10.0 4.6 6.3 13.8 9.9 Around the middle in terms of wealth 72.1 73.3 77.5 92.1 79.2 77.1 78.5 Among the richest hh in the village 4.2 5.0 3.8 2.1 0.8 1.7 2.9 .a 4.2 1.3 1.3 - 2.5 3.3 2.1 .b 0.4 - 2.5 - 2.1 1.7 1.1 .c 9.2 5.4 5.0 1.3 9.2 2.5 5.4 Total 100.0 100.0 100.0 100.0 100.0 100.0 100.0 Obs. 240 240 240 240 240 240 1,440

Minister of Finance Initial Household Survey 2005
47
Which of the following statements best describe the spouse’s parents households? Of the households in the village who are in the middle in terms of wealth, the spouse’s parents were/are: (Pw8b)
pw8b Chachoeng Buriram Lop Buri SiSaket Phrae Satun Total Among the poor 2.5 5.8 4.2 1.7 2.1 3.8 3.3 Among the middle 68.8 63.8 70.8 88.8 76.7 72.9 73.6 Among the rich 0.8 3.8 2.5 1.7 0.4 0.4 1.6 .a 4.2 1.3 1.3 - 2.5 3.3 2.1 .b 0.4 - 2.5 - 2.1 1.7 1.1 .c 23.3 25.4 18.8 7.9 16.3 17.9 18.3 Total 100.0 100.0 100.0 100.0 100.0 100.0 100.0 Obs. 240 240 240 240 240 240 1,440
Section X. Inheritance
Have you or your spouse inherit from either of your parents? (ih1)
ih1 Chachoeng Buriram Lop Buri SiSaket Phrae Satun Total Yes 36.7 72.1 45.0 73.8 65.0 71.3 60.6 No 63.3 27.9 55.0 26.3 35.0 28.8 39.4 Total 100.0 100.0 100.0 100.0 100.0 100.0 100.0 Obs. 240 240 240 240 240 240 1,440
What did you and your spouse inherit from either of your parents? (ih2)
1. Land – Head
ih2 Chachoeng Buriram Lop Buri SiSaket Phrae Satun Total Yes 58.0 75.7 66.7 55.9 71.2 84.2 69.6 No 42.1 24.3 33.3 43.5 28.9 15.8 30.2 .b - - - 0.6 - - 0.1 Total 100.0 100.0 100.0 100.0 100.0 100.0 100.0 Obs. 88 173 108 177 156 171 873
2. Land – Spouse
ih2 Chachoeng Buriram Lop Buri SiSaket Phrae Satun Total Yes 38.6 48.0 29.6 63.3 44.9 45.6 46.9 No 61.4 52.0 70.4 36.7 55.1 54.4 53.2 Total 100.0 100.0 100.0 100.0 100.0 100.0 100.0 Obs. 88 173 108 177 156 171 873
3. Livestock
ih2 Chachoeng Buriram Lop Buri SiSaket Phrae Satun Total Yes - 4.6 0.9 14.1 - 1.8 4.2 No 100.0 95.4 99.1 85.9 100.0 98.3 95.8 Total 100.0 100.0 100.0 100.0 100.0 100.0 100.0 Obs. 88 173 108 177 156 171 873

Minister of Finance Initial Household Survey 2005
48
What did you and your spouse inherit from either of your parents? (ih2)
Cont.
4. House
ih2 Chachoeng Buriram Lop Buri SiSaket Phrae Satun Total Yes 29.6 26.6 34.3 26.0 26.3 15.2 25.4 No 70.5 73.4 65.7 74.0 73.7 84.8 74.6 Total 100.0 100.0 100.0 100.0 100.0 100.0 100.0 Obs. 88 173 108 177 156 171 873
5. Debt
ih2 Chachoeng Buriram Lop Buri SiSaket Phrae Satun Total Yes 1.1 1.2 1.9 1.1 - 1.2 1.0 No 98.9 98.8 98.2 98.9 100.0 98.8 99.0 Total 100.0 100.0 100.0 100.0 100.0 100.0 100.0 Obs. 88 173 108 177 156 171 873
6. Cash
ih2 Chachoeng Buriram Lop Buri SiSaket Phrae Satun Total Yes 26.1 6.4 19.4 11.9 5.1 3.5 10.3 No 73.9 93.6 80.6 88.1 94.9 96.5 89.7 Total 100.0 100.0 100.0 100.0 100.0 100.0 100.0 Obs. 88 172 108 177 156 171 872
7. Gold or Jewelry
ih2 Chachoeng Buriram Lop Buri SiSaket Phrae Satun Total Yes 12.5 1.2 11.1 2.8 3.2 1.2 4.2 No 87.5 98.8 88.9 97.2 96.8 98.8 95.8 Total 100.0 100.0 100.0 100.0 100.0 100.0 100.0 Obs. 88 172 108 177 156 171 872
8. Other
ih2 Chachoeng Buriram Lop Buri SiSaket Phrae Satun Total Yes 2.3 2.9 3.7 - - 1.2 1.5 No 97.7 97.1 96.3 100.0 100.0 98.8 98.5 Total 100.0 100.0 100.0 100.0 100.0 100.0 100.0 Obs. 88 172 108 177 156 171 872

Minister of Finance Initial Household Survey 2005
49
How many rai were inherited? (ih3a)
1. Land - head
Province Obs Mean Std. Dev. Min Max Chachoeng 51 5.0 9.1 0.0 40.0Buriram 131 5.5 8.8 0.0 59.0Lop Buri 72 8.2 15.0 0.0 100.0SiSaket 99 6.0 8.1 0.0 40.5Phrae 111 2.1 5.5 0.1 50.5Satun 144 5.1 5.8 0.1 30.5Total 608 5.2 8.7 0.0 100.0
2. Land- spouse
Province Obs Mean Std. Dev. Min Max Chachoeng 34 4.2 8.2 0.0 40.0Buriram 83 7.7 10.2 0.0 50.0Lop Buri 32 5.4 8.9 0.1 39.5SiSaket 112 6.8 9.8 0.1 75.0Phrae 70 1.8 2.4 0.1 10.0Satun 78 3.8 3.8 0.1 19.0Total 409 5.2 8.1 0.0 75.0
In what year did you inherit? (ih4)
ih4 Chachoeng Buriram Lop Buri SiSaket Phrae Satun Total 1920-1950 0.1 0.1 - 0.4 0.1 0.5 0.2 1951-1970 2.1 2.7 3.5 2.0 1.7 2.5 2.4 1971-1980 3.3 3.5 3.8 5.2 1.8 2.7 3.4 1981-1990 2.8 4.9 3.0 5.7 3.5 3.8 4.2 1991-2000 4.3 5.8 7.1 6.1 5.8 6.8 6.1 2001-2005 3.0 2.9 2.8 2.5 3.4 2.3 2.8
DK 0.6 - 0.4 0.1 2.2 0.4 0.6 NA 81.8 80.1 79.5 78.0 81.6 80.9 80.2 RF 2.0 - - - - - 0.2
Total 100.0 99.9 100.0 100.0 100.0 100.0 100.0 Obs. 704 1,381 864 1,416 1,248 1,368 6,981

Minister of Finance Initial Household Survey 2005
50
Section XI. Household Assets
Does anyone who usually lives in the household own any of the following assets? If so, how many? (ha2)
And for how many years has the household owned this item? (ha5)
1. TV-color
Quantity Chachoeng Buriram Lop Buri SiSaKet Phrae Satun Total 0 1.3 0.8 1.3 1.3 - 2.5 1.2 1 98.8 99.2 98.8 98.8 100.0 97.5 98.8
Total 100.0 100.0 100.0 100.0 100.0 100.0 100.0 Obs. 240 240 240 240 240 240 1,440
Number of years
Years Chachoeng Buriram Lop Buri SiSaket Phrae Satun Total Equal to 0 0.4 1.3 0.4 - 0.8 0.8 0.6 0.01 to 5 32.5 31.3 28.3 40.8 38.8 37.1 34.8 5.01 to 10 37.5 38.8 35.4 39.2 35.0 41.3 37.9
10.01 to 20 22.9 22.5 30.0 16.7 21.3 17.5 21.8 20.01 to 40 3.3 5.4 4.2 2.1 4.2 0.8 3.3 Above 40 3.3 0.8 1.7 1.3 - 2.5 1.6
Total 100.0 100.0 100.0 100.0 100.0 100.0 100.0 Obs. 240 240 240 240 240 240 1,440
2. VCR
Quantity Chachoeng Buriram Lop Buri SiSaKet Phrae Satun Total 0 76.7 75.4 71.7 77.5 62.1 37.5 66.8 1 23.3 24.6 28.3 22.5 37.9 62.5 33.2
Total 100.0 100.0 100.0 100.0 100.0 100.0 100.0 Obs. 240 240 240 240 240 240 1,440
Number of years
Years Chachoeng Buriram Lop Buri SiSaket Phrae Satun Total 0.01 to 5 12.5 13.3 13.8 12.9 24.2 49.2 21.0 5.01 to 10 7.5 7.9 10.8 7.9 10.4 12.1 9.4
10.01 to 20 3.3 2.9 2.9 1.7 2.9 0.4 2.4 20.01 to 40 - 0.4 - - 0.4 0.4 0.2 Above 40 76.7 75.4 72.5 77.5 62.1 37.9 67.0
Total 100.0 100.0 100.0 100.0 100.0 100.0 100.0 Obs. 240 240 240 240 240 240 1,440

Minister of Finance Initial Household Survey 2005
51
Does anyone who usually lives in the household own any of the following assets? If so, how many? (ha2)
And for how many years has the household owned this item? (ha5)
Cont.
3. Air Conditioner
Quantity Chachoeng Buriram Lop Buri SiSaKet Phrae Satun Total 0 69.6 82.5 70.8 83.8 80.8 97.5 80.8 1 30.4 17.5 29.2 16.3 19.2 2.5 19.2
Total 100.0 100.0 100.0 100.0 100.0 100.0 100.0 Obs. 240 240 240 240 240 240 1,440
Number of years
Years Chachoeng Buriram Lop Buri SiSaket Phrae Satun Total Equal to 0 0.4 - 0.4 0.4 - - 0.2 0.01 to 5 16.7 11.7 12.9 7.9 7.9 1.7 9.8 5.01 to 10 10.8 4.2 11.7 5.8 7.1 0.8 6.7
10.01 to 20 2.5 1.3 3.8 1.7 4.2 - 2.2 20.01 to 40 - 0.4 0.4 0.4 - - 0.2 Above 40 69.6 82.5 70.8 83.8 80.8 97.5 80.8
Total 100.0 100.0 100.0 100.0 100.0 100.0 100.0 Obs. 240 240 240 240 240 240 1,440
4. Regular Telephone
Quantity Chachoeng Buriram Lop Buri SiSaKet Phrae Satun Total 0 37.9 54.2 43.3 56.3 44.6 72.5 51.5 1 62.1 45.8 56.7 43.8 55.4 27.5 48.5
Total 100.0 100.0 100.0 100.0 100.0 100.0 100.0 Obs. 240 240 240 240 240 240 1,440
Number of years
Years Chachoeng Buriram Lop Buri SiSaket Phrae Satun Total Equal to 0 - - - 0.4 - - 0.1 0.01 to 5 14.6 13.8 13.8 11.7 12.5 12.5 13.1 5.01 to 10 23.3 21.3 25.8 19.2 23.8 11.3 20.8
10.01 to 20 19.2 8.8 15.0 11.7 15.4 2.9 12.2 20.01 to 40 3.3 2.1 2.1 0.8 2.5 - 1.8 Above 40 39.6 54.2 43.3 56.3 45.8 73.3 52.1
Total 100.0 100.0 100.0 100.0 100.0 100.0 100.0 Obs. 240 240 240 240 240 240 1,440

Minister of Finance Initial Household Survey 2005
52
Does anyone who usually lives in the household own any of the following assets? If so, how many? (ha2)
And for how many years has the household owned this item? (ha5)
Cont.
5. Cellular Telephone
Quantity Chachoeng Buriram Lop Buri SiSaKet Phrae Satun Total 0 24.2 22.9 22.1 30.8 32.1 46.3 29.7 1 75.8 77.1 77.9 69.2 67.9 53.8 70.3
Total 100.0 100.0 100.0 100.0 100.0 100.0 100.0 Obs. 240 240 240 240 240 240 1,440
Number of years
Years Chachoeng Buriram Lop Buri SiSaket Phrae Satun Total Equal to 0 0.8 1.3 0.4 0.4 0.4 0.4 0.6 0.01 to 5 65.4 67.1 65.8 60.0 59.2 49.6 61.2 5.01 to 10 7.9 8.8 10.8 7.5 7.1 2.9 7.5
10.01 to 20 0.8 - 0.8 0.8 1.3 - 0.6 Above 40 25.0 22.9 22.1 31.3 32.1 47.1 30.1
Total 100.0 100.0 100.0 100.0 100.0 100.0 100.0 Obs. 240 240 240 240 240 240 1,440
6. Refrigerator
Quantity Chachoeng Buriram Lop Buri SiSaKet Phrae Satun Total 0 7.1 6.7 3.8 11.3 5.0 10.8 7.4 1 92.9 93.3 96.3 88.8 95.0 89.2 92.6
Total 100.0 100.0 100.0 100.0 100.0 100.0 100.0 Obs. 240 240 240 240 240 240 1,440
Number of years
Years Chachoeng Buriram Lop Buri SiSaket Phrae Satun Total Equal to 0 - 0.4 1.3 - - 0.8 0.4 0.01 to 5 24.2 27.5 24.6 30.4 23.8 26.3 26.1 5.01 to 10 40.4 36.3 35.4 35.4 35.4 47.9 38.5
10.01 to 20 22.1 23.8 30.0 19.6 27.5 9.6 22.1 20.01 to 40 5.4 5.0 5.0 2.9 8.3 2.5 4.9 Above 40 7.9 7.1 3.8 11.7 5.0 12.9 8.1
Total 100.0 100.0 100.0 100.0 100.0 100.0 100.0 Obs. 240 240 240 240 240 240 1,440

Minister of Finance Initial Household Survey 2005
53
Does anyone who usually lives in the household own any of the following assets? If so, how many? (ha2)
And for how many years has the household owned this item? (ha5)
Cont.
7. Motorcycle
Quantity Chachoeng Buriram Lop Buri SiSaKet Phrae Satun Total 0 24.6 12.9 19.2 15.4 12.1 10.4 15.8 1 75.4 87.1 80.8 84.6 87.9 89.6 84.2
Total 100.0 100.0 100.0 100.0 100.0 100.0 100.0 Obs. 240 240 240 240 240 240 1,440
Number of years
Years Chachoeng Buriram Lop Buri SiSaket Phrae Satun Total Equal to 0 0.8 0.8 0.4 0.4 0.8 - 0.6 0.01 to 5 38.3 33.3 35.8 34.2 43.3 47.1 38.7 5.01 to 10 20.8 33.3 21.7 31.3 26.3 32.1 27.6
10.01 to 20 12.1 17.1 20.4 16.7 15.8 10.4 15.4 20.01 to 40 2.5 2.5 2.5 2.1 1.7 - 1.9 Above 40 25.4 12.9 19.2 15.4 12.1 10.4 15.9
Total 100.0 100.0 100.0 100.0 100.0 100.0 100.0 Obs. 240 240 240 240 240 240 1,440
8. Car
Quantity Chachoeng Buriram Lop Buri SiSaKet Phrae Satun Total 0 79.2 87.5 87.5 88.3 84.2 92.9 86.6 1 20.8 12.5 12.5 11.7 15.8 7.1 13.4
Total 100.0 100.0 100.0 100.0 100.0 100.0 100.0 Obs. 240 240 240 240 240 240 1,440
Number of years
Years Chachoeng Buriram Lop Buri SiSaket Phrae Satun Total Equal to 0 - - 0.8 - - - 0.1 0.01 to 5 12.1 5.4 5.4 5.0 7.1 3.8 6.5 5.01 to 10 5.0 5.8 4.6 3.8 6.3 3.3 4.8
10.01 to 20 3.3 0.8 1.7 2.9 1.7 - 1.7 20.01 to 40 0.4 0.4 - - 0.8 - 0.3 Above 40 79.2 87.5 87.5 88.3 84.2 92.9 86.6
Total 100.0 100.0 100.0 100.0 100.0 100.0 100.0 Obs. 240 240 240 240 240 240 1,440

Minister of Finance Initial Household Survey 2005
54
Does anyone who usually lives in the household own any of the following assets? If so, how many? (ha2)
And for how many years has the household owned this item? (ha5)
Cont.
9. Pick-up Truck
Quantity Chachoeng Buriram Lop Buri SiSaKet Phrae Satun Total 0 77.5 79.6 75.8 77.9 72.1 95.0 79.7 1 22.5 20.4 24.2 22.1 27.9 5.0 20.4
Total 100.0 100.0 100.0 100.0 100.0 100.0 100.0 Obs. 240 240 240 240 240 240 1,440
Number of years
Years Chachoeng Buriram Lop Buri SiSaket Phrae Satun Total Equal to 0 0.4 2.5 0.8 - 1.3 0.4 0.9 0.01 to 5 10.4 8.8 7.9 9.2 14.6 2.5 8.9 5.01 to 10 5.8 5.8 8.3 7.9 9.2 1.7 6.5
10.01 to 20 5.0 2.9 6.7 4.6 2.5 0.4 3.7 20.01 to 40 0.4 0.4 0.4 0.4 0.4 - 0.4 Above 40 77.9 79.6 75.8 77.9 72.1 95.0 79.7
Total 100.0 100.0 100.0 100.0 100.0 100.0 100.0 Obs. 240 240 240 240 240 240 1,440
10. Long Tail Boat with Motor
Quantity Chachoeng Buriram Lop Buri SiSaKet Phrae Satun Total 0 99.6 100.0 100.0 100.0 100.0 96.3 99.3 1 0.4 - - - - 3.8 0.7
Total 100.0 100.0 100.0 100.0 100.0 100.0 100.0 Obs. 240 240 240 240 240 240 1,440
Number of years
Years Chachoeng Buriram Lop Buri SiSaket Phrae Satun Total 0.01 to 5 - - - - - 1.7 0.3 5.01 to 10 - - - - - 1.3 0.2
10.01 to 20 0.4 - - - - 0.8 0.2 Above 40 99.6 100.0 100.0 100.0 100.0 96.3 99.3
Total 100.0 100.0 100.0 100.0 100.0 100.0 100.0 Obs. 240 240 240 240 240 240 1,440

Minister of Finance Initial Household Survey 2005
55
Does anyone who usually lives in the household own any of the following assets? If so, how many? (ha2)
And for how many years has the household owned this item? (ha5)
Cont.
11. Large Fishing Boat
Quantity Chachoeng Buriram Lop Buri SiSaKet Phrae Satun Total 0 99.2 99.6 100.0 100.0 100.0 98.8 99.6 1 0.8 0.4 - - - 1.3 0.4
Total 100.0 100.0 100.0 100.0 100.0 100.0 100.0 Obs. 240 240 240 240 240 240 1,440
Number of years
Years Chachoeng Buriram Lop Buri SiSaket Phrae Satun Total 0.01 to 5 - 0.4 - - - 0.4 0.1 5.01 to 10 0.4 - - - - - 0.1
10.01 to 20 0.4 - - - - 0.8 0.2 Above 40 99.2 99.6 100.0 100.0 100.0 98.8 99.6
Total 100.0 100.0 100.0 100.0 100.0 100.0 100.0 Obs. 240 240 240 240 240 240 1,440
12. Washing Machine
Quantity Chachoeng Buriram Lop Buri SiSaKet Phrae Satun Total 0 36.3 36.7 25.4 41.7 18.8 45.4 34.0 1 63.8 63.3 74.6 58.3 81.3 54.6 66.0
Total 100.0 100.0 100.0 100.0 100.0 100.0 100.0 Obs. 240 240 240 240 240 240 1,440
Number of years
Years Chachoeng Buriram Lop Buri SiSaket Phrae Satun Total Equal to 0 0.4 0.8 2.5 0.4 0.4 - 0.8 0.01 to 5 37.5 36.3 40.4 38.3 40.0 34.6 37.9 5.01 to 10 21.3 22.1 22.9 16.3 28.3 17.5 21.4
10.01 to 20 3.8 3.8 8.3 3.3 11.7 2.5 5.6 20.01 to 40 0.4 0.4 0.4 - 0.8 - 0.4 Above 40 36.7 36.7 25.4 41.7 18.8 45.4 34.1
Total 100.0 100.0 100.0 100.0 100.0 100.0 100.0 Obs. 240 240 240 240 240 240 1,440

Minister of Finance Initial Household Survey 2005
56
Does anyone who usually lives in the household own any of the following assets? If so, how many? (ha2)
And for how many years has the household owned this item? (ha5)
Cont.
13. Gas Stove
Quantity Chachoeng Buriram Lop Buri SiSaKet Phrae Satun Total 0 5.8 14.2 10.4 18.8 7.9 8.8 11.0 1 94.2 85.8 89.6 81.3 92.1 91.3 89.0
Total 100.0 100.0 100.0 100.0 100.0 100.0 100.0 Obs. 240 240 240 240 240 240 1,440
Number of years
Years Chachoeng Buriram Lop Buri SiSaket Phrae Satun Total Equal to 0 - - 0.4 - 0.4 - 0.1 0.01 to 5 34.2 32.1 27.1 30.8 28.3 30.0 30.4 5.01 to 10 39.2 38.8 39.6 36.7 39.2 42.1 39.2
10.01 to 20 17.5 13.3 19.2 11.7 20.4 15.4 16.3 20.01 to 40 2.1 1.3 2.1 2.1 3.8 2.9 2.4 Above 40 7.1 14.6 11.7 18.8 7.9 9.6 11.6
Total 100.0 100.0 100.0 100.0 100.0 100.0 100.0 Obs. 240 240 240 240 240 240 1,440
14. Bicycle
Quantity Chachoeng Buriram Lop Buri SiSaKet Phrae Satun Total 0 52.5 37.5 48.8 42.1 35.0 69.2 47.5 1 47.5 62.5 51.3 57.9 65.0 30.8 52.5
Total 100.0 100.0 100.0 100.0 100.0 100.0 100.0 Obs. 240 240 240 240 240 240 1,440
Number of years
Years Chachoeng Buriram Lop Buri SiSaket Phrae Satun Total Equal to 0 1.7 0.4 3.3 0.8 0.8 - 1.2 0.01 to 5 32.9 37.1 28.8 42.5 39.6 25.4 34.4 5.01 to 10 8.3 17.9 12.9 10.4 18.8 3.8 12.0
10.01 to 20 3.8 4.6 4.6 4.2 5.0 0.8 3.8 20.01 to 40 0.4 2.1 1.7 - 0.8 0.4 0.9 Above 40 52.9 37.9 48.8 42.1 35.0 69.6 47.7
Total 100.0 100.0 100.0 100.0 100.0 100.0 100.0 Obs. 240 240 240 240 240 240 1,440

Minister of Finance Initial Household Survey 2005
57
Does anyone who usually lives in the household own any of the following assets? If so, how many? (ha2)
And for how many years has the household owned this item? (ha5)
Cont.
15. Stereo
Quantity Chachoeng Buriram Lop Buri SiSaKet Phrae Satun Total 0 73.8 67.9 60.8 73.8 55.4 85.8 69.6 1 26.3 32.1 39.2 26.3 44.6 14.2 30.4
Total 100.0 100.0 100.0 100.0 100.0 100.0 100.0 Obs. 240 240 240 240 240 240 1,440
Number of years
Years Chachoeng Buriram Lop Buri SiSaket Phrae Satun Total Equal to 0 - - - 0.4 0.4 - 0.1 0.01 to 5 14.6 13.8 15.0 15.0 25.8 8.8 15.5 5.01 to 10 8.3 14.2 20.0 9.6 14.2 4.2 11.7
10.01 to 20 2.5 3.8 3.3 0.8 3.3 1.3 2.5 20.01 to 40 0.4 0.4 0.4 0.4 0.8 - 0.4 Above 40 74.2 67.9 61.3 73.8 55.4 85.8 69.7
Total 100.0 100.0 100.0 100.0 100.0 100.0 100.0 Obs. 240 240 240 240 240 240 1,440

Minister of Finance Initial Household Survey 2005
58
How did you get the money to buy this item? (ha4)
Codes A With cash that had been saved up B With cash that was raised from selling land C With cash that was raised from selling livestock or other assets D With cash from selling product E On credit from the store F With fund borrowed from Commercial Bank
G With fund borrowed from BAAC H With fund borrowed from Agricultural Cooperative I With fund borrowed from PCG J With fund borrowed from other organization K With fund borrowed from relatives L With fund borrowed from non-relatives M With fund borrowed from moneylender N With cash from inheritance O Gift P From employer Q Other NA Not applicable
ha4 Chachoeng Buriram Lop Buri SiSaket Phrae Satun Total A 50.3 47.7 48.0 50.2 52.2 36.6 47.7
A,E 1.1 2.8 3.5 1.1 2.1 2.2 2.1 B - 0.1 - 0.0 0.1 0.1 0.0 C - 0.0 - - - - - D 0.4 0.3 0.1 0.4 0.1 0.3 0.3 E 1.8 0.5 1.7 0.1 1.4 2.4 1.3 F - - - 0.0 - 0.1 0.0 G - - - 0.0 0.2 0.1 0.1 H - - - - - 0.1 0.0 I - - - - - 0.0 - J - 0.0 0.1 - 0.0 0.1 0.0 K 0.0 - 0.1 - - 0.0 0.0 N - - - - - 0.1 0.0 O 5.2 5.4 3.9 3.5 3.5 0.4 3.7 P - - - 0.0 - 0.1 0.0 Q 0.1 0.1 - 0.0 0.4 0.3 0.1
NA 40.7 43.2 42.6 44.3 40.0 56.3 44.3 RF 0.2 - - - - - 0.0
Total 100.0 100.0 100.0 100.0 100.0 100.0 100.0 Obs. 4,624.0 4,396.0 4,287.0 4,477.0 4,379.0 3,983.0 26,146.0

Minister of Finance Initial Household Survey 2005
59
Section XII. Agricultural Assets
Is this household involved in agricultural activities? (fa1)
fa1 Chachoeng Buriram Lop Buri Sisaket Phrae Satun Total Yes 3.8 26.7 10.8 49.6 17.5 47.9 26.0 No 96.3 73.3 89.2 50.4 82.5 52.1 74.0 Total 100.0 100.0 100.0 100.0 100.0 100.0 100.0 Obs. 240 240 240 240 240 240 1,440
What type of agricultural activities is this household involved in? (fa2)
Codes A Rice farming B Corn farming C Shrimp farming D Raise fish other than shrimp E Orchard farming F Vegetable farming G Growing another crop H Raising livestock: chicken or duck I Raising livestock: pig, cow or buffalo J Working as a farm laborer K Other
fa2 Chachoeng Buriram Lop Buri Sisaket Phrae Satun Total A 0.4 5.4 2.9 10.0 9.2 0.4 4.7
A,E - 2.1 - - - 1.3 0.6 A,F,I - 0.4 - 2.5 - - 0.5 A,H,I - 1.3 - 4.2 - - 0.9 A,I - 1.7 - 7.1 - 1.3 1.7 A,K - 0.4 - 1.3 0.8 5.4 1.3 B - - 0.4 - - - 0.1 D 0.8 - - - - 0.4 0.2 E 1.3 0.8 1.3 - 1.3 0.8 0.9 F - 0.4 - 0.8 0.4 0.4 0.4 H 0.4 0.4 2.5 2.5 0.8 - 1.1 I - 2.1 1.7 0.8 1.7 2.1 1.4 J - 0.4 - 1.3 0.8 3.3 1.0 K 0.4 0.8 0.4 0.4 0.8 14.6 2.9
Missing value 96.3 73.3 89.2 50.4 82.5 52.1 74.0 Total 100.0 100.0 100.0 100.0 100.0 100.0 100.0 Obs. 240 240 240 240 240 240 1,440

Minister of Finance Initial Household Survey 2005
60
Does anyone who usually lives in this household own any of the following assets? If so, how many? (fa4)
And for how many years has the household owned this item? (fa7)
1. Walking tractor
Quantity Chachoeng Buriram Lop Buri Sisaket Phrae Satun Total 0 100.0 74.6 84.6 74.8 76.2 75.7 76.5 1 - 25.4 15.4 25.2 23.8 24.4 23.5
Total 100.0 100.0 100.0 100.0 100.0 100.0 100.0 Obs. 9 67 26 119 42 115 378
Number of years
Years Chachoeng Buriram Lop Buri Sisaket Phrae Satun Total Equal to 0 - 3.0 - - 2.4 - 0.8 0.01 to 1 - 1.5 - 0.8 - - 0.5 1.01 to 5 - 6.0 - 7.6 7.1 6.1 6.1 5.01 to 10 - 9.0 - 12.6 7.1 8.7 9.0
10.01 to 30 - 6.0 11.5 4.2 7.1 9.6 6.9 Above 30 - - 3.9 - - - 0.3
. 100.0 74.6 84.6 74.8 76.2 75.7 76.5 Total 100.0 100.0 100.0 100.0 100.0 100.0 100.0 Obs. 9 67 26 119 42 115 378
2. Large four-wheel tractor Quantity Chachoeng Buriram Lop Buri Sisaket Phrae Satun Total
0 100.0 98.5 100.0 99.2 97.6 99.1 98.9 1 - 1.5 - 0.8 2.4 0.9 1.1
Total 100.0 100.0 100.0 100.0 100.0 100.0 100.0 Obs. 9 67 26 119 42 115 378
Number of years
Years Chachoeng Buriram Lop Buri Sisaket Phrae Satun Total 0.01 to 1 - 1.5 - - - - 0.3 1.01 to 5 - - - - 2.4 0.9 0.5 5.01 to 10 - - - 0.8 - - 0.3
. 100.0 98.5 100.0 99.2 97.6 99.1 98.9 Total 100.0 100.0 100.0 100.0 100.0 100.0 100.0 Obs. 9 67 26 119 42 115 378

Minister of Finance Initial Household Survey 2005
61
Does anyone who usually lives in this household own any of the following assets? If so, how many? (fa4)
And for how many years has the household owned this item? (fa7)
Cont.
3. Small four-wheel tractor Quantity Chachoeng Buriram Lop Buri Sisaket Phrae Satun Total
0 100.0 98.5 100.0 100.0 97.6 100.0 99.5 1 - 1.5 - - 2.4 - 0.5
Total 100.0 100.0 100.0 100.0 100.0 100.0 100.0 Obs. 9 67 26 119 42 115 378
Number of years
Years Chachoeng Buriram Lop Buri Sisaket Phrae Satun Total 1.01 to 5 - 1.5 - - - - 0.3
10.01 to 30 - - - - 2.4 - 0.3 . 100.0 98.5 100.0 100.0 97.6 100.0 99.5
Total 100.0 100.0 100.0 100.0 100.0 100.0 100.0 Obs. 9 67 26 119 42 115 378
4. Set: machine to put in seed, pesticides for preventing grass, machine to mix fertilizer and soil Quantity Chachoeng Buriram Lop Buri Sisaket Phrae Satun Total
0 100.0 92.5 100.0 95.8 95.2 89.6 93.7 1 - 7.5 - 4.2 4.8 10.4 6.4
Total 100.0 100.0 100.0 100.0 100.0 100.0 100.0 Obs. 9 67 26 119 42 115 378
Number of years
Years Chachoeng Buriram Lop Buri Sisaket Phrae Satun Total 0.01 to 1 - 3.0 - - - - 0.5 1.01 to 5 - 4.5 - 4.2 2.4 9.6 5.3 5.01 to 10 - - - - - 0.9 0.3
. 100.0 92.5 100.0 95.8 97.6 89.6 93.9 Total 100.0 100.0 100.0 100.0 100.0 100.0 100.0 Obs. 9 67 26 119 42 115 378

Minister of Finance Initial Household Survey 2005
62
Does anyone who usually lives in this household own any of the following assets? If so, how many? (fa4)
And for how many years has the household owned this item? (fa7)
Cont.
5. Sprinkler Quantity Chachoeng Buriram Lop Buri Sisaket Phrae Satun Total
0 100.0 100.0 100.0 100.0 97.6 92.2 97.4 1 - - - - 2.4 7.8 2.7
Total 100.0 100.0 100.0 100.0 100.0 100.0 100.0 Obs. 9 67 26 119 42 115 378
Number of years
Years Chachoeng Buriram Lop Buri Sisaket Phrae Satun Total 0.01 to 1 - - - - - 1.7 0.5 1.01 to 5 - - - - 2.4 5.2 1.9 5.01 to 10 - - - - - 0.9 0.3
. 100.0 100.0 100.0 100.0 97.6 92.2 97.4 Total 100.0 100.0 100.0 100.0 100.0 100.0 100.0 Obs. 9 67 26 119 42 115 378
6. Threshing machine Quantity Chachoeng Buriram Lop Buri Sisaket Phrae Satun Total
0 100.0 100.0 100.0 100.0 97.6 99.1 99.5 1 - - - - 2.4 0.9 0.5
Total 100.0 100.0 100.0 100.0 100.0 100.0 100.0 Obs. 9 67 26 119 42 115 378
Number of years
Years Chachoeng Buriram Lop Buri Sisaket Phrae Satun Total 0.01 to 1 - - - - 2.4 - 0.3 1.01 to 5 - - - - - 0.9 0.3
. 100.0 100.0 100.0 100.0 97.6 99.1 99.5 Total 100.0 100.0 100.0 100.0 100.0 100.0 100.0 Obs. 9 67 26 119 42 115 378

Minister of Finance Initial Household Survey 2005
63
Does anyone who usually lives in this household own any of the following assets? If so, how many? (fa4)
And for how many years has the household owned this item? (fa7)
Cont.
7. Rice mill Quantity Chachoeng Buriram Lop Buri Sisaket Phrae Satun Total
0 100.0 97.0 100.0 99.2 100.0 100.0 99.2 1 - 3.0 - 0.8 - - 0.8
Total 100.0 100.0 100.0 100.0 100.0 100.0 100.0 Obs. 9 67 26 119 42 115 378
Number of years
Years Chachoeng Buriram Lop Buri Sisaket Phrae Satun Total 0.01 to 1 - 1.5 - - - - 0.3
5.01 to 10 - 1.5 - 0.8 - - 0.5 . 100.0 97.0 100.0 99.2 100.0 100.0 99.2
Total 100.0 100.0 100.0 100.0 100.0 100.0 100.0 Obs. 9 67 26 119 42 115 378
8. Crop storage buildings Quantity Chachoeng Buriram Lop Buri Sisaket Phrae Satun Total
0 100.0 43.3 100.0 43.7 69.1 71.3 60.1 1 - 56.7 - 56.3 31.0 28.7 40.0
Total 100.0 100.0 100.0 100.0 100.0 100.0 100.0 Obs. 9 67 26 119 42 115 378
Number of years
Years Chachoeng Buriram Lop Buri Sisaket Phrae Satun Total 0.01 to 1 - 1.5 - - - - 0.3 1.01 to 5 - 4.5 - 6.7 4.8 8.7 6.1 5.01 to 10 - 9.0 - 17.7 4.8 10.4 10.9
10.01 to 30 - 35.8 - 27.7 16.7 7.8 19.3 Above 30 - 6.0 - 4.2 4.8 1.7 3.4
. 100.0 43.3 100.0 43.7 69.1 71.3 60.1 Total 100.0 100.0 100.0 100.0 100.0 100.0 100.0 Obs. 9 67 26 119 42 115 378

Minister of Finance Initial Household Survey 2005
64
Does anyone who usually lives in this household own any of the following assets? If so, how many? (fa4)
And for how many years has the household owned this item? (fa7)
Cont.
9. Large chicken coop Quantity Chachoeng Buriram Lop Buri Sisaket Phrae Satun Total
0 100.0 98.5 100.0 99.2 100.0 100.0 99.5 1 - 1.5 - 0.8 - - 0.5
Total 100.0 100.0 100.0 100.0 100.0 100.0 100.0 Obs. 9 67 26 119 42 115 378
Number of years
Years Chachoeng Buriram Lop Buri Sisaket Phrae Satun Total 1.01 to 5 - 1.5 - 0.8 - - 0.5
. 100.0 98.5 100.0 99.2 100.0 100.0 99.5 Total 100.0 100.0 100.0 100.0 100.0 100.0 100.0 Obs. 9 67 26 119 42 115 378
10. Other large buildings for livestock Quantity Chachoeng Buriram Lop Buri Sisaket Phrae Satun Total
0 100.0 91.0 96.2 84.9 97.6 96.5 92.1 1 - 9.0 3.9 15.1 2.4 3.5 7.9
Total 100.0 100.0 100.0 100.0 100.0 100.0 100.0 Obs. 9 67 26 119 42 378 378
Number of years
Years Chachoeng Buriram Lop Buri Sisaket Phrae Satun Total 0.01 to 1 - 3.0 - 0.8 2.4 0.9 1.3 1.01 to 5 - 4.5 - 7.6 - 0.9 3.4 5.01 to 10 - 1.5 - 5.0 - - 1.9
10.01 to 30 - - 3.9 0.8 - 1.7 1.1 . 100.0 91.0 96.2 85.7 97.6 96.5 92.3
Total 100.0 100.0 100.0 100.0 100.0 100.0 100.0 Obs. 9 67 26 119 42 115 378

Minister of Finance Initial Household Survey 2005
65
How did you get the money to buy this item? (fa6)
Codes A With cash that had been saved up B With cash that was raised from selling land C With cash that was raised from selling livestock or other assets D With cash from selling product E On credit from the store F With fund borrowed from Commercial Bank
G With fund borrowed from BAAC H With fund borrowed from Agricultural Cooperative I With fund borrowed from PCG J With fund borrowed from other organization K With fund borrowed from relatives L With fund borrowed from non-relatives M With fund borrowed from moneylender N With cash from inheritance O Gift P From employer Q Other NA Not applicable
fa6 Chachoeng Buriram Lop Buri Sisaket Phrae Satun Total A 1.5 6.9 3.6 7.3 5.7 5.9 6.2 C - 0.1 - - - - 0.0 D - 0.2 - 0.1 - 0.1 0.1 G - 0.1 - 0.2 1.3 0.1 0.3 H - - - - - 0.1 0.0 I - - - - - 0.1 0.0 J - - - - - 0.1 0.0
M,J - - - - - 0.1 0.0 M,L - - - - - 0.1 0.0 N - 0.1 - - - - 0.0 O - 0.3 - 0.3 0.3 - 0.2 Q - 0.1 - - - 0.2 0.1
Missing value 98.5 91.8 96.4 91.9 92.7 93.5 92.9 Total 100.0 100.0 100.0 100.0 100.0 100.0 100.0 Obs. 135 1,006 391 1,785 634 1,724 5,675
Shrimp and Fish Ponds
How many shrimp and fish ponds for raising adult shrimp or fish does this household own? (fa8) Quantity Chachoeng Buriram Lop Buri Sisaket Phrae Satun Total
0 2.5 26.3 10.4 49.6 17.5 45.8 25.4 1 0.4 0.4 - - - 0.8 0.3 2 - - 0.4 - - - 0.1 3 - - - - - 0.4 0.1 4 - - - - - 0.4 0.1 5 0.4 - - - - - 0.1 6 0.4 - - - - 0.4 0.1 . 96.3 73.3 89.2 50.4 82.5 52.1 74.0
Total 100.0 100.0 100.0 100.0 100.0 100.0 100.0 Obs. 240 240 240 240 240 240 1,440

Minister of Finance Initial Household Survey 2005
66
How big is this pond? (fa9) fa9 Chachoeng Buriram Lop Buri Satun Total 0.2 - - - 66.7 33.3 0.5 8.3 100.0 100.0 - 13.3 1.0 50.0 - - 26.7 33.3 1.5 16.7 - - - 6.7 2.0 25.0 - - - 10.0 10.0 - - - 6.7 3.3
Total 100.0 100.0 100.0 100.0 100.0 Obs. 12 1 2 15 30
Is this a shrimp or a fish pond? (fa10)
fa10 Chachoeng Buriram Lop Buri Satun Total Fish 100.0 100.0 100.0 93.3 96.7 Other - - - 6.7 3.3 Total 100.0 100.0 100.0 100.0 100.0 Obs. 12 1 2 15 30
Livestock
How many of the following animals does the household own? (fa14)
1. Cows
fa14t Chachoeng Buriram Lop Buri Sisaket Phrae Satun Total Equal to 0 100.0 73.4 92.3 57.1 88.1 72.2 71.5 0.01 to 5 - 14.1 - 34.5 9.5 23.5 21.6 5.01 to 10 - 9.4 3.9 8.4 - 2.6 5.3
10.01 to 25 - 1.6 3.9 - 2.4 1.7 1.3 Above 25 - 1.6 - - - - 0.3
Total 100.0 100.0 100.0 100.0 100.0 100.0 100.0 Obs. 9 64 26 119 42 115 375
2. Buffalo
fa14t Chachoeng Buriram Lop Buri Sisaket Phrae Satun Total Equal to 0 100.0 95.3 100.0 87.4 100.0 100.0 95.2 0.01 to 5 - 4.7 - 12.6 - - 4.8
Total 100.0 100.0 100.0 100.0 100.0 100.0 100.0 Obs. 9 64 26 119 42 115 375
3. Pigs
fa14t Chachoeng Buriram Lop Buri Sisaket Phrae Satun Total Equal to 0 100.0 92.2 88.5 96.6 95.2 100.0 96.3 0.01 to 5 - 4.7 - - - - 0.8 5.01 to 10 - 3.1 3.9 2.5 2.4 - 1.9
10.01 to 25 - - 3.9 0.8 2.4 - 0.8 Above 25 - - 3.9 - - - 0.3
Total 100.0 100.0 100.0 100.0 100.0 100.0 100.0 Obs. 9 64 26 119 42 115 375

Minister of Finance Initial Household Survey 2005
67
Livestock
How many of the following animals does the household own? (fa14)
Cont.
4. Chicken (if >50)
fa14t Chachoeng Buriram Lop Buri Sisaket Phrae Satun Total Equal to 0 88.9 95.3 96.2 98.3 97.6 100.0 97.9 Above 25 11.1 4.7 - 1.7 2.4 - 1.9
15,000 - - 3.9 - - - 0.3 Total 100.0 100.0 100.0 100.0 100.0 100.0 100.0 Obs. 9 64 26 119 42 115 375
Ducks (if >50)
fa14t Chachoeng Buriram Lop Buri Sisaket Phrae Satun Total Equal to 0 100.0 98.4 96.2 100.0 100.0 100.0 99.5 Above 25 - 1.6 3.9 - - - 0.5
Total 100.0 100.0 100.0 100.0 100.0 100.0 100.0 Obs. 9 64 26 119 42 115 375
Scale of farm enterprise
If you could increase the size of your farm do you think it would be more profitable? (fa16)
fa16 Chachoeng Buriram Lop Buri Sisaket Phrae Satun Total Yes 0.8 5.0 0.8 5.0 0.4 6.3 3.1 No 2.9 21.7 10.0 44.2 17.1 41.3 22.9 . 96.3 73.3 89.2 50.8 82.5 52.5 74.1 Total 100.0 100.0 100.0 100.0 100.0 100.0 100.0 Obs. 240 240 240 240 240 240 1,440

Minister of Finance Initial Household Survey 2005
68
Scale of farm enterprise (Cont.)
If yes, what stops you from increasing the size of your farm? What are the main barriers or obstacles to increasing the size of your farm? (fa17a)
Codes: A Not enough land B Not enough labor to hire C Not enough time D Not enough money to hire labor E Not enough money to buy equipment F Not enough money to buy land G Demand for product is too low H Price of product is too low I Other
fa17a Chachoeng Buriram Lop Buri Sisaket Phrae Satun Total A - 1.3 0.4 0.8 0.4 0.8 0.6 B - - - - - 0.4 0.1 C - 0.8 - - - 1.7 0.4
C,E - - - 0.4 - - 0.1 C,F,E - - - 0.4 - - 0.1
D 0.4 0.4 - - - - 0.1 D,E - 0.4 - 0.4 - - 0.1 E - - - 0.4 - - 0.1 F - - - 0.4 - 2.1 0.4
F,C - - - 0.4 - - 0.1 I - 1.3 0.4 - - 0.4 0.4
Missing value 99.2 95.0 99.2 95.0 99.6 93.8 96.9 Total 100.0 100.0 100.0 100.0 100.0 100.0 100.0 Obs. 240 240 240 240 240 240 1,440

Minister of Finance Initial Household Survey 2005
69
Section XIII. Household Business
Does anyone in this household own a business or part of a business? (ba1)
Ba1 Chachoeng Buriram Lop Buri SiSaket Phrae Satun Total Yes 68.8 65.0 75.8 66.3 54.6 37.1 61.3 No 31.3 35.0 24.2 33.8 45.4 62.9 38.8 Total 100.0 100.0 100.0 100.0 100.0 100.0 100.0 Obs. 240 240 240 240 240 240 1,440
If yes, how many business does this household own all or a part of? (ba2)
Ba2 Chachoeng Buriram Lop Buri SiSaket Phrae Satun Total 1 57.1 52.1 64.2 51.7 46.7 31.7 50.6 2 9.2 10.8 10.4 12.5 7.1 5.0 9.2 3 2.1 1.7 1.3 1.3 0.8 0.4 1.3 4 0.4 0.4 - 0.8 - - 0.3 .c 31.3 35.0 24.2 33.8 45.4 62.9 38.8
Total 100.0 100.0 100.0 100.0 100.0 100.0 100.0 Obs. 240 240 240 240 240 240 1,440
What type of business does this household own all or a part of? (ba3)
1st business owned Chachoeng Buriram Lop Buri SiSaket Phrae Satun Total Shop 16.3 12.1 15.0 13.3 7.1 8.8 12.1 Mechanic / repair shop 0.4 1.3 1.7 1.3 1.7 0.4 1.1 Hair salon / barber 2.9 2.1 2.9 1.7 1.7 1.7 2.2 Rice miller - 1.7 - - 0.4 - 0.4 Fish farmer 1.7 - - - - 1.7 0.6 Pickup rental service 5.4 - 0.4 1.3 0.8 0.8 1.5 Trader 19.6 20.0 21.7 15.8 18.8 7.9 17.3 Restaurant/noodle shop 8.8 9.2 12.9 6.7 3.8 6.3 7.9 Other 13.8 18.8 21.3 26.3 20.4 9.6 18.3 .c 31.3 35.0 24.2 33.8 45.4 62.9 38.8 Total 100.0 100.0 100.0 100.0 100.0 100.0 100.0 Obs. 240 240 240 240 240 240 1,440

Minister of Finance Initial Household Survey 2005
70
How many years has this business been in existence? (ba4)
Province Obs Mean Std. Dev. Min Max Chachoeng 200 18.7 14.8 0.0 59.0Buriram 193 12.8 12.0 0.0 58.0Lop Buri 213 14.9 12.5 0.0 58.0SiSaket 201 15.9 13.4 0.0 66.0Phrae 152 11.6 11.0 1.0 52.0Satun 103 20.6 16.2 1.0 63.0Total 1,062 15.5 13.5 0.0 66.0
Years Chachoeng Buriram Lop Buri SiSaket Phrae Satun Total Equal to 0 2.5 1.0 0.5 0.5 - - 0.9 0.01 to 5 23.5 34.7 30.1 26.9 39.5 24.3 29.9 5.01 to 10 16.5 24.9 20.2 20.9 21.1 14.6 20.1
10.01 to 20 19.0 20.2 24.4 25.4 23.7 20.4 22.3 20.01 to 30 18.0 9.8 13.6 11.4 9.2 12.6 12.6 30.01 to 40 11.5 5.2 7.5 8.0 4.6 13.6 8.1
More than 40 9.0 4.2 3.8 7.0 2.0 14.6 6.2 Total 100.0 100.0 100.0 100.0 100.0 100.0 100.0 Obs. 200 193 213 201 152 103 1,062
Where did the idea to start the business come from? (ba5)
Source of idea Chachoeng Buriram Lop Buri SiSaket Phrae Satun Total Household member 76.5 65.3 72.3 88.6 61.2 54.4 71.6 Company who sells input - 0.5 - - - - 0.1 Books 0.5 0.5 0.5 - 0.7 1.0 0.5 Observing someone else 21.5 33.2 26.8 11.0 26.3 41.8 25.3 television program - 0.5 - - - - 0.1 Commercial advertisement 0.5 - - - - - 0.1 Other 1.0 - 0.5 0.5 11.8 2.9 2.4 Total 100.0 100.0 100.0 100.0 100.0 100.0 100.0 Obs. 200 193 213 201 152 103 1,062
Do you or members of your household own all of the business? (b6)
Ba6 Chachoeng Buriram Lop Buri SiSaket Phrae Satun Total Yes 99.5 97.9 99.5 99.0 99.3 100.0 99.2 No 0.5 2.1 0.5 1.0 0.7 - 0.9 Total 100.0 100.0 100.0 100.0 100.0 100.0 100.0 Obs. 200 193 213 201 152 103 1,062

Minister of Finance Initial Household Survey 2005
71
How many people altogether worked in this business for at least 6 months of the last 12 months regardless of whether they were paid or not? (ba9)
Ba9 Chachoeng Buriram Lop Buri SiSaket Phrae Satun Total 0 1.0 - - - - - 0.2 1 45.5 30.6 49.8 30.9 49.3 44.7 41.3 2 28.5 43.0 29.1 37.3 33.6 31.1 33.9 3 13.0 14.5 14.6 15.9 8.6 13.6 13.6 4 7.5 5.2 3.3 10.0 2.6 4.9 5.7 5 1.0 4.7 - 3.5 1.3 1.9 2.1 6 0.5 0.5 2.4 0.5 3.3 2.9 1.5 7 0.5 0.5 - 0.5 - - 0.3 8 - 0.5 0.5 0.5 0.7 - 0.4 9 1.0 - - 0.5 0.7 - 0.4
10 0.5 0.5 - - - - 0.2 11 - - - - - 1.0 0.1 13 0.5 - - - - - 0.1 20 - - 0.5 - - - 0.1 21 0.5 - - - - - 0.1 112 - - - 0.5 - - 0.1
Total 100.0 100.0 100.0 100.0 100.0 100.0 100.0 Obs. 200 193 213 201 152 103 1,062
How many of these people are members of the household? (ba10)
Ba10 Chachoeng Buriram Lop Buri SiSaket Phrae Satun Total 1 50.5 38.9 58.7 35.3 53.3 55.3 48.0 2 31.5 41.5 27.2 38.8 39.5 29.1 34.8 3 12.0 13.5 9.9 13.4 5.9 8.7 10.9 4 3.5 3.6 3.3 9.5 1.3 3.9 4.3 5 0.5 2.6 0.5 3.0 - 1.0 1.3 6 1.0 - 0.5 - - 1.9 0.5 7 0.5 - - - - - 0.1
10 0.5 - - - - - 0.1 Total 100.0 100.0 100.0 100.0 100.0 100.0 100.0 Obs. 200 193 213 201 152 103 1,062
During the past 12 months, has this business paid anyone in cash or in kind to work here? (ba11)
Ba11 Chachoeng Buriram Lop Buri SiSaket Phrae Satun Total Yes 15.0 12.4 15.0 11.9 13.8 12.6 13.6 No 85.0 87.6 85.0 88.1 86.2 87.4 86.4 Total 100.0 100.0 100.0 100.0 100.0 100.0 100.0 Obs. 200 193 213 201 152 103 1,062

Minister of Finance Initial Household Survey 2005
72
How many workers were paid? (ba12)
Ba12 Chachoeng Buriram Lop Buri SiSaket Phrae Satun Total 1 9.0 6.2 7.5 4.0 5.3 3.9 6.2 2 2.0 2.6 5.2 5.0 4.0 6.8 4.1 3 2.0 1.6 0.9 1.5 - - 1.1 4 - 0.5 - 1.0 3.3 1.0 0.9 5 - - 0.5 - - - 0.1 6 0.5 0.5 0.5 - 0.7 - 0.4 7 - 1.0 - - 0.7 - 0.3
10 0.5 - - - - 1.0 0.2 15 - - 0.5 - - - 0.1 20 0.5 - - - - - 0.1 110 - - - 0.5 - - 0.1 .b 0.5 - - - - - 0.1 .c 85.0 87.6 85.0 88.1 86.2 87.4 86.4
Total 100.0 100.0 100.0 100.0 100.0 100.0 100.0 Obs. 200 193 213 201 152 103 1,062 What was the daily wage that you paid to anyone over the past 12 months? (ba13-ba15)
ba13 Chachoeng Buriram Lop Buri SiSaket Phrae Satun Total 0.01 to 100 5.0 5.7 3.3 4.5 3.3 1.9 4.1
100.01 to 200 8.0 5.7 10.8 6.0 7.2 5.8 7.4 200.01 to 300 0.5 0.5 - 1.5 0.7 - 0.6 300.01 to 500 0.5 - - - 0.7 - 0.2 500.01 to 1000 - - 0.5 - - - 0.1
.b - - 0.5 - - - 0.1
.c 86.0 88.1 85.0 88.1 88.2 92.2 87.5 Total 100.0 100.0 100.0 100.0 100.0 100.0 100.0 Obs. 200 193 213 201 152 103 1,062
Additional Start-up Capital
Besides the funds that you needed to buy the assets that were necessary to star your business did you need any additional funds to start your business? (ba22)
Ba22 Chachoeng Buriram Lop Buri SiSaket Phrae Satun Total Yes 2.5 11.4 18.8 1.5 2.0 29.1 9.7 No 97.5 88.6 81.2 98.5 98.0 70.9 90.3 Total 100.0 100.0 100.0 100.0 100.0 100.0 100.0 Obs. 200 193 213 201 152 103 1,062
Scale of Business
If you could increase the size of your business do you think it would be more profitable? (ba26)
Ba26 Chachoeng Buriram Lop Buri SiSaket Phrae Satun Total Yes 12.5 41.5 3.8 6.0 5.3 6.8 13.2 No 87.5 58.6 96.2 94.0 94.7 93.2 86.8 Total 100.0 100.0 100.0 100.0 100.0 100.0 100.0 Obs. 200 193 213 201 152 103 1,062

Minister of Finance Initial Household Survey 2005
73
Section XIV. Housing and Landholdings
Housing
Does your household own or rent this house? (la1)
la1 Chachoeng Buriram Lop Buri Sisaket Phrae Satun Total Own 66.7 79.2 85.8 86.7 90.4 89.2 83.0 Rent 33.3 20.8 14.2 13.3 9.6 10.8 17.0 Total 100.0 100.0 100.0 100.0 100.0 100.0 100.0 Obs. 240 240 240 240 240 240 1,440
Renters only – what is the monthly rent? (la2)
Thai Baht of 2005
Province Obs Mean Std. Dev. Min Max Chachoeng 80 863 915 0 4,000Buriram 50 847 1,131 0 5,000Lop Buri 34 2,161 5,021 0 30,000Sisaket 32 2,153 2,451 0 10,000Phrae 23 1,123 1,124 0 4,000Satun 26 1,153 1,000 0 3,500Total 245 1,263 2,286 0 30,000
Thai Baht of 2005 Chachoeng Buriram Lop Buri Sisaket Phrae Satun Total Equal to 0 4.6 9.2 1.7 2.9 1.7 1.7 3.6 0.01 to 100 2.9 0.4 0.8 0.4 0.8 2.1 1.3
100.01 to 250 3.8 0.8 0.8 0.4 - - 1.0 250.01 to 500 6.3 1.3 1.3 - 1.3 - 1.7 500.01 to 1000 6.3 2.5 1.3 2.1 2.5 0.8 2.6 Above 1000 9.6 6.7 8.3 7.5 3.3 6.3 6.9
. 66.7 79.2 85.8 86.7 90.4 89.2 83.0 Total 100.0 100.0 100.0 100.0 100.0 100.0 100.0 Obs. 240 240 240 240 240 240 1,440
If someone wanted to buy a house like yours in this village, how much would they have to pay (for the house and the house plot)? (la3)
Thousands of Thai Baht of 2005
Province Obs Mean Std. Dev. Min Max Chachoeng 224 943 1,469 5 15,000Buriram 240 851 1,048 30 7,000Lop Buri 240 663 769 5 7,000Sisaket 240 801 1,124 20 7,000Phrae 236 636 605 50 5,000Satun 237 289 275 10 2,000Total 1,417 695 978 5 15,000

Minister of Finance Initial Household Survey 2005
74
Landholdings
Land that the household cultivates
How many rai did your household cultivate during the past 12 months? (la4)
Province Obs Mean Std. Dev. Min Max Chachoeng 239 0.8 6.7 0.0 102.0Buriram 240 3.6 7.4 0.0 35.0Lop Buri 240 1.0 3.8 0.0 40.3Sisaket 240 5.3 8.6 0.0 62.0Phrae 240 1.1 2.7 0.0 26.5Satun 240 4.8 6.9 0.1 39.0Total 1,439 2.8 6.6 0.0 102.0
Rai Chachoeng Buriram Lop Buri Sisaket Phrae Satun Total 0 to 5 98.3 79.6 95.4 67.5 94.2 67.5 83.8
5.01 to 10 - 5.8 1.3 12.9 3.8 15.8 6.6 10.01 to 25 0.8 11.3 2.5 15.8 1.7 15.0 7.9 25.01 to 50 - 3.3 0.8 3.3 0.4 1.7 1.6 50.01 to 100 - - - 0.4 - - 0.1
100.01 to 250 0.4 - - - - - 0.1 . 0.4 - - - - - 0.1
Total 100.0 100.0 100.0 100.0 100.0 100.0 100.0 Obs. 240 240 240 240 240 240 1,440
How many plots does your household cultivate? (la5)
la5 Chachoeng Buriram Lop Buri Sisaket Phrae Satun Total 1 88.3 74.6 89.6 52.5 85.0 58.8 74.8 2 10.4 9.6 7.1 31.7 10.4 20.4 14.9 3 0.8 7.1 3.3 10.8 3.8 15.8 6.9 4 0.4 6.3 - 4.2 0.8 2.9 2.4 5 - 2.5 - 0.4 - 1.3 0.7 6 - - - - - 0.8 0.1 7 - - - 0.4 - - 0.1
Total 100.0 100.0 100.0 100.0 100.0 100.0 100.0 Obs. 240 240 240 240 240 240 1,440
What type of land is in the plot? (la7)
la7 Chachoeng Buriram Lop Buri Sisaket Phrae Satun Total Residential 89.0 66.8 90.5 29.9 82.0 59.3 66.2 Land for livestock 0.4 1.4 1.5 1.5 0.7 - 0.9 Land for paddy 0.4 22.3 4.0 29.4 12.5 11.5 14.7 Land for field crops - 0.5 1.5 0.7 0.4 - 0.5 Land for tree crops 1.5 4.6 1.1 0.5 2.4 24.5 6.6 Land for vegetable crops - 0.8 0.4 2.9 - 1.7 1.1 Land for shrimp or fish raising 1.5 0.3 0.4 - - 1.2 0.6 Other 7.4 3.3 0.7 35.1 2.1 1.7 9.4 Total 100.0 100.0 100.0 100.0 100.0 100.0 100.0 Obs. 272 367 273 408 289 408 2,017

Minister of Finance Initial Household Survey 2005
75
What claim does the household have to the plot? (la8)
la8 Chachoeng Buriram Lop Buri Sisaket Phrae Satun Total Own plot 49.3 77.1 60.1 77.9 68.9 82.8 71.2 Rent plot for money 33.8 8.5 25.6 7.6 10.4 9.6 14.5 Rent plot for portion of harvest - 3.0 0.4 2.7 2.8 0.7 1.7 Pay no rent - plot owned by relatives 5.2 7.1 6.6 5.6 15.6 4.4 7.1 Pay no rent - plot owned by non relatives 2.9 0.5 1.5 - 0.7 0.7 0.9 Pay no rent - plot is on public land 8.5 2.7 5.1 0.5 - 1.5 2.7 Someone has mortgaged this plot to your hh - 0.3 - 0.3 - - 0.1 Other 0.4 0.8 0.7 5.4 1.7 0.3 1.7 Total 100.0 100.0 100.0 100.0 100.0 100.0 100.0 Obs. 272 367 273 408 289 408 2,017
What type of land certificate covers this plot? (la9)
la9 Chachoeng Buriram Lop Buri Sisaket Phrae Satun Total Chanod 80.2 80.9 49.5 89.0 91.0 73.3 78.1 NS3 0.7 4.1 13.6 6.6 1.0 15.9 7.4 NS3K - 0.5 2.9 - - 1.2 0.7 SK1 - 1.1 12.8 0.5 - 0.3 2.1 Saw Paw Kae 1.1 3.8 0.7 0.7 - 1.0 1.3 Sor Tor Kor - - 0.4 - - - 0.1 Application for land 16.5 1.4 2.2 0.3 - 2.0 3.2 Economic reserve area - 0.3 - - - 0.5 0.2 Noneconomic reserve area - 0.3 - 0.3 - 0.3 0.2 Other 1.1 7.6 16.9 2.7 7.6 5.6 6.6 . 0.4 - 1.1 - 0.4 - 0.3 Total 100.0 100.0 100.0 100.0 100.0 100.0 100.0 Obs. 272 367 273 408 289 408 2,017
How many rai are in the plot? (la10)
Province Obs Mean Std. Dev. Min Max Chachoeng 271 0.7 4.4 0.0 50.0Buriram 367 2.4 4.2 0.0 20.0Lop Buri 273 0.9 2.7 0.0 20.0Sisaket 408 3.1 5.7 0.0 40.0Phrae 289 0.9 1.8 0.0 11.0Satun 408 2.8 4.1 0.1 30.0Total 2,016 2.0 4.2 0.0 50.0
Rai Chachoeng Buriram Lop Buri Sisaket Phrae Satun Total 0.01 to 1 94.1 72.2 91.9 60.5 85.5 57.8 74.5 1.01 to 5 3.7 11.2 2.9 22.8 11.4 26.2 14.5 5.01 to 10 0.7 10.4 3.3 10.5 2.1 11.5 7.2
10.01 to 25 0.4 6.3 1.8 4.2 1.0 3.9 3.2 25.01 to 50 0.7 - - 2.0 - 0.5 0.6
. 0.4 - - - - - 0.1 Total 100.0 100.0 100.0 100.0 100.0 100.0 100.0 Obs. 272 367 273 408 289 408 2,017

Minister of Finance Initial Household Survey 2005
76
How was this plot acquired? (la12)
la12 Chachoeng Buriram Lop Buri Sisaket Phrae Satun Total Purchased 29.8 19.4 31.9 24.8 15.9 13.0 21.8 Inherited 20.6 57.8 28.2 58.8 52.3 70.6 50.8 Cleared - - 1.8 0.7 - - 0.4 Land reform program - 0.3 - - - - 0.1 Rented land 38.6 14.4 27.1 10.1 12.8 9.6 17.3 From relatives 6.3 6.8 6.2 4.7 16.3 5.4 7.3 Other 4.8 1.4 4.8 1.0 2.8 1.2 2.4 . - - - - - 0.3 0.1 Total 100.0 100.0 100.0 100.0 100.0 100.0 100.0 Obs. 272 367 273 408 289 408 2,017
How many kilometers is it from your house to the plot? (la15)
Province Obs Mean Std. Dev. Min Max Chachoeng 272 0.5 4.3 0.0 60.0Buriram 365 6.3 57.6 0.0 1,000.0Lop Buri 273 5.1 45.4 0.0 650.0Sisaket 408 1.8 6.9 0.0 100.0Phrae 289 0.5 1.5 0.0 10.0Satun 408 1.6 4.0 0.0 30.0Total 2,015 2.7 30.0 0.0 1,000.0
Kilometers Chachoeng Buriram Lop Buri Sisaket Phrae Satun Total Equal to 0 91.5 70.8 89.0 59.1 83.7 56.1 72.6 0.01 to 5 7.0 19.1 7.3 34.6 13.8 36.3 21.7 5.01 to 10 - 4.9 0.7 1.7 2.4 3.7 2.4
10.01 to 25 0.7 1.9 0.7 3.4 - 3.4 1.9 25.01 to 50 0.4 1.9 1.1 1.0 - 0.5 0.8 50.01 to 100 0.4 - - 0.3 - - 0.1 Above 100 - 0.8 1.1 - - - 0.4
. - 0.5 - - - - 0.1 Total 100.0 100.0 100.0 100.0 100.0 100.0 100.0 Obs. 272 367 273 408 289 408 2,017
In a normal rainfall year, does this plot have access to water in the cold season? (la16)
la16 Chachoeng Buriram Lop Buri Sisaket Phrae Satun Total Yes 84.2 7.4 22.0 95.6 12.1 62.8 49.4 No 15.8 92.6 78.0 4.4 87.9 37.3 50.6 Total 100.0 100.0 100.0 100.0 100.0 100.0 100.0 Obs. 272 367 273 408 289 408 2,017
In a normal rainfall year, does this plot have access to water in the hot season? (la17)
la17 Chachoeng Buriram Lop Buri Sisaket Phrae Satun Total Yes 83.5 5.7 18.0 94.4 7.6 68.6 48.8 No 16.5 94.3 82.1 5.6 92.4 31.4 51.2 Total 100.0 100.0 100.0 100.0 100.0 100.0 100.0 Obs. 272 367 273 408 289 408 2,017

Minister of Finance Initial Household Survey 2005
77
How many bags of chemical fertilizer did you use on the plot last year? (la18)
Bags Chachoeng Buriram Lop Buri Sisaket Phrae Satun Total Equal to 0 10.3 11.2 30.8 7.1 5.5 2.2 10.3 0.01 to 1 1.1 2.2 0.7 2.9 4.2 4.7 2.8 1.01 to 5 0.7 9.0 0.4 20.6 7.3 19.4 10.9 5.01 to 10 0.4 6.5 1.8 7.1 - 10.1 5.0
10.01 to 25 - 3.8 3.3 2.9 - 2.7 2.3 25.01 to 50 - 0.3 - 0.3 - 0.3 0.2 Above 100 - - - - - 0.7 0.2
. 87.5 67.0 63.0 59.1 83.0 60.1 68.5 Total 100.0 100.0 100.0 100.0 100.0 100.0 100.0 Obs. 272 367 273 408 289 408 2,017
Is this plot in the Tambon? (la19)
la19a Chachoeng Buriram Lop Buri Sisaket Phrae Satun Total Yes 98.2 89.4 93.8 91.4 96.9 95.8 94.0 No 1.8 10.6 6.2 8.6 3.1 4.2 6.1 Total 100.0 100.0 100.0 100.0 100.0 100.0 100.0 Obs. 272 367 273 408 289 408 2,017
Other land
Besides the land that the household cultivates, does the household own any other land? (la21)
la21 Chachoeng Buriram Lop Buri Sisaket Phrae Satun Total Yes 18.8 38.8 23.3 20.8 23.3 11.3 22.7 No 81.3 61.3 76.7 79.2 76.7 88.8 77.3 Total 100.0 100.0 100.0 100.0 100.0 100.0 100.0 Obs. 240 240 240 240 240 240 1,440
How many other plots do you own? (la22)
la22 Chachoeng Buriram Lop Buri Sisaket Phrae Satun Total 1 13.3 27.5 15.0 13.8 20.8 10.0 16.7 2 5.0 9.2 5.8 3.8 2.1 0.8 4.4 3 - 0.8 2.5 1.3 0.4 0.4 0.9 4 - 0.4 - 0.8 - - 0.2 5 0.4 0.4 - 0.4 - - 0.2 6 - 0.4 - 0.8 - - 0.2 . 81.3 61.3 76.7 79.2 76.7 88.8 77.3
Total 100.0 100.0 100.0 100.0 100.0 100.0 100.0 Obs. 240 240 240 240 240 240 1,440

Minister of Finance Initial Household Survey 2005
78
What type of land is in this plot? (la24)
la24 Chachoeng Buriram Lop Buri Sisaket Phrae Satun Total Residential 32.8 13.7 17.1 11.8 15.9 9.7 16.6 Land for livestock - - 2.4 - - - 0.4 Land for paddy 23.0 43.5 31.7 56.5 49.2 35.5 41.3 Land for field crops 3.3 1.5 9.8 3.5 6.4 3.2 4.4 Land for tree crops 8.2 0.8 12.2 14.1 17.5 6.5 9.1 Land for shrimp or fish raising 4.9 - - - - 9.7 1.3 Other 27.9 40.5 26.8 14.1 11.1 35.5 26.9 Total 100.0 100.0 100.0 100.0 100.0 100.0 100.0 Obs. 61 131 82 85 63 31 453
What type of land certificate covers this plot? (la25)
la25 Chachoeng Buriram Lop Buri Sisaket Phrae Satun Total Chanod 91.8 83.2 72.0 84.7 88.9 67.7 82.3 NS3 1.6 6.1 12.2 4.7 9.5 12.9 7.3 NS3K - 1.5 3.7 - - 3.2 1.3 SK1 - 2.3 7.3 3.5 - - 2.7 Saw Paw Kae - 2.3 - 3.5 - - 1.3 Sor Tor Kor - 2.3 - - - - 0.7 Application for land 6.6 - - - - 3.2 1.1 Other - 2.3 4.9 3.5 1.6 12.9 3.3 Total 100.0 100.0 100.0 100.0 100.0 100.0 100.0 Obs. 61 131 82 85 63 31 453
How many rai are in the plot? (la26)
Province Obs Mean Std. Dev. Min Max Chachoeng 61 5.6 13.1 0.0 80.0Buriram 131 7.0 12.2 0.0 100.0Lop Buri 82 9.3 15.3 0.0 100.0Sisaket 85 8.1 12.5 0.1 74.5Phrae 63 4.2 6.9 0.2 50.0Satun 31 2.4 3.1 0.0 14.0Total 453 6.7 12.1 0.0 100.0
Rai Chachoeng Buriram Lop Buri Sisaket Phrae Satun Total 0 to 5 80.3 65.7 56.1 60.0 77.8 87.1 68.0
5.01 to 10 9.8 13.0 19.5 20.0 17.5 9.7 15.5 10.01 to 25 1.6 15.3 17.1 12.9 3.2 3.2 10.8 25.01 to 50 6.6 5.3 4.9 4.7 1.6 - 4.4 50.01 to 100 1.6 0.8 2.4 2.4 - - 1.3
Total 100.0 100.0 100.0 100.0 100.0 100.0 100.0 Obs. 61 131 82 85 63 31 453

Minister of Finance Initial Household Survey 2005
79
How was this plot acquired? (la28)
la28 Chachoeng Buriram Lop Buri Sisaket Phrae Satun Total Purchased 32.8 35.1 32.9 35.3 17.5 35.5 32.0 Inherited 60.7 64.1 63.4 61.2 76.2 64.5 64.7 Cleared - - - 1.2 - - 0.2 Rented land 6.6 0.8 - - 1.6 - 1.3 From relatives - - 2.4 1.2 3.2 - 1.1 Other - - 1.2 1.2 1.6 - 0.7 Total 100.0 100.0 100.0 100.0 100.0 100.0 100.0 Obs. 61 131 82 85 63 31 453
What were the sources of financing for this land purchase? la(29)
Codes A With cash that had been saved up B With cash that was raised from selling land C With cash that was raised from selling livestock or other assets D With cash from selling product E On credit from the store F With fund borrowed from Commercial Bank
G With fund borrowed from BAAC H With fund borrowed from Agricultural Cooperative I With fund borrowed from PCG J With fund borrowed from other organization K With fund borrowed from relatives L With fund borrowed from non-relatives M With fund borrowed from moneylender N With cash from inheritance O Gift P From employer Q Other NA Not applicable
la29 Chachoeng Buriram Lop Buri Sisaket Phrae Satun Total A 26.2 31.3 25.6 31.8 12.7 16.1 26.1
A,E - 0.8 - - - - 0.2 A,G,C - - - - 1.6 - 0.2
A,J 3.3 1.5 1.2 1.2 - - 1.3 A,Q - - - 1.2 - - 0.2 B - - - - - 3.2 0.2 C - - 2.4 - - - 0.4 D 1.6 - - - - 3.2 0.4 G - - - - - 6.5 0.4 J 1.6 0.8 3.7 1.2 - - 1.3
J,A - - - - 1.6 - 0.2 L - - - - - 3.2 0.2 N - - - - - 3.2 0.2 O - 0.8 - - - - 0.2 Q - - - - 1.6 - 0.2 . 67.2 64.9 67.1 64.7 82.5 64.5 68.0
Total 100.0 100.0 100.0 100.0 100.0 100.0 100.0 Obs. 61 131 82 85 63 31 453

Minister of Finance Initial Household Survey 2005
80
How many kilometers is it from your house to the plot? (la31)
Province Obs Mean Std. Dev. Min Max Chachoeng 61 106.4 248.7 0.0 1,000.0Buriram 131 29.6 78.7 0.0 500.0Lop Buri 82 62.8 139.9 0.0 700.0Sisaket 83 71.4 175.4 0.0 780.0Phrae 61 27.0 78.2 0.0 560.0Satun 31 38.8 178.6 0.1 1,000.0Total 449 54.1 151.5 0.0 1,000.0
Kilometers Chachoeng Buriram Lop Buri Sisaket Phrae Satun Total Equal to 0 9.8 19.9 11.0 4.7 3.2 - 10.4
0 to 5 36.1 34.4 43.9 27.1 57.1 64.5 40.2 5.01 to 10 9.8 16.0 9.8 11.8 7.9 16.1 12.1
10.01 to 25 9.8 11.5 6.1 22.4 12.7 12.9 12.6 25.01 to 50 14.8 6.1 8.5 12.9 3.2 3.2 8.4 50.01 to 100 4.9 4.6 7.3 7.1 6.4 - 5.5 Above 100 14.8 7.6 13.4 11.8 6.4 3.2 9.9
. - - - 2.4 3.2 - 0.9 Total 100.0 100.0 100.0 100.0 100.0 100.0 100.0 Obs. 61 131 82 85 63 31 453
How is this land currently being used? (la32)
la32 Chachoeng Buriram Lop Buri Sisaket Phrae Satun Total House plot 3.3 - 6.1 1.2 7.9 - 2.9 Rented out for cash 36.1 16.0 30.5 11.8 17.5 9.7 20.3 Rented out for portion of harvest - 28.2 9.8 24.7 19.1 - 17.2 Rented out for free to relatives 27.9 10.7 23.2 31.8 23.8 19.4 21.6 Rented out for free to non relatives 9.8 1.5 1.2 - - - 2.0 This plot is mortgaged to someone - 0.8 - 5.9 - - 1.3 Plot is not being used 19.7 36.6 28.1 24.7 30.2 71.0 32.0 Other 3.3 6.1 1.2 - 1.6 - 2.7 Total 100.0 100.0 100.0 100.0 100.0 100.0 100.0 Obs. 61 131 82 85 63 31 453
Loss land
In the past 15 years, has the household gotten rid of any land? (la34)
la34 Chachoeng Buriram Lop Buri Sisaket Phrae Satun Total Yes 5.0 12.1 5.4 10.4 5.4 5.4 7.3 No 95.0 87.9 94.6 89.6 94.6 94.6 92.7 Total 100.0 100.0 100.0 100.0 100.0 100.0 100.0 Obs. 240 240 240 240 240 240 1,440

Minister of Finance Initial Household Survey 2005
81
How many times did you get rid of land during the past 15 years? (la35)
la35 Chachoeng Buriram Lop Buri Sisaket Phrae Satun Total 1 3.8 8.8 4.2 9.2 5.4 3.8 5.8 2 1.3 2.9 1.3 0.4 - 1.7 1.3 3 - - - 0.4 - - 0.1 4 - - - 0.4 - - 0.1 5 - 0.4 - - - - 0.1 . 95.0 87.9 94.6 89.6 94.6 94.6 92.7
Total 100.0 100.0 100.0 100.0 100.0 100.0 100.0 Obs. 240 240 240 240 240 240 1,440
How many rai were lost/sold? (la37)
Province Obs Mean Std. Dev. Min Max Chachoeng 15 3.8 10.3 0.1 40.0Buriram 40 5.5 6.0 0.1 20.0Lop Buri 16 11.5 26.8 0.0 108.0Sisaket 31 5.8 7.4 0.2 34.0Phrae 12 1.6 1.3 0.3 5.0Satun 17 4.4 4.4 0.3 13.0Total 131 5.6 11.2 0.0 108.0
Rai Chachoeng Buriram Lop Buri Sisaket Phrae Satun Total 0 to 5 86.7 57.5 62.5 64.5 92.3 64.7 67.4
5.01 to 10 6.7 30.0 12.5 19.4 - 23.5 18.9 10.01 to 25 - 12.5 18.8 12.9 - 11.8 10.6 25.01 to 50 6.7 - - 3.2 - - 1.5 50.01 to 100 - - 6.3 - - - 0.8
. - - - - 7.7 - 0.8 Total 100.0 100.0 100.0 100.0 100.0 100.0 100.0 Obs. 15 40 16 31 13 17 132
What type of land was lost/sold? (la38)
la38 Chachoeng Buriram Lop Buri Sisaket Phrae Satun Total Residential 66.7 35.0 37.5 19.4 23.1 29.4 33.3 Land for paddy 6.7 50.0 50.0 71.0 61.5 35.3 49.2 Land for field crops 6.7 - 6.3 3.2 - - 2.3 Land for tree crops - - - 6.5 15.4 23.5 6.1 Other 20.0 15.0 6.3 - - 11.8 9.1 Total 100.0 100.0 100.0 100.0 100.0 100.0 100.0 Obs. 15 40 16 31 13 17 132

Minister of Finance Initial Household Survey 2005
82
Section XV. Expenditure
What is the total value of expenditures/consumption of the following items in a typical month of the last year? (ex4)
Thai Baht of 2005
1. Rice you grew yourself
Province Obs Mean Std. Dev. Min Max Chachoeng 2 413 244 240 585Buriram 46 606 250 150 1,400Lop Buri 2 565 92 500 630Sisaket 108 789 356 150 2,250Phrae 27 645 357 150 1,800Satun 52 447 339 96 2,500Total 237 657 357 96 2,500
2. Rice you bought
Province Obs Mean Std. Dev. Min Max Chachoeng 233 528 962 70 11,475Buriram 202 532 287 52 1,800Lop Buri 230 496 330 75 2,250Sisaket 142 619 353 24 2,250Phrae 213 443 257 45 1,800Satun 198 364 214 30 1,500Total 1,218 492 500 24 11,475
3. Other grains
Province Obs Mean Std. Dev. Min Max Chachoeng 9 42 18 20 60Buriram 0 Lop Buri 9 557 426 15 1,400Sisaket 64 49 43 10 210Phrae 2 165 78 110 220Satun 3 40 0 40 40Total 87 103 206 10 1,400
4. Milk and milk products
Province Obs Mean Std. Dev. Min Max Chachoeng 157 480 511 40 3,600Buriram 185 494 521 35 3,900Lop Buri 171 630 1,067 40 12,060Sisaket 174 380 445 10 3,600Phrae 171 520 666 36 5,000Satun 143 436 613 40 3,300Total 1,001 492 673 10 12,060

Minister of Finance Initial Household Survey 2005
83
What is the total value of expenditures/consumption of the following items in a typical month of the last year? (ex4)
Cont.
Thai Baht of 2005
5. Meat (chicken, beef, pork)
Province Obs Mean Std. Dev. Min Max Chachoeng 221 561 475 50 3,000Buriram 231 549 453 55 2,700Lop Buri 231 415 352 50 2,700Sisaket 238 355 231 90 1,650Phrae 236 624 744 60 7,200Satun 231 783 766 100 7,000Total 1,388 547 557 50 7,200
6. Alcoholic beverages consumed at home
Province Obs Mean Std. Dev. Min Max Chachoeng 50 943 798 60 3,000Buriram 75 652 701 35 3,150Lop Buri 71 715 649 50 3,500Sisaket 67 408 469 20 2,040Phrae 43 466 489 40 2,280Satun 9 676 364 240 1,200Total 315 636 650 20 3,500
7. Alcoholic beverages consumed away from home
Province Obs Mean Std. Dev. Min Max Chachoeng 31 1,201 2,645 130 15,000Buriram 43 454 562 35 2,600Lop Buri 30 435 276 130 1,200Sisaket 31 350 458 20 2,280Phrae 13 522 395 100 1,500Satun 4 1,023 1,326 175 3,000Total 152 602 1,298 20 15,000
8. Tobacco
Province Obs Mean Std. Dev. Min Max Chachoeng 85 607 447 14 2,400Buriram 82 477 482 8 2,100Lop Buri 65 469 517 3 2,250Sisaket 97 405 430 16 2,100Phrae 38 522 423 30 1,800Satun 101 549 412 20 1,225Total 468 504 454 3 2,400

Minister of Finance Initial Household Survey 2005
84
What is the total value of expenditures/consumption of the following items in a typical month of the last year? (ex4)
Cont.
Thai Baht of 2005
9. Gasoline –excluding gasoline for business or farming use
Province Obs Mean Std. Dev. Min Max Chachoeng 197 1,408 1,486 50 12,000Buriram 222 1,039 915 100 5,500Lop Buri 205 1,446 2,827 50 33,600Sisaket 214 871 843 50 6,960Phrae 219 940 1,026 50 7,000Satun 225 1,164 1,698 25 21,600Total 1,282 1,138 1,613 25 33,600
10. Ceremonies
Province Obs Mean Std. Dev. Min Max Chachoeng 240 657 902 0 8,500Buriram 240 495 657 0 8,000Lop Buri 240 531 839 0 12,000Sisaket 240 467 554 85 5,000Phrae 240 596 610 0 5,000Satun 188 656 645 0 3,500Total 1,388 563 717 0 12,000
In the past 12 months, how much has the household spend on house repairs? (ex5)
Thai Baht of 2005
Province Obs Mean Std. Dev. Min Max Chachoeng 240 15,674 100,231 0 1,500,000Buriram 240 24,163 116,206 0 1,000,000Lop Buri 240 9,418 35,925 0 400,000Sisaket 240 19,165 107,446 0 1,200,000Phrae 240 12,461 43,279 0 500,000Satun 240 6,312 22,669 0 200,000Total 1,440 14,532 80,469 0 1,500,000
In the past 12 months, how much has the household spend on vehicle repairs? (ex6)
Thai Baht of 2005
Province Obs Mean Std. Dev. Min Max Chachoeng 204 3,588 6,495 0 50,000Buriram 239 2,567 4,791 0 51,700Lop Buri 198 4,143 6,769 0 35,000Sisaket 212 2,615 6,650 0 60,000Phrae 238 2,362 3,577 0 20,000Satun 184 3,092 5,753 0 50,000Total 1,275 3,021 5,740 0 60,000

Minister of Finance Initial Household Survey 2005
85
In the past 12 months, how much has the household spend on education expenses? (ex7)
Thai Baht of 2005
Province Obs Mean Std. Dev. Min Max Chachoeng 239 16,956 42,715 0 520,000Buriram 236 13,662 37,080 0 500,000Lop Buri 236 15,650 28,377 0 250,000Sisaket 237 8,128 16,151 0 150,000Phrae 237 7,159 12,053 0 96,000Satun 239 10,287 18,826 0 100,000Total 1,424 11,975 28,382 0 520,000
In the past 12 months, how much has the household spend on clothing for all the household members? (ex8)
Thai Baht of 2005
Province Obs Mean Std. Dev. Min Max Chachoeng 239 3,919 5,138 0 36,000Buriram 240 3,170 3,919 0 30,000Lop Buri 240 3,293 3,918 0 36,000Sisaket 240 1,620 1,797 0 12,000Phrae 240 2,090 2,504 0 20,000Satun 224 2,963 4,660 0 60,000Total 1,423 2,840 3,896 0 60,000
In the past 12 months, how much has the household spent on food eaten away from home by all household members? (ex9)
Thai Baht of 2005
Province Obs Mean Std. Dev. Min Max Chachoeng 239 11,135 19,387 0 180,000Buriram 240 5,202 8,148 0 58,400Lop Buri 239 10,811 19,351 0 180,000Sisaket 240 2,598 5,907 0 36,000Phrae 239 8,730 12,880 0 72,000Satun 235 3,220 7,920 0 70,000Total 1,432 6,955 13,837 0 180,000

Minister of Finance Initial Household Survey 2005
86
Section XVI. Income
(Gross Revenues) What was your household’s total gross income over the past 12 months? (in1)
Thousands of Thai Baht of 2005
Province Obs Mean Std. Dev. Min Max Chachoeng 240 693 2,457 28 31,272Buriram 240 472 654 20 7,200Lop Buri 240 435 514 13 3,720SiSaket 240 328 505 21 4,700Phrae 240 292 380 18 4,300Satun 240 205 239 0 2,760Total 1,440 404 1,104 0 31,272
Thousands Chachoeng Buriram Lop Buri SiSaket Phrae Satun Total Equal to 0 - - - - - 0.4 0.1
5.01 to 10 - - - - - 0.4 0.1 10.01 to 25 - 0.4 0.8 0.8 1.3 1.7 0.8 25.01 to 50 3.3 1.7 0.8 7.9 3.8 4.2 3.6 50.01 to 100 10.8 11.7 10.0 21.7 15.8 23.8 15.6
100.01 to 150 11.3 11.3 13.3 17.5 18.3 19.6 15.2 150.01 to 300 29.2 26.7 28.8 20.4 32.1 35.8 28.8 300.01 to 750 32.5 32.1 33.8 22.9 22.9 11.7 26.0 750.01 to 1500 7.5 11.3 7.1 6.3 4.6 2.1 6.5 Above 150 5.4 5.0 5.4 2.5 1.3 0.4 3.3
Total 100.0 100.0 100.0 100.0 100.0 100.0 100.0 Obs. 240 240 240 240 240 240 1,440
Has anyone in your household received any of the following payments during the past 12 months? (in2)
If yes, how much did they receive over the past 12 months? (in4)
A. Rice farming
in2 Chachoeng Buriram Lop Buri SiSaket Phrae Satun Total Yes 0.4 18.8 2.9 36.3 6.7 9.2 12.4 No 99.6 81.3 97.1 63.8 93.3 90.8 87.6 Total 100.0 100.0 100.0 100.0 100.0 100.0 100.0 Obs. 240 240 240 240 240 240 1,440
Thousands of Thai Baht of 2005
Province Obs Mean Std. Dev. Min Max Chachoeng 1 10.0 . 10 10Buriram 45 27.0 21.4 3 90Lop Buri 7 52.3 54.8 8 168SiSaket 87 19.0 16.1 2 97Phrae 16 14.8 11.3 2 47Satun 22 9.3 9.8 1 30Total 178 20.7 20.9 1 168

Minister of Finance Initial Household Survey 2005
87
Has anyone in your household received any of the following payments during the past 12 months? (in2)
If yes, how much did they receive over the past 12 months? (in4)
Cont.
B. Corn farming
In2 Chachoeng Buriram Lop Buri SiSaket Phrae Satun Total Yes - 0.4 0.8 0.4 0.4 1.3 0.6 No 100.0 99.6 99.2 99.6 99.6 98.8 99.4 Total 100.0 100.0 100.0 100.0 100.0 100.0 100.0 Obs. 240 240 240 240 240 240 1,440
Thousands of Thai Baht of 2005
Province Obs Mean Std. Dev. Min Max Chachoeng 0 Buriram 1 1.0 . 1 1Lop Buri 2 26.5 30.4 5 48SiSaket 1 5.0 . 5 5Phrae 1 30.0 . 30 30Satun 3 3.3 2.3 2 6Total 8 12.4 17.2 1 48
C. Vegetable farming
In2 Chachoeng Buriram Lop Buri SiSaket Phrae Satun Total Yes - 2.5 - 5.0 0.4 4.2 2.0 No 100.0 97.5 100.0 95.0 99.6 95.8 98.0 Total 100.0 100.0 100.0 100.0 100.0 100.0 100.0 Obs. 240 240 240 240 240 240 1,440
Thousands of Thai Baht of 2005
Province Obs Mean Std. Dev. Min Max Chachoeng 0 Buriram 6 12.0 20.8 1 54Lop Buri 0 SiSaket 12 16.5 14.3 2 40Phrae 1 18.0 . 18 18Satun 10 10.7 9.4 1 25Total 29 13.6 13.9 1 54

Minister of Finance Initial Household Survey 2005
88
Has anyone in your household received any of the following payments during the past 12 months? (in2)
If yes, how much did they receive over the past 12 months? (in4)
Cont.
D. Orchard farming
In2 Chachoeng Buriram Lop Buri SiSaket Phrae Satun Total Yes 0.8 1.7 - - 0.8 4.2 1.3 No 99.2 98.3 100.0 100.0 99.2 95.8 98.8 Total 100.0 100.0 100.0 100.0 100.0 100.0 100.0 Obs. 240 240 240 240 240 240 1,440
Thousands of Thai Baht of 2005
Province Obs Mean Std. Dev. Min Max Chachoeng 2 82.0 87.7 20 144Buriram 4 3.0 1.9 1 5Lop Buri 0 SiSaket 0 Phrae 2 6.0 1.4 5 7Satun 10 29.0 35.1 3 100Total 18 26.5 40.7 1 144
E. Other crop
In2 Chachoeng Buriram Lop Buri SiSaket Phrae Satun Total Yes - 0.8 0.8 2.5 0.8 29.6 5.8 No 100.0 99.2 99.2 97.5 99.2 70.4 94.2 Total 100.0 100.0 100.0 100.0 100.0 100.0 100.0 Obs. 240 240 240 240 240 240 1,440
Thousands of Thai Baht of 2005
Province Obs Mean Std. Dev. Min Max Chachoeng 0 Buriram 2 22.5 24.7 5 40Lop Buri 2 75.0 97.6 6 144SiSaket 6 60.2 64.2 4 180Phrae 2 11.5 4.9 8 15Satun 71 131.2 102.8 1 576Total 83 119.2 101.7 1 576

Minister of Finance Initial Household Survey 2005
89
Has anyone in your household received any of the following payments during the past 12 months? (in2)
If yes, how much did they receive over the past 12 months? (in4)
Cont.
F. Raising shrimp
In2 Chachoeng Buriram Lop Buri SiSaket Phrae Satun Total Yes - - - - - - -No 100.0 100.0 100.0 100.0 100.0 100.0 100.0 Total 100.0 100.0 100.0 100.0 100.0 100.0 100.0 Obs. 240 240 240 240 240 240 1,440
G. Raising fish
In2 Chachoeng Buriram Lop Buri SiSaket Phrae Satun Total Yes 2.1 - 0.4 - - 1.7 0.7 No 97.9 100.0 99.6 100.0 100.0 98.3 99.3 Total 100.0 100.0 100.0 100.0 100.0 100.0 100.0 Obs. 240 240 240 240 240 240 1,440
Thousands of Thai Baht of 2005
Province Obs Mean Std. Dev. Min Max Chachoeng 5 960.0 1,154.6 200 3,000Buriram 0 Lop Buri 1 8.0 . 8 8SiSaket 0 Phrae 0 Satun 4 152.5 103.4 10 250Total 10 541.8 890.0 8 3,000
H. Raising chicken or ducks
In2 Chachoeng Buriram Lop Buri SiSaket Phrae Satun Total Yes - 1.3 1.3 1.7 0.8 2.5 1.3 No 100.0 98.8 98.8 98.3 99.2 97.5 98.8 Total 100.0 100.0 100.0 100.0 100.0 100.0 100.0 Obs. 240 240 240 240 240 240 1,440
Thousands of Thai Baht of 2005
Province Obs Mean Std. Dev. Min Max Chachoeng 0 Buriram 3 3.0 2.0 1 5Lop Buri 3 538.4 928.0 1 1,610SiSaket 4 68.3 108.4 6 230Phrae 2 2.5 2.1 1 4Satun 6 1.6 2.2 0 6Total 18 106.2 379.1 0 1,610

Minister of Finance Initial Household Survey 2005
90
Has anyone in your household received any of the following payments during the past 12 months? (in2)
If yes, how much did they receive over the past 12 months? (in4)
Cont.
I. Raising pigs, cows of buffalo
In2 Chachoeng Buriram Lop Buri SiSaket Phrae Satun Total Yes - 4.6 1.7 6.7 2.1 5.4 3.4 No 100.0 95.4 98.3 93.3 97.9 94.6 96.6 Total 100.0 100.0 100.0 100.0 100.0 100.0 100.0 Obs. 240 240 240 240 240 240 1,440
Thousands of Thai Baht of 2005
Province Obs Mean Std. Dev. Min Max Chachoeng 0 Buriram 11 28.2 25.6 4 90Lop Buri 4 288.8 451.5 20 960SiSaket 16 20.6 10.2 4 38Phrae 5 57.8 58.2 10 150Satun 13 18.2 12.1 5 50Total 49 47.3 136.6 4 960
J. Raising other livestock
In2 Chachoeng Buriram Lop Buri SiSaket Phrae Satun Total Yes 0.4 - - - - 0.8 0.2 No 99.6 100.0 100.0 100.0 100.0 99.2 99.8 Total 100.0 100.0 100.0 100.0 100.0 100.0 100.0 Obs. 240 240 240 240 240 240 1,440
Thousands of Thai Baht of 2005
Province Obs Mean Std. Dev. Min Max Chachoeng 1 3,600.0 . 3,600 3,600Buriram 0 Lop Buri 0 SiSaket 0 Phrae 0 Satun 2 22.0 2.8 20 24Total 3 1,214.7 2,065.8 20 3,600
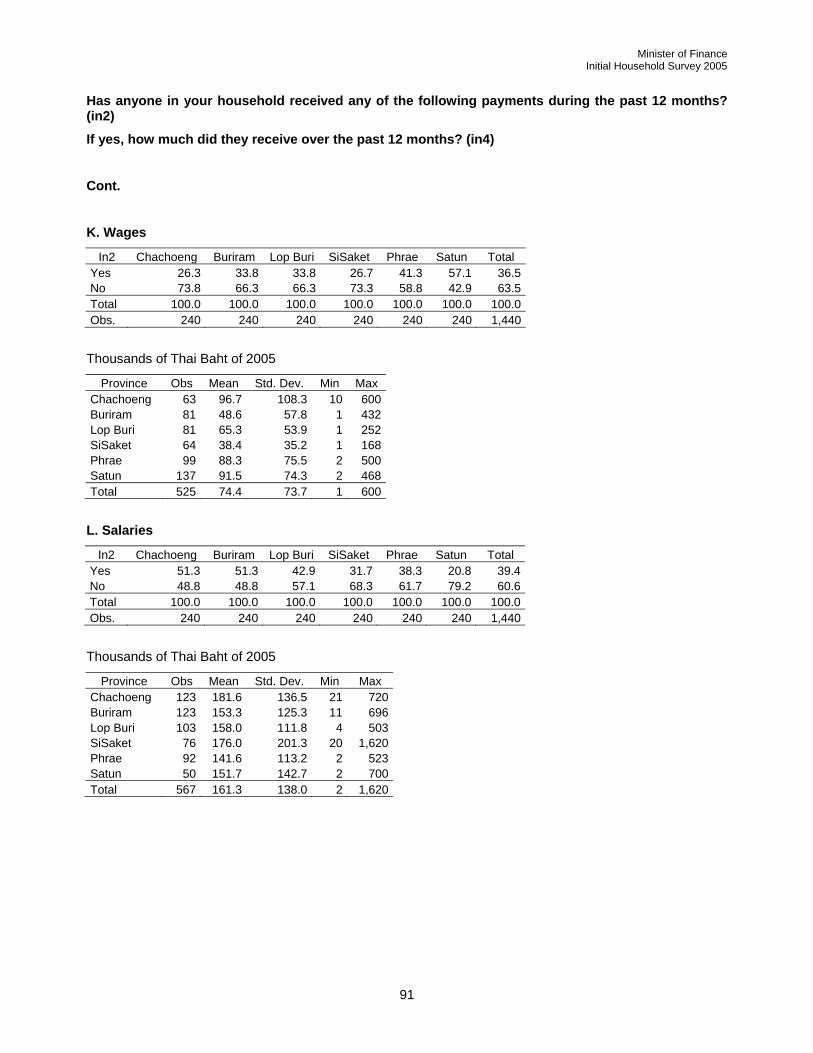
Minister of Finance Initial Household Survey 2005
91
Has anyone in your household received any of the following payments during the past 12 months? (in2)
If yes, how much did they receive over the past 12 months? (in4)
Cont.
K. Wages
In2 Chachoeng Buriram Lop Buri SiSaket Phrae Satun Total Yes 26.3 33.8 33.8 26.7 41.3 57.1 36.5 No 73.8 66.3 66.3 73.3 58.8 42.9 63.5 Total 100.0 100.0 100.0 100.0 100.0 100.0 100.0 Obs. 240 240 240 240 240 240 1,440
Thousands of Thai Baht of 2005
Province Obs Mean Std. Dev. Min Max Chachoeng 63 96.7 108.3 10 600Buriram 81 48.6 57.8 1 432Lop Buri 81 65.3 53.9 1 252SiSaket 64 38.4 35.2 1 168Phrae 99 88.3 75.5 2 500Satun 137 91.5 74.3 2 468Total 525 74.4 73.7 1 600
L. Salaries
In2 Chachoeng Buriram Lop Buri SiSaket Phrae Satun Total Yes 51.3 51.3 42.9 31.7 38.3 20.8 39.4 No 48.8 48.8 57.1 68.3 61.7 79.2 60.6 Total 100.0 100.0 100.0 100.0 100.0 100.0 100.0 Obs. 240 240 240 240 240 240 1,440
Thousands of Thai Baht of 2005
Province Obs Mean Std. Dev. Min Max Chachoeng 123 181.6 136.5 21 720Buriram 123 153.3 125.3 11 696Lop Buri 103 158.0 111.8 4 503SiSaket 76 176.0 201.3 20 1,620Phrae 92 141.6 113.2 2 523Satun 50 151.7 142.7 2 700Total 567 161.3 138.0 2 1,620

Minister of Finance Initial Household Survey 2005
92
Has anyone in your household received any of the following payments during the past 12 months? (in2)
If yes, how much did they receive over the past 12 months? (in4)
Cont.
M. Rice mill
In2 Chachoeng Buriram Lop Buri SiSaket Phrae Satun Total Yes - 1.7 - 0.4 0.8 - 0.5 No 100.0 98.3 100.0 99.6 99.2 100.0 99.5 Total 100.0 100.0 100.0 100.0 100.0 100.0 100.0 Obs. 240 240 240 240 240 240 1,440
Thousands of Thai Baht of 2005
Province Obs Mean Std. Dev. Min Max Chachoeng 0 Buriram 4 24.6 21.0 2 48Lop Buri 0 SiSaket 1 43.2 . 43 43Phrae 2 31.2 23.8 14 48Satun 0 Total 7 29.1 19.1 2 48
N. Store
In2 Chachoeng Buriram Lop Buri SiSaket Phrae Satun Total Yes 17.1 11.7 13.3 13.3 8.3 7.9 11.9 No 82.9 88.3 86.7 86.7 91.7 92.1 88.1 Total 100.0 100.0 100.0 100.0 100.0 100.0 100.0 Obs. 240 240 240 240 240 240 1,440
Thousands of Thai Baht of 2005
Province Obs Mean Std. Dev. Min Max Chachoeng 41 1,723.9 5,439.7 8 30,000Buriram 28 740.1 1,354.0 36 7,200Lop Buri 32 371.7 422.6 48 1,890SiSaket 32 201.9 207.1 20 1,080Phrae 20 300.0 225.4 25 720Satun 19 183.2 198.4 30 900Total 172 693.2 2,761.8 8 30,000

Minister of Finance Initial Household Survey 2005
93
Has anyone in your household received any of the following payments during the past 12 months? (in2)
If yes, how much did they receive over the past 12 months? (in4)
Cont.
O. Mechanic or Repair shop
In2 Chachoeng Buriram Lop Buri SiSaket Phrae Satun Total Yes 0.4 2.5 2.9 5.0 1.7 0.4 2.2 No 99.6 97.5 97.1 95.0 98.3 99.6 97.9 Total 100.0 100.0 100.0 100.0 100.0 100.0 100.0 Obs. 240 240 240 240 240 240 1,440
Thousands of Thai Baht of 2005
Province Obs Mean Std. Dev. Min Max Chachoeng 1 120.0 . 120 120Buriram 6 262.5 188.7 72 528Lop Buri 7 395.7 473.9 66 1,200SiSaket 12 565.5 1,320.1 12 4,700Phrae 4 75.6 69.9 36 180Satun 1 126.0 . 126 126Total 31 376.8 850.7 12 4,700
P. Hair salon or Barber
In2 Chachoeng Buriram Lop Buri SiSaket Phrae Satun Total Yes 3.8 2.9 3.8 2.1 2.1 2.1 2.8 No 96.3 97.1 96.3 97.9 97.9 97.9 97.2 Total 100.0 100.0 100.0 100.0 100.0 100.0 100.0 Obs. 240 240 240 240 240 240 1,440
Thousands of Thai Baht of 2005
Province Obs Mean Std. Dev. Min Max Chachoeng 9 168.8 222.3 26 720Buriram 7 132.6 104.2 10 280Lop Buri 9 104.9 69.2 36 218SiSaket 5 91.6 52.3 43 175Phrae 5 160.8 152.9 60 420Satun 5 63.6 59.5 2 160Total 40 124.3 131.0 2 720

Minister of Finance Initial Household Survey 2005
94
Has anyone in your household received any of the following payments during the past 12 months? (in2)
If yes, how much did they receive over the past 12 months? (in4)
Cont.
Q. Restaurant or Noodle shop
In2 Chachoeng Buriram Lop Buri SiSaket Phrae Satun Total Yes 8.3 9.6 14.2 6.7 3.3 8.3 8.4 No 91.7 90.4 85.8 93.3 96.7 91.7 91.6 Total 100.0 100.0 100.0 100.0 100.0 100.0 100.0 Obs. 240 240 240 240 240 240 1,440
Thousands of Thai Baht of 2005
Province Obs Mean Std. Dev. Min Max Chachoeng 20 491.0 812.2 37 3,650Buriram 23 601.2 591.8 12 2,520Lop Buri 34 390.3 307.8 60 1,176SiSaket 16 256.6 212.9 10 720Phrae 8 452.9 348.5 144 1,080Satun 20 111.7 82.6 6 360Total 121 387.4 484.1 6 3,650
R. Trading
In2 Chachoeng Buriram Lop Buri SiSaket Phrae Satun Total Yes 20.0 20.4 16.7 14.6 27.1 12.9 18.6 No 80.0 79.6 83.3 85.4 72.9 87.1 81.4 Total 100.0 100.0 100.0 100.0 100.0 100.0 100.0 Obs. 240 240 240 240 240 240 1,440
Thousands of Thai Baht of 2005
Province Obs Mean Std. Dev. Min Max Chachoeng 48 559.3 958.0 1 4,900Buriram 49 548.5 651.1 7 2,280Lop Buri 40 546.7 706.3 2 3,600SiSaket 35 243.7 277.4 7 1,260Phrae 65 353.4 600.6 24 4,300Satun 31 207.8 491.7 12 2,760Total 268 423.7 673.3 1 4,900

Minister of Finance Initial Household Survey 2005
95
Has anyone in your household received any of the following payments during the past 12 months? (in2)
If yes, how much did they receive over the past 12 months? (in4)
Cont.
S. Other business
In2 Chachoeng Buriram Lop Buri SiSaket Phrae Satun Total Yes 22.9 17.1 31.7 27.9 15.0 8.8 20.6 No 77.1 82.9 68.3 72.1 85.0 91.3 79.4 Total 100.0 100.0 100.0 100.0 100.0 100.0 100.0 Obs. 240 240 240 240 240 240 1,440
T. Payments for renting land
In2 Chachoeng Buriram Lop Buri SiSaket Phrae Satun Total Yes 4.2 3.8 5.8 0.8 3.3 0.8 3.1 No 95.8 96.3 94.2 99.2 96.7 99.2 96.9 Total 100.0 100.0 100.0 100.0 100.0 100.0 100.0 Obs. 240 240 240 240 240 240 1,440
Thousands of Thai Baht of 2005
Province Obs Mean Std. Dev. Min Max Chachoeng 10 113.4 252.9 1 828Buriram 9 23.1 31.0 2 100Lop Buri 14 13.7 16.0 2 50SiSaket 2 21.0 12.7 12 30Phrae 8 5.8 7.7 0 24Satun 2 39.2 43.6 8 70Total 45 37.8 122.9 0 828
U. Payments for other rentals
In2 Chachoeng Buriram Lop Buri SiSaket Phrae Satun Total Yes 1.7 - 0.4 0.4 - 0.4 0.5 No 98.3 100.0 99.6 99.6 100.0 99.6 99.5 Total 100.0 100.0 100.0 100.0 100.0 100.0 100.0 Obs. 240 240 240 240 240 240 1,440
Thousands of Thai Baht of 2005
Province Obs Mean Std. Dev. Min Max Chachoeng 4 55.5 42.5 18 108Buriram 0 Lop Buri 1 18.0 . 18 18SiSaket 1 12.0 . 12 12Phrae 0 Satun 1 84.0 . 84 84Total 7 48.0 39.0 12 108

Minister of Finance Initial Household Survey 2005
96
Has anyone in your household received any of the following payments during the past 12 months? (in2)
If yes, how much did they receive over the past 12 months? (in4)
Cont.
V. From selling land
In2 Chachoeng Buriram Lop Buri SiSaket Phrae Satun Total Yes 0.4 0.8 0.4 1.3 0.4 0.4 0.6 No 99.6 99.2 99.6 98.8 99.6 99.6 99.4 Total 100.0 100.0 100.0 100.0 100.0 100.0 100.0 Obs. 240 240 240 240 240 240 1,440
Thousands of Thai Baht of 2005
Province Obs Mean Std. Dev. Min Max Chachoeng 1 2,000.0 . 2,000 2,000Buriram 2 550.0 353.6 300 800Lop Buri 1 30.0 . 30 30SiSaket 3 1,083.3 1,660.1 100 3,000Phrae 1 1,200.0 . 1,200 1,200Satun 1 85.0 . 85 85Total 9 851.7 1,041.8 30 3,000
W. Government assistance
In2 Chachoeng Buriram Lop Buri SiSaket Phrae Satun Total Yes 1.7 1.3 1.3 2.9 - 0.4 1.3 No 98.3 98.8 98.8 97.1 100.0 99.6 98.8 Total 100.0 100.0 100.0 100.0 100.0 100.0 100.0 Obs. 240 240 240 240 240 240 1,440
Thousands of Thai Baht of 2005
Province Obs Mean Std. Dev. Min Max Chachoeng 4 2.9 1.5 1 4Buriram 3 1.1 0.7 1 2Lop Buri 3 2.3 1.4 1 4SiSaket 7 4.2 3.8 1 12Phrae 0 Satun 1 6.0 . 6 6Total 18 3.2 2.8 1 12

Minister of Finance Initial Household Survey 2005
97
Has anyone in your household received any of the following payments during the past 12 months? (in2)
If yes, how much did they receive over the past 12 months? (in4)
Cont.
X. Interest on savings
In2 Chachoeng Buriram Lop Buri SiSaket Phrae Satun Total Yes 2.5 0.4 3.3 - - 2.5 1.5 No 97.5 99.6 96.7 100.0 100.0 97.5 98.5 Total 100.0 100.0 100.0 100.0 100.0 100.0 100.0 Obs. 240 240 240 240 240 240 1,440
Thousands of Thai Baht of 2005
Province Obs Mean Std. Dev. Min Max Chachoeng 6 12.8 8.3 2 20Buriram 1 0.2 . 0 0Lop Buri 7 3.4 3.3 0 10SiSaket 0 Phrae 0 Satun 6 3.3 3.4 1 10Total 20 6.0 6.8 0 20
Y. Income from loan repayments
In2 Chachoeng Buriram Lop Buri SiSaket Phrae Satun Total Yes - 1.3 0.4 0.4 - - 0.4 No 100.0 98.8 99.6 99.6 100.0 100.0 99.7 Total 100.0 100.0 100.0 100.0 100.0 100.0 100.0 Obs. 240 240 240 240 240 240 1,440
Thousands of Thai Baht of 2005
Province Obs Mean Std. Dev. Min Max Chachoeng 0 Buriram 3 15.4 12.6 8 30Lop Buri 1 15.0 . 15 15SiSaket 1 10.4 . 10 10Phrae 0 Satun 0 Total 5 14.3 9.2 8 30

Minister of Finance Initial Household Survey 2005
98
Has anyone in your household received any of the following payments during the past 12 months? (in2)
If yes, how much did they receive over the past 12 months? (in4)
Cont.
Z. Scholarships or grants
In2 Chachoeng Buriram Lop Buri SiSaket Phrae Satun Total Yes 0.4 0.8 0.8 2.9 0.4 0.4 1.0 No 99.6 99.2 99.2 97.1 99.6 99.6 99.0 Total 100.0 100.0 100.0 100.0 100.0 100.0 100.0 Obs. 240 240 240 240 240 240 1,440
Thousands of Thai Baht of 2005
Province Obs Mean Std. Dev. Min Max Chachoeng 1 8.0 . 8 8Buriram 2 2.2 2.6 0 4Lop Buri 2 6.0 5.7 2 10SiSaket 7 3.6 3.8 0 10Phrae 1 0.2 . 0 0Satun 1 20.0 . 20 20Total 14 5.0 5.6 0 20
AA. Income from roomers and boarders
In2 Chachoeng Buriram Lop Buri SiSaket Phrae Satun Total Yes 1.7 7.9 2.1 1.3 1.7 0.4 2.5 No 98.3 92.1 97.9 98.8 98.3 99.6 97.5 Total 100.0 100.0 100.0 100.0 100.0 100.0 100.0 Obs. 240 240 240 240 240 240 1,440
Thousands of Thai Baht of 2005
Province Obs Mean Std. Dev. Min Max Chachoeng 4 60.3 53.4 6 115Buriram 19 82.2 59.0 18 252Lop Buri 5 82.8 103.9 8 250SiSaket 3 72.0 24.0 48 96Phrae 4 42.9 30.6 16 84Satun 1 36.0 . 36 36Total 36 73.4 60.0 6 252

Minister of Finance Initial Household Survey 2005
99
Has anyone in your household received any of the following payments during the past 12 months? (in2)
If yes, how much did they receive over the past 12 months? (in4)
Cont.
BB. Proceeds from ROSCA
In2 Chachoeng Buriram Lop Buri SiSaket Phrae Satun Total Yes 1.7 - 3.3 0.4 2.1 5.0 2.1 No 98.3 100.0 96.7 99.6 97.9 95.0 97.9 Total 100.0 100.0 100.0 100.0 100.0 100.0 100.0 Obs. 240 240 240 240 240 240 1,440
Thousands of Thai Baht of 2005
Province Obs Mean Std. Dev. Min Max Chachoeng 4 18.1 10.2 8 32Buriram 0 Lop Buri 8 43.6 58.6 1 148SiSaket 1 16.0 . 16 16Phrae 5 20.2 17.3 6 48Satun 12 14.9 14.9 3 48Total 30 23.9 33.4 1 148
CC. Remittances from relatives
In2 Chachoeng Buriram Lop Buri SiSaket Phrae Satun Total Yes 30.0 34.2 28.3 45.4 25.8 10.8 29.1 No 70.0 65.8 71.7 54.6 74.2 89.2 70.9 Total 100.0 100.0 100.0 100.0 100.0 100.0 100.0 Obs. 240 240 240 240 240 240 1,440
Thousands of Thai Baht of 2005
Province Obs Mean Std. Dev. Min Max Chachoeng 72 39.6 50.9 1 327Buriram 82 57.7 159.7 2 1,075Lop Buri 68 65.5 225.8 1 1,880SiSaket 109 34.0 50.9 1 360Phrae 62 35.3 53.6 1 360Satun 26 21.7 22.7 1 105Total 419 44.1 121.9 1 1,880
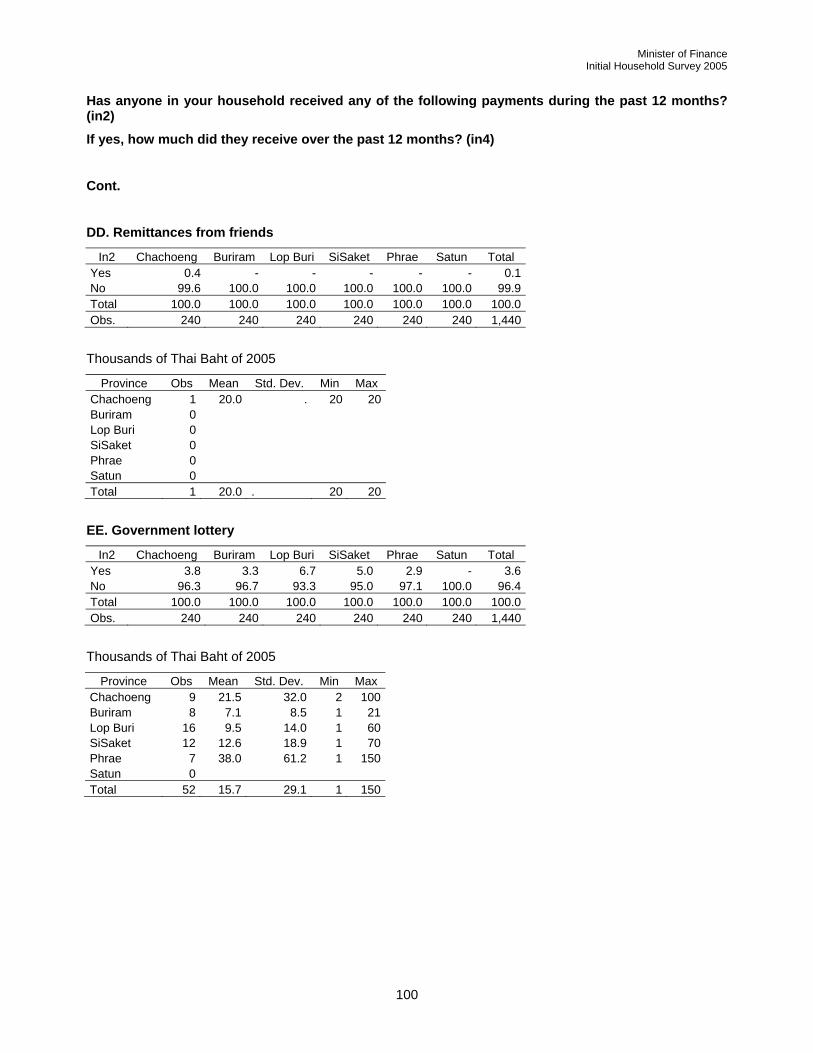
Minister of Finance Initial Household Survey 2005
100
Has anyone in your household received any of the following payments during the past 12 months? (in2)
If yes, how much did they receive over the past 12 months? (in4)
Cont.
DD. Remittances from friends
In2 Chachoeng Buriram Lop Buri SiSaket Phrae Satun Total Yes 0.4 - - - - - 0.1 No 99.6 100.0 100.0 100.0 100.0 100.0 99.9 Total 100.0 100.0 100.0 100.0 100.0 100.0 100.0 Obs. 240 240 240 240 240 240 1,440
Thousands of Thai Baht of 2005
Province Obs Mean Std. Dev. Min Max Chachoeng 1 20.0 . 20 20Buriram 0 Lop Buri 0 SiSaket 0 Phrae 0 Satun 0 Total 1 20.0 . 20 20
EE. Government lottery
In2 Chachoeng Buriram Lop Buri SiSaket Phrae Satun Total Yes 3.8 3.3 6.7 5.0 2.9 - 3.6 No 96.3 96.7 93.3 95.0 97.1 100.0 96.4 Total 100.0 100.0 100.0 100.0 100.0 100.0 100.0 Obs. 240 240 240 240 240 240 1,440
Thousands of Thai Baht of 2005
Province Obs Mean Std. Dev. Min Max Chachoeng 9 21.5 32.0 2 100Buriram 8 7.1 8.5 1 21Lop Buri 16 9.5 14.0 1 60SiSaket 12 12.6 18.9 1 70Phrae 7 38.0 61.2 1 150Satun 0 Total 52 15.7 29.1 1 150

Minister of Finance Initial Household Survey 2005
101
Has anyone in your household received any of the following payments during the past 12 months? (in2)
If yes, how much did they receive over the past 12 months? (in4)
Cont.
FF. Dividends
In2 Chachoeng Buriram Lop Buri SiSaket Phrae Satun Total Yes 2.5 25.4 1.7 62.5 12.5 2.1 17.8 No 97.5 74.6 98.3 37.5 87.5 97.9 82.2 Total 100.0 100.0 100.0 100.0 100.0 100.0 100.0 Obs. 240 240 240 240 240 240 1,440
Thousands of Thai Baht of 2005
Province Obs Mean Std. Dev. Min Max Chachoeng 6 7.7 12.4 0 30Buriram 61 4.8 8.2 0 36Lop Buri 4 4.8 4.9 0 10SiSaket 150 0.9 3.9 0 39Phrae 30 0.8 1.3 0 6Satun 5 12.9 11.5 1 30Total 256 2.2 6.0 0 39
GG. Retirement compensation
In2 Chachoeng Buriram Lop Buri SiSaket Phrae Satun Total Yes 5.8 7.9 5.0 9.2 7.5 1.3 6.1 No 94.2 92.1 95.0 90.8 92.5 98.8 93.9 Total 100.0 100.0 100.0 100.0 100.0 100.0 100.0 Obs. 240 240 240 240 240 240 1,440
Thousands of Thai Baht of 2005
Province Obs Mean Std. Dev. Min Max Chachoeng 14 217.8 126.9 21 432Buriram 19 218.0 121.8 37 600Lop Buri 12 240.8 171.6 36 600SiSaket 22 180.4 119.2 36 492Phrae 18 173.6 120.3 56 420Satun 3 108.0 63.5 60 180Total 88 198.8 128.2 21 600

Minister of Finance Initial Household Survey 2005
102
Has anyone in your household received any of the following payments during the past 12 months? (in2)
If yes, how much did they receive over the past 12 months? (in4)
Cont.
HH. Gifts
In2 Chachoeng Buriram Lop Buri SiSaket Phrae Satun Total Yes 1.7 7.1 3.8 2.1 0.4 1.3 2.7 No 98.3 92.9 96.3 97.9 99.6 98.8 97.3 Total 100.0 100.0 100.0 100.0 100.0 100.0 100.0 Obs. 240 240 240 240 240 240 1,440
Thousands of Thai Baht of 2005
Province Obs Mean Std. Dev. Min Max Chachoeng 4 108.4 127.1 8 290Buriram 17 72.8 115.9 1 500Lop Buri 9 84.7 116.0 5 360SiSaket 5 35.2 39.5 0 84Phrae 1 5.5 . 6 6Satun 3 5.3 5.9 1 12Total 39 67.5 103.6 0 500
(Business/Farm Expenses) Over the past 12 months, what were the total business or farm expenses of the household? (in6)
Thousands of Thai Baht of 2005
Province Obs Mean Std. Dev. Min Max Chachoeng 240 388.7 2,111.7 0 29,400Buriram 240 216.1 438.9 0 3,447Lop Buri 240 200.4 376.2 0 3,295SiSaket 240 138.7 370.0 0 4,118Phrae 240 109.3 313.4 0 4,000Satun 240 38.8 182.7 0 2,460Total 1,440 182.0 923.4 0 29,400
Thousands Chachoeng Buriram Lop Buri SiSaket Phrae Satun Total Equal to 0 31.3 21.7 22.5 11.3 39.2 31.7 26.3
0.01 to 1 0.8 7.1 0.4 2.1 0.4 0.8 1.9 1.01 to 2.5 0.8 0.8 0.4 2.1 0.8 3.3 1.4 2.51 to 5 1.7 1.3 1.3 5.0 2.1 13.3 4.1 5.01 to 10 2.9 2.5 3.3 11.7 4.2 13.8 6.4
10.01 to 25 6.7 7.5 7.5 15.0 7.5 12.9 9.5 25.01 to 50 7.5 10.0 7.9 11.3 9.6 10.4 9.4 50.01 to 100 15.0 11.3 15.0 14.2 10.4 7.9 12.3
100.01 to 150 7.1 6.7 6.7 6.7 6.7 3.3 6.2 150.01 to 300 11.7 11.7 17.5 7.9 10.0 1.3 10.0 300.01 to 750 7.5 11.7 11.3 10.0 7.1 0.4 8.0 750.01 to 1500 3.3 4.2 4.6 2.1 1.3 0.4 2.6 Above 150 3.8 3.8 1.7 0.8 0.8 0.4 1.9
Total 100.0 100.0 100.0 100.0 100.0 100.0 100.0 Obs. 240 240 240 240 240 240 1,440

Minister of Finance Initial Household Survey 2005
103
Has anyone in your household had the following farm expenses during the past 12 months? (in7f)
If yes, how much did they spend over the past 12 months? (in9f)
A. Seeds
in7 Chachoeng Buriram Lop Buri SiSaket Phrae Satun Total Yes 0.4 9.6 5.0 11.3 6.7 7.9 6.8 No 99.6 90.4 95.0 88.8 93.3 92.1 93.2 Total 100.0 100.0 100.0 100.0 100.0 100.0 100.0 Obs. 240 240 240 240 240 240 1,440
Thousands of Thai Baht of 2005
Province Obs Mean Std. Dev. Min Max Chachoeng 1 13.0 . 13.0 13.0Buriram 23 2.2 2.8 0.2 13.5Lop Buri 12 4.8 4.5 0.2 15.0SiSaket 27 0.8 0.8 0.1 3.6Phrae 16 1.5 1.6 0.3 5.0Satun 19 4.8 6.3 0.2 22.5Total 98 2.7 4.0 0.1 22.5
B. Fertilizers
in7 Chachoeng Buriram Lop Buri SiSaket Phrae Satun Total Yes 1.3 22.1 5.4 42.9 11.3 39.2 20.4 No 98.8 77.9 94.6 57.1 88.8 60.8 79.7 Total 100.0 100.0 100.0 100.0 100.0 100.0 100.0 Obs. 240 240 240 240 240 240 1,440
Thousands of Thai Baht of 2005
Province Obs Mean Std. Dev. Min Max Chachoeng 2 2.0 1.4 1.0 3.0Buriram 53 6.0 5.3 0.4 27.0Lop Buri 13 5.7 5.3 0.6 18.0SiSaket 103 4.0 3.6 0.1 20.0Phrae 27 2.9 7.3 0.4 39.0Satun 93 4.4 3.2 0.3 20.0Total 291 4.5 4.4 0.1 39.0

Minister of Finance Initial Household Survey 2005
104
Has anyone in your household had the following farm expenses during the past 12 months? (in7f)
If yes, how much did they spend over the past 12 months? (in9f)
Cont.
C. Pesticides or herbicides
in7 Chachoeng Buriram Lop Buri SiSaket Phrae Satun Total Yes 0.4 5.4 4.6 14.2 4.6 14.6 7.3 No 99.6 94.6 95.4 85.8 95.4 85.4 92.7 Total 100.0 100.0 100.0 100.0 100.0 100.0 100.0 Obs. 240 240 240 240 240 240 1,440
Thousands of Thai Baht of 2005
Province Obs Mean Std. Dev. Min Max Chachoeng 0 Buriram 13 0.7 0.9 0.1 3.0Lop Buri 11 2.2 1.8 0.5 5.0SiSaket 34 0.8 1.1 0.1 5.0Phrae 11 2.4 5.9 0.1 20.0Satun 35 1.2 1.6 0.0 10.0Total 104 1.2 2.3 0.0 20.0
D. Wages –all paid labor
in7 Chachoeng Buriram Lop Buri SiSaket Phrae Satun Total Yes 0.4 17.9 2.9 27.5 10.4 11.7 11.8 No 99.6 82.1 97.1 72.5 89.6 88.3 88.2 Total 100.0 100.0 100.0 100.0 100.0 100.0 100.0 Obs. 240 240 240 240 240 240 1,440
Thousands of Thai Baht of 2005
Province Obs Mean Std. Dev. Min Max Chachoeng 0 Buriram 43 7.9 6.6 0.3 30.0Lop Buri 7 7.0 6.2 0.5 17.6SiSaket 66 5.3 4.7 0.5 20.5Phrae 25 6.7 7.1 1.5 36.0Satun 27 9.2 24.1 0.2 120.0Total 168 6.9 11.0 0.2 120.0

Minister of Finance Initial Household Survey 2005
105
Has anyone in your household had the following farm expenses during the past 12 months? (in7f)
If yes, how much did they spend over the past 12 months? (in9f)
Cont.
E. Meals for laborers
in7 Chachoeng Buriram Lop Buri SiSaket Phrae Satun Total Yes - 14.2 - 21.7 7.5 1.7 7.5 No 100.0 85.8 100.0 78.3 92.5 98.3 92.5 Total 100.0 100.0 100.0 100.0 100.0 100.0 100.0 Obs. 240 240 240 240 240 240 1,440
Thousands of Thai Baht of 2005
Province Obs Mean Std. Dev. Min Max Chachoeng 0 Buriram 19 2.5 4.4 0.2 20.0Lop Buri 0 SiSaket 46 1.5 1.6 0.2 9.0Phrae 18 1.6 1.5 0.3 5.0Satun 4 1.7 2.3 0.3 5.0Total 87 1.7 2.5 0.2 20.0
F. Rental cost of all tractors, machinery and equipment
in7 Chachoeng Buriram Lop Buri SiSaket Phrae Satun Total Yes 0.4 18.3 4.2 29.6 7.5 13.8 12.3 No 99.6 81.7 95.8 70.4 92.5 86.3 87.7 Total 100.0 100.0 100.0 100.0 100.0 100.0 100.0 Obs. 240 240 240 240 240 240 1,440
Thousands of Thai Baht of 2005
Province Obs Mean Std. Dev. Min Max Chachoeng 0 Buriram 31 9.8 11.6 1.5 60.0Lop Buri 10 7.3 8.0 0.5 26.0SiSaket 67 1.9 1.5 0.2 9.0Phrae 18 2.7 1.9 1.0 9.0Satun 32 1.8 1.1 0.5 5.0Total 158 3.9 6.4 0.2 60.0

Minister of Finance Initial Household Survey 2005
106
Has anyone in your household had the following farm expenses during the past 12 months? (in7f)
If yes, how much did they spend over the past 12 months? (in9f)
Cont.
G. All land rental
in7 Chachoeng Buriram Lop Buri SiSaket Phrae Satun Total Yes 0.4 2.1 2.9 1.7 3.3 0.8 1.9 No 99.6 97.9 97.1 98.3 96.7 99.2 98.1 Total 100.0 100.0 100.0 100.0 100.0 100.0 100.0 Obs. 240 240 240 240 240 240 1,440
Thousands of Thai Baht of 2005
Province Obs Mean Std. Dev. Min Max Chachoeng 1 36.0 . 36.0 36.0Buriram 5 12.3 10.7 4.0 24.0Lop Buri 7 5.1 3.7 1.0 12.0SiSaket 4 2.9 2.4 1.1 6.3Phrae 8 4.4 2.5 1.0 8.8Satun 2 1.8 1.8 0.5 3.0Total 27 6.8 8.3 0.5 36.0
H. Fuel for tractors and any other machinery and equipment
in7 Chachoeng Buriram Lop Buri SiSaket Phrae Satun Total Yes 0.8 7.1 1.3 14.6 5.4 10.8 6.7 No 99.2 92.9 98.8 85.4 94.6 89.2 93.3 Total 100.0 100.0 100.0 100.0 100.0 100.0 100.0 Obs. 240 240 240 240 240 240 1,440
Thousands of Thai Baht of 2005
Province Obs Mean Std. Dev. Min Max Chachoeng 1 2.0 . 2.0 2.0Buriram 17 4.2 8.3 0.2 36.0Lop Buri 3 73.8 123.1 0.5 216.0SiSaket 34 1.6 1.5 0.3 8.0Phrae 13 1.1 0.9 0.1 3.0Satun 26 4.1 11.7 0.1 60.0Total 94 5.0 23.1 0.1 216.0

Minister of Finance Initial Household Survey 2005
107
Has anyone in your household had the following farm expenses during the past 12 months? (in7f)
If yes, how much did they spend over the past 12 months? (in9f)
Cont.
I. Maintenance of tractors and other machinery and equipment
in7 Chachoeng Buriram Lop Buri SiSaket Phrae Satun Total Yes - 5.8 - 5.4 2.1 5.0 3.1 No 100.0 94.2 100.0 94.6 97.9 95.0 96.9 Total 100.0 100.0 100.0 100.0 100.0 100.0 100.0 Obs. 240 240 240 240 240 240 1,440
Thousands of Thai Baht of 2005
Province Obs Mean Std. Dev. Min Max Chachoeng 0 Buriram 14 3.8 7.7 0.4 30.0Lop Buri 0 SiSaket 13 1.3 1.3 0.2 5.0Phrae 5 15.3 30.7 0.3 70.0Satun 12 3.5 5.6 0.3 20.0Total 44 4.3 11.4 0.2 70.0
J. Purchase of baby or breeding livestock
in7 Chachoeng Buriram Lop Buri SiSaket Phrae Satun Total Yes 0.8 2.9 - 4.2 0.4 1.7 1.7 No 99.2 97.1 100.0 95.8 99.6 98.3 98.3 Total 100.0 100.0 100.0 100.0 100.0 100.0 100.0 Obs. 240 240 240 240 240 240 1,440
Thousands of Thai Baht of 2005
Province Obs Mean Std. Dev. Min Max Chachoeng 2 1,530.0 2,078.9 60.0 3,000.0Buriram 7 3.8 3.6 0.9 11.2Lop Buri 0 SiSaket 10 7.6 4.2 0.2 15.0Phrae 1 10.0 . 10.0 10.0Satun 4 6.0 3.9 1.0 10.0Total 24 133.2 610.7 0.2 3,000.0

Minister of Finance Initial Household Survey 2005
108
Has anyone in your household had the following farm expenses during the past 12 months? (in7f)
If yes, how much did they spend over the past 12 months? (in9f)
Cont.
K. Food for livestock
in7 Chachoeng Buriram Lop Buri SiSaket Phrae Satun Total Yes 0.8 5.0 2.5 2.1 0.8 - 1.9 No 99.2 95.0 97.5 97.9 99.2 100.0 98.1 Total 100.0 100.0 100.0 100.0 100.0 100.0 100.0 Obs. 240 240 240 240 240 240 1,440
Thousands of Thai Baht of 2005
Province Obs Mean Std. Dev. Min Max Chachoeng 1 0.9 . 0.9 0.9Buriram 12 2.1 2.1 0.1 8.0Lop Buri 6 67.8 143.6 0.3 360.0SiSaket 5 13.5 20.1 0.1 48.0Phrae 2 28.6 9.8 21.6 35.5Satun 0 Total 26 21.4 70.2 0.1 360.0
Total Farm Expenses (in10f)
Thousands of Thai Baht of 2005
Province Obs Mean Std. Dev. Min Max Chachoeng 240 13.0 193.7 0.0 3,000.0Buriram 240 5.6 13.1 0.0 71.4Lop Buri 240 4.0 38.6 0.0 588.0SiSaket 240 5.2 8.5 0.0 48.0Phrae 240 2.5 10.0 0.0 107.0Satun 240 4.3 11.5 0.0 125.5Total 1,440 5.8 81.0 0.0 3,000.0

Minister of Finance Initial Household Survey 2005
109
Has anyone in your household had the following shrimp expenses during the past 12 months? (in7s)
If yes, how much did they spend over the past 12 months? (in9s)
A. Wages –all paid labor
in7 Chachoeng Buriram Lop Buri SiSaket Phrae Satun Total Yes 0.8 - - - - - 0.1 No 99.2 100.0 100.0 100.0 100.0 100.0 99.9 Total 100.0 100.0 100.0 100.0 100.0 100.0 100.0 Obs. 240 240 240 240 240 240 1,440
Thousands of Thai Baht of 2005
Province Obs Mean Std. Dev. Min Max Chachoeng 2 68.0 28.3 48.0 88.0Buriram 0 Lop Buri 0 SiSaket 0 Phrae 0 Satun 0 Total 2 68.0 28.3 48.0 88.0
B. Meals for laborers
in7 Chachoeng Buriram Lop Buri SiSaket Phrae Satun Total Yes 0.8 - - - - - 0.1 No 99.2 100.0 100.0 100.0 100.0 100.0 99.9 Total 100.0 100.0 100.0 100.0 100.0 100.0 100.0 Obs. 240 240 240 240 240 240 1,440
Thousands of Thai Baht of 2005
Province Obs Mean Std. Dev. Min Max Chachoeng 2 27.4 12.9 18.3 36.5Buriram 0 Lop Buri 0 SiSaket 0 Phrae 0 Satun 0 Total 2 27.4 12.9 18.3 36.5

Minister of Finance Initial Household Survey 2005
110
Has anyone in your household had the following shrimp expenses during the past 12 months? (in7s)
If yes, how much did they spend over the past 12 months? (in9s)
Cont.
C. Rental cost of all tractors, machinery and equipment
in7 Chachoeng Buriram Lop Buri SiSaket Phrae Satun Total Yes - - - - - - -No 100.0 100.0 100.0 100.0 100.0 100.0 100.0 Total 100.0 100.0 100.0 100.0 100.0 100.0 100.0 Obs. 240 240 240 240 240 240 1,440
D. All land rental
in7 Chachoeng Buriram Lop Buri SiSaket Phrae Satun Total Yes 0.8 - - - - - 0.1 No 99.2 100.0 100.0 100.0 100.0 100.0 99.9 Total 100.0 100.0 100.0 100.0 100.0 100.0 100.0 Obs. 240 240 240 240 240 240 1,440
Thousands of Thai Baht of 2005
Province Obs Mean Std. Dev. Min Max Chachoeng 2 8.9 12.4 0.1 17.7Buriram 0 Lop Buri 0 SiSaket 0 Phrae 0 Satun 0 Total 2 8.9 12.4 0.1 17.7
E. Fuel for tractors and any other machinery and equipment
in7 Chachoeng Buriram Lop Buri SiSaket Phrae Satun Total Yes 0.8 - - - - 1.7 0.4 No 99.2 100.0 100.0 100.0 100.0 98.3 99.6 Total 100.0 100.0 100.0 100.0 100.0 100.0 100.0 Obs. 240 240 240 240 240 240 1,440
Thousands of Thai Baht of 2005
Province Obs Mean Std. Dev. Min Max Chachoeng 2 55.0 35.4 30.0 80.0Buriram 0 Lop Buri 0 SiSaket 0 Phrae 0 Satun 4 7.7 11.0 0.3 24.0Total 6 23.5 30.3 0.3 80.0

Minister of Finance Initial Household Survey 2005
111
Has anyone in your household had the following shrimp expenses during the past 12 months? (in7s)
If yes, how much did they spend over the past 12 months? (in9s)
Cont.
F. Maintenance of tractors and other machinery and equipment
in7 Chachoeng Buriram Lop Buri SiSaket Phrae Satun Total Yes 0.8 - - 0.4 - - 0.2 No 99.2 100.0 100.0 99.6 100.0 100.0 99.8 Total 100.0 100.0 100.0 100.0 100.0 100.0 100.0 Obs. 240 240 240 240 240 239 1,439
Thousands of Thai Baht of 2005
Province Obs Mean Std. Dev. Min Max Chachoeng 2 2.0 0.0 2.0 2.0Buriram 0 Lop Buri 0 SiSaket 1 15.0 . 15.0 15.0Phrae 0 Satun 0 Total 3 6.3 7.5 2.0 15.0
G. Cost of baby shrimp/fish
in7 Chachoeng Buriram Lop Buri SiSaket Phrae Satun Total Yes 1.3 0.4 0.4 0.4 - 1.3 0.6 No 98.8 99.6 99.6 99.6 100.0 98.8 99.4 Total 100.0 100.0 100.0 100.0 100.0 100.0 100.0 Obs. 240 240 240 240 240 240 1,440
Thousands of Thai Baht of 2005
Province Obs Mean Std. Dev. Min Max Chachoeng 3 151.7 45.0 111.0 200.0Buriram 1 4.0 . 4.0 4.0Lop Buri 1 3.0 . 3.0 3.0SiSaket 1 24.0 . 24.0 24.0Phrae 0 Satun 3 51.0 44.2 3.0 90.0Total 9 71.0 70.7 3.0 200.0

Minister of Finance Initial Household Survey 2005
112
Has anyone in your household had the following shrimp expenses during the past 12 months? (in7s)
If yes, how much did they spend over the past 12 months? (in9s)
Cont.
H. Shrimp and fish breeding expenses
in7 Chachoeng Buriram Lop Buri SiSaket Phrae Satun Total Yes - - - - - 0.4 0.1 No 100.0 100.0 100.0 100.0 100.0 99.6 99.9 Total 100.0 100.0 100.0 100.0 100.0 100.0 100.0 Obs. 240 240 240 240 240 240 1,440
Thousands of Thai Baht of 2005
Province Obs Mean Std. Dev. Min Max Chachoeng 0 Buriram 0 Lop Buri 0 SiSaket 0 Phrae 0 Satun 1 10.0 . 10.0 10.0Total 1 10.0 . 10.0 10.0
I. Shrimp and fish food
in7 Chachoeng Buriram Lop Buri SiSaket Phrae Satun Total Yes 1.3 0.4 0.4 0.4 - 2.1 0.8 No 98.8 99.6 99.6 99.6 100.0 97.9 99.2 Total 100.0 100.0 100.0 100.0 100.0 100.0 100.0 Obs. 240 240 240 240 240 240 1,440
Thousands of Thai Baht of 2005
Province Obs Mean Std. Dev. Min Max Chachoeng 3 510.0 684.3 100.0 1,300.0Buriram 1 1.0 . 1.0 1.0Lop Buri 1 5.0 . 5.0 5.0SiSaket 1 196.8 . 196.8 196.8Phrae 0 Satun 5 12.7 15.6 1.5 40.0Total 11 163.3 382.6 1.0 1,300.0

Minister of Finance Initial Household Survey 2005
113
Has anyone in your household had the following shrimp expenses during the past 12 months? (in7s)
If yes, how much did they spend over the past 12 months? (in9s)
Cont.
J. Chemicals for shrimp/fish ponds
in7 Chachoeng Buriram Lop Buri SiSaket Phrae Satun Total Yes - - - - - 1.3 0.2 No 100.0 100.0 100.0 100.0 100.0 98.8 99.8 Total 100.0 100.0 100.0 100.0 100.0 100.0 100.0 Obs. 240 240 240 240 240 240 1,440
Thousands of Thai Baht of 2005
Province Obs Mean Std. Dev. Min Max Chachoeng 0 Buriram 0 Lop Buri 0 SiSaket 0 Phrae 0 Satun 3 3.1 2.1 0.8 5.0Total 3 3.1 2.1 0.8 5.0
K. Sea water for shrimp/fish ponds
in7 Chachoeng Buriram Lop Buri SiSaket Phrae Satun Total Yes - - - - - - -No 100.0 100.0 100.0 100.0 100.0 100.0 100.0 Total 100.0 100.0 100.0 100.0 100.0 100.0 100.0 Obs. 240 240 240 240 240 240 1,440
Total Shrimp and Fish Expenses (in10s)
Thousands of Thai Baht of 2005
Province Obs Mean Std. Dev. Min Max Chachoeng 240 9.7 111.0 0.0 1,670.9Buriram 240 0.0 0.3 0.0 5.0Lop Buri 240 0.0 0.5 0.0 8.0SiSaket 240 1.0 15.2 0.0 235.8Phrae 240 0.0 0.0 0.0 0.0Satun 240 1.2 10.8 0.0 109.2Total 1,440 2.0 46.0 0.0 1,670.9

Minister of Finance Initial Household Survey 2005
114
Has anyone in your household had the following business expenses during the past 12 months? (in7b)
If yes, how much did they spend over the past 12 months? (in9b)
A. Wages –all paid labor
in7 Chachoeng Buriram Lop Buri SiSaket Phrae Satun Total Yes 10.8 10.4 10.4 10.8 8.8 4.2 9.2 No 89.2 89.6 89.6 89.2 91.3 95.8 90.8 Total 100.0 100.0 100.0 100.0 100.0 100.0 100.0 Obs. 240 240 240 240 240 240 1,440
Thousands of Thai Baht of 2005
Province Obs Mean Std. Dev. Min Max Chachoeng 26 1,412.1 5,777.6 3 29,400Buriram 25 77.7 78.3 4 360Lop Buri 25 71.4 71.8 3 300Sisaket 26 59.5 52.6 4 240Phrae 21 119.8 107.9 25 475Satun 10 110.8 216.1 9 720Total 133 342.9 2,571.0 3 29,400
B. Meals for laborers
in7 Chachoeng Buriram Lop Buri SiSaket Phrae Satun Total Yes 1.7 3.3 1.7 5.8 1.7 2.5 2.8 No 98.3 96.7 98.3 94.2 98.3 97.5 97.2 Total 100.0 100.0 100.0 100.0 100.0 100.0 100.0 Obs. 240 240 240 240 240 240 1,440
Thousands of Thai Baht of 2005
Province Obs Mean Std. Dev. Min Max Chachoeng 3 85.1 131.8 6 237Buriram 8 9.0 6.0 1 17Lop Buri 3 63.3 101.0 5 180Sisaket 13 10.4 12.9 1 50Phrae 4 18.3 19.9 7 48Satun 6 65.8 144.2 5 360Total 37 30.3 73.0 1 360
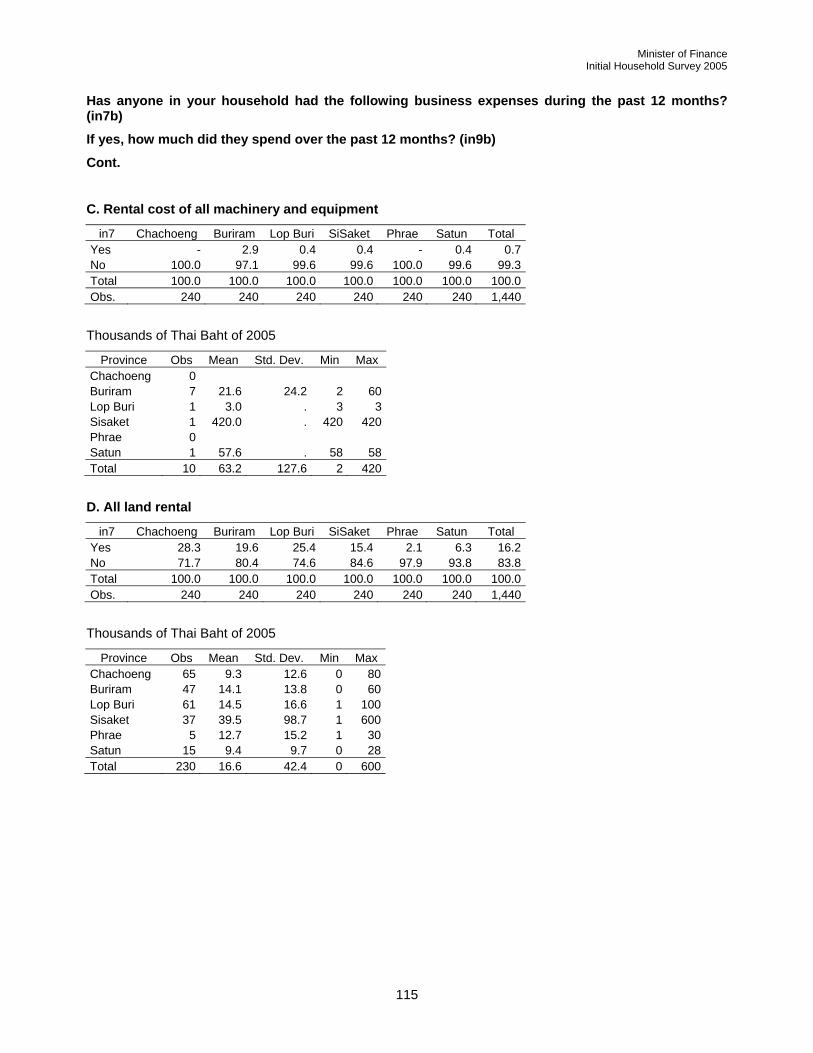
Minister of Finance Initial Household Survey 2005
115
Has anyone in your household had the following business expenses during the past 12 months? (in7b)
If yes, how much did they spend over the past 12 months? (in9b)
Cont.
C. Rental cost of all machinery and equipment
in7 Chachoeng Buriram Lop Buri SiSaket Phrae Satun Total Yes - 2.9 0.4 0.4 - 0.4 0.7 No 100.0 97.1 99.6 99.6 100.0 99.6 99.3 Total 100.0 100.0 100.0 100.0 100.0 100.0 100.0 Obs. 240 240 240 240 240 240 1,440
Thousands of Thai Baht of 2005
Province Obs Mean Std. Dev. Min Max Chachoeng 0 Buriram 7 21.6 24.2 2 60Lop Buri 1 3.0 . 3 3Sisaket 1 420.0 . 420 420Phrae 0 Satun 1 57.6 . 58 58Total 10 63.2 127.6 2 420
D. All land rental
in7 Chachoeng Buriram Lop Buri SiSaket Phrae Satun Total Yes 28.3 19.6 25.4 15.4 2.1 6.3 16.2 No 71.7 80.4 74.6 84.6 97.9 93.8 83.8 Total 100.0 100.0 100.0 100.0 100.0 100.0 100.0 Obs. 240 240 240 240 240 240 1,440
Thousands of Thai Baht of 2005
Province Obs Mean Std. Dev. Min Max Chachoeng 65 9.3 12.6 0 80Buriram 47 14.1 13.8 0 60Lop Buri 61 14.5 16.6 1 100Sisaket 37 39.5 98.7 1 600Phrae 5 12.7 15.2 1 30Satun 15 9.4 9.7 0 28Total 230 16.6 42.4 0 600

Minister of Finance Initial Household Survey 2005
116
Has anyone in your household had the following business expenses during the past 12 months? (in7b)
If yes, how much did they spend over the past 12 months? (in9b)
Cont.
E. Fuel for machinery and equipment
in7 Chachoeng Buriram Lop Buri SiSaket Phrae Satun Total Yes 15.8 28.8 21.7 24.2 19.6 13.3 20.6 No 84.2 71.3 78.3 75.8 80.4 86.7 79.4 Total 100.0 100.0 100.0 100.0 100.0 100.0 100.0 Obs. 240 240 240 240 240 240 1,440
Thousands of Thai Baht of 2005
Province Obs Mean Std. Dev. Min Max Chachoeng 36 30.8 23.7 0 102Buriram 68 18.8 35.6 1 240Lop Buri 52 38.7 41.9 1 216Sisaket 58 13.0 23.5 0 130Phrae 47 20.2 37.2 0 234Satun 32 12.4 16.7 0 72Total 293 22.2 33.3 0 240
F. Maintenance of machinery and equipment
in7 Chachoeng Buriram Lop Buri SiSaket Phrae Satun Total Yes 11.7 13.8 7.9 13.3 15.8 3.3 11.0 No 88.3 86.3 92.1 86.7 84.2 96.7 89.0 Total 100.0 100.0 100.0 100.0 100.0 100.0 100.0 Obs. 240 240 240 240 240 240 1,440
Thousands of Thai Baht of 2005
Province Obs Mean Std. Dev. Min Max Chachoeng 27 9.4 14.4 1 68Buriram 33 4.1 6.4 0 34Lop Buri 19 11.2 15.5 1 50Sisaket 32 8.9 19.5 0 100Phrae 38 7.0 9.2 0 36Satun 8 4.9 4.9 1 12Total 157 7.6 13.1 0 100

Minister of Finance Initial Household Survey 2005
117
Has anyone in your household had the following business expenses during the past 12 months? (in7b)
If yes, how much did they spend over the past 12 months? (in9b)
Cont.
G. Cost of inventory
in7 Chachoeng Buriram Lop Buri SiSaket Phrae Satun Total Yes 58.8 54.2 64.6 37.1 22.1 18.8 42.6 No 41.3 45.8 35.4 62.9 77.9 81.3 57.4 Total 100.0 100.0 100.0 100.0 100.0 100.0 100.0 Obs. 240 240 240 240 240 240 1,440
Thousands of Thai Baht of 2005
Province Obs Mean Std. Dev. Min Max Chachoeng 139 335.1 1,062.3 1 10,950Buriram 130 351.1 506.6 1 3,240Lop Buri 155 245.2 396.6 2 3,260Sisaket 89 212.2 530.1 2 3,904Phrae 53 152.8 195.3 4 720Satun 45 46.3 85.7 0 540Total 611 260.7 633.6 0 10,950
H. Transportation expenses
in7 Chachoeng Buriram Lop Buri SiSaket Phrae Satun Total Yes 10.4 4.2 3.8 10.4 3.3 9.6 6.9 No 89.6 95.8 96.3 89.6 96.7 90.4 93.1 Total 100.0 100.0 100.0 100.0 100.0 100.0 100.0 Obs. 240 240 240 240 240 240 1,440
Thousands of Thai Baht of 2005
Province Obs Mean Std. Dev. Min Max Chachoeng 23 15.1 28.6 0 108Buriram 10 9.1 15.0 1 50Lop Buri 9 90.1 192.5 4 600Sisaket 25 12.8 18.4 1 90Phrae 8 12.9 9.7 2 30Satun 23 12.6 15.5 1 62Total 98 20.0 62.5 0 600

Minister of Finance Initial Household Survey 2005
118
Total Business Expenses (in10b)
Thousands of Thai Baht of 2005
Province Obs Mean Std. Dev. Min Max Chachoeng 240 366.0 2,090.2 0.0 29,400.0Buriram 240 210.6 439.2 0.0 3,447.0Lop Buri 240 196.4 376.1 0.0 3,295.3SiSaket 240 132.5 370.7 0.0 4,118.0Phrae 240 106.8 313.9 0.0 4,000.0Satun 240 33.3 182.7 0.0 2,460.0Total 1,440 174.2 914.7 0.0 29,400.0
Net Income (in11, in12 and in13) Thousands of Thai Baht of 2005
Province Obs Mean Std. Dev. Min Max Chachoeng 239 311.0 613.1 28 6,808Buriram 239 257.6 314.6 7 3,753Lop Buri 239 236.1 294.7 9 2,815SiSaket 239 190.6 269.4 14 3,200Phrae 240 183.0 160.7 9 1,290Satun 239 167.3 130.3 0 829Total 1,435 224.2 338.9 0 6,808
Thousands Chachoeng Buriram Lop Buri SiSaket Phrae Satun Total Equal to 0 - - - - - 0.4 0.1
5.01 to 10 - 0.4 0.4 - 0.8 0.8 0.4 10.01 to 25 - 0.8 2.1 2.1 2.1 1.7 1.5 25.01 to 50 8.4 5.9 2.5 15.9 5.4 6.3 7.4 50.01 to 100 19.7 18.4 18.8 27.6 22.5 27.6 22.4
100.01 to 150 15.9 18.4 19.3 14.2 23.3 18.8 18.3 150.01 to 300 31.0 31.0 36.4 23.0 30.8 33.5 30.9 300.01 to 750 20.1 20.9 18.4 14.6 13.3 10.5 16.3 750.01 to 1500 2.1 3.8 0.4 2.1 1.7 0.4 1.7 Above 1500 2.9 0.4 1.7 0.4 - - 0.9
Total 100.0 100.0 100.0 100.0 100.0 100.0 100.0 Obs. 239 239 239 239 240 239 1,435

Minister of Finance Initial Household Survey 2005
119
What is your best guess about what the household net profit will be next year? (in14)
Thousands of Thai Baht of 2005
Province Obs Mean Std. Dev. Min Max Chachoeng 240 305.5 605.4 28 6,808Buriram 240 247.9 314.1 13 4,000Lop Buri 233 223.8 267.3 10 2,820SiSaket 240 176.2 187.4 15 1,200Phrae 175 184.9 156.4 2 963Satun 194 182.7 241.0 3 3,000Total 1,322 223.2 342.0 2 6,808
Thousands Chachoeng Buriram Lop Buri SiSaket Phrae Satun Total Equal to 0 - - 2.9 - 27.1 19.2 8.2
1.01 to 2.5 - - - - 0.4 - 0.1 2.51 to 5 - - - - - 0.4 0.1 5.01 to 10 - - 0.4 - 0.8 0.8 0.4
10.01 to 25 - 0.4 1.7 2.5 0.8 0.8 1.0 25.01 to 50 8.8 6.3 5.0 17.9 3.8 5.0 7.8 50.01 to 100 18.8 19.6 20.4 26.3 19.6 22.9 21.3
100.01 to 150 13.8 17.5 16.3 15.4 15.4 17.1 15.9 150.01 to 300 33.8 34.6 35.4 23.8 20.4 25.8 29.0 300.01 to 750 20.8 18.8 16.7 11.3 10.4 7.1 14.2 750.01 to 1500 2.1 2.5 - 2.9 1.3 0.4 1.5 Above 150 2.1 0.4 1.3 - - 0.4 0.7
Total 100.0 100.0 100.0 100.0 100.0 100.0 100.0 Obs. 240 240 240 240 240 240 1,440
If next year is a very good year for your household, What the household net profit will be next year? (in15)
Thousands of Thai Baht of 2005
Province Obs Mean Std. Dev. Min Max Chachoeng 240 342 681 15 7,000Buriram 240 290 383 35 5,000Lop Buri 232 263 328 15 3,600SiSaket 240 212 244 20 2,000Phrae 163 196 168 12 1,200Satun 183 202 281 9 3,500Total 1,298 256 400 9 7,000
Thousands Chachoeng Buriram Lop Buri SiSaket Phrae Satun Total Equal to 0 - - 3.3 - 32.1 23.8 9.9
5.01 to 10 - - - - - 0.8 0.1 10.01 to 25 0.4 - 0.8 2.1 1.7 0.8 1.0 25.01 to 50 5.8 3.3 3.3 10.4 3.3 3.3 4.9 50.01 to 100 17.9 19.2 17.1 30.4 17.5 20.4 20.4
100.01 to 150 12.1 14.2 17.9 12.1 15.0 15.4 14.4 150.01 to 300 35.4 37.5 34.6 28.3 19.2 25.8 30.1 300.01 to 750 23.3 21.3 20.4 12.9 10.0 8.3 16.0 750.01 to 1500 2.9 3.8 1.3 2.9 1.3 0.8 2.2 Above 150 2.1 0.8 1.3 0.8 - 0.4 0.9
Total 100.0 100.0 100.0 100.0 100.0 100.0 100.0 Obs. 240 240 240 240 240 240 1,440

Minister of Finance Initial Household Survey 2005
120
If next year is a very bad year for your household, What the household net profit will be next year? (in16)
Thousands of Thai Baht of 2005
Province Obs Mean Std. Dev. Min Max Chachoeng 240 250 543 14 6,770Buriram 240 172 166 10 1,000Lop Buri 232 193 222 5 2,000SiSaket 240 137 162 2 990Phrae 162 165 146 7 900Satun 180 147 206 2 2,500Total 1,294 180 289 2 6,770
Thousands Chachoeng Buriram Lop Buri SiSaket Phrae Satun Total Equal to 0 - - 3.3 - 32.5 25.0 10.1
1.01 to 2.5 - - - 0.4 - 0.4 0.1 2.51 to 5 - - 0.4 0.4 - - 0.1 5.01 to 10 - 1.3 0.8 1.3 1.3 0.8 0.9
10.01 to 25 2.5 3.3 1.3 7.1 0.8 2.5 2.9 25.01 to 50 13.3 16.7 8.8 27.1 6.3 11.3 13.9 50.01 to 100 23.3 30.8 27.9 25.8 22.5 26.7 26.2
100.01 to 150 14.2 10.0 14.2 12.5 10.8 12.1 12.3 150.01 to 300 28.3 24.6 31.7 16.3 17.9 16.3 22.5 300.01 to 750 15.0 11.7 10.4 6.7 6.7 4.6 9.2 750.01 to 1500 2.1 1.7 0.4 2.5 1.3 - 1.3 Above 150 1.3 - 0.8 - - 0.4 0.4
Total 100.0 100.0 100.0 100.0 100.0 100.0 100.0 Obs. 240 240 240 240 240 240 1,440

Minister of Finance Initial Household Survey 2005
121
Section XVII. Borrowing
Do you or members of your household owe money or goods to anyone? For example, to a commercial bank, the BAAC, a PCG, a Rice bank, the Agricultural Cooperative, a government agency, a money lender, a friend, a relative or any other individual or institution? (bl1a)
bl1a Chachoeng Buriram Lop Buri Sisaket Phrae Satun Total Yes 55.0 85.4 92.5 92.9 83.8 69.2 79.8 No 45.0 14.6 7.5 7.1 16.3 30.8 20.2 Total 100.0 100.0 100.0 100.0 100.0 100.0 100.0 Obs. 240 240 240 240 240 240 1,440
How many loans are owed? (bl1b)
bl1b Chachoeng Buriram Lop Buri Sisaket Phrae Satun Total 1 34.2 40.8 49.6 35.4 38.3 45.4 40.6 2 10.8 23.3 30.8 38.3 30.4 13.8 24.6 3 6.7 11.7 7.5 12.1 10.4 5.0 8.9 4 2.5 5.4 2.9 4.2 4.2 4.2 3.9 5 0.8 2.5 0.4 2.5 0.4 0.4 1.2 6 - 0.8 1.3 - - 0.4 0.4 7 - 0.4 - 0.4 - - 0.1 8 - 0.4 - - - - 0.1 . 45.0 14.6 7.5 7.1 16.3 30.8 20.2
Total 100.0 100.0 100.0 100.0 100.0 100.0 100.0 Obs. 240 240 240 240 240 240 1,440
In the past 12 months has any member of your household completely repaid a loan of money or goods? (bl2a)
bl2a Chachoeng Buriram Lop Buri Sisaket Phrae Satun Total Yes 20.8 38.8 76.7 64.6 36.7 9.2 41.1 No 79.2 61.3 23.3 35.4 63.3 90.8 58.9 Total 100.0 100.0 100.0 100.0 100.0 100.0 100.0 Obs. 240 240 240 240 240 240 1,440
How many loans have been completely repaid during the past 12 months? (bl2b)
bl2b Chachoeng Buriram Lop Buri Sisaket Phrae Satun Total 1 17.9 32.1 68.3 46.7 30.8 7.9 34.0 2 2.5 4.6 7.1 16.7 4.2 0.8 6.0 3 - 0.4 0.8 0.8 1.7 - 0.6 4 0.4 0.8 - - - - 0.2 5 - 0.4 0.4 0.4 - 0.4 0.3
12 - 0.4 - - - - 0.1 . 79.2 61.3 23.3 35.4 63.3 90.8 58.9
Total 100.0 100.0 100.0 100.0 100.0 100.0 100.0 Obs. 240 240 240 240 240 240 1,440

Minister of Finance Initial Household Survey 2005
122
Who did you borrow from? (bl3b)
bl3b Chachoeng Buriram Lop Buri Sisaket Phrae Satun Total Neighbor 1.1 1.3 0.3 0.5 0.2 1.7 0.8 Relative 4.4 1.1 1.0 2.2 - 3.5 1.7 BAAC 1.1 6.0 3.1 9.9 14.4 12.1 7.9 PCG 0.4 4.9 2.1 4.9 1.3 5.5 3.3 Commercial bank 8.4 2.6 4.0 3.6 2.8 1.7 3.6 Agricultural cooperative 0.7 4.3 0.2 4.1 1.9 10.0 3.2 Village fund 44.4 46.4 73.5 56.9 51.9 47.6 55.3 Money lender 12.0 8.3 2.9 1.3 - 1.7 3.9 Store owner 9.8 10.9 3.3 5.7 10.6 8.3 7.7 Landlord - - 0.2 - 0.2 - 0.1 Purchaser output - - - 0.6 - - 0.1 Other 17.8 14.1 9.5 10.4 16.6 7.9 12.4 Total 100.0 100.0 100.0 100.0 100.0 100.0 100.0 Obs. 275 532 581 636 464 290 2,778
In what year did you borrow the money? (bl3c)
bl3c Chachoeng Buriram Lop Buri Sisaket Phrae Satun Total 1985-1990 1.1 0.2 0.2 - 0.4 0.7 0.4 1991-1995 1.1 1.0 1.0 0.3 2.4 2.1 1.2 1996-2000 5.1 1.5 1.5 1.4 5.4 8.6 3.3
2001 2.6 1.9 0.3 1.1 2.4 12.1 2.6 2002 9.1 3.6 1.9 2.7 3.9 6.5 3.9 2003 17.1 9.4 10.3 6.1 13.8 24.1 11.9 2004 27.3 36.5 44.9 41.7 42.0 30.0 38.8 2005 34.2 46.0 39.4 46.6 26.5 14.8 37.1
Don't know 1.1 - 0.3 0.2 3.2 1.0 0.9 Refuse to answer 1.5 - - - - - 0.1 Total 100.0 100.0 100.0 100.0 100.0 100.0 100.0 Obs. 275 532 581 636 464 290 2,778
Has this loan been fully repaid? (bl3d)
bl3d Chachoeng Buriram Lop Buri Sisaket Phrae Satun Total Yes 21.5 24.3 36.3 31.8 23.5 10.3 26.6 No 78.6 75.8 63.7 68.2 76.5 89.7 73.4 Total 100.0 100.0 100.0 100.0 100.0 100.0 100.0 Obs. 275 532 581 636 464 290 2,778

Minister of Finance Initial Household Survey 2005
123
How much money or goods (value) was borrowed? (bl3e)
Thousands of Thai Baht of 2005
Province Obs Mean Std. Dev. Min Max Chachoeng 267 207.2 750.5 1.0 10,000.0Buriram 532 81.7 181.9 1.3 1,500.0Lop Buri 577 72.6 266.4 3.0 3,900.0Sisaket 636 59.3 150.2 1.0 1,400.0Phrae 464 69.0 117.0 1.2 650.0Satun 289 57.7 119.9 2.0 1,000.0Total 2,765 82.1 293.4 1.0 10,000.0
Thousands Chachoeng Buriram Lop Buri Sisaket Phrae Satun Total 0.01 to 100 74.9 86.7 91.2 91.0 84.3 91.0 87.5
100.01 to 250 5.5 3.0 1.9 2.2 7.1 3.1 3.5 250.01 to 500 8.7 6.0 3.8 4.9 7.8 4.1 5.7 500.01 to 1000 5.1 4.0 1.0 1.4 0.9 1.4 2.1
1000.01 to 2500 1.8 0.4 1.2 0.5 - - 0.6 Above 2500 1.1 - 0.2 - - - 0.1
Missing value 2.9 - 0.7 - - 0.3 0.5 Total 100.0 100.0 100.0 100.0 100.0 100.0 100.0 Obs. 275 532 581 636 464 290 2,778
If the loan has been fully repaid, how much money or goods (value) did you have to pay back? If loan has not been fully repaid, how much money or goods (value) will you have to pay back in total? (bl3f)
Thousands of Thai Baht of 2005
Province Obs Mean Std. Dev. Min Max Chachoeng 234 207.2 782.8 1.1 10,000.0Buriram 499 78.3 195.7 1.3 1,692.0Lop Buri 554 74.7 319.6 3.0 5,000.0Sisaket 635 72.5 203.6 1.4 2,280.0Phrae 451 85.1 161.3 1.2 1,134.0Satun 242 48.1 99.0 2.0 1,040.0Total 2,615 86.0 317.0 1.1 10,000.0
Thousands Chachoeng Buriram Lop Buri Sisaket Phrae Satun Total 0.01 to 100 66.9 83.5 87.8 89.2 80.2 77.6 82.9
100.01 to 250 4.4 2.1 3.1 3.3 6.0 2.8 3.5 250.01 to 500 6.2 3.8 1.7 3.6 6.9 2.1 3.9 500.01 to 1000 4.4 4.0 1.6 2.8 3.7 0.7 2.8
1000.01 to 2500 2.2 0.6 0.9 0.9 0.4 0.3 0.8 Above 2500 1.1 - 0.3 - - - 0.2
Missing value 14.9 6.2 4.7 0.2 2.8 16.6 5.9 Total 100.0 100.0 100.0 100.0 100.0 100.0 100.0 Obs. 275 532 581 636 464 290 2,778

Minister of Finance Initial Household Survey 2005
124
How long is the loan for? (bl3g)
Months Chachoeng Buriram Lop Buri Sisaket Phrae Satun Total Equal to 0 - 0.4 - - - - 0.1
0.01 to 1 2.6 5.6 0.3 0.8 - 1.0 1.7 1.01 to 3 1.5 1.9 0.3 1.3 - 0.7 0.9 3.01 to 6 1.1 1.5 1.4 2.4 0.4 3.1 1.6 6.01 to 12 45.1 60.2 80.9 74.8 59.7 52.4 65.5
12.01 to 24 6.2 5.8 3.3 3.9 8.4 13.5 6.1 24.01 to 36 3.3 7.1 3.3 3.1 7.5 9.3 5.3 36.01 to 60 7.3 5.1 3.8 7.6 6.5 7.9 6.1 60.01 to 120 2.9 3.4 1.7 4.3 8.6 4.1 4.1 Above 120 5.5 3.8 2.9 1.4 4.1 2.4 3.1
. 24.7 5.3 2.1 0.5 4.7 5.5 5.4 Total 100.0 100.0 100.0 100.0 100.0 100.0 100.0 Obs. 275 532 581 636 464 290 2,778

Minister of Finance Initial Household Survey 2005
125
Why was this money borrowed? (bl3h)
Codes A Walking tractor B Fertilizer, pesticide, herbicide, seed C Livestock D Other farm equipment E Business investment F Buy land G Build or buy a house H To relend to other I For ceremony J Consumption K To buy motorcycle L To buy pickup truck or car M To buy television, VCR, air conditioner, stove or other hh asset N Educational expenses O Other
bl3h Chachoeng Buriram Lop Buri Sisaket Phrae Satun Total A - 0.4 - 0.3 - 0.7 0.2 B 0.4 4.7 2.8 0.2 1.1 3.5 2.1
B,J - 2.8 0.2 14.2 - 0.3 3.9 C - 0.8 - - 2.2 2.1 0.7 D - 0.8 - 0.2 0.9 1.0 0.4 E 28.4 24.4 29.1 7.7 23.7 14.8 20.8
E,J 2.2 2.4 6.4 14.5 3.2 0.3 5.9 E,J,N - - 0.9 1.3 - - 0.5
F - 0.2 0.7 0.2 1.3 1.7 0.6 G 8.0 3.8 2.4 1.1 7.3 13.1 4.9 H 1.1 1.1 1.2 0.2 0.7 2.1 0.9 I 0.7 0.9 0.7 0.2 0.2 - 0.5 J 25.8 30.8 42.9 29.9 33.6 25.5 32.5
J,B - 0.4 - 3.9 - - 1.0 J,E 0.4 - 0.7 4.4 0.7 - 1.3 J,N 2.9 1.7 2.2 4.9 1.1 0.7 2.5 J,O 0.7 1.1 - 0.6 0.2 0.3 0.5 K 4.4 3.2 1.6 2.5 4.3 7.2 3.4 L 6.2 3.8 2.8 2.4 7.1 2.4 3.9 M 2.2 1.5 0.5 0.8 3.5 3.8 1.8 N 5.5 3.6 1.7 0.2 3.9 7.6 3.1
N,J - 1.1 0.5 1.6 0.2 - 0.7 O 5.5 6.8 0.9 3.0 1.7 7.9 3.8
Total 100.0 100.0 100.0 100.0 100.0 100.0 100.0 Obs. 275 532 581 636 464 290 2,778

Minister of Finance Initial Household Survey 2005
126
What did the household offer as collateral for this loan? (bl3i)
bl3i Chachoeng Buriram Lop Buri Sisaket Phrae Satun Total No collateral required 20.0 10.0 2.2 4.3 2.4 13.1 7.1 Land title borrower uses land 7.6 7.7 2.6 5.7 8.8 14.1 7.0 Land title lender uses land - 0.6 0.5 0.2 - 0.7 0.3 Used savings to guarantee loan 1.1 - 0.5 0.3 0.4 2.1 0.6 Other collateral 2.6 3.8 4.8 1.4 7.3 4.1 4.0 Single guarantor 12.7 6.0 3.3 4.4 22.6 15.9 9.5 Multiple guarantors 53.1 69.9 85.4 83.3 57.1 49.7 70.3 Other 2.9 2.1 0.7 0.5 1.3 0.3 1.2 Total 100.0 100.0 100.0 100.0 100.0 100.0 100.0 Obs. 275 532 581 636 464 290 2,778
If the household use collateral, what was the value of the collateral at the time you got this loan? (bl3j)
Thousands of Thai Baht of 2005
Province Obs Mean Std. Dev. Min Max Chachoeng 34 1,204.8 1,525.8 5.5 8,000.0Buriram 66 573.4 791.6 5.4 5,000.0Lop Buri 51 818.6 1,067.8 8.0 4,000.0Sisaket 49 677.7 859.0 10.0 3,800.0Phrae 81 301.1 330.9 5.0 2,000.0Satun 53 380.7 543.5 7.0 3,000.0Total 334 593.8 882.1 5.0 8,000.0
Thousands Chachoeng Buriram Lop Buri Sisaket Phrae Satun Total 0.01 to 100 1.1 1.9 2.1 1.6 4.5 8.6 2.9
100.01 to 250 0.7 2.4 0.7 1.6 6.9 2.8 2.5 250.01 to 500 2.9 4.5 2.4 1.9 3.7 2.4 3.0 500.01 to 1000 3.3 2.6 1.6 1.3 1.7 3.1 2.1
1000.01 to 2500 3.6 0.4 1.4 0.8 0.7 1.0 1.1 Above 2500 0.7 0.6 0.7 0.6 - 0.3 0.5
. 87.6 87.6 91.2 92.3 82.5 81.7 88.0 Total 100.0 100.0 100.0 100.0 100.0 100.0 100.0 Obs. 275 532 581 636 464 290 2,778
If you could not repay this lender or if this lender had to take your collateral or if you cosigners hat to repay the loan for you, what would be the consequences for you (the borrower)? (bl3k)
bl3k Chachoeng Buriram Lop Buri Sisaket Phrae Satun Total None 4.0 3.4 1.0 0.8 0.2 16.2 3.2 Not able to borrow again from this lender 59.3 94.7 88.8 94.8 24.4 49.0 73.5 Not able to borrow again from this and other lender 2.2 1.5 1.2 0.3 8.8 9.3 3.3 Other 34.2 0.2 9.0 4.1 66.6 24.5 19.9 . 0.4 0.2 - - - 1.0 0.2 Total 100.0 100.0 100.0 100.0 100.0 100.0 100.0 Obs. 275 532 581 636 464 290 2,778

Minister of Finance Initial Household Survey 2005
127
Section XVIII. Lending
Does anyone currently owe money or goods to you or member of your household? For example, loans to friends, neighbors, relatives or business partners that have not yet been repaid? (le1a)
le1a Chachoeng Buriram Lop Buri Sisaket Phrae Satun Total Yes 2.5 5.8 3.8 3.8 3.8 2.1 3.6 No 97.5 94.2 96.3 96.3 96.3 97.9 96.4 Total 100.0 100.0 100.0 100.0 100.0 100.0 100.0 Obs. 240 240 240 240 240 240 1,440
How many loans are owed to members of this household? (le1b)
le1b Chachoeng Buriram Lop Buri Sisaket Phrae Satun Total 1 1.7 3.3 2.9 2.9 3.3 1.3 2.6 2 - 0.8 0.4 0.4 - 0.4 0.4 3 0.8 1.3 - 0.4 - - 0.4 4 - 0.4 0.4 - 0.4 - 0.2 . 97.5 94.2 96.3 96.3 96.3 98.3 96.5
Total 100.0 100.0 100.0 100.0 100.0 100.0 100.0 Obs. 240 240 240 240 240 240 1,440
In the past 12 months has any one fully repaid a loan to you or members of your household? (le2a)
le2a Chachoeng Buriram Lop Buri Sisaket Phrae Satun Total Yes 0.4 1.3 1.7 0.4 0.4 0.8 0.8 No 99.6 98.8 98.3 99.6 99.6 99.2 99.2 Total 100.0 100.0 100.0 100.0 100.0 100.0 100.0 Obs. 240 240 240 240 240 240 1,440
How many loans have been completely repaid during the past 12 months? (le2b)
le2b Chachoeng Buriram Lop Buri Sisaket Phrae Satun Total 1 0.4 0.4 1.7 - 0.4 0.4 0.6 3 - 0.8 - 0.4 - - 0.2 . 99.6 98.8 98.3 99.6 99.6 99.6 99.2
Total 100.0 100.0 100.0 100.0 100.0 100.0 100.0 Obs. 240 240 240 240 240 240 1,440
Who did you loan money to? (le3b)
le3b Chachoeng Buriram Lop Buri Sisaket Phrae Satun Total Non relative in the village 36.4 18.8 35.3 60.0 46.2 16.7 34.0 Non relative out of the village 27.3 31.3 11.8 13.3 15.4 - 20.2 Relative in village - 40.6 29.4 20.0 7.7 50.0 26.6 Relative out of the village 36.4 9.4 23.5 6.7 30.8 16.7 18.1 Other - - - - - 16.7 1.1 Total 100.0 100.0 100.0 100.0 100.0 100.0 100.0 Obs. 11 32 17 15 13 6 94

Minister of Finance Initial Household Survey 2005
128
In what year did you loan the money? (le3c)
le3c Chachoeng Buriram Lop Buri Sisaket Phrae Satun Total 1985-1990 - - - - - - - 1991-1995 - - - 6.7 - - 1.1 1996-2000 9.1 3.1 5.9 13.3 - - 5.3
2001 18.2 - - - - - 2.1 2002 - 6.2 5.9 6.7 - 33.3 6.4 2003 - 3.1 - - 7.7 - 2.1 2004 36.4 43.7 35.3 26.7 30.8 - 34.0 2005 36.4 43.8 52.9 46.7 53.8 50.0 46.8
Don't know - - - - 7.7 16.7 2.1 Refuse to answer - 1.0 2.0 3.0 4.0 5.0 6.0 Total 100.0 100.0 100.0 100.0 100.0 100.0 100.0 Obs. 11 32 17 15 13 6 94
Has this loan been fully repaid? (le3d)
le3d Chachoeng Buriram Lop Buri Sisaket Phrae Satun Total Yes 9.1 21.9 23.5 20.0 7.7 16.7 18.1 No 90.9 78.1 76.5 80.0 92.3 83.3 81.9 Total 100.0 100.0 100.0 100.0 100.0 100.0 100.0 Obs. 11 32 17 15 13 6 94
How much money or goods (value) was loaned? (le3e)
Thousands of Thai Baht of 2005
Province Obs Mean Std. Dev. Min Max Chachoeng 11 185.1 256.4 2.0 600.0Buriram 32 18.6 18.9 2.0 90.0Lop Buri 17 29.5 28.9 5.0 100.0Sisaket 15 11.1 9.1 2.0 30.0Phrae 13 34.1 66.9 2.0 250.0Satun 6 77.7 95.3 17.0 270.0Total 94 44.8 106.2 2.0 600.0
Thousands Chachoeng Buriram Lop Buri Sisaket Phrae Satun Total 0.01 to 100 63.6 100.0 100.0 100.0 92.3 83.3 93.6
100.01 to 250 9.1 - - - 7.7 - 2.1 250.01 to 500 9.1 - - - - 16.7 2.1 500.01 to 1000 18.2 - - - - - 2.1
Total 100.0 100.0 100.0 100.0 100.0 100.0 100.0 Obs. 11 32 17 15 13 6 94

Minister of Finance Initial Household Survey 2005
129
If the loan has been fully repaid, how much money or goods (value) were repaid?
If the loan has not been fully repaid, how much money or goods (value) will you have to be repaid in total? (le3f)
Thousands of Thai Baht of 2005
Province Obs Mean Std. Dev. Min Max Chachoeng 8 261.0 287.3 6.0 636.0Buriram 29 21.8 28.0 2.0 133.2Lop Buri 13 35.9 32.8 14.0 107.0Sisaket 15 16.7 23.7 2.6 96.6Phrae 13 36.8 68.9 2.2 255.6Satun 5 40.1 15.6 17.8 60.0Total 83 49.6 114.8 2.0 636.0
Thousands Chachoeng Buriram Lop Buri Sisaket Phrae Satun Total 0.01 to 100 36.4 87.5 64.7 100.0 92.3 83.3 79.8
100.01 to 250 9.1 3.1 11.8 - - - 4.3 250.01 to 500 9.1 - - - 7.7 - 2.1 500.01 to 1000 18.2 - - - - - 2.1
. 27.3 9.4 23.5 - - 16.7 11.7 Total 100.0 100.0 100.0 100.0 100.0 100.0 100.0 Obs. 11 32 17 15 13 6 94
How long is the loan for? (le3g)
Months Chachoeng Buriram Lop Buri Sisaket Phrae Satun Total 1.01 to 3 - - - 13.3 - 16.7 3.2 3.01 to 6 - 21.9 - 46.7 7.7 - 16.0 6.01 to 12 18.2 53.1 52.9 26.7 30.8 33.3 40.4
12.01 to 24 - 6.3 5.9 - - - 3.2 24.01 to 36 - 9.4 - - - 33.3 5.3 36.01 to 60 - 3.1 11.8 - - 16.7 4.3 Above 100 - - - 6.7 15.4 - 3.2
. 81.8 6.3 29.4 6.7 46.2 - 24.5 Total 100.0 100.0 100.0 100.0 100.0 100.0 100.0 Obs. 11 32 17 15 13 6 94

Minister of Finance Initial Household Survey 2005
130
Why was this money borrowed? (le3h)
Codes A Walking tractor B Fertilizer, pesticide, herbicide, seed C Livestock D Other farm equipment E Business investment F Buy land G Build or buy a house H To relend to other I For ceremony J Consumption K To buy motorcycle L To buy pickup truck or car M To buy television, VCR, air conditioner, stove or other household asset N Educational expenses O Other
le3h Chachoeng Buriram Lop Buri Sisaket Phrae Satun Total A - - - 6.7 - - 1.1 B - 3.1 17.7 - - - 4.3
B,J - 3.1 - - - - 1.1 DK - - - - 7.7 - 1.1 E 9.1 18.8 11.8 13.3 61.5 33.3 22.3 G 27.3 - - - - - 3.2
G,J 9.1 - - - - - 1.1 H - - 5.9 - - - 1.1 J 9.1 53.1 58.8 73.3 7.7 16.7 43.6
J,N - 3.1 - - 7.7 - 2.1 K - 3.1 5.9 - - 33.3 4.3 L - - - - 7.7 - 1.1 N 9.1 6.3 - - 7.7 - 4.3 O 36.4 9.4 - 6.7 - 16.7 9.6
Total 100.0 100.0 100.0 100.0 100.0 100.0 100.0 Obs. 11 32 17 15 13 6 94
What was offered as collateral for this loan? (le3i)
le3i Chachoeng Buriram Lop Buri Sisaket Phrae Satun Total No collateral required 100.0 71.9 100.0 53.3 100.0 100.0 83.0 Land title borrower uses land - 6.3 - - - - 2.1 Land title lender uses land - 3.1 - 6.7 - - 2.1 Other collateral - - - 40.0 - - 6.4 Single guarantor - 3.1 - - - - 1.1 Multiple guarantors - 15.6 - - - - 5.3 Total 100.0 100.0 100.0 100.0 100.0 100.0 100.0 Obs. 11 32 17 15 13 6 94

Minister of Finance Initial Household Survey 2005
131
If this borrower does not repay the loan, what would be the consequences for the borrower? (le3k)
le3k Chachoeng Buriram Lop Buri Sisaket Phrae Satun Total None 18.2 15.6 17.7 20.0 76.9 66.7 28.7 Not able to borrow again from lender 81.8 84.4 82.4 33.3 7.7 33.3 61.7 Other - - - 46.7 15.4 - 9.6 Total 100.0 100.0 100.0 100.0 100.0 100.0 100.0 Obs. 11 32 17 15 13 6 94
Have you (or anyone in your household) turned anyone who asked for a loan down in the past 12 months? (le5)
Codes1. Yes, someone asked for a loan and they were turned down. 2. No, someone asked for a loan and they were Not turned down.
3. No, No one asked for a loan from me or anyone else in my household in the past 12 months.
le5 Chachoeng Buriram Lop Buri Sisaket Phrae Satun Total 1 6.3 8.3 1.3 2.5 9.2 2.1 4.9 3 1.7 46.3 4.2 2.1 6.7 1.7 10.4 5 92.1 45.4 94.6 95.4 84.2 96.3 84.7
Total 100.0 100.0 100.0 100.0 100.0 100.0 100.0 Obs. 240 240 240 240 240 240 1,440

Minister of Finance Initial Household Survey 2005
132
Section XIX. Savings
Do you or members of your household have any of the following kind of savings? (sa1)
1. Commercial Bank
sa1 Chachoeng Buriram Lop Buri Sisaket Phrae Satun Total Yes 74.6 65.8 60.0 48.3 41.7 39.2 54.9 No 25.4 34.2 40.0 51.7 58.3 60.8 45.1 Total 100.0 100.0 100.0 100.0 100.0 100.0 100.0 Obs. 240 240 240 240 240 240 1,440
2. Agricultural Cooperative
sa1 Chachoeng Buriram Lop Buri Sisaket Phrae Satun Total Yes 0.8 7.5 2.1 11.3 7.1 16.3 7.5 No 99.2 92.5 97.9 88.8 92.9 83.8 92.5 Total 100.0 100.0 100.0 100.0 100.0 100.0 100.0 Obs. 240 240 240 240 240 240 1,440
3. Bank account at BAAC
sa1 Chachoeng Buriram Lop Buri Sisaket Phrae Satun Total Yes 2.1 17.5 9.2 22.1 36.7 27.5 19.2 No 97.9 82.5 90.8 77.9 63.3 72.5 80.8 Total 100.0 100.0 100.0 100.0 100.0 100.0 100.0 Obs. 240 240 240 240 240 240 1,440
4. PCG account
sa1 Chachoeng Buriram Lop Buri Sisaket Phrae Satun Total Yes 2.5 22.1 43.3 25.0 14.2 15.4 20.4 No 97.5 77.9 56.7 75.0 85.8 84.6 79.6 Total 100.0 100.0 100.0 100.0 100.0 100.0 100.0 Obs. 240 240 240 240 240 240 1,440
5. Rice Bank
sa1 Chachoeng Buriram Lop Buri Sisaket Phrae Satun Total Yes - - - 0.4 - - 0.1 No 100.0 100.0 100.0 99.6 100.0 100.0 99.9 Total 100.0 100.0 100.0 100.0 100.0 100.0 100.0 Obs. 240 240 240 240 240 240 1,440
6. Gold, Jewelry
sa1 Chachoeng Buriram Lop Buri Sisaket Phrae Satun Total Yes 72.1 67.9 71.3 54.2 78.8 37.1 63.5 No 27.9 32.1 28.8 45.8 21.3 62.9 36.5 Total 100.0 100.0 100.0 100.0 100.0 100.0 100.0 Obs. 240 240 240 240 240 240 1,440

Minister of Finance Initial Household Survey 2005
133
Do you or members of your household have any of the following kind of savings? (sa1)
Cont.
7. Cash
sa1 Chachoeng Buriram Lop Buri Sisaket Phrae Satun Total Yes 100.0 100.0 100.0 100.0 100.0 100.0 100.0 Total 100.0 100.0 100.0 100.0 100.0 100.0 100.0 Obs. 240 240 240 240 240 240 1,440
8. Other savings
sa1 Chachoeng Buriram Lop Buri Sisaket Phrae Satun Total Yes 65.4 100.0 100.0 100.0 87.9 98.3 91.9 No 34.6 - - - 12.1 1.7 8.1 Total 100.0 100.0 100.0 100.0 100.0 100.0 100.0 Obs. 240 240 240 240 240 240 1,440
9. Rice in storage
sa1 Chachoeng Buriram Lop Buri Sisaket Phrae Satun Total Yes - 20.8 0.4 43.3 12.5 16.3 15.6 No 100.0 79.2 99.6 56.7 87.5 83.8 84.4 Total 100.0 100.0 100.0 100.0 100.0 100.0 100.0 Obs. 240 240 240 240 240 240 1,440
What is the most important source of this savings? (sa2)
1. Commercial Bank
sa2 Chachoeng Buriram Lop Buri Sisaket Phrae Satun Total Saving up small amounts for a long time 24.6 33.8 42.9 35.8 22.5 10.8 28.4 From selling land 0.4 - 0.4 0.4 - 0.8 0.4 Profits from business 20.4 7.9 6.3 3.3 7.5 5.0 8.4 From selling agricultural product 0.4 0.4 - 0.4 - 4.6 1.0 From salary or wages 28.8 22.5 10.4 8.3 9.6 17.5 16.2 Lottery winnings - - - - 0.4 - 0.1 Other - 0.8 - - 1.7 0.4 0.5 . 25.4 34.6 40.0 51.7 58.3 60.8 45.1 Total 100.0 100.0 100.0 100.0 100.0 100.0 100.0 Obs. 240 240 240 240 240 240 1,440

Minister of Finance Initial Household Survey 2005
134
What is the most important source of this savings? (sa2)
Cont.
2. Agricultural Cooperative
sa2 Chachoeng Buriram Lop Buri Sisaket Phrae Satun Total Saving up small amounts for a long time 0.8 5.8 1.7 11.3 6.3 5.4 5.2 From selling land - - 0.4 - - - 0.1 Profits from business - 0.4 - - 0.4 1.3 0.4 From selling agricultural product - 0.4 - - - 6.7 1.2 From salary or wages - - - - 0.4 2.5 0.5 Other - 0.8 - - - 0.4 0.2 . 99.2 92.5 97.9 88.8 92.9 83.8 92.5 Total 100.0 100.0 100.0 100.0 100.0 100.0 100.0 Obs. 240 240 240 240 240 240 1,440
3. Bank account at BAAC
sa2 Chachoeng Buriram Lop Buri Sisaket Phrae Satun Total Saving up small amounts for a long time 1.3 13.3 8.3 20.4 25.0 8.8 12.9 From selling other assets - - - 0.4 - - 0.1 Profits from business 0.4 1.3 - 0.8 6.7 5.4 2.4 From selling agricultural product - 1.3 - 0.4 0.4 7.1 1.5 From salary or wages - 1.7 0.4 - 3.8 6.3 2.0 Other 0.4 - 0.4 - 0.8 - 0.3 . 97.9 82.5 90.8 77.9 63.3 72.5 80.8 Total 100.0 100.0 100.0 100.0 100.0 100.0 100.0 Obs. 240 240 240 240 240 240 1,440
4. PCG account
sa2 Chachoeng Buriram Lop Buri Sisaket Phrae Satun Total Saving up small amounts for a long time 0.8 20.0 37.9 22.1 11.3 3.3 15.9 Profits from business 0.8 2.1 4.2 1.3 2.1 2.1 2.1 From selling agricultural product - - - 0.4 - 3.8 0.7 From salary or wages 0.8 - 1.3 1.3 0.8 6.3 1.7 . 97.5 77.9 56.7 75.0 85.8 84.6 79.6 Total 100.0 100.0 100.0 100.0 100.0 100.0 100.0 Obs. 240 240 240 240 240 240 1,440
5. Rice Bank
sa2 Chachoeng Buriram Lop Buri Sisaket Phrae Satun Total Saving up small amounts for a long time - - - 0.4 - - 0.1 . 100.0 100.0 100.0 99.6 100.0 100.0 99.9 Total 100.0 100.0 100.0 100.0 100.0 100.0 100.0 Obs. 240 240 240 240 240 240 1,440

Minister of Finance Initial Household Survey 2005
135
What is the most important source of this savings? (sa2)
Cont.
6. Gold, Jewelry
sa2 Chachoeng Buriram Lop Buri Sisaket Phrae Satun Total Saving up small amounts for a long time 56.3 62.9 66.7 51.3 60.8 24.2 53.7 From inheritance - - 0.4 - - - 0.1 Profits from business 10.4 1.3 4.2 1.7 10.4 3.8 5.3 From selling agricultural product - 0.8 - 0.8 - 3.8 0.9 From salary or wages 5.4 2.9 - 0.4 7.1 5.4 3.5 Lottery winnings - - - - 0.4 - 0.1 . 27.9 32.1 28.8 45.8 21.3 62.9 36.5 Total 100.0 100.0 100.0 100.0 100.0 100.0 100.0 Obs. 240 240 240 240 240 240 1,440
7. Cash
sa2 Chachoeng Buriram Lop Buri Sisaket Phrae Satun Total Saving up small amounts for a long time 47.5 89.2 91.7 90.0 71.7 45.0 72.5 From selling land - - - - - 0.4 0.1 Profits from business 32.5 6.7 6.7 5.0 15.8 11.3 13.0 From selling agricultural product 0.4 0.8 - 1.7 - 18.8 3.6 From salary or wages 18.3 3.3 1.7 3.3 12.1 24.2 10.5 Lottery winnings - - - - 0.4 - 0.1 Other 1.3 - - - - - 0.2 . - - - - - 0.4 0.1 Total 100.0 100.0 100.0 100.0 100.0 100.0 100.0 Obs. 240 240 240 240 240 240 1,440
8. Other savings
sa2 Chachoeng Buriram Lop Buri Sisaket Phrae Satun Total Saving up small amounts for a long time 47.9 90.4 92.1 95.0 66.3 30.8 70.4 From selling land - - - - 0.4 - 0.1 Profits from business 12.5 7.5 6.3 2.1 10.8 15.4 9.1 From selling agricultural product - 0.4 - 0.8 - 20.0 3.5 From salary or wages 5.0 1.7 1.7 2.1 10.4 31.7 8.8 . 34.6 - - - 12.1 2.1 8.1 Total 100.0 100.0 100.0 100.0 100.0 100.0 100.0 Obs. 240 240 240 240 240 240 1,440

Minister of Finance Initial Household Survey 2005
136
How many times did you make deposits with this institution in the past 12 months? (sa3)
1. Commercial Bank
sa3p Chachoeng Buriram Lop Buri Sisaket Phrae Satun Total 0 24.6 39.2 36.7 30.0 6.7 3.3 23.4 1 0.4 5.0 2.1 6.7 2.9 0.8 3.0 2 1.3 2.1 2.1 2.9 0.4 1.7 1.7 3 1.3 2.1 1.3 0.8 2.5 1.7 1.6 4 2.9 2.9 - 0.4 0.4 0.8 1.3 5 1.7 1.3 2.1 1.3 1.3 2.1 1.6 6 0.4 0.8 - 0.4 - 0.8 0.4 7 - 2.5 1.3 - 0.4 - 0.7 8 0.4 - 0.4 0.4 - 0.4 0.3 9 - 0.8 - - - 0.4 0.2
10 1.3 - 1.3 1.3 0.4 1.7 1.0 11 - 0.4 - - - 0.4 0.1 12 13.8 6.7 7.5 2.9 12.5 7.1 8.4
More than 12 7.1 1.3 0.8 - 0.8 1.7 1.9 . 45.0 35.0 44.6 52.9 71.7 77.1 54.4
Total 100.0 100.0 100.0 100.0 100.0 100.0 100.0 Obs. 240 240 240 240 240 240 1,440
2. Agricultural Cooperative
sa3p Chachoeng Buriram Lop Buri Sisaket Phrae Satun Total 0 0.8 5.8 - 9.2 3.3 2.1 3.5 1 - 0.8 0.8 1.7 2.5 0.4 1.0 2 - 0.8 - - - 0.8 0.3 4 - - - - 0.4 0.4 0.1 5 - - - - - 0.4 0.1 6 - - - - 0.4 0.4 0.1 7 - - - - - 0.8 0.1 8 - - - - - 0.8 0.1
10 - - - - - 0.4 0.1 12 - - - 0.4 - 2.5 0.5
More than 12 - - - - - 0.4 0.1 . 99.2 92.5 99.2 88.8 93.3 90.4 93.9
Total 100.0 100.0 100.0 100.0 100.0 100.0 100.0 Obs. 240 240 240 240 240 240 1,440

Minister of Finance Initial Household Survey 2005
137
How many times did you make deposits with this institution in the past 12 months? (sa3)
Cont.
3. Bank account at BAAC
sa3p Chachoeng Buriram Lop Buri Sisaket Phrae Satun Total 0 0.8 13.3 7.1 17.5 17.9 7.1 10.6 1 0.8 2.1 0.8 3.8 5.0 1.7 2.4 2 - - - 0.8 1.3 1.3 0.6 3 - 0.4 - - 0.8 1.7 0.5 4 - 0.4 0.4 - 0.4 0.4 0.3 5 - 0.4 - - 0.4 1.3 0.4 6 - - - - - 2.9 0.5 7 - 0.4 - - - 0.4 0.1 8 - - - - 0.4 - 0.1
10 - - - - - 0.4 0.1 12 - 0.4 0.8 - 0.8 2.9 0.8
More than 12 - - - - 0.4 - 0.1 . 98.3 82.5 90.8 77.9 72.5 80.0 83.7
Total 100.0 100.0 100.0 100.0 100.0 100.0 100.0 Obs. 240 240 240 240 240 240 1,440
4. PCG Account
sa3p Chachoeng Buriram Lop Buri Sisaket Phrae Satun Total 0 0.4 0.8 1.7 8.8 2.5 - 2.4 1 - 1.7 12.9 3.8 0.8 - 3.2 2 0.4 - 0.4 - - 0.4 0.2 3 - - 0.8 - - - 0.1 4 - - 0.8 - - 0.4 0.2 5 - - - - - 0.4 0.1 6 - - 0.4 - - 0.8 0.2 7 - - 2.5 - - 1.7 0.7 8 0.4 1.3 0.8 - - - 0.4
12 0.4 13.8 17.5 12.1 7.9 7.1 9.8 More than 12 - 2.1 2.1 0.4 0.4 0.4 0.9
. 98.3 80.4 60.0 75.0 88.3 88.8 81.8 Total 100.0 100.0 100.0 100.0 100.0 100.0 100.0 Obs. 240 240 240 240 240 240 1,440
5. Rice Bank
sa3p Chachoeng Buriram Lop Buri Sisaket Phrae Satun Total 0 - - - 0.4 - - 0.1 . 100.0 100.0 100.0 99.6 100.0 100.0 99.9
Total 100.0 100.0 100.0 100.0 100.0 100.0 100.0 Obs. 240 240 240 240 240 240 1,440

Minister of Finance Initial Household Survey 2005
138
How many times did you make deposits with this institution in the past 12 months? (sa3)
Cont.
8. Other savings
sa3p Chachoeng Buriram Lop Buri Sisaket Phrae Satun Total 0 38.8 17.1 40.8 82.5 35.4 31.3 41.0 1 2.9 22.1 40.0 13.3 9.2 2.1 14.9 2 2.1 0.4 1.7 1.7 2.1 2.1 1.7 3 0.8 - 2.5 0.4 - 1.3 0.8 4 1.3 0.4 1.3 - - 2.5 0.9 5 0.4 0.4 - 0.8 - 2.5 0.7 6 0.8 - - 0.4 0.8 5.0 1.2 7 0.4 - 0.8 - 0.8 2.1 0.7 8 0.4 2.1 2.1 - 0.4 1.7 1.1 9 - 1.3 0.4 - - 0.4 0.4
10 0.8 - 0.4 - - 2.5 0.6 11 - - 0.4 - - - 0.1 12 12.9 53.8 9.2 0.4 34.6 5.8 19.4
More than 12 - 2.5 - 0.4 0.4 2.1 0.9 . 38.3 - 0.4 - 16.3 38.8 15.6
Total 100.0 100.0 100.0 100.0 100.0 100.0 100.0 Obs. 240 240 240 240 240 240 1,440
How much have you deposited in the past 12 months? (sa4)
Thousands of Thai Baht of 2005
1. Commercial Bank
Province Obs Mean Std. Dev. Min Max Chachoeng 60 108.8 115.2 1.0 400.0 Buriram 59 45.4 103.9 1.0 600.0 Lop Buri 43 58.0 145.6 0.4 900.0 Sisaket 40 41.2 115.7 1.0 714.0 Phrae 49 71.5 109.5 0.5 516.0 Satun 25 18.6 28.3 0.2 100.0 Total 276 62.7 115.0 0.2 900.0
2. Agricultural Cooperative
Province Obs Mean Std. Dev. Min Max Chachoeng 0 Buriram 4 2.1 1.7 0.4 4.2 Lop Buri 2 100.3 141.1 0.5 200.0 Sisaket 5 1.0 0.7 0.2 2.0 Phrae 7 7.9 7.6 0.2 20.0 Satun 13 64.2 164.1 1.0 600.0 Total 31 35.6 112.3 0.2 600.0

Minister of Finance Initial Household Survey 2005
139
How much have you deposited in the past 12 months? (sa4)
Thousands of Thai Baht of 2005
Cont.
3. Bank account at BAAC
Province Obs Mean Std. Dev. Min Max Chachoeng 2 4.3 5.3 0.5 8.0 Buriram 10 26.3 37.9 1.0 110.0 Lop Buri 5 15.8 21.5 0.4 50.0 Sisaket 11 5.1 10.3 0.1 35.0 Phrae 22 40.3 169.8 0.1 800.0 Satun 22 11.4 21.9 0.5 80.0 Total 72 21.4 95.3 0.1 800.0
4. PCG account
Province Obs Mean Std. Dev. Min Max Chachoeng 3 0.8 0.6 0.1 1.2 Buriram 45 2.0 2.5 0.1 12.0 Lop Buri 90 1.2 3.0 0.0 24.8 Sisaket 37 1.3 1.4 0.0 7.2 Phrae 22 2.8 3.1 0.1 12.0 Satun 25 3.7 7.0 0.2 30.0 Total 222 1.8 3.5 0.0 30.0
5. Rice Bank
Province Obs Mean Std. Dev. Min Max Chachoeng 0 Buriram 0 Lop Buri 0 Sisaket 0 Phrae 0 Satun 0 Total 0
8. Other savings
Province Obs Mean Std. Dev. Min Max Chachoeng 55 3.1 9.1 0.1 60.0 Buriram 199 0.6 0.5 0.0 3.6 Lop Buri 137 0.5 1.1 0.0 12.0 Sisaket 42 7.2 12.7 0.1 50.0 Phrae 117 9.4 83.2 0.0 900.0 Satun 56 2.6 3.6 0.1 15.0 Total 606 3.1 36.9 0.0 900.0

Minister of Finance Initial Household Survey 2005
140
How many times have you withdraw money from your savings with this institution during the past 12 months? (sa5)
1. Commercial Bank
sa5p Chachoeng Buriram Lop Buri Sisaket Phrae Satun Total 0 29.6 47.9 47.5 38.3 10.0 7.9 30.2 1 2.1 3.3 0.8 4.2 1.7 2.9 2.5 2 0.8 2.1 1.3 1.7 3.3 2.1 1.9 3 0.4 1.7 0.4 0.4 1.7 0.8 0.9 4 - 1.3 - - 0.4 0.4 0.4 5 0.4 0.8 2.1 - 0.4 1.7 0.9 6 0.8 0.8 - - - - 0.3 7 - 0.8 0.8 - - - 0.3 8 - 0.4 - - 0.4 - 0.1 9 - 0.8 - - - - 0.1
10 1.7 0.4 0.4 0.4 - - 0.5 11 - - - - - 0.4 0.1 12 8.3 3.3 2.1 2.1 7.9 5.4 4.9
More than 12 4.2 0.8 - - 1.7 - 1.1 . 51.7 35.4 44.6 52.9 72.5 78.3 55.9
Total 100.0 100.0 100.0 100.0 100.0 100.0 100.0 Obs. 240.0 240.0 240.0 240.0 240.0 240.0 1,440.0
2. Agricultural Cooperative
sa5p Chachoeng Buriram Lop Buri Sisaket Phrae Satun Total 0 0.8 7.5 0.8 10.8 5.0 2.9 4.7 1 - - - 0.4 0.4 1.3 0.4 2 - - - - 0.8 0.8 0.3 3 - - - - - 0.4 0.1 4 - - - - - 0.4 0.1
10 - - - - - 0.4 0.1 12 - - - - - 0.8 0.1 . 99.2 92.5 99.2 88.8 93.8 92.9 94.4
Total 100.0 100.0 100.0 100.0 100.0 100.0 100.0 Obs. 240.0 240.0 240.0 240.0 240.0 240.0 1,440.0
3. Bank account at BAAC
sa5p Chachoeng Buriram Lop Buri Sisaket Phrae Satun Total 0 1.3 15.8 8.3 20.4 24.2 11.7 13.6 1 0.4 0.8 0.4 1.3 0.8 2.1 1.0 2 - - - 0.4 0.4 1.7 0.4 3 - - - - - 1.3 0.2 4 - - 0.4 - 0.4 - 0.1 5 - - - - 0.4 0.4 0.1 6 - 0.4 - - - 0.4 0.1 7 - 0.4 - - - - 0.1
10 - - - - - 0.4 0.1 12 - - - - 0.4 0.4 0.1 . 98.3 82.5 90.8 77.9 73.3 81.7 84.1
Total 100.0 100.0 100.0 100.0 100.0 100.0 100.0 Obs. 240 240 240 240 240 240 1,440

Minister of Finance Initial Household Survey 2005
141
How many times have you withdraw money from your savings with this institution during the past 12 months? (sa5)
Cont.
4. PCG account
sa5p Chachoeng Buriram Lop Buri Sisaket Phrae Satun Total 0 1.7 19.2 39.6 24.2 10.4 15.4 18.4 1 - 0.4 - 0.8 1.7 - 0.5 2 - - 0.4 - - - 0.1 . 98.3 80.4 60.0 75.0 87.9 84.6 81.0
Total 100.0 100.0 100.0 100.0 100.0 100.0 100.0 Obs. 240 240 240 240 240 240 1,440
5. Rice Bank
sa5p Chachoeng Buriram Lop Buri Sisaket Phrae Satun Total 0 - - - 0.4 - - 0.1 . 100.0 100.0 100.0 99.6 100.0 100.0 99.9
Total 100.0 100.0 100.0 100.0 100.0 100.0 100.0 Obs. 240 240 240 240 240 240 1,440
8. Other savings
sa5p Chachoeng Buriram Lop Buri Sisaket Phrae Satun Total 0 60.4 98.8 98.8 94.2 83.8 80.0 86.0 1 0.4 1.3 0.8 4.6 - 2.5 1.6 2 0.4 - - 0.4 - 1.7 0.4 3 0.4 - - 0.4 - 2.5 0.6 4 0.4 - - 0.4 - - 0.1 5 - - - - 0.4 0.8 0.2 6 0.4 - - - - - 0.1
12 - - - - 0.4 - 0.1 . 37.5 - 0.4 - 15.4 12.5 11.0
Total 100.0 100.0 100.0 100.0 100.0 100.0 100.0 Obs. 240 240 240 240 240 240 1,440
How much have you withdrawn over the past 12 months? (sa6)
Thousands of Thai Baht of 2005
1. Commercial Bank
Province Obs Mean Std. Dev. Min Max Chachoeng 35 94.2 93.8 3.0 356.0 Buriram 40 32.8 65.3 0.5 400.0 Lop Buri 16 23.6 48.3 0.0 200.0 Sisaket 21 50.9 130.6 0.5 600.0 Phrae 35 71.2 154.8 0.7 800.0 Satun 11 19.6 28.1 0.5 90.0 Total 158 55.5 106.4 0.0 800.0

Minister of Finance Initial Household Survey 2005
142
How much have you withdrawn over the past 12 months? (sa6)
Thousands of Thai Baht of 2005
Cont.
2. Agricultural Cooperative
Province Obs Mean Std. Dev. Min Max Chachoeng 0 Buriram 0 Lop Buri 0 Sisaket 1 1.0 . 1.0 1.0 Phrae 2 12.5 3.5 10.0 15.0 Satun 7 71.1 167.4 0.5 450.0 Total 10 52.4 140.0 0.5 450.0
3. Bank account at BAAC
Province Obs Mean Std. Dev. Min Max Chachoeng 1 6.0 . 6.0 6.0 Buriram 4 43.8 29.4 19.0 86.0 Lop Buri 2 45.0 7.1 40.0 50.0 Sisaket 4 2.0 2.0 1.0 5.0 Phrae 5 49.9 85.0 2.5 200.0 Satun 10 16.6 19.5 0.5 50.0 Total 26 26.7 41.7 0.5 200.0
4. PCG account
Province Obs Mean Std. Dev. Min Max Chachoeng 0 Buriram 1 5.0 . 5.0 5.0 Lop Buri 0 Sisaket 2 1.0 0.0 1.0 1.0 Phrae 3 2.2 2.0 1.0 4.5 Satun 0 Total 6 2.3 1.9 1.0 5.0
5. Rice Bank
Province Obs Mean Std. Dev. Min Max Chachoeng 0 Buriram 0 Lop Buri 0 Sisaket 0 Phrae 0 Satun 0 Total 0

Minister of Finance Initial Household Survey 2005
143
How much have you withdrawn over the past 12 months? (sa6)
Thousands of Thai Baht of 2005
Cont.
8. Other savings
Province Obs Mean Std. Dev. Min Max Chachoeng 5 3.1 2.8 0.5 7.0 Buriram 3 10.7 9.0 2.0 20.0 Lop Buri 1 0.8 . 0.8 0.8 Sisaket 13 5.4 5.2 1.0 20.0 Phrae 2 47.0 52.3 10.0 84.0 Satun 8 2.5 1.9 0.4 5.0 Total 32 7.3 14.9 0.4 84.0
What amount do you have saved as of today? (sa7)
Thousands of Thai Baht of 2005
1. Commercial Bank
Province Obs Mean Std. Dev. Min Max Chachoeng 82 121.4 266.8 0.1 1,500.0 Buriram 146 52.4 137.9 0.1 800.0 Lop Buri 115 41.7 246.4 0.1 2,500.0 Sisaket 113 35.1 72.9 0.1 500.0 Phrae 54 59.4 148.8 0.1 920.0 Satun 11 39.6 59.9 2.4 200.0 Total 521 57.6 184.4 0.1 2,500.0
2. Agricultural Cooperative
Province Obs Mean Std. Dev. Min Max Chachoeng 0 Buriram 17 20.8 63.0 0.1 264.0 Lop Buri 2 107.5 130.8 15.0 200.0 Sisaket 24 6.5 20.2 0.1 100.0 Phrae 8 2.0 3.2 0.1 9.0 Satun 4 50.9 67.0 3.5 150.0 Total 55 17.1 48.9 0.1 264.0
3. Bank account at BAAC
Province Obs Mean Std. Dev. Min Max Chachoeng 2 2.0 0.0 2.0 2.0 Buriram 37 8.6 28.5 0.1 170.0 Lop Buri 20 20.1 66.3 0.4 300.0 Sisaket 51 4.8 17.3 0.1 120.0 Phrae 44 22.1 94.5 0.1 600.0 Satun 16 20.2 30.0 0.1 100.0 Total 170 13.3 56.3 0.1 600.0

Minister of Finance Initial Household Survey 2005
144
What amount do you have saved as of today? (sa7)
Thousands of Thai Baht of 2005
Cont.
4. PCG account
Province Obs Mean Std. Dev. Min Max Chachoeng 4 51.0 86.6 0.7 180.0 Buriram 47 6.9 5.8 0.1 30.0 Lop Buri 97 3.2 6.5 0.1 50.0 Sisaket 47 4.9 5.5 0.1 24.0 Phrae 20 5.8 8.0 0.3 35.0 Satun 9 6.2 8.0 0.6 25.0 Total 224 5.5 13.4 0.1 180.0
5. Rice Bank
Province Obs Mean Std. Dev. Min Max Chachoeng 0 Buriram 0 Lop Buri 0 Sisaket 1 0.1 . 0.1 0.1 Phrae 0 Satun 0 Total 1 0.1 . 0.1 0.1
8. Other savings
Province Obs Mean Std. Dev. Min Max Chachoeng 118 8.6 34.9 0.1 300.0 Buriram 240 2.2 3.0 0.1 30.0 Lop Buri 234 0.8 1.5 0.0 10.5 Sisaket 238 3.5 10.6 0.1 100.0 Phrae 183 17.6 159.4 0.0 2,000.0 Satun 30 1.1 1.5 0.1 6.0 Total 1,043 5.6 68.1 0.0 2,000.0
9. Rice in storage
Province Obs Mean Std. Dev. Min Max Chachoeng 0 Buriram 50 6.6 7.0 0.2 38.4 Lop Buri 1 0.2 . 0.2 0.2 Sisaket 102 4.4 3.9 0.2 22.4 Phrae 25 3.7 2.9 0.7 10.0 Satun 29 5.1 4.8 0.9 20.0 Total 207 4.9 5.0 0.2 38.4

Minister of Finance Initial Household Survey 2005
145
What is the most important reason for saving? (sa8)
Codes: A Provide for old age B To leave as a bequest for children C To buy farm equipment D To buy motorcycle, car or pick-up truck E To buy TV, VCR, air conditioner or other household asset F To pay for children's education G To rebuild house or buy new house H Invest in existing business I Invest in new business J Use in case of emergency K Other
sa8 Chachoeng Buriram Lop Buri Sisaket Phrae Satun Total A 47.9 9.6 21.7 20.4 28.3 16.3 24.0 B 10.4 12.1 11.3 18.8 19.2 8.8 13.4 C - - - 0.4 - 0.4 0.1 F 5.4 2.1 1.3 2.9 7.1 7.9 4.4 G 0.4 0.8 0.4 - 0.4 - 0.4 H 3.3 2.1 19.2 2.5 2.9 1.7 5.3 I - - 1.3 0.8 0.4 - 0.4 J 31.3 72.9 45.0 54.2 40.4 62.5 51.0 K 1.3 0.4 - - 1.3 2.5 0.9
Total 100.0 100.0 100.0 100.0 100.0 100.0 100.0 Obs. 240 240 240 240 240 240 1,440

Minister of Finance Initial Household Survey 2005
146
Section XX. General Questions
Have you ever repaid one loan using a loan from another source? (gq2a)
gq2a Chachoeng Buriram Lop Buri Sisaket Phrae Satun Total Yes 7.1 6.7 3.3 2.1 1.3 5.0 4.2 No 92.9 93.3 96.7 97.9 98.8 95.0 95.8 Total 100.0 100.0 100.0 100.0 100.0 100.0 100.0 Obs. 240 240 240 240 240 240 1,440
Have you ever repaid a loan late or made a late loan payment? (gq3a)
gq3a Chachoeng Buriram Lop Buri Sisaket Phrae Satun Total Yes 13.8 20.0 5.4 9.6 5.4 22.9 12.9 No 86.3 80.0 94.6 90.4 94.6 77.1 87.2 Total 100.0 100.0 100.0 100.0 100.0 100.0 100.0 Obs. 240 240 240 240 240 240 1,440
Have you ever missed a savings deposit or made a savings deposit late to a pledge savings account? (gq4a)
gq4a Chachoeng Buriram Lop Buri Sisaket Phrae Satun Total Yes 1.7 10.4 0.8 1.7 0.4 1.7 2.8 No 98.3 89.6 99.2 98.3 99.6 98.3 97.2 Total 100.0 100.0 100.0 100.0 100.0 100.0 100.0 Obs. 240 240 240 240 240 240 1,440
Have you ever had a loan that was guaranteed by cosigners where the cosigners had to pay all or part of what you owed? (gq5a)
gq5a Chachoeng Buriram Lop Buri Sisaket Phrae Satun Total Yes - - - - - 0.4 0.1 No 100.0 100.0 100.0 100.0 100.0 99.6 99.9 Total 100.0 100.0 100.0 100.0 100.0 100.0 100.0 Obs. 240 240 240 240 240 240 1,440
Have you ever had a loan that was guaranteed by collateral where you had to forfeit your collateral because you could not repay the loan? (gq6a)
gq6a Chachoeng Buriram Lop Buri Sisaket Phrae Satun Total Yes 0.4 - - - - - 0.1 No 99.6 100.0 100.0 100.0 100.0 100.0 99.9 Total 100.0 100.0 100.0 100.0 100.0 100.0 100.0 Obs. 240 240 240 240 240 240 1,440
Have you ever loaned someone money and then had to take their collateral, get someone else to pay what they owe, or just not been able to get repaid? (gq7a)
gq7a Chachoeng Buriram Lop Buri Sisaket Phrae Satun Total Yes 0.4 0.4 - 0.4 0.4 - 0.3 No 99.6 99.6 100.0 99.6 99.6 100.0 99.7 Total 100.0 100.0 100.0 100.0 100.0 100.0 100.0 Obs. 240 240 240 240 240 240 1,440

Minister of Finance Initial Household Survey 2005
147
Have ever loaned money to that person again? (gq7c)
gq7c Chachoeng Buriram Lop Buri Sisaket Phrae Satun Total Yes - - 0.4 - - - 0.1 No 1.7 0.8 - 0.4 0.4 - 0.6 . 98.3 99.2 99.6 99.6 99.6 100.0 99.4 Total 100.0 100.0 100.0 100.0 100.0 100.0 100.0 Obs. 240 240 240 240 240 240 1,440

Minister of Finance Initial Household Survey 2005
148
Section XXI. Hypothetical Situation
Suppose you encounter an unavoidable emergency and you needed 2000 B right away. How would you get the money? (hs1)
hs1 Chachoeng Buriram Lop Buri Sisaket Phrae Satun Total Use savings 69.6 66.7 65.0 62.1 75.0 68.3 67.8 Sell equipment 0.4 0.4 0.4 - - - 0.2 Sell livestock - - - 0.8 - - 0.1 Sell jewelry or gold 0.8 1.7 6.7 2.9 2.5 2.5 2.9 Sell car 0.4 - - - 0.4 - 0.1 Sell motorcycle - - - 0.4 - - 0.1 sell other assets - - - 0.4 1.3 - 0.3 Use welfare card - - 0.4 - 0.4 - 0.1 Borrow from money lender in the village 6.3 1.3 6.3 8.8 2.1 3.8 4.7 Borrow from money lender outside the village 1.7 - 0.4 1.3 0.8 - 0.7 Borrow from one relative in village 6.3 15.4 8.8 7.9 7.5 5.4 8.5 Borrow from one relative out of village 7.9 4.2 5.8 3.3 2.1 1.7 4.2 Borrow from many relatives in the village 0.8 0.8 - 4.6 1.7 2.5 1.7 Borrow from many relatives outside the village - 0.8 0.4 0.4 0.4 3.3 0.9 Borrow from many relatives in and out of the village 1.3 1.7 0.8 0.8 0.8 6.7 2.0 Borrow from one non relative in village 2.5 3.3 2.9 1.3 2.5 4.6 2.9 Borrow from one non relative out of village 0.8 0.4 1.3 - 0.4 0.4 0.6 Borrow from many non relatives in the village 0.4 - - 0.4 - - 0.1 Borrow from many non relatives outside the village - 0.4 - - - - 0.1 Borrow from many non relatives in and out of the village - 0.4 - - - - 0.1 Borrow from many people -relatives and non relatives in the village - 0.4 - 0.8 - - 0.2 Borrow from many people -relatives and non relatives in and out of the village - 0.4 - - - - 0.1 Have someone else borrow on your behalf - - - 0.4 - 0.4 0.1 Borrow from PCG - 0.4 0.4 - - - 0.1 Borrow from agricultural cooperative - - - - - 0.4 0.1 Borrow BAAC group members - - - - 0.4 - 0.1 Sell rice - 0.4 - 2.9 - - 0.6 Other 0.8 0.8 0.4 0.4 1.7 - 0.7 Total 100.0 100.0 100.0 100.0 100.0 100.0 100.0 Obs. 240 240 240 240 240 240 1,440

Minister of Finance Initial Household Survey 2005
149
Suppose you encounter an unavoidable emergency and you needed 20000 B right away. How would you get the money? (hs4)
hs4 Chachoeng Buriram Lop Buri Sisaket Phrae Satun Total Use savings 38.8 28.8 32.1 19.6 39.6 35.8 32.4 Sell land 1.7 0.4 0.4 0.4 0.4 - 0.6 Mortgage land 0.8 2.5 - 0.4 5.0 1.7 1.7 Sell equipment 0.8 0.4 0.8 - 0.8 - 0.5 Sell livestock - 0.4 0.4 6.3 - 1.3 1.4 Sell jewelry 3.8 3.8 12.5 2.9 1.7 1.3 4.3 Sell car 1.3 - 0.8 0.4 0.4 0.8 0.6 Sell motorcycle 2.5 1.7 2.5 2.1 2.5 1.3 2.1 sell other assets 1.3 0.8 0.8 4.2 1.3 1.3 1.6 Borrow from money lender in the village 11.3 6.7 6.7 12.5 7.1 4.6 8.1 Borrow from money lender outside the village 1.7 1.7 2.9 2.1 1.3 0.8 1.7 Borrow from one relative in village 8.3 19.6 14.6 8.3 7.1 3.8 10.3 Borrow from one relative out of village 12.1 8.3 6.7 2.9 3.8 1.3 5.8 Borrow from many relatives in the village 2.5 4.6 2.1 5.4 3.8 5.8 4.0 Borrow from many relatives outside the village 2.1 4.6 2.1 3.3 2.5 3.8 3.1 Borrow from many relatives in and out of the village - 3.8 2.1 7.1 3.8 2.9 3.3 Borrow from one non relative in village 3.3 4.6 2.9 3.3 1.7 4.6 3.4 Borrow from one non relative out of village 0.8 1.7 0.8 1.3 - 2.5 1.2 Borrow from many non relatives in the village 0.8 1.3 0.8 1.3 0.8 3.8 1.5 Borrow from many non relatives outside the village - - - 0.8 - 1.3 0.4 Borrow from many non relatives in and out of the village - 0.4 - 1.3 - 0.4 0.4 Borrow from many people -relatives and non relatives in the village - 0.8 0.4 1.3 - 1.7 0.7 Borrow from many people -relatives and non relatives out of the village - - - - - 0.4 0.1 Borrow from many people -relatives and non relatives in and out of the village - 0.4 - 0.8 - 0.8 0.4 Have someone else borrow on your behalf 0.4 0.4 0.4 2.1 0.4 - 0.6 Borrow from PCG 0.4 - - 0.8 0.8 1.7 0.6 Borrow from agricultural cooperative - 0.4 - 0.4 - 4.2 0.8 Borrow BAAC group members - - - - 0.8 - 0.1 Borrow BAAC group members - - - 0.4 1.3 0.8 0.4 Borrow from bank 0.4 0.8 2.9 2.5 4.6 10.0 3.5 Sell rice - - - 0.4 - - 0.1 Other 5.0 1.3 3.8 5.4 8.8 1.7 4.3 . - - 0.4 - - - 0.1 Total 100.0 100.0 100.0 100.0 100.0 100.0 100.0 Obs. 240 240 240 240 240 240 1,440

Minister of Finance Initial Household Survey 2005
150
Section XXII. Institutions and organizations
Institution: RICE BANK
Is anyone in your household currently a member or a customer of this institution? (io1)
io1 Chachoeng Buriram Lop Buri Sisaket Phrae Satun Total Yes - - - 0.4 - - 0.1 No 100.0 100.0 100.0 99.6 100.0 100.0 99.9
Total 100.0 100.0 100.0 100.0 100.0 100.0 100.0 Obs. 240 240 240 240 240 240 1,440
(If oi1 is NO) has anyone in your household ever been a member of a customer of this institution, but is not currently? (io2)
io2 Chachoeng Buriram Lop Buri Sisaket Phrae Satun Total No 100.0 100.0 100.0 99.6 100.0 100.0 99.9 NA - - - 0.4 - - 0.1
Total 100.0 100.0 100.0 100.0 100.0 100.0 100.0 Obs. 240 240 240 240 240 240 1,440
(If oi1 or oi2 is YES) when did you join or become a customer of this institution? (io3)
io3t Chachoeng Buriram Lop Buri Sisaket Phrae Satun Total 2001 - - - 0.4 - - 0.1 NA 100.0 100.0 100.0 99.6 100.0 100.0 99.9
Total 100.0 100.0 100.0 100.0 100.0 100.0 100.0 Obs. 240 240 240 240 240 240 1,440
(If oi2 is YES) when did you stop being a member of this institution? (io4)
io4t Chachoeng Buriram Lop Buri Sisaket Phrae Satun Total NA 100.0 100.0 100.0 100.0 100.0 100.0 100.0
Total 100.0 100.0 100.0 100.0 100.0 100.0 100.0 Obs. 240 240 240 240 240 240 1,440
(if io2 is YES) why did you stop being a member of this institution? (io5)
io5 Chachoeng Buriram Lop Buri Sisaket Phrae Satun Total NA 100.0 100.0 100.0 100.0 100.0 100.0 100.0
Total 100.0 100.0 100.0 100.0 100.0 100.0 100.0 Obs. 240 240 240 240 240 240 1,440
(If io1 or io2 is YES) How many times have you borrowed from this institution? (io6)
io6 Chachoeng Buriram Lop Buri Sisaket Phrae Satun Total 0 - - - 0.4 - - 0.1
NA 100.0 100.0 100.0 99.6 100.0 100.0 99.9 Total 100.0 100.0 100.0 100.0 100.0 100.0 100.0 Obs. 240 240 240 240 240 240 1,440

Minister of Finance Initial Household Survey 2005
151
(If io1 or io2 is NO) If one of your neighbors asked you to join this institution, would you or members of your household want to become a member/customer? (io7)
io7 Chachoeng Buriram Lop Buri Sisaket Phrae Satun Total Yes - 0.8 - 0.4 - - 0.2 Not sure 7.5 - 0.8 1.3 - 2.9 2.1 Not sure 4.2 1.3 7.5 3.8 1.7 0.8 3.2 In village 88.3 97.9 91.7 94.2 98.3 96.3 94.4 NA - - - 0.4 - - 0.1 Total 100.0 100.0 100.0 100.0 100.0 100.0 100.0 Obs. 240 240 240 240 240 240 1,440
(If io7 is YES) What is your main reason for wanting to join or become a member of this institution? (io8)
io8 Chachoeng Buriram Lop Buri Sisaket Phrae Satun Total Other organizations - - - 100.0 - - 33.3 Opportunity to save - 50.0 - - - - 33.3 Other - 50.0 - - - - 33.3 Total - 100.0 - 100.0 - - 100.0 Obs. - 2 - 1 - - 3
(If io7 is NO) What is your main reason for not becoming a member of this institution? (io8)
io8 Chachoeng Buriram Lop Buri Sisaket Phrae Satun Total Not enough time - - 27.8 55.6 - - 21.7 Don’t have extra money - - 5.6 - - - 2.2 Too old 20.0 33.3 - - - - 6.5 Other organizations 40.0 33.3 11.1 44.4 - 100.0 28.3 Not necessary 40.0 33.3 55.6 - 50.0 - 37.0 Other - - - - 50.0 - 4.4 Total 100.0 100.0 100.0 100.0 100.0 100.0 100.0 Obs. 10 3 18 9 4 2 46
Institution: Buffalo Bank
Is anyone in your household currently a member or a customer of this institution? (io1)
io1 Chachoeng Buriram Lop Buri Sisaket Phrae Satun Total No 100.0 100.0 100.0 100.0 100.0 100.0 100.0 Total 100.0 100.0 100.0 100.0 100.0 100.0 100.0 Obs. 240 240 240 240 240 240 1,440
(If oi1 is NO) has anyone in your household ever been a member of a customer of this institution, but is not currently? (io2)
io2 Chachoeng Buriram Lop Buri Sisaket Phrae Satun Total No 100.0 100.0 100.0 100.0 100.0 100.0 100.0 Total 100.0 100.0 100.0 100.0 100.0 100.0 100.0 Obs. 240 240 240 240 240 240 1,440

Minister of Finance Initial Household Survey 2005
152
(If oi1 or oi2 is YES) when did you join or become a customer of this institution? (io3)
io3t Chachoeng Buriram Lop Buri Sisaket Phrae Satun Total NA 100.0 100.0 100.0 100.0 100.0 100.0 100.0
Total 100.0 100.0 100.0 100.0 100.0 100.0 100.0 Obs. 240 240 240 240 240 240 1,440
(If oi2 is YES) when did you stop being a member of this institution? (io4)
io4t Chachoeng Buriram Lop Buri Sisaket Phrae Satun Total NA 100.0 100.0 100.0 100.0 100.0 100.0 100.0
Total 100.0 100.0 100.0 100.0 100.0 100.0 100.0 Obs. 240 240 240 240 240 240 1,440
(if io2 is YES) why did you stop being a member of this institution? (io5)
Codes A Institution closed B Repaid loan C Could not save any more D Too old E Not enough time to participate F Household welfare improved G household welfare declined H Other
io5 Chachoeng Buriram Lop Buri Sisaket Phrae Satun Total NA 100.0 100.0 100.0 100.0 100.0 100.0 100.0
Total 100.0 100.0 100.0 100.0 100.0 100.0 100.0 Obs. 240 240 240 240 240 240 1,440
(If io1 or io2 is YES) How many times have you borrowed from this institution? (io6)
io6 Chachoeng Buriram Lop Buri Sisaket Phrae Satun Total NA 100.0 100.0 100.0 100.0 100.0 100.0 100.0
Total 100.0 100.0 100.0 100.0 100.0 100.0 100.0 Obs. 240 240 240 240 240 240 1,440
(If io1 or io2 is NO) If one of your neighbors asked you to join this institution, would you or members of your household want to become a member/customer? (io7)
io7 Chachoeng Buriram Lop Buri Sisaket Phrae Satun Total Yes - 0.8 - - - - 0.1 Not sure 6.7 - 0.8 0.4 - 2.9 1.8 No 3.3 1.7 6.3 0.8 1.7 0.8 2.4 Don’t have one in village 90.0 97.5 92.9 98.8 98.3 96.3 95.6 Total 100.0 100.0 100.0 100.0 100.0 100.0 100.0 Obs. 240 240 240 240 240 240 1,440

Minister of Finance Initial Household Survey 2005
153
(If io7 is YES) What is your main reason for wanting to join or become a member of this institution? (io8)
io8 Chachoeng Buriram Lop Buri Sisaket Phrae Satun Total Opportunity to borrow - 100.0 - - - - 100.0 Total - 100.0 - - - - 100.0 Obs. - 2 - - - - 2
(If io7 is NO) What is your main reason for not becoming a member of this institution? (io8)
io8 Chachoeng Buriram Lop Buri Sisaket Phrae Satun Total Not enough time - 50.0 13.3 50.0 - - 14.3 Don’t have extra money - - 6.7 - - - 2.9 Too old 12.5 25.0 - - - - 5.7 Other organizations 50.0 25.0 13.3 - - 100.0 25.7 Members should be poor - - - 50.0 - - 2.9 Not necessary 37.5 - 66.7 - 50.0 - 42.9 Other - - - - 50.0 - 5.7 Total 100.0 100.0 100.0 100.0 100.0 100.0 100.0 Obs. 8 4 15 2 4 2 35
Institution: PCG
Is anyone in your household currently a member or a customer of this institution? (io1)
io1 Chachoeng Buriram Lop Buri Sisaket Phrae Satun Total Yes 2.5 22.1 43.3 25.0 14.2 15.4 20.4 No 97.5 77.9 56.7 75.0 85.8 84.6 79.6
Total 100.0 100.0 100.0 100.0 100.0 100.0 100.0 Obs. 240 240 240 240 240 240 1,440
(If oi1 is NO) has anyone in your household ever been a member of a customer of this institution, but is not currently? (io2)
io2 Chachoeng Buriram Lop Buri Sisaket Phrae Satun Total Yes - 2.1 1.3 2.5 0.4 - 1.0 No 97.5 75.8 55.8 72.5 85.4 84.6 78.6 NA 2.5 22.1 42.9 25.0 14.2 15.4 20.4
Total 100.0 100.0 100.0 100.0 100.0 100.0 100.0 Obs. 240 240 240 240 240 240 1,440

Minister of Finance Initial Household Survey 2005
154
(If oi1 or oi2 is YES) when did you join or become a customer of this institution? (io3)
io3t Chachoeng Buriram Lop Buri Sisaket Phrae Satun Total 1980 0.4 - - - - - 0.1 1985 - - - 0.4 - - 0.1 1992 0.4 - - 0.4 - - 0.1 1993 - - - 0.4 - - 0.1 1995 - - - - - 0.4 0.1 1996 0.4 - - - - - 0.1 1997 - - - 1.7 0.4 0.8 0.5 1998 - - - 2.5 0.8 0.8 0.7 1999 - 0.8 0.4 5.8 0.4 0.8 1.4 2000 - 2.1 - 2.1 0.8 0.4 0.9 2001 - 10.0 15.4 5.0 0.8 3.3 5.8 2002 - 4.2 14.2 1.7 2.9 1.7 4.1 2003 - 1.7 5.0 2.9 0.8 1.7 2.0 2004 - 1.3 2.1 1.7 0.4 1.3 1.1 2005 - 0.4 1.3 0.8 0.4 0.8 0.6 NA 98.8 79.6 61.7 74.6 92.1 87.9 82.4
Total 100.0 100.0 100.0 100.0 100.0 100.0 100.0 Obs. 240 240 240 240 240 240 1,440
(If oi2 is YES) when did you stop being a member of this institution? (io4)
io4t Chachoeng Buriram Lop Buri Sisaket Phrae Satun Total 2000 - 0.4 - - - - 0.1 2001 - - - - 0.4 - 0.1 2003 - 0.8 0.4 0.8 - - 0.4 2004 - 0.8 0.4 1.7 - - 0.5 NA 100.0 97.9 99.2 97.5 99.6 100.0 99.0
Total 100.0 100.0 100.0 100.0 100.0 100.0 100.0 Obs. 240 240 240 240 240 240 1,440
(if io2 is YES) why did you stop being a member of this institution? (io5)
Codes A Institution closed B Repaid loan C Could not save any more D Too old E Not enough time to participate F Household welfare improved G household welfare declined H Other
io5 Chachoeng Buriram Lop Buri Sisaket Phrae Satun Total A - 0.8 - 2.5 0.4 - 0.6 C - - 0.4 - - - 0.1 E - 0.8 - - - - 0.1 F - - 0.4 - - - 0.1 H - 0.4 - - - - 0.1
NA 100.0 97.9 99.2 97.5 99.6 100.0 99.0 Total 100.0 100.0 100.0 100.0 100.0 100.0 100.0 Obs. 240 240 240 240 240 240 1,440

Minister of Finance Initial Household Survey 2005
155
(If io1 or io2 is YES) How many times have you borrowed from this institution? (io6)
io6 Chachoeng Buriram Lop Buri Sisaket Phrae Satun Total 0 1.7 12.1 35.0 19.2 11.7 8.3 14.7 1 - 6.3 3.8 2.1 2.1 5.8 3.3 2 0.4 3.8 0.8 3.3 0.4 0.8 1.6 3 0.4 1.3 3.8 1.3 - - 1.1 4 - 0.8 0.8 0.8 0.4 0.4 0.6 5 - - - 0.4 - - 0.1 6 - - - 0.4 - - 0.1
NA 97.5 75.8 55.8 72.5 85.4 84.6 78.6 Total 100.0 100.0 100.0 100.0 100.0 100.0 100.0 Obs. 240 240 240 240 240 240 1,440
(If io1 or io2 is NO) If one of your neighbors asked you to join this institution, would you or members of your household want to become a member/customer? (io7)
io7 Chachoeng Buriram Lop Buri Sisaket Phrae Satun Total Yes - 2.1 0.4 4.6 2.9 0.8 1.8 Not sure 11.7 1.7 5.8 7.5 4.2 7.1 6.3 No 4.2 13.3 9.2 12.1 14.2 6.7 9.9 Don’t have one in village 81.7 58.8 40.4 48.3 64.2 70.0 60.6 NA 2.5 24.2 44.2 27.5 14.6 15.4 21.4 Total 100.0 100.0 100.0 100.0 100.0 100.0 100.0 Obs. 240 240 240 240 240 240 1,440
(If io7 is YES) What is your main reason for wanting to join or become a member of this institution? (io8)
io8 Chachoeng Buriram Lop Buri Sisaket Phrae Satun Total Not enough time - - - 36.4 - - 15.4 Opportunity to save - 60.0 100.0 45.5 100.0 100.0 69.2 Opportunity to borrow - 40.0 - 9.1 - - 11.5 Not necessary - - - 9.1 - - 3.9 Total - 100.0 100.0 100.0 100.0 100.0 100.0 Obs. - 5 1 11 7 2 26
(If io7 is NO) What is your main reason for not becoming a member of this institution? (io8)
io8 Chachoeng Buriram Lop Buri Sisaket Phrae Satun Total Not enough time - 34.4 40.9 62.1 52.9 37.5 43.4 Don’t have extra money 20.0 6.3 4.6 3.5 - 12.5 5.6 Too old 30.0 6.3 - - 2.9 12.5 5.6 Other organizations 20.0 46.9 36.4 31.0 5.9 18.8 27.3 Opportunity to borrow - - - - - 6.3 0.7 Not necessary 30.0 6.3 18.2 3.5 38.2 6.3 16.8 Other - - - - - 6.3 0.7 Total 100.0 100.0 100.0 100.0 100.0 100.0 100.0 Obs. 10 32 22 29 34 16 143

Minister of Finance Initial Household Survey 2005
156
Institution: BAAC
Is anyone in your household currently a member or a customer of this institution? (io1)
io1 Chachoeng Buriram Lop Buri Sisaket Phrae Satun Total Yes 2.1 17.5 9.2 22.1 36.7 27.5 19.2 No 97.9 82.5 90.8 77.9 63.3 72.5 80.8
Total 100.0 100.0 100.0 100.0 100.0 100.0 100.0 Obs. 240 240 240 240 240 240 1,440
(If oi1 is NO) has anyone in your household ever been a member of a customer of this institution, but is not currently? (io2)
io2 Chachoeng Buriram Lop Buri Sisaket Phrae Satun Total Yes - - 0.4 - 0.4 1.7 0.4 No 97.9 82.5 90.4 77.9 62.9 70.8 80.4 NA 2.1 17.5 9.2 22.1 36.7 27.5 19.2
Total 100.0 100.0 100.0 100.0 100.0 100.0 100.0 Obs. 240 240 240 240 240 240 1,440
(If oi1 or oi2 is YES) when did you join or become a customer of this institution? (io3)
io3t Chachoeng Buriram Lop Buri Sisaket Phrae Satun Total 1953 - 1979 0.8 2.1 1.3 0.4 2.1 - 1.3
1980 - 0.4 1.3 - - - 0.3 1981 - 0.4 - - - - 0.1 1982 - - - 0.8 - - 0.1 1983 - 0.4 - - 0.4 - 0.1 1984 - 0.4 - - - - 0.1 1985 - 1.3 - 0.4 1.3 0.4 0.6 1986 - - - - 0.4 - 0.1 1987 - 0.4 - - 0.4 0.8 0.3 1988 - 0.8 - - - - 0.1 1989 - - 0.4 - 0.8 - 0.2 1990 - 0.4 0.8 0.4 2.1 - 0.6 1991 - 0.4 - - 0.8 - 0.2 1992 - 0.4 - 0.8 3.8 0.4 0.9 1993 - 0.4 - 1.7 - 0.4 0.4 1994 - - - 2.1 1.7 0.4 0.7 1995 - 1.7 0.4 1.7 4.2 2.1 1.7 1996 - 0.4 0.4 1.3 0.4 1.3 0.6 1997 - 0.8 - 2.1 0.8 4.2 1.3 1998 - 0.4 0.4 0.4 0.4 - 0.3 1999 - 0.4 0.8 0.4 1.7 1.7 0.8 2000 0.8 0.4 2.1 1.7 0.8 2.1 1.3 2001 - 1.3 0.8 1.7 1.3 4.2 1.5 2002 - 0.4 - 1.7 1.3 2.9 1.0 2003 - 1.3 - 1.7 2.1 0.8 1.0 2004 - 0.4 - 2.1 5.0 1.7 1.5 2005 0.4 2.1 0.4 0.8 1.7 0.4 1.0 NA 97.9 82.5 90.8 77.9 66.7 76.3 82.0
Total 100.0 100.0 100.0 100.0 100.0 100.0 100.0 Obs. 240 240 240 240 240 240 1,440

Minister of Finance Initial Household Survey 2005
157
(If oi2 is YES) when did you stop being a member of this institution? (io4)
io4t Chachoeng Buriram Lop Buri Sisaket Phrae Satun Total 1997 - - - - - 0.4 0.1 1999 - - - - 0.4 0.4 0.1 2004 - - 0.4 - - 0.8 0.2 NA 100.0 100.0 99.6 100.0 99.6 98.3 99.6
Total 100.0 100.0 100.0 100.0 100.0 100.0 100.0 Obs. 240 240 240 240 240 240 1,440
(if io2 is YES) why did you stop being a member of this institution? (io5)
Codes A Institution closed B Repaid loan C Could not save any more D Too old E Not enough time to participate F Household welfare improved G household welfare declined H Other
io5 Chachoeng Buriram Lop Buri Sisaket Phrae Satun Total B - - - - - 0.8 0.1 D - - 0.4 - - - 0.1 E - - - - 0.4 0.8 0.2
NA 100.0 100.0 99.6 100.0 99.6 98.3 99.6 Total 100.0 100.0 100.0 100.0 100.0 100.0 100.0 Obs. 240 240 240 240 240 240 1,440
(If io1 or io2 is YES) How many times have you borrowed from this institution? (io6)
io6 Chachoeng Buriram Lop Buri Sisaket Phrae Satun Total 0 0.8 7.9 2.9 3.3 9.2 13.8 6.3 1 - 1.7 1.7 6.7 18.8 13.3 7.0 2 - 0.4 - 2.1 2.9 0.4 1.0 3 0.4 0.8 0.4 1.7 0.4 0.4 0.7 4 0.4 0.4 0.4 1.3 1.3 - 0.6 5 - 1.3 0.8 1.7 1.3 0.4 0.9 6 - - 0.4 0.8 0.4 - 0.3
Above 6 0.4 5.0 2.5 4.6 1.3 - 2.3 NA 97.9 82.5 90.8 77.9 64.6 71.7 80.9
Total 100.0 100.0 100.0 100.0 100.0 100.0 100.0 Obs. 240 240 240 240 240 240 1,440
(If io1 or io2 is NO) If one of your neighbors asked you to join this institution, would you or members of your household want to become a member/customer? (io7)
io7 Chachoeng Buriram Lop Buri Sisaket Phrae Satun Total Yes - 8.3 - 4.2 0.4 1.3 2.4 Not sure 18.3 2.1 24.2 - 8.3 10.8 10.6 No 8.8 19.6 41.3 3.8 24.6 15.4 18.9 Don’t have one in village 70.8 52.5 25.0 70.0 29.6 43.3 48.5 NA 2.1 17.5 9.6 22.1 37.1 29.2 19.6 Total 100.0 100.0 100.0 100.0 100.0 100.0 100.0 Obs. 240 240 240 240 240 240 1,440

Minister of Finance Initial Household Survey 2005
158
(If io7 is YES) What is your main reason for wanting to join or become a member of this institution? (io8)
io8 Chachoeng Buriram Lop Buri Sisaket Phrae Satun Total Not enough time - 5.0 - - - - 2.9 Other organizations - - - 10.0 - - 2.9 Opportunity to save - 10.0 - - - - 5.9 Opportunity to borrow - 85.0 - 90.0 100.0 100.0 88.2 Total - 100.0 - 100.0 100.0 100.0 100.0 Obs. - 20 - 10 1 3 34
(If io7 is NO) What is your main reason for not becoming a member of this institution? (io8)
io8 Chachoeng Buriram Lop Buri Sisaket Phrae Satun Total Not enough time - 6.4 16.2 22.2 32.2 16.2 16.9 Don’t have extra money 14.3 12.8 17.2 - 27.1 32.4 19.9 Too old 38.1 21.3 4.0 11.1 18.6 2.7 12.9 Other organizations 19.1 42.6 37.4 44.4 10.2 43.2 32.0 Members should be wealthy - - - - - 2.7 0.4 Opportunity to borrow - 2.1 - 22.2 - - 1.1 Not necessary 28.6 14.9 25.3 - 11.9 - 16.5 Other - - - - - 2.7 0.4 Total 100.0 100.0 100.0 100.0 100.0 100.0 100.0 Obs. 21 47 99 9 59 37 272
Institution: Agricultural Cooperative
Is anyone in your household currently a member or a customer of this institution? (io1)
io1 Chachoeng Buriram Lop Buri Sisaket Phrae Satun Total Yes 0.8 7.9 2.1 11.3 10.0 16.3 8.1 No 99.2 92.1 97.9 88.8 90.0 83.8 91.9
Total 100.0 100.0 100.0 100.0 100.0 100.0 100.0 Obs. 240 240 240 240 240 240 1,440
(If oi1 is NO) has anyone in your household ever been a member of a customer of this institution, but is not currently? (io2)
io2 Chachoeng Buriram Lop Buri Sisaket Phrae Satun Total Yes - 0.4 1.3 0.4 0.8 0.4 0.6 No 99.2 91.7 96.7 88.3 89.2 83.3 91.4 NA 0.8 7.9 2.1 11.3 10.0 16.3 8.1
Total 100.0 100.0 100.0 100.0 100.0 100.0 100.0 Obs. 240 240 240 240 240 240 1,440

Minister of Finance Initial Household Survey 2005
159
(If oi1 or oi2 is YES) when did you join or become a customer of this institution? (io3)
io3t Chachoeng Buriram Lop Buri Sisaket Phrae Satun Total 1973 - - - - 0.4 - 0.1 1974 - - 0.4 - - - 0.1 1975 - - 0.4 - 0.4 - 0.1 1977 - 0.4 - - - - 0.1 1980 - - - - 0.4 - 0.1 1982 - - - - 0.4 - 0.1 1983 - 0.4 - - 0.4 - 0.1 1985 - - 0.4 0.4 0.8 0.4 0.4 1986 - - - - 0.4 0.4 0.1 1987 - 0.4 - - - 1.7 0.4 1988 - - - - 0.4 - 0.1 1989 - - - 0.4 - - 0.1 1990 - 0.4 - - 0.4 - 0.1 1991 - - - - - 0.4 0.1 1992 - - - - 0.4 - 0.1 1993 - - - - - 0.4 0.1 1994 - - - 0.4 - 0.4 0.1 1995 - 0.8 0.4 0.4 - 2.9 0.8 1996 - - - - 0.4 0.4 0.1 1997 - 0.4 - 1.7 0.8 2.1 0.8 1998 - 0.4 - 0.8 0.4 - 0.3 1999 - - - 0.4 0.8 0.8 0.4 2000 0.8 0.8 - 1.3 0.8 2.1 1.0 2001 - 0.8 0.8 1.3 1.3 0.4 0.8 2002 - 0.4 0.4 1.3 0.4 1.3 0.6 2003 - 1.3 - 1.3 - 0.8 0.6 2004 - - 0.4 1.7 - - 0.4 2005 - 1.7 - - 0.4 - 0.4 NA 99.2 91.7 96.7 88.8 90.0 85.4 91.9
Total 100.0 100.0 100.0 100.0 100.0 100.0 100.0 Obs. 240 240 240 240 240 240 1,440
(If oi2 is YES) when did you stop being a member of this institution? (io4)
io4t Chachoeng Buriram Lop Buri Sisaket Phrae Satun Total 1991 - 0.4 - - - - 0.1 1995 - - 0.4 - 0.4 - 0.1 2003 - - 0.4 - - 0.4 0.1 2004 - - 0.4 0.4 0.4 - 0.2 NA 100.0 99.6 98.8 99.6 99.2 99.6 99.4
Total 100.0 100.0 100.0 100.0 100.0 100.0 100.0 Obs. 240 240 240 240 240 240 1,440

Minister of Finance Initial Household Survey 2005
160
(if io2 is YES) why did you stop being a member of this institution? (io5)
Codes A Institution closed B Repaid loan C Could not save any more D Too old E Not enough time to participate F Household welfare improved G household welfare declined H Other
io5 Chachoeng Buriram Lop Buri Sisaket Phrae Satun Total B - - - 0.4 0.4 0.4 0.2 D - - 0.4 - - - 0.1 E - 0.4 - - 0.4 - 0.1 F - - 0.8 - - - 0.1
NA 100.0 99.6 98.8 99.6 99.2 99.6 99.4 Total 100.0 100.0 100.0 100.0 100.0 100.0 100.0 Obs. 240 240 240 240 240 240 1,440
(If io1 or io2 is YES) How many times have you borrowed from this institution? (io6)
io6 Chachoeng Buriram Lop Buri Sisaket Phrae Satun Total 0 - 0.8 1.3 3.3 5.0 4.6 2.5 1 0.4 2.5 1.7 2.1 2.9 6.3 2.6 2 - 0.8 - 2.9 - 1.7 0.9 3 - 1.7 - 1.3 0.8 1.3 0.8 4 - 0.8 - - 0.4 0.8 0.4 5 0.4 0.4 - 0.8 0.8 0.4 0.5 6 - - - 0.4 - 0.4 0.1
Above 6 - 1.3 0.4 0.8 0.4 0.8 0.6 NA 99.2 91.7 96.7 88.3 89.6 83.8 91.5
Total 100.0 100.0 100.0 100.0 100.0 100.0 100.0 Obs. 240 240 240 240 240 240 1,440
(If io1 or io2 is NO) If one of your neighbors asked you to join this institution, would you or members of your household want to become a member/customer? (io7)
io7 Chachoeng Buriram Lop Buri Sisaket Phrae Satun Total Yes - 5.0 - 4.2 1.3 - 1.7 Not sure 17.1 3.3 24.2 0.4 7.5 13.8 11.0 No 10.8 20.8 44.2 3.8 34.2 17.1 21.8 Don’t have one in village 71.3 62.5 28.3 80.0 46.3 52.5 56.8 NA 0.8 8.3 3.3 11.7 10.8 16.7 8.6 Total 100.0 100.0 100.0 100.0 100.0 100.0 100.0 Obs. 240 240 240 240 240 240 1,440

Minister of Finance Initial Household Survey 2005
161
(If io7 is YES) What is your main reason for wanting to join or become a member of this institution? (io8)
io8 Chachoeng Buriram Lop Buri Sisaket Phrae Satun Total Don’t have extra money - - - 10.0 - - 4.0 Opportunity to save - 8.3 - 70.0 33.3 - 36.0 Opportunity to borrow - 91.7 - 20.0 66.7 - 60.0 Total - 100.0 - 100.0 100.0 - 100.0 Obs. - 12 - 10 3 - 25
(If io7 is NO) What is your main reason for not becoming a member of this institution? (io8)
io8 Chachoeng Buriram Lop Buri Sisaket Phrae Satun Total Not enough time 3.9 24.0 14.2 55.6 34.2 14.6 21.3 Don’t have extra money 11.5 8.0 14.2 11.1 15.9 26.8 15.0 Too old 42.3 22.0 6.6 - 9.8 7.3 12.7 Other organizations 19.2 36.0 34.0 22.2 17.1 43.9 29.6 Members should be poor - - 0.9 - - - 0.3 Opportunity to borrow - - - 11.1 - - 0.3 Not necessary 23.1 10.0 29.3 - 23.2 2.4 19.8 Other - - 0.9 - - 4.9 1.0 Total 100.0 100.0 100.0 100.0 100.0 100.0 100.0 Obs. 26 50 106 9 82 41 314
Institution: Women’s Group
Is anyone in your household currently a member or a customer of this institution? (io1)
io1 Chachoeng Buriram Lop Buri Sisaket Phrae Satun Total
Yes 3.3 17.5 4.2 5.4 30.0 3.3 10.6
No 96.7 82.5 95.8 94.6 70.0 96.7 89.4
Total 100.0 100.0 100.0 100.0 100.0 100.0 100.0
Obs. 240 240 240 240 240 240 1,440
(If oi1 is NO) has anyone in your household ever been a member of a customer of this institution, but is not currently? (io2)
io2 Chachoeng Buriram Lop Buri Sisaket Phrae Satun Total
Yes 0.4 3.8 0.4 0.8 0.8 1.3 1.3
No 96.3 78.8 95.4 93.8 69.2 95.4 88.1
NA 3.3 17.5 4.2 5.4 30.0 3.3 10.6
Total 100.0 100.0 100.0 100.0 100.0 100.0 100.0
Obs. 240 240 240 240 240 240 1,440

Minister of Finance Initial Household Survey 2005
162
(If oi1 or oi2 is YES) when did you join or become a customer of this institution? (io3)
io3t Chachoeng Buriram Lop Buri Sisaket Phrae Satun Total
1965 - - - - 0.4 - 0.1
1983 - - - - 0.4 - 0.1
1984 - - - - 0.4 - 0.1
1985 - - - - 0.4 - 0.1
1987 - - - - - 0.4 0.1
1990 - - - - 1.3 - 0.2
1991 - - - - 0.8 - 0.1
1992 - 0.4 - - 1.3 - 0.3
1993 - - - - 0.4 0.4 0.1
1994 0.8 - - - - - 0.1
1995 0.4 1.7 0.4 0.4 2.9 - 1.0
1996 - 0.4 0.4 0.4 0.8 0.4 0.4
1997 0.4 2.1 0.4 - 0.8 0.8 0.8
1998 - 1.7 - 0.4 0.4 0.4 0.5
1999 - 1.7 - 0.4 1.3 - 0.6
2000 - 2.1 0.4 0.4 4.6 - 1.3
2001 0.8 5.0 0.8 0.8 2.5 0.4 1.7
2002 0.8 4.2 0.8 0.4 3.8 0.8 1.8
2003 0.4 1.3 - 2.1 2.9 0.4 1.2
2004 - 0.4 0.4 0.8 1.3 0.4 0.6
2005 - 0.4 0.8 - 0.8 - 0.4
NA 96.3 78.8 95.4 93.8 72.5 95.4 88.7
Total 100.0 100.0 100.0 100.0 100.0 100.0 100.0
Obs. 240 240 240 240 240 240 1,440
(If oi2 is YES) when did you stop being a member of this institution? (io4)
io4t Chachoeng Buriram Lop Buri Sisaket Phrae Satun Total
1990 - - - - - 0.4 0.1
1997 - - - - 0.4 - 0.1
2000 - - - - - 0.4 0.1
2001 - 0.4 - 0.4 - - 0.1
2002 0.4 1.3 - - - 0.4 0.4
2003 - 1.3 0.4 - - - 0.3
2004 - 0.4 - 0.4 0.4 - 0.2
2005 - 0.4 - - - - 0.1
NA 99.6 96.3 99.6 99.2 99.2 98.8 98.8
Total 100.0 100.0 100.0 100.0 100.0 100.0 100.0
Obs. 240 240 240 240 240 240 1,440

Minister of Finance Initial Household Survey 2005
163
(if io2 is YES) why did you stop being a member of this institution? (io5)
Codes A Institution closed B Repaid loan C Could not save any more D Too old E Not enough time to participate F Household welfare improved G household welfare declined H Other
io5 Chachoeng Buriram Lop Buri Sisaket Phrae Satun Total
A - - - - - 1.3 0.2
D - - - - 0.4 - 0.1
E 0.4 3.3 0.4 0.8 0.4 - 0.9
H - 0.4 - - - - 0.1
NA 99.6 96.3 99.6 99.2 99.2 98.8 98.8
Total 100.0 100.0 100.0 100.0 100.0 100.0 100.0
Obs. 240 240 240 240 240 240 1,440
(If io1 or io2 is YES) How many times have you borrowed from this institution? (io6)
io6 Chachoeng Buriram Lop Buri Sisaket Phrae Satun Total
0 3.8 16.7 4.6 6.3 24.6 4.6 10.1
1 - 1.7 - - 2.5 - 0.7
2 - 1.7 - - 1.7 - 0.6
3 - 0.4 - - 0.8 - 0.2
4 - 0.8 - - - - 0.1
5 - - - - 0.8 - 0.1
6 - - - - 0.4 - 0.1
NA 96.3 78.8 95.4 93.8 69.2 95.4 88.1
Total 100.0 100.0 100.0 100.0 100.0 100.0 100.0
Obs. 240 240 240 240 240 240 1,440
(If io1 or io2 is NO) If one of your neighbors asked you to join this institution, would you or members of your household want to become a member/customer? (io7)
io7 Chachoeng Buriram Lop Buri Sisaket Phrae Satun Total
Yes - 3.8 - 1.3 1.7 2.1 1.5
Not sure 15.8 2.1 18.8 2.5 5.4 10.4 9.2
No 8.8 32.9 39.2 9.2 32.1 5.8 21.3
Don’t have one in village 71.7 40.0 37.5 80.8 30.0 77.1 56.2
NA 3.8 21.3 4.6 6.3 30.8 4.6 11.9
Total 100.0 100.0 100.0 100.0 100.0 100.0 100.0
Obs. 240 240 240 240 240 240 1,440

Minister of Finance Initial Household Survey 2005
164
(If io7 is YES) What is your main reason for wanting to join or become a member of this institution? (io8)
io8 Chachoeng Buriram Lop Buri Sisaket Phrae Satun Total
Not enough time - 33.3 - 33.3 - - 19.1
Don’t have extra money - - - 33.3 - - 4.8
Too old - 11.1 - - - - 4.8
Other organizations - - - 33.3 - - 4.8
Opportunity to save - 11.1 - - 75.0 80.0 38.1
Opportunity to borrow - 33.3 - - 25.0 20.0 23.8
Other - 11.1 - - - - 4.8
Total - 100.0 - 100.0 100.0 100.0 100.0
Obs. - 9 - 3 4 5 21
(If io7 is NO) What is your main reason for not becoming a member of this institution? (io8)
io8 Chachoeng Buriram Lop Buri Sisaket Phrae Satun Total
Not enough time 23.8 48.1 51.1 77.3 58.4 57.1 52.4
Don’t have extra money - - 6.4 4.6 2.6 7.1 3.3
Too old 33.3 20.3 6.4 - 10.4 - 12.1
Other organizations 14.3 30.4 16.0 13.6 2.6 35.7 16.9
Not necessary 28.6 1.3 20.2 4.6 26.0 - 15.3
Total 100.0 100.0 100.0 100.0 100.0 100.0 100.0
Obs. 21 79 94 22 77 14 307
Institution: Commercial Bank
Is anyone in your household currently a member or a customer of this institution? (io1)
io1 Chachoeng Buriram Lop Buri Sisaket Phrae Satun Total Yes 74.6 65.8 60.0 48.3 41.7 39.2 54.9 No 25.4 34.2 40.0 51.7 58.3 60.8 45.1
Total 100.0 100.0 100.0 100.0 100.0 100.0 100.0 Obs. 240 240 240 240 240 240 1,440
(If oi1 is NO) has anyone in your household ever been a member of a customer of this institution, but is not currently? (io2)
io2 Chachoeng Buriram Lop Buri Sisaket Phrae Satun Total Yes 1.7 0.4 1.3 0.4 - - 0.6 No 23.8 33.8 38.8 51.3 58.3 60.8 44.4 NA 74.6 65.8 60.0 48.3 41.7 39.2 54.9
Total 100.0 100.0 100.0 100.0 100.0 100.0 100.0 Obs. 240 240 240 240 240 240 1,440

Minister of Finance Initial Household Survey 2005
165
(If oi1 or oi2 is YES) when did you join or become a customer of this institution? (io3)
io3t Chachoeng Buriram Lop Buri Sisaket Phrae Satun Total 1955 0.4 - 0.4 - - - 0.1 1959 0.8 - - - - - 0.1 1960 - 0.4 - - - - 0.1 1965 0.4 - 0.4 0.4 - - 0.2 1967 0.4 0.4 - - 0.4 - 0.2 1969 - 0.4 - - 0.4 - 0.1 1970 - 0.8 0.8 - - - 0.3 1971 0.4 0.4 0.4 - - - 0.2 1972 0.8 - 0.4 1.3 - - 0.4 1973 0.4 0.4 - - - 0.4 0.2 1974 0.8 - - - - - 0.1 1975 0.8 0.4 0.8 - 0.4 0.4 0.5 1976 - 0.4 - - - - 0.1 1977 4.6 1.7 0.8 - - 0.4 1.3 1978 0.4 - 0.4 0.8 0.4 - 0.4 1979 0.4 0.8 0.8 - - - 0.4 1980 0.4 1.3 0.4 - - - 0.4 1981 - 0.4 - - - 0.4 0.1 1982 - 1.3 0.4 1.3 - - 0.5 1983 - 0.4 - - - 0.4 0.1 1984 0.4 - - - - - 0.1 1985 4.2 4.2 1.7 2.5 0.4 - 2.2 1986 1.7 0.4 - - 0.4 - 0.4 1987 5.8 9.2 2.5 2.9 0.8 1.3 3.8 1988 0.8 1.3 0.8 - - - 0.5 1989 1.3 0.4 1.3 1.3 - 0.8 0.8 1990 0.8 1.3 1.3 0.8 - - 0.7 1991 1.7 0.4 0.4 - 0.4 - 0.5 1992 1.7 1.3 1.3 2.1 0.8 0.8 1.3 1993 0.8 0.8 0.8 1.7 0.4 - 0.8 1994 - 0.8 3.3 0.4 1.7 0.4 1.1 1995 3.3 4.6 4.6 3.3 4.2 2.5 3.8 1996 1.7 2.1 0.8 2.9 1.3 1.3 1.7 1997 3.8 6.3 10.0 6.7 2.5 9.2 6.4 1998 1.3 1.3 0.4 0.8 - 0.4 0.7 1999 2.1 1.7 2.1 2.1 1.3 0.8 1.7 2000 3.8 2.9 2.5 2.1 2.1 0.4 2.3 2001 1.3 4.6 2.5 1.7 0.8 1.3 2.0 2002 3.8 2.5 3.3 3.3 3.8 2.9 3.3 2003 3.8 2.9 3.8 1.7 2.9 3.3 3.1 2004 0.8 3.3 2.1 2.9 3.3 1.3 2.3 2005 1.3 0.8 2.1 0.8 1.3 - 1.0 NA 42.9 37.5 46.3 56.3 70.0 71.3 54.0
Total 100.0 100.0 100.0 100.0 100.0 100.0 100.0 Obs. 240 240 240 240 240 240 1,440

Minister of Finance Initial Household Survey 2005
166
(If oi2 is YES) when did you stop being a member of this institution? (io4)
io4t Chachoeng Buriram Lop Buri Sisaket Phrae Satun Total 1992 0.8 - - - - - 0.1 1997 0.4 - 0.4 - - - 0.1 2000 0.4 - - - - - 0.1 2002 - - 0.8 - - - 0.1 2004 - 0.4 - - - - 0.1 2005 - - - 0.4 - - 0.1 NA 98.3 99.6 98.8 99.6 100.0 100.0 99.4
Total 100.0 100.0 100.0 100.0 100.0 100.0 100.0 Obs. 240 240 240 240 240 240 1,440
(if io2 is YES) why did you stop being a member of this institution? (io5)
Codes A Institution closed B Repaid loan C Could not save any more D Too old E Not enough time to participate F Household welfare improved G household welfare declined H Other
io5 Chachoeng Buriram Lop Buri Sisaket Phrae Satun Total B - - 0.4 - - - 0.1 C 1.3 - - 0.4 - - 0.3
C,G - 0.4 - - - - 0.1 G 0.4 - - - - - 0.1 H - - 0.8 - - - 0.1
NA 98.3 99.6 98.8 99.6 100.0 100.0 99.4 Total 100.0 100.0 100.0 100.0 100.0 100.0 100.0 Obs. 240 240 240 240 240 240 1,440
(If io1 or io2 is YES) How many times have you borrowed from this institution? (io6)
io6 Chachoeng Buriram Lop Buri Sisaket Phrae Satun Total 0 66.7 58.3 47.9 38.8 35.4 36.7 47.3 1 7.5 4.6 10.8 7.1 5.8 2.1 6.3 2 0.8 1.7 0.8 1.7 0.4 - 0.9 3 - 0.8 - 0.8 - - 0.3 6 - - 0.4 - - - 0.1
Above 6 0.4 0.8 - 0.4 - - 0.3 NA 24.6 33.8 40.0 51.3 58.3 61.3 44.9
Total 100.0 100.0 100.0 100.0 100.0 100.0 100.0 Obs. 240 240 240 240 240 240 1,440

Minister of Finance Initial Household Survey 2005
167
(If io1 or io2 is NO) If one of your neighbors asked you to join this institution, would you or members of your household want to become a member/customer? (io7)
io7 Chachoeng Buriram Lop Buri Sisaket Phrae Satun Total Yes 0.4 3.3 - 1.7 - - 0.9 Not sure 7.5 4.2 12.5 0.4 5.8 5.8 6.0 No 5.0 16.7 22.1 2.5 28.3 14.2 14.8 Don’t have one in village 10.8 9.6 4.2 46.7 24.2 40.8 22.7 NA 76.3 66.3 61.3 48.8 41.7 39.2 55.6 Total 100.0 100.0 100.0 100.0 100.0 100.0 100.0 Obs. 240 240 240 240 240 240 1,440
(If io7 is YES) What is your main reason for wanting to join or become a member of this institution? (io8)
io8 Chachoeng Buriram Lop Buri Sisaket Phrae Satun Total Don’t have extra money 100.0 - - - - - 7.7 Opportunity to save - 62.5 - 100.0 - - 69.2 Opportunity to borrow - 37.5 - - - - 23.1 Total 100.0 100.0 - 100.0 - - 100.0 Obs. 1 8 - 4 - - 13
(If io7 is NO) What is your main reason for not becoming a member of this institution? (io8)
io8 Chachoeng Buriram Lop Buri Sisaket Phrae Satun Total Not enough time - 2.5 7.6 - 27.9 - 11.3 Don’t have extra money 75.0 67.5 35.9 16.7 47.1 61.8 51.2 Too old 8.3 17.5 3.8 - 1.5 5.9 6.1 Other organizations d 16.7 10.0 24.5 83.3 16.2 32.4 21.6 Members should be wealthy - 2.5 - - - - 0.5 Opportunity to save - - - - 1.5 - 0.5 Not necessary - - 28.3 - 5.9 - 8.9 Total 100.0 100.0 100.0 100.0 100.0 100.0 100.0 Obs. 12 40 53 6 68 34 213
Institution: Money Lender
Is anyone in your household currently a member or a customer of this institution? (io1)
io1 Chachoeng Buriram Lop Buri Sisaket Phrae Satun Total
Yes 8.3 17.5 7.1 4.2 - 2.9 6.7
No 91.7 82.5 92.9 95.8 100.0 97.1 93.3
Total 100.0 100.0 100.0 100.0 100.0 100.0 100.0
Obs. 240 240 240 240 240 240 1,440

Minister of Finance Initial Household Survey 2005
168
(If oi1 is NO) has anyone in your household ever been a member of a customer of this institution, but is not currently? (io2)
io2 Chachoeng Buriram Lop Buri Sisaket Phrae Satun Total
Yes 3.8 1.7 2.5 - - 0.8 1.5
No 87.9 80.8 90.4 95.8 100.0 96.3 91.9
NA 8.3 17.5 7.1 4.2 - 2.9 6.7
Total 100.0 100.0 100.0 100.0 100.0 100.0 100.0
Obs. 240 240 240 240 240 240 1,440
(If oi1 or oi2 is YES) when did you join or become a customer of this institution? (io3)
io3t Chachoeng Buriram Lop Buri Sisaket Phrae Satun Total
1977 - - 0.4 - - - 0.1
1985 - 0.4 - - - 0.4 0.1
1987 0.8 - - - - - 0.1
1988 - 0.4 - - - - 0.1
1992 - 0.4 - - - - 0.1
1995 - 0.4 0.4 - - - 0.1
1996 - 0.4 - - - - 0.1
1997 0.4 0.4 0.4 0.8 - 0.4 0.4
1998 - 0.4 - - - - 0.1
1999 0.4 - 0.4 - - - 0.1
2000 2.1 2.1 0.8 - - - 0.8
2001 - 0.8 0.8 0.4 - 1.3 0.6
2002 2.1 1.7 0.4 0.4 - 0.4 0.8
2003 2.5 2.9 - 0.8 - 0.8 1.2
2004 0.4 2.1 2.5 0.4 - 0.4 1.0
2005 2.5 6.7 3.3 0.8 - - 2.2
NA 88.8 80.8 90.4 96.3 100.0 96.3 92.1
Total 100.0 100.0 100.0 100.0 100.0 100.0 100.0
Obs. 240 240 240 240 240 240 1,440

Minister of Finance Initial Household Survey 2005
169
(If oi2 is YES) when did you stop being a member of this institution? (io4)
io4t Chachoeng Buriram Lop Buri Sisaket Phrae Satun Total
1992 0.4 - - - - - 0.1
1993 - 0.4 - - - - 0.1
1996 - - 0.4 - - - 0.1
1998 0.4 - - - - - 0.1
2000 0.4 0.4 - - - - 0.1
2001 - 0.4 0.8 - - 0.4 0.3
2002 - - 0.4 - - - 0.1
2003 1.7 - 0.8 - - - 0.4
2005 0.8 0.4 - - - - 0.2
NA 96.3 98.3 97.5 100.0 100.0 99.6 98.6
Total 100.0 100.0 100.0 100.0 100.0 100.0 100.0
Obs. 240 240 240 240 240 240 1,440
(if io2 is YES) why did you stop being a member of this institution? (io5)
Codes A Institution closed B Repaid loan C Could not save any more D Too old E Not enough time to participate F Household welfare improved G household welfare declined H Other
io5 Chachoeng Buriram Lop Buri Sisaket Phrae Satun Total
B 3.8 1.3 2.1 - - 0.4 1.3
D - - 0.4 - - - 0.1
F - 0.4 - - - - 0.1
NA 96.3 98.3 97.5 100.0 100.0 99.6 98.6
Total 100.0 100.0 100.0 100.0 100.0 100.0 100.0
Obs. 240 240 240 240 240 240 1,440

Minister of Finance Initial Household Survey 2005
170
(If io1 or io2 is YES) How many times have you borrowed from this institution? (io6)
io6 Chachoeng Buriram Lop Buri Sisaket Phrae Satun Total
0 - 0.4 0.4 - - - 0.1
1 6.7 10.4 5.0 3.8 - 1.3 4.5
2 2.1 3.3 2.1 - - 0.4 1.3
3 0.8 1.3 0.4 - - - 0.4
4 0.4 1.3 0.4 0.4 - 0.4 0.5
5 - 0.4 - - - 0.4 0.1
6 - - 0.4 - - 0.8 0.2
Above 6 1.7 2.1 0.8 - - 0.4 0.8
NA 88.3 80.8 90.4 95.8 100.0 96.3 91.9
Total 100.0 100.0 100.0 100.0 100.0 100.0 100.0
Obs. 240 240 240 240 240 240 1,440
(If io1 or io2 is NO) If one of your neighbors asked you to join this institution, would you or members of your household want to become a member/customer? (io7)
io7 Chachoeng Buriram Lop Buri Sisaket Phrae Satun Total
Yes - 3.8 - 0.8 0.4 0.4 0.9
Not sure 32.1 2.1 24.2 2.9 3.8 12.9 13.0
No 23.3 46.3 52.5 17.9 52.5 22.9 35.9
Don’t have one in village 32.5 28.8 13.8 74.2 43.3 60.0 42.1
NA 12.1 19.2 9.6 4.2 - 3.8 8.1
Total 100.0 100.0 100.0 100.0 100.0 100.0 100.0
Obs. 240 240 240 240 240 240 1,440
(If io7 is YES) What is your main reason for wanting to join or become a member of this institution? (io8)
io8 Chachoeng Buriram Lop Buri Sisaket Phrae Satun Total
Members should be wealthy - - - 50.0 - - 7.7
Opportunity to save - 11.1 - - - - 7.7
Opportunity to borrow - 77.8 - - 100.0 100.0 69.2
Not necessary - 11.1 - 50.0 - - 15.4
Total - 100.0 - 100.0 100.0 100.0 100.0
Obs. - 9 - 2 1 1 13

Minister of Finance Initial Household Survey 2005
171
(If io7 is NO) What is your main reason for not becoming a member of this institution? (io8)
Don’t have extra money Chachoeng Buriram Lop Buri Sisaket Phrae Satun Total
Not enough time 1.79 4.5 12.7 4.65 23.02 30.91 13.54
Don’t have extra money 3.57 17.12 9.52 4.65 7.14 20 10.64
Too old 23.21 3.6 1.59 0 2.38 7.27 5.03
Other organizations 30.36 44.14 24.6 90.7 10.32 27.27 31.72
Members should be wealthy 8.93 3.6 3.97 0 11.11 14.55 6.96
Opportunity to borrow 0 0 0.79 0 0 0 0.19
Not necessary 32.14 27.03 46.83 0 46.03 0 31.91
Total 100.0 100.0 100.0 100.0 100.0 100.0 100.0
Obs. 56 111 126 43 126 55 517


![Social Enterprises in Thailand - WFTO AsiaSOCIAL ENTERPRISE IN THAILAND KEY MILESTONES 2009: •Government set up Thai Social Enterprise Promotion Board [TSEB] with the Prime Minister](https://static.fdocuments.in/doc/165x107/5e4b584947bab037cb28a163/social-enterprises-in-thailand-wfto-asia-social-enterprise-in-thailand-key-milestones.jpg)