
Thai Oil Public Company Limited Oil’s Businesses The majority of refined petroleum products are...
83
Thai Oil Public Company Limited Presentation to Investors March 2015
Transcript of Thai Oil Public Company Limited Oil’s Businesses The majority of refined petroleum products are...

Thai Oil Public Company Limited
Presentation to Investors
March 2015

-2-
Disclaimer
The information contained in this presentation is intended
solely for your personal reference. Please do not circulate this
material. If you are not an intended recipient, you must not
read, disclose, copy, retain, distribute or take any action in
reliance upon it.

-3-
VISION A LEADING FULLY INTEGRATED REFINING & PETROCHEMICAL
COMPANY IN ASIA PACIFIC
MISSION
• To be in top quartile on performance and return on investment
• To create a high-performance organization that promotes
teamwork, innovation and trust for sustainability
• To emphasis good Corporate Governance and commit to Corporate
Social Responsibility
VALUES
Corporate Vision, Mission and Values
Professionalism
Ownership & Commitment
Social Responsibility Integrity Teamwork & Collaboration Initiative
Vision Focus
Excellent Striving

-4-
Corporate Governance Policy
Corporate Governance Policy
The board of directors, management
and all staff shall commit to moral
principles, equitable treatment to all
stakeholders and perform their duties for
the company’s interest with dedication,
integrity, and transparency.
Roles and Responsibilities for
Stakeholders
• Truthfully report company’s situation and
future trends to all stakeholders equally
on a timely manner.
• Shall not exploit the confidential
information for the benefit of related
parties or personal gains.
• Shall not disclose any confidential
information to external parties.
CG Channels
Should you discover any
ethical wrongdoing that is
not compliance to CG policies
or any activity that could
harm the Company’s interest,
please inform:
Corporate Management Office Thai Oil Public Company Limited 555/1 Energy Complex Building A
11F, Vibhavadi Rangsit Road,
Chatuchak, Bangkok 10900
[email protected] http://www.thaioilgroup.com
+66-0-2797-2999 ext. 7312-5
+66-0-2797-2973

-5-
Thaioil Group Sustainable Development
Member of DJSI Emerging Markets for 2 consecutive years • Highest Ranked Level in RobecoSAM Gold Class of Global Oil & Gas Companies • No.1 in ENERGY industry around the WORLD (Industry Group Leader) • No.1 in Oil & Gas Producers Worldwide (Industry Leader)

-6-
Presentation Agenda
TOP GROUP BUSINESS OVERVIEW
KEY FINANCIAL HIGHLIGHT
STRATEGIC INVESTMENT PLAN
MARKET OUTLOOK
KEY TAKE AWAY MESSAGES
APPENDIX
Q4 & FY/14 PERFORMANCE ANALYSIS
GLOBAL REFINERY MARGINS / INVENTORY / THAILAND PETROLEUM DEMAND

-7-
TOP Group Business Overview

-8-
Strategic Relationship and Operational Integration with PTT
Thai Oil’s strong shareholder base
49.1%
25.1%
20.3%
5.5%
PTT
Foreign Investors
Local Investors
NVDR
• Benefits from PTT’s dual role as our major shareholder and key business partner
• All transactions take place at arm’s length and in adherence with strong corporate governance principles
Key strategic benefits for Thai Oil
1. Long-term strategic partnership
• Thai Oil is PTT’s principal refiner
• Long-term strategic shareholder and joint investment
2. Business partnership
• Product offtake • Crude procurement
3. Operational synergies
• Freight costs reduction • Knowledge transfer and shared
services • Close management collaboration
and secondment of trained staff
49.1%
As of 27 Feb 2015

-9-
TOP Group Synergy & Strategic Role in PTT Group Value Chain
NATURAL GAS
CRUDE IMPORT
Mixed-Xylene
Solvent
Toluene
Pentane
Hexane
SOLVENTS
TP provides electricity and steam to Thai Oil, TLB and TPX and sells its remaining power to the national grid
Paraxylene
Benzene
Mixed-Xylene
Toluene
AROMATICS
Lube Base Oil
Bitumen
TDAE
Slack Wax
Extract
LUBE BASE
REFINERY LPG
Fuel Oil
Diesel
Gasoline
Jet/Kero
PLATFORMATE
LONG RESIDUE
REFINED PETROLEUM
POWER
Diversifying to a broad
range of downstream
products to enjoy higher
profit margins and
reduce earnings
volatility
Thai Oil’s Businesses
The majority of refined petroleum products are sold domestically to PTT
PTT is our principal domestic customer for our lube base products
Upstream Intermediate Downstream

-10-
Key Milestones: 53 Years, A Long Track Record of Success
2007 • Increased refining capacity to 275 kbd 2008 • The first refinery in Thailand with diesel
production to comply with the sulfur content requirements of Euro IV
• Capacity expansion of Thai Paraxylene with total aromatics capacity of 900,000 tons p.a.
• Invested in Solvents business in Thailand and Vietnam
1993 • We expanded our refining capacity to 190 kbd
1994 – 1997 • Increased total refining capacity to 220 kbd • Initial investment in Thai Paraxylene (“TPX”) and
Thai Lube Base (“TLB”) • IPT became the first IPP to enter into a PPA with
EGAT2 with 700 MW capacity ; separately, Thaioil Power (“TP”) constructed the power generation plant under the SPP with 118 MW capacity
1961 – 1997 Capacity expansion and initial stage of
business diversification
2004 – 2011 Listing, expansion and
diversification
Today A leading integrated refining and
petrochemical group in Asia Pacific
• 275 kbd refinery ( approximately 25% of Thailand’s total refining capacity)
• Nelson index 9.71 • Diversified business through 13
subsidiaries • The 3rd largest listed company by revenue in Thailand
1961 – 1964
2004
1961 • Incorporated
1964 • Commenced
operation with distillation capacity of 35 kbd
• Simple refinery with Nelson complexity Index ~ 41
1970 • Refining capacity
expanded to 65 kbpd
1989 • Increased refining
capacity to 90 kbpd
2004 • IPO and listed on the SET • Acquired remaining shares in
Thai Paraxylene and Thai Lube Base which became our wholly-owned subsidiaries
2007 -2008
2010
2011
1993-1997
1970-1989
2013 • Established LABIX to
produce LAB • Invested in power biz
via GPSC • TOP SPP for 239 MW • Revenue 414,599 MB • Net profit 10,394 MB
2011 • 1st refinery in the Asia-
Pacific region to manufacture diesel and ULG in compliance with the sulfur and BZ aromatics content requirements of the Euro IV
• Acquired 1st VLCC
2010 • Established
Thaioil Ethanol • Production
expansion of TDAE by 50,000 tons per annum
Note 1. Based on our internal estimates using the methodology of the Nelson Complexity Index 2. The Electricity Generating Authority of Thailand (“EGAT”) is the national grid
2013

-11-
Thai Oil Group Business Structure
40% 34% 15% 10% Refinery Aromatics Lube Base Others
• 4 Oil & Chemical Tankers Capacity : 51,250 DWT
• Crude Tankers: 3VLCCs Capacity: 881,500 DWT
• 11 crew & utility boats (120 DWT each)
• 2 Large vessels for crude, feedstock & product storage and transportation services
Capacity: 200,000 DWT • Ship management services
9.2 %
Principal power plant of PTT capacity 1,038 MW of electricity 1,340 tons/hour of steam Total aggregate capacity 1,357 MW
Platformate 1.8 million tons/annum
PTT Group 80.0%
100.0% 100.0% 74.0% 100.0%
Thaioil (TOP) Thai Lube Base
(TLB) Thaioil Power
(TP)
Global Power Synergy Company Limited
Thaioil Energy Services (TES)
Thaioil Marine (TM)
Maesod Clean Energy (MCE)
Capacity : 275,000 barrels/day Small Power Producer
Program 3-on-1 Combined Cycle Electricity 118 MW Steam 168 tons/hour
PTT 26.0%
Proceeds the business on various professional of management services
Sugarcane Based Ethanol Capacity : 230,000 lts/day
PTT 30.1%
Thaioil 11.9%
TP 27.7%
Padaeng 35.0%
Mitr Phol 35.0%
100.0%
Thappline (THAP)
Multi-product Pipeline Capacity:26,000 m.lts/y
20.0%
PTT 40.4%
Others 50.4%
Lube Base Oil Capacity : Base Oil 267,015 tons/annum Bitumen 350,000 tons/annum TDAE 67,520 tons/annum
Thaioil Solvent
Through TOP Solvent (TS)
100.0%
100.0%
Thaioil Ethanol (TET)
Capacity : 141,000 tons/annum
Thai Paraxylene (TPX)
100.0% 80.5%
Solvent distribute in Thailand
Sak Chaisidhi (SAKC)
Top Solvent Vietnam
Solvent distribute in Vietnam
PTT ICT Solutions (PTT ICT)
Sapthip (SAP) Cassava Based Ethanol Capacity : 200,000 lts/day
50.0%
Ubon Bio Ethanol (UBE) 21.3%
Cassava/Molasses Based Plant Capacity : 400,000 lts/day
100%
PTT Energy Solutions (PTTES)
Provides engineering technique consulting services
20.0% PTT 40.0%
PTTGC 20.0% IRPC 20.0%
BCP 21.3% Others 57.4%
PTTGC 30.3%
30.0%
Aromatics Capacity: Paraxylene 527,000 tons/annum Mixed Xylene 52,000 tons/annum Benzene 259,000 tons/annum Total 838,000 tons/annum
LABIX Company Limited (LABIX)
LAB producer and distributor Capacity: 100 KTA COD: 2015
Mitsui 25.0% 75.0% TOP SPP Company
Limited
2 Small Power Producers Total capacity: 239 MW COD 2016
100.0%
Sells Electricity/Steam to Group
Net Profit Contribution
(Avg. from 2006 – 2014)

-12-
Process Linkage: Beauty of Integration
Thai Paraxylene
Thai Lube Base
PROCESS FLOWCHART
JET
ULG91
LPG
ULG95
KEROSENE
CDU-1
45,000
CDU-2
50,000
CDU-3
165,000
MX
AGO
DIESEL
FUEL OIL
BITUMEN
SULPHUR
HVU-1
HVU-2
HVU-3
95,000
FUELGAS
BBU
1,800
ADIP
TCU
19,000
FCCU
10,400
HCU-
1 HCU 2
50,000
SRU-1/2
SRU-3/4
2x210
KMT-1
KMT-2
HMU-1
HDT-1
HDT-2
HDT-3
85,000
HMU-2
140TH2
HDS-2
HDS-3
75,000
MX
40,000
CCR-1
CCR-2
50,000
ISOM
20,000
ADIP
Thai Oil
-13-
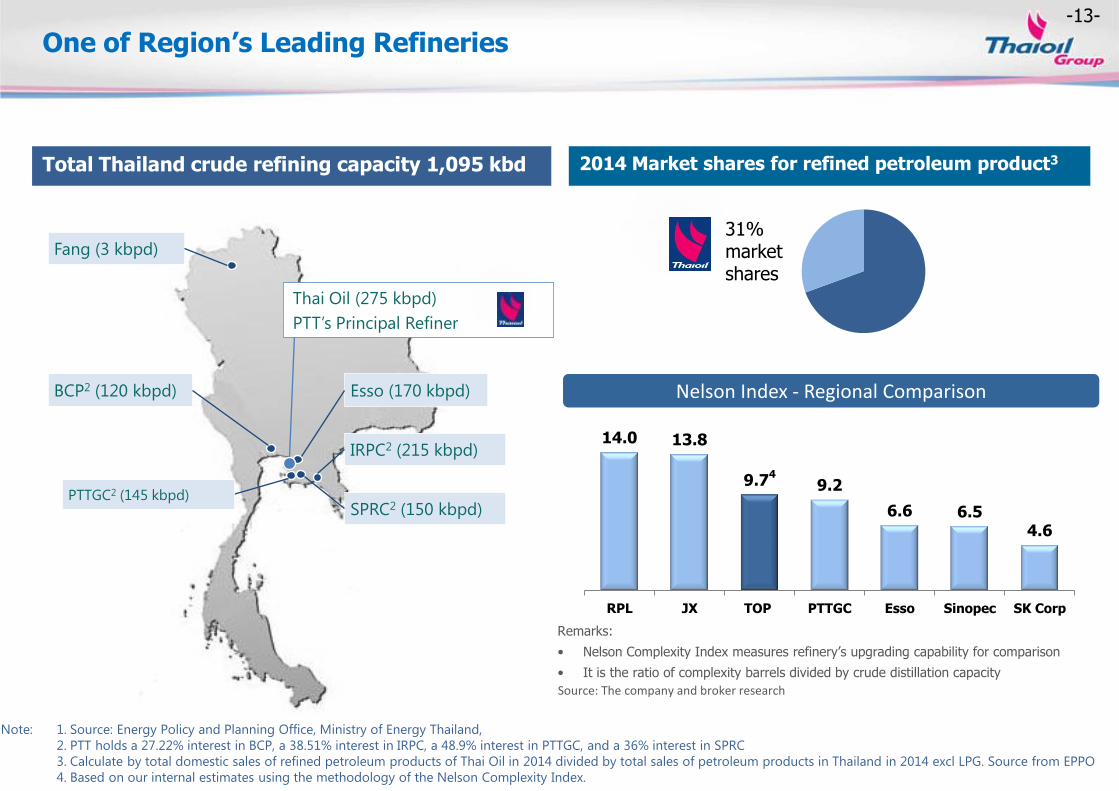
Total Thailand crude refining capacity 1,095 kbd 2014 Market shares for refined petroleum product3
One of Region’s Leading Refineries
Thai Oil (275 kbpd)
PTT’s Principal Refiner
Esso (170 kbpd)
IRPC2 (215 kbpd)
SPRC2 (150 kbpd)
BCP2 (120 kbpd)
Fang (3 kbpd)
Remarks:
• Nelson Complexity Index measures refinery’s upgrading capability for comparison
• It is the ratio of complexity barrels divided by crude distillation capacity
14.0 13.8
9.74 9.2
6.6 6.5 4.6
RPL JX TOP PTTGC Esso Sinopec SK Corp
Source: The company and broker research
Nelson Index - Regional Comparison
31% market shares
Note: 1. Source: Energy Policy and Planning Office, Ministry of Energy Thailand,
2. PTT holds a 27.22% interest in BCP, a 38.51% interest in IRPC, a 48.9% interest in PTTGC, and a 36% interest in SPRC
3. Calculate by total domestic sales of refined petroleum products of Thai Oil in 2014 divided by total sales of petroleum products in Thailand in 2014 excl LPG. Source from EPPO
4. Based on our internal estimates using the methodology of the Nelson Complexity Index.
PTTGC2 (145 kbpd)
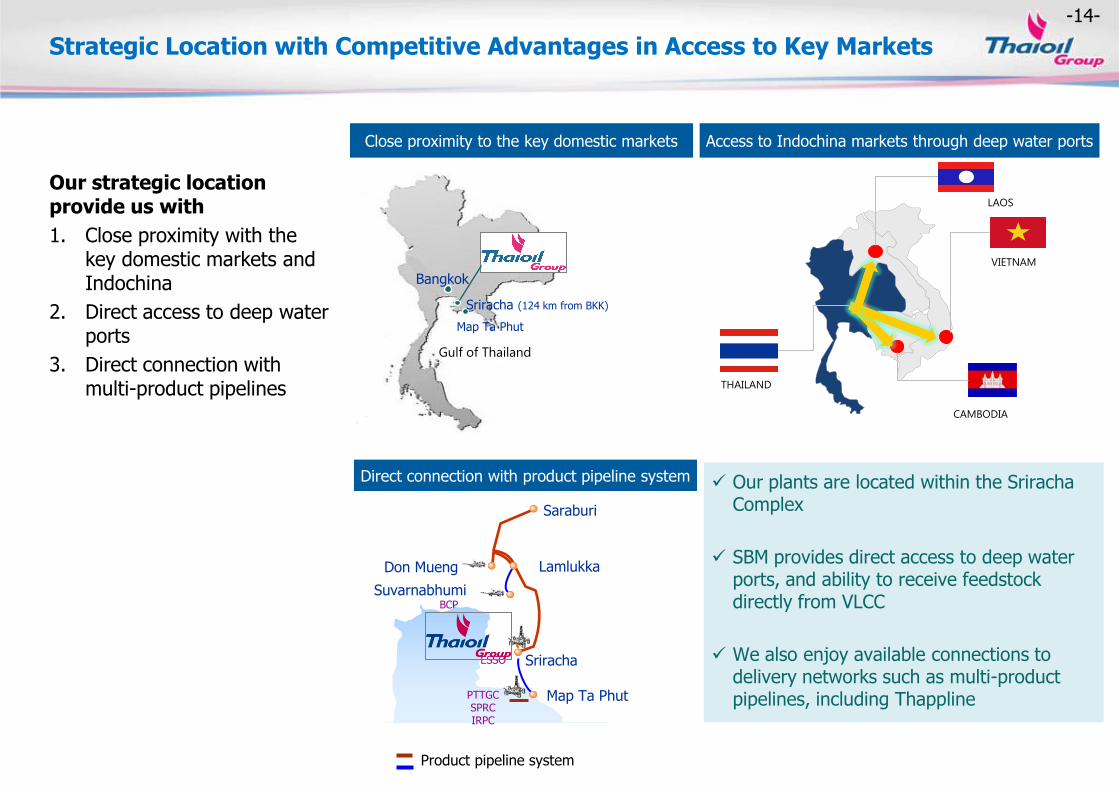
-14-
Strategic Location with Competitive Advantages in Access to Key Markets
Our strategic location provide us with
1. Close proximity with the key domestic markets and Indochina
2. Direct access to deep water ports
3. Direct connection with multi-product pipelines
Our plants are located within the Sriracha Complex
SBM provides direct access to deep water ports, and ability to receive feedstock directly from VLCC
We also enjoy available connections to delivery networks such as multi-product pipelines, including Thappline
Ø24”, 134 km
Saraburi
Lamlukka Don Mueng
Suvarnabhumi
ESSO
PTTGC SPRC IRPC
Map Ta Phut
Sriracha
BCP
Product pipeline system
Direct connection with product pipeline system
Access to Indochina markets through deep water ports
Close proximity to the key domestic markets
Bangkok
Map Ta Phut
Gulf of Thailand
Sriracha (124 km from BKK)
THAILAND
LAOS
VIETNAM
CAMBODIA

-15-
Optimized & Flexible Operations…Superior Performance
72%
9%
8%
11%
9%
38%
20%
16%
13%
4%
4%
41%
11%
17%
27%
27% 13% 7%
32%
29% 32%
41% 58% 61%
Oman Dubai Murban
Short Residue Waxy Gas/Distillates
Far East
Local
Middle East
Sources of Crude
FY/14
1
Spread over Dubai (US$/bbl)
-35.6
15.9
16.1
-8.3
14.3
Others
18.3
• Flexibility in crude intake allows diversification of crude types to source cheaper crude
• Flexibility in product outputs by maximizing middle distillates (jet and diesel) by adjusting production mode to capture domestic demand and price premium
• Maximize Platformate production to capture higher margin on aromatics
• Minimize fuel oil output to avoid lower margin products
1.LPG price = 76% CP + 24%*333 $/ton
LPG
PLATFORMATE
GASOLINE
JET
DIESEL
FUEL OIL
Product output
Domestic demand for
petroleum products*
*Source: Energy Policy and Planning Office, Ministry of Energy Thailand
FY/14
% S = 0.79 API = 39.7
% S = 1.54 API = 31.2
% S = 2.13 API = 30.4
Crude Assays based on TOP configuration
Thai Oil is able to diversify its type of crude intake and product outputs to maximize demand and margin

-16-
84% 81% 83%
16% 19% 17%
FY/13 Q4/14 FY/14
Export
Domestic
Strong Domestic Sales despite Flatten Local Demand
Refinery Intake (KBD)
280
TOP’s Domestic & Export Sales Sales breakdown by customers
38%
12% 7%
1%
23%
17% 2%
Domestic Jobbers
Q4/14
Sales
Breakdown
Export 19%
296 269
38%
13% 9%
2%
22%
15% 2%
Domestic Jobbers
FY/14
Sales
Breakdown
Export 17%
686 694 640 689 724 698 667 700 732 706 668 706 698 701
92% 88% 85%
89% 93%
89% 92% 92% 86% 85% 85%
92% 92% 87%
0%
20%
40%
60%
80%
100%
-
200
400
600
800
1,000
1,200
Domestic Demand/Sales Net Export Others Utilization Rate
Domestic Oil Demand / Domestic Refinery Intake Domestic Oil Demand
KBD
Utilization = 98%
including LPG from refinery only
*
*including TOP intake (Excluding TOP = 65%)
0
200
400
600
800
1,000
LPG Mogas Jet/Kero Diesel Fuel Oil Total Demand
2013 2014 KBD
-0.2% +3.8% -1.0%
0.9%
-3.9%
0.6%

-17-
Competitive Performance Benchmarking
Shell Global Solutions International (SGSi) Solomon (Bi-Annually)
2012
2010
Operational Performance Review
Hydrocarbon Management Review
Operational Troubleshooting
Staff Competency Development
Knowledge Management & Research

-18-
Thailand’s largest and
one of the region’s
most advanced and
competitive refineries 1 Strategic relationship
and operational
integration with PTT as
the Group’s principal
refiner
3
Technological
superiority, logistical
advantages & cost
leadership
6
Industry with high
barriers to entry and
strong market
positioning
5 Strategic location with
competitive advantages
in access to key markets
4
Diversified earnings
through integration
with, and significant
contribution from, our
subsidiaries
2
Highly experienced
management team
7 Strong financial profile
8
TOP Group Key Highlights

-19-
Key Financial Highlights

-20-
2014 Key Industry Highlights
Implication
4.5 $/bbl inventory loss (from stock gain 0.8 to stock loss 4.5 $/bbl Y/Y)
Improved market GRM (from 4.3 to 5.7 $/bbl Y/Y)
$48/bbl drop in Dubai crude price pressured by ample supply ,while demand remains soft
Benefits from crude price collapse (i.e. lower refinery fuel & loss / crude premium) supports GRM
Refinery
Aromatic
Base Oil
Pressured Aromatic Margins (GIM contribution from 1.8 to 0.1 $/bbl Y/Y)
PX oversupply from new capacities and slowdown in Chinese polyester / PTA demand pressured margins
Soften Base Oil margins (GIM contribution from 0.9 to 0.7 $/bbl Y/Y)
More competition from Gr II/III, while sharp drop in HSFO supported margins
Refinery + Aromatics + Base Oil
$/BBL 2014 2013
Market GIM 6.2 6.8
Stock Gains / (Loss) -4.3 0.8
Accounting GIM 1.9 7.6

-21-
2014 Key Events/Achievements & TOP Group Net Profit
Key Events / Achievements 2014
Completion of CDU-3 Turnaround 9 days earlier than plan (46 vs 55 day)
Successful COD of key margin improvement products i.e. HVU-2 revamp, CDU-3 Preheat Train
Active commodities hedging resulting in gains of 2,218 MB
Maintain strong credit rating profile by all 3 agencies
Oil & Gas Industry Leader for sustainability, only Thai Company for Gold Class for 2 consecutive yr (announce as of 19 Jan 2015)
Implementing Profit Recovery Plan
2,115 5,773 7,621 6,692
(3,637)
(10,454) (14,439)
2,624
(653)
(1,798)
(2,451)
5,243
NP w/o Stock G/L Stock G/(L) LCM Additional benefits
Top Group Net Profit
Unit : million THB
Q4/14
Excluding tax
(6,479) MB
Q3/14
(2,175) MB
FY/14
(4,026) MB
FY/13
9,316* MB
Including (tax expense) /reversal
12,864 MB

-22-
FY/14 Success on TOP Profit Recovery Program
Hydrocarbon / Supply Chain & Commercial Management save 0.57 US$/bbl
Commodities Hedging (both crack spread & Inventory)
2. Profit Recovery Program
1,102 MB
5,243 Million Baht Success from Margin Improvement / Profit Recovery Program / Risk Management
OPEX & Cost Management , Supply & Marketing Initiatives
1,923 MB 2,218 MB
Less CDU-3 Maintenance time HVU-2 Revamp CDU-3 Preheat Train Alternative feedstock to TLB
More specialty product sale (TLB) Optimize Gasoline Export (upgrade low value component) Negotiate on Insurance Premium

-23-
Integrated Margin & Competitive Cash Cost
6.4
1.1
3.3 4.6
5.3
4.3
8.2
5.7
2.2 3.4
4.1
6.2
4.5 5.1
(3.5)
1.2
2008 2009 2010 2011 2012 2013 Q4/14 2014
6.1 2.6
1.1 2.9 3.1 3.9 4.4
5.9 5.1 4.3 4.1 4.9 7.9
(3.3)
5.4
1.1
1.1
1.1 2.6
2.6 1.5 1.5 2.1
2.1 1.7
1.7 1.8 1.8
(0.3)
(0.3)
0.1
0.1
0.7
0.7 0.7
0.7 1.0
1.0
1.3 1.3
0.9 0.9 0.9
0.9 0.4
0.4
0.7
0.7
7.9
4.3 5.6
7.8 7.6 6.8
8.0 6.2
4.3 6.1 6.3
9.3
6.9 7.6
(3.2)
1.9
2008 2009 2010 2011 2012 2013 Q4/14 2014
TOP TPX TLB
(Unit: US$/bbl)
Marketing GIM Accounting GIM (Marketing GIM + Stock G/L)
Marketing GRM Accounting GRM (Marketing GRM + Stock G/L)
Gross Refining Margin
Gross Integrated Margin
(Unit: US$/bbl)
0.9 0.9 1.0 1.1 1.2 1.4 1.7 1.6 0.4 0.5 0.5 0.4 0.4 0.7 0.7 0.8 1.4 1.4 1.5 1.5 1.6 2.1 2.4 2.4
2008 2009 2010 2011 2012 2013 Q4/14 2014
Operating Cost Interest Expense (Net)
1.1 1.1 1.2 1.4 1.5 1.7 1.9 1.8 0.5 0.5 0.5 0.4 0.4 0.6 0.7 0.7 1.6 1.7 1.8 1.8 1.9 2.3 2.6 2.5
2008 2009 2010 2011 2012 2013 Q4/14 2014
Operating Cost Interest Expense (Net)
Refinery’s Cash Cost
(Unit: US$/bbl)
Group’s Cash Cost
(Unit: US$/bbl)
*Including MTA cost in MTA period since mid Jun-late July 2014 for 46 days (TOP MTA cost in 2014 = 436 MB)
*
*Including MTA cost in MTA period since mid Jun-late July 2014 for 46 days ( TOP group MTA cost in 2014 = 609 MB)
*
*Including MTA cost 0.14 $/bbl
*Including MTA cost 0.20 $/bbl

-24-
Financial Performance
2,157
14,035
10,349
13,753
16,946
3,801 5,767
2008 2009 2010 2011 2012 2013 2014
22,897
12,846 14,585
23,868 22,808
19,713
6,880
19,541
7,949
21,393 17,381
28,760
20,350 22,337
(5,373)
2,651
2008 2009 2010 2011 2012 2013R Q4/14 2014
EBITDA (excl stk G/L) EBITDA (incl stk G/L)
399,125
284,123 318,391
446,241
447,432
414,575
88,545
390,090
2008 2009 2010 2011 2012 2013R Q4/14 2014
11,435
5,652 6,999
9,961
14,777
6,692 5,773
12,864
224
12,062
8,956
14,853 12,320
9,316
(6,479) (4,026)
2008 2009 2010 2011 2012 2013R Q4/14 2014
NP (excl stk G/L before tax) NP (incl stk G/L)
Unit: Million THB
Sales Revenue EBITDA
Unit: Million THB
Net Profit
Unit: Million THB
Free Cash Flow*
R Restated financial statement
Unit: Million THB
* Free Cash Flow (FCF) = Operating cash flow – CAPEX(PP&E)-Net
CAPEX (PP&E)-Net
6,103 12,330 18,666 3,850 3,187 1,300 6,284
Financial
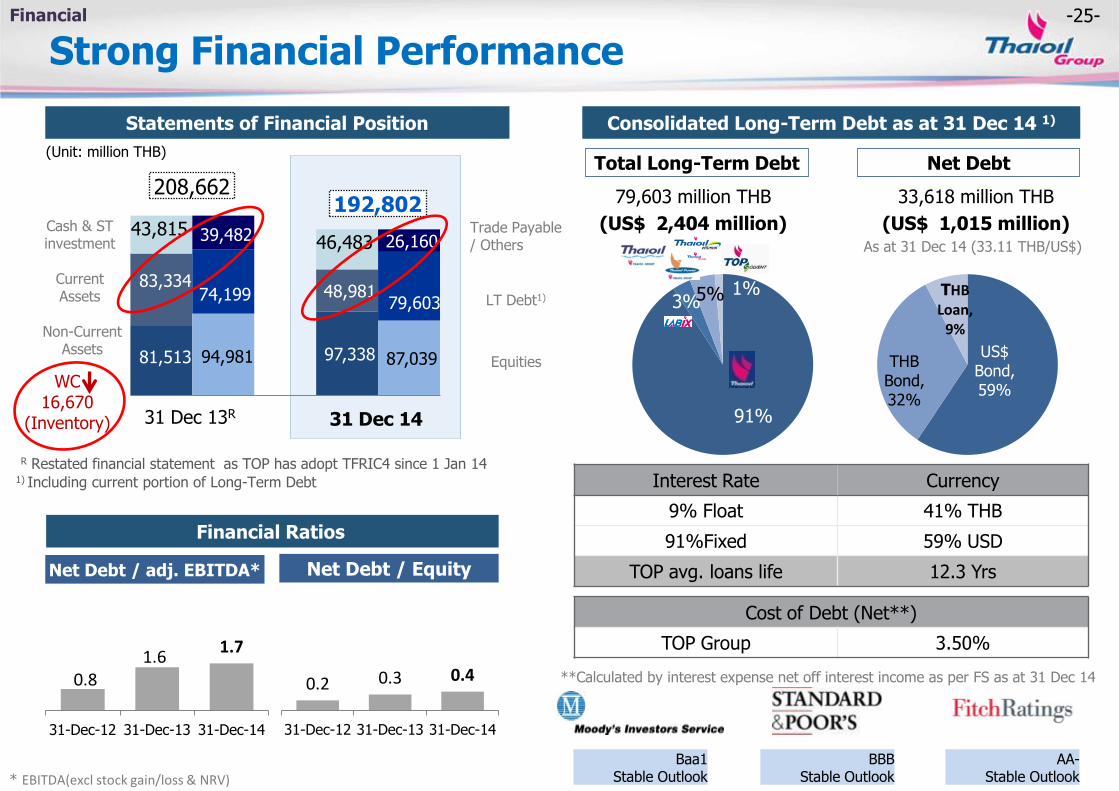
-25-
Strong Financial Performance
0.2 0.3 0.4
31-Dec-12 31-Dec-13 31-Dec-14
1) Including current portion of Long-Term Debt
Financial Ratios
Net Debt / adj. EBITDA* Net Debt / Equity
Cost of Debt (Net**)
TOP Group 3.50%
BBB Stable Outlook
Baa1 Stable Outlook
AA- Stable Outlook
Interest Rate Currency
9% Float 41% THB
91%Fixed 59% USD
TOP avg. loans life 12.3 Yrs
Consolidated Long-Term Debt as at 31 Dec 14 1)
79,603 million THB
(US$ 2,404 million)
33,618 million THB
(US$ 1,015 million)
Total Long-Term Debt Net Debt
As at 31 Dec 14 (33.11 THB/US$)
R Restated financial statement as TOP has adopt TFRIC4 since 1 Jan 14
81,513 97,338
83,334 48,981
43,815 46,483
94,981 87,039
74,199 79,603
39,482 26,160
Statements of Financial Position
(Unit: million THB)
Trade Payable / Others
LT Debt1)
Equities
Current Assets
Non-Current Assets
Cash & ST investment
192,802 208,662
31 Dec 13R 31 Dec 14 91%
3% 5% 1%
US$ Bond, 59%
THB Bond, 32%
THB Loan,
9%
**Calculated by interest expense net off interest income as per FS as at 31 Dec 14
Financial
WC 16,670
(Inventory)
0.8 1.6
1.7
31-Dec-12 31-Dec-13 31-Dec-14
* EBITDA(excl stock gain/loss & NRV)

-26-
7.82
9.19
8.13
9.40
0.11
5.91
4.41
7.28
6.04
5.09
-1.97
1.80
3.50 3.50
4.50
2.75 2.55 2.00
3.30 2.70
2.30
1.16
FY/04 FY/05 FY/06 FY/07 FY/08 FY/09 FY/10 FY/11 FY/12 FY/13 FY/14
1.50 1.75 1.75
1.05 0.60
1.30
0.50 0.80 0.56
Dividend Payment
Dividend Policy : Not less than 25% of consolidated net profit after deducting reserves, subject to cash flow and investment plan
25%
40%
45%
48%
Yield* 4.0% 5.6% 5.6% 6.2% 5.2% 7.1% 4.0% 4.7% 4.2% 3.6% 2.3%
n.a.
43%
THB/Share
45% 45%
EPS
Total dividend
Interim dividend
Dividend payout
45%
TOP price
44.7 63.0 62.7 72.7 53.3 35.9 49.9 69.8 65.1 64.6 50.4
45%
* Based on average TOP price in each year
Financial
n.a.

-27-
Strategic Investment Plans

-28-
Broadening Growth, Capturing Step Out ,Pursuing Sustainability
Logistics
AEC countries
Value Chain Enhancement
Adjacent
Quick win
Core Business
Geography
New Business
Operational Excellence Growth (Core & Step Out)
Project Update

-29-
Strategic Investment Plan
Projects COD Total Project
Cost 2014 2015 2016 2017 2018
Refinery upgrading 2014 137 32
Reliability, efficiency and flexibility improvement
- 353 103 58 14 8 31
Environmental and fuel efficiency improvement
- 269* 89 12
CDU-3 preheat train 2014 68 45 15
Benzene Derivatives - LAB 2015 300 141 77 10 16
Power – 2 SPPs 2016 380 140 192 48
Solvent expansion – SAKC 2014 64 13 7
Marine fleets expansion 2014/15 56 15 8
Lorry Expansion 2016 55 28 27
Total 1,682 578 396 98 24 31
CAPEX Plan (Unit US$ million)
Notes: Excluding approximately 40 M$/year for annual maintenance *anticipated to receive BOI for environmental projects
Our CAPEX
investments will
cover improvements
in plants reliability,
efficiency &
flexibility,
environmental & fuel
efficiency
improvement as well
as value chain
enhancement
Thai Oil has
sufficient internal
cash flow to fund
this investment plan
$153m
Remaining capital investment
Project Update
Update as of Feb 2015
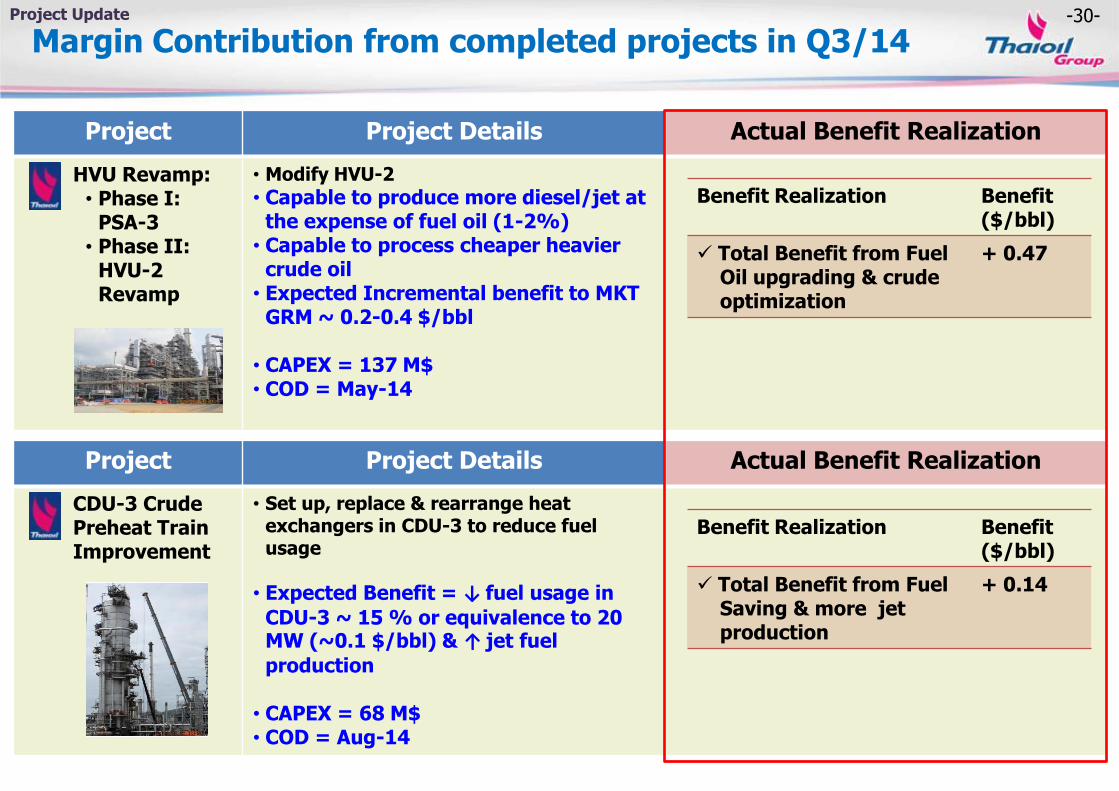
-30-
Margin Contribution from completed projects in Q3/14
Project Project Details Actual Benefit Realization
HVU Revamp: • Phase I:
PSA-3 • Phase II:
HVU-2 Revamp
• Modify HVU-2
• Capable to produce more diesel/jet at the expense of fuel oil (1-2%)
• Capable to process cheaper heavier crude oil
• Expected Incremental benefit to MKT GRM ~ 0.2-0.4 $/bbl
• CAPEX = 137 M$ • COD = May-14
Project Project Details Actual Benefit Realization
CDU-3 Crude Preheat Train Improvement
• Set up, replace & rearrange heat exchangers in CDU-3 to reduce fuel usage
• Expected Benefit = ↓ fuel usage in
CDU-3 ~ 15 % or equivalence to 20 MW (~0.1 $/bbl) & ↑ jet fuel
production • CAPEX = 68 M$ • COD = Aug-14
Benefit Realization Benefit ($/bbl)
Total Benefit from Fuel Oil upgrading & crude optimization
+ 0.47
Benefit Realization Benefit ($/bbl)
Total Benefit from Fuel Saving & more jet production
+ 0.14
Project Update

-31-
Key Project Progress Update : LAB Project Update
Project Detail Progress
Linear Alkyl Benzene (LAB)
• TPX JV with Mitsui (75% : 25%) • Upgrade existing Benzene and Kerosene into higher valued product; LAB which is an intermediate feedstock in production of surfactant (detergent)
•Capacity: 100 KTA (First Integrated LAB Plant in SEA)
•Benefit = add to GIM ~ 0.4-0.6 $/bbl •CAPEX = 400 M$ (TPX’s part = 300 M$) •COD = Q4 2015
86%
KTA %
Feedstock
Kerosene (from TOP) 520 94%
Benzene (from TPX) 33 6%
Product/ By-products
LAB 100 19%
By-products (mostly Kerosene
components) (to TOP)
453 81%
LABIX site LABIX : Feedstock / Products

-32-
Key Project Progress Update : 2 SPPs Project Update
Project Detail Progress
TOP SPP (2 blocks of SPP)
• Low risk power business enhance income stability • Support reliability of electricity & steam supply for TOP Group
• Develop 2 new SPP power plants; • Total power capacity 239 MW (~20% used
in TOP complex ~80% sales to national Grid under firmed contract)
• Total steam capacity 498 T/H (100% used in TOP complex)
•CAPEX = 380 M$ •COD = 1H 2016
60%

-33-
New Project Approval in Q3/14 : Lorry Expansion Project New Project
Project Project Detail
Lorry Expansion Project
• Expand lorry loading capacity
• CAPEX : ~ 60 M$ • Benefit : Margin Improvement ~ 0.10 – 0.15 $/bbl (capture future local & Indochina vol) • COD : 2H 2016
Existing Capacity Lorry Expansion Project
Designed Capacity : 10 mml/day (10 gantries)
Planned Additional Capacity : +5 mml/day (+ 5 gantries)

-34-
Progress on Myanmar Project Project Update
Study Project Detail Progress
Refinery Upgrading Project in Myanmar
• On mid-July, 2014, Myanmar Petrochemical Enterprise (MPE) issued Invitation to Tender, specifying the proposal deadline by mid-Oct, 2014
• Planned Two Phase Proposal (TOP in collaboration with PTT Group) 1 - Revamp existing Thanlyin Refinery 2 – Option to Develop new green field refinery
PTT/TOP had submitted proposal on Oct 13, 2014
Thanlyin
Yangon
(Expect result announcement by Q1/15)
Thanlyin Refinery Thanlyin Refinery
Thanlyin Refinery Info
Total Capacity 20 KBD
Year Built 1963
Location 14 km from Yangon

-35-
2015 MARKET OUTLOOK
• Crude Oil
• Petroleum Products
• Aromatics
• Base Oil & Bitumen

-36-
Macroeconomics and Crude Price

-37-
2015 Global GDP Growth by IMF
Sources: (1) ASEAN-5 includes Thailand, Malaysia, Indonesia, Vietnam, Philippines
(2) IMF’S WEO Oct, 2014 (3) IMF ‘S WEO Jan, 2015 (4) BOT Sep, 2014 (5) BOT Dec, 2014
IMF revised down the Global GDP growth to 3.5%
2.8%
-0.6%
5.2%3.9%
3.2% 3.3% 3.3%3.5%
-6%
-3%
0%
3%
6%
9%
12%
2008 2009 2010 2011 2012 2013 2014 2015
Growth (%YoY)
China US EU World
Macroeconomics & Crude Prices
2013
2014 2015
Oct-14(2) Jan-15(3) Oct-14(2) Jan-15(3)
USA 2.2% 2.2% 2.4% 3.1% 3.6%
EU -0.5% 0.8% 0.8% 1.3% 1.2%
China 7.8% 7.4% 7.4% 7.1% 6.8 %
Japan 1.6% 0.9% 0.1% 0.8% 0.6%
India 5.0% 5.6% 5.8% 6.4% 6.3%
ASEAN-5(1) 5.2% 4.7% 4.5% 5.4% 5.2%
Thailand 2.9% 1.5%(4) 0.8%(5) 4.8%(4) 4.0%(5)
World 3.3% 3.3% 3.3% 3.8% 3.5%

-38-
490 0
140
North America
2015 Global Oil Demand Growth
Macroeconomics & Crude Prices
IEA Demand (MBD)
Growth (MBD)
2013 91.8 +1.3
2014 92.4 +0.6
2015 93.3 +0.9
OPEC Demand (MBD)
Growth (MBD)
2013 90.2 +1.2
2014 91.2 +1.0
2015 92.3 +1.1
EIA Demand (MBD)
Growth (MBD)
2013 90.5 +1.3
2014 91.4 +0.9
2015 92.4 +1.0
IEA forecasted 2015’s global oil demand to increase by 0.9 MBD mainly from Asia
Unit: KBD
-90 -260
-70
Europe
350 310 540
Asia 160 200 220
Middle East
50 90 170
Africa
200 150 110
Latin America
130 100
-210
FSU
Source: IEA, Oil Market Report, January 2015
Source: IEA, Oil Market Report January 2015 Source: EIA, Short Term Energy Outlook January 2015 Source: OPEC, Oil Market Report January 2015
The global oil demand will grow
by 0.9 MBD in 2015, amid weak
global demand conditions.
Slump in crude prices have
limited effects to boost demand.
EU’s deflation, strong USD,
revenue impact on oil exporters
and subsidy cuts policies are key
reasons why low oil prices fail to
stimulate demand.
2013
2014 2015
-39-
-150
0
-70
Europe
-250 -40
100
Asia -150 -30 -60
Middle East
100 20
-10
Africa
-30
190 160
Latin America
1313
840
North America
180 20
-120
FSU
2015 Non-OPEC Supply Growth
Macroeconomics & Crude Prices
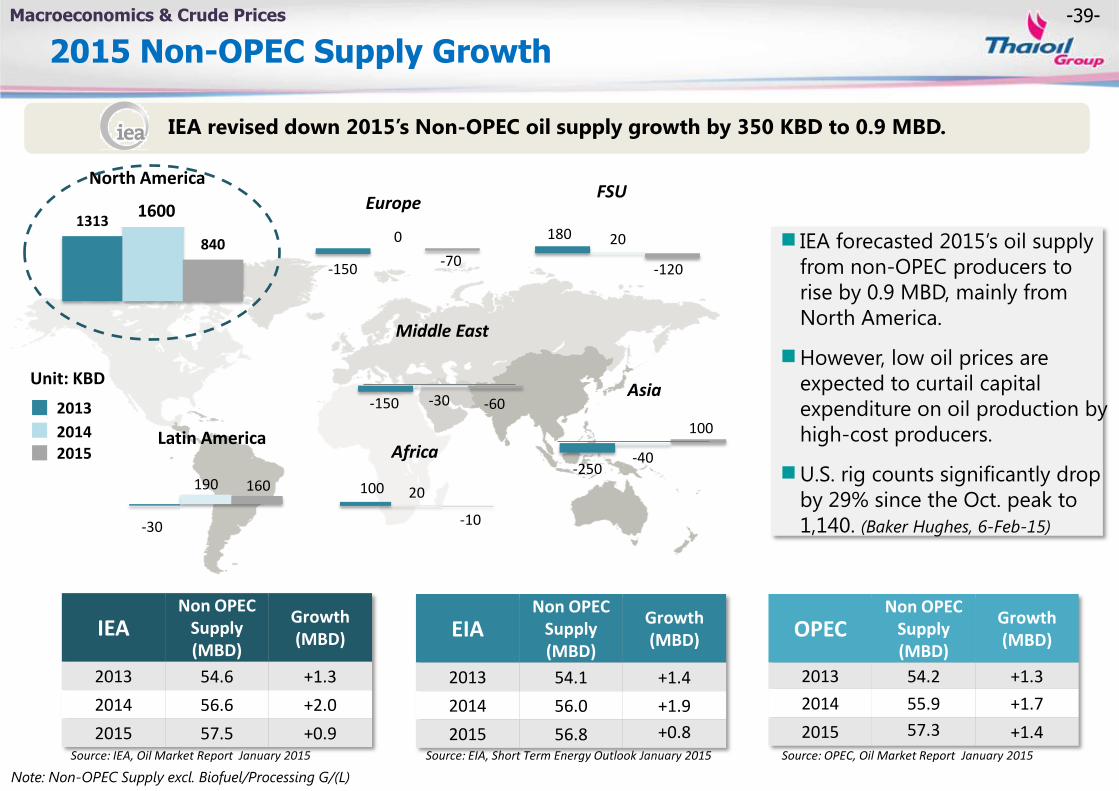
IEA revised down 2015’s Non-OPEC oil supply growth by 350 KBD to 0.9 MBD.
IEA Non OPEC
Supply (MBD)
Growth (MBD)
2013 54.6 +1.3
2014 56.6 +2.0
2015 57.5 +0.9
OPEC Non OPEC
Supply (MBD)
Growth (MBD)
2013 54.2 +1.3
2014 55.9 +1.7
2015 57.3 +1.4
EIA Non OPEC
Supply (MBD)
Growth (MBD)
2013 54.1 +1.4
2014 56.0 +1.9
2015 56.8 +0.8 Source: IEA, Oil Market Report January 2015 Source: EIA, Short Term Energy Outlook January 2015 Source: OPEC, Oil Market Report January 2015
Unit: KBD
2013
2014 2015
IEA forecasted 2015’s oil supply
from non-OPEC producers to
rise by 0.9 MBD, mainly from
North America.
However, low oil prices are
expected to curtail capital
expenditure on oil production by
high-cost producers.
U.S. rig counts significantly drop
by 29% since the Oct. peak to
1,140. (Baker Hughes, 6-Feb-15)
1600
Note: Non-OPEC Supply excl. Biofuel/Processing G/(L)

-40-
Overview of Crude Prices in Q1/15
Macroeconomics & Crude Prices
40
50
60
70
80
90
100
Oct-14 Nov-14 Dec-14 Jan-15 Feb-15
USD/BBL
Dubai Price Rebound in Late Jan’ 15
$ 54.2
MTD Feb (16 Feb 15)
Fundamental Factors
Aug-11, 1055
Oct-14, 1609
Feb-15, 1056
600
800
1000
1200
1400
1600
Rigs
Total U.S. Oil Rig Counts 2011-2015
Abundant Supply from both Non-OPEC and OPEC producers, amid weak global demand conditions
MBD MBD
Source: IEA Jan’15
Source: Baker Hughes, 2015
Response to the dramatic drop in oil rig counts
Reduced CAPEX on oil production, mainly by non-OPEC producers
Why Do Crude Prices Rebound?: Slowdown in Supply Growth
2015 2014
Surplus
DB $105/BBL
DB $54/BBL
DB $87/BBL
Feb-11 DB $100/BBL

-41-
2015 Crude Outlook
Macroeconomics & Crude Prices
FACTORS TO WATCH
SUPPLY-SIDED FACTORS
Estimates as of Feb’15
Fed’s stance on interest rate hike
ECB’s QE impacts on economy
China’s Strategic Petroleum Reserve Plan
DEMAND-SIDED FACTORS
Declining oil rig counts and reduced CAPEX on oil production
MENA Unrest (i.e. Libya and Iraq)
Iran’s nuclear talks
105 97
104 106 101
74
51 50 53 61
53
20
40
60
80
100
120
2013 2014 1Q14 2Q14 3Q14 4Q14 1Q15 2Q15 3Q15 4Q15 2015
USD/BBL Dubai Price Movement
Actual (Annually) Actual (Quarterly) Forecast
53$/BBL

-42-
PETROLEUM PRODUCTS

-43-
Overview 2014-20 Refinery Status
Source: FACTs Semi Annual Reports, October 2014, Reuters, Bloomberg, TOP estimate
Note: Adjusted capacity based on start-up period (Effective additional capacity)
525
796
82
958
782
1,004
714
-600
-400
-200
0
200
400
600
800
1000
1200
1400
2014 2015 2016 2017 2018 2019 2020
KBD
AP Additional Demand ME Additional Demand
ME Addition China
Australia Japan
India Vietnam
Other AP Net Addition
Addition (start-up period)
Country Nameplate (KBD)
Company
Q4-14 Saudi Arabia 400 Jubail
Saudi Arabia 400 Yanbu
China 90 Sinopec Yangxi
China 45 Local
Q1-15 UAE 417 Ruwais
India 300 IOC Paradip
Q2-15 China 14 Local
Pakistan 10.5 Attock Rawalpindi
Q3-15 China 30 Sinopec Yangxi
Q4-15 China 60 CNOOC Jiangsu
China 140 CNOOC Zhejiang
New Zealand 8 Marsden Point
Closure
Q4-14 Australia -125 Caltex (Kurnell)
Q2-15 Australia -95 BP Bulwer
Japan -124 Cosmo/Tonen Chiba
Q4-15 Taiwan -205 CPC Kaohsiung
China -75 Local
New barrels from AP/ME are expected to continually flood the petroleum product market
CDU Addition VS Additional Demand – AP & ME

-44-
High Supply Pressures GRM
Refinery
($/bbl) 2013 2014 Q4-14 Q1-15 Q2-15TD* 2015(F)**
ULG95-DB 13.7 14.3 13.4 15.5 16.3
JET-DB 17.5 15.9 17.7 17.0 14.1
GO-DB 17.9 16.1 16.0 16.3 14.7
HSFO-DB (8.0) (8.3) (5.6) (1.9) (3.6)
SG GRM Crack 6.1 5.8 6.2 8.5 7.8
+ High winter demand for heating oil
+ Crude prices slump
+ Improved regional economy
+ Lower price to support demand
Refinery
Remark : *as of 7 Apr 15 , **Compared to 2014
- New barrels from China and ME started to enter the market stream
- Increased refinery run rates, incentivized by healthy refinery margins
- More supply from new AP/ME refineries
- Energy subsidy cuts and consumption tax policies dampen regional oil demand
Overall Market in Q1-15 Factor to Watch for 2015…

-45-
Feb 02: New LPG ex-ref. price formula (CP-$20 /T)
Better benefit when LPG CP price is higher than $416/T
Thailand Oil Demand Outlook Refinery
Year on Year 2013 2014 2015(F)
LPG +2% 0% +3%
MogasA +7% +4% +4%
Jet/Kero +9% -1% +3%
DieselA +2% +1% +1%
Fuel Oil -8% -4% -5%
Total +3.0% +0.6% +2.1%
GDP Growth +2.9% +0.7% +4.0%B
A) Mogas and diesel have included ethanol and biodiesel, respectively
B) Forecasted by BOT ( Monetary Policy Report as of Dec-14 )
Thailand oil demand in 2015 is expected to grow at 2.1% YoY supported by better economic
outlook compared to 2014
Higher local petroleum demand supported by
lower crude oil price
FACTORS TO WATCH “Energy Policy & Economic Stimulus Program”

-46-
AROMATICS

-47-
Has PX Spread Hit the Bottom? Aromatics

-48-
Heavy PX Capacity Addition Causing Supply Surplus
HC
Petr
och
em
Ten
glo
ng
1
Ten
glo
ng
2
Sin
op
ec H
inan
TP
PI
Country Plan KTA Company
China Feb 650 Petrochina Sichuan Petrochemical
SaudiArabia Feb 660 SATORP
China Feb 700 Qingdao Lidong (restart)
China May 800 Dragon Aromatics No.2 (restart)
Korea Jun (delay from May) 1,000 Ulsan Aromatics
China Jul 700 Qingdao Lidong (restart)
Korea Jul (delay from Jun) 1,300 SK Energy
Korea Jul (delay from May) 1,000 Samsung Total 2
India Aug (delay from
May) 920 ONGC Mangalore Petrochemicals
Singapore Sep (delay from Jun) 800 Jurong Aromatics Corp
Algeria Oct 220 Sonatrach
• Heavy new capacity in Feb pressured
PX market in Q1’14
Early plan of PX capacities
• Delay start-up of new capacity in
Jul and Aug helped support PX
market in Q3’14
Delay start-up of new PX plants
Aromatics
0.0
0.5
1.0
1.5
2.0
2.5
3.0
3.5
Jan Sep Oct Dec Jan Feb Mar Apr May Jun Jul Aug Sep Oct Nov Dec
2013 2014
Feedstock Uncertainty MTA
2013 2014

-49-
2015 PX and PTA Capacity Update Aromatics
-1.0
0.0
1.0
2.0
3.0
4.0
Q1 Q2 Q3 Q4
MTA
Country Plan KTA Company
Korea Q1’15 -200 Lotte Chemical1
Kazakhstan Q2’15 469 JSC KazMunaiGas
China Q3’15 800 Ningbo Zhongjin Petrochemical 1
India Q3’15 2,250 Reliance Industries 4
Thailand Q3’15 120 PTTGC
Total 2015 3,439 MTA
Global Nameplate PX Additional/Closure Capacity
-2.0
-1.0
0.0
1.0
2.0
3.0
4.0
Q1 Q2 Q3 Q4
Global Nameplate PTA Additional/Closure Capacity
• 5.6 MTA of new PTA capacity will be
added (3.8 MTA as PX equivalent) in 2015
• PX spread remains under pressure due to
heavy supply
• New PTA capacity will help support PX
market -1.0
0.0
1.0
2.0
3.0
4.0
Q1 Q2 Q3 Q4 2015
PX PTA (PX equivalent)
MTA
2015
Source: PCI Xylene&Polyesters as of Nov’14

-50-
PX Demand/Supply Outlook
Source: PCI Xylene & Polyesters as of Nov’14 and TOP estimate
AP/ME PTA Additional New Capacity*
25 27 28 30 31 33 35 37 39 41
29 30 30 33 37
42 45 47 50
53
0
10
20
30
40
50
60
2010 2011 2012 2013 2014 2015 2016 2017 2018 2019
Demand Capacity
AP/ME PX Capacity* and Demand
3.2
1.6
-0.1
2.6
4.5 4.2
3.7
1.7
2.7
3.6
-2
0
2
4
6
8
2010 2011 2012 2013 2014 2015 2016 2017 2018 2019
Demand Growth Effective Additional Capacity
AP/ME Effective Additional New Capacity
MTA
MTA
Forecast
2010-2014 Dem: 7.4% Cap: 8.1%
2015 Dem: 5.7% Cap: 11.1%
2016-2019 Dem: 5.8% Cap: 6.4%
Forecast
New PX capacity of 2.9 mil tons/yr will be added in China, S. Korea, Brunei, Vietnam and ME during 2016-2019
New PTA additional capacity support PX demand growth
Remark : * Nameplate capacity
Aromatics
2
4
12
1
11
6
2
0
4 4
1
3
8
0
7
4
1 0
3 3
-2
0
2
4
6
8
10
12
14
2010 2011 2012 2013 2014 2015 2016 2017 2018 2019
PTA PTA (PX equivalent)
MTA
SUPPLY
DEMAND
Remark : * Nameplate capacity

-51-
Weak Benzene Spread on Soft Demand and Bearish Crude Market
Aromatics

-52-
3.1
1.6
0.4
1.2
2.4
1.8
1.0 0.9
1.6 1.9
0
1
2
3
4
2010 2011 2012 2013 2014 2015 2016 2017 2018 2019
Demand Growth Effective Capacity Addition
BZ Demand/Supply Outlook
New BZ capacity of 1.4 mil tons/yr will be added in China, S. Korea, Brunei, Vietnam and ME during 2016-2019
Healthy BZ demand, driven by US import
SUPPLY
DEMAND
Remark : * Nameplate capacity
AP/ME BZ Capacity* and Demand
AP/ME Effective Additional New Capacity MTA
23 23 23 24 26 27 28 29 30 32 31 33 33 34 37 39 40 40 42 44
10
15
20
25
30
35
40
45
50
2010 2011 2012 2013 2014 2015 2016 2017 2018 2019
Demand Capacity
2010-2014 Dem: 5.2% Cap: 5.6%
2015 Dem: 4.3% Cap: 4.9%
2016-2019 Dem: 4.5% Cap: 3.3%
MTA
Forecast Forecast
Aromatics
Source: IHS as of Nov’14 and TOP estimate
0.0
1.0
2.0
3.0
2010 2011 2012 2013 2014 2015 2016 2017 2018 2019
BZ Imports by North America
MT

-53-
Stable PX Spread Due To Production Cut
($/t) 2013 2014 Q4-14 Q1-15 Q2-15TD* 2015(F)**
PX-ULG95 486 279 252 253 238
BZ-ULG95 289 268 207 101 171
Note: PX = Paraxylene, BZ = Benzene
Overall Market in Q1-15
- Weak downstream margin on weak Chinese economy
- Slow US buying interest due to weak BZ price following weak crude price
+ Cut run of PX plants due to soft margin
+ Improved PTA margin on rising polyester demand
PX:
BZ:
Factor to Watch for 2015…
- Bearish downstream demand on weak margin
+ Lower BZ production following reduction of PX run rate
+ PX plants reduce operating rate
+ New PTA capacity (5.6 MTA) will help support PX market
- New PX plants (3.5 MTA) start-up in Q2 and Q3’15
PX:
BZ:
Aromatics
Remark : *as of 7 Apr 15 , **Compared to 2014

-54-
BASE OIL & BITUMEN

-55-
-200
0
200
400
600
Jan-12 Jul-12 Jan-13 Jul-13 Jan-14 Jul-14 Jan-15
$/ton
Gr.III vs Gr.I
Gr.II vs Gr.I
200
400
600
800
Jan-12 Jul-12 Jan-13 Jul-13 Jan-14 Jul-14 Jan-15
$/ton
500SN-HSFO
150SN-HSFO
Weak Base Oil Prices
478 • Lower 150SN and 500SN
spreads due to Gr.II supply
surplus
374
495 374
2014 YTD-15*
Key Factors
(5) 33
102 417
2014 YTD-15*
• Widening Gr.II and Gr.III over
Gr.I supported Gr.I market
Key Factors
Base Oil & Bitumen
*As of 13 Feb 2015

-56-
200
350
500
650
800
Jan-12 Jul-12 Jan-13 Jul-13 Jan-14 Jul-14 Jan-15
$/ton
Bitumen
HSFO
-200
-100
0
100
200
Jan-12 Jul-12 Jan-13 Jul-13 Jan-14 Jul-14 Jan-15
$/ton
Bitumen-HSFO
Weak Fuel Oil Support Bitumen Spread
• Positive spread due to
weakening fuel oil price in
Q4-2014
Key Factors
527 337
2014 YTD-15*
561 308
(32) 28
2014 YTD-15*
Base Oil & Bitumen
*As of 13 Feb 2015

-57-
Abundant Supply to Pressure Base Oil Prices
($/t) 2013 2014 Q4-14 Q1-15 Q2-15TD* 2015(F)**
500SN-HSFO 485 495 493 370 406
Bitumen-HSFO (14) (32) 85 24 41
Factor to Watch for 2015…
+ Steady regional demand, especially from Indonesia and Vietnam
- Increasing HSFO price, following crude price, limits bitumen margin
- Continued Gr.II price competition
- Expansion of Exxon Mobil pressures market in Mar (1.2MTA to 1.6 MTA in Singapore)
Overall Market in Q1-15
- Additional capacity (1.28MTA) affected base oil market
+ Widening Gr.II over Gr.I supported Gr.I market
Base Oil & Bitumen
Bitumen:
Base oil:
Bitumen:
Base oil:
+ Firm regional demand especially from AEC infrastructure projects
Remark : *as of 7 Apr 15 , **Compared to 2014
-58-
CONCLUSION

-59-
2015 Market Conclusion
• Expected crude prices recovery in 2H15,
supported by declining non-OPEC production
• Additional supply from new refineries pressure
refinery margins
Refinery
Aromatics
Base Oil & Bitumen
Conclusion
• Stable PX spread due to production cut
• Soft SM downstream margin limited BZ demand
• Stable base oil spread due to widen Gr.II price
• Stable bitumen spread supported by firm regional
demand

-60-
Key Take Away Messages

-61-
Key Take Away Messages
Maximize Refinery Run to capture decent GRM
Flexible & Optimized Run for Aromatics & Base Oil
Maintain Regional 1st Quartile Cost Effectiveness
Prudent Risk Management Strategies
Sustain Strong Financial Discipline
Further Enhance Cost Management Program i.e.
2015 Key Focus
1.) Improve Energy Intensity Index (EII) i.e. 2014 EII @ 82.3point, every 1 EII reduction = energy saving 14.9 MW or 5.5 M$ (@Dubai 53$/bbl)
2.) Procurement Strategy i.e. PTT Group procurement plan to save cost, IT system to enhance process
3.) Negotiate service contract (operation & maintenance) i.e. contractor / service & consultant fees

-62-
Appendix
• Q4 & FY/14 Performance analysis
• World GRM / Inventory
• Thailand petroleum demand by products

-63-
Q4 & FY/2014 PERFORMANCE
ANALYSIS

-64-
Thai Oil Refinery : Superior Performance…
Q4/2014
TOP’s Refinery Utilization vs Industry TOP’s Refinery Crude sources & Product Output
102% 108%
98% 92% 92%
87%
2013 Q4/14 2014
TOP Refinery Overall Industry (Thailand)
TOP’s Domestic Sale vs Industry
84% 76% 81%
72% 83% 76%
16% 24% 19%
28% 17% 24%
FY/13 Q4/14 FY/14
TOP Industry TOP Industry TOP Industry
Domestic Sales Export Sales
Source : *Department of Energy Business, Ministry of Energy
FY/13 Q4/14 FY/14
Thailand Thailand Thailand
73%
9%
8%
11%
9%
37%
20%
17%
13%
4%
4%
41%
11%
17%
27% Far East
Local
Middle East
Sources of Crude
Others LPG
PLATFORMATE
GASOLINE
JET
DIESEL
FUEL OIL
Product output
Domestic demand for
petroleum products*
• Flexibility in crude intake allows diversification of crude types to source cheaper crude
• Flexibility in product outputs by maximizing middle distillates (jet and diesel) by adjusting production mode to capture domestic demand and price premium
• Maximize Platformate production to capture higher margin on aromatics
• Minimize fuel oil output to avoid lower margin products

-65-
2014 2015
$/bbl Q1 Q2 Q3 Q4 Q1 Q2TD
DUBAI (DB) 104.4 106.1 101.5 74.4 51.8 54.6
ULG95 - DB 14.6 16.1 13.2 13.4 15.5 16.3
JET - DB 17.0 14.3 14.5 17.7 17.0 14.1
GO - DB 17.8 16.0 14.4 16.0 16.3 14.7
HSFO - DB (8.5) (10.6) (8.4) (5.6) (1.9) (3.6)
104 105 104 105 106 108 106 102 96
87 76
60
46 55 55 55
40
60
80
100
120
Jan Feb Mar Apr May Jun Jul Aug Sep Oct Nov Dec Jan Feb Mar Apr
2014 2015
Q4/14:Robust Refining Margins…Offset by Huge Inventory Loss Refining
2014
$/bbl Q1 Q2 Q3 Q4
Marketing GRM 5.1 4.4 4.6 8.2
Stock G/(L) (1.7) 1.4 (5.2) (11.7)
Accounting GRM
3.4 5.8 (0.6) (3.5)
2013 2014
FY13 FY14
105.5 96.6
13.7 14.3
17.5 15.9
17.9 16.1
(8.0) (8.3)
Dubai Crude Price & Key Petroleum Product Spreads Refinery Utilization
2013 Q4/14 2014
102% 108% 98%*
Gross Refinery Margins - GRM
- Excess OPEC & Non OPEC supplies; High US shale oil production, Maintained OPEC production after OPEC meeting
- Sluggish demand; as weak world economy, IEA revised down 2015 global oil demand growth by 0.2 MBD to 0.9 MBD
Dubai
Benefits to Q4/14 TOP GRM
Dubai Price
(US$/bbl)
*CDU-3 MTA mid Jun to end Jul 14
2013 2014
FY13 FY14
4.3 5.7
0.8 (4.5)
5.1 1.2
*
* As of 7 Apr 15
• Margin improvement Projects 0.6 $/bbl
• Crude Premium ~1.2 $/bbl
• F&L 0.8 $/bbl
3.6$/bbl QoQ
Total 2.6$/bbl
-66-
353 273
191 180 191
290
381 415
317 242 248 266 290
251 224 238
340 285
232 241 228 293
333 372
275 270 229
122 120 56 119 171
0
200
400
600
800
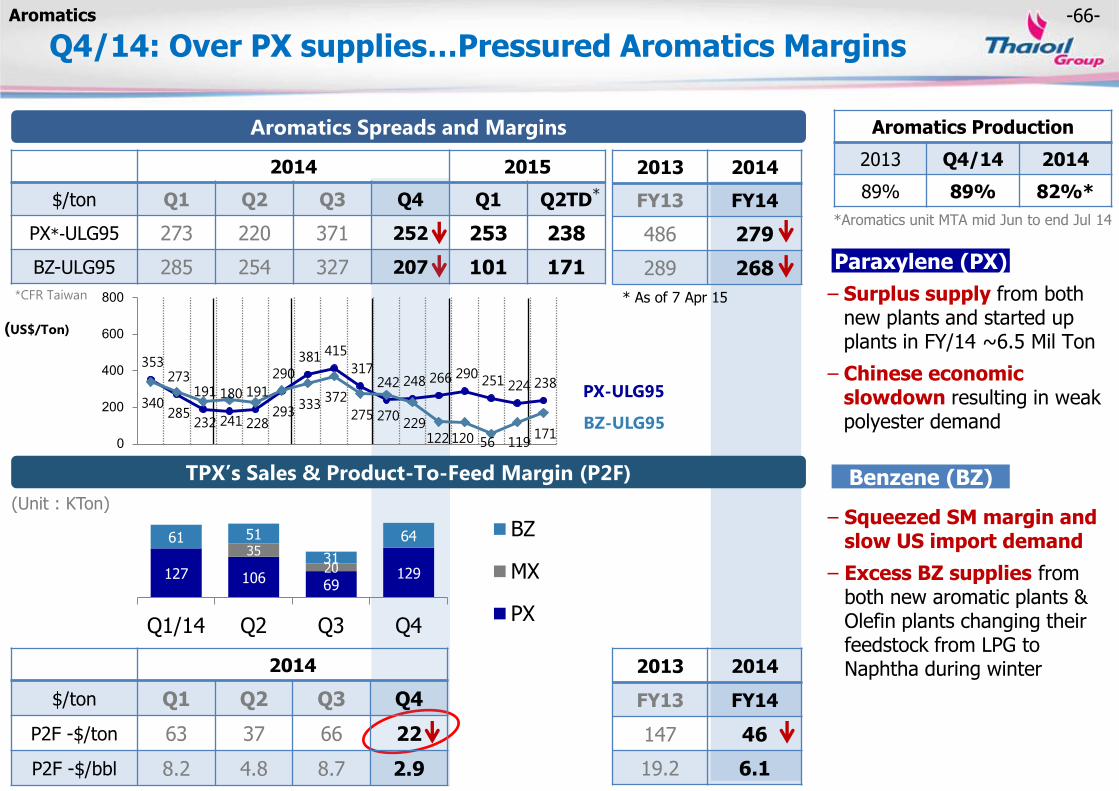
Q4/14: Over PX supplies…Pressured Aromatics Margins
Aromatics
127 106 69
129
35
20
61 51
31
64
Q1/14 Q2 Q3 Q4
BZ
MX
PX
Aromatics Spreads and Margins
TPX’s Sales & Product-To-Feed Margin (P2F)
Aromatics Production
2013 Q4/14 2014
89% 89% 82%*
(Unit : KTon)
(US$/Ton)
PX-ULG95
BZ-ULG95
Paraxylene (PX)
Benzene (BZ)
*CFR Taiwan
*Aromatics unit MTA mid Jun to end Jul 14
2013 2014
FY13 FY14
486 279
289 268
2013 2014
FY13 FY14
147 46
19.2 6.1
*
* As of 7 Apr 15 − Surplus supply from both new plants and started up plants in FY/14 ~6.5 Mil Ton
− Chinese economic slowdown resulting in weak polyester demand
− Squeezed SM margin and slow US import demand
− Excess BZ supplies from both new aromatic plants & Olefin plants changing their feedstock from LPG to Naphtha during winter
2014
$/ton Q1 Q2 Q3 Q4
P2F -$/ton 63 37 66 22
P2F -$/bbl 8.2 4.8 8.7 2.9
2014 2015
$/ton Q1 Q2 Q3 Q4 Q1 Q2TD
PX*-ULG95 273 220 371 252 253 238
BZ-ULG95 285 254 327 207 101 171

-67-
2014 2015
$/ton Q1 Q2 Q3 Q4 Q1 Q2TD
500SN-HSFO 486 501 500 493 370 406
BITUMEN-HSFO (69) (77) (66) 85 24 41
Q4/14: G II/III Price Competition…Soften Lube Margins Lube Base Oil
− Additional GII supply from US & South Korea triggering price war between GI & II
− Weak demand as buyers kept low stock during year end
+ Spread highly supported by soft fuel oil price
+ Resumed regional demand especially from Indonesia & Vietnam to expedite road repairs during year end
+ Spread supported by soft fuel oil price
493 483 486 506 505 492 497 501 507 534 454 490
430 312 366 406
(49) (78) (78) (68) (75) (90) (78) (74) (48) 32 76
145 73
(22) 19 41
-200
0
200
400
600
800
2014
$/ton Q1 Q2 Q3 Q4
P2F -$/ton 135 117 107 90
P2F -$/bbl 20.5 17.8 16.2 13.6
70 60 58 52 33 40 37 32
90 89 87 93
Q1/14 Q2 Q3 Q4
Bitumen
TDAE/Extract/Slack Wax
Base Oil
Base Oil & Bitumen Spreads & Margins
TLB’s Sales & Product-To-Feed Margin (P2F)
Base oil Production
2013 Q4/14 2014
102% 80% 92%*
500SN-HSFO
Bitumen-HSFO
Lube Base Oil
Bitumen
(US$/Ton)
(Unit : KTon)
*Base oil unit T/A in end-Sep 14
2013 2014
FY13 FY14
485 495
(14) (32)
2013 2014
FY13 FY14
144 112
21.9 17.1
*
* As of 7 Apr 15

-68-
18.0 20.1 24.0 25.0 20.5 17.8 16.2 13.6 21.9 17.1
Q1/13 Q2 Q3 Q4 Q1/14 Q2 Q3 Q4 FY/13 FY/14
5.3 2.0
8.6
3.3 3.3 5.6
(0.6) (3.3)
4.9 1.1
2.0
1.4
1.9
2.1 0.4
0.0
0.4
(0.3)
1.8
0.1
0.5
0.8
1.2
1.0
0.8
0.8
0.7 0.4
0.9
0.7
7.7 4.2
11.7
6.4 4.5
6.4
0.5
(3.2)
7.6
1.9
TOP TPX TLB GIM
Q1/13 Q2 Q3 Q4 Q1/14 Q2 Q3 Q4 FY/13 FY/14
Beauty of Integration…Sustainable GIM
(Unit: US$/bbl)
Marketing GIM Accounting GIM
Crude
Product to Feed
Product to Feed
Marketing GRM (excluded stock gain / loss)
(Unit: US$/bbl) (Unit: US$/bbl)
Performance Breakdown
6.4 3.4
4.8 1.8
4.9 4.2 4.4
7.9
4.1 5.4
2.0
1.4 1.9
2.1
0.4 0.0 0.4
(0.3)
1.8 0.1
0.5
0.8
1.2
1.0
0.8 0.8 0.7
0.4
0.9 0.7
8.8
5.6
7.9
4.9 6.1
5.1 5.5
8.0
6.8 6.2
TOP TPX TLB GIM
6.6 3.6 5.0
1.9 5.1 4.4 4.6
8.2 4.3 5.7
Q1/13 Q2 Q3 Q4 Q1/14 Q2 Q3 Q4 FY/13 FY/14
20.3 16.5 18.6 21.6
8.2 4.8 8.7 2.9
19.2
6.1
Q1/13 Q2 Q3 Q4 Q1/14 Q2 Q3 Q4 FY/13 FY/14
Q1/13 Q2 Q3 Q4 Q1/14 Q2 Q3 Q4 FY/13 FY/14

-69-
Q4 & FY/2014: Performance Breakdown
Q1/14 1,929 (161) 437 43 39 64 71 72 2,534 (1,433) 3,967
Q2/14 1,729 (397) 337 51 63 (13) 57 204 2,094 1,074 1,020
Q3/14 (2,500) (276) 240 56 (15) (4) 52 219 (2,175) (4,290) 2,115
Q4/14 (6,188) (633) 98 11 3 10 93 89 (6,479) (12,252) 5,773
FY/14 (5,030) (1,467) 1,112 98 153 57 273 591 (4,026) (16,890) 12,864
98%
82% 92% 91% 92%
85% 89% 102% 89%
102%
130%
88% 76%
88%
FY/14 FY/13
*Since Q3/14 onwards, 2014 SAKC capacity = 141 KTA / 2013 SAKC capacity = 76 KTA ** Apply on an equity accounted basis in the consolidated financial statement.(GPSC has been hold by TOP 11.88% and TP 27.71% since 10 Jan 13) ***TP performance are based on TOP’s equity portion (excluding 27.71% shares of profit from the investment in GPSC). TOP hold TP 74% since 4 Dec 12
Refinery Aromatic Lube Solvents Marine Ethanol Power
Performance Breakdown
Consol Stock G/(L) & NRV
Consol Excl Stock G/(L) & NRV
*
Key Points • TOP/ TPX/ TLB: Lower intake
due to CDU-3 & aromatics complex planned MTA (15 Jun-end July 14) & Lube planned S/D during Sep 14
• TS: Completion of capacity expansion but drop in gross profit margins pressured by slow demand & higher regional competition
• TM: Drop in contribution from the dry docking of the VLCC
• TET: Higher ethanol sale as rising domestic gasohol demand but soften margins
• TP: Better contribution from higher run rate & rising Ft rate
** 32.39% holding
Utilization/Production (%) & Net Profit (million THB)
*** 74% holding
1,172

-70-
32.62 30.87 1.75
33.11 32.95 0.16
N/A 10% N/A
THB/US$ - average 32.85 32.24 31.83 0.61
THB/US$ - ending 33.11 32.52 32.95 0.59
Effective Tax Rate (%) * N/A N/A N/A N/A
(16,890) 2,624 (19,514)
12,864 6,692 6,172
Stock G/(L) & NRV (12,252) (4,290) 1,247 (7,962)
Net Profit/ (Loss) excl. Stk G/(L) and NRV
5,773 2,115 (1,237) 3,658
Consolidated Financial Performance Financial
(million THB) Q4/14 Q3/14 Q4/13R QoQ+/(-) FY/14 FY/13R YoY+/(-)
390,090 414,575 (24,485)
2,218 1,292 926
2,651 22,337 (19,686)
19,541 19,713 (172)
(3,966) (3,786) (180)
996 (3,111) 4,107
920 (1,160) 2,080
(4,026) 9,316 (13,342)
(1.97) 4.57 (6.54)
R Restated financial statement . As on 1 January 2014, Thaioil Group adopted Thai Financial Reporting Interpretations Committee 4 (TFRIC4) on determining whether an arrangement contains a lease.
*redeemed BOI privilege for tax exemption on environmental projects in Q4/14 ,= 0 MB, Q3/14 = 0 MB, FY/14 = 0 MB, FY/13 = 640 MB
Sales Revenue 88,545 88,254 107,952 291
Hedging Gain 328 695 388 (367)
EBITDA (5,373) (545) 4,257 (4,828)
EBITDA excl. Stk G/(L) 6,880 3,745 3,010 3,135
Financial Charges (992) (1,004) (968) 12
FX G/(L) & CCS (548) 561 (1,815) (1,109)
(Tax Expense)/reversal 1,451 118 (217) 1,333
Net Profit / (Loss) (6,479) (2,175) 10 (4,304)
EPS (THB/Share) (3.18) (1.07) 0.00 (2.11)

-71-
Free Cash Flow 4,086 (10,111)
FY/2014 Consolidated Cash Flow
Beginning
cash 15,303
S/T investment 28,512
43,815
2014 2013
Operating Cash Flow 24,432 16,131
Net income & non-cash adj. 7,762 24,882
Change in working capital 16,670 (8,751)
+
+ =
+
2014 2013
Investments (20,346) (26,242)
ST investments (1,734) (11,129)
CAPEX (PP&E) & other (18,612) (15,113)
Ending
16,237
30,246
46,483
Effect of FCD
(77)
+ Change
1,011
Financing (3,075) 16,616
Loans proceeding / (repayment)
4,985 25,953
Dividends paid (4,242) (6,269)
Interest (3,818) (3,068)
Operating Cash Flow Investments
Financing
Financial
(Unit: Million THB) (Unit: Million THB)

-72-
• World GRM / Inventory
• Thailand petroleum demand by products

-73-
Asian Margin Vs. US-EU margin
Source: EIA, Norwegian Energy, Thai Oil
Total Capacity: 4.9 MBD
91.0% 63.4% 73.8%
Total Capacity: 17.5 MBD Total Capacity: 17.0 MBD

-74-
Crude Inventory
Source: Norwegian Energy

-75-
Global Distillate Inventory
Source: Norwegian Energy
-76-
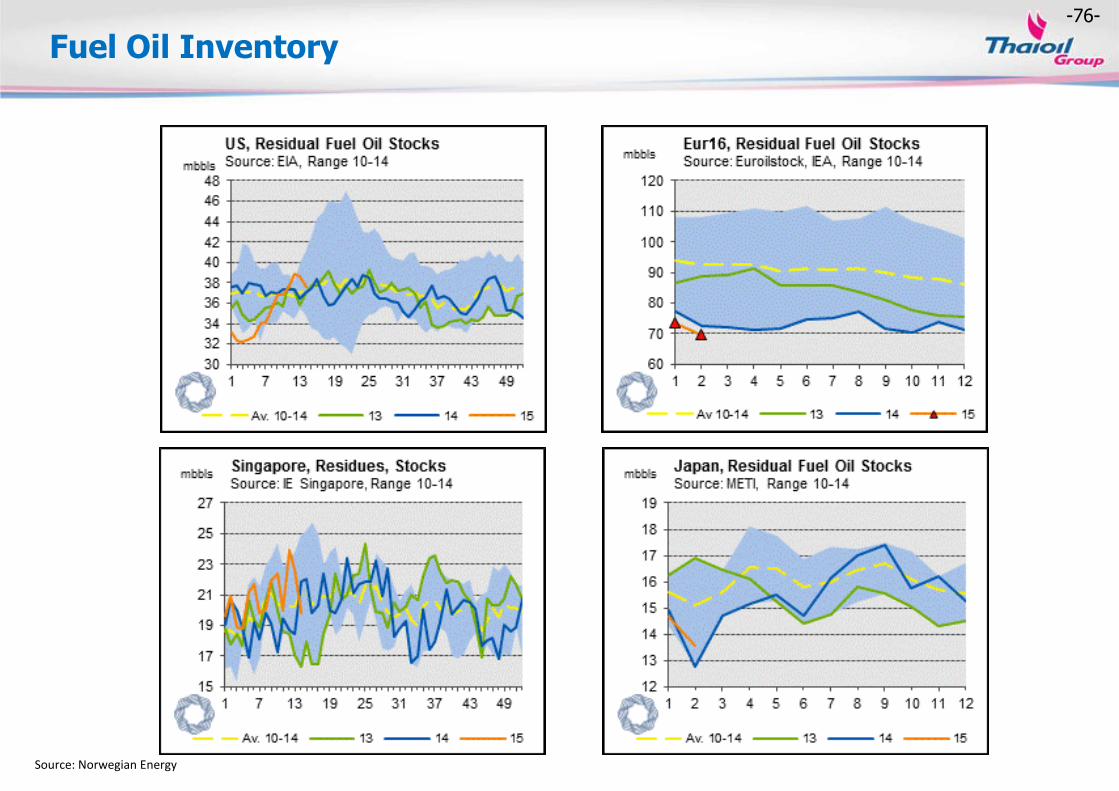
Fuel Oil Inventory
Source: Norwegian Energy

-77-
China’s Product Export
Source: Norwegian Energy

-78-
Domestic LPG Demand
LPG Demand by Sector
LPG Demand Highlight
• In 2014 LPG demand slightly declined by 0.2% YoY as pressured by low usages in cooking, industrial and petrochemical sectors. Consumptions in cooking and industrial sector were limited by increased retail price to reflect real cost and weak Thailand economic activities. However, usages in automobile sector significantly increased as a result of new registered LPG cars.
Outlook for 2015
• LPG demand is expected to grow by 2.9% YoY supported by the expectation of higher demand in auto and cooking sectors following an improving economic.
• However, LPG demand growth was expected to limit by increased of LPG price to reflect market price.
Thailand LPG Demand
Remark : Include Petrochemical and own used consumption
-79-
Domestic Gasoline Demand
Source : Department of Energy Business, Ministry of Energy
Gasoline Demand by Grade
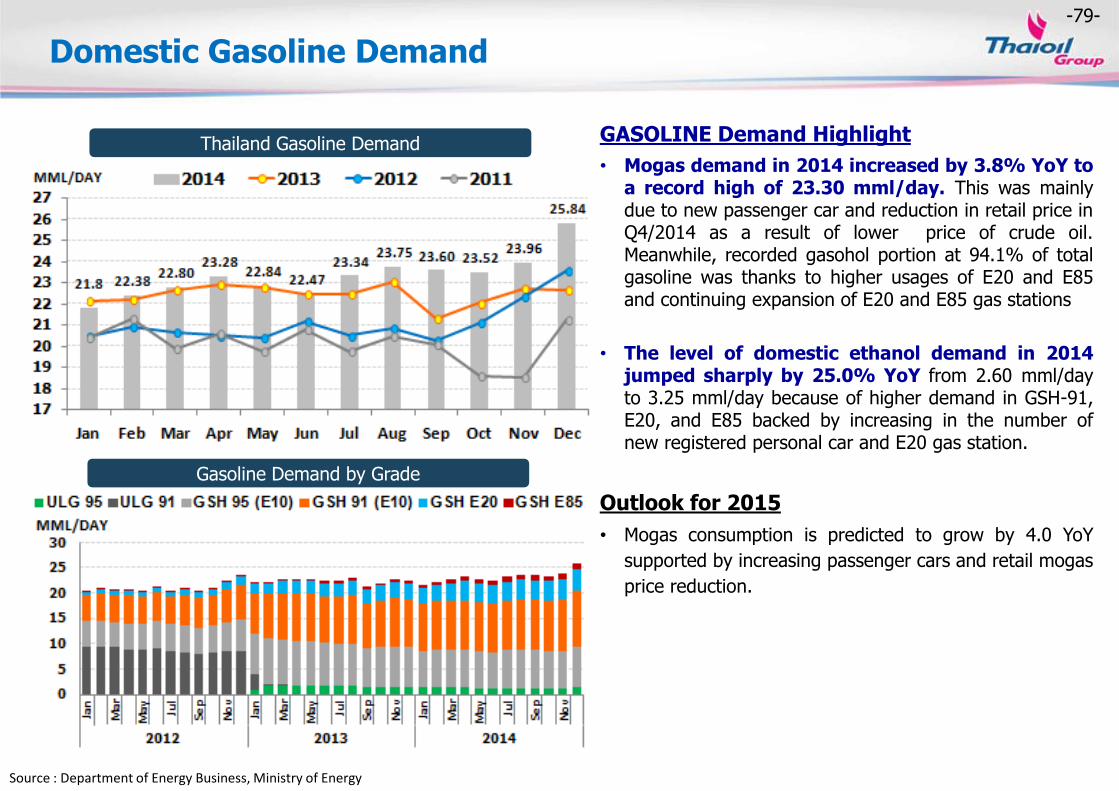
Thailand Gasoline Demand GASOLINE Demand Highlight
• Mogas demand in 2014 increased by 3.8% YoY to a record high of 23.30 mml/day. This was mainly due to new passenger car and reduction in retail price in Q4/2014 as a result of lower price of crude oil. Meanwhile, recorded gasohol portion at 94.1% of total gasoline was thanks to higher usages of E20 and E85 and continuing expansion of E20 and E85 gas stations
• The level of domestic ethanol demand in 2014 jumped sharply by 25.0% YoY from 2.60 mml/day to 3.25 mml/day because of higher demand in GSH-91, E20, and E85 backed by increasing in the number of new registered personal car and E20 gas station.
Outlook for 2015
• Mogas consumption is predicted to grow by 4.0 YoY
supported by increasing passenger cars and retail mogas
price reduction.

-80-
JET Demand Highlight
• In 2014 Jet consumption marginally decreased by 1.0% YoY mainly due to the concern of politic situation in Thailand during May-Jul 14 and weakening global economic growth especially in Russia which has resulted from declining oil price and economic sanction from US and EU. However, downside was limited by the increased number of flight movement especially from domestic aircraft movement and stability situation in Thailand in Dec-14.
Outlook for 2015
• Jet demand growth is expected to surge by 3.2 YoY owing
to returning tourists from improving global economy and
stable politic situation in Thailand.
Domestic Jet Demand
Source : Department of Energy Business, Ministry of Energy / AOT
Thailand JET-A1 Demand
JET-A1 demand and # of flights

-81-
Diesel Demand Highlight
• In 2014 Diesel demand rose by 0.9% YoY. as
supported by increased transportation demand and retail
fuel price reduction in Q4/14. However, demand growth
was limited by the slow growth of Thailand economy
especially in Manufacturing sector, which has affected by
declined export orders and slowly-than-expected
improvement of domestic orders.
Outlook for 2015
• Diesel demand in 2015 is expected to expand by 1.1%
YoY supported by reducing retail price and increasing
new commercial car sales. However, gasoil demand was
limited gain by concerns on in-recovery of Thailand’s
export sector.
Domestic Gasoil Demand
Source : Department of Energy Business, Ministry of Energy
NGV Demand Highlight
• In 2014 NGV demand increased by 3.2% YoY to 8.8
KT/day thanks to switching on fuel engines, new register
cars and price attractiveness over gasoline and diesel.
Thailand Gasoil Demand
NGV Demand

-82-
Domestic Fuel Oil Demand
FUEL OIL Demand Highlight
• In 2014, Fuel Oil consumption significantly fell by
3.9% YoY. because of lower demand in electrical sector
which has resulted from fuel switching toward Natural gas
and alternative energy. Moreover, demand in transportation
also declined as a result of lower shipping activities.
Outlook for 2015
• Fuel oil demand is expected to dropped by 4.7% YoY
following the government power develop plan (PDP) that
aim to promote alternative fuel. Moreover, power plant also
alternate to use natural gas instead of fuel oil thanks to
lower price.
Source : Department of Energy Business, Ministry of Energy
Thailand Fuel Oil Demand by Sector
Thailand Fuel Oil Demand

-83-
Thank You
Any queries, please contact:
at email: [email protected]
Tel: 662-797-2999 / 662-797-2961
Fax: 662-797-2976


![PTT Multicasting Scheme [호환 모드] · 2 New PTT Group Add by Mouse right button click 3PTTGrouppg Name Setting 4 PTT Group Number Setting 5 PTT Server Setting 6 PTT Group Session](https://static.fdocuments.in/doc/165x107/5f727989ade5745a8a06acb0/ptt-multicasting-scheme-eeoe-2-new-ptt-group-add-by-mouse-right-button.jpg)


