THAI IN DIASPORA: LANGUAGE AND IDENTITY A DISSERTATION...
199
THAI IN DIASPORA: LANGUAGE AND IDENTITY IN LOS ANGELES, CALIFORNIA A DISSERTATION SUBMITTED TO THE GRADUATE DIVISION OF THE UNIVERSITY OF HAWAI‘I AT MĀNOA IN PARTIAL FULFILLMENT OF THE REQUIREMENTS FOR THE DEGREE OF DOCTOR IN PHILOSOPHY IN LINGUISTICS AUGUST 2015 By Kanjana Thepboriruk Dissertation Committee: Patricia Donegan, Chairperson Victoria Anderson Michael L. Forman Yuphaphann Hoonchamlong Lucia Aranda Keywords: Thai, tones, diaspora, ethnic identity, stance
Transcript of THAI IN DIASPORA: LANGUAGE AND IDENTITY A DISSERTATION...

THAI IN DIASPORA: LANGUAGE AND IDENTITY
IN LOS ANGELES, CALIFORNIA
A DISSERTATION SUBMITTED TO THE GRADUATE DIVISION OF
THE UNIVERSITY OF HAWAI‘I AT MĀNOA IN PARTIAL FULFILLMENT OF THE
REQUIREMENTS FOR THE DEGREE OF
DOCTOR IN PHILOSOPHY
IN
LINGUISTICS
AUGUST 2015
By
Kanjana Thepboriruk
Dissertation Committee:
Patricia Donegan, Chairperson
Victoria Anderson
Michael L. Forman
Yuphaphann Hoonchamlong
Lucia Aranda
Keywords: Thai, tones, diaspora, ethnic identity, stance

© Copyright 2015, Kanjana Thepboriruk All rights reserved.

i
FOR MY MOTHER, NANTANA,
WHO SAID NOT TO TALK BACK UNTIL I GET A PH.D.

ii
‘A‘ohe hana nui ke alu‘ia
NO TASK IS TOO BIG IF DONE TOGETHER BY ALL
This project was truly a group effort. None of it would have been possible without the
cooperation of the Thai community in Los Angeles and the mothers and daughters who
participated in this study. I am a child the academic upbringing at three fantastic universities. I
owe my development as a scholar to my teachers at the University of Wisconsin in Madison, WI:
อาจารย ดร.ธงช ย ว น จก ล , อาจารย ดร. Bob Bickner, and those at the Linguistics Department; at the
Department of Linguistics at จ ฬาลงกรณ มหาว ทยาล ย : อาจารย ดร.ธ ระพ นธ เหล องทองค า , อาจารย ดร.ปารณ ก ลละ
วณ ชย , อาจารย ดร.อมรา ประส ทธ ร ฐส นธ # , and อาจารย ดร. ม.ร.ว. ก ลยา ต งศภ ท ย who all set the bar very high for
quality of research and academic rigor. Thank you to my uncles and aunties at the UW-Madison
Center for Southeast Asian Studies who watched me grow from a nine-year old fresh from
Thailand into to the scholar that I am today. ขอขอบพระค ณ เป นอย างย ง + ค ะ
Mahalo nui loa to the Department of Linguistics at the University of Hawai‘i at Mānoa
for their belief in me as a person and as a scholar through their generous funding and logistical
support. Aloha and mahalo nui to my advisor and committee chair, Dr. Patricia Donegan for
giving me the time to explore and meander, for your sense of humor, infinite patience, and gentle
pushing (sorry I had a coffee shop for three years!). Much mahalo to Dr. Victoria Anderson for
your phonetic and technological guidance with my frenemy Praat. ขอขอบพระค ณ อาจารย ดร. ยพาพรรณ
หนจาลอง for not only hosting me in her lovely home on several occasions, but for also being the
one who first noticed the anachronisticity of my tones that ultimately led to this dissertation.
Mahalo nui loa to Dr. Mike Forman and Dr. Lucia Aranda for their loving guidance and for
showing me what kind of teacher I want to be. Any and all deadlines that were met were due to
the diligence of our department administrators Jen Kanda and Nora Lum, despite all I did to
hinder their tasks.
I am only as good as the company I keep. I am lucky to have an unbelievable group of
friends who are dizzyingly successful. My deepest gratitude to my best friend, Alyona
Topolianskaya, whose humor and friendship has firmly kept me grounded and honest since 1991.
Thank you to all the sons my mom was happy to adopt: Adam Funk, Jon Braun, and James
Thompson, we’ve been through too much and y’all know too much; to Nathaniel Kritzer, Esq.
for letting me be your friend and for being an unflinching bearer of the truth that I sometimes

iii
refuse to see; to Garrett Holthaus for being a faithful friend to me for 20 years, for the honor of
being a groomswoman at your wedding, and for never judging me. To Amy Lopez, Lindsay
Gonzalez Torres, and Dr. Akiemi Glenn, thank you for endless nights of dancing, your
friendship, support, and encouragement through everything. Infinite love to my two life-twins:
Frans Abarillo and Emily Lee; for showing me that I am not alone this world.
Thank you to my Thai-Am academic family: Thank you to Dr. Mark Padoongpatt for
being the first of us to finish and setting the bar real high with your tenure-track job (holla!); to
Dr. Daniel Soodjinda for doing the work that matters, I’m waiting for our collaboration, son!; to
พ + Siwaraya Rochanahusdin, and น องๆ (and soon to be PhDs) Pahole Sookkasikon and Wanda
Pathomrit for reminding me of the reason why we do what we do; to Virada Chatikul for your
support, to all for going along with my nefarious plans for the Thai-American Panels at AAAS.
Thank you to my LA family who made this new girl in town feel right at home: Candy
Krajangsri, Phillip Sriployrung, Danny Dechartivong; to Dr. Sarah Grant, Mom Beverly Grant
and Grandma Elenor Sorkin for hosting me in your home; to ค ณป า นงเยาว of THAIS, Inc. and
Khun Chancee of Thai CDC for leading by example. Aloha nui to my UH friends who nourished
my soul with innumerable shared meals and laughs, Jake Terrell, Dr. Karen Huang, Dr. Kaori
Ueki, Dr. Laura Robinson, James Crippen, Katya Jensen, Dr. Nian Liu, Dr. Carl Polley. Special
thanks to Dr. Bryce Beemer who’s been my academic big brother since our UW days.
The academic conference tour of 2010-2011 was made possible by the generous
donations through crowdfunding from those who, for whatever reasons, believed in me: Bert &
Amelia Kritzer, Nate & Sonia Culwell-Kanarek, Garrett Holthaus, Evelyn Velasquez, Rob
Latousek, Jim Yoshioka, Jon Braun, Andrew Merz, Nathaniel Kritzer, Sara Olson, Emmet
Quinn, Nat Bletter, Robyn Lopez, Rider Sporn, Aunt Katherine Kirlin, and Dr. LaRene Despain.
Thank you for sending the checks and making all those paypal contributions!
I am fortunate to have several families: the Lamarts, the Thepboriruks, the Slatters, and
the Hubiks who are the glue that keeps this human in one piece. My mom, Nantana, inspires me
to do my best, always improve, and work hard. She is the example I live by in so many ways. My
entire life, I owe to her. She also had the good sense to fall in love and eventually marry my dad,
Hyde Slatter, without whose love for reading, writing, cooking, and Star Trek I would not be the
person that I am today. I hope learning to be my dad wasn’t too traumatic! My beautiful and

iv
fantastic sister, Weerawanna (พ โอ + ), is my greatest champion and protector in life. Thank you for
being my second mom and the top standard during my formative years. My biological father,
Veera, whose recent return to my life reaffirms my faith in family and love. To my eldest aunt
who raised me: ขอขอบพระค ณค ณป าอ อด เป นอย างย ง + ท ได เล ยงหลานคนน ให เป นคนด ม น าใจ และท ได เป นต วอย างให หน + 3 3 3 +
ตลอด ว าคนด ม ธรรมต องปฏ บ ต ต วอย างไร Thank you for being my true home and hearth. Thank you to all
the Slatters for being my extended family when I had none in the United States and for showing
your love through the universal medium of home-cooked meals when we had no other way to
effectively communicate. Big hugs to the whole Hubik family who warmly welcomed this city
mouse into your loving family like I’ve always been there. Tom, thank you for being a loving
dad to me during the few years we had together before you left us. We miss you.
This whole thing, me included, would have fallen apart if it wasn’t for my amazing
partner, Ian Hubik. Thanks for letting me be me (all the time) and picking me up from the ground
over and over again; for dusting dirt of my shoulder when I didn’t have it in me to do it myself;
for being the patron of this dissertation; for your critical eye for quality and unfailing logic; for
giving me space to complete this project but somehow always being right next to me every step
of the way; for always being there when I come back from wherever I was off to for days, weeks,
and months; for financially supporting this broke grad student; in other words, for everything.
The wind blew us both to the same valley of the same island in the middle of the ocean at the
perfect time to sail into each other’s lives and to make each other happy. You’re unparalleled
with your sheer intelligence and mind-blowing ability to solve any problem you encounter.
Words are stupid and will never express how I feel. I love you.

v
ABSTRACT
Over 200,000 people self-reported as Thai in the last nation-wide US Census, a nearly
60% increase from the previous decade. Los Angeles has the largest concentration of Thais
outside of Thailand, with local organizations estimating up to 80,000 Thais living in LA County.
This study is the first examination of Thai language and identity in the diaspora. The study is in
two parts: first, a phonetic analysis and second, a discourse analysis. The phonetic analysis is a
four-way comparison of Thai lexical tones in mother-daughter pairs in LA and Bangkok (BKK)
with data collected from wordlist readings. Studies have determined lexical tones to be salient
markers for linguistic innovation in younger BKK speakers (Panroj 1990, Teeranon 2007,
Thepboriruk 2010). Results show that BKK mothers and daughters have differences in tone pitch
range, location of pitch peaks, and pitch heights of the tone onsets and offsets. Tones for LA
daughters, however, more closely resemble the tones for LA mothers, with similar pitch range,
pitch differences, and with the pitch peaks occurring at approximately the same places in the tone
duration. BKK mothers and daughters have the expected generational differences in their tones
that were not found in the LA group.
The LA group is more linguistically conservative when compared with their peers in
Thailand with the LA teen speakers not serving as the linguistic innovators in their Thai-
speaking community. The second part of the study is a discourse analysis of the linguistic stances
taken by LA teen speakers during personal interviews, more specifically, their choice of
pronouns when referring to the Thai people and community. LA teens take three types of stance:
1) alignment where the speaker shows psychological proximity by using ‘we’ when referring to
the Thai community; 2) disalignment where the speaker shows psychological distance by using
‘they’ when referring to the Thai community; and 3) double disalignment where the speaker
shows psychological distance from both Thais and Americans by using ‘they’ or the null
pronoun form to refer to both groups. The double disalignment stance is taken, for example,
when the speaker makes comparisons between Thais and Americans. The tonal conservatism
found in LA teens can be attributed to both the importance of linguistic proficiency in their
ethnic identity construction and their linguistic role models who are the community elders,
particularly their mothers; whereas the teens in BKK do not model their speech after their elders.
In conclusion, the tonal conservatism in the LA community is a phonetic reflection of the overall
efforts by the LA speakers, particularly the teens, to construct their Thai identity and maintain
membership in the Thai diaspora.

vi
LIST OF TABLES
Table 1. The five Thai tones and names used in previous studies. .............................................. 20
Table 2. Tone trajectories of younger speakers and older speakers from .................................... 26
Table 3. Speaker information for LA participants. ..................................................................... 34
Table 4. Speaker information for BKK participants. .................................................................. 35
Table 5. The wordlist. ............................................................................................................... 37
Table 6. Summary of tonal features for LA speakers. ................................................................ 86
Table 7. Summary of tonal features for BKK speakers. ........................................................... 127
Table 8. Summary of tonal features for all speakers. ................................................................ 130
Table 9. LA interview participants. ......................................................................................... 134

vii
LIST OF FIGURES Figure 1. Map of Thailand with Central region outlined. ........................................................... 19
Figure 2. Siamese Tones from Bradley (1909, xcvi). ................................................................. 21
Figure 3. Average tone curves on double vowels for Standard Thai from Figure 3.6 in Abramson
(1962, 127). The diacritic /ˊ/ denotes the Tone 4; /ˆ/ denotes the Tone 3; /˚/ denotes the Tone 1;
/ˇ/ denotes the Tone 5; and /ˋ/ denotes the Tone 2. ..................................................................... 22
Figure 4. Mean F0 trajectories of Thai tones from Potisuk et al. (1994, 11) ............................... 24
Figure 5. Pitch trajectories of Thai tones in citation form Morén and Zsiga (2006, in Zsiga and
Nitisaroj 2007, 347) .................................................................................................................. 25
Figure 6. Average pitch trajectories for younger speakers from Thepboriruk (2010, 95) ............ 26
Figure 7b. Pitch trajectories for speakers twenty and under (Teeranon 2007, 9) ......................... 27
Figure 8. Examples of slides used to elicit the wordlist. ............................................................. 36
Figure 9. Token segmentation for 12. หมาก /ma:k2/ for MLA1 ................................................... 38
Figure 10. Token segmentation for 19. ฐาน /tʰa:n5/ for MLA1. ................................................... 39
Figure 11. Average pitch trajectories for speaker MLA1. .......................................................... 41
Figure 12. Average pitch trajectories for Tone 1 for MLA speakers. .......................................... 42
Figure 13. Average pitch trajectories for Tone 2 for MLA speakers. .......................................... 44
Figure 14. Average pitch trajectories for Tone 3 for MLA speakers. .......................................... 46
Figure 15. Average pitch trajectories for Tone 4 for MLA speakers. .......................................... 49
Figure 16. Average pitch trajectories for Tone 5 for MLA speakers. .......................................... 51
Figure 17. Average pitch trajectories for all tones for MLA speakers......................................... 54
Figure 18. Average pitch trajectories for Older Speakers (50+) from Thepboriruk (2010, 94) .... 55
Figure 19. Average pitch trajectories for each MLA speakers. ................................................... 59
Figure 20. Average pitch trajectories for Tone 1 for TLA speakers. ........................................... 61
Figure 21. Average pitch trajectories for Tone 2 for TLA speakers. ........................................... 64
Figure 22. Average pitch trajectories for Tone 3 for TLA speakers. ........................................... 67
Figure 23. Average pitch trajectories for Tone 4 for TLA speakers. ........................................... 69
Figure 24. Average pitch trajectories for Tone 5 for TLA speakers. ........................................... 73
Figure 25. Average pitch trajectories for all tones for TLA speakers.......................................... 75
Figure 26. Average pitch trajectories for MLA and TLA speakers. ............................................ 77
Figure 27. Average pitch trajectories for Younger speakers from Thepboriruk (2010, 95) ......... 78
Figure 28. Tone 1 for LA speakers. ........................................................................................... 79
Figure 29. Tone 2 for LA speakers. ........................................................................................... 81
Figure 30. Tone 3 for LA speakers. ........................................................................................... 82
Figure 31. Tone 4 for LA speakers. ........................................................................................... 83
Figure 32. Tone 5 for LA speakers. ........................................................................................... 84
Figure 33. Average pitch trajectories for Tone 1 for MBK speakers. ......................................... 87
Figure 34. Average pitch trajectories for Tone 2 for MBK speakers. ......................................... 89
Figure 35. Average pitch trajectories for Tone 3 for MBK speakers. ......................................... 91
Figure 36. Average pitch trajectories for Tone 4 for MBK speakers. ......................................... 93
Figure 37. Average pitch trajectories for Tone 5 for MBK speakers. ......................................... 95

viii
Figure 38. Average pitch trajectories for all tones for MBK speakers. ....................................... 96
Figure 39. Average pitch trajectories for Tone 1 for TBK speakers............................................ 97
Figure 40. Average pitch trajectories for Tone 2 for TBK speakers.......................................... 100
Figure 41. Average pitch trajectories for Tone 3 for TBK speakers.......................................... 102
Figure 42. Average pitch trajectories for Tone 4 for TBK speakers.......................................... 104
Figure 43. Average pitch trajectories for Tone 5 for TBK speakers.......................................... 106
Figure 44. Average pitch trajectories for TBK speakers. .......................................................... 108
Figure 45. Average pitch trajectories for BKK speakers. ......................................................... 109
Figure 46. Tone 1 for BKK speakers. ...................................................................................... 110
Figure 47. Tone 1 for all speakers. .......................................................................................... 111
Figure 48. Tone 2 for BKK speakers. ...................................................................................... 112
Figure 49. Tone 2 for all speakers. .......................................................................................... 113
Figure 50. Tone 3 for BKK speakers. ...................................................................................... 115
Figure 51. Tone 3 for all speakers. .......................................................................................... 116
Figure 52. Tone 4 for BKK speakers. ...................................................................................... 118
Figure 53. Tone 4 for all speakers. .......................................................................................... 119
Figure 54. Tone 5 for BKK speakers. ...................................................................................... 121
Figure 55. Tone 5 for all speakers. .......................................................................................... 122
Figure 56. Comparison of average pitch trajectories for teens in BKK and LA. ....................... 124
Figure 57. Comparison of average pitch trajectories for mothers in BKK and LA. ................... 124
Figure 58. Comparison of average pitch trajectories for all groups of speakers. ....................... 125
Figure 59. Speaker positionality in relation to text, audience, and context. .............................. 135
Figure 60. The multi-directional and recursive relationship between stance, social and cultural
ideology, and linguistic features. ............................................................................................. 136
Figure 61. Wordlist slides (from top left to bottom right): Frame sentence; 1. หา /ha:5/ ‘to look
for’; 2. ผ า /pʰa:2/ ‘to split’; 3. มา /ma:1/ ‘to come’; 4. ชาต /ʨʰa:t3/ ‘nation’; and 5. ท า /tʰa:4/ ‘to
challenge, compete’ ................................................................................................................ 171
Figure 62. Wordlist slides: 6. จ า /ʨa:5/ ‘a nickname’; 7. ผ า /pʰa:3/ ‘cloth’; 8. อา /ʔa:1/ ‘paternal
younger uncle/aunt’; 9. ม า /ma:4/ ‘horse’; 10. ถาด /tʰa:t2/ ‘tray’; and 11. ห า /ha:3/ ‘five’ ........... 172
Figure 63. Wordlist slides: 12. หมาก /ma:k2/ ‘betel’; 13. หน า /na:3/ ‘face’; 14. ค า /kʰa:4/
‘commerce’; 15. คา /kʰa:1/ ‘tall coarse grass’; 16. ชา /ʨʰa:1/ ‘tea’; and 17. (มา)ม า /ma:3/ ‘a popular
brand of instant noodles’ ......................................................................................................... 173
Figure 64. Wordlist slides: 18. หาด /ha:t2/ ‘beach’; 19. (น อย )หน า /na:2/ ‘apple custard’; 20. ฐาน
/tʰa:n5/ ‘pedestal’; 21. ช า /ʨʰa:4/ ‘slow’; 22. พา /pʰa:1/ ‘to bring along’; and 23. ผา /pʰa:5/ ‘cliff’
............................................................................................................................................... 174
Figure 65. Wordlist slides: 24. ข า /kʰa:2/ ‘galangal’; 25. หนา /na:5/ ‘thick’; 26. นา /na:1/ ‘rice
paddy’; 27. ท า /tʰa:3/ ‘pier, dock, port’; 28. ฆ า /kʰa:3/ ‘to kill’; and 29. น า /na:4/ ‘maternal
younger uncle/aunt’ ................................................................................................................. 175

ix
Figure 66. Wordlist slide: 30. อ า /ʔa:3/ ‘to open wide’; 31. หมา /ma:5/ ‘dog’; 32. ป า /pa:4/ ‘dad
(Chinese); 33. ตา /ta:1/ ‘eye’; 34. ฉ า /ʨʰa:2/ ‘sizzling, splashing (onomatopoeia)’; and 35. ขา /kʰa:5/ ‘leg’ ............................................................................................................................. 176
x
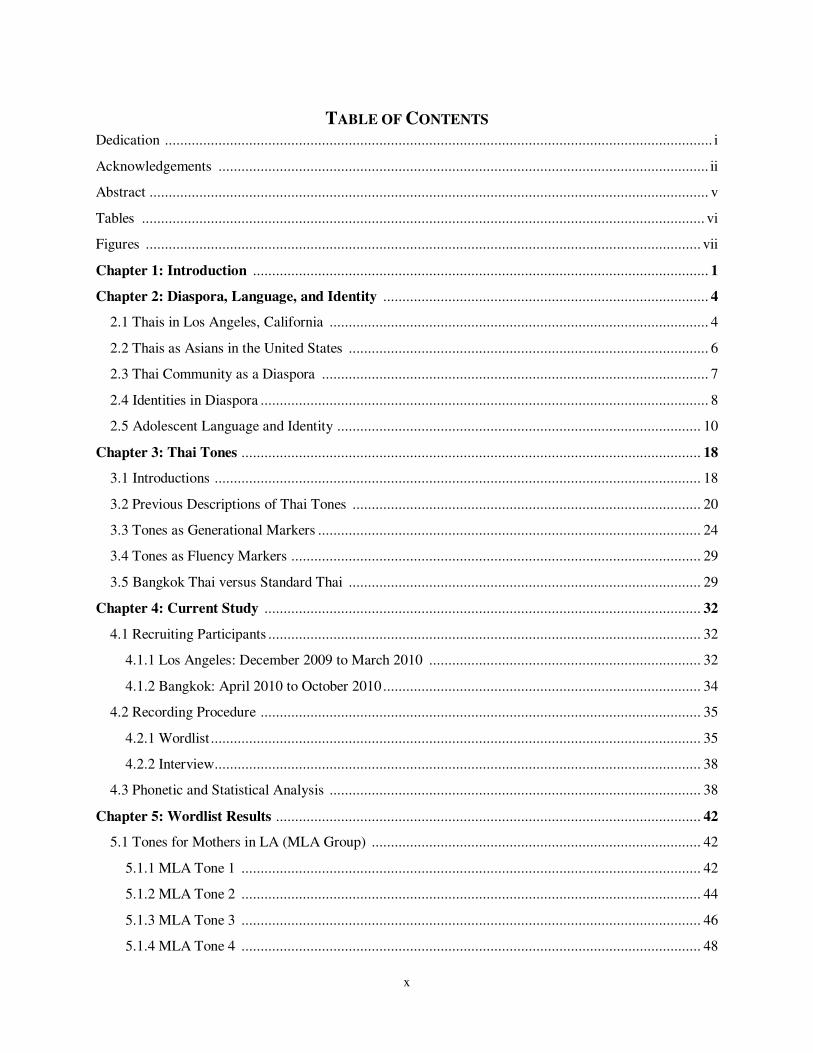
TABLE OF CONTENTS Dedication ............................................................................................................................................... i
Acknowledgements ................................................................................................................................ ii
Abstract .................................................................................................................................................. v
Tables ................................................................................................................................................... vi
Figures ................................................................................................................................................. vii
Chapter 1: Introduction ....................................................................................................................... 1
Chapter 2: Diaspora, Language, and Identity ..................................................................................... 4
2.1 Thais in Los Angeles, California ................................................................................................... 4
2.2 Thais as Asians in the United States .............................................................................................. 6
2.3 Thai Community as a Diaspora ..................................................................................................... 7
2.4 Identities in Diaspora ..................................................................................................................... 8
2.5 Adolescent Language and Identity ............................................................................................... 10
Chapter 3: Thai Tones ........................................................................................................................ 18
3.1 Introductions ............................................................................................................................... 18
3.2 Previous Descriptions of Thai Tones ........................................................................................... 20
3.3 Tones as Generational Markers .................................................................................................... 24
3.4 Tones as Fluency Markers ........................................................................................................... 29
3.5 Bangkok Thai versus Standard Thai ............................................................................................ 29
Chapter 4: Current Study .................................................................................................................. 32
4.1 Recruiting Participants ................................................................................................................. 32
4.1.1 Los Angeles: December 2009 to March 2010 ....................................................................... 32
4.1.2 Bangkok: April 2010 to October 2010 ................................................................................... 34
4.2 Recording Procedure ................................................................................................................... 35
4.2.1 Wordlist ................................................................................................................................ 35
4.2.2 Interview............................................................................................................................... 38
4.3 Phonetic and Statistical Analysis ................................................................................................. 38
Chapter 5: Wordlist Results ............................................................................................................... 42
5.1 Tones for Mothers in LA (MLA Group) ...................................................................................... 42
5.1.1 MLA Tone 1 ........................................................................................................................ 42
5.1.2 MLA Tone 2 ........................................................................................................................ 44
5.1.3 MLA Tone 3 ........................................................................................................................ 46
5.1.4 MLA Tone 4 ........................................................................................................................ 48

xi
5.1.5 MLA Tone 5 ........................................................................................................................ 51
5.1.6 Discussion of MLA Results ................................................................................................... 53
5.2 Tones for Teens in LA (TLA Group) ............................................................................................ 61
5.2.1 TLA Tone 1 ......................................................................................................................... 61
5.2.2 TLA Tone 2 ......................................................................................................................... 64
5.2.3 TLA Tone 3 ......................................................................................................................... 67
5.2.4 TLA Tone 4 ......................................................................................................................... 69
5.2.5 TLA Tone 5 ......................................................................................................................... 72
5.2.6 Discussion of TLA Results .................................................................................................... 75
5.2.7 Tones in Los Angeles, California .......................................................................................... 77
5.3 Tones for Mothers in BKK (MBK Group) .................................................................................... 87
5.3.1 MBK Tone 1 ........................................................................................................................ 87
5.3.2 MBK Tone 2 ........................................................................................................................ 89
5.3.3 MBK Tone 3 ........................................................................................................................ 91
5.3.4 MBK Tone 4 ........................................................................................................................ 93
5.3.5 MBK Tone 5 ........................................................................................................................ 95
5.4 Tones for Teens in BKK (TBK Group) ........................................................................................ 97
5.4.1 TBK Tone 1 ......................................................................................................................... 97
5.4.2 TBK Tone 2 ......................................................................................................................... 99
5.4.3 TBK Tone 3 ....................................................................................................................... 101
5.4.4 TBK Tone 4 ....................................................................................................................... 103
5.4.5 TBK Tone 5 ....................................................................................................................... 106
5.4.6 Discussion of BKK Results and Overall Results .................................................................. 108
5.4.6.1 Tone 1 ......................................................................................................................... 109
5.4.6.2 Tone 2 ......................................................................................................................... 112
5.4.6.3 Tone 3 ......................................................................................................................... 114
5.4.6.4 Tone 4 ......................................................................................................................... 117
5.4.6.5 Tone 5 ......................................................................................................................... 120
5.5 Conclusion ................................................................................................................................ 127
Chapter 6: Taking a Thai Stance in Los Angeles ............................................................................ 131
6.1 Research Questions and Goals.................................................................................................... 131
6.2 Methodology and Participants .................................................................................................... 132
6.2.1 Methodology ....................................................................................................................... 132
6.2.2 Participants ......................................................................................................................... 133

xii
6.3 Stance ........................................................................................................................................ 134
6.3.1 Thai Pronoun Choice as Stancetaking .................................................................................. 135
6.4 Taking a Thai Stance.................................................................................................................. 137
6.4.1 Language of Legitimacy ...................................................................................................... 137
6.4.2 Alignments and Disalignments ........................................................................................... 140
6.4.3 Locus of Thainess ............................................................................................................... 143
6.5 Summary and Discussion ........................................................................................................... 146
Chapter 7: Summary of Findings and Conclusion .......................................................................... 152
7.1 Summary of Findings ................................................................................................................ 152
7.2 Implications of Study ................................................................................................................ 155
7.3 Limitations of the Study and Directions for Future Studies ........................................................ 157
Appendix 1a: Biographical Surveys for BKK Participants ............................................................. 161
Appendix 1b: Biographical Surveys for LA Participants ................................................................ 164
Appendix 2: Adapted General Ethnicity Questionnaire ................................................................. 167
Appendix 3: MS PowerPoint Slides Used for Wordlist Elicitation ................................................. 169
Appendix 4: Praat Script .................................................................................................................. 175
Bibliography ..................................................................................................................................... 178

1
CHAPTER 1. INTRODUCTION
This project began from a comment made about the way I speak Thai. While working on
a Thai language textbook project with Dr. Yuphaphann Hoonchamlong, we noticed that the tones
on the sound clips recorded in Thailand did not sound like mine, even though the speakers and I
were very close in age. Somehow, my tones sounded more ‘correct’. Then I remembered several
other incidents where I was mistaken for someone much older over the phone when speaking
Thai. When many Thais learn of my US upbringing, they would express their delight in the
‘correctness’ of my pronunciation and would lament about the current state of Thai language
from Thai youths.
The dissimilarities between my tones and those of my peers in Thailand, as well as all the
unprompted commentary I receive whilst in Thailand, made me wonder about the differences
between the Thai being spoken by Thai communities in diaspora and the Thai being spoken by
those in Thailand. Other over-seas Thais also have similar accounts of others being surprised by
their age, or positively reacting to the way they speak. Sometimes they would explicitly ask if we
grew up abroad because we spoke Thai so well. What were we doing that made us sound so
different?
To attempt to answer this question, I compared a total of eight pairs of mothers and
daughters in LA and BKK. This study is in two parts, a comparative phonetic investigation of
Thai tones and a discourse analysis. The phonetic investigation focuses on the salient markers of
generational differences in Thai tones such as the shape of the pitch trajectories, the location of
the tone peaks and troughs, and the height of the tones, or where each tone falls in the speaker’s
tone range. The discourse analysis explores the notion of Thainess, in particular, how the LA
teens define and conceptualize Thainess.
The following chapters will provide some theoretical backgrounds and previous works
that informed this study and my analyses. In Chapter 2, I will give a history of Thais in Los
Angeles. The discussion will then lead to the concept of diasporas, as I want to argue here that
the Thai community in Los Angeles is diasporic. The argument draws from formal definitions of
the term ‘diaspora’ as well as the ways its use has been expanded more recently to help describe
the experiences of Asians living outside of Asia. More specifically, we will look at the
‘diasporization processes’ that members of displaced communities undergo. Then, I will briefly
discuss the diasporization process by exploring diasporic identity construction in some Asian
communities.
2
Because we are concerned with comparing two possibly different varieties of Thai being
spoken by the mother and daughters in BKK and LA, and because one variety may be considered
more ‘authentic’ than the other, Chapter 2 will also include a review of non-linguistic research
relevant to this aspect of the study. The review will begin with the relationship between language
and identity construction, especially for those living outside their ‘home’ and for adolescents.
Chapter 3 will review the existing body of research on Thai tones and explore the ways that they
serve as salient markers of age differences, dialectal differences, and fluency, all topics that
concern this study. This portion of the discussion concludes with the role that pronoun choices
play in linguistic stancetaking in Thai, especially as a way to show psychological proximity to
the subject matter and to the interlocutor.
The study itself is in two parts. The first part is a phonetic comparison of Thai tones of
eight mother-daughter pairs in Los Angeles and Bangkok. I will describe the methodology used
to elicit and collect data for the current study in Chapter 4, as well as explain how the results will
be discussed in the following chapters, including the previous works that provide points of
comparison in the results. The phonetic descriptions in Chapter 5 begin with the tonal
characteristics of the LA mothers, then the daughters, followed by a description of the tones in
the BKK speakers, also beginning with the tones of the mothers followed by the tones of the
Thai teens in BKK. I arranged the discussion of the results in this order so that the discussion
will begin with the speakers whose tones I expect to be the most conservative and conclude with
speakers whose tones I expect to be the most innovative.
We will look at what similarities and differences the four groups of speakers have, paying
particular attention to pitch contour shape, the placement of the tone peaks and troughs during
the syllable, and the tone offset, or the aspects of Thai tones that Thai speakers find most salient
and important in their identification and perception of tones. My expectations were that the tones
of the BKK teens will have characteristics that do not match those of their mothers due to
differences in age as well as social indices. Additionally, I expected that BKK teens will not
share tonal characteristics with their peers in LA as the BKK teens presumably are tonal
innovators while the LA teens are not. Lastly, I expected that LA teens will have more
conservative tones, or those that more closely resemble the tones of their mothers, because of the
differences in the context of their use of Thai, similar to what I and my peers experienced while
growing up in the United States.
The second part of the study begins in Chapter 6 and will focus on the ways in which the
LA teens talk about Thainess. I will first give a brief background on Thai pronouns and how they

3
serve as insightful entry points for stancetaking in Thai. I will also explain the stances I took as
the interviewer, why I chose to take those stances, and how they may have affected the interview
data. Next, the discussion will include how the teens define Thainess and where the locus of
Thainess in a person is in their conceptualization. We will also look at how strongly the LA teens
align with being Thai via the linguistic stances they take with respect to the Thai language, Thai
people, and Thainess.
The choice of pronoun is a prominent way for Thai speakers to take a linguistic stance
and make alignments with the subject matter and the interlocutor. The discourse analysis,
therefore, will begin with an investigation the choices in pronouns that the LA teens make while
talking about Thainess, Thai culture, and Thai people, especially vis-à-vis their life in LA,
American culture, and American people. The discussion will continue with an exploration of the
perceived locus of Thainess for the LA teens. We will explore the aspects of Thainess that are
more important to the teens and those that are not. More importantly, we will focus on whether
their conceptualizations about Thainess inform the way that they speak Thai, namely, the ways
that the phonetic characteristics of their Thai, particularly the tones, are physical manifestations
of their linguistic and cultural attitudes and a part of their performance of Thai authenticity.
Chapter 6 concludes with a discussion that relates the earlier phonetic results with the
results from the discourse analysis and the new insights gained from them. More specifically, I
will explore the ways that discourse data can be used to explain the phonetic results and, more
importantly, the implications this study has in the field of linguistics, diaspora studies, and Thai
studies. The final chapter, Chapter 7, is a summary of the findings from Chapters 1-6 as well as a
reflection of some of the limitations of this study and ways upon which this study can be
continued and expanded.
4
CHAPTER 2. DIASPORA, LANGUAGE, AND IDENTITY
2.1 Thais in Los Angeles, California
LA is home to the largest Thai community outside of Thailand. Over 200,000
respondents reported themselves as Thai or partly Thai in the 2010 U.S. Census (Commerce
2011). Local organizations estimate there are anywhere between 50,000 to 100,000 Thais living
in the LA metropolitan area alone (Martorell and Morlan 2011). Local organizers blame the
discrepancy between the Census data and the actual number of Thais living the U.S. on the lack
of information on the Census in the community that perpetuates a lower rate of participation. A
successful multi-tier outreach campaign for the 2010 Census, not actual increased numbers of
Thai arrivals in the United States, contributed to the nearly 60% increase of Thai respondents
from 150,238 in 2000 (Commerce 2011). Nicknamed the 77th province of Thailand, LA boasts
the first official Thai Town in the world as well as numerous Thai language newspapers, Thai
language satellite channels, Thai Buddhist temples, Thai churches, and over 40 Thai-owned
businesses within the Thai Town area.1
Thais began arriving in the United States in large numbers during the 1950s and 1960s,
partly due to changes in the US immigration policy such as the McCarran-Walter Act of 1952
and the Hart-Cellar Act of 1965.2 The first large group of Thais in LA was university students
who arrived during the 1960s. There were two types of students who came to study in LA and
they differed by their source of educational funding. A small number were privately funded by
their families and composed of upper and upper-middle class students. The remainder of the
students was publicly funded by the Royal Thai government (Kaeonil 1977). The latter group
had obligations to the government upon completing their studies and was required to either
return to Thailand or pay back the cost of their education.
By the 1970s, many Thais were already settling in LA. The number of non-resident Thais
in California increased more than two-fold from 1,187 in 1971 to 2,820 in 1975, according to the
Alien Address Program through the Immigration and Naturalization Service (INS).3 Though the
many Thais coming to LA were students and their families, a significant number arrived under
tourist visas. The 1970s also saw a large increase of Thai ‘tourists’ arriving in the United States
on the B2 visa. By 1975, Thai ‘tourists’ had surpassed those who arrived as students with 4,709
Thais arriving under non-immigrant status for the purpose of “pleasure”, equaling more than half
of Thais with non-immigrant status. The “tourist” trend increased steadily and by 1980, a total of
5
22,500 Thais were granted tourist visas (Padoongpatt 2011). The LA mothers who participated in
this study arrived in LA under a tourist visa during the 1980s.
In his 1977 study, Narong Kaeonil reported that many Thais in LA were students and
estimated that there were approximately 4000 – 5000 Thais living in the Los Angeles County
based on surveys distributed to local business owners, residents, and the Royal Thai Consulate.4
Kaeonil distributed a total of 1000 surveys in the Thai community in person, via postal mail,
through official channels such as the Royal Thai Consulate, local schools and universities, and
through Thai businesses. He derived his data from a total of 292 completed surveys and
interviews conducted with 25 community members to discuss their lives in LA. The interviewees
included Buddhists monks, Thai business owners, Royal Thai government officials, and students.
Thai immigration to LA can be divided into three main: pioneer migration, group
migration, and mass migration stages (Martorell and Morlan 2011, 9). Pioneer migration is
characterized by the settlement of mostly educated and middle-class Thais after WWII.
Kaeonil’s study comprises those who belong to this first wave of migration. The second wave,
group migration, began after changes in U.S. immigration laws allowed an increase in Asian
immigration and family reunification with those already in the U.S. The third and on-going stage
is mass migration. The first two stages resulted in a large number of Thais in LA and
subsequently, the city continues to serve as the point of entry for Thai chain migration. New Thai
arrivals in LA are overwhelmingly low-income and generally work in agriculture, garment
manufacturing, and restaurants. As such, the new arrivals tend to live among other Thais in their
community, interacting mostly in their native language instead of English (Thepboriruk 2014).
A large majority of new arrivals to LA during the pioneer wave were from the Central
Plains. Over 80 percent of Kaeonil’s respondents were from the Central Plains region of
Thailand while few came from the Northeastern and Southern regions, 5 percent and 7 percent,
respectively. None of the respondents came from the Northern or Eastern region. Kaeonil
recorded a total of 171 Thai-owned businesses listed in a Thai business directory. Official figures
at that time also support the data. According to the INS, 836 Thais became Permanent U.S.
Residents in 1975. Students and their families, a total of 577 people, comprised the majority of
the applicants whereas 140 were tourists. Statistics from the Royal Thai Consulate also points to
many Thais remaining in Los Angeles. The Consulate reported a total of 401 children born to
Thai parents between 1971 and 1976 (Kaeonil 1977).
Group migration began during the 1980s when Thais arrived en masse as tourists and
then overstayed their visas. This wave of migration consisted mostly of women who entered into

6
either the service industry or the garment industry upon arrival (Martorell and Morlan 2011).
Thailand was suffering from economic repression during the 1980s and as such, the women left
to seek better opportunities in LA. In fact, this influx of Thai ‘tourists’ already began during the
1970s. INS records show a 200% increase of Thais entering the US as tourists between 1971 and
1975 whereas the number of students during those years remained relatively static (Padoongpatt
2011).
Over thirty percent of the people who reported themselves to be Thai in the 2000 Census
are considered to be ‘linguistically isolated’ by the United States Census Bureau. The United
States Census Bureau defines linguistic isolation as a household where “no person 14 years old
and over speaks only English and no person 14 years old and over who speaks a language other
than English speaks English ‘Very well’” (Shin and Bruno 2003, 10). Recognizing the need to
reach Thai constituents, the Bureau produced Thai language census materials to be used for the
first time during the 2010 campaign. Thai was one of five new Asian languages added for 2010
along with Bangladeshi, Hmong, Laotian, and Pakistani (United States Census Bureau 2009, 2).
2.2 Thais as Asians in the United States
Thais are under-studied Asian immigrants. The 2013 Association for Asian American
Studies conference, for example, had only four presentations on Thais out of the over 400 studies
presented during the four day event. And 2014 marked the first time an entire panel of research
conducted with and about the Thai community was organized for the organization’s annual
meeting. Thais’ unique position within the Asian immigrant population presents a challenge for
scholars interested in researching Thais. While some Asian communities can be characterized by
shared experiences and common narratives, Thais have no such experience or narrative. Kaeonil
states in his study that “Thais have no bitter immigration history [and Thai] immigration was not
one of economic necessity created by a situation in the homeland” (1977, 2).
Thais are politically and economically different from other Southeast Asian immigrants.
Though both Thais and Filipinos are economic immigrants, Thais do not have post-colonial ties
to the United States that have helped Filipinos become the second largest Asian group in the
country. Thais are often not eligible for federal aid because they are economic immigrants and
not war refugees, unlike many from neighboring Laos, Vietnam, Cambodia, and Burma. Very
little academic work has been done with the Thai community and not much economic or
demographic information on Thais is available outside those already cited here. A small group of
Thai American scholars, including myself and those already cited above, are working to fill this
7
lacuna in the literature. The fact remains that much of the state of the community today is
unknown. To understand the formation and maintenance of the Thai community in the United
States, I draw from several fields of study, anthropology, sociology, social psychology, and of
course, linguistics.
2.3 Thai Community as a Diaspora
The term Diaspora has been in used since the fifth century B.C. is derived from the Greek
verb diaspeiro, meaning “to disperse, to scatter across”. Dufoix (2008) chronicled the
development of the term that was originally used strictly in a theological sense to refer to the
dispersion of the Jews and the displacement of Christian churches within predominantly non-
Christian areas into something that is now academically in vogue. Black community leaders and
scholars grasped on the term to describe the history of those displaced by the African slave-trade,
beginning in the 1910s. The definition of diaspora was expanded in 1931 to include the Greek
and Armenia communities by historian Simon Dubnov and again in 1939 to include the Asian
communities by sociologist Robert Park (Dufoix 2008, 18-19). By the 1960s, the more common
usage of the term to refer to a displaced group of people was in full swing.
Robin Cohen (1997, ix) defined a diasporic community as a group of people who are
settled outside their natal (or imagined natal) territories, acknowledge that ‘the old country’ has some claim on their loyalty and emotions .…[and] a member’s adherence to a diasporic community is demonstrated by an acceptance of an inescapable link with the past migration history and a sense of co-ethnicity with others of a similar background.
Though the definition Cohen provides above is generous and can be used to define many
different displaced communities, he went on to identify nine features or “fibers” of what he calls
the “diasporic rope”: 1) traumatic dispersal; 2) expansion through work, trade, or empire; 3)
collective memory and myth about the homeland; 4) idealization of the supposed ancestral home;
5) return movement; 6) strong ethnic group consciousness sustained over a long time; 7) troubled
relationship with the host society; 8) sense of solidarity with co-ethnic members in other
countries; and 9) possibility of a distinctive creative, enriching life in tolerant host countries.
Interestingly, Southeast Asians are entirely absent from his discussion.
The Thai community in Los Angeles, I want to argue, is a diaspora by Cohen’s definition,
despite not having been violently or traumatically displaced like other populations traditionally
defined as diasporic or having the nine characteristics he later outlined . Thais have no trauma
narrative and are overwhelmingly economic immigrants, unlike our Southeast Asian neighbors,

8
many of whom are war refugees or have post-colonial ties to the United States (Kaeonil 1977).
So how is the Thai community diasporic? The community is undergoing diasporization, a
process that differentiates them from merely being a minority community.
The idea of diaspora, thus far, has been finite, an instance of displacement caused by
some external impetus. In contrast, Parreñas and Siu define diaspora as “an ongoing and
contested process of subject formation embedded in a set of cultural and social relations that are
sustained simultaneously with the ‘homeland’ (real or imagined), place of residence, and
compatriots or coethnics dispersed elsewhere” (Parreñas and Siu 2007, 1). Being in diaspora is
an experience, not a status to hold. Parreñas and Siu emphasized the existence of inequality and
alienation within both the host and home countries in the formation and maintenance of
diasporas. Likewise, they relocate the focus of diaspora studies onto diasporic bodies, thus giving
community members more agency in their experience, despite whatever circumstances may have
led to their displacement. Under this definition of diaspora, the Thai communities in the United
States are diasporas and the Thai people are under-going the diasporization process.
2.4 Identities in Diaspora
Identity construction is an integral part of the diasporization process described above by
Parreñas and Siu. At the heart of a diasporic identity, as Parreñas and Siu rightly emphasized, is
the simultaneous sense of identification with two distant forces, the homeland and the host
country, a duality that often results in a lack of belonging in either place. To exacerbate their
experience, incorporation into the host society is often not possible for racialized groups like
Asians.
According to Portes and Zhou (1993), cultural and linguistic assimilation for racialized
groups do not always follow the traditional model proposed for turn of the century Europeans,
wherein assimilation leads to upward economic mobility. Acculturation, for many, will not
provide access to middle-class white society, no matter the degree. To help understand the
experiences of newly arrived racialized people, they argue that segmented assimilation serves as
a strategy towards achieving economic mobility for those who are racialized in American
society. The immigrant group preserves aspects of the home culture, like maintaining a close
family unit, while simultaneously participating in other aspects of the host country, such as
gaining proficiency in the host language. The ‘home’ community then can provide economic
mobility in lieu of mainstream American society by providing social support and business
opportunities otherwise not available.

9
Parreñas and Siu (2007, 12-13) consider this practice of community building in the face
of externally imposed displacement as part of the on-going process of diasporization and further
define the diasporic experience as “the partial belonging of subjects to both their place of
residence and the homeland, and more specifically by the displacement caused by their
placement outside the logic of the racially and culturally homogeneous and territorially bounded
nation-state.” So, identifying culturally and linguistically with one’s own group, no matter how
displaced within the mainstream society, offers an alternative path to belonging for diasporic
subjects.
The explanations for the existence and perpetuation of a diaspora within a host country
only hint at the tension experienced and embodied by those in the diaspora. In her 2007 study,
Siu described the tension in the Central American Chinese communities manifesting in the
highly contested 1996 Reina de Colonia China (Queen of the Chinese Colony) beauty pageant.
The controversial 1996 contest was marked by an announcement of Miss Honduras as the winner
that was immediately followed by its retraction. The judges then quickly announced a different
winner, Miss Costa Rica (2007, 105). The controversy was rooted in a lack of consensus in the
community on which contestant embodied the ideal Chinese subject in the diaspora: that of the
mixed-race, non-Chinese speaking Miss Honduras or the more physically Chinese and Chinese-
speaking Miss Costa Rica. The conflicting ideals exposed by the 1996 pageant are still present in
the Colonia China community today (Siu 2007, 134).
Purkayastha (2005) also found tensions in the identity construction of second generation
South Asians (SAs) as they struggled to balance their family’s definition of ethnicity specific to
their parents’ place of origin with one that was more pan-South Asian and hybrid in nature.
Purkayastha’s analysis moved beyond Portes and Zhou’s segmented assimilation model to a
more nuanced understanding of how the SAs constructed their racialized hyphenated identities,
whether the hyphenation showed distance or proximity to their host American culture.
Purkayastha argued that, in our globalized and transnational cultural climate, SAs can
“identity shop” as their “home” culture is increasingly being marketed to them via entertainment
(Bollywood films and songs), fashion (transnational specific styles), and tourism packages
(2005, 3). For example, an SA can have a fantasy Indian wedding through the various wedding
packages sold at Indian castle-resorts, giving them an opportunity to symbolically and
simultaneously perform their Indianness and their privileged transnational socio-economic status.
The Indianness sold through these wedding tourism packages evokes the “princely India” of
Western imaginations but also of their own idealized Indianness (Purkayastha 2005, 84-85).

10
Similar struggles exist for second generation Filipino Americans (FAs) interviewed by
Espiritu (2001). In the same vein that the SAs in Purkayastha’s study locate their ethnicity in
concrete ways through the consumption of fashion, media, and lavish weddings, the FAs in
Espiritu’s study saw food, music, and traditional dance as the physical loci of Filipino culture.
The participants in Espiritu’s study “construct[ed] a Filipino American culture that is neither an
extension of the ‘original’ culture or a facsimile of mainstream ‘American’ culture,” a hybrid
identity in between the two social spaces as a response to their inability to fully assimilate into
mainstream American culture. And unlike the identity of their parents’ generation, the FAs saw
ethnicity as “an object of cognitive orientation,” something that can be discovered, built, and
challenged. Espiritu concluded that FA identity is not bipolar, that is, solely a choice between the
“home” and the “host” cultures, but rather a multilayered identity that is always “in dialogue and
in opposition to the racist ideologies and practices within the United States” (Espiritu 2001, 45-
46).
Diasporic identities, then, are rooted in tensions between several entities within and
surrounding the individuals. The tensions exist between the language and culture of the host and
the homelands; between the different ways that a family and the community perform ethnicity;
and between the personal needs of the people and the structural limitations of their host country
(private versus public spheres). Diasporic identities are about proximity and distance too, in
essence, where we psychologically place ourselves in relation to our host and home.
Within a diasporic community, women are overwhelmingly responsible for mitigating
cultural and linguistic transmission. Women maintain the religious institutions and practices
(Cadge 2002, Ecklund 2005). Women also are responsible for linguistic maintenance within the
community (Murkherjee 2003, Subhan 2007). Connections with ‘home’ through media
consumption are also maintained mostly by the women in the community (Srisombati 2005,
Georgiou 2011). So it is fitting that this study focuses on the language and identity of a sample of
female speakers from the Thai community in LA. The ways in which the Thai women in LA
speak Thai and talk about being Thai can offer a glimpse into the diasporization process of the
community as a whole as well as an understanding of how a Thai identity is being constructed in
LA.
2.5 Adolescent Language and Identity
Much of identity construction is done through language. Besides our ethnicity and
community, other social factors such as socioeconomic level, gender identification, age, and peer

11
group contribute to how we all speak. All aspects of our sense of self intersect and inform how
we choose to present ourselves when we speak. The study of the relationship between language
and identity construction is a relative new subfield of linguistics and mostly dates from the last
half-century but is steadily gaining in momentum.
Linguists have drawn from diverse academic disciplines, including sociology,
anthropology, and social psychology, to inform the relationship between language use and
identity. Sociolinguistics began with the investigation of how specific phonetic features are
associated with certain macro-level social categories such as socioeconomic status and gender.
Early sociolinguistic studies such as Labov (1966) and Eckert (1989) linked linguistic varieties
to social categories. Even though much of the theoretical construct involved the assumption and
acceptance of social categories as predetermined and static, the “first wave” of variationists
offered useful insights into the relationship between speech and the social lives of their speakers
(Eckert 2012). For this study, I draw from the “second wave” and “third wave” of variation
studies by first, recognizing the speaker as an active agent who indexes social categories through
choices made in speech; and second, by defining identity, in this case ethnic identity, as
something speakers must constantly maintain and negotiate. Identity construction is, in essence,
a dynamic process in which speakers continually engage throughout all linguistic events.
Labov (1973) and Eckert (1989) pioneered the study of adolescent language and the ways
it is used to construction an identity. As identity construction in adolescent groups is more overt
than in adults, it may be the case that adolescents experience the tensions of a diasporic identity
described by Parreñas and Siu (2007) in more pronounced ways than the older members in their
community. I will use the terms ‘immigrant’ and ‘diasporic’ interchangeably in the next section,
not because I am equating the two terms but because so little has been done in terms of language
use in diaspora that I must refer to studies done with immigrant population. While it may be that
all diaspora communities are also immigrant communities, the reverse is certainly not the case.
Recall that diasporization is a process that is both externally imposed upon and internally
maintained by the community. Certain immigrant communities who do are not racialized in the
mainstream culture may not necessarily be participating in the diaporization process. Some of the
studies I am about to discuss were conducted in what I would consider to be communities that
are undergoing diasporization, though the scholars did not frame them in those terms. As such,
the claims being made in those studies are about ‘immigrants’ and not specifically about
‘displaced people’ or ‘a diaspora community.’ I would like to argue, however, that the

12
experiences of immigrant adolescents are similar enough to those in a diaspora community to
safely draw the same conclusions about their language use.
Scholars generally find a displaced variety, that is a variety spoken outside of the
‘homeland,’ of any given language to be quite different from the varieties found in the
‘homeland’ in two main ways. First, immigrant languages are in constant contact with other
minority languages or the dominant languages, resulting in a large amount of lexical and
structural borrowing. Second, immigrant languages are generally phonologically conservative,
not having undergone the same changes as the varieties found in the ‘homeland’ (Chambers
2003). Linguistic factors, such as intense contact situation or bilingualism, can explain the first
category of differences. The second category of differences, however, cannot be explained by
linguistic factors alone. Other extra-linguistic aspects such as maintenance of ethnic identity may
contribute to phonological conservatism. More specifically to this study, the Thai speakers in LA
may be unable to keep up with the phonetic changes happening in BKK speech. In other words,
the tonal patterns of LA speakers may be an ‘older’ form of Thai tones as they lag behind the
innovations happening in real time in BKK, similar to what Anivan (1988) and Tienmee (1992)
found in their studies of regional speakers.
Phinney (1990, 503) found that ethnic and cultural identification of immigrant
adolescents have several components. She argued that the formation of ethnic identity – so called
a formation because identity is indeed dynamic – begins with the act of self-labeling. Immigrant
adolescents are particularly active in this process as they may or may not choose labels that
match those of their parents. They can also create a new hybrid or hyphen identity such as Thai-
American or Black-Chinese. The second component in the process is a sense of belonging. It is
important to note now that it is misleading to assign an ‘order’ to the process of identity as
identity is non-linear. A sense of belonging, in fact, influences the choice of ethnic labels one
chooses and also affects the third component, attitude towards one’s own ethnic group. Again,
since the process is non-linear, attitude also has direct effects on the ethnic label one chooses and
the sense of belonging. The last and most problematic component of ethnic identity, according to
Phinney (1990), is involvement in ethno-social or ethno-cultural activities. There are many types
of ethno-social and ethno-cultural activities, such as attending religious services, friendship
maintenance, and political involvement, etc.
Like the above issue of ethnic identity, the relationship between immigrant-language
maintenance, linguistic attitudes, and socio-cultural affiliation and practices is non-linear. The
level of linguistic maintenance by immigrants is intrinsically linked to the issue of ethnic

13
identity. Factors such as religious affiliation (e.g. Ecklund 2005, Mills 2005) and first and
second generation linguistic and cultural attitudes (i.e., Mills 2005, Kim and Chao 2009), among
many others, affect immigrant-language maintenance. Immigrant bilinguals navigate multiple
codes to accommodate context, content, and audience. One cannot hope to provide a description
of any immigrant language variety without exploring socio-cultural issues of the speakers.
There also seems to be a relationship between strong ethnic and cultural identification or
affiliation and immigrant-language maintenance. This is not to say that there is a requisite
relationship between strong ethnic identification and language maintenance as there can be the
former without the latter (i.e., European-descent Americans). For a relatively recent immigrant
group such as the Thais in the U.S. however, the relationship between ethnic or cultural
identification, linguistic attitudes, and language maintenance cannot yet be discounted.
Several scholars have determined that the issue of self-identity and label is especially
salient for adolescent speakers. Eckert (2003, 113) describes teen peer groups as “the primary
loci for their participants to view jointly the social world and assess their individual and joint
places in it [where language] plays a key role in the creation and maintenance of social groups.”
Landmark works done by Labov (1973) and Eckert (1989) showed that language is an integral
part of teen social group formation and demarcation. The use of immigrant language, then, can
serve to demarcate ethnic boundaries in addition to non-ethnic categories for adolescent
speakers.
Adolescent language data also contribute to studies of changes in progress. Tagliamonte
and D’Arcy (2009) found that teens are the most innovative speakers of all age groups, having
the highest instances of using the incoming linguistic forms in their speech community. The
same cannot be said of pre-pubescent or young adult speakers who may differ in age from the
teens by only five years. Further, Teresa Labov (1992, 360) found that “careful tracking of which
social categories make use of which [slang] terms will increase our knowledge of the direction
and rate of both linguistic and social change.” Immigrant teen language, then, should prove to be
fertile grounds for the study of the relationship between language and identity as they are the
crux of linguistic innovation and conservation.
Eckert (2012) summarized the gradual shift of focus in the study of linguistic variation
into three waves. The first wave of researchers did not see identity as a process or as something
that speakers construct through language, but rather, as a set of social categories – male or
female, working-class or middle-class, local or non-local – that have concrete effects on the
speech of its members by way of shared lifestyles generally associated with those within the
14
same category. The second wave of researchers shifted their focus to attribute to speakers more
sense of agency, mainly through ethnographic studies. The third wave added a dimension of style
to the study of linguistic variation and considers the meaning of linguistic variation to be an
integral part of language as there is no feature of language that is devoid of social meaning and
that such meaning is not incidental in language use. Speakers are active participants in the
construction and negotiation of meaning in their daily lives and, of course, in their social
identity. To understand this process, the ethnographic approach of the third wave emphasizes the
evaluative aspect of language use, as well as the stylistics of language.
This ethnographic movement stemmed from treating linguistic interaction as one of the
many types of communicative events which are adapted and expanded from Roman Jakobson’s
communications theory during the 1950s and 1960s. The approach takes into account the
participants, the mode of communication, the various codes of communication, the context or
setting of the event, the forms of messages, the attitude (in our case, stance) of the message, and
the communicative events themselves (Hymes 1974, 10). The focus moves from the form of
language to the function of language, in other words, the goals are in “identifying social
functions, and discover the ways in which linguistic features are selected and grouped together to
serve them….from the standpoint of social meaning, that is, from a functional perspective”
(Hymes 1974, 196-7).
From this perspective, language and the variations within “constitute a social semiotic
system capable of expressing the full range of a community’s social concerns” (Eckert 2012, 94).
Language use is viewed as a local concern and necessarily evaluative. No concern is more local
than group membership. This is particularly evident in the speech of adolescents. Labov (1973)
was one of the first to study the language and variety of adolescents. To his credit, his study also
provided a great amount of narrative on the social lives and the interactional contexts of the
speakers he studied. The study focuses on the grammatical features used by a group of urban
Black adolescents who are ‘Lames’ (those who did not have membership in one of the four main
social groups, the Aces, Thunderbirds, Jets, and Cobras). Lames are outside of those circles of
social interactions and, therefore, do not possess enough knowledge of the group practices and
cultures, including the linguistic practices between members.
Labov found that, though they have the same general grammar as in-group members,
Lames are more influenced by Standard English in their phonology. For example, the members
of the Aces’ and Thunderbirds’ social circles rarely have post-vocalic /r/ in words such as car,
card, fear, beard, etc., even when reading; the Lames use post-vocalic /r/ more often in all styles

15
of speech (1973, 88-9). Labov showed through a series of phonological and grammatical
analyses that Lames are so socially isolated from members of the main social groups that their
speech reflects the lack of interaction. Inversely, core members of the Jets all display very
consistent grammar and phonology, a result of their intense social interaction and in-group
linguistic practices (1973, 106-7).
A little over a decade later Eckert (1989) explored the social groups and linguistic
practices of white suburban adolescents. Eckert’s study focused on the two main social
categories at a high school outside of Detroit, the Jocks and the Burnouts. Her results expanded
the explanation of variation beyond linguistic exposure and group membership to also consider
the use of styles and social orientation of the groups of speakers, whether they are urban-oriented
or school-oriented (Eckert 2008, 458). The study considered, in particular, the mid and low
vowels involved in the Northern Cities Shift and the raising and backing of the nucleus /ay/. She
found that the Burnouts were more likely to use the vocalic forms associated with urban speakers
while the Jocks, especially the jock boys, were less likely to use them. Eckert also found that the
most ‘burned-out’ of burnout girls were those who led in the use in all vocalic forms associated
with the Northern Cities Shift.
Both Eckert (1989) and Labov (1973) hinted at the idea of linguistic authenticity in their
studies. Labov (1973) interviewed Vaughn, a fairly new member of a group called the Jets, and
found that, though he used many of the same linguistic variables as other Jets, his language
betrayed his relatively new membership as well as his former status as a Lame in a different
neighborhood. Whereas his lifestyle had coalesced successfully with the Jets, his language has
yet to catch up to his new membership in the group and the change from formerly being a Lame.
In short, Vaughn’s linguistic authenticity had not caught up with other aspects of his social
authenticity though Vaughn’s authentic behavior in conjunction with his authentic-enough
language granted him membership into the Jets.
What is authentic, however, rests in the minds of those who participate in creating
authenticity. In Vaughn’s case, he was authentic enough to be one of the Jets. Coupland et al.
(2003) compared the “real Wales” being conceptualized in the US Welsh diaspora and in Wales
and found that the Welsh language was being used iconically by the reporters of the English-
language Welsh-American newspaper Y Drych. Welsh words, phrases, and place names had a
“metonymic function, standing for the complete Welsh cultural experience, as the relevant
groups conceive it to be”. Additionally, the newspaper had a ‘traditionalizing function’ for its US

16
readership and struck readers in Wales as being old-fashioned, harking back to the days of yr hen
wlad or ‘old Wales’ (Coupland et al. 2003: 171-2).
Authenticity is at the heart of identity performance. Coupland et al. provided five
‘qualities of authenticity’ that have been assumed in sociolinguistic studies: 1) ontology,
authentic things have a real existence; 2) historicity, authentic things have longevity; 3) systemic
coherence, authentic things ‘reflect a principled set of relations’; 4) consensus, authentic things
‘have a high acceptance within a constituency’ and have ‘a consensus that they have been
properly authorized’; and 5) value, authentic things ‘occupy prominent symbolic positions’ and
‘have definite cultural value’ (2003: 418-9). Authenticity, in other words, is a locally constructed
and maintained concept that is necessarily evaluative. Authenticity always happens in relation to
inauthenticity.
Shenk (2007, 195) describes authentic ethnic identity as “a dialogic process linking social
action and ideology with interactionally negotiated identity stances”. In her study of a group of
bilingual Mexican-American friends, she found that throughout the discourse, the speakers made
a series of ‘authenticating moves’ that reference past discourse, present discourse, and a future
discourse. Additionally, when the speaker is taking the position of authenticity, others must then
be inauthentic. Social and linguistic ideologies can assuage breaches of authenticity in the
discourse and work to relegitimize the speaker’s ethnic identity claims.
Authenticating moves, as described by Shenk, are made through stancetaking. Stance is
an old framework but its use in sociolinguistics is gaining ground, particularly within the last
decade. Stancetaking can be defined as “taking up a position with respect to the form or the
content of one’s utterance [where] speaker positionality is built into the act of communication”
(Jaffe 2009, 3). As speakers, we draw from our vast linguistic tool belt of word choice,
pronunciations, intonation, etc., in order to construct our position within our environment and
with respect to other interlocutors. Our position as speakers is our identity, our role, and how we
see ourselves – or at least how we want to be seen. I will discuss linguistic stancetaking in more
details in Chapter 6.

17
1 The City of Los Angeles officially recognized the area in East Hollywood as ‘Thai Town’ on October 27, 1999. The area spans one mile between Western and Vermont Avenues on Hollywood Boulevard. In 2008, Thai Town became one of the Preserve America neighborhoods as part of a White House initiative by former First Lady Laura Bush. (http://www.thaidcd.org/ourcommunity/thai-town/, accessed 25 March 2015). 2 The McCarran-Walter Act of 1952 ended the exclusion of Asians in the US immigration policy. The Hart-Cellar Act of 1965 ended the quota system in US immigration. 3 Under the formation of the Department of Homeland Security in 2002, the United States Immigration and Naturalization Service (INS) is now the United States Citizenship and Immigration Services (USCIS). 4 Los Angeles County in Kaeonil’s 1977 study includes the cities of Los Angeles, Long Beach, North Hollywood, Lynwood, Glendale, Torrance, Bell City, El Monte, East LA, Santa Monica, Gardena, and the San Fernando Valley area. The numbers gathered from the Royal Consulate reflects the number of passport renewal applications at the time of the study.
18
CHAPTER 3. THAI TONES
3.1 Introduction
Thai tones have fascinated scholars since the early 1900s. The novelty of lexical tones
piqued academic interests in the early 20th century (Bradley 1909 and 1911, Jones 1918 in
Henderson 1976) and still is fertile ground for inquiries about the Thai language. In the 1980s
(Gedney 1989, Tingsabadh 1982, Smalley 1990, etc.) linguists began to differentiate between the
various types of Thai spoken in Thailand and moved away from using monolithic references like
‘Siamese’ or ‘Thai’. Basic demographic information such as the place of origin or the native
dialect/language of the speakers was often not provided in earlier studies. For the purpose of this
study, I assume that earlier studies of Thai or Siamese refer to Standard Thai, or the language of
the government of Thailand.
Some studies (i.e. Abramson 1975) also used the term ‘Central Thai’ (CT) to refer to the
varieties spoken in the Central Region of Thailand. The Office of the National Economics and
Social Development Board (NESDB) defines the Central Region as encompassing nine
provinces between Uthaithani and Lopburi to the north, Saraburi and Pathum Thani to the east,
Nonthaburi and Angthong to the west, and Bangkok as the southernmost province. According to
both Tingsabadh (1982) and Tienmee (1992), CT is the variety of Thai spoken in the lower Chao
Phraya River valley that is north of the delta, a geographical area similar to the NESDB’s
definition. Figure 1 shows the provinces of Thailand and the Central region.1
This study focuses on Standard Thai (ST). Standard Thai is the official language of the
Kingdom of Thailand and was, at one time, loosely based on the variety spoken in Bangkok
where the seat of government is located. To speak ST is to speak a variety wherein the regional
and dialectal markers have been neutralized. Bangkok Thai (BT), on the other hand, is the
variety of Standard Thai spoken by Bangkokians. The differences between BT and ST are mostly
phonetic in nature with very small amounts of lexical variation. I consider the speakers in Los
Angeles to be ST speakers who, by definition, are not speakers of BT as they do not live in
Bangkok. The speakers in Bangkok, in turn, are considered to be ST speakers in formal settings
and BT speakers in casual settings. The following section will discuss the differences between
BT and ST in more details.

19
Figure 1. Map of Thailand with Central region outlined.
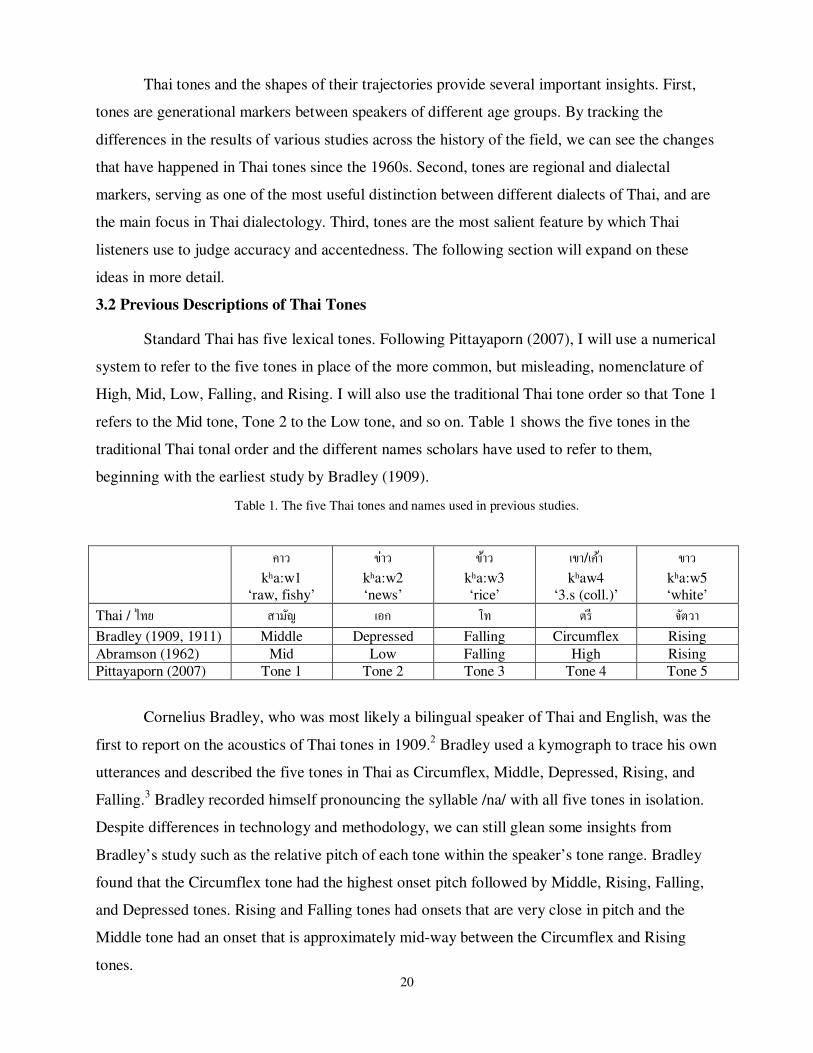
20
Thai tones and the shapes of their trajectories provide several important insights. First,
tones are generational markers between speakers of different age groups. By tracking the
differences in the results of various studies across the history of the field, we can see the changes
that have happened in Thai tones since the 1960s. Second, tones are regional and dialectal
markers, serving as one of the most useful distinction between different dialects of Thai, and are
the main focus in Thai dialectology. Third, tones are the most salient feature by which Thai
listeners use to judge accuracy and accentedness. The following section will expand on these
ideas in more detail.
3.2 Previous Descriptions of Thai Tones
Standard Thai has five lexical tones. Following Pittayaporn (2007), I will use a numerical
system to refer to the five tones in place of the more common, but misleading, nomenclature of
High, Mid, Low, Falling, and Rising. I will also use the traditional Thai tone order so that Tone 1
refers to the Mid tone, Tone 2 to the Low tone, and so on. Table 1 shows the five tones in the
traditional Thai tonal order and the different names scholars have used to refer to them,
beginning with the earliest study by Bradley (1909).
Table 1. The five Thai tones and names used in previous studies.
คาว
kʰa:w1 ‘raw, fishy’
ข าว
kʰa:w2 ‘news’
ข าว
kʰa:w3 ‘rice’
เขา/เค า kʰaw4
‘3.s (coll.)’
ขาว
kʰa:w5 ‘white’
Thai / ไทย สาม ญ เอก โท ตร จ ตวา Bradley (1909, 1911) Middle Depressed Falling Circumflex Rising
Abramson (1962) Mid Low Falling High Rising
Pittayaporn (2007) Tone 1 Tone 2 Tone 3 Tone 4 Tone 5
Cornelius Bradley, who was most likely a bilingual speaker of Thai and English, was the
first to report on the acoustics of Thai tones in 1909.2 Bradley used a kymograph to trace his own
utterances and described the five tones in Thai as Circumflex, Middle, Depressed, Rising, and
Falling.3 Bradley recorded himself pronouncing the syllable /na/ with all five tones in isolation.
Despite differences in technology and methodology, we can still glean some insights from
Bradley’s study such as the relative pitch of each tone within the speaker’s tone range. Bradley
found that the Circumflex tone had the highest onset pitch followed by Middle, Rising, Falling,
and Depressed tones. Rising and Falling tones had onsets that are very close in pitch and the
Middle tone had an onset that is approximately mid-way between the Circumflex and Rising
tones.

21
According to Bradley’s report, only the Circumflex tone showed any significant changes
in the tonal trajectory, with a rise in pitch followed by a plateau, then a fall in pitch. The pitches
in the Rising tone steeply rise while the pitches in the Falling tones steeply fall during the
syllable. The Middle and Depressed tones show some undulation in the pitch that is followed by
a fall at end of the utterance. Three of the tones in Bradley’s study had convex tonal trajectory
with respect to the pitch floor. The Middle and Depressed tones were slightly convex, showing a
slight fall in pitch towards the end of the tonal trajectories after some initial pitch undulation.
The Circumflex tone, however, had a very large drop in pitch, approximately the same as the
entire pitch range of the Falling and Rising tones. The Rising and Falling tones showed rapid rise
and fall, respectively, in pitch. Figure 2 shows the tones recorded by Bradley (1909, xcvi).
Half a century later, Abramson reported very different characteristics for the five tones he
recorded and analyzed using a high-fidelity recorder and modified Kay Sonograph (1962, 17-18).
Abramson analyzed the tones of eighty-eight monosyllabic morphemes with thirty-nine on single
vowels and forty-nine on double vowels, all said in citation form. The analyzed recordings were
mostly from two brothers who were native speakers of Standard Thai (1962, 21). Abramson
divided Thai tones into two groups: dynamic (Falling and Rising) and static (High, Mid, Low).
He defined dynamic tones as those that are “characterized by sharp pitch trajectories as opposed
to the relatively smooth pitch movements of the [static tones]” (1962, 112).
Figure 2. Siamese Tones from Bradley (1909, xcvi).
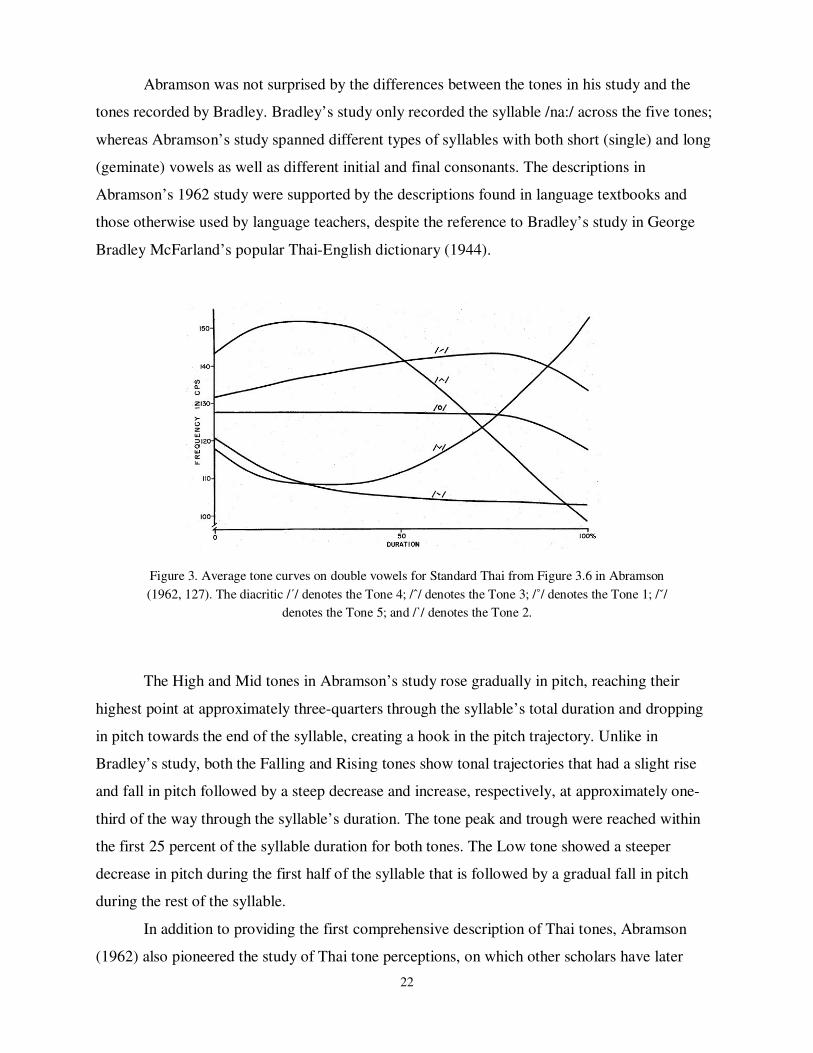
22
Abramson was not surprised by the differences between the tones in his study and the
tones recorded by Bradley. Bradley’s study only recorded the syllable /na:/ across the five tones;
whereas Abramson’s study spanned different types of syllables with both short (single) and long
(geminate) vowels as well as different initial and final consonants. The descriptions in
Abramson’s 1962 study were supported by the descriptions found in language textbooks and
those otherwise used by language teachers, despite the reference to Bradley’s study in George
Bradley McFarland’s popular Thai-English dictionary (1944).
The High and Mid tones in Abramson’s study rose gradually in pitch, reaching their
highest point at approximately three-quarters through the syllable’s total duration and dropping
in pitch towards the end of the syllable, creating a hook in the pitch trajectory. Unlike in
Bradley’s study, both the Falling and Rising tones show tonal trajectories that had a slight rise
and fall in pitch followed by a steep decrease and increase, respectively, at approximately one-
third of the way through the syllable’s duration. The tone peak and trough were reached within
the first 25 percent of the syllable duration for both tones. The Low tone showed a steeper
decrease in pitch during the first half of the syllable that is followed by a gradual fall in pitch
during the rest of the syllable.
In addition to providing the first comprehensive description of Thai tones, Abramson
(1962) also pioneered the study of Thai tone perceptions, on which other scholars have later
Figure 3. Average tone curves on double vowels for Standard Thai from Figure 3.6 in Abramson
(1962, 127). The diacritic /ˊ/ denotes the Tone 4; /ˆ/ denotes the Tone 3; /˚/ denotes the Tone 1; /ˇ/
denotes the Tone 5; and /ˋ/ denotes the Tone 2.

23
expanded. Two early studies, Erickson (1976) and Abramson (1975), investigated inter-speaker
variability. The former focused on the production of tones while the latter focused on the impact
of the differences in production had on tonal perception. Absent in the earlier studies were
comparisons of tone production across different groups of speakers.
Nearly thirty years after the landmark work by Abramson in 1962, Gandour et al. (1991)
and Potisuk et al. (1994), showed different trajectories for Thai tones. The 1991 study recorded a
total of twenty BKK adult speakers, ten in the ‘young’ group (average age = 26.7, s.d. = 2.6) and
ten in the ‘old’ group (average age = 56.7, s.d. = 2.6), reading /kʰa:/ with all five tones in random
order. The results confirmed that the bifurcation of Thai tones into dynamic and static tones by
Abramson (1962 and 1975) was still accurate in terms of production and perception. The
dynamic tones (Tones 3 and 5), for example, showed less variability in production across
different speakers than the static tones (Tones 1, 2, and 4). The results also supported earlier
acoustic reports of Thai tones (Abramson 1962, Henderson 1964, Erickson 1974 and 1976, and
Gandour et al. 1988), the exception being the hook, or the steep decrease in pitch at the end of
the tone duration. Gandour et al. (1991) found that the hook in Tone 4 seem to be optional for
speakers in the 1991 study whereas speakers from earlier studies all had the hook in both Tones
1 and 4 (e.g. Abramson 1962, see Figure 3 above). Two studies, Luksaneeyanawin (1998) and
Kallayanamit (2004), argue that the hook in the tone trajectories can be attributed to intonation.
Gandour et al. (1991) concluded that Thai speakers perceive static tones differently than
dynamic tones. Additionally, the variability in the motor control of F0 is inversely related to the
degree of F0 movement, regardless of the direction of the pitch change. In other words, Thai
speakers pay more attention to small changes in the pitch for dynamic tones but not in static
tones. Additionally, they found that a speaker’s age was not a significant factor in tone
production, with older speakers producing tones that were similar in shape to younger speakers.
While other studies only made passing mentions, Potisuk et al (1994) was the first study
to specifically investigate the effects of stress on Thai tones. The study recorded three BKK
speakers, one male and two females ages 22, 25, and 32, respectively, reading 25 pairs of
ambiguous target sentences that contained two-syllable noun-verb and noun-noun compounds.
They found that, overall, F0 trajectories for stressed syllables closely approximate the trajectories
in citation form; whereas, the F0 trajectories of unstressed syllables did not resemble the
trajectories of tones in citation form. Despite the vastly different tone trajectories in unstressed
syllables, the five-way contrast remained intact, maintaining the three levels of tonal register:
high, mid, and low; wherein Tones 3 and 4 are in the high register; Tones 2 and 5 are in the low

24
register; and Tone 1 is in the mid register (Potisuk et al. (1994, 14). Figure 4 shows the five tones
in stressed syllable from Potisuk et al 1994.
3.3 Tones as Generational Markers
In the 1990s, scholars (Panroj 1990, Teeranon 2007, Thepboriruk 2010) started
conducting diachronic or change-in-progress studies and found differences between the tone
trajectories of older and younger speakers that did not agree with the results from Gandour et al.
(1991) where the differences in age did not result in variability in the speakers’ tones. The
findings from the diachronic studies support anecdotal claims that tones in younger speakers
sound different than those produced by older speakers. Tone 4, in particular, has undergone the
most changes within the last century. First reported by Bradley (1911) to be a high falling tone,
Tone 4 has evolved into a high level tone (Abramson 1962, 1975, and 1979, and Erickson 1976),
and now has become a mid-rising tone (Potisuk et al. 1994, Teeranon 2007, and Thepboriruk
2010).
The most recent studies on Thai tones show that tonal trajectories for speakers younger
than thirty years old differ greatly from earlier reports and from speakers fifty years or older.
Morén and Zsiga (2006, 125-132) recorded three female BKK speakers in their late twenties
producing tones in isolation as well as in carrier phrases. They found that Thai tones can be best
described using the mora as the tone bearing unit and that the mora in Thai has a fairly consistent
duration. Further, the pitch trajectories for each of the five tones show very little variability
Figure 4. Mean F0 trajectories of Thai tones from Potisuk et al. (1994, 11)
T3
T4
T5
T1
T2

25
across different types of syllables. The trajectories recorded by Morén and Zsiga were so
different from the prescriptive standards based on Abramson (1962) that it helped spur new
interests in the phonetics of Thai tones (Teeranon 2007 and Thepboriruk 2010). Figure 5 shows
the pitch trajectories for Thai tones from Morén and Zsiga (2006, in Zsiga and Nitisaroj 2007).
My 2010 study compared the tones of fifteen female BKK speakers from 18 to 61 years
of age pronouncing twenty-five words in an identical carrier phrase. Beyond changes observed in
Tone 4 by other studies, I found that older and younger speakers differ in the location of tone
peaks and troughs in Tones 4 and 5, meaning that the highest and lowest points in the pitch
contour are at different times in the syllable duration. The results from Teeranon (2007) and
Morén and Zsiga (2006) further showed that Tones 4 and 5 share very similar tone shapes.
Figure 6 shows the average pitch trajectories for Younger speakers from my 2010 study. Besides
the location of the tone peaks and troughs, Older and Younger speakers from that study also
differed in other ways across all five tones as shown in Table 2.
Figure 5. Pitch trajectories of Thai tones in citation form Morén and Zsiga
(2006, in Zsiga and Nitisaroj 2007, 347)

26
Tones 4 and 5 now differ mainly in three aspects: first, the degree of pitch excursion;
second, the overall height of the tone in the speakers’ tone range, and lastly, the location of the
pitch trough, or the lowest point in the tone, in the duration of the tone. Overall, younger
speakers had smaller pitch excursions for all tones, meaning that their tones increase and
decrease in pitch less than for older speakers. Additionally, younger speakers had higher tone
onsets for the two static tones, Tones 1 and 2, and a lower tone onset for Tone 4. Tone onsets for
Tones 3 and 5 were similar between younger and older speakers.
Table 2. Tone trajectories of younger speakers and older speakers from
Teeranon (2007) and Thepboriruk (2010).
AGE
TONE 1 TONE 2 TONE 3 TONE 4 TONE 5
Peak/ Trough
Offset Peak/ Trough
Offset Peak/ Trough
Offset Peak/ Trough
Offset Peak/ Trough
Offset
≤
25
Onset Mid
Mid Onset Mid
Low Onset High
High-Mid
40-50% Mid
Mid 50-60% Low
Mid-high
• Static • Mid-range • Gentle slope
• Static • Mid-low range • Steep slope
• Convex • High-Mid • Fall-plateau-fall
• Concave • Mid-rising
• Concave • Low-rising • Creaky
≥
60
Mid Mid Mid Low 30% High
Mid 20-30% Mid
Mid 40-50% Low
Mid
• Static • Mid-range • Gentle slope • hook
• Static • Mid-low range • Gentle slope
• Convex • High-Mid • Rise-plateau-fall
• S-shaped • Mid-rising • Fall-rise-fall • hook
• Concave • Low-rising
Figure 6. Average pitch trajectories for younger speakers from Thepboriruk (2010, 95)

27
Much earlier, Potisuk et al. 1994 also observed that Tone 4 had become a rising tone.
More recent phonetic descriptions of Thai tones agree with this assessment (Morén & Zsiga
2006, Pittayaporn 2007, Teeranon 2007, Zsiga & Nitisaroj 2007, and Thepboriruk 2010). Note
the increased similarities between Tones 4 and 5 in younger speakers recorded in my 2010 study,
when compared with those recorded by Potisuk et al. (1994) fifteen years earlier. In fact,
evidence from recent perceptual experiments also show that the phonetic similarities between
these two tones in younger speakers are causing perceptual confusion between Tones 4 and 5 in
isolation, similar to the confusion between the perception of Tones 1 and 2 reported by
Abramson (1962 and 1979) in earlier studies.
Figure 7a. Pitch trajectories for speakers sixty and over (Teeranon 2007, 8)
Figure 7b. Pitch trajectories for speakers twenty and under (Teeranon 2007, 9)

28
Teeranon (2007) recorded and tested forty participants who were divided into two age
groups: under-twenty and over-sixty. Each participant produced each of the five tones five times
in isolation, based on the syllable /kʰa:/, and were also asked to match a series of synthesized
tokens to each of the five tones in three separate experiments. The tokens were 1) straight pitch
trajectories, meaning the tonal onset and offset were the same pitch; 2) rising pitch trajectories
with the tone onset of 150 Hz and offsets ranging from 155 Hz to 240 Hz; and 3) pitch
trajectories with the tone onset of 195 Hz and the offsets ranging from 150 Hz to 240 Hz. The
experiments were designed to test for the participants’ preferred pitch range and the preferred
pitch trajectories for Tone 4. Figure 7a and 7b show the pitch trajectories from Teeranon (2007).
The results show that a concave trajectory is overwhelmingly being perceived as Tone 4
for participants under-twenty years old; whereas participants from the over-sixty group perceive
a high level trajectory to be Tone 4. Additionally, the over-sixty group confused Tones 4 and 5
much more than the under-twenty group; whereas the younger speakers also confused Tones 2
and 5. Tones produced by the two groups point to differences in their perception. The under-
twenty group produced tones that were, overall, higher in their tone range than the over-sixty
group with tone peaks for all tones occurring later in the syllable. Note the similarities in tone
trajectories between the under-twenty group in Teeranon’s study and the Younger speakers in
my 2010 study (Figure 7a and 7b). The differences between the under-twenty group and the
over-sixty group can also be found between the Younger speakers and the Older speakers in the
2010 study.
To test the perceptibility of the five Thai tones and their perceptual cues, Zsiga and
Nitisaroj (2007) conducted four different experiments with native Bangkok Thai speakers aged
22 – 35 years old. The participants confused Tones 2 and Tone 5 when presented with segmented
syllables from a female Bangkok speaker in her late-twenties, differentiating them only by the
location and level of the tone peaks. The participants also associated a trajectory with a low
midpoint and a mid-range endpoint with both Tones 4 and 5 (Experiment 2). Additionally, Thai
listeners prioritized tonal midpoints and endpoints more than the onsets, as change in pitch of the
onsets had little effect on tonal recognition for the participants (Experiment 3). Lastly, Thai
listeners found temporal aspects of pitch trajectories important; in other words, each tone has its
characteristic peak (tone maximum) and trough (tone minimum). When the peak alignments
were confusing or did not match their expectations, the participants identified the tones based on
overall pitch direction and slope (Experiment 4).

29
3.4 Tones as Fluency Markers
Besides being a dialect marker, tones are also the most salient marker of fluency as well
for Thai speakers and listeners. So it is fitting that this study, the first of such investigation of
Thai spoken outside of Thailand, should begin with a comparison of the five tones. Wayland
(1997) showed that native Thai listeners are more attentive to the location of tone peaks and tone
qualities than other phonetic features when judging the level of fluency in Thai. A total of six
male Thai language learners, five advanced and one low-intermediate, were recorded producing
all five tones with the syllables /kʰa:w/ and /na:/ in an identical carrier phrase. Three male native
Thai speakers were also recorded for comparison. Three female native Thai speakers, one from
each of the central, southern, and northeast regions then rated the recordings on a scale of 1 to 5
for the level of accentedness.
Wayland found that Thai listeners are more sensitive to spectral aspects of foreign
speech, meaning tones and vowel quality, as opposed to temporal aspects such as voice onset
time and vowel duration. The results also suggested that listeners judged the level tones
produced by native English speakers to be more noticeably accented than contour tones, even for
the same speaker (Wayland 1997, 366). In fact, Thai listeners seemed to pay attention to the tone
first, above all other phonetic qualities. If the tone is not native like, then the listeners paid
attention to other characteristics of the speech such as the vowel quality.
3.5 Bangkok Thai versus Standard Thai
The majority of studies done discussed so far focused on Standard Thai (ST) or Bangkok
Thai (BT). Scholars often times conflated the two in their treatment of Thai tones. A few
scholars, however, have made the distinction and compared the ST spoken by those in Bangkok
with those outside of Bangkok (BKK). Treating BT as the “standard dialect”, Anivan (1988)
compared the tones of BKK speakers with those of speakers from three other regions: north
(Chiang Mai), northeast (Ubonratchathani), and south (Songkhla). All three regions are well-
known for having different phonology, phonetics, lexical items, and, in the cases of the north and
south, different historical development from the Thai spoken in Thailand’s central plains region.
Anivan found that the F0 trajectories from the ST spoken by regional speakers were not the same
as those from BKK speakers.
While BKK speakers shared the same overall tone shapes for all five tones, the pitch
trajectories of regional speakers varied between each tone, displaying an ‘older’ form of the
tones. Further, there was a degree of uniformity between the three groups of regional speakers in

30
the shapes of their pitch trajectories. Tone 4, for example, was described as a mid-rising tone for
BKK speakers and as a mid-rise-falling tone for the regional speakers, where the tone showed a
significant drop in pitch, or hook at the end of the syllable. The BKK speakers did not have a
hook for Tone 4. Anivan (1988, 9) ruled out the possibility of interference from the local dialects
to explain the differences between regional and BKK speakers because of the uniformity shown
in the tones for the three different groups of regional speakers.
Anivan also observed the most differences between BKK speakers and northeastern
speakers in the trajectories of Tones 3, a tone traditionally considered to be dynamic. Tone 4, a
traditionally static tone, also showed significant differences in pitch trajectories between BKK
speakers and all other speakers. Interestingly, the shapes of Tone 1, Tone 2, and Tone 5 were
fairly uniform across all groups. Recall that Gandour et al (1991) reported more variability in
static tones than in dynamic tones in terms of pitch contours. Observations made by Anivan seem
to support both his claim and those made by later diachronic studies (Teeranon 2007, Pittayaporn
2007) that Tone 4 is undergoing the most changes in the Thai tonal system.
Tienmee (1992) also distinguished the tones of BKK speakers from the tones of speakers
from other regions in Thailand. In classifying Thai dialects into four regional groups, she found
that phonetic realization of tones is the most useful feature to use when distinguishing between
different dialects of Thai over other features such as tone phonology (Li 1977, Gedney 1972,
reprinted in 1989) or initial consonants (Chamberlain 1989), or lexical items (Thongmark (1983).
Tienmee (1992: 234) also observed that even within the central region where BKK is
geographically situated, BKK speakers differ from other speakers from the central region in their
tones, adding that other central region speakers seem to be aiming at an older version of BT than
the version of tones the BKK speakers use.
Tingsabadh (1982 and 2001) outlined the ways in which tones can be used to conduct
dialectal studies for Thai. In her proposal, the process would consist of a tone checklist and the
tone box, both methods developed by William J. Gedney (1972, reprinted in 1989) to be used in
distinguishing languages in the Tai language family, including Thai. What little work has been
done in Thai tone dialectology has focused on the differences between main dialects of Thai such
as Northern, Northeastern, Central, and Southern. A few scholars have also studied the contact
between two main dialects in the tonal borderlands. Tingsabadh concluded that Thai accents “are
defined…as members of the same subdialect [by] having the same number of tones as well as the
same pattern of tone splits and mergers, and differing in the phonetic realizations of some or all
of the tones” (2001, 219).

31
The review of previous works in this chapter established two main points: first, that there
are differences between speakers of different ages; and second, that tones are the most saliently
aspect in the Thai language that speakers use to judge for both fluency and dialectal differences.
So the question remains: why do my tones index an older speaker? What is it about the way that
Thais in diaspora speak that makes us sound more “correct” or older than we really are? Surely,
my growing up in diaspora greatly affected the way I speak Thai. In our small community in
Madison, WI, as well as all the times we took trips to a Thai Buddhist temple in Chicago, IL, the
community elders were always the linguistic gatekeepers who policed the quality of the Thai my
peers and I spoke.
1 From http://en.wikipedia.org/wiki/Provinces_of_Thailand (accessed 23 March 2015) 2 Cornelius Beach Bradley (1843-1936) was born and raised mostly in Thailand while his father, Daniel Beach Bradley, served as the doctor and tutor for the Thai royal family. The elder Bradley was responsible for many firsts: Thai printing press, Thai language newspaper, Old Testament Thai translation, and Thai monolingual dictionary among many others. The younger Bradley returned to Thailand to serve as a missionary from 1871-1874 after he completed his studies at Oberlin College and Yale Divinity School. Cornelius Bradley began his academic career in 1875 at a high school in Oakland, California and eventually became a Professor of Rhetoric at the University of California, Berkeley from which he retired in 1911. 3 Abramson cast doubts on both Bradley’s proficiency with Thai tones and his adeptness in using the Rousselot apparatus, but did credit Bradley as an early pioneer in the study of Thai tones (2013, 228).

32
CHAPTER 4. CURRENT STUDY
4.1 Recruiting Participants
I have chosen to focus this study on female speakers for two reasons. First, the most
recent studies done on Thai tones were done with female speakers with very few exceptions.
Though there has been no evidence for tonal differences in speakers of different genders, the
focus on female speakers avoids any possible tonal variables due to the gender of the speakers.
Second, women are overwhelmingly responsible for cultural, linguistic, and religious
maintenance in immigrant and diasporic communities, as discussed in Chapter 2; and therefore,
are the linguistic gatekeepers of the community. And women are, indeed, at the core of the
linguistic preservation efforts in the LA community. The women may also serve as the linguistic
index for the daughters (either as something to deviate from or to conform towards).
I began the study in LA because the Thai speech community there is much smaller than
in Thailand. Subsequently, I was able to match the demographics of the BKK participants, as
much as possible, to those I had already interviewed in LA. The reverse may have been very
difficult. All participants completed a biographical information survey prior to participation in
the study. I prepared four versions of the survey, specific for each group of speakers that asked
their age, place of birth and residence, the length of residence, first language(s), language(s) used
at home, etc. (Appendix 1). A total of eight mother-daughter pairs participated in this study, four
pairs in LA and four pairs in BKK.
In both locations I targeted fluent speakers of Standard Thai who were talkative and
willing to be interviewed. I specifically looked for Thai mothers who have lived at least ten years
in Bangkok and spoken mostly Standard Thai at home and to their children to avoid any
regionalism that may appear in their tones and the tones of their children. The following sections
describe in more details the recruitment methods as well as the demographic of the participants
in both field locations.
4.1.1 Los Angeles: December 2009 to March 2010
I spent a total of four months in LA observing and getting to know the community and
formally collecting linguistic data. I timed my arrival with His Majesty the King’s birthday in the
first week of December, in order to maximize my exposure to community members. H.M. the
King’s birthday also serves as Father’s Day for Thais. The Thai Buddhist temple where I planned
to meet community members and collect data hosts the annual celebration of H.M. the King’s
birthday for the LA Thai community. At the temple celebration in 2009, I met the founding

33
director of a non-profit health center and began to volunteer that same day at the Census 2010
outreach booth hosted by the center. The health center serves mainly monolingual Thai elders,
women, and children in the community. I remained a volunteer with the health center and the
Thai community for the entirety of my stay in LA, eventually serving as a text translator and
Census outreach specialist.
Through my participation in community advocacy and volunteerism, I was able to
quickly become a trusted, albeit new, member of the community and a familiar face at
community events. All participants in LA were recruited informally through the social and
professional networks I developed through community advocacy projects and events. Though
volunteering served as my entry into the community, it was also an attempt to equalize my
relationship with the community. Not only did I want to get the data necessary for this study
from the community, I wanted to also work for and with the community.
I chose participants for this study who were active members at the Thai Buddhist temple
in LA, following two main assumptions. First, I assumed that regular participation and
involvement with temple activities would increase the frequency of the LA participants speaking
Thai outside their homes. Second, I assumed that the teens who were active temple members
were socially, linguistically, and culturally invested in the Thai community; thus, they were most
likely to 1) be fluent Thai speakers; and 2) have opinions on the notion of Thainess for the
qualitative portion of this study. The young members of the temple were musicians and/or
dancers who often performed traditional Thai music and dances in various events throughout LA.
With or without knowing it, they served as representatives for the Thai people as a whole during
those events. I assumed that, at some point, they had to consider what it means to be a Thai
person, having served in that role myself.
To find my ideal participants at the temple, I approached some temple elders, who were
mostly women, and asked them to help identify teen girls for the study whom they considered to
be the most fluent Thai speakers in that they speak Thai “clearly and properly”.1 The goal was to
get participants whose own community identifies them to be the most fluent speakers in the
desired age group and whose proficiency level in Thai would be sufficient for them to be
interviewed entirely in Thai for the second portion of this study. I hoped to avoid, as much as
possible, any phonetic disfluency that may affect the comparative tonal analysis with Thai
speakers in BKK. Recall that tones are the most salient aspect of the language that Thai listeners
use to judge fluency and accuracy (Wayland 1997).

34
The four LA teens who participated in this study were all born in LA to Thai parents and
have spent varying amounts of time in Thailand. All but one teen, TLA1, reported Thai to be
their first language. TLA1 reported Thai and English as her first languages. Additionally, the LA
teens completed an adapted General Ethnicity Questionnaire (Tsai et al. 2000, Appendix 2) as a
way to mentally prime the LA teens to think about topics to be discussed during the interview,
such as the notion of Thainess and Thai language and culture. The three LA mothers are very
close in age, ranging from 46 to 49 years old. All lived in BKK for more than ten years prior to
moving to LA and reported speaking only ST with their daughters at home. Table 3 below shows
the demographic information for the LA participants. The double line and cell shading separates
each family in the table, so that MLA1 is the mother of TLA1 and TLA2 and so on.
Table 3. Speaker information for LA participants, including the speaker code, age at the time of the recording,
birthplace, number of years in LA, prior place of residence, and number of years in prior place of residence.
ID AGE BIRTHPLACE IN LA PRIOR LOC. YRS
MLA1 49 Saraburi (Central) 18 BKK 30
TLA1 14 LA
TLA2 16 LA
MLA2 51 Nakhon Srithammarat (Southern) 21 BKK 13
TLA3 15 LA
MLA3 49 Udonthani 24 BKK 25
TLA4 15 LA
MLA4 46 Nakhonnayok (Central/Eastern) 18 Nakhonnayok (Central/Eastern) 27
TLA5 15 LA
4.1.2 Bangkok: April 2010 to October 2010
To recruit participants in Bangkok, I sent formal written requests to three schools to
request permission to conduct interviews on their campus. The letter briefly explained my
research topic, a small amount of background information on linguistic research, an explanation
of what I would be doing, and the participants that I seek for the study. Two of the schools
responded, and after a brief meeting with administrators, the principals at each school granted me
permission to recruit participants at their schools. The administrators at both schools expedited
the recruitment process by personally introducing me to school faculty members and staff who
qualified for this study, as described in my letter, and whose daughters also attended the school.
My affiliation with the prestigious Chulalongkorn University in Bangkok greatly facilitated my
entry at both schools.

35
I assumed that, unlike the participants in LA, the notion of Thainess would not be
particularly salient for those in Bangkok and that they may take their Thainess for granted. I
considered the General Ethnicity Questionnaire to not be appropriate for the Bangkok
participants, and instead, asked them to discuss at length the influx of various foreign elements
into the Thai cultural mainstream. I also asked the participants similar questions as those in the
GEQ, especially those regarding their media preferences and consumption (types of music,
television drama, fashion, hobbies, etc.), to try to arrive at the same type of discussion as the
ones in LA. The four BKK mothers range in age from 40 to 56 years old and have lived in the
BKK metropolitan area for more than twenty-five years or were born and raised in the BKK
metropolitan area. All BKK teens were born and raised in the BKK metropolitan area and have
never lived elsewhere. Table 4 below shows the demographic information for the participants in
BKK.
Table 4. Speaker information for BKK participants, including the speaker code, age at the time of the recording,
birthplace, number of years in BKK, prior place of residence, and number of years in prior place of residence.
ID AGE BIRTH IN BKK PRIOR LOC. YRS
MBK1 52 BKK
TBK1 15 BKK
MBK2 56 Nonthaburi (Central) 26 Nonthaburi (Central) 30
TBK2 17 BKK
MBK3 42 Chonburi (Eastern)
TBK3 16 BKK
MBK4 40 Prachinburi (Eastern) 37 Prachinburi (Eastern) 3
TBK4 13 Nonthaburi (Central)
4.2 Recording procedure
4.2.1 Wordlist
The participants were all told that the wordlist was a test and teaching tool for foreigners
learning Thai. I, in turn, presented myself as a Thai-American linguist who studies Thai as a way
to connect with my own community. The goal was to center the reading activity and discussion
on Thainess in order to elicit the “most Thai” pronunciations possible from the speakers in both
the wordlist and the interview. I presented myself as a fellow community member so that the
interactions would be between two community members instead of between a community
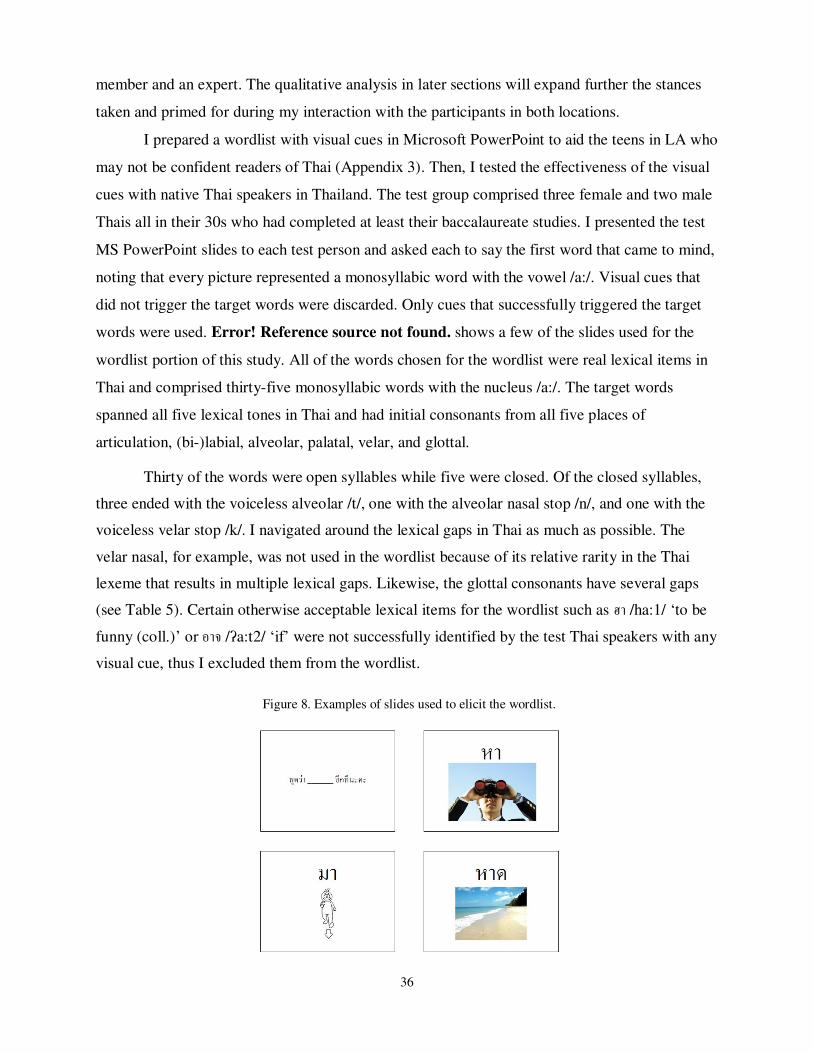
36
member and an expert. The qualitative analysis in later sections will expand further the stances
taken and primed for during my interaction with the participants in both locations.
I prepared a wordlist with visual cues in Microsoft PowerPoint to aid the teens in LA who
may not be confident readers of Thai (Appendix 3). Then, I tested the effectiveness of the visual
cues with native Thai speakers in Thailand. The test group comprised three female and two male
Thais all in their 30s who had completed at least their baccalaureate studies. I presented the test
MS PowerPoint slides to each test person and asked each to say the first word that came to mind,
noting that every picture represented a monosyllabic word with the vowel /a:/. Visual cues that
did not trigger the target words were discarded. Only cues that successfully triggered the target
words were used. Error! Reference source not found. shows a few of the slides used for the
wordlist portion of this study. All of the words chosen for the wordlist were real lexical items in
Thai and comprised thirty-five monosyllabic words with the nucleus /a:/. The target words
spanned all five lexical tones in Thai and had initial consonants from all five places of
articulation, (bi-)labial, alveolar, palatal, velar, and glottal.
Thirty of the words were open syllables while five were closed. Of the closed syllables,
three ended with the voiceless alveolar /t/, one with the alveolar nasal stop /n/, and one with the
voiceless velar stop /k/. I navigated around the lexical gaps in Thai as much as possible. The
velar nasal, for example, was not used in the wordlist because of its relative rarity in the Thai
lexeme that results in multiple lexical gaps. Likewise, the glottal consonants have several gaps
(see Table 5). Certain otherwise acceptable lexical items for the wordlist such as ฮา /ha:1/ ‘to be
funny (coll.)’ or อาจ /ʔa:t2/ ‘if’ were not successfully identified by the test Thai speakers with any
visual cue, thus I excluded them from the wordlist.
Figure 8. Examples of slides used to elicit the wordlist.

37
Table 5. The wordlist, organized by the place of articulation and lexical tones.
Tone 1 Tone 2 Tone 3 Tone 4 Tone 5
BIL
AB
IAL
Sto
p
20. พา
/pʰa:1/
‘to take or bring
along (animate)’
1. ผ า
/pʰa:2/
‘to split, cut’
9. ผ า
/pʰa:3/
‘cloth’
31. ป า
/pa:4/
‘dad (Chinese
loanword)’
23. ผา
/pʰa:5/
‘cliff’
Nasa
l 4. มา
/ma:1/
‘to come’
12. หมาก
/ma:k2/
‘betel’
17. (มา)ม า
/ma:3/
‘a popular brand
of instant noodles’
10. ม า
/ma:4/
‘horse’
33. หมา
/ma:5/
‘dog’
AL
VE
OL
AR
Sto
p 34. ตา
/ta:1/
‘eye, node, knot’
8. ถาด
/tʰa:t2/
‘tray’
28. ท า
/tʰa:3/
‘pier, dock’
5. ท า
/tʰa:4/
‘to challenge,
oppose’
19. ฐาน
/tʰa:n5/
‘pedestal, base,
foundation’
Na
sal 25. นา
/na:1/
‘rice paddy’
21. หน า
/na:2/
‘apple custard’
15. หน า
/na:3/
‘face, page’
29. น า
/na:4/
‘younger maternal
aunt or uncle’
27. หนา
/na:5/
‘thick’
PA
LA
TA
L
Aff
ric
ate
14. ชา
/ʨʰa:1/
‘tea’
32. ฉ า
/ʨʰa:2/
‘splashing, sizzling,
(onomatopoeia)’
2. ชาต
/ʨʰa:t3/
‘nation, race’
22. ช า
/ʨʰa:4/
‘slow’
6. จ า
/ʨa:5/
‘a common
nickname (f.)’
VE
LA
R
Sto
p 16. คา
/kʰa:1/
‘tall coarse grass’
23. ข า
/kʰa:2/
‘galangal’
26. ฆ า
/kʰa:3/
‘to kill’
13. ค า
/kʰa:4/
‘to do business,
commerce’
35. ขา
/kha:5/
‘leg’
GL
OT
TA
L Sto
p
7. อา
/ʔa:1/
‘younger paternal
aunt or uncle’
(no effective
visual cue)
30. อ า
/ʔa:3/
‘to open wide
(e.g. the mouth or
door)’
(lexical gap) (lexical gap)
Fric
ati
ve
(no effective
visual cue)
18. หาด
/ha:t2/
‘beach’
11. ห า
/ha:3/
‘five’
(lexical gap)
3. หา
‘to look for’
/ha:5/
I asked the participants to say each word within the phrase “Can you please say X
again?” or พ ดว า __ อ กท �นะคะ [pʰu:t3 wa:3 __ ʔi:k2 tʰi:1 na4 kʰa4] (see Slide 1, Error! Reference
source not found.). Each
participant said the target word in the frame sentence twice. I recorded directly onto a computer
using Praat, version 5.2, computer program (Boersma and Weenink 2010) at 44.1 kHz with a

38
Logitech unidirectional noise-cancelling desktop microphone. All recordings were done in a
quiet office at each field location.
4.2.2 Interview
After each participant completed the wordlist, I spent 10-45 minutes chatting with each
participant, depending on how talkative the participants were. I primed the participants for the
interview portion of the study by taking several stances during our personal introductions. The
goal was to build a friendly yet formal rapport with each participant. Chapter 6 will discuss in
more details the stances I took as an interviewer as well as the motivation and purpose for each
stance taken. I began data collection with the teens for both the wordlist readings and the
interviews. I asked the teens in both LA and BKK to talk about their lives. I also asked them
about their notions of Thainess and how they apply such notions to their lives as well as general
information about their schools, exams, friends, and siblings. Their mothers, in turn, talked about
their child-rearing experiences, their notions of Thainess, and how they apply such notions to
child-rearing. The interviews were recorded directly onto a computer using the Audacity®
computer program (Audacity Team 2010) at 44.1 kHz using the same external microphone used
for the wordlist.
4.3 Phonetic and Statistical Analysis
The recordings were phonetically analyzed in Praat. Each target word from the wordlist
was labeled and segmented manually. Recall that the tone-bearing unit in Thai is the mora, that
is, the vowels and syllable-final nasals, but not the initial consonants or final stops (Morén and
Zsiga 2006). Therefore, the tone onset and offsets were determined to be the same as the mora
boundaries. The tonal onset was defined as the fifth glottal pulse with high amplitude on the
waveform. For open syllables, the tonal offset was defined as the fifth before last glottal pulse on
the waveform with high amplitude before the glottal closure of the following word.
Figure 9. Token segmentation for 12. หมาก /ma:k2/ for MLA1

39
For the four words that have final stops (2. ชาต /ʨʰa:t3/, 8. ถาด /tʰa:t2/, 12. หมาก /ma:k2/,
and 18. หาด /ha:t2/), the tonal offset was defined as the fifth before last glottal pulse with high
amplitude before the closure of the final consonants. For the only word that has a final /n/, 19.
ฐาน /tʰa:n5/, the tonal offset was defined as the fifth before last glottal pulse on the waveform of
the /n/. Since a final nasal is a tone bearing unit (TBU) in Thai, the tone duration for the word
with a final /n/ was determined to include the entirety of the final /n/ (Morén and Zsiga 2006).
All segmentations were crossed-checked aurally and visually in Praat. Figure 9 and Figure 10
show the tonal onset and offset boundaries for 12. หมาก /ma:k2/ and 19. ฐาน /tʰa:n5/ for MLA1.
Once each token was segmented, I used a Praat script (Appendix 4) to extract F0
measurements at every 10% of the duration, with the first measurement at the tonal onset and the
last measurement at the tonal offset. Each segmented token had a total of 11 measurements.
Next, I converted the raw F0 values into semitones using the logarithmic method, following
Huang (2012), with a base of two and a reference frequency of 100 which is approximately the
lowest pitch found across all speakers, so that y = 12*log2(x/100) where x is the raw F0 value
and y is the logarithmic semitone value.
I further standardized the semitones for intra-speaker comparisons so that z = (x-µ)/σ
where x is the calculated semitone value from the raw F0 value, µ is the mean semitone value for
each speaker, and σ is the standard deviation of all semitone values for each speaker. For inter-
speaker comparisons within and between each group of speakers (LA mothers, LA daughters,
BKK mothers, and BKK daughters), I standardized the semitone values into z-scores so that z =
(x-µ)/σ where x is the calculated semitone from the raw F0 value, µ is the average of the mean
Figure 10. Token segmentation for 19. ฐาน /tʰa:n5/ for MLA1.
40
semitone value for all speakers within each group, and σ is the average of the semitone standard
deviation for all speakers within each group.
The normalized data were then plotted into graphs with the aid of MS Excel. The x-axis
represents the percentage of the duration where 0% is the tonal onset and 100% is the tonal
offset. The y-axis represents the semitone z-score with a range of -2.00 to 2.00, the closest
integers to the semitone z-scores in the data set. I further divided the semitone z-score range
visually into four sections for ease of discussion. Several tokens in this study showed evidence of
creaky voice. In the instances where creakiness is present, the semitone z-scores were calculated
from manually extracted F0 measurements as automatic extraction through the Praat script was
not effective during creaky intervals.
The descriptions of the tones in the next chapter are based on the combination of the pitch
trajectory graphs as well as the data points that produced the graphs. The tone range as graphed
has reference points at semitone z-score values of -2.00, -1.00, 0.00, 1.00, and 2.00. The tone
duration will be discussed in terms of percentages. Tone duration begins at zero percent (0%)
which is the tone onset and ends at one hundred percent (100%) which is the tone offset. There
are eleven data points for the tone duration, each coinciding with the point in the vowel (or rime,
in the case of ฐาน /tʰa:n5/ ), whence the Praat script (Appendix 4) extracted the F0 values from
the pitch track for analysis.
I will use pitch levels, including the semitone z-scores, and tone duration to describe each
tone for each speaker in the next section. I will also refer to each speaker by their speaker code,
MLA3 for speaker number three in the LA mother group, TLA1 for speaker number one in the
LA teen group, and so forth, as befitting the quantitative aspect of this part of the study. I will,
however, use their nickname aliases in the latter portion of this study for the qualitative
discussion of their speech. The following descriptions will make comparisons between the
results from this study to previous studies by Abramson (1962, Figure 3), Gandour et al. (1991),
Potisuk et al. (1994, Figure 4), Morén and Zsiga (2006, Figure 5), Teeranon (2007, Figures 7a
and 7b), and my earlier study, Thepboriruk (2010, Figure 6). The comparisons will illustrate not
only the differences between the each group of speakers in this study, but also the changes in the
tones throughout the years that they have been studied.
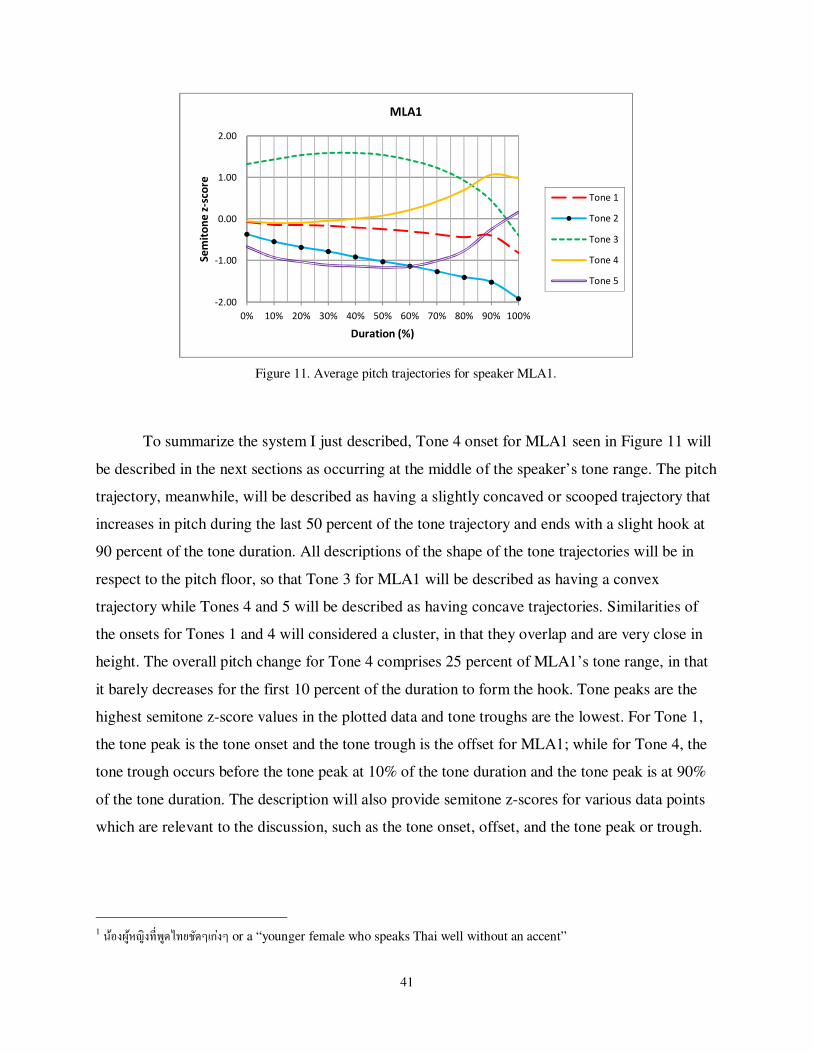
41
To summarize the system I just described, Tone 4 onset for MLA1 seen in Figure 11 will
be described in the next sections as occurring at the middle of the speaker’s tone range. The pitch
trajectory, meanwhile, will be described as having a slightly concaved or scooped trajectory that
increases in pitch during the last 50 percent of the tone trajectory and ends with a slight hook at
90 percent of the tone duration. All descriptions of the shape of the tone trajectories will be in
respect to the pitch floor, so that Tone 3 for MLA1 will be described as having a convex
trajectory while Tones 4 and 5 will be described as having concave trajectories. Similarities of
the onsets for Tones 1 and 4 will considered a cluster, in that they overlap and are very close in
height. The overall pitch change for Tone 4 comprises 25 percent of MLA1’s tone range, in that
it barely decreases for the first 10 percent of the duration to form the hook. Tone peaks are the
highest semitone z-score values in the plotted data and tone troughs are the lowest. For Tone 1,
the tone peak is the tone onset and the tone trough is the offset for MLA1; while for Tone 4, the
tone trough occurs before the tone peak at 10% of the tone duration and the tone peak is at 90%
of the tone duration. The description will also provide semitone z-scores for various data points
which are relevant to the discussion, such as the tone onset, offset, and the tone peak or trough.
1 น องผ หญ งท พ ดไทยช ดๆเก งๆ � or a “younger female who speaks Thai well without an accent”
-2.00
-1.00
0.00
1.00
2.00
0% 10% 20% 30% 40% 50% 60% 70% 80% 90% 100%
Se
mit
on
e z
-sco
re
Duration (%)
MLA1
Tone 1
Tone 2
Tone 3
Tone 4
Tone 5
Figure 11. Average pitch trajectories for speaker MLA1.

42
CHAPTER 5. WORDLIST RESULTS
5.1 Tones for Mothers in LA (MLA Group)
5.1.1 MLA Tone 1
Tone 1 is the most similar across all four mothers in LA, so much so that the pitch
trajectories for all speakers overlap during the middle 30 percent of the duration. Between the
speakers, Tone 1 trajectories vary in terms of onset and offset pitch height. The onsets for all
speakers are approximately at the middle of the speakers’ tone range while tonal offsets range
between the z-scores of 1.00 and -1.00 and Tone 1, overall, falls within the middle 50 percent of
the speakers’ tone range. The pitch trajectories for Tone 1 have a slight decline or gentle
negative slope for all speakers in this group and the tone shapes are fairly static. All trajectories
show a slight hook during the last 20 percent of the tone duration, meaning there is a sudden
drop in pitch which may or may not be preceded by a slight increase in pitch. Overall, Tone 1 is
a mid-range static tone with a mid-range onset and offset. Figure 12 shows the average Tone 1
trajectories for all speakers in the group.
Tone 1 for MLA1 has a relatively static pitch trajectory, in that the decrease in pitch is at
a constant downward trajectory with exception to the hook which begins during the last 20
percent of the duration. The tone has a narrow pitch range and falls between the z-scores of 0.00
and -1.00, or less than 25 percent of her total tone range. The onset is at the midpoint of her tone
range. The tone offset, meanwhile, is slightly above the z-score of -1.00. The hook for MLA1 is
the most prominent of all the speakers in this group. The pitch increases very slightly between 80
-2.00
-1.00
0.00
1.00
2.00
0% 10% 20% 30% 40% 50% 60% 70% 80% 90% 100%
Se
mit
on
e z
-sco
re
Duration (%)
MLA Tone 1
MLA1
MLA2
MLA3
MLA4
Figure 12. Average pitch trajectories for Tone 1 for MLA speakers.

43
and 90 percent of the duration then drops rapidly for the last 10 percent of the duration to reach
the tone’s lowest pitch at the tone offset to form the hook.
MLA2 has the highest tone onset with the tone z-score of 0.400 and the lowest tone offset
with the z-score of -0.967. Not surprisingly, MLA2 has the steepest slope in her pitch trajectory
and, therefore, the largest difference between the tone onset and offset for Tone 1, which is over
25 percent of her total tone range, or a z-score difference of -1.368. She does not have a very
prominent hook for this tone, however. The slope of the pitch trajectory is steeper during the first
half of the tone than the second half of the tone with the difference of z-scores between the tone
onset and at 50 percent of the tone duration of -0.546; whereas the difference between the
midpoint of the tone and at 90 percent of the duration is only -0.305. In the last 10 percent of the
duration the pitch suddenly drops -0.366 in z-score to form the slight hook in the trajectory.
MLA3 has the second highest tone onset for Tone 1, a z-score of 0.267. The offset for
this tone is the highest for the group with the z-score of -0.374. Expectedly, she has the smallest
difference between the tone onset and tone offset, a total difference between the onset and offset
of only 0.640, or approximately half of the pitch change in Tone 1for MLA2, the speaker with
the largest pitch range for Tone 1 in this group. Unlike the first two previous speakers, MLA3’s
trajectory for Tone 1 is a gradual downward path for the first 70 percent that has a total z-score
difference of -0.552. The pitch then rises slightly between 70 and 80 percent of the duration then
drops back down from its highest point for the last 10 percent, reaching its lowest point at the
tone offset and forming the hook.
Tone 1 for MLA4 has the second largest pitch range with the total difference in z-score
between the onset and the offset of -1.193. The tone onset has the z-score of .1166, just above the
midpoint of her tone range and the offset has the z-score of -1.077, or within the bottom 25
percent of her tone range. The trajectory for MLA4’s Tone 1 is the most constant in its
downward path than any other speaker in her group. The pitch falls gradually for the first 90
percent of the duration, a total change in z-score of -0.806. The pitch then suddenly drops during
the last 10 percent of the tone to form a hook but is not preceded by a slight increase in pitch like
the other speakers in this group. The hook, as just described, is very slight and more similar to
what Abramson reported.
MLA speakers share the most similarities for Tone 1, more so than any other tone. Tone
1 for this group of speakers can be characterized as a static mid-level tone with a mid-range
onset and a mid-range offset. The tone trajectories occur within the middle 50 percent of the
speakers’ tone range. MLA speakers all have a change in the rate of pitch change during the last

44
20 percent of the tone duration, resulting in a hook for speakers MLA1 and MLA4. MLA1 has
the smallest change in pitch for this tone and MLA2 has the largest. The consistency of Tone 1
for the speakers in this group is the opposite of the results from Potisuk et al. (1994) which found
more inter-speaker variability for dynamic tones than for static tones. The gradual downward
slope of this tone is different than the mostly plateaued tone shape reported by Abramson (1962)
but is similar to the steady downward trajectory reported by all others since Potisuk et al. (1994).
Tone 1 remains to be a truly mid tone despite the change in the tone shape.
5.1.2 MLA Tone 2
Tone 2, like Tone 1, is fairly consistent for the MLA speakers, though there are variations
in the height of the tone onset pitch. Though still gentle and gradual, the negative slope for Tone
2 is steeper than the slope for Tone 1 in this group. And unlike Tone 1, only two speakers from
this group have a hook at the end of syllable duration. All four speakers in this group show the
most similarities in the pitch height of the tone offset for Tone 2, with all trajectories ending
within the very bottom of each speaker’s tone range and a clustering of trajectories between 80
and 90 percent of the duration. The onsets, meanwhile, hover at the middle of the speakers’ tone
range. Figure 13 shows the average pitch trajectories for Tone 2 in this group.
Tone 2 for MLA1 decreases from the tone onset with the z-score of -0.363 down to a z-
score of -1.912 at the tone offset for a total change in tone z-score of -1.549. The slight hook for
this tone during the last 20 percent of the tone duration disrupts the otherwise constant
-2.00
-1.00
0.00
1.00
2.00
0% 10% 20% 30% 40% 50% 60% 70% 80% 90% 100%
Se
mit
on
e z
-sco
re
Duration (%)
MLA Tone 2
MLA1
MLA2
MLA3
MLA4
Figure 13. Average pitch trajectories for Tone 2 for MLA speakers.

45
downward slope of the pitch trajectory. There is a small increase in pitch, a difference of -0.076
in z-score, which occurs between 80 and 90 percent of the tone duration, followed by a pitch
drop for the last 10 percent of the tone duration, a difference of -0.133 in the z-score that results
in the slight hook. The overall change in pitch for Tone 2 for this speaker is the second largest of
all speakers in this group.
MLA2 has the largest change in pitch for Tone 2, a total difference in the z-score of -
1.695 between the tone onset and offset. The onset for this speaker, with a z-score of 0.161, is
higher than MLA1. MLA2 is the only speaker in her group to have a Tone 2 trajectory that is the
most similar to the one reported by Abramson (1962) with a more rapid decrease in pitch during
the first 25 percent of the tone duration. The offset has a z-score of -1.4741 and is in the bottom
25 percent of her total tone like the other speakers in her group, but is not as low as the offset for
MLA1.
Tone 2 for MLA3 has a smaller change in pitch than the previous two speakers, a
decrease of -1.413 in tone z-score. The onset for her Tone 2 is higher than MLA1 but is lower
than the onset for MLA2, with a z-score of -0.044. The pitch trajectory is a constant downward
decrease of -1.316 in z-score for the first 80 percent of the tone duration. The rate of change for
the pitch does change for the last 20 percent of the duration that would result in a hook at the end
of this tone.
MLA4 has a pitch change of only -1.250 in z-score for the duration of Tone 2, the
smallest pitch change for this tone across all speakers in her group. There is a very slight hook
during the last 20 percent of the tone. The tonal onset for MLA4 is also the lowest of all the
speakers in this group with a z-score value of -0.529. This speaker’s pitch trajectory is constant
in its downward slope for the first 80 percent of the tone. Between 80 and 90 percent of the
duration, the change in pitch is very small with a sudden drop during the last 10 percent of the
tone duration. The tonal offset for this tone, with a z-score of -1.778, is the second lowest of all
the LA mothers.
Overall, Tone 2 for MLA speakers is a mid-low static tone with a mid-range onset and a
low offset that roughly spans the bottom 25 percent of the speakers’ tone range. Only two
speakers, MLA1 and MLA4, in this group have a hook for this tone, though all speakers show a
shift in the pitch trajectory at the end of their tone duration. Speakers MLA2 and MLA3 have a
decrease in the downward slope, but no initial increase in pitch that would result in a hook. Tone
2 of this group of speakers does not have a convex trajectory, that is, a steeper decrease in pitch
followed by a steady decrease, as reported by Abramson (1962); but rather, Tone 2 has a straight

46
trajectory where the pitch decreases steadily throughout the tone duration until it reaches its
lowest point at the tone offset that agrees with all reports since Potisuk et al. (1994). The
negative slope for Tone 2 is steeper than for Tone 1 for all speakers in this group. Despite the
change in the shape of the tone trajectory, Tone 2 remains a static tone with a mid-range onset
and a low offset as first reported by Abramson (1962).
5.1.3 MLA Tone 3
Tone 3 is also consistent across all speakers in the MLA group. Unlike the first two tones,
Tone 3 has a large change in pitch between the tone onset and the tone offset that spans almost
the entire tone range of the speakers. The pitch changes very little during the first 70 percent of
the tone duration, after which the pitch drops suddenly until the tone offset. The onsets occur in
the upper-most 25 percent of the speakers’ tone range while the offsets all are in the middle 50
percent. The tone peaks in Tone 3 for MLA speakers are within the first half of the tone duration.
The lowest pitch for Tone 3 occurs at the tone offsets for all speakers in this group. The shapes
of the pitch trajectories are convex, that is, the tone peak or maximum pitch in the tone occurs
after the tone onset. Figure 14 shows Tone 3 for MLA speakers.
Tone 3 for MLA1 has a convex tone shape and stays within the top 25 percent of the
tone range for the first 70 percent of the tone duration then rapidly drops in pitch for the
remaining 30 percent of the duration. The tone onset has a z-score of 1.324 and is the lowest
-2.00
-1.00
0.00
1.00
2.00
0% 10% 20% 30% 40% 50% 60% 70% 80% 90% 100%
Se
mit
on
e z
-sco
re
Duration (%)
MLA Tone 3
MLA1
MLA2
MLA3
MLA4
Figure 14. Average pitch trajectories for Tone 3 for MLA speakers.

47
onset in this group of speakers. The pitch gradually increases until it reaches its highest point at
30 percent of the duration, after which the pitch gradually decreases for the next 20 percent of
the duration. The pitch remains in the top 25 percent of the speaker’s tone range during the first
70 percent of the tone, a total difference of only 0.269 in z-score between the onset and the tone
peak. In contrast, the fall in pitch during the last 30 percent of the tone duration is a difference in
z-score of -1.646. The tone offset has a z-score of -0.394 for this speaker. The difference
between the tone peak and the lowest pitch for this tone at the offset equals a difference of -1.985
in z-score, or approximately half of MLA1’s tone range.
MLA2 also has a convex shape for Tone 3, though her pitch trajectory is quite different
from MLA1. Unlike the first speaker, the tone begins with a relative plateau during the first half
of the duration. The highest pitch is reached within the first 10 percent of the tone, remaining
stead until 50 percent of the tone range, and then rapidly decreases during the last half of the tone
duration. In all, the difference in pitch between the pitch peak and the pitch trough equals a
difference in z-score of 2.434, or over half the speaker’s tone range. The tonal offset has a z-
score of -0.7519, the lowest in the group.
Tone 3 for MLA3 shares little similarities with other speakers, outside of the height of the
onset. Though the trajectory is convex as for other speakers, this speaker has a very small overall
change in pitch. The trajectory remains within the top 50 percent of the speakers tone range, or
between z-scores 0.00 and 2.00, for the entire duration of the tone. The onset has a z-score of
1.487 and clusters with the onsets of the other speakers in this group but the pitch plateaus for
well over the first half of the tone duration. The shape of the trajectory is, thus, much more flat
than other speakers in this group. The gradual decrease in pitch that occurs during the last 40
percent of the tone constitutes the entire change in pitch for this tone. For this speaker, Tone 3
has the second smallest change in pitch. Tone 1 has the smallest change in pitch. MLA3 is the
only speaker to have a positive-value z-score for the offset of 0.522.
MLA4 also has a convex-shaped pitch trajectory for Tone 3 that begins in the uppermost
portion of her tone range between the z-scores of 1.00 and 2.00. The tone peak is at 20 percent of
the tone duration, the earliest for this group of speakers, and has a z-score of 1.781. The pitch
increases and decreases during the first 40 percent of the tone in very small amounts, then
rapidly drops during the last 50 percent to total a difference in z-score of -1.956 between the tone
peak and the tone offset. The tonal offset has a z-score value of -0.175.
In summary, Tone 3 is a high-mid dynamic tone with a convex trajectory that is fairly
consistent across all speakers in the MLA group, differing mostly in the height of the tone offset

48
pitch. Of all the tones, Tone 3 has the largest differences in pitch between the onsets and the
offsets, covering over 50 percent of the speakers’ tone range, with MLA2 having the greatest
difference between the tone peak and the tone offset. Tone 3 is also the highest tone, in that the
onset and at least half of the tone duration is in the top 25 percent of the speakers’ tone range for
all speakers in all groups. Tone 3, overall, reaches its highest pitch during the first half of the
tone duration then rapidly decreases in pitch during the last half of the tone duration. The tone
has the largest span in pitch out of all five tones. Tone 3, additionally, occupies the highest
portion of the speakers’ tone range and is phonetically the highest tone in terms of pitch reached.
In comparison to Tones 1 and 2, Tone 3 shows more variety in tone trajectory, despite the
relatively consistent height of the onset across all four speakers. The onsets for all speakers are
within the top 25 percent of their tone range, or between the z-scores of 1.00 and 2.00. The
offsets are also somewhat clustered; with the exception of MLA3 whose Tone 3 is the most
varied in her group. MLA3’s offset for Tone 3 falls between the z-score of 1.00 and 0.00, while
the other speakers’ offsets fall much lower at between 0.00 and -1.00. The pitch trajectories are
all convex in shape for all speakers except MLA2, who is the only speaker to have an initial
decrease in pitch instead of an initial increase.
Though the trajectories for Tone 3 in this group of speakers are convex, they are not the
same shapes as the tones recorded by Abramson or Morén and Zsiga. Tone 3 in Abramson’s
study increases in pitch and reaches its highest pitch during the first half of the tone duration
though the decrease in pitch comes much earlier in the tone, at approximately 25 to 30 percent of
the duration. The decrease in pitch for the tones in Abramson’s study is constant and rapid until
the end of the tone duration. Tone 3 in Morén and Zsiga’s study, on the other hand, reaches its
highest pitch a little past the midpoint of the tone duration then rapidly decreases in pitch.
5.1.4 MLA Tone 4
Tone 4 is a mid-range dynamic tone with a concave pitch trajectory and ends with a hook
for all speakers in this group. Though the trajectories for Tone 4 have a similar shape across all
speakers, the overall heights of the tone vary. The lowest pitch points occur during the first 30
percent of the tone duration for all speakers. The tone peaks, or the highest pitch points at 90
percent of the duration. All trajectories end with a hook for Tone 4. The mid-range onsets fall
mostly between z-scores 0.00 and 1.00, with exception to MLA1 whose onset has a z-score of -
0.050. Figure 15 shows the average pitch contours for Tone 4 for MLA speakers.
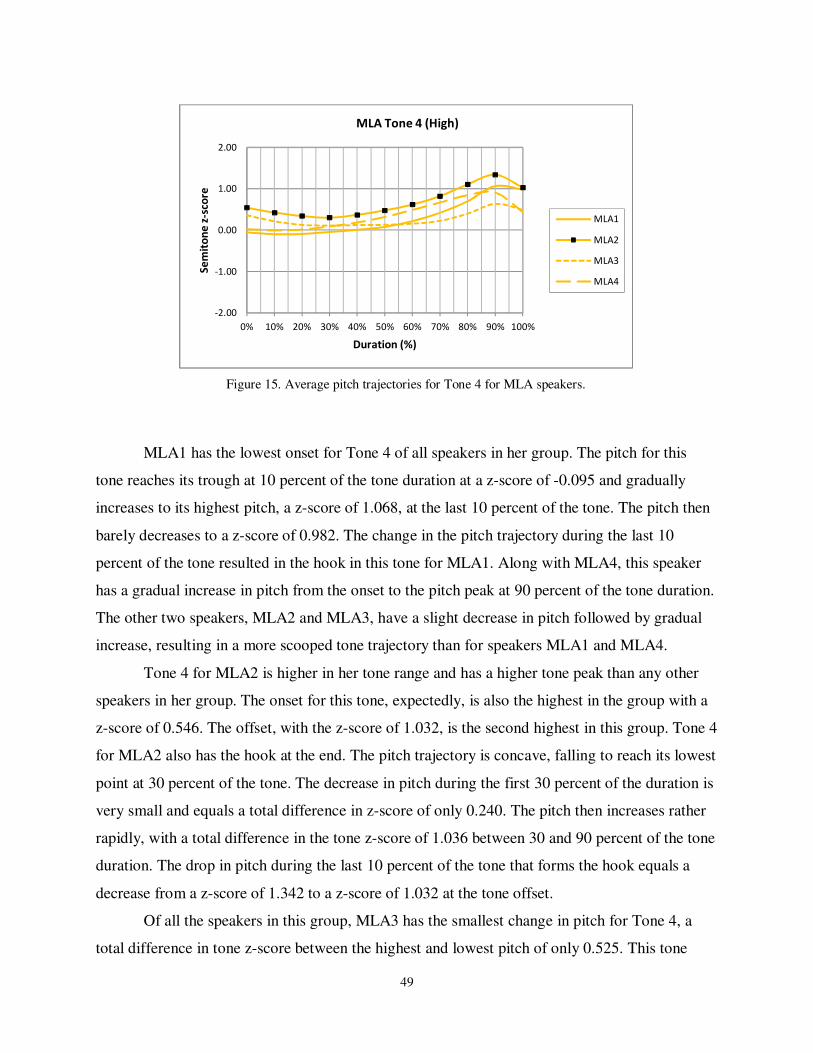
49
MLA1 has the lowest onset for Tone 4 of all speakers in her group. The pitch for this
tone reaches its trough at 10 percent of the tone duration at a z-score of -0.095 and gradually
increases to its highest pitch, a z-score of 1.068, at the last 10 percent of the tone. The pitch then
barely decreases to a z-score of 0.982. The change in the pitch trajectory during the last 10
percent of the tone resulted in the hook in this tone for MLA1. Along with MLA4, this speaker
has a gradual increase in pitch from the onset to the pitch peak at 90 percent of the tone duration.
The other two speakers, MLA2 and MLA3, have a slight decrease in pitch followed by gradual
increase, resulting in a more scooped tone trajectory than for speakers MLA1 and MLA4.
Tone 4 for MLA2 is higher in her tone range and has a higher tone peak than any other
speakers in her group. The onset for this tone, expectedly, is also the highest in the group with a
z-score of 0.546. The offset, with the z-score of 1.032, is the second highest in this group. Tone 4
for MLA2 also has the hook at the end. The pitch trajectory is concave, falling to reach its lowest
point at 30 percent of the tone. The decrease in pitch during the first 30 percent of the duration is
very small and equals a total difference in z-score of only 0.240. The pitch then increases rather
rapidly, with a total difference in the tone z-score of 1.036 between 30 and 90 percent of the tone
duration. The drop in pitch during the last 10 percent of the tone that forms the hook equals a
decrease from a z-score of 1.342 to a z-score of 1.032 at the tone offset.
Of all the speakers in this group, MLA3 has the smallest change in pitch for Tone 4, a
total difference in tone z-score between the highest and lowest pitch of only 0.525. This tone
-2.00
-1.00
0.00
1.00
2.00
0% 10% 20% 30% 40% 50% 60% 70% 80% 90% 100%
Se
mit
on
e z
-sco
re
Duration (%)
MLA Tone 4 (High)
MLA1
MLA2
MLA3
MLA4
Figure 15. Average pitch trajectories for Tone 4 for MLA speakers.

50
does have a concave pitch trajectory and the hook at the end of the tone like the previous two
speakers, however. The tone begins near the middle of the tone range then drops slightly in pitch
for the first 20 percent of the duration. The pitch plateaus during the next 40 percent, after which
it increases to its highest point at a z-score of 0.638. The pitch drops a small amount for the last
10 percent of the tone duration to a z-score of 0.495 at the offset. Like MLA2, the pitch for this
tone decreases gradually after the onset and reaches its lowest point at 30 of the tone duration.
MLA4 has both the concave pitch trajectory and the hook at the end of Tone 4 like other
speakers in her group. The onset is approximately midway in her tone range. Like MLA1, the
pitch decrease very slightly in the first 10 percent of the tone for this speaker, then climbs to its
peak at 90 percent of the tone duration, at which point the pitch drops until the tone offset, a z-
score of 0.438 to form the hook. The difference between the lowest to the highest pitch equals an
increase from a z-score of 0.028 to 0.438, or a total difference in z-score of 0.409.
In summary, Tone 4 can be characterized as a mid-range dynamic tone with a concave
trajectory that ends with a hook. The onsets for this tone all occur in the middle of the speakers’
tone range and the offsets also occur in the middle of the tone range, though slightly higher than
the onsets. The lowest pitch occurs within the first 50 percent of the tone duration and the highest
pitch occurs at 90 percent, followed by a sudden drop in pitch to form the hook. Though the
concave tone shape is consistent in this group, the pitch heights of the tone do vary, with MLA2
having the highest overall pitches for this tone in this group.
Tone 4 has been the focus of many studies because of its relatively new concave shape
and its having become more of a dynamic tone than a static tone in the past few decades.
Abramson (1962) first categorized Thai tones into two groups: static and dynamic, differentiated
by the amount of pitch excursions throughout the tone duration. By his definition and the shape
of the pitch trajectories, Tone 4 was categorized as a static tone in his 1962 study. The Tone 4 in
his study had relatively straight trajectory that ended with a hook, a tone that was very similar to
Tone 1 in both its shape and height in relation to the speakers’ tone range. Whereas Tone 1 in
Abramson’s study had a pitch plateau until the final hook at the end of the tone duration; Tone 4
had a gentle upward slope until the final hook. All later reports since Potisuk et al. (1994) on the
other hand, reported Tone 4 to have a concave trajectory, similar to Tone 5 in shape but higher in
the speakers’ tone range. Zsiga and Nitisaroj (2007) found that the new level of similarities
between Tones 4 and 5 are affecting their distinction and perception by Thai speakers. The
similarities between Tones 4 and 5 are present for LA Mothers as they were for all three age
groups recorded for my 2010 study.

51
5.1.5 MLA Tone 5
Tone 5 is a dynamic mid-low tone with a concave trajectory. The onsets are at the middle
of the speaker’s pitch range, or between z-scores -1.00 and 0.00 for all speakers. The offsets
hover around a z-score of 0.00. The pitch excursions occur mostly within the lower 50 percent of
the speakers’ tone range. For the speakers in this group, the onsets are higher than the offsets in
pitch. The pitch decreases from the onset, the highest pitch point for all speakers, until the lowest
pitch point which occurs during the middle 50 percent of the tone duration. Despite both having
a concave-shaped trajectory, Tone 5 does not have a hook at the end of the tone duration like
Tone 4. Of the five tones, this tone occupies the lowest part of the speakers’ tone range in that
the lowest pitches in the trajectories of Tone 5 were also the lowest data points for all speakers.
All lowest pitch points are within the bottom 25 percent of the speakers’ tone range. Figure 16
below shows Tone 5 for all speakers in this group.
Tone 5 for MLA1 has a concave pitch trajectory that begins at a z-score of -0.667,
decreasing slightly in pitch until the pitch reaches its trough at a z-score of -1.1627 at 50 percent
of the tone duration. The pitch then increases rapidly for the last 50 percent of the tone duration
until it reaches its highest point at the tone offset, a z-score of 1.167. As previously mentioned
above, the rate of increase for the pitch reduces slightly for the last 10 percent of the tone
duration but does not result in a hook like in Tones 1, 2, and 4. The change in pitch for Tone 5
totals a difference in z-score of 1.330, or over 30 percent of the speaker’s tone range.
-2.00
-1.00
0.00
1.00
2.00
0% 10% 20% 30% 40% 50% 60% 70% 80% 90% 100%
Se
mit
on
e z
-sco
re
Duration (%)
MLA Tone 5
MLA1
MLA2
MLA3
MLA4
Figure 16. Average pitch trajectories for Tone 5 for MLA speakers.

52
MLA2 also has a concave pitch trajectory for Tone 5. The pitch decreases from the onset
until it reaches its lowest point at approximately 50 percent of the tone duration and a z-score of -
1.241. The pitch then increases gradually until the tone offset which is also the highest pitch at a
z-score of -0.0513. The tone offset for Tone 5 is only slightly higher than the onset for MLA2.
Tone 5 for this speaker has a total difference in z-score between the lowest and the highest pitch
of 1.189. The rate of the pitch increase in the last 10 percent of the tone duration also decreases
for this speaker as it does for MLA1.
Similar to other MLA speakers, MLA3 has a concave trajectory for Tone 5. The pitch
begins and ends at roughly the same level in her tone range; whereas other speakers have offsets
that are highest pitches than onsets. The onset has a z-score of -0.350 while the offset has a z-
score of -0.394. So unlike MLA1 and MLA2, this speaker’s highest pitch for Tone 5 is the tone
onset and not the offset, but only slightly so. The pitch reaches its lowest point, with a z-score of
-1.388, halfway through the tone duration. The total difference in z-score between the lowest and
the highest pitch is 0.994. There is a slight change in the rate of pitch increase during the last 10
percent of the tone duration, the same phenomenon found in every speaker within this group.
MLA4 has the most unique trajectory for Tone 5 in her group. She has the largest span in
pitch change for this tone, a difference in z-score between the lowest and highest pitch of 1.653.
She also has the lowest onset for Tone 5 in the group with a z-score of -0.915. The tone offset for
this tone, however, is the highest with a z-score of 0.437. The most unique aspect of her Tone 5
is that she has the earliest pitch trough in her group, at 30 percent of the tone duration as opposed
to at 50 percent for other speakers. MLA4, in fact, has a Tone 5 that most closely resembles the
tone recorded by Abramson. MLA4 is the only LA mother that did not live in Bangkok for an
extended period prior to moving the U.S. She moved to LA directly from Nakhon Nayok which
is in the central region of Thailand, but not considered part of the Greater Bangkok Metropolitan
Area.
Tone 5 is more varied across all speakers than any other tone, though the trajectories for
all speakers do cluster at around 35 percent of the tone duration. Overall, the tonal onsets are
between the z-scores of 0.00 and -1.00 while the tonal offsets all fall around the middle of the
tone range for all speakers. MLA2 and MLA3 had smaller changes in pitch for Tone 5 with the
differences in z-score between the lowest and highest pitch of 1.189 and 0.994, respectively;
while the changes in pitch for MLA1 and MLA4 were the differences in z-scores of 1.330 and
1.653, respectively. Tone 5 has no prominent hook but the pitch does increase at a lesser rate
during the last 10 percent of the tone duration for all speakers. Two speakers in this group,

53
MLA1 and MLA4, have tone offsets that are at a higher pitch than the onset, similar to the Tone
5 from Abramson’s study. For the other two speakers’ Tones 5 begin and end roughly at the
same level in their tone range.
Overall, Tone 5 is a dynamic mid-low tone with a concave trajectory. Tone 5 generally
reaches its lowest pitch at approximately midway through the tone duration, with exception for
MLA4, whose lowest pitch for this tone occurs earlier at around 30 percent of the tone duration.
Interestingly, Abramsom (1962) had a Tone 5 with the lowest pitch occurring at approximately
25 percent of the tone duration and Potisuk et al. (1994) had speakers whose trajectories reached
its lowest point at approximately 40 percent of the tone duration. Older speakers from both
Teeranon (2007) and my 2010 study reached the lowest pitch between 40 and 50 percent of the
tone duration; whereas younger speakers reached the lowest pitch later between 50 and 60
percent. Recall that MLA4 never lived in BKK and, thus, most likely never picked up the tonal
features of BKK speakers. It is not surprising, then, that MLA4 should have what we can deem
to be an ‘older’ form of Tone 5, that is, she reaches the lowest pitch sooner than other speakers in
her group who all lived in BKK between 13 to 30 years before moving to LA.
5.1.6 Discussion of MLA Results
Overall, MLA speakers have tones that pattern with the speakers recorded by Potisuk et
al. (1994), the over-sixty group from Teeranon (2007), and most of the Older speakers from
Thepboriruk (2010), despite being at least a decade younger than the speakers in the previous
studies. Tone 1 for MLA speakers is a static mid-range tone that has a very small decrease in
pitch from the onset to the offset and ends with a hook. Tone 2 is a low-mid static tone that has a
slightly steeper slope than Tone 1 and does not end with a hook. Tone 3 is a dynamic high-mid
tone with a concave trajectory that has the largest difference between the highest and the lowest
pitch of any tone. The highest pitch in Tone 3 occurs at approximately 40 percent of the tone
duration for MLA speakers. Tone 4 is a dynamic mid-range tone with a slightly concave
trajectory that ends with a hook. The offset for Tone 4 is higher in pitch than the onset and the
trajectory reaches its lowest pitch early at between 20 and 30 percent of the tone duration. Tone 5
is a dynamic mid-low tone with a concave trajectory that reaches its lowest point within the first
50 percent of the tone duration and does not have a hook. The offsets for this tone are generally
higher than the onset, with exception to MLA3 whose offset is roughly equal to the onset for
Tone 5.

54
The tones for the MLA speakers, in short, seem to be an older form than those of their
peers in Thailand. Tones 1 and 2, both of which are historically very stable, show little variation
in this group of speakers, even when compared with previous studies. The dynamic tones, Tones
3, 4, and 5, have trajectories that align with patterns of older speakers in Thailand in the location
of the highest/lowest pitch and the height of tone offset. Of all the speakers in this group, MLA4
shows the most differences in the trajectories of the three dynamic tones, Tones 3, 4, and 5 which
can be attributed to her never having lived in BKK for any period prior to moving to LA. The
differences may be due to her having arrived with an ‘older’ form of the tones than other
speakers in her group who all spent significant time in BKK before arriving in LA. Figure 17
shows the average pitch trajectories for this group.
The hook in Tone 1 that I observed for the four speakers in this group was also present
for Older speakers (50+ years old) in the study I conducted in 2010. Speakers for Abramson
(1962) had a hook in both Tone 1 and Tone 4 (see Figure 3) though they were males in their 30s
at the time of his study and are, presumably, at least a generation older than the LA mothers I
recorded. The hook in Abramson’s study, additionally, occurred at approximately 75 percent of
the tone duration rather than at 90 percent found in this study and my 2010 study. The Older
BKK speakers I recorded for the 2010 study were between five to twenty years older than the LA
mothers recorded in this study, yet both groups have the hook in Tone 1. The ages of the LA
mothers fall right between the two age ranges in my previous study, Middle (30-40) and Older
-2.00
-1.00
0.00
1.00
2.00
0% 10% 20% 30% 40% 50% 60% 70% 80% 90% 100%
Se
mit
on
e z
-sco
re
Duration (%)
MLA GROUP AVE
Tone 1
Tone 2
Tone 3
Tone 4
Tone 5
Figure 17. Average pitch trajectories for all tones for MLA speakers.

55
(50+), so it unknown whether their tones pattern with their immediate peer group in Bangkok or
not. The Older speakers in the 2010 study had a hook in their Tone 1 and the Middle speakers
(30-40) did not. Note the similarities between the trajectories of MLA speakers and the
trajectories for the Older Speakers in Figure 18.
Morén and Zsiga’s Tone 1 also had a hook, but it is an upward hook, in that the pitch
suddenly increased during the last portion of the tone, as opposed to the downward hook
recorded by Abramson and by my two studies. Interestingly, Morén and Zsiga recorded three
tones, Tones 1, 4, and 5, to have the upward hook. Those same three tones have a hook in both of
my studies, but are downward instead of upward. The hook shows up in Tone 2 for some
speakers in this study as well. Expectedly, the trajectories for the MLA tones do not resemble
those reported by Morén and Zsiga. MLA speakers are approximately twenty years older than
the speakers recorded by Morén and Zsiga and do not have tones that pattern with them.
Teeranon (2007) did not report any hook in the trajectories of the tones, but it is
impossible to tell whether the speakers in her study had the hook or not because she extracted F0
readings at every 25 percent of the tone duration. The F0 values are, therefore, unknown at 80 to
90 percent of the duration where the hook was found in other studies. MLA speakers have many
similarities with the over-sixty group in Teeranon’s study. For example, both groups of speakers
have tones that occupy mostly the middle 50 percent of their overall tone range. The trajectories
Figure 18. Average pitch trajectories for Older Speakers (50+) from
Thepboriruk (2010, 94)
T3
T4
T5
T1
T2

56
for Tones 4 and 5, though both are concaved, are not very similar because the trajectory for Tone
5 is much more scooped than the trajectory for Tone 4.
The change in pitch in Tone 1 for MLA is small and is only about 25 percent of the
speakers’ tone range. The pitch changes in were also small for Tone 1 in both Abramson’s and
Morén and Zsiga’s studies. The entirety of Tone 1’s duration is in the middle of the speakers’
tone range. The Tone 1 onset for MLA speakers was at approximately the middle of their tone
range and the offset was slightly below the midway point between z-scores 0.00 and -1.00,
similar to the speakers recorded by Abramson and Morén and Zsiga as well as those I recorded
in 2010. In fact, Tone 1 has consistently been a mid-range static tone since it was first recorded
by Bradley in 1909. Unsurprisingly then, Tone 1 has shown virtually no variation between
speakers from different age groups in this study.
The onsets for Tone 2, unlike those recorded by Abramson (1962) and Morén and Zsiga
(2006), do not cluster with Tone 5 for any of the LA mothers. The trajectory in Abramson’s
study showed the pitch suddenly dropping off in the first 25 percent of the tone duration then
gradually decreases more or less in a plateau-like manner until the end of the tone. Morén and
Zsiga’s study, however, showed Tone 2 to have a constant negative slope for the pitch trajectory,
similar to those I recorded in Middle (30-40) and Younger (18-24) speakers in 2010. Tone 2 for
the LA mothers patterns with the latter two studies as it has a constant negative slope with no
initial sudden drop in pitch found by Abramson. The MLA results also support findings from
Teeranon (2007) where participants from both the over-sixty and under-twenty age groups
overwhelmingly associate straight pitch trajectories in the lower portion of the pitch range with
Tone 2.
Tone 3 for MLA speakers has tonal characteristics that fall between those found in
Abramson’s study and those in Morén and Zsiga’s study. The speakers in this group reach the
highest pitch in this tone between 30 and 50 percent of the tone duration. The Older speakers in
my 2010 study reached the highest pitch for Tone 3 at 30 percent of the tone duration, Middle
speakers at 50 percent, and Younger speakers at 40 percent. Not surprisingly, none of the Tone 3
trajectories in this group pattern with the Younger speakers from my 2010 study. Tone 3 in
Abramson’s study reached its highest point earlier at approximately 20 or 25 percent of the tone
duration. In Morén and Zsiga’s study, Tone 3 reached the highest pitch at approximately 50
percent of the tone duration.
The total change in pitch from the peak to the trough in Tone 3 is small in comparison to
Abramson’s speakers. The speakers in his study had a Tone 3 that fell from the top of their tone

57
range down to nearly the very bottom of their tone range. The speaker for Morén and Zsiga had
a Tone 3 that dropped in pitch for over 50 percent of her total tone range; whereas, MLA
speakers had a pitch change in Tone 3 that is less than 40 percent of their tone range (38.98%).
Tone 3 for this group of speakers pattern closer to Older speakers in my 2010 study. The results
from this study show that the relatively early pitch peak in Tone 3 for MLA speakers also
patterns with the over-sixty group from Teeranon (2007) rather than the under-twenty group,
whose peak is at or after the middle of the tone duration. The pitch peak of Middle and Younger
speakers from my 2010 study occurred at or after the middle of the tone duration as well.
The tone onset of Tone 3 tone falls within the top 25 percent of the speakers’ tone range,
slightly lower than those recorded by Abramson and of the speakers from the 2010 study. The
onset for Tone 3 in Abramson’s study is at the very top of the speaker’s tone range. Morén and
Zsiga showed a much lower onset for Tone 3, at slightly above the middle of the speaker’s tone
range with a larger difference in pitch between the onset and the pitch peak. Similar to the Older
speakers from the 2010 study, MLA’s offset for Tone 3 falls at approximately the middle of their
tone range, much lower than the younger speakers from the 2010 study. The tone offset in Morén
and Zsiga’s study almost reached the bottom 25 percent of their speaker’s tone range.
I expected the most variety in the trajectories of Tone 4, due to the changes in its shape
within the past 50 years. And, indeed, Tone 4 for MLA speakers is the only tone that has no
cluster in tone trajectories. Though the MLA speakers all have similar shapes for the trajectories,
each speaker varies in overall tone height for Tone 4. Tone 4 has a concave pitch contour for all
MLA speakers, consistent with Potisuk et al. (1994), Morén and Zsiga (2006), Teeranon (2007),
and Thepboriruk (2010). The onset and offset for Tone 4 that occur at approximately the middle
of the speakers’ tone range are the same Abramson (1962), the over-sixty group from Teeranon
(2007), and all three groups from my 2010 study. The offset is higher than the onset for MLA
speakers, Potisuk et al. (1994), and the speaker for Morén and Zsiga. MLA speakers also have a
hook in Tone 4 during the last 10 percent of the tone duration, similar to the Older and Middle
speakers from the 2010 study. Younger speakers in the 2010 study did not have a hook in Tone
4. Again, it is impossible to ascertain whether speakers recorded by Teeranon (2007) had the
hook in any of their tones as the pitch values were not extracted as a frequent enough intervals to
be reported.
The difference in pitch between the highest and lowest pitch in Tone 4 covers
approximately 25 percent of MLA’s tone range. Speakers in both Abramson’s and Morén and
Zsiga’s studies changed in pitch very little as well for this tone. In the 2010 study, Tone 4 is

58
much more scooped, with the largest change in pitch for Younger speakers, followed by Middle
speakers, then Older speakers. The 2010 Older speakers still had a concave shape for this tone,
but had the least amount of contour out of the three age groups recorded. Recall that the over-
sixty listener group in Teeranon (2007) did not identify concave pitch trajectories to be Tone 4
but the under-twenty group did; rather, the over-sixty group associated a straight pitch shape that
has a high onset and offset. The under-twenty group consistently did not associate straight
trajectories with Tone 4. The small amount of pitch excursion in the MLA group supports the
findings of Zsiga and Nitisaroj (2007) who found that pitch trajectories with a low midpoint and
a low- to mid-range offset were associated with Tone 4 by Thai listeners. In fact, Zsiga and
Nitisaroj found that Tone 4 can be associated with any contour that has a rising slope in the last
50 percent of the duration.
The results for MLA speakers agree with those from 2010, in that Tones 4 and 5 are
becoming more similar in their characteristics, namely both tones have a mid-range onset, a low-
to mid-range midpoint, and a mid-range to high offset. The under-twenty group and the Younger
speakers (ages 18-24) from Thepboriruk (2010) show more pitch excursion for Tone 5 than Tone
4. Zsiga and Nitisaroj (2007) found that participants were more unlikely to distinguish between
Tones 4 and 5 as the midpoint pitch is increased in combination with a high endpoint.
Additionally, midpoints associated with Tone 4 were mid-range in pitch in contrast to low to
very low midpoints pitches associated with for Tone 5. The perceptual feature that helped
participants to distinguish between Tones 4 and 5 were the height of the offset and the location
of the lowest pitch in the trajectory. Early locations for the lowest pitch were associated more
with Tone 4 than Tone 5. High offsets are associated with Tone 4, while mid-range offsets are
associated with Tone 5.
Tone 5, as already mentioned above, has a concave pitch contour. The onset, at midway
between the z-score -1.00 and 0.00, is slightly lower in pitch that the offset, which is at
approximately the middle of the speakers tone range. Tone 5 has a larger difference in z-score
between the highest and lowest pitches, equaling to an average of 0.853 for the group; whereas
the average z-score difference in Tone 4 was only 0.77 for the group. The highest pitch in the
tone occurs at the tone offset and the lowest pitch occurs between 50 and 60 percent of the tone
duration. Like for Tone 4, participants in both Teeranon (2007) and Zsiga and Nitisaroj (2007)
associate low midpoints and low offsets with Tone 5. MLA speakers show some similarities
between Tones 4 and 5, about the same as for Older speakers in the 2010 study, but not as much
as the Middle and Younger speakers.
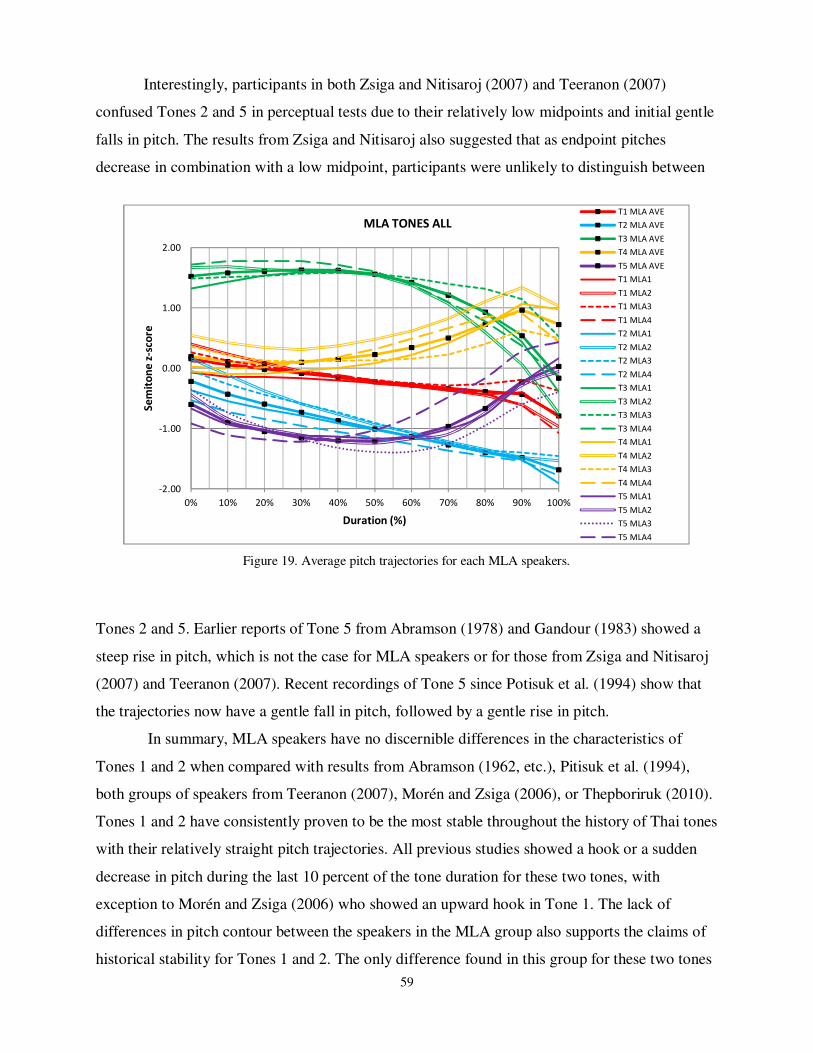
59
Interestingly, participants in both Zsiga and Nitisaroj (2007) and Teeranon (2007)
confused Tones 2 and 5 in perceptual tests due to their relatively low midpoints and initial gentle
falls in pitch. The results from Zsiga and Nitisaroj also suggested that as endpoint pitches
decrease in combination with a low midpoint, participants were unlikely to distinguish between
Tones 2 and 5. Earlier reports of Tone 5 from Abramson (1978) and Gandour (1983) showed a
steep rise in pitch, which is not the case for MLA speakers or for those from Zsiga and Nitisaroj
(2007) and Teeranon (2007). Recent recordings of Tone 5 since Potisuk et al. (1994) show that
the trajectories now have a gentle fall in pitch, followed by a gentle rise in pitch.
In summary, MLA speakers have no discernible differences in the characteristics of
Tones 1 and 2 when compared with results from Abramson (1962, etc.), Pitisuk et al. (1994),
both groups of speakers from Teeranon (2007), Morén and Zsiga (2006), or Thepboriruk (2010).
Tones 1 and 2 have consistently proven to be the most stable throughout the history of Thai tones
with their relatively straight pitch trajectories. All previous studies showed a hook or a sudden
decrease in pitch during the last 10 percent of the tone duration for these two tones, with
exception to Morén and Zsiga (2006) who showed an upward hook in Tone 1. The lack of
differences in pitch contour between the speakers in the MLA group also supports the claims of
historical stability for Tones 1 and 2. The only difference found in this group for these two tones
-2.00
-1.00
0.00
1.00
2.00
0% 10% 20% 30% 40% 50% 60% 70% 80% 90% 100%
Se
mit
on
e z
-sco
re
Duration (%)
MLA TONES ALLT1 MLA AVE
T2 MLA AVE
T3 MLA AVE
T4 MLA AVE
T5 MLA AVE
T1 MLA1
T1 MLA2
T1 MLA3
T1 MLA4
T2 MLA1
T2 MLA2
T2 MLA3
T2 MLA4
T3 MLA1
T3 MLA2
T3 MLA3
T3 MLA4
T4 MLA1
T4 MLA2
T4 MLA3
T4 MLA4
T5 MLA1
T5 MLA2
T5 MLA3
T5 MLA4
Figure 19. Average pitch trajectories for each MLA speakers.

60
was in the height of the onset for Tone 2, though the difference between the highest Tone 2 onset
(MLA2) and the lowest (MLA4) was only .690 in tone z-score. Figure 19 shows the average
pitch trajectories for all tones for each of the MLA speakers and an average pitch contour for the
group for each tone.
As for the three dynamic tones, MLA speakers have characteristics for Tones 3, 4, and 5
that are similar to the Older and Middle speakers from Thepboriruk (2010) and the over-sixty
group from Teeranon (2007), but not to the under-twenty group from Teeranon (2007) or the
speakers from Morén and Zsiga (2006) who were in their late twenties. MLA4 had contour tones
that were the most different from other speakers in her group. Again, this difference may be due
to her being the only MLA speaker to not have spent significant time in BKK prior to moving to
LA.
Tone 3 for MLA speakers reach its highest pitch relatively early (between 30 and 50
percent of the tone duration) and is consistent with findings for Older speakers from my 2010
study and the over-sixty group from Teeranon (2007), and more or less with the findings from
Abramson (1962) though MLA speakers do not have a steep decline in pitch as did the speakers
for Abramson. One speaker in this group, MLA3, showed a relatively straight pitch contour with
a slight fall in the last 10 percent of the duration, similar to the Tone 4 in Abramson (1962) but it
may be due to her idiosyncratic pronunciation and intonation in this particular tone, as she
mostly patterns with other MLA speakers for all other tones. MLA4 reached the highest pitch in
Tone 3 the earliest at 20 percent of the tone duration.
The results for Tone 4 show that MLA speakers, again, pattern with Older and Middle
speakers from the 2010 study, in that this tone has a slightly scooped shape and a hook at the end
of the tone duration. Like in Tone 1, Tone 4 for Morén and Zsiga (2006) has an inverse hook that
showed a sudden increase as opposed to the decrease in pitch found in other studies. Tone 4 also
has a smaller pitch excursion, or less difference in pitch between the lowest and highest pitches
than Tone 5. Lastly, Tone 4 reaches its lowest point at between 10 and 30 percent of the tone
duration and its highest point at 90 percent of the duration, similar to the speakers from
Abramson (1962) and Potisuk et al. (1994). MLA4, once again, reaches the pitch troughs earlier
than other speakers at 10 percent of the tone duration where others reach the lowest pitch
between 20 and 40 percent of the duration.
For Tone 5, MLA speakers showed the most differences in the location of the pitch
trough and the amount of pitch increase following the trough. MLA3, once again, does not
pattern with other speakers in this group, reaching the lowest pitch earlier at 30 percent of the

61
tone duration while others reach their lowest pitches between 50 and 60 percent of the duration.
MLA speakers also varied in the height of the tone offset, though all offsets were all within the
middle of the speakers’ tone range with z-scores of the offset ranging from the lowest of -0.3939
(MLA3) to the highest of 0.4367 (MLA4). Tone 5 reaches its lowest pitch later and has a lower
offset when compared with Tone 4, two characteristics that match how Thai speakers perceive
these two tones (Teeranon 2007 and Zsiga and Nitisaroj 2007).
5.2 Tones for Teens in LA (TLA Group)
5.2.1 TLA Tone 1
Tone 1 is a mid-range level tone that is quite similar for the speakers in this group, with
exception to TLA2, whose uniqueness will be described in more details during the discussion
below. Tone 1 is truly a mid tone in that the pitch excursions for this tone are all within the
middle 50 percent of the speakers’ tone range. The small differences between each speaker’s
trajectories are found in the steepness and duration of the initial fall in pitch. The onsets all fall
within the middle of the speakers’ tone range. All speakers, except for TLA2, have trajectories
that cluster for the last 50 percent of the tone duration, showing that, once again, Tone 1 is
overwhelmingly stable across speakers of all ages. The overall tone shape for Tone 1 is a gentle
downward slope for the pitch trajectory. There is some evidence of a small hook, or the rise and
fall of the pitch during the last 20 percent of the tone duration. TLA4 has the most prominent
-2.00
-1.00
0.00
1.00
2.00
0% 10% 20% 30% 40% 50% 60% 70% 80% 90% 100%
Se
mit
on
e z
-sco
re
Duration (%)
TLA Tone 1
TLA1
TLA2
TLA3
TLA4
TLA5
Figure 20. Average pitch trajectories for Tone 1 for TLA speakers.

62
hook, and even so, it is not very large. Figure 20 shows the average pitch trajectories for Tone 1
for TLA speakers.
Tone 1 for TLA1 has a gentle slope and gradually decreases in pitch from the onset to the
offset. The onset is approximately midway between z-score 0.00 and 1.00 and the offset is
approximately midway between -1.00 and 0.00. The tone has a very slight hook, with an
increase of only 0.068 in z-score between 80 and 90 percent of the tone duration. Between 90
percent of the duration and the tone offset, the difference in z-score for the pitch was -0.190. The
total decrease in pitch of Tone 1 for TLA1 equals a change of -0.982 in z-score from tone onset
to tone offset.
TLA2 also has a gentle slope with gradual pitch decrease for Tone 1. TLA2 has the
lowest tone onset and offset than any other speaker in her group. The rate of pitch decrease for
Tone 1 during the first 70 percent of the tone duration has a difference in z-score between the
onset and at the 70 percent point of -0.597. The pitch then increases until the last 10 percent of
the tone duration, at which point there is a slight decrease. The tone onset is at the middle of the
speaker’s tone range with a z-score of 0.008. The offset is at approximately midway between the
z-scores 0.00 and -1.00 with a z-score of -0.628. TLA2 has the most unique Tone 1, with a
trajectory that does not pattern with other speakers; whereas the other TLA speakers have
trajectories that overlap for most of the duration for Tone 1.
The Tone 1 trajectory for TLA3 is almost identical to that of TLA1. In fact, the pitch
trajectories nearly overlap for the entirety of the tone duration. The onset for this speaker’s Tone
1 is midway between the z-scores of 0.00 and 1.00 and the offset is between the z-scores of -1.00
and 0.00, the same as for TLA1. The pitch trajectory has a gentle slope and a gradual decrease of
the pitch throughout the tone duration, with a total decrease in z-score of -1.033. TLA3 does not
have a hook at the last 10 percent of Tone 1. Like for TLA1, the highest pitch is the tone onset
and the lowest pitch is the tone offset.
TLA4 has a Tone 1 trajectory that is similar to TLA1 and TLA3 but has a prominent
hook at the end of the tone. The total change in pitch in Tone 1 equals -0.993 in z-score. The
tone offset has a z-score of -0.363 that is the same as the Tone 1 offset for TLA5. During the last
50 percent of the tone duration, the pitch barely deviates away from the middle of the pitch range
with exception to the sudden drop in pitch during the last 10 percent of the trajectory; therefore,
the overall trajectory for this tone is mostly straight with a hook at the end of the tone. The initial
fall in pitch is steeper and equals a difference in z-score of -0.658; whereas the gradual fall in
pitch until the offset equals only -0.335.

63
Tone 1 for TLA5 would be similar to speakers TLA1, TLA3, and TLA4 if it was not for
her much lower tone onset. At a z-score of 0.111, the onset is the second lowest in this group,
second to TLA2. This speaker has the straightest trajectory for Tone 1 and, thus, has the smallest
change in pitch between the tone onset, the highest pitch, and the tone offset, the lowest pitch.
The total decrease in pitch between the onset and offset equals only -0.474 in z-score. Despite
her much lower onset, TLA5 has a trajectory that overlaps with speakers TLA1, TLA3, and
TLA4 for the last 50 percent of the tone duration. The end of the tone also has a slight hook.
Tone 1 for TLA speakers can be characterized as a static mid-range tone with a mid-
range onset and a mid-range offset, making this tone a truly mid tone. The entire duration of the
tone trajectories occur all within the middle 50 percent of the speakers’ tone range. TLA
speakers have fairly consistent trajectories for Tone 1 which are also similar to those of their
mothers. But unlike their mothers, not all TLA speakers have a hook at the end of this tone. Only
speakers TLA1 and TLA4 have hooks for this tone. The trajectories for this group of speakers,
however, mostly overlap at the mid-point of the duration and then cluster at the tone offset.
Speakers TLA1, TLA3, and TLA4 have a change in the rate of pitch decrease during the first 50
percent of the tone duration. Of all the speakers in this group, speakers TLA1, TLA3, and TLA4
share the most similarities for Tone 1.
In summary, the LA teens have trajectories for Tone 1 that are more similar to their
mothers in terms of onset height, the slope of the trajectory (overall change in pitch), and offset
height with younger speakers from Teeranon (2007) and Thepboriruk (2010) who are closer in
age. The younger speakers in the two previous studies have overall pitches for Tone 1 that are
much higher in their pitch range than those recorded in older speakers. Further, some speakers in
this group have a hook at the end of the tone like their mothers, even TLA2 whose tone was the
most innovative in her group; whereas there were no hooks for any younger speakers in the 2010
study.
TLA2 has a trajectory for Tone 1 that is overall much lower than the other speakers in her
group, even her sister, TLA1. Her average pitch for Tone 1 has a z-score of -0.437; whereas the
average pitch for her sister has a z-score of -0.041. In fact, TLA2 has only one point in the
trajectory that has a positive z-score, the onset. The uniqueness of TLA2’s tone trajectories for
all five tones may be due to her strong affinity to the Thai language and her insistence on
speaking Thai to her family and sister, as well as her strong sense of Thai identity. TLA2 was the
only speaker in her group that reported regularly speaking Thai with her peer group and who also
reported having Thai-speaking friends in Thailand with whom she regularly communicates.

64
Unlike other TLA speakers, TLA2 may be socially indexing other Thai teens in Thailand in her
speech. I will discuss the teens’ attitudes towards the Thai language, culture, and identity in more
details in Chapter 6.
5.2.2 TLA Tone 2
Tone 2 is a static low tone with a mid-range onset and a low offset. In fact, the pitch
excursions for this tone take place mostly within the lower 50 percent of the speakers’ tone
range. The Tone 2 trajectories for TLA speakers are not as consistent as for Tone 1 and do not
overlap for a portion of the tone duration. The onsets are at or around the z-score of 0.00 and the
offsets all fall within the z-scores of -1.00 and -2.00, with exception to TLA2 whose offset is
much higher and falls above the z-scores of -1.00. Both the onsets and offsets cluster for the
other TLA speakers. The slopes for Tone 2 are steeper than for Tone 1 for all speakers in this
group. Only TLA4 has a hook at the end of this tone. Error! Reference source not found. shows
the average pitch trajectories for Tone 2 for TLA speakers.
TLA1 has the second lowest onset and also the second lowest offset for Tone 2. The
onset has a z-score of 0.164 and the offset has the z-score of -1.176. The total change in pitch
between the highest pitch, the onset, and the lowest pitch, the offset, equals a decrease of –1.339
in z-score. Like speakers TLA3, TLA4, and TLA5, TLA1 has a gentle downward slope for Tone
2 with no hook at the end of the tone duration. The decrease in pitch is gradual throughout the
-2.00
-1.00
0.00
1.00
2.00
0% 10% 20% 30% 40% 50% 60% 70% 80% 90% 100%
Se
mit
on
e z
-sco
re
Duration (%)
TLA Tone 2 (Low)
TLA1
TLA2
TLA3
TLA4
TLA5
Figure 21. Average pitch trajectories for Tone 2 for TLA speakers.
65
duration of the tone. The trajectory slope is steeper between the onset and at the tone midpoint
than for the last 50 percent of the duration. All but one data point, the tone onset, occurs within
the bottom 50 percent of the speaker’s tone range.
The trajectory for Tone 2 begins similarly for TLA2 as for other speakers in her group
but becomes quite different at 30 percent of the tone duration. The onset is at approximately the
middle of the tone range and a z-score of 0.008. TLA2 has the highest offset with the z-score of -
0.628. The pitch trajectory is, once again, different from other speakers in this group. The lowest
pitch in this tone occurs at 60 percent of the trajectory, followed by a slight rise and then a final
fall during the last 10 percent of the tone duration that does not quite form a hook. The final
decrease in pitch between 90 percent of the duration and the offset equals only a difference in z-
score of -0.074 and the increase in pitch leading up to it totals only 0.051 in z-score. Unlike other
speakers, the Tone 2 for TLA2 has a nearly straight trajectory, with an overall difference in z-
score of -0.636 between the tone onset and the tone offset.
Of the speakers in this group, TLA3 has the most unique trajectory for Tone 2. TLA3 has
the highest onset, the lowest offset, and, therefore, the steepest negative slope for this tone. The
onset has a z-score of 0.278 while the offset has a z-score of -1.521 which is the same as the
offset for TLA4. TLA3 has a total difference in z-score of -1.807 between the Tone 2 onset and
offset, or nearly half of her total tone range, the largest such difference in this group. The
decrease in pitch is greater during the first 80 percent of the tone duration, a total difference in z-
score of -1.716; whereas the decrease in pitch during the last 20 percent equals a z-score
difference of -0.092.
TLA4 has a trajectory for Tone 2 that closely matches that of TLA1 but TLA4 has a
slightly higher tone onset and a hook at the end of the tone. In fact, the trajectories overlap for
the majority of the tone duration. TLA4 has a fairly gentle slope with the greatest decrease in
pitch occurring within the first 90 percent of the tone duration, like other speakers in this group.
The change in pitch during the first 90 percent of the tone duration totals a decrease of -1.213 in
z-score; whereas the decrease in pitch during the last 10 percent equals only a change of -0.346
in z-score. There is no hook in Tone 2 for TLA4. The onset for this speaker’s Tone 2 clusters
with speakers TLA1, TLA2, and TLA3, with the main convergence in the trajectories occurring
at 20 percent of the tone duration. TLA4 is the only speaker in this group to have a hook at the
end of Tone 2.
TLA5 has the lowest overall Tone 2. She has the lowest tone onset with a z-score of -
0.322, the only onset with a negative value. In fact, TLA5 is the only speaker whose Tone 2 have

66
all negative z-score values. The tone offset for Tone 2 is the second lowest to speakers TLA3 and
TLA4, with a z-score of -1.521. The offset z-score is the same as the Tone 2 offset for TLA4.
The trajectory for this tone is, like for other speakers, a gentle negative slope but with a more
rapid rate of pitch during the first 60 percent of the tone duration. The last 40 percent of the
trajectory has two changes in the rate of pitch decrease which is more rapid for the last 10
percent of the tone. TLA5 does not have a hook in this tone.
Tone 2, overall, is truly a low tone for the LA teens, with the trajectories occurring
mostly in the bottom 50 percent of the speakers’ tone range. The heights of the tone onsets are
fairly consistent across the speakers in this group, at approximately the middle of the speakers’
tone range. TLA5 has the lowest pitch for the onset and TLA3 has the highest. The heights of the
tone offsets, on the other hand, are rather diverse. The offsets all occur between the z-scores of
0.00 and -2.00, with the highest being TLA2 and the lowest are speakers TLA3 and TLA4. Only
one speaker in this group has a hook at the end of this tone.
When compared with their mothers, the TLA speakers have very similar tone trajectories
for Tone 2; though the MLA speakers vary according to the height of the tone’ onset and TLA
speakers vary mostly in the height of the offset. Recall that Zsiga and Nitisaroj (2007) found that
the height of the offset is more important than the height of the onset. The results seem to show
that the LA speakers are aiming at the same pitch target for Tone 2, which is low on their tone
range, with exception to TLA2 whose offset for Tone 2 can be considered to be mid-range.
Tone 2 pitch trajectories for the speakers in this group pattern closely with each other,
with exception to TLA2 whose tone, once again, is different from others in her group. Overall,
the tone has a gentle negative slope like Tone 1; though the total change in pitch is more than
that of Tone 1. The onsets are at the middle of the speakers’ tone range. The offsets fall within
the bottom 25 percent of the tone range, between the z-scores -2.00 and -1.00, again with
exception to TLA2. Both the onsets and the offsets cluster for Tone 2 in this group of speakers.
When compared to earlier reports of Tone 2, the TLA trajectories are higher in the
speakers’ tone range. The rate of pitch change is fairly consistent throughout the tone duration,
unlike the curved Tone 2 trajectory from Abramson (see Figure 3). More recent reports since
Potisuk et al. (1994) showed a straight downward trajectory for Tone 2 with no changes in the
rate of pitch change at any point in the tone duration. Recall that Gandour et al. (1991) found less
inter-speaker variability in Tones 3 and 5, the dynamic tones, than the static tones, Tones 1, 2,
and 4. The results from this study, however, show that it is the static tones, Tones 1 and 2, that
are stable across different group of speakers.

67
5.2.3 TLA Tone 3
Tone 3 for TLA speakers is a dynamic high tone with a high onset, a high mid point, and
a mid-range offset. The tone has a convex trajectory for all speakers except for TLA2. The onsets
are in the top 25 percent of the speakers pitch range while the offsets are within the middle 50
percent, again, with except to TLA2, whose offset is also within the top 25 percent of her tone
range. The overall change in pitch for Tone 3 in this group of speakers is much smaller than for
MLA speakers. Only one speaker in this group, TLA3, has a rapid drop in pitch during the last
50 percent of the tone duration; whereas the other three speakers show a rapid pitch decrease
during the last 30 percent. Tone 3 is the highest of all the five tones, in that the trajectories
occupy the highest portion of the speakers’ tone range for a large portion of the tone duration.
The speakers in this group vary mostly in the height of the tone offset pitch for Tone 3. Figure 22
shows the average pitch trajectories for Tone 3 for TLA speakers.
TLA1 have almost the same pitch contour for Tone 3 as TLA4. The pitch trajectory
begins approximately midway between the z-scores 1.00 and 2.00, or in the top 25 percent of the
speaker’s tone range (z = 1.473), gradually decreases for the first 60 percent of the tone duration,
after which the pitch falls from a z-score of 1.330 (60%) to 0.346 (offset). The total change in
pitch from the onset to the offset equals a difference in z-score of -1.127, or approximately 25
percent of the speaker’s tone range.
-2.00
-1.00
0.00
1.00
2.00
Se
mit
on
e z
-sco
re
Duration (%)
TLA Tone 3
TLA1
TLA2
TLA3
TLA4
TLA5
Figure 22. Average pitch trajectories for Tone 3 for TLA speakers.

68
Tone 3 for TLA2 begins slightly higher than midway between z-scores 1.00 and 2.00,
with a z-score of 1.614. Like TLA1, this speaker has a gradual decrease in pitch, but throughout
the tone duration, with an increase fall in pitch during the last 10 percent of the tone. Otherwise,
there is no change in the rate of the pitch excursion downwards. The total change in pitch
between the onset, z-score of 1.614, and the offset, z-score of 1.050, is very small and equals a
difference in z-score of only -0.563. This is the only tone where TLA2 patterns with other
speakers in her group. But once, again, this tone does not share any characteristics with her
sister, TLA1.
TLA3, on the other hand, has the most unique Tone 3 in this group. In addition to having
the highest onset with a z-score of 1.7239, or nearly the very top of her tone range, TLA3 also
has the lowest offset with a z-score of -0.8134. In fact, the pitch excursion in Tone 3 is entire in
the top most region of her tone range, between the z-scores of 1.00 and 2.00. TLA3 also has the
largest difference in pitch between the onset and the offset, a difference in z-score of 2.537. The
total pitch excursion for this tone spans over 60 percent of her entire tone range, the largest such
excursion for any speaker in any group for any tone. The pitch contour begins with a very small
increase in pitch to reach the pitch peak at 20 percent of the tone duration. Between 20 and 60
percent of the duration, the pitch falls gradually from a z-score of 1.735 to 1.289. The trajectory
then steeply declines from a z-score of 1.289 to the offset at -0.813, with a slight decrease in
slope in during the last 10 percent of the duration.
Tone 3 for TLA4, as already mentioned, is very similar to Tone 3 for TLA1. The pitch
trajectory overlaps for 60 percent of the tone duration, differing only in the amount of pitch
decrease during the last 40 percent. The onset for this speaker has a z-score of 1.451 and the
onset has a z-score of .1794, with the total pitch change of 1.272 over the tone duration. The
offset is lower than that of TLA1 and is the second lowest offset pitch in the group.
The TLA speakers vary mostly in the height of the offset for Tone 3. Overall, the onsets
cluster at approximately midway between z-scores 2.00 and 1.00. The trajectory is dynamic,
showing a decrease in pitch starting at 40 percent of the tone duration. With exception to TLA3,
the speakers in this group do not have a drastic fall in pitch during the last half of the tone. The
pitch decreases do not fall below the z-score of 0.00. The offset for TLA3, however, has a z-
score of -0.813, the lowest in the group. Once again, TLA1 and TLA2 do not have similar
characteristics for this tone despite being sisters.

69
5.2.4 TLA Tone 4
TLA speakers have the most variation in the shapes of trajectories for Tone 4. While the
onsets do cluster just above the middle of the speakers’ tone range, the offsets heights are
different across the speakers in this group. Two speakers, TLA3 and TLA5, have a hook at the
end of this tone. TLA2, once again, has a trajectory that is unique in her group and TLA4 has the
lowest overall pitch for Tone 4. Tone 4 is one of the two tones that have a concave trajectory.
The shape of the trajectory is characterized by a slight decrease in pitch after the onset until the
tone reaches its lowest pitch in the first half of the tone duration. The pitch then increase until it
reaches its highest pitch. For speakers TLA2 and TLA1, the highest pitch is achieved at the end
of the tone, at the tone offsets. For speakers TLA3 and TLA5, the highest pitches occur at 90
percent of the duration and are followed by a decrease in pitch until the offset, forming a hook at
the end of the tone. TLA4 is the only speaker in this group to have a lower pitch at the tone offset
than the onset. Figure 23 shows the average pitch trajectories for Tone 4.
TLA1 has similar pitch heights for the onset and the offset for Tone 4. The onset has a z-
score of 0.236 while the offset has a z-score of 0.361. The pitch reaches its lowest point at 40
percent of the tone duration with a z-score of -0.177. The decline in pitch during the first 40
percent of the tone duration and the remaining 60 percent are roughly equal, a difference in z-
score of -0.412 and -0.538, respectively. TLA1 has a nearly symmetrical trajectory for Tone 4, in
that the lowest pitch occurs at approximately midway through the tone duration. Additionally,
-2.00
-1.00
0.00
1.00
2.00
0% 10% 20% 30% 40% 50% 60% 70% 80% 90% 100%
Se
mit
on
e z
-sco
re
Duration (%)
TLA Tone 4
TLA1
TLA2
TLA3
TLA4
TLA5
Figure 23. Average pitch trajectories for Tone 4 for TLA speakers.

70
the trajectory for Tone 4 occurs in the middle of the speaker’s tone range. There is no hook in
Tone 4 for TLA1.
TLA2, again, does not pattern with the other speakers for Tone 4. Though the pitch
trajectory for this tone is concave like it is for the other TLA speakers, she reaches her lowest
pitch in this tone within 20 percent of the tone duration with the z-score of 0.103. The change in
pitch during the first 20 percent of the tone is very small and only equals a difference in z-score
of -0.179; whereas the increase in pitch during the last 80 percent of the tone, or between the
lowest pitch and the tone offset, equals 2.090, or roughly half of her tone range. In fact, the offset
for this tone tops her tone range with a z-score of 1.986, the highest of all speakers in any group.
TLA2 also reaches the lowest pitch earlier than any other speakers in her group.
TLA3 has the highest tone onset for Tone 3 in this group with a z-score of 0.396 but the
onset still clusters with speakers TLA1, TLA2, and TLA5. This speaker has a hook at the end of
Tone 4. The offset has a z-score of 0.809. The tone trajectory is concave in shape and reaches its
lowest pitch at 50 percent of the tone duration with a z-score of -0.152. The highest pitch occurs
at 90 percent of the tone duration with a z-score of .888. The pitch then falls slightly from its
peak to the offset, a total difference in pitch of -0.079 in z-score and forms the hook. The
increase in pitch between the lowest and highest pitch is greater than the decrease in pitch during
the first half of the tone. The initial pitch decrease equals a difference in z-score of -0.548;
whereas the increase in pitch during the 50 to 90 percent of duration equals -1.040, nearly 100
percent more. The pitch trajectory for this speaker overlaps with TLA1 during the first half of the
tone, and then the trajectories diverge during the last half as the pitch continues its steep increase
for TLA3.
TLA4 has the lowest overall pitch for Tone 4. The entire Tone 4 pitch excursions occur
within the lower 50 percent of the speaker’s tone range. TLA4 is the only speaker in this group
to have no positive z-score values for this tone. The Tone 4 trajectory for this speaker is most
similar to the Tone 4 trajectory for TLA1, in that the lowest pitch occurs at the middle of the tone
duration and there is no hook at the end of the tone but occurs all in the lower half of the
speaker’s tone range as opposed to the middle for TLA1. Though there is a change in the rate of
pitch change during the last 10 percent of the tone duration, the change was not enough to form a
hook. The pitch onset clusters with other speakers and is the highest pitch point for this tone with
a z-score of -0.013. The lowest pitch has a z-score of -0.747 and occurs at the tone offset. TLA4
also has the lowest offset for this tone in the group with a z-score of -0.160.

71
TLA5 has the least concaved pitch trajectory in this group of speakers. The change in
pitch between the onset, a z-score of 0.280, and the lowest pitch, a z-score of 0.188, only equals
a difference in z-score of -0.091. This speaker also reaches the lowest pitch quite early in the
tone duration, at 30 percent. The earliest low-point was at 20 percent of the tone duration for
speaker MLA2. Because the difference in pitch is so small between the tone onset and the lowest
pitch, speaker TLA5 has the highest low-point in Tone 4, even higher than TLA2 whose Tone 4
is the overall highest in the group. TLA5’s onset does cluster with speakers TLA1, TLA2, and
TLA3, however. The increase in pitch between the highest point in the tone at 90 percent of the
tone duration and the lowest point at 30 percent totals a difference of only 0.816, the smallest
such difference in this group.
In summary, Tone 4 is a dynamic mid-range tone with a mid-level onset, offset, and
midpoint. Tone 4 for all speakers in this group has a concave trajectory. Two of the speakers in
this group, MLA3 and MLA5, have a hook at the end of this tone; whereas the other three
speakers, MLA1, MLA3, and MLA4, did not. Speakers MLA1 and MLA4 have very similar
trajectories for Tone 4, the main difference being the over height of the tone in the speakers’ tone
range. MLA4 has the lowest overall pitch for this tone and is the only speaker to have all
negative z-score values for this tone. When compared with Tone 4 trajectories in the MLA
group, the LA teens have more variation in the trajectories than did their mothers. TLA speakers
also have an overall lower Tone 4 in their tone range than the MLA speakers. Additionally, only
two the TLA speakers have a hook at the end of their tone; whereas all every MLA speakers had
hooks for Tone 4.
The variation found in the Tone 4 trajectories was unsurprising, given that the shape for
Tone 4 has been in flux for the past decades. Abramson characterized Tone 4 as a static high-
level tone. And indeed, Tone 4 in his study occupied the top portion of his two speakers’ tone
range. The trajectory had little pitch excursion. From the onset to the highest point in the tone
duration, the pitch increased steadily until the highest point of the tone duration which occurred
at approximately 75 percent of the tone duration. The pitch then decreased for the next 25
percent of the duration until the offset, forming a wide hook. In Abramson’s study, Tone 4 had a
similar shape to Tone 1 but is higher on the speakers’ tone range and has a gradual upward slope;
whereas Tone 1 had virtually no change in pitch until the last 25 percent of the duration when the
pitch drops to its lowest point at the offset, forming a hook.
The trajectories for Tone 4 since Potisuk et al. (1994) are concave and the tone occupies
mostly the middle of the speakers’ tone range. The pitch gradually decreases from the onset to

72
reach its lowest point during the first half of the tone duration. For speakers in Potisuk et al.’s
study the lowest point in Tone 4 was reached within the first 20 percent of the tone duration.
Older speakers from Teeranon (2007) reach the lowest point in Tone 4 at approximately 25
percent of the tone duration and younger speakers reach the lowest point at 50 percent. The
results from my 2010 study showed that the lowest pitch in Tone 4 is getting progressively later
for younger speakers. Older speakers from that study reached the lowest pitch at approximately
20 percent of the tone duration, Middle speakers at approximately 30 percent, and Younger
speakers at approximately 50 percent. The overall pitch for the tone is also getting progressively
lower for younger speakers. Of the three groups of speakers in the 2010 study, Younger speakers
have the lowest overall pitch for Tone 4. The TLA speakers, when compared with their mothers,
the MLA speakers, also have lower overall pitches for Tone 4. In fact, only two MLA speakers
have negative values at all for Tone 4, and even then, the values were for the lowest points in the
trajectory.
5.2.5 TLA Tone 5
Tone 5 has the most variation out of all five tones for this group of speakers. There are no
clusters at any point of the trajectories and very few instances where the trajectories overlap for
different speakers. The tone trajectories vary in the heights of the tone onsets, the heights of the
lowest pitch, where the lowest pitch occurs, the height of the offset pitch, the overall change in
pitch, and the difference between the height of the onset pitch and the offset pitch. Some
speakers have a higher pitched onset than offset while others have the opposite. Despite the
amount of variation, Tone 5 can still be characterized as a dynamic mid-low tone with a concave
trajectory for all speakers. The majority of the pitch excursions occur within the lower 50 percent
of the speakers’ tone range, with the exception of the offset for TLA3 which has a z-score higher
than 0.00. As with for MLA speakers, the pitch troughs for Tone 5 in this group are all within the
lowest 25 percent of the speakers’ tone range. Tone 5 is also the lowest of the five tones, in that
the lowest pitches in this tone are the lowest data points for all the speakers. Figure 24 shows the
average pitch trajectories for Tone 5 for TLA speakers.

73
TLA1 has the smallest difference in pitch height between the onset and offset in this
group. The onset is approximately midway between z-scores -1.00 and 0.00 and has a z-score of
-0.405. The offset for this speaker is the lowest in the group with a z-score of -0.891. TLA1 also
reaches the lowest pitch in the tone the latest in the tone duration at 70 percent of the tone
duration. The pitch decreases in a gentle slope from the tone onset for the first 70 percent of the
tone duration then rises in a much steeper slope for the last 30 percent. The pitch changes a total
of portion of the tone duration equals a difference of -1.417 in z-score while the last 30 percent
has an increase in pitch of 0.944. Because the lowest pitch is reached so late in the tone duration,
TLA1 has a pitch trajectory that is different from the other speakers in her group.
Of all the speakers in this group, TLA2 has the flattest trajectory for Tone 5, meaning she
has the smallest overall change in pitch than any other speakers. TLA2 has the highest pitch for
the low-point of Tone 5 and the highest high-point in the group so that she has the highest overall
pitch for this tone. Tone 5 for this speaker begins with a z-score of -0.736, after which the pitch
decreases until it reaches its lowest point at 40 percent of the tone duration with a z-score of -
1.114, a total difference in z-score of -0.378. The pitch offset is slightly higher in pitch than the
onset and has a z-score of -0.390. The increase in pitch between the lowest pitch and the offset
equals 0.724 in z-score. As with the other tones, TLA2 has a trajectory for this tone that does not
pattern with any other speakers in her group.
TLA3 has the highest tone onset and offset for Tone 3 in this group of speakers. The tone
onset has a z-score value of -0.110 and the offset has a z-score of 0.607. TLA3 reaches the
-2.00
-1.00
0.00
1.00
2.00
0% 10% 20% 30% 40% 50% 60% 70% 80% 90% 100%
Se
mit
on
e z
-sco
re
Duration (%)
TLA Tone 5
TLA1
TLA2
TLA3
TLA4
TLA5
Figure 24. Average pitch trajectories for Tone 5 for TLA speakers.

74
lowest pitch at approximately midway through the tone duration at a z-score of -1.389. The
decrease in pitch during the first half of the tone duration is a difference in z-score of 1.279 while
the increase in pitch during the last half equals 1.996, or approximately half of the speaker’s tone
range. TLA3 has the largest difference between the lowest and highest pitch for this tone in the
group. She is also the only speaker to have a positive z-score value for the tone offset. When
compared to the other speakers, TLA3 has a Tone 5 trajectory that is most similar to TLA4 but
TLA3’s trajectory is much more scooped.
Tone 4 for TLA4 occupies the lower 50 percent of her tone range and has a concave
trajectory. The onset has a z-score of -0.418 and the offset has a z-score of -0.663, the onset
being higher than the offset by 0.246 in z-score. TLA4 reaches the lowest point in the tone at the
middle of the tone duration, a z-score of -1.351. The tone offset is the highest pitch in the tone.
The rate of pitch change is more rapid for the first half of the tone duration. The difference in
pitch between the onset and the lowest pitch equals -0.934 while the difference between the
lowest point and the offset equals 0.688. Compared with the other speakers in her group, TLA4
has a trajectory that the most similar to TLA3’s trajectory, in that they both reach their lowest
pitch in the tone at approximately midway through the tone duration. They do differ in the
heights of the onsets and the offsets, however. TLA3 has a very high onset for this tone and
TLA4 does not.
TLA5 has a relatively shallow concave trajectory for Tone 5. The lowest pitch is reached
at 40 percent of the tone duration, earlier than other TLA speakers, and has a z-score of -1.563.
The onset for this speaker is the lowest in the group and has a z-score of -1.125, the only onset
with a z-score value below -1.00. TLA5 also has one of the lowest tone offsets, second only to
TLA1, with a z-score of -0.828. The pitch for the tone offset is higher than the pitch for the tone
onset, with a difference in in z-score of 0.297. Between the onset and the lowest pitch, the pitch
decreases a total of -0.438; whereas it increases a total of 0.735 between the lowest pitch and the
tone offset.
TLA speakers vary the most in Tone 5. Like the other two dynamic tones, Tones 3 and 4,
the offset shows the greatest variety between the speakers in this group. In fact, there are no
clusters for the onset, midpoint, or offset. All speakers do have a concave or scooped contour for
the pitch trajectory. Two speakers, TLA3 and TLA4 reach the pitch trough in this tone at 50
percent of the tone range; speakers TLA2 and TLA5 at 40 percent; and TLA1 at 70 percent. The
majority of the pitch trajectories are within the lower 50 percent of the speakers’ tone range, with
exception to TLA3 who has the highest offset with the only a positive z-score of 0.607. TLA3

75
also has the highest onset with a z-score of -0.110. TLA5 has the lowest onset, the only one with
a z-score below -1.00. TLA1 has the lowest pitch trough with a z-score of -1.836 and the lowest
offset with a z-score of -0.891. TLA2 has the least amount of pitch excursion for this tone, again,
with the most differences in pitch trajectory from the other speakers in this group.
5.2.6 Discussion of TLA results
Overall, TLA speakers have tone trajectories that resemble those of their mothers with
some differences which can be categorized as generational. TLA speakers also have trajectories
that are similar to Younger speakers from my 2010 study despite being at least ten years younger
in age. Tone 1 for TLA speakers is a static mid tone with a mid-level onset and a mid-level
offset. Tone 1 has a small change of pitch between the highest point, the tone onset, and the
lowest point, the tone offset. The tone excursions for Tone 1 all occur within the middle 50
percent of the speakers’ tone range and are gentle downward slopes for all speakers. TLA2 is the
only speaker whose trajectory does not overlap with any other speakers in this group. She has the
lowest overall pitch for Tone 1 in this group with all negative z-score values for this tone except
for the onset which has a z-score of 0.008. All other TLA speakers have Tone 1 trajectories that
overlap for portions of the tone duration. Figure 25 shows the average tone trajectories for the
TLA group.
-2.00
-1.00
0.00
1.00
2.00
0% 10% 20% 30% 40% 50% 60% 70% 80% 90% 100%
Se
mit
on
e z
-sco
re
Duration (%)
TLA GROUP AVE
Tone 1
Tone 2
Tone 3
Tone 4
Tone 5
Figure 25. Average pitch trajectories for all tones for TLA speakers

76
Tone 2 can be categorized as a static low tone with a large change in pitch between the
highest point, the tone onset, and the lowest point, the tone offset. Most of Tone 2 pitch
excursions occur within the lower 50 percent of the speakers’ tone range. TLA5 has the lowest
overall pitch for Tone 2 and TLA2 has the highest. TLA2 was the only speaker whose Tone 2
did not end within the lower 25 percent of her tone range. Like the other static tone, Tone 1, the
shapes of tone trajectories for Tone 2 are fairly consistent for TLA speakers
Tone 3 for TLA speakers is a dynamic high tone with a high onset and a high or mid-
range offset. The trajectories begin with a pitch plateau or a very small change in pitch, followed
by a drop in pitch until the tone offset. Speaker TLA3 has the largest decrease in pitch between
the highest point of the tone at 20 percent of the tone duration and the lowest pitch at the offset.
She is also the only TLA speaker to have a negative z-score for the Tone 3 offset. Speakers
TLA1 and TLA5 have a sudden drop in pitch at 60 percent of the tone duration until the tone
offset. Speaker TLA2 has the pitch drop at 90 percent and TLA4 has the pitch drop at 80 percent.
The tone trajectories for Tone 4 in this group all have a concave shape. TLA speakers
vary mostly in the height of the tone offset. Tone 4 for this group is a dynamic mid tone with a
mid-range onset, a mid-range midpoint, and a mid-range offset. The speakers in this group reach
the lowest point in Tone 4 within the first 50 percent of the tone duration. Speakers TLA1,
TLA3, and TLA4 reach the lowest point at 50 percent and speakers TLA2 and TLA5 at 20
percent. TLA2, once again, has a trajectory that does not pattern with other speakers for this tone
and has a high-, not mid-range offset, topping her own tone range at a z-score of 1.968. Only
speakers TLA3 and TLA5 have hooks at the end of Tone 4 in this group.
Tone 5 is a dynamic low tone with a mid to low onset, a low midpoint, and a mid to low
offset. The shape of the trajectory for this tone is concave. No speakers in this group have a hook
at the end of Tone 5. In this tone, the TLA speakers vary in the height of the onset, the height and
location of the mid-point, the height of the offset, and the relative height between the onset and
offset. Speakers TLA2 and TLA5 reach the lowest point at 40 percent of the tone duration, TLA3
and TLA4 at 50 percent, and TLA1 at 70 percent. Speaker TLA3 has the highest onset and
offset; subsequently she also the largest difference in pitch between the lowest and the highest
pitch in the tone. TLA2, TLA3, and TLA5, have higher pitches for the tone offset than the onset
and, therefore, have their highest pitches for Tone 5 at the tone offset.TLA1 and TLA4, however,
have lower tone offsets than onsets and, therefore, have their highest pitches at the tone onsets.

77
5.2.7 Thai Tones in Los Angeles, California
The LA teens have tone trajectories that are quite similar to those of their mothers but
have some tonal markers of younger Thai speakers. For example, the LA teens reach the lowest
pitches in Tones 4 and 5 later in the tone duration than their mothers. They also have lower
overall pitches for those two tones, both markers of younger Thai speakers (Thepboriruk 2010).
The differences between these two generations of LA speakers are more subtle than the
differences found between Teeranon’s over-sixty and under-twenty groups or between the Older
and Younger speakers in my 2010 study. Figure 26 provides a comparison between the tones of
the MLA and TLA groups.
Compare the pitch trajectories from Figure 25 to those from the Younger speakers from
my 2010 study (Figure 27) and notice the similarities between the two groups of speakers,
despite age differences of up to 12 years between the youngest LA speaker and the oldest
speaker from 2010. The LA teens show some similarities as well to the under-twenty group from
Teeranon (2007) too. Amongst these three groups of young speakers, those from the 2010 study
are the oldest, then the under-twenty group from Teeranon (2007), and the LA teens from this
study are the youngest. The tone onsets for Tones 1, 2, and 4 cluster at approximately the middle
of the speakers’ tone range. For Teeranon’s under-twenty speakers, the onset for Tone 5 clusters
with these three tones too. The two static tones, Tones 1 and 2, differ for the young speakers in
-2.00
-1.00
0.00
1.00
2.00
0% 10% 20% 30% 40% 50% 60% 70% 80% 90% 100%
Se
mit
on
e z
-sco
re
Duration (%)
LA COMPARISON
MLA Tone 1
TLA Tone 1
MLA Tone 2
TLA Tone 2
MLA Tone 3
TLA Tone 3
MLA Tone 4
TLA Tone 4
MLA Tone 5
TLA Tone 5
Figure 26. Average pitch trajectories for MLA and TLA speakers.

78
terms of the steepness of the negative slope but are otherwise fairly straight trajectories with very
little pitch excursions. The overall change in pitch is less for Tone 1 than for Tone 2 across all
three groups.
The three dynamic tones, Tones 3, 4, and 5, also have many similarities for the young
speakers. First, the trajectories for Tone 3 do not begin with a pitch increase as they do for the
Older and Middle speakers from the 2010 study and for the over-sixty group from Teeranon
(2007). In other words, the older speakers from the 2010 study and Teeranon (2007) have convex
trajectories for Tone 3 and the three groups of young speakers do not. Instead, the young
speakers have Tone 3 trajectories that begin as a pitch plateau or a gradual pitch decrease that
ends with a sudden drop in pitch towards the end of the tone duration. The highest pitch in Tone
3 for the three groups of young speaker is, therefore, the onset. The 2010 Older speakers and the
over-sixty group from Teeranon (2007), however, reach the highest pitches for Tone 3 at 20 and
25 percent of the tone duration, respectively. For the Younger 2010 speakers, the sudden
decrease in pitch begins at approximately 70 percent of the tone duration; whereas, for the LA
teens, the decrease begins slightly earlier at 60 percent. The under-twenty group from Teeranon
(2007) begins the decrease in pitch at approximately 50 percent of the tone duration. Recall the
Teeranon extracted data points at every 25 percent intervals, so the pitch decrease could have
occurred anywhere between 50 to 70 percent of the duration.
The other two dynamic tones, Tones 4 and 5, have very similar concave trajectories for
all three groups of speakers, though the Younger 2010 speakers reach the lowest pitches in those
Figure 27. Average pitch trajectories for Younger speakers from Thepboriruk (2010, 95)

79
two tones later than the LA teens. Speakers in Teeranon’s under-twenty group also reache their
lowest pitches at approximately midway through the tone duration. The lowest pitch for Tone 5
occurs later in the tone duration than the lowest pitch for Tone 4 in all three groups. Tone 5 is
also overall lower in pitch than Tone 5, so that the former is a dynamic mid tone and the latter is
a dynamic low tone. The lowest pitches in Tones 4 and 5 for the Younger 2010 speakers occur at
approximately 50 and 60 percent, respectively. The LA teens, meanwhile, reach the lowest
pitches at 30 and 50 percent, respectively. In essence, the main difference between Tones 4 and 5
for young speakers are the pitch heights for the onsets, offsets, mid-points, and where in the tone
duration the lowest pitch occurs. Tone 4 has a mid-level onset, a mid-level mid-point, a mid-
level offset, a higher pitched offset than the onset, and the lowest pitch occurring within the first
50 percent of the tone duration. Tone 5, on the other hand, has a mid-level onset, a low mid-
point, a mid- to low-onset, with an offset that is lower than or equal to the onset in pitch.
Tone 1 for the TLA group is truly a mid tone, with the relatively straight pitch trajectory
that has an average z-score difference between the onset and the offset of only -0.625. The onset
and the offset are roughly at the same height above and below the mid-point of the tone range
with z-scores of 0.274 and -0.352, respectively. The pitch does decline at a slightly steeper rate
during the first 30 percent of the duration but the overall slope of the pitch trajectory is nearly
straight. The hook at the end of this tone can only considered a hook because of the small
increase in the rate of pitch change during the last 10 percent of the tone duration. The hook,
-2.00
-1.00
0.00
1.00
2.00
0% 10% 20% 30% 40% 50% 60% 70% 80% 90% 100%
Se
mit
on
e z
-sco
re
Duration (%)
LA TONE 1
MLA
TLA
Figure 28. Tone 1 for LA speakers.

80
when compared with other groups of speakers, such as MLA speakers or Older and Middle
speakers from my 2010 study is negligible in shape. Younger speakers from the 2010 study also
did not have any ‘hooks’ in their tones. Only the Older speakers had prominent hooks. Middle
speakers from the 2010 study still had ‘hooks’ but they were much less prominent than those
found in Older speakers. Figure 28 shows a comparison of Tone 1 between MLA and TLA
speakers.
Apart from TLA2, Tone 1 was the most consistent across the speakers in this group.
TLA2 has the lowest Tone 1 of any speaker. Her Tone 1, despite being different from the rest of
the other speakers still has a trajectory that is more similar to those in her speaker group than the
Younger speakers from the 2010 study or those recorded by Teeranon (2007). Despite the
different ages and place of origin of the speakers being compared and recorded, Tone 1 remains
the most stable out of all the tones in Thai. What little variety we see between the results from
this study and those from previous studies for Tone 1 is mainly in the height of the tone and the
height of the offset. The lack of variety in Tone 1’s trajectory supports results from Zsiga and
Nitisaroj (2007) that found the pitch at the midpoint and offset of the contour to be the most
salient cues in identifying tones for Thai listeners. The stability of Tone 1 across the two groups
of LA speakers does not support the results of Gandour et al (1991) which found more inter-
speaker variability in ‘static’ tones.1
TLA2, of all of the speakers in this group, identifies the most strongly with being Thai.
She also reported the highest amount of Thai language media consumption within this group.
Her younger sister, TLA1, said during her interview that the two of them speak mostly Thai
amongst themselves despite both being bilingual in English and Thai. TLA2 reported on the
GEQ that she did not learn English until she entered the U.S. school system and TLA1 reported
both Thai and English as her first languages. Additionally, TLA2 is described as being “really
into speaking Thai” by her sister. This strong affinity to the Thai language and Thainess,
combined with her constant consumption of Thai language media may contribute to the
differences in her tones when compared with other speakers from the TLA group.
Because TLA2’s tones are so different from the other speakers in her group, they do not
pattern with the young speakers from previous studies. Younger speakers in the 2010 study have
an overall higher pitch for both Tones 1 and 2 than the Middle and Older speakers. TLA
speakers, however, have a lower overall pitch for Tone 1 but a higher overall pitch for Tone 2
than MLA speakers. The Younger speakers in the 2010 also have the largest difference in pitch
between the onset and offset for Tone 2, resulting in the steepest slope across the three groups of

81
speakers. The slope for Tone 1, however, is nearly the same for all three groups of speakers in
the 2010 study. TLA speakers have a smaller difference between the onset and offset for both
Tones 1 and 2 than the Younger speakers. The nearly straight contour in this group supports the
perception results from Zsiga & Nitisaroj (2007) where Tone 1 is generally associated with a
straight pitch contour without any sudden or steep slope. Participants in their study also
identified trajectories with a mid-range onset and mid-range offset to be Tone 1. Figure 29 shows
Tone 2 for the LA speakers.
The trajectories for Tone 2 in the TLA group, expectedly, do not match those in
Abramson (1962), given the extreme differences in age between the speakers. This tone’s
contour also has a gentler slope than the Tone 2 in Morén and Zsiga (2006). The under-twenty
group for Teeranon (2007) had a Tone 2 with small pitch excursions as well, but her speakers
had a slight increase in pitch during the last 25 percent of the tone duration, a characteristic that
is not found in any other report or in any of the LA speakers. The offset for Tone 2 in the TLA
group fell between the z-score of -1.00 and -2.00, the same as for MLA speakers. The overall
pitch excursion for Tone 2 was within the bottom 50 percent of the tone range, similar to Tone 2
for MLA speakers and all other previous reports for this tone. The results from this group
support the findings of Teeranon (2007) where participants in both the over-sixty and under-
twenty group associate a straight slope in the bottom of the tone range with Tone 2. The Tone 2
results for TLA and MLA speakers also support the findings in Zsiga and Nitisaroj (2007) that
-2.00
-1.00
0.00
1.00
2.00
0% 10% 20% 30% 40% 50% 60% 70% 80% 90% 100%
Se
mit
on
e z
-sco
re
Duration (%)
LA TONE 2
MLA
TLA
Figure 29. Tone 2 for LA speakers.

82
Thai listeners identify a gentle fall combined with a low midpoint and endpoint with Tone 2 in
citation form. Zsiga and Nitisaroj (2007) also found that the steeper the decline in pitch, the more
Thai listeners confused Tone 2 with Tone 5. In such cases, they rely on the height of the offset to
distinguish the two tones. Much like Tone 1, Tone 2 is generally stable across different groups of
speakers with different ages, again contradicting the findings in Gandour et al. (1991) where
‘static’ tones have more inter-speaker variability.
For Tone 3, TLA speakers have trajectories that generally match those of their mothers.
TLA1 and TLA4 have the rapid drop in pitch during the final 40 percent of the tone duration like
their mothers, MLA1 and MLA3, respectively, but the two teen speakers do not have an initial
increase in pitch found in the trajectories of their mothers. The initial rise in pitch reported by
Abramson (1962) was already an optional characteristic for Tone 3 in Gandour et al. (1991).
Even though Morén & Zsiga (2006) had a speaker who had this feature, none of the under-
twenty speakers in Teeranon (2007) had this trait, nor did the speakers from my 2010 study, but
the over-sixty group for Teeranon (2007) did. For the speakers who have a pitch increase after
the onset, the highest pitch is reached within the first 50 percent of the tone duration. For those
who do not, the highest pitch for Tone 3 is the onset. Gandour et al. (1991) also reported that
Tone 3 had the smallest degree of variability between the two groups of speakers in their 20s and
50s. TLA3 has a pitch contour that does not match any of the speakers in this group or those in
the MLA group. Figure 30 shows the average Tone 3 trajectories for LA speakers.
-2.00
-1.00
0.00
1.00
2.00
0% 10% 20% 30% 40% 50% 60% 70% 80% 90% 100%
Se
mit
on
e z
-sco
re
Duration (%)
LA TONE 3
MLA
TLA
Figure 30. Tone 3 for LA speakers.

83
I expected the most variation in Tone 4 between the LA speakers and the speakers in
previous studies because of the on-going change in Tone 4 (Teeranon 2007, Pittayaporn 2007)
and, indeed, this variability is borne out. Teeranon (2007) found that speakers from the over-
sixty group reach the lowest pitch for Tone 4 within the first 25 percent of the tone duration;
whereas the under-twenty group reaches the lowest pitch at 50 percent of the tone duration.
Results from Thepboriruk (2010) study support her findings. Older speakers (ages 50+) reached
the peak trough at approximately 25 percent of the tone duration while Middle and Younger
speakers reach the trough at 50 percent. Figure 31 shows the average pitch trajectories for MLA
and TLA speakers.
Interestingly, Teeranon (2007) reported that the over-sixty group perceived Tone 4 as a
‘level’ tone despite their own production of Tone 4 as a dynamic tone. The under-twenty group,
however, both perceived and produced Tone 4 as a dynamic tone. In fact, Tone 4 for the under-
twenty group is so much of a contour tone that it is being confused with Tone 5, especially as the
difference between onset and offset pitch increased. The differences found between the two
groups of LA speakers is similar to the differences found between the three groups of speakers
from my 2010 study, in that, Younger speakers have a lower overall pitch and a larger change in
pitch for Tone 4 despite having similar onset and offset pitch heights with older speakers. The
LA results further support the findings from Teeranon (2007) that Tone 4 in younger speakers
are becoming a mid-rising dynamic tone as opposed to the level high tone of previous
generations.
-2.00
-1.00
0.00
1.00
2.00
0% 10% 20% 30% 40% 50% 60% 70% 80% 90% 100%
Se
mit
on
e z
-sco
re
Duration (%)
LA TONE 4
MLA
TLA
Figure 31. Tone 4 for LA speakers.

84
These results also support the findings of Zsiga & Nitisaroj (2007) where Thai speakers s
associate Tone 4 with a mid-range midpoint and a gentle rise in pitch. To distinguish between
Tones 4 and 5, the participants in their study rely on the location of the highest and lowest pitch
in the trajectories because Tone 4 has an earlier pitch trough than Tone 5, a distinguishing
feature found in both groups of LA speakers. The 2007 study participants also associate a low
midpoint in combination with a high endpoint with Tone 4. Tone 5, on the other hand, is
associated with a low midpoint and a low to mid-range endpoint that must not be higher than the
middle of the tone range. Their findings are consistent with the Tone 4 pitch trajectories found in
the two groups of speakers in LA.
Tone 5 for the two groups of LA speakers has a mid-range midpoint and a mid-range
endpoint. The onsets for both groups are approximately midway between z-scores 0.00 and -
1.00. The offsets for Tone 5 are higher than the onsets but are still at the middle of the speakers’
tone range. MLA speakers have a lower onset but a higher offset than their daughters. The same
generational differences can be found between the Older speakers from the 2010 study and the
Younger speakers. When compared with the two speaker groups in Teeranon (2007), TLA
speakers have similar trajectories as the under-twenty group, in that the lowest pitch in Tone 5 is
reached approximately midway in the tone duration. The over-sixty group from Teeranon (2007)
reaches the lowest pitch at 25 percent of the tone duration. Younger speakers from the 2010
study also reach the lowest pitch later than Older and Middle speakers, at approximately 60
-2.00
-1.00
0.00
1.00
2.00
0% 10% 20% 30% 40% 50% 60% 70% 80% 90% 100%
Se
mit
on
e z
-sco
re
Duration (%)
LA TONE 5
MLA
TLA
Figure 32. Tone 5 for LA speakers.

85
percent of the tone duration; whereas Older and Middle speakers reach their lowest pitches
within the first 50 percent of the duration. Figure 32 shows the average pitch trajectories for
Tone 5 for LA speakers.
Zsiga & Nitisaroj (2007) reported that, while Tone 4 is associated with a gentle rise in
pitch, Tone 5 is associated with a steep rise. Looking at Tone 5 from all previous studies, we find
that Tone 5 does have a steeper rise in pitch than Tone 4, despite both tones having a concave or
scooped pitch trajectory. When combined with the relative heights between the tone onset and
offset, the differences between Tones 4 and 5 begin in emerge. In summary, Tone 5 has a
concave contour that reaches the pitch trough before the middle of the tone duration for older
speakers and at or after the 50 percent mark of the duration for younger speakers. The offset for
Tone 5 is at approximately the same pitch height for younger speakers but at a lower pitch height
for older speakers. Tone 5 is distinguished by its steep rise in pitch as opposed to the gentle rise
in pitch in Tone 4.
In summary, the tone trajectories of the LA mothers and LA teens are similar in overall
shape and height in the speakers’ tone range (see Figure 26). What generational difference there
are between the two groups, are quite small, such as where in the tone durations the speakers
reach their lowest pitches for Tones 4 and 5. The tone trajectories for the LA teens are so similar
to their mothers that they pattern with speakers in Bangkok from previous studies who are at
least 10 years older than they are. The LA mothers, likewise, pattern with speakers in Thailand
that are nearly 20 years older. Table 6 shows the summary of the tonal features for the LA
speakers. The main differences in the trajectories have been highlighted below.

86
Table 6. Summary of tonal features for LA speakers.
MLA TLA
Sta
tic
Ton
es
1
Onset Mid Mid
Midpoint Mid Mid
Highest Onset Onset
Lowest Offset Offset
Offset Mid Mid
Shape Straight Straight
2
Onset Mid Mid
Midpoint Low/Mid Low/Mid
Highest Onset Onset
Lowest Offset Offset
Offset Low Low
Shape Straight + hook Straight
Dy
na
mic
To
nes
3
Onset High High
Midpoint High High
Highest 30% of duration Onset
Lowest Offset Offset
Offset Mid Mid
Shape Convex Convex
4
Onset Mid Mid
Midpoint Mid Mid
Highest 90% of duration Offset
Lowest 20% of duration 40% of duration
Offset Mid/High Mid/High
Shape Concave + hook Concave
5
Onset Mid/Low Mid/Low
Midpoint Low Low
Highest Offset Offset
Lowest 50% of duration 50% of duration
Offset Mid Mid
Shape Concave Concave

87
5.3 Tones for Mothers in BKK (MBK group)
5.3.1 MBK Tone 1
Tone 1 for MBK speakers is a static or level mid-range tone. The onsets cluster at the
middle of the speakers’ tone range and the offsets all fall within the bottom 50 percent. All but
one speaker, MBK1, has a rapid decrease in pitch during the last 20 percent of the trajectory. The
pitch excursions for Tone 1 occur mostly within the middle 50 percent of the speakers’ tone
range, making this tone truly a ‘mid’ tone. With exception to MBK1, the trajectories for Tone 1
are fairly consistent in this group of speakers. Unlike the mothers in LA, MBK speakers do not
have a hook at the end of Tone 1. Figure 33 shows the average pitch trajectories for Tone 1 for
MBK speakers.
MBK1 is the only speaker in this group to have a straight pitch trajectory with a constant
negative slope for Tone 1. The change in pitch from the highest z-score at the onset to the lowest
z-score at the offset equals a difference of -1.0845, or approximately 25 percent of her tone
range. The onset for MBK1 is the second highest in this group with a z-score of 0.535. And
because her contour does not have a sudden drop in pitch during the last 20 percent of the
duration, the offset for MBK1 is the highest for this speaker group with a z-score of -0.550.
MBK1 is the only speaker in this group to have the offset z-score with a value higher than -1.00.
Interestingly, the slope of Tone 1 for this speaker is very similar to the trend lines for the other
three speakers.
-2.00
-1.00
0.00
1.00
2.00
0% 10% 20% 30% 40% 50% 60% 70% 80% 90% 100%
Se
mit
on
e z
-sco
re
Duration (%)
MBK Tone 1
MBK1
MBK2
MBK3
MBK4
Figure 33. Average pitch trajectories for Tone 1 for MBK speakers.

88
Tone 1 for MBK2 begins with an initial fall in pitch for the first 10 percent of the tone
duration, followed by a pitch plateau that lasts until 70 percent of the tone duration. The pitch
plateau lasts until 80 percent of the duration for speakers MBK3 and MBK4. The plateau falls
along the middle of her tone range with the highest z-score of 0.070 at 20 percent and the lowest
z-score of -0.005 at 70 percent. The pitch then rapidly drops for the last 30 percent of the tone
duration, a total difference in z-score of -1.087, or approximately 25 percent of her tone range.
MBK2 has the second lowest tone onset with a z-score of 0.117. Her tone onset clusters with
speakers MBK4 and has a z-score of -1.082.
MBK3 has the highest onset for Tone 1 in this group with a z-score of 0.629. The offset
clusters with MBK2, MBK4, and MBK5 and has a z-score of -1.057. Tone 1 for this speaker
begins with an initial fall in pitch during the 10 percent of the tone duration, followed by a gentle
pitch decrease until the last 20 percent of the duration. Unlike MBK2 and MBK3, this speaker’s
pitch plateau has a larger difference between 20 and 80 percent of the duration, equaling a
change in z-score of -0.387; whereas the change in z-score for MBK2 and MBK4 equal -0.074
and 0.067, respectively. The final drop in pitch is also the greatest for MBK3 with a total
difference in z-score of -1.118, or approximately 25 percent of her tone range.
MBK4 is the only speaker to not have an initial fall in pitch during the first 10 percent of
Tone 1. Similar to speakers MBK2 and MBK3, the pitch plateau for this speaker begins at the
tone onset and lasts for the next 70 percent of the tone duration, at which point the pitch
suddenly drops for the rest of the duration. MBK4 has the lowest onset for Tone 1 in her group
with a z-score of -0.054, the only onset to have a z-score lower than 0.00. MBK4 also has the
lowest offset with a z-score of -1.246. The final decrease in pitch during the last 30 percent of the
tone duration equals a difference of 1.277 in z-score, the largest such difference out of this
speaker group.
Overall, Tone 1 for MBK speakers can be characterized as a static mid tone with a mid-
range onset, midpoint, and an offset, a truly mid tone. The pitch trajectories for Tone 1 are fairly
consistent for this group. With the exception of MBK1, Tone 1 begins with a pitch plateau
followed by a sudden drop in pitch during the last 20 or 30 percent of the tone duration. Speaker
MBK1 has a straight pitch trajectory with a negative slope from the onset to the offset. Speakers
MBK1, MBK2, and MBK3 have an initial fall in pitch during the first 10 percent of the tone
duration followed by a pitch plateau; whereas the pitch plateau for MBK4 begins at the onset.
The onsets vary the most for the MBK speakers, ranging in z-scores from -0.054 (MBK4)
to 0.629 (MBK3), and are all in the middle of the speakers’ tone rage. The offsets range from -

89
0.550 (MBK1) to -1.246 (MBK4) in z-score and fall within the bottom 25 percent of the
speakers’ tone range, with exception to MBK1 whose offset is midway between z-scores -1.00
and 0.00. The offsets cluster for speakers MBK2, MBK3, and MBK4 at approximately z-score -
1.00. The sudden drop in pitch from the middle to the bottom 25 percent of the tone range occurs
for speakers MBK2, MBK3, and MBK4 and resembles the drop in pitch at the end of Tone 1 in
Abramson (1962, see Figure 3). Tone 1 has pitch excursions that fall within the middle 50
percent of the tone range for all speakers.
5.3.2 MBK Tone 2
Tone 2, like Tone 1, is a static tone that is also very consistent for the MBK speakers,
even more so than Tone 1. The trajectories begin with a mid-range onset and continue in a
negative slope to a low offset. The majority of the tone trajectories occur within the bottom 50
percent of the speakers’ tone range, with the exception of the onsets for speakers MBK1 and
MBK3 whose onset have positive z-score values. The MBK speakers do, however, vary in the
relative heights of the tone onsets but the offsets all cluster at the bottom 25 percent of the
speakers’ tone range. MBK1 has the highest onset in the group and MBK4 the lowest. No one in
this group has hook at the end of Tone 2; though one speaker, MBK2, has an inverse hook that
results from a more rapid decrease in pitch at 80 percent of the tone duration that is followed by
a pitch increase until the tone offset. The rate of pitch decrease in Tone 2 is greater than in Tone
1 for all speakers in this group. Figure 34 shows the average pitch trajectories for Tone 2 for the
speakers in this group.
-2.00
-1.00
0.00
1.00
2.00
0% 10% 20% 30% 40% 50% 60% 70% 80% 90% 100%
Se
mit
on
e z
-sco
re
Duration (%)
MBK Tone 2
MBK1
MBK2
MBK3
MBK4
Figure 34. Average pitch trajectories for Tone 2 for MBK speakers.

90
MBK1 has the highest onset for Tone 2 and is one of two speakers in her group with a
positive onset z-score value, 0.292. Her offset is the second lowest in the group and falls within
the bottom 25 percent of the tone range with a z-score of -1.612. Like the pitch trajectory for her
Tone 1, Tone 2 for this speaker has a consistent negative slope with the total change in z-score of
-1.838. The pitch trajectory for this tone falls mostly within the bottom half of the speaker’s tone
range. MBK1 is the only speaker in this group to have no hook in this tone, or no change in the
pitch trajectory at the end of the tone duration.
Tone 2 for MBK2 is also has a consistent negative slope. The onset has a z-score of -
0.060 and is at the middle of the speaker’s tone range. The offset has a z-score of -1.652, the
lowest in the group, and is in the bottom 25 percent. The slope of pitch change for MBK2 is
similar to MBK1, though she has an inverse hook for the last 20 percent of the duration and a
higher onset. The pitch reaches its lowest point at 90 percent of the tone duration at a z-score of -
1.685 then rises to -1.652 at the offset. The total difference between the highest pitch at the onset
and the lowest pitch at 90 percent of the tone duration is -1.712 in z-score.
MBK3 has the highest offset for this speaker group with a z-score of -1.463 and the
second highest onset with a z-score of 0.262, the total difference in z-score between the two
points is -1.725. The pitch trajectory for this speaker has a steeper fall in pitch during the first 30
percent of the tone duration followed by a gentle negative slope from 30 to 90 percent. The final
10 percent of the tone duration is a pitch plateau, resulting in a very slight inverse hook at the
end of this tone.
Tone 2 for MBK4 has the smallest difference between the pitch at the onset and the pitch
at the offset. The onset and the offset have z-scores of -0.520 and -1.546, respectively, totaling a
difference of -2.066, or approximately half of the speaker’s tone range. MBK4 has the largest
change in pitch of all speakers in this group for Tone 2. This speaker has a slight hook for this
tone but it is a downward hook, not the inverse one like MBK2. The pitch drops at the greatest
rate during the first 60 percent of the tone duration, decreasing a total of -0.747 in z-score;
whereas the pitch plateau between 60 and 90 percent of the duration the pitch only shows a
difference in z-score of 0.148. There is slight increase in the rate of pitch decrease during the last
10 percent of the tone duration that results in the slight hook for this tone.
In summary, Tone 2 for MBK speakers varies mostly in the tone onsets. Speakers MBK1,
MBK2, and MBK3 have a fairly consistent negative slope for the pitch trajectory in Tone 2;
whereas MBK4 has the steepest slope for this tone. Speakers MBK2 and MBK3 have an inverse
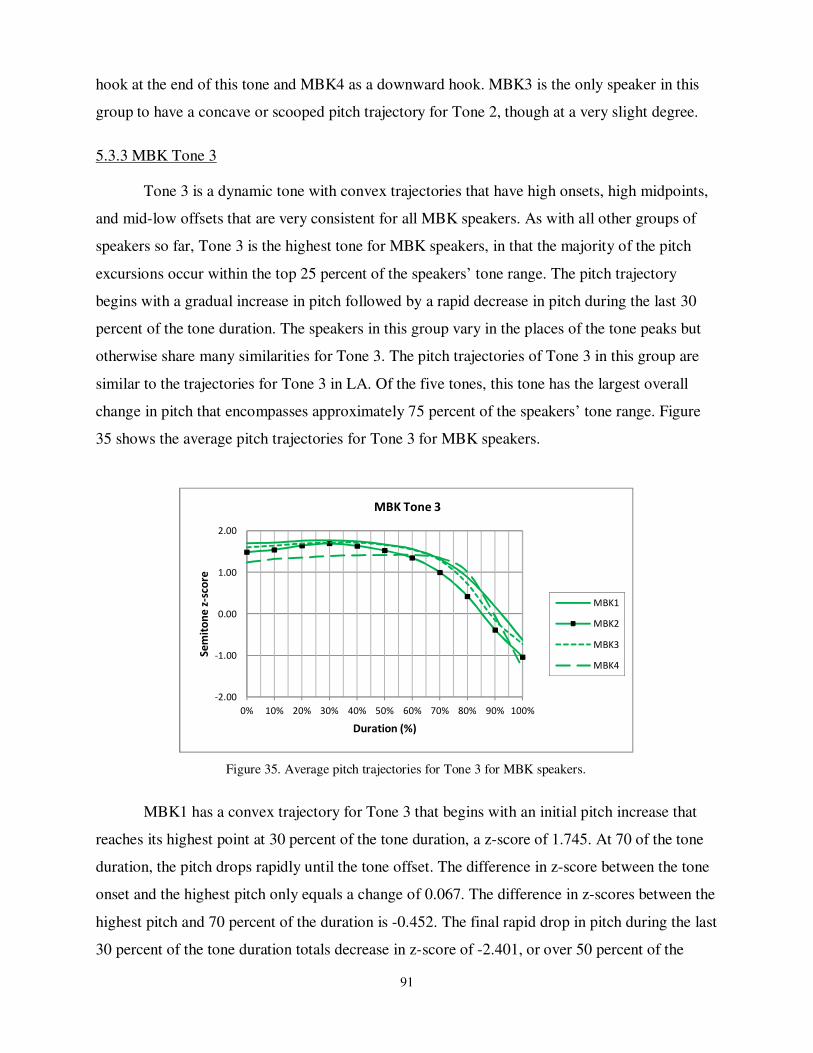
91
hook at the end of this tone and MBK4 as a downward hook. MBK3 is the only speaker in this
group to have a concave or scooped pitch trajectory for Tone 2, though at a very slight degree.
5.3.3 MBK Tone 3
Tone 3 is a dynamic tone with convex trajectories that have high onsets, high midpoints,
and mid-low offsets that are very consistent for all MBK speakers. As with all other groups of
speakers so far, Tone 3 is the highest tone for MBK speakers, in that the majority of the pitch
excursions occur within the top 25 percent of the speakers’ tone range. The pitch trajectory
begins with a gradual increase in pitch followed by a rapid decrease in pitch during the last 30
percent of the tone duration. The speakers in this group vary in the places of the tone peaks but
otherwise share many similarities for Tone 3. The pitch trajectories of Tone 3 in this group are
similar to the trajectories for Tone 3 in LA. Of the five tones, this tone has the largest overall
change in pitch that encompasses approximately 75 percent of the speakers’ tone range. Figure
35 shows the average pitch trajectories for Tone 3 for MBK speakers.
MBK1 has a convex trajectory for Tone 3 that begins with an initial pitch increase that
reaches its highest point at 30 percent of the tone duration, a z-score of 1.745. At 70 of the tone
duration, the pitch drops rapidly until the tone offset. The difference in z-score between the tone
onset and the highest pitch only equals a change of 0.067. The difference in z-scores between the
highest pitch and 70 percent of the duration is -0.452. The final rapid drop in pitch during the last
30 percent of the tone duration totals decrease in z-score of -2.401, or over 50 percent of the
-2.00
-1.00
0.00
1.00
2.00
0% 10% 20% 30% 40% 50% 60% 70% 80% 90% 100%
Se
mit
on
e z
-sco
re
Duration (%)
MBK Tone 3
MBK1
MBK2
MBK3
MBK4
Figure 35. Average pitch trajectories for Tone 3 for MBK speakers.

92
speaker’s tone range. MBK1 has the highest onset and the highest offset in the group with the z-
scores of 1.705 and -0.629, respectively.
Tone 3 for MBK2 is consistent with every speaker in this study. The trajectory begins
with a rise in pitch, followed by a gradual decrease, and then a rapid drop in pitch during the last
30 percent of the tone duration. The pitch reaches its highest point at 30 percent of the duration
for this speaker. Unlike MBK1, this speaker has a larger initial pitch increase after the onset and
a greater fall in pitch towards the offset. The difference between the onset and the highest pitch
at 30 percent of the tone duration equals an increase of 0.208; between 30 and 70 percent equals
a decrease of -0.696; and between 70 percent and offset equals another decrease of -2.035 or
approximately half of the speaker’s tone range.
MBK3 has the second highest tone onset with a z-score of 1.605 and also the second
highest offset with a z-score of -0.726. MBK3 reaches the highest pitch in this tone at 40 percent
of the tone duration at a z-score of 1.718, an increase of 0.073 from the onset. The difference in
pitch between the highest pitch and at 70 percent of the tone duration is -0.425, after which the
pitch drops to its lowest z-score of -0.726 at the offset. The pitch trajectory for MBK3 is very
similar to the trajectories for MBK1 and MBK2.
MBK4 has the lowest onset for Tone 3 with a z-score of .238 and also the lowest offset
with a z-score of -1.312. MBK4 reaches the highest pitch for this tone earlier than the other
speakers, at 60 percent of the tone duration. The rapid pitch fall towards the end of the tone
duration is a difference in z-score of -2.731, or over 60% of the speaker’s tone range, the largest
change in pitch for any tone in any group. The pitch trajectory for Tone 3 for this speaker is
different from the other three speakers in that the tone does not begin with an initial rise and fall
of the tone, followed by a rapid change in pitch towards the end. For MBK4, Tone 3 begins with
a gentle rise in pitch until 60 percent of the duration, after which the pitch drops to its lowest
point at the offset.
Overall, Tone 3 can be characterized as a dynamic high tone with a high onset, a high
midpoint, and a mid-low offset. Tone 3 for MBK speakers have very little change in pitch during
the first 60 to 70 percent of the trajectory, followed by a rapid fall in pitch towards the end of the
tone duration. Additionally, Tone 3 shows the largest change in pitch out of the fives tones for
this group of speakers. The MBK onsets for Tone 3 are at the upper most 25 percent of the tone
range for all speakers and the offsets are slightly above, at, or just below z-score -1.00. The
trajectories for all but one speaker, MBK4, begin with a gradual rise and fall in pitch during the
first 80 percent of the tone duration. The final drop in pitch occurs during the last 20 percent.

93
MBK4 does not have an initial rise and fall of the pitch, but a gradual increase in pitch for the
first 60 percent of the duration and then the pitch drops suddenly, the largest such drop across
any tone and any group of speakers, until the offset.
5.3.4 MBK Tone 4
Tone 4 is a dynamic mid-high tone with a concave trajectory that ends with a hook. The
tone has mid-range onsets that cluster between z-scores 0.00 and 1.00 and high or mid-range
offsets that occur within the top 50 percent of the speakers’ tone range. Tone 4 for MBK
speakers has a high mid-range midpoint. The pitch reaches its lowest point during the first half of
the tone duration and highest at 80 or 90 percent. The speakers in this group mostly vary in the
location of the lowest pitch in the tone duration and the height of the offset pitch. Figure 36
shows average pitch trajectories for Tone 4 for MBK speakers.
Tone 4 for MBK1 has a concave or scooped trajectory. From the onset, the pitch
decreases until its lowest point at 40 percent of the tone duration then rises to its highest point at
90 percent of the duration, after which there is a slight decrease in pitch, resulting in a hook. The
lowest pitch has a z-score of 0.316 and the highest pitch 1.250. The onset is mid-high with a z-
score of 0.690. The offset is high and falls within the top 25% of the speaker’s tone range with a
z-score of 1.092. The change in pitch between the onset and the lowest pitch equals a difference
of -0.374 in z-score. MBK1 has a trajectory that is nearly identical to MBK3’s trajectory for this
tone.
-2.00
-1.00
0.00
1.00
2.00
0% 10% 20% 30% 40% 50% 60% 70% 80% 90% 100%
Se
mit
on
e z
-sco
re
Duration (%)
MBK Tone 4
MBK1
MBK2
MBK3
MBK4
Figure 36. Average pitch trajectories for Tone 4 for MBK speakers.

94
MBK2 has the most unique trajectory in this speaker group for Tone 2 but otherwise
patterns with the MBK speakers for all other tones. The pitch decreases from the onset until it
increases again after 20 percent of the tone duration. The pitch then rises to its highest point with
a z-score of 1.664 at 80 percent of the duration, after which it suddenly drops to its lowest point
at the offset with a z-score of -0.232. MBK2 has the lowest tone onset and offset in the MBK
speaker group. The onset has a z-score of 0.309. In fact, MBK2 is the only speaker who has a
mid-range offset with a negative z-score value offset for Tone 2. Other speakers’ offsets are high
in their tone range and fall within or just under a z-score of 1.00. The hook in MBK2’s Tone 2 is
the largest out of all MBK speakers, a total difference in z-score between the 80 percent duration
and the offset of -1.896 in z-score, or nearly half of her tone range.
The Tone 4 pitch trajectory for MBK3 patterns with speakers MBK1 and MBK4. The
concave trajectory has a hook at the end of the tone. The pitch decreases from the onset and
reaches its lowest pitch at 40 percent of the tone duration with a z-score of 0.193. The onset has a
z-score value of 0.563. The pitch then rises from its lowest point for the next 50 percent of the
duration to a z-score of 0.977, after which it falls for the last 10 percent to form a hook at the
offset. The offset for this speaker is the second lowest in this group and is just below the top 25
percent of this speaker’s tone range at a z-score of 0.873.Speaker MBK3 has the longest lasting
initial pitch decrease in this group with 40 percent of the tone duration.
MBK4 has the least scooped contour for Tone 4. For this speaker, Tone 4 begins with a
gradual increase in pitch from the onset; whereas the other speakers’ trajectories begin with a
pitch decrease. The pitch falls from the onset for 90 percent of the tone duration and then drops
slightly during the last 10 percent to form a hook. The onset is the second lowest in this group
with a z-score value of 0.334 but the offset is the highest with a z-score of 1.482. The total
difference in pitch between the highest and the lowest pitch totals an increase of 1.307.
Overall, Tone 4 for MBK speakers falls within the top 50 percent of the speakers’ tone
range and can be characterized as a dynamic mid-high tone with a concave trajectory. All
speakers have a mid-range onset, a mid-range mid-point, and a high offset, with exception of
MBK2 who has a mid-range midpoint. For speakers MBK1, MBK3, and MBK4, the pitch falls
from the onset for the first 40 percent of the tone duration then rises for the next 50 percent of the
duration and falls once more for the last 10 percent until the tone offset. All speakers have a
hook for this tone with MBK2 having the largest one in both duration and change in pitch.
MBK2 also has shortest duration for the initial pitch fall in this speaker group at 20 percent of
the tone duration.

95
5.3.5 MBK Tone 5
Tone 5 is mid-low dynamic tone with a concave trajectory for this group of speakers. The
onsets are clustered between z-scores -1.00 and 0.00 while the offsets also are clustered around
and below 1.00. The shapes of the tone trajectories are similar across all four speakers in this
group but locations of the lowest pitch in the tone duration do vary. As for all other speakers in
this study, Tone 5 is the lowest tone for the MBK speakers, with the majority of the pitch
excursions occurring within the bottom 50 percent of the speakers’ tone range. The lowest
pitches for this tone are also the lowest points in the data for the speakers. MBK speakers have
offsets for this tone that are much higher than the onsets. Figure 37 shows the average pitch
trajectory for Tone 5 for this group of speakers.
MBK1 has a concave or scooped trajectory for Tone 5. The onset has a z-score of -0.328
and is this speaker’s lowest onset for all five tones. The pitch then drops from the onset to the
lowest pitch at 40 percent of the tone duration with a z-score of -1.330. The difference in pitch
between the onset and lowest pitch totals a change in z-score of -1.00. The pitch rises from the
lowest to highest points for the remainder of the tone duration. The offset is the highest pitch in
Tone 5 for MBK1 and is the lowest offset within this group, at a z-score of 0.522. The pitch
increases from its lowest to highest point during the last 60 percent of the tone duration and
equals a change in z-score of 1.852, or nearly half of her tone range. The difference in z-score
between the pitch of the onset and the offset is 0.850.
-2.00
-1.00
0.00
1.00
2.00
0% 10% 20% 30% 40% 50% 60% 70% 80% 90% 100%
Se
mit
on
e z
-sco
re
Duration (%)
MBKTone 5
MBK1
MBK2
MBK3
MBK4
Figure 37. Average pitch trajectories for Tone 5 for MBK speakers.

96
MBK2 reaches the lowest point in Tone 5 at 30 percent of the duration; whereas other
speakers reach the lowest points between 40 and 50 percent. MBK2 also has the second lowest
tone onset with a z-score of -0.716 and the second highest offset with a z-score of 1.203. The
initial difference between the onset and the lowest pitch equals a decrease in z-score of -0.469.
The final increase in pitch during the last 70 percent of the tone duration equals 2.388 in z-score.
MBK2 has a higher pitch for the offset than the onset by a difference of 1.919 in z-score, or
nearly half of her tone range.
MBK3 has the highest onset within this group with a z-score value of 0.013. Her offset
has a z-score value of 0.954 and is higher than the onset. The difference in pitch height between
the offset and the onset is 0.967 in z-score. This speaker reaches her lowest pitch in Tone 5 at 40
percent of the tone duration. The initial pitch decrease between the onset and the lowest pitch
equals a change in z-score of -0.993. The final rise in pitch from the lowest pitch to the offset is
an increase in z-score of 1.935, just a little under half of her tone range.
MBK4 has a Tone 5 that is consistent with other speaker sin this group. The trajectory
reaches its lowest point at 40 percent of the tone duration. The onset is the lowest in this group at
a z-score of -0.793 and the offset is the highest with a z-score of 1.292. The pitch decreases from
the onset to its lowest point at a z-score of -1.134 then rises until its highest point at the offset.
The initial fall in pitch equals a difference in z-score of -0.545 and the final rise in pitch equals
an increase in z-score of 2.630, the largest increase in the group. Like for the other speakers in
this group, the Tone 5 offset and higher than the onset, with a difference of 1.371 in z-score.
-2.00
-1.00
0.00
1.00
2.00
0% 10% 20% 30% 40% 50% 60% 70% 80% 90% 100%
Se
mit
on
e z
-sco
re
Duration (%)
MBK GROUP AVE
Tone 1
Tone 2
Tone 3
Tone 4
Tone 5
Figure 38. Average pitch trajectories for all tones for MBK speakers.

97
In summary, Tone 5 for the MBK speakers has a concave trajectory with a mid-low
onset, a low midpoint, and a mid-high offset. The trajectory begins with a decrease in pitch from
the onset to the lowest point between 20 to 40 percent of the tone duration, followed by a rapid
pitch increase to its highest point at the tone offset. Speakers MBK1, MBK3, and MBK4 reach
their pitch troughs at 40 percent of the tone duration while MBK2 reaches it at 20 percent. The
offsets are all higher in pitch than the onsets for the speakers in this group. Figure 38 shows the
average pitch trajectories for MBK speakers.
5.4 Tones for Teens in Bangkok (TBK Group)
5.4.1 TBK Tone 1
Tone 1 for TBK speakers has a very consistent trajectory. The tone is truly a mid tone
that has static trajectory with very little pitch excursion. Tone 1 has a mid-range onset, a mid-
range midpoint, and a mid-range offset. TBK speakers have similar heights for the tones and
results in clustering and overlapping of the tone trajectories. The onsets and offsets for all
speakers cluster for this tone. The trajectories have a gentle negative slope and all occur within
the middle 50 percent of the speakers’ tone range. Though there are very small changes to the
rate of pitch change towards the end of the tone duration, they are not significant enough to be
considered a hook like in other groups of speakers. Figure 39 shows the average pitch trajectories
for Tone 1 for TBK speakers.
-2.00
-1.00
0.00
1.00
2.00
Se
mit
on
e z
-sco
re
Duration (%)
TBK Tone 1
TBK1
TBK2
TBK3
TBK4
Figure 39. Average pitch trajectories for Tone 1 for TBK speakers.

98
TBK1 has the highest onset of all speakers in this group for Tone 1 with a z-score of -
0.326. The onset is approximately midway between z-scores 0.00 and 1.00 with a z-score of
0.446. The pitch trajectory has a gradual downward slope, reaching its lowest point at 80 percent
of the tone duration. The pitch then rises slightly until the last 10 percent, at which point it drops
until the offset, at a z-score of 0.326. The onset for TBK1 clusters with the other speakers in this
group and remains within the middle 50 percent of the tone range for the whole duration of the
tone. The total decrease in pitch between the tone onset and offset equals a difference of 0.772.
Tone 1 for TBK2 has a slight undulating trajectory with and initial pitch decrease,
followed by a pitch increase, and ends with a final pitch decrease. The onset has the highest pitch
at a z-score of 0.488 and the offset has the lowest pitch at a z-score of -0.847. The initial drop in
pitch between the onset and 20 percent of the tone range equals a change of -0.5812. Between 20
percent of the tone range and 90 percent, the pitch rises then fall. The final 10 percent of the tone
shows a different rate of pitch decrease than between 60 and 90 percent of the tone. The resulting
trajectory from all of the pitch excursions is flattened S-shape. The difference between the onset
and the offset is a decrease in z-score of -1.335.
TBK3 also has an S-shaped trajectory for Tone 1 that begins with an initial drop in pitch
during the first 10 percent, followed by a pitch plateau between 10 and 70 percent of the
duration, and then a final drop in pitch during the last 30 percent. The onset for this speaker is
the lowest in this group, but otherwise clusters with the other speakers, as does her tone offset,
which is the second lowest in this group. The change in pitch during the relatively straight
trajectory between 10 and 70 percent equals a change of only -0.329 in z-score; whereas the
initial drop in pitch equals -0.394 and the final pitch drop equals -0.471. The total difference
between the highest pitch at the onset, a z-score of 0.376, and the lowest pitch at the offset, a z-
score of -0.817, totals a decrease of -1.193 in z-score.
TBK4 also has an undulated pitch trajectory for Tone 1, mostly likely due to the presence
of creaky voice for this tone and two other tones. Words with Tone 1 that were either creaky or
had any portion of creaky voice are 14. ชา /tcʰa:1/ ‘tea’; 16. คา /kʰa:1/ ‘to be lodged, stuck’ ;and
20. พา /pʰa:1/ ‘to take or bring along’. We will discuss creaky voice for TBK4 in more detail in
the discussion section. The change in pitch is otherwise at approximately the same negative slope
as the other speakers. The Tone 1 onset for TBK4 is the highest in the group with a z-score of
0.580. The offset is the lowest pitch and has a z-score of -0.433. The difference in pitch between
the onset and the offset equals a change in z-score of -1.013.

99
Overall, Tone 1 for TBK speakers can be characterized as a static mid tone with a mid-
range onset, midpoint, and offset. The pitch excursions for this tone are within the middle 50
percent of the tone range for TBK speakers. Additionally, the tone onset clusters at
approximately midway between z-scores 0.00 and 1.00 and ranges in z-scores from the lowest
value of 0.376 (TBK3) to 0.580 (TBK4). The pitch height on the offset all fall within the z-
scores of -1.00 and 0.00 with values ranging from -0.847 (TBK2) to -0.326 (TBK1). Speakers
TBK1 and TBK4 have similar pitch heights for their Tone 1 offsets and speakers TBK2 and
TBK3 have similar heights for their tone offsets.
Though the pitch trajectory is an overall negative slope for all speakers, there are some
slight changes in the rate of pitch decrease throughout some speakers’ tone duration. For
example, TBK2 and TBK3 have trajectories that decrease in pitch more rapidly from the onset,
followed by a pitch plateau, then a more rapid rate of pitch decrease until the tone offset. Their
pitch trajectories for Tone 1, therefore, are a flattened S-shaped trajectory. Speakers TBK1 and
TBK4, however, have a gradual decrease in pitch that begins to plateau at 70 percent of the tone
duration. The pitch then drops at a slightly faster rate during the last 10 percent.
5.4.2 TBK Tone 2
Tone 2 is also fairly consistent across all speakers in this group. Tone 2 is a high- or mid-
low static tone with high or high-mid onsets in the top 50 percent of the speakers tone range,
mid-range midpoints, and low offsets. The onsets have the highest pitch and the offset the lowest
for all TBK speakers. The rate in pitch decrease in Tone 2 is greater than the rate of pitch change
in Tone 1, resulting in a steeper negative slope for all speakers. Despite the similarities for Tone
2 across all speakers in this group, the trajectories do not overlap. Some TBK speakers have a
great rate of pitch decrease in the first portion of the tone duration. TBK2, for example, has a
steeper slope during the first 70 percent of the tone trajectories while TBK3 has a steeper slope
for the first 20 percent. Though the differences in pitch between the onsets and the offsets are
large, the overall change in pitch for Tone 2 is still less than Tone 3. There are no hooks in this
group of speakers for this tone. Figure 40 shows the average pitch trajectories for Tone 2 for this
group of speakers.

100
TBK1 has the lowest onset and offset for Tone 2 in this group. The onset has z-score of
0.538 and the offset has a z-score of -1.547. TBK1 also has the largest pitch difference between
the onset and offset in this group, a total change in z-score of -2.085, or proximately half of the
speaker’s tone range. Like the other speakers in this group, TBK1 does not have a hook at the
end of Tone 2. TBK1 is the only speaker in her group, however, that has a constant rate of pitch
change; whereas the other speakers have different rates at different points in the tone duration.
TBK2 has a more rapid pitch decrease during the first 70 percent of the tone duration for
Tone 2. The onset for this speaker is the highest in the group and has a z-score of 1.143. The
decrease in pitch from the onset to 70 percent of the tone duration equals a change in a z-score of
-1.979, or nearly half of the speaker’s tone range. The offset has a z-score of -1.044. The offset
for TBK2 clusters with TBK3 and TBK4 and the last 30 percent of the trajectory nearly overlaps
with TBK3. Her tone onset does not cluster with any other speakers in this group. TBK2 also has
no hook at the end of this tone.
Tone 2 for TBK3 has a similar tone trajectory as the first two speakers in this group. The
onset has a z-score of 0.680. The offset clusters with speakers TBK2 and TBK4, but unlike
TBK2, the more rapid rate of pitch decrease at the beginning of the tone only lasts for the first 30
percent of tone duration and not for the first 70 percent. The difference in pitch between the
onset and at 30 percent of the duration equals -0.976 in z-score; while the slower rate of pitch
change during the last 70 percent of the duration and the offset equals a change of -0.665. TBK3
has the smallest total pitch change between the onset and offset in her group, totaling less than
-2.00
-1.00
0.00
1.00
2.00
0% 10% 20% 30% 40% 50% 60% 70% 80% 90% 100%
Se
mit
on
e z
-sco
re
Duration (%)
TBK Tone 2
TBK1
TBK2
TBK3
TBK4
Figure 40. Average pitch trajectories for Tone 2 for TBK speakers.
101
half of her tone range. The Tone 2 offset for TBK3 clusters with speakers TBK2 and TBK4 and
has a z-score of -0.960. There is no hook at the end of this tone for TBK3.
TBK4 has an undulated pitch trajectory for Tone 2, similar to what she has for Tone 1 but
at a greater negative slope. Again, this may be due to the creaky nature of her voice during this
tone. The words with Tone 2 that has a creaky quality are 8. ถาด /tʰa:t2/ ‘tray’; 24. ข า /kʰa:2/
‘galangal (rhizome)’; and 32. ฉ า /tcʰa:2/ ‘sizzling, splashing (onomatopoeia)’. All three words are
only partially creaky. The onset for this tone has a z-score of 0.747 and the offset has a z-score of
-1.217, a total difference in pitch of -1.964, or nearly half of this speaker’s tone range. The
majority of the pitch change occurs during the first half of the tone duration and totals -1.206 in
z-score; whereas the change in pitch during the last half of the tone duration equals a change in
z-score of only -0.758
Tone 2 is a static tone with a high-mid onset, a mid-range midpoint, and a low offset. The
pitch trajectory for Tone 2 for the TBK group is also quite consistent, showing a gentle negative
slope from the top 25 percent of the speakers’ tone range to the bottom 25 percent. The rate of
pitch change is faster at the beginning of the tone duration for all speakers in this group then
slows down for the remainder of the tone, with the largest decrease in pitch change rate was for
TBK3and started at 20 percent of her tone duration. The pitch range for Tone 2 covers
approximately 50 percent of the speakers’ tone range. TBK1 has the largest change in pitch
within this group and TBK3 has the smallest.
5.4.3 TBK Tone 3
Tone 3 is a high-low dynamic tone with a high onset, high midpoint, and a mid-low offset
for TBK speakers. The tone trajectories are all convex, but vary in the height of the onset pitch,
the location of the highest pitches in the tone duration, and the height of the offsets. Overall, the
onsets occur between z-scores 1.00 and 2.00 or at the very top of the speakers’ tone range. The
offsets occur within the bottom 50 percent of the speakers’ tone range. Like for all other groups
of speakers in this study, Tone 3 is the highest tone for TBK speakers, in that the majority of the
pitch excursions occur in the top 25 percent of the speakers’ tone range. All speakers have a
rapid decrease in pitch during the last 60 percent of the tone duration that is preceded by a pitch
plateau. Figure 41 shows the average pitch trajectories for Tone 3 for all four speakers.

102
TBK1 has the highest offset for Tone 3 in this speaker group with a z-score of -0.207.
Her onset clusters with speakers TBK2 and TBK3 and has a z-score of 1.757. The trajectory for
this tone begins with a pitch plateau during the first 60 percent of the tone duration, after which
the pitch rapidly drops until the tone offset. The change in pitch during the first 60 percent of the
tone duration equals a difference in z-score of only -0.165; whereas the last 40 percent has a
pitch drop of -1.863 in z-score. The total difference in z-score between the tone onset and offset
is 1.965 with 95 percent of the change in pitch for this tone occurring in the last 40 percent of the
duration for speaker TBK1.
Tone 3 for TBK2 overlaps with TBK1 during the first 60 percent of the tone duration.
The trajectory for this speaker also begins with a pitch plateau that is followed by a sudden drop
in pitch during the last 40 percent. The pitch change during the first 60 percent of the tone
duration equals only -0.266, slightly more of a pitch decrease than TBK1. The onset has a z-
score of 1.790 and the offset has a z-score of -0.640. The final drop in pitch during the last 40
percent of the tone duration is a change of -2.164 in z-score, or over half of her tone range.
TBK2 additionally has a change in the rate of pitch change during the last 10 percent of the tone
that forms an inverse hook in this tone’s trajectory.
TBK3 has the highest onsets for Tone 3 with a z-score of 1.945. She is also the only
speaker in this group to not have a Tone 3 trajectory that begins with a pitch plateau. The
trajectory for TBK3 begins with a gradual negative slope followed by a small pitch plateau
between 50 and 60 percent of her tone duration that ends with a steeper fall in pitch during the
-2.00
-1.00
0.00
1.00
2.00
0% 10% 20% 30% 40% 50% 60% 70% 80% 90% 100%
Se
mit
on
e z
-sco
re
Duration (%)
TBK Tone 3
TBK1
TBK2
TBK3
TBK4
Figure 41. Average pitch trajectories for Tone 3 for TBK speakers.

103
last 40 percent of the tone duration. The offset has a z-score of -0.409. The total change in pitch
during the first 50 percent of the tone duration equals a decrease of -0.570 in z-score; whereas
the change during the last 40 percent equals -1.774. The rate of pitch decrease changes again
during the last 20 percent of the tone duration. The difference between the onset and the offset
totals -2.344, or over the speaker’s tone range.
TBK4 is the only speaker in this group to have a Tone 3 trajectory that begins with a
pitch increase. She also has the lowest onset within this group of speakers with a z-score of
1.238, though the onset still falls within the top 25 percent of her tone range. The onset has a z-
score of 1.238 and the offset has a z-score of -1.312. The pitch increase between the onset and
the highest pitch at 60 percent of the duration equals a change of 0.180 in z-score. The final fall
of the pitch is small between 60 and 70 percent of the tone duration, only -0.072 in z-score, then
drops dramatically to the offset z-score of -1.312, the lowest offset for the group. The total
change in pitch during the last 30 percent of the duration equals a difference in z-score of -2.659,
the largest such drop in this group of speakers. That final change in pitch is double the amount of
change found in TBK3. TBK4 is the only speaker whose tone offset for Tone 3 falls within the
bottom 25 percent of her tone range.
In summary, Tone 3 for TBK speakers is a dynamic tone with a concave trajectory that
has a high onset, a high midpoint, and a mid-low offset. All speakers have tone onsets for Tone 3
that are within the top 25 percent of the tone range and tone offsets that are in the bottom 50
percent of their tone range. Tone 3, therefore, has an overall pitch range that covers over 75
percent of the tone range. TBK4 has the lowest onset within this group and TBK3 has the
highest. TBK4 also has the lowest tone offset while TBK1 has the highest onset.
The characteristic Tone 3 pitch drop for this group begins at 60 percent of the tone
duration for speakers TBK1 and TBK2. TBK4 has a pitch plateau that lasts for the first 70
percent of the tone duration. Additionally, the pitch plateau for TBK1 and TBK2 begins with a
fall in pitch during the first 10 percent of the tone duration; whereas TBK4 has a very slight rise
in pitch during the first 70 percent of the tone duration.
5.4.4 TBK Tone 4
Tone 4 is a mid-range dynamic tone with a mid-range onset, a mid-range midpoint, and
the mid-range offset for the TBK speakers. The pitch excursions are all within the middle 50
percent of the speakers’ tone range, with exception to one offset which is within the top 25
percent of the speaker’s tone range. The pitch trajectories for this group of speakers have two

104
shapes: a concave trajectory or an S-shaped trajectory. Despite the variation in trajectory shapes,
the onsets for the speakers in this group cluster at the middle of the speakers’ tone range and the
offsets are within the top 50 percent. The speakers with concave pitch trajectories reach the
lowest pitch between 50 and 70 percent of the tone duration; whereas the speakers with S-shaped
trajectories reach the lowest pitch between 10 and 30 percent. The highest pitches for the
concave trajectories are the tone offsets. For the S-shaped trajectories, the highest pitches are at
80 percent of the tone duration. Figure 42 shows the average pitch trajectories for Tone 4.
TBK1 has a concave or scooped pitch trajectory for Tone 4 like TBK4. The onset is
lower in pitch, a z-score of 0.619, than the offset, a z-score of 1.247. TBK1 has the highest onset
and offset for this tone within this speaker group. Additionally, the majority of the pitch
excursions occur within the top 50 percent of the tone range. This speaker reaches the pitch
trough for Tone 1 at 40 percent of the tone duration. The difference in pitch between the tone
onset and the pitch trough is a change of -0.826 in z-score. The rise in pitch during the last 60
percent of the tone changes equals an increase of 1.454 in z-score. The offset is higher in pitch
than the onset by a difference of 0.628. There is an extremely slight change in the rate of pitch
increase during the last 10 percent of the tone duration, but it is too small of a change to form a
hook for this tone.
Unlike TBK1, TBK2 has an S-shaped contour for Tone 4. The lowest pitch is reached at
30 percent of the tone duration at a z-score of -0.696 and the highest pitch is reached at 80
-2.00
-1.00
0.00
1.00
2.00
0% 10% 20% 30% 40% 50% 60% 70% 80% 90% 100%
Se
mit
on
e z
-sco
re
Duration (%)
TBK Tone 4
TBK1
TBK2
TBK3
TBK4
Figure 42. Average pitch trajectories for Tone 4 for TBK speakers.

105
percent of the tone duration at a z-score of 0.640. The tone onset is slightly lower in pitch than
the tone offset, with a z-score of 0.1628 and 0.329, respectively. The difference in pitch between
the tone onset and the lowest pitch equals a change in z-score of -0.859; whereas the difference
between the lowest and highest pitches equals 1.275, or roughly 25 percent of the tone range. For
the last 20 percent of the tone duration, the pitch falls from the highest pitch to a z-score of 0.329
at the offset, a difference of -0.312. The final fall in pitch for this speaker results in a large hook
for Tone 4 that forms the S-shaped trajectory.
TBK3 also has an S-shaped pitch trajectory for Tone 4 but has a lower onset and a higher
offset than TBK2. TBK3 is the only speaker to have an onset with a negative z-score at -0.232.
The tone offset for this tone has a z-score of 0.639. The pitch falls from the onset to its lowest
point at a z-score of 0.449. This speaker reaches the lowest pitch in Tone 4 by 20 percent of the
tone duration, the earliest for this group of speakers. The highest pitch is reached at 80 percent of
the tone duration and has a z-score of 1.054. The difference in pitch between the onset and the
lowest pitch totals a change in z-score of -0.681; whereas the difference between the lowest and
highest pitches equals an increase of 1.503. The final decrease in pitch during the last 20 percent
of the duration equals a -0.415 difference in z-score. The last pitch fall forms in a large hook at
the end of this tone and results in the S-shaped trajectory.
TBK4 has a concave or scooped pitch trajectory for Tone 4, similar to TBK1, though
both her tone onset and offset are lower than TBK1. The pitch height for the onset is slightly
higher than the offset with z-scores of 0.375 and 0.297, respectively. TBK4 also reaches the
lowest pitch the latest in this group at 50 percent of the tone duration. The lowest pitch has a z-
score of -0.383. TBK4 has the lowest tone offset in this group with a z-score of 0.297. The rate
of pitch decrease is gradual from the onset until the lowest pitch is reached at a z-score of -0.383,
a total difference in z-score of -0.758. The pitch then rises more quickly during the last 50
percent of tone duration until it reaches the offset. The increase in pitch during the last half of the
tone duration equals a difference in z-score of 0.680. Tone 4 is the only tone for TBK4 that does
not have any instances of creakiness.
Overall, the TBK speakers have two types of trajectories for Tone 4: an S-shaped contour
or a concave or scooped contour. Speakers TBK2 and TBK3 have S-shaped pitch trajectories for
this tone; whereas speakers TBK1 and TBK4 have concave trajectories. The S-shaped
trajectories are characterized by an initial fall in pitch for the first 10 to 20 percent of the tone
duration, followed by a rise in pitch until the last 20 percent of the duration when the pitch falls
once more to the offset. The concave trajectories also begin with an initial fall in pitch but reach

106
its lowest point during the last half of the tone duration. The pitch then rises again until the tone
offset.
Though both speakers TBK2 and TBK3 have S-shaped trajectories, the former has a
higher tone onset and greater fall in pitch than the latter. The pitch excursions for these two
speakers remain within the middle 50 percent of both speakers’ tone range. The pitch excursions
for the two speakers with the concaved trajectories are also mostly within the middle 50 percent
of their tone range, with exception to the Tone 4 onset for TBK1 which is slightly higher. The
onsets for this tone do not cluster for the speakers in this group. In fact, there are no clusters at all
in the pitch trajectories for these four speakers.
5.4.5 TBK Tone 5
Tone 5 is a dynamic low tone with a concave trajectory for the TBK speakers. Tone 5 has
a mid-range onset, a low midpoint, and a high or mid-range offset. The onset pitches cluster at
the z-score of 0.00. The speakers vary in pitch height for the tone offsets, where in the tone
duration they reach the lowest pitch, and the height of the lowest pitch for this tone. Tone 5 is the
lowest tone of the five tones with most of the pitch excursions occurring in the bottom 50 percent
of the speakers’ tone range. Speakers in this group have a pitch plateau that occurs in the middle
50 percent of the tone duration and is within the bottom 25 percent of the speakers’ tone range.
Figure 43 shows the average pitch trajectories for Tone 5 in this speaker group.
-2.00
-1.00
0.00
1.00
2.00
0% 10% 20% 30% 40% 50% 60% 70% 80% 90% 100%
Se
mit
on
e z
-sco
re
Duration (%)
TBK Tone 5
TBK1
TBK2
TBK3
TBK4
Figure 43. Average pitch trajectories for Tone 5 for TBK speakers.

107
TBK1 has the lowest pitch plateau and tone offset in this group for Tone 5. The trajectory
for this tone is concave or scooped with the onset and the offset at approximately the same pitch
height. Her onset clusters with other TBK speakers and has a z-score of -0.025. The tone offset
has a z-score of -0.029. TBK1 reaches the lowest pitch in Tone 5 latest in this group at 60
percent of the tone duration with a z-score of -1.727, nearly at pitch trough is the latest within
this group of speakers. The fall in pitch between the onset and the lowest pitch equals a
difference in z-score of -1.701. The pitch then rises for the last 40 percent of the tone duration to
its highest point at the offset, a total difference of 1.698 in z-score. The Tone 5 pitch excursions
for this speaker are within the bottom 50 percent of her tone range.
TBK2 also has a concave trajectory for Tone 5. The tone offset is much higher than the
tone onset, by nearly 25 percent of the speaker’s tone range. The onset has a z-score of -0.148
and clusters with the other speakers in this group while the offset has a z-score of 0.874. The
difference in pitch between the onset and the offset is 1.022 in z-score. TBK2 reaches her lowest
pitch in Tone 5 at 50 percent of the tone duration with a z-score of -1.237. The difference in
pitch between the onset and the lowest pitch is a decrease of 1.088 in z-score; whereas the
difference between the offset is and the lowest pitch is 2.111. The tone offset for this speaker is
the second highest in the group.
TBK3 has the highest tone offset of any speaker in this group with a z-score of 1.376.
She is the only speaker to have pitch excursions for Tone 5 not fall within the bottom 25 percent
her tone range at any point in the trajectory. TBK3 is also the only speaker to have the Tone 5
offset be within the top 25 percent of her tone range. The tone offset is higher than the tone onset
by 1.472 in z-score. The lowest pitch occurs at 60 percent of the tone duration and has a z-score
of -0.996. The fall in pitch between the onset and the lowest pitch equals a change of -0.900 in z-
score while the difference between the lowest and highest pitch at the offset equals 2.372. TBK3
is the only speaker to not have no pitch points in Tone 5 with z-scores below -1.00.
TBK4 has a similar pitch contour shape for Tone 5 as the other speakers in her group, but
also has creaky voice for some words with this tone. The three words that have creaky voice for
this tone are 6. จ า /tca:5/ ‘an affectionate particle’ or ‘a popular nickname’; 19. ฐาน /tʰa:n5/
‘pedestal, base’; and 35. ขา /kʰa:5/ ‘leg’. TBK4 has a similar pitch height for Tone 5’s onset as
other speakers in this group and has an offset that is close in pitch height with TBK1. The onset
and offset have z-scores of 0.098 and 0.149, respectively. She reaches the lowest point in Tone 5
at 60 percent of the tone duration at a z-score of -1.427. The initial pitch decrease from the onset

108
to the lowest pitch equals a change in z-score of -1.525. The offset has a z-score of 0.149 and is
slightly higher in pitch than the onset. The rise in pitch during the final 40 percent of the tone
duration equals an increase in z-score of 1.576.
Tone 5 for TBK speakers is characterized by a concave trajectory that begins at
approximately the middle of the speakers’ tone range then falls to the lowest pitches between 50
and 60 percent of the tone duration, followed by a rapid rise in pitch for the of the tone duration
until it reaches its highest point at the tone offset. This dynamic tone has a mid-range onset, a
low midpoint, and a mid-range to high offset. All speakers in this group have concave or scooped
pitch trajectories for this tone. Tone 5 for TBK speakers varies between the four speakers in two
aspects: the location of the lowest pitch in the tone duration and the height of the offset pitch.
The onsets for this tone are extremely uniform for the speakers in this group. Figure 44 shows
the average pitch trajectories for all tones for TBK speakers.
5.4.6 Discussion of BKK Results and Overall Results
The tones of the BKK mothers and daughters show several generational differences.
Overall, the pitch trajectories of the two groups vary in terms of pitch height and not the shape of
the pitch trajectories. Bangkok teens have higher overall pitch heights for Tone 2, Tone 3, and
Tone 4 but their mothers have a higher over pitch height for Tone 5. The overall pitch height for
Tone1 is similar but the shapes of the trajectories are very different. The location of the where
-2.00
-1.00
0.00
1.00
2.00
0% 10% 20% 30% 40% 50% 60% 70% 80% 90% 100%
Se
mit
on
e z
-sco
re
Duration (%)
TBK GROUP AVE
Tone 1
Tone 2
Tone 3
Tone 4
Tone 5
Figure 44. Average pitch trajectories for TBK speakers.

109
the highest and lowest pitches occur in the tone duration of the dynamic tones are also different
for these two groups of speakers. I will discuss the differences and similarities for each of the
five tones in more details in the next section, including in depth comparisons of the four groups
of speakers and comparisons with the results from previous studies. Figure 45 shows the average
pitch trajectories for the two groups of speakers in BKK.
5.4.6.1 Tone 1
Tone 1 for the MBK group, surprisingly, mostly patterns with Tone 1 from Abramson
(1962) in that the pitch trajectory begins with a pitch plateau and then decreases during the last
20 to 25 percent of the tone duration, forming a very prominent hook at the end of this tone.
Anivan (1988) reported the same initial straight trajectory followed by an increased rate of pitch
fall towards the end of the tone duration. Tone 1 for the three groups of speakers from my 2010
study and Teeranon (2007) have a straight negative slope with no sudden drop in pitch at the end
of the tone.
In fact, no study since Abramson and Anivan has reported a straight trajectory with a
final drop in pitch for Tone 1. Morén & Zsiga (2006) showed a sudden increase in pitch at the
-2.00
-1.00
0.00
1.00
2.00
0% 10% 20% 30% 40% 50% 60% 70% 80% 90% 100%
Se
mit
on
e z
-sco
re
Duration (%)
BKK COMPARISON
MBK Tone 1
TBK Tone 1
MBK Tone 2
TBK Tone 2
MBK Tone 3
TBK Tone 3
MBK Tone 4
TBK Tone 4
MBK Tone 5
TBK Tone 5
Figure 45. Average pitch trajectories for BKK speakers.

110
end of the tone, the only such description for Tone 1. Compared to MLA speakers, the hook
found in MBK speakers are much more prominent. Older speakers (50+ years old) in the 2010
study have virtually no hook for Tone 1. Both groups of LA speakers have the hook at the end of
their Tone 1 as well, with less prominent ‘hooks’ found in TLA speakers than in MLA speakers.
Figure 46 shows the average pitch trajectories of Tone 1 for Bangkok speakers.
Unlike the two groups of LA speakers, the two groups of BKK speakers do not have the
same trajectory shape for Tone 1. The MBK group has a pitch contour that is mostly straight for
a large portion of the tone duration and a final fall in pitch towards the offset while the TBK
group has a downward slope for pitch throughout the tone duration. What the two groups do
have in common is a change in the rate of pitch change towards the end of the tone. MBK
speakers have a more rapid fall in pitch while TBK speakers have a slower rate. One speaker,
MBK1, does have a straight downward pitch trajectory for this tone. MBK1 is also the only
speaker who was born and raised entirely in BKK and has never lived outside of BKK; whereas
the other MBK speakers are long-time transplants to BKK. Both groups also have pitch
excursions for Tone 1 that are within the middle 50 percent of the tone range. In summary, the
Tone 1 trajectories for Bangkok speakers have mid-range onsets, mid-range midpoints, and mid-
range offsets, matching the previous reports for Tone 1 (Potisuk et al. 1994, Tingsabadh &
Deeprasert 1997, Luksaneeyanawain 1998, Morén & Zsiga 2006, Teeranon 2007, and
Thepboriruk 2010). Tone 1 is truly a mid tone for both groups of Bangkok speakers.
-2.00
-1.00
0.00
1.00
2.00
0% 10% 20% 30% 40% 50% 60% 70% 80% 90% 100%
Se
mit
on
e z
-sco
re
Duration (%)
BKK TONE 1
MBK
TBK
Figure 46. Tone 1 for BKK speakers.

111
The Tone 1 pitch trajectory for the MBK speakers confirm the findings of Zsiga &
Nitisaroj (2007) that flat or slightly falling pitch trajectories within the middle of the tone range
are associated with Tone 1 by Thai speakers. Abramson (1978) and Gandour (1983) also
reported that Tone 1 is the only tone associated with a flat trajectory at all. These results are not
surprising, considering that Tone 1 has been consistently stable throughout the history of Thai
tones, with the exception of the disappearance of the hook at the end of the tone duration in
recent decades. Figure 47 shows the average pitch trajectories for Tone 1 for all groups.
Tone 1 pitch trajectories for the two mother groups are very similar, except MBK
speakers have a larger and longer hook. TLA speakers also have a hook at the end of Tone 1.
Bangkok teens are the only speakers who do not have any form of a hook in any tone. Most
MBK speakers, MLA, and TLA speakers all have trajectories that are more similar to those
reported by Abramson (1962). TBK speakers and MBK1, on the other hand, have downward
pitch trajectories from the tone onset to the tone offset, similar to those reported since Potisuk et
al. (1994) onwards. Though the onsets for Tone 1 do cluster for the MBK, MLA, and TLA
groups, MBK speakers have a larger difference in pitch between the onset and the offset. TBK
speakers have the largest change in pitch for Tone 1 out of all the four groups in this study.
Likewise, the Younger speakers in the 2010 study have a larger pitch change for Tone 1 than
Older and Middle speakers.
-2.00
-1.00
0.00
1.00
2.00
0% 10% 20% 30% 40% 50% 60% 70% 80% 90% 100%
Se
mit
on
e z
-sco
re
Duration (%)
ALL TONE 1
MBK
TBK
MLA
TLA
Figure 47. Tone 1 for all speakers.

112
Anivan (1988:9) reported that both Bangkok and regional speakers have similar pitch
trajectories for Tone 1, a tone she described as beginning “at or around the mean F0 range, and
slowly mov[ing] down with varying degrees of fall.” The Tone 1 data from this study suggest
that the “varying degrees” for Tone 1 maybe a distinguishing feature for different group of
speakers. For example, speakers who were born and raised exclusively in BKK have trajectories
for Tone 1 that are a consistent negative slope. But for those speakers who are transplants to
BKK or living outside of BKK, such as the MLA and TLA speakers and some of the MBK
speakers, Tone 1 has a trajectory that begins with a relatively straight trajectory that ends in a
final dip in pitch towards the tone offset. If we consider the latter trajectory shape to be an older
form of Tone 1, as reported by both Abramson (1962) and Anivan, the BKK speakers are,
indeed, leading a change in this tone’s contour from the older straight-falling trajectory to a
consistent negative slope.
5.4.6.2 Tone 2
For MBK, MLA, and TLA speaker groups, Tone 2 onsets cluster at approximately the
middle of the speakers’ tone range or the z-score of 0.00. TBK speakers, once again, do not
pattern with the other speakers and have much higher onsets. The offsets for Tone 2 for the
speakers in this study all fall in the bottom 25 percent of the speakers’ tone range. Speakers from
previous studies, likewise, have Tone 2 offsets that are at the bottom on the tone range. The
height of Tone 2 onsets and offsets from this study agree with the acoustic and perceptual
findings from Zsiga & Nitisaroj (2007). In their study, Tone 2 is associated with a midrange or
-2.00
-1.00
0.00
1.00
2.00
0% 10% 20% 30% 40% 50% 60% 70% 80% 90% 100%
Se
mit
on
e z
-sco
re
Duration (%)
BKK TONE 2
MBK
TBK
Figure 48. Tone 2 for BKK speakers.

113
low endpoint, low midpoint, and a low endpoint. Figure 48 shows a comparison of average pitch
trajectories for Tone 2 for BKK speakers.
Tone 2 for BKK speakers is a consistent downward slope that begins in the middle of the
speakers’ tone range. The trajectory shape is similar to the Tone 2 for LA speakers in this study,
the BKK speakers from Anivan (1988), the speakers for Potisuk et al. (1994), Luksaneeyanawin
(1998), Morén & Zsiga (2006), Teeranon (2007), and the speakers from my 2010 study. The
regional speakers from Anivan (1988) have varying shapes for Tone 2 that range from a less
steep downward slope (Northeastern - Ubon) to a downward slope with a slight rise towards the
end of the tone (Northern - Chiang Mai and Southern - Songkhla). The speaker for Tingsabadh &
Deeprasert (1997) also had a slight upward curve at the end of the tone duration for Tone 2.
Abramson (1962) reported Tone 2 to have a steeper fall in pitch from the tone onset, followed by
a gentle downward slope for the rest of the tone duration.
In terms of the shape of the pitch trajectories, Tone 2 is the most consistent across all
speakers from this study. The same was also true for the three groups of speakers from my 2010
study. This consistency in trajectory shapes contradicts the findings of Gandour et al. (1991) that
found the ‘static’ tones, or Tones 1, 2, and 4, to be more variable across different speakers than
the ‘dynamic’ tones, or Tones 3 and 5. Tone 2 was so consistent, in fact, that the mothers in this
study have overlapping average pitch trajectories for Tone 2 for half of the tone duration,
between 40 to 90 percent of the tone duration. Figure 49 shows a comparison of average pitch
trajectories across all speakers in this study.
-2.00
-1.00
0.00
1.00
2.00
0% 10% 20% 30% 40% 50% 60% 70% 80% 90% 100%
Se
mit
on
e z
-sco
re
Duration (%)
ALL TONE 2
MBK
TBK
MLA
TLA
Figure 49. Tone 2 for all speakers.

114
TLA speakers have a pitch trajectory that patterns closely with their mothers, though the
overall pitch, onset, midpoint, and offset, are higher than the pitch for MLA speakers. The
difference in overall pitch heights between TLA and MLA speakers are consistent with the
difference in pitch found between the three groups of speakers in the 2010 study. Younger
speakers (18-24) have the highest overall pitch for Tone 2 than Middle (30-40) speakers. The
Middle speakers, in turn, have a higher overall pitch than Older speakers (50+). The negative
slopes of the Tone 2 trajectories are, otherwise, very similar (Thepboriruk 2010: 98).
Though both of Tones 1 and 2 have consistent downward trajectories for TBK speakers,
the slopes are different. Tone 2 has a steeper slope than Tone 1 for TBK speakers, resulting in a
larger change in pitch between the tone onsets and offsets. Similarly, the slopes of pitch change
are different between Tones 1 and 2 for all three groups of speakers in the 2010 study, with
Younger speakers having the greatest difference in downward slope between those two tones and
Older speakers having the smallest difference. This pattern between Tones 1 and 2 was not
reported by Abramson (1962) but all others studies since then have found the pattern to be true.
Tones 1 and 2 have onsets that are very close in pitch height, approximately at the middle
of the speakers’ tone range. Whereas Tone 1 has pitch excursions that remain within the middle
of the tone range all the way through to the tone offsets, Tone 2 have offsets that are within the
bottom 25 percent of the tone range. This same pattern was true for speakers from all previous
studies, starting with Anivan (1988). The findings from Zsiga & Nitisaroj (2007) agree with this
pattern. Thai speakers associate Tone 2 with a low midpoint and a low endpoint and Tone 1 is
associated with a pitch that remains in the middle of the tone range. Additionally, they found that
speakers perceptually convert tones’ endpoints to pitch slope so that Tone 2 is associated with a
gentle fall while Tone 1 is associated with a flat trajectory. Ambiguities that arose between
Tones 1 and 2 became less confusing as the endpoints move further apart in pitch height.
For TLA speakers to pattern closely in both Tones 1 and 2 with MLA and MBK speakers
may imply that the teens in LA do not have significant differences between the two tones quite
yet. And indeed, earlier perceptual experiments (Abramson 1962 and Gandour et al 1991) show
that Thai speakers confuse these two tones. TBK speakers, however, show all the differences
reported by later acoustic and perceptual experiments. The perceptual cues for Tone 2 – mid-
range midpoint and a low endpoint – may be changing in younger BKK speakers in ways that
have yet to manifest in regional or diasporic speakers.

115
5.4.6.3 Tone 3
Tone 3 is also very consistent amongst BKK speakers. The MBK and TMBK groups vary
at the onsets and offsets, but are otherwise, similar in the shapes of their pitch trajectories for
Tone 3. Whereas MBK speakers have an initial rise in pitch for Tone 3, TBK speakers do not.
Both groups of speakers do, however, have onsets that are in the upper most part of their tone
range. Abramson (1962) reported an initial rise in pitch from the onset for Tone 3, as did Anivan
(1988) for BKK speakers, Potisuk et al. (1994), and Morén & Zsiga (2006). Gandour et al.
(1991) did not, however, and reported instead that the two speakers in their study did not have an
initial rise in pitch. Tingsabadh & Deeprasert (1997), Luksaneeyanawin (1998), Teeranon
(2007), and Thepboriruk (2010) found no rise in pitch, or an extremely small rise in pitch, for
Tone 3. What pitch rise there is for MBK speakers in this study, it is very slight, nowhere near as
prominent as the one reported by Abramson and Potisuk et al. Figure 50 shows a comparison of
average pitch trajectories for Tone 3 for BKK speakers.
BKK speakers from this study have a larger drop in pitch in the last half of the tone
duration than the Middle and Younger speakers from the 2010 study. The Tone 3 pattern of a
high onset, followed by a high midpoint, and a low endpoint was also true for Tingsabadh &
Deeprasert (1997), Lukasaneenayawin (1998), Teeranon (2007), and the Older speakers from
Thepboriruk (2010). Middle and Younger speakers from the 2010 study and TBK speakers do
not have low endpoints for Tone 3, but a mid-range one.2 Again, this may be due to the fact that
-2.00
-1.00
0.00
1.00
2.00
0% 10% 20% 30% 40% 50% 60% 70% 80% 90% 100%
Se
mit
on
e z
-sco
re
Duration (%)
BKK TONE 3
MBK
TBK
Figure 50. Tone 3 for BKK speakers.

116
all of the MBK speakers are transplants to BKK while the speakers in the 2010 study are all born
and raised in BKK. Between the three groups of speakers in the 2010 study, Younger speakers
have the least amount of pitch change during the second half of the tone duration. The same is
true for the under-twenty group when compared with the over-sixty group from Teeranon (2007).
Compared to previous studies, both TBK speakers and the Younger speakers from my
2010 study have offsets that are at approximately the middle of the speakers’ tone range. MBK
speakers’, on the other hand, have offset that fall slightly above the bottom 25 percent of their
tone range. And when we look at the height of the offset for Tone 3 across different studies since
Abramson (1962), we see that the pitch of the offset has long changed from being at the bottom
of the speakers’’ tone range first reported by Abramson to an offset that is at the middle of the
tone range (Anivan 1988, Potisuk et al 1994, Tingsabadh & Deeprasert 1997, Luksaneeyanawin
1998, Teeranon 2007, and Thepboriruk 2010). Even the older speakers in Teeranon (2007) and
Thepboriruk (2010) have offsets that are in the middle of their tone range. Figure 51 shows a
comparison of the average pitch trajectories for Tone 3 from this study.
The pitch trajectories from this study agree with the results from Zsiga and Nitisaroj
(2007) in that speakers associate Tone 3 with a mid-range to high midpoint, a low endpoint, a
pitch peak at or near the tone midpoint, and an abrupt change in pitch, particularly a steep fall.
The differences in onset heights also agree with their findings that the onset does not serve as a
perceptual cue for tone identification, but rather, the location and height of highest and lowest
-2.00
-1.00
0.00
1.00
2.00
0% 10% 20% 30% 40% 50% 60% 70% 80% 90% 100%
Se
mit
on
e z
-sco
re
Duration (%)
ALL TONE 3
MBK
TBK
MLA
TLA
Figure 51. Tone 3 for all speakers.

117
pitches, the height of the offset, and the movement of the pitch trajectories serve as salient
perceptual cues for Thai speakers in identifying tones.
Returning to the four groups of speakers in this study, the characteristics for Tone 3 are,
again, quite consistent according to the most salient perceptual cues for tone identification. The
pitch begins the swift decline at the middle of the tone duration and decreases over 25 percent of
the tone range for all speakers, with MBK speakers having the largest fall in pitch in this study.
The trajectories for Tone 3 overlap for the majority of the tone duration for the mothers but not
for the teens. The older speakers have lower pitch heights for their offsets than do younger
speakers. And the younger speakers, in turn, have higher onsets for Tone 3 than older speakers.
Interestingly, Zsiga & Nitisaroj (2007) found that as the height of the offset pitch
increases, Thai speakers are less likely to identify a contour with a high midpoint as Tone 3.
Both they and Tingsabadh & Deeprasert (1997) found that in certain connected speech
environments, Tone 3 does not fall and may have a negative slope straight trajectory all together.
In the cases where Tone 3 is confused with other negatively sloped tones, listeners rely on the
location and height of the highest pitch to distinguish Tone 3 from other tones. Potisuk et al.
(1994) reported that Tone 3 is perceptually the highest pitched tone and that speakers use this
relatively high pitch to identify Tone 3.
Younger speakers, additionally, show a slight initial pitch fall after the onset in this tone.
The Younger speakers in the 2010 study and the under-twenty group from Teeranon (2007) have
similar pitch excursions for Tone 3, that is, an initial pitch fall, followed by a long pitch plateau
and a rapid decline in pitch towards the end of the tone duration. When compared with other
tones, Tone 3 has the least amount of differences between different groups of speakers and
relative lack of variation in production agree with the perceptual findings from Zsiga & Nitisaroj
(2007) that Tone 3 identification is most accurate of all the tones for Thai speakers. What little
differences there were, TBK speakers show the most variance in Tone 3 trajectories and are,
once again, the most innovative with their tones. Neither of the LA groups have an initial fall in
pitch for this tone.
5.4.6.4 Tone 4 Discussion
Tone 4 is characterized by a hook leading into the offset for most BKK speakers and
varies mainly in the height of the lowest and highest pitch, with the exceptions of TBK1 and
TBK4 who have concaved trajectories with no hooks. TBK speakers have a lower overall pitch
for Tone 4 and greater initial decrease in pitch from the onset. For MBK speakers, the onsets for

118
Tone 4 are between the z-scores 0.00 and 1.00 while the offsets are within the top 25 percent of
their tone range, with exception to MBK2 whose offset for this tone is much lower, with a z-
score below 0.00. The onsets for TBK speakers are approximately at the middle of their tone
range, as are the offsets which have z-scores between 0.00 and 1.00, with exception to TBK2
whose offset has a z-score above 1.00. The pitch excursions in Tone 4 for MBK speakers are all
within the top 50 percent of the speakers’ tone range while the pitch excursions for TBK
speakers are within the middle 50 percent of theirs. The lowest pitches in Tone 4 for TBK
speakers is at 30 percent of the tone duration and the highest pitch at 90 percent; whereas for
MBK speakers, the lowest pitch is at 20 percent of the tone duration and the highest pitch at 90
percent. Figure 52 shows the average pitch trajectories for Tone 4 for BKK speakers.
Compared with previous studies, the location of the lowest pitch in Tone 4 at
approximately 20 percent of the tone duration is comparable to the speakers in both Potisuk et al.
(1994) and Tingsabadh & Deeprasert (1997), both studies having recorded speakers in their 30s.
The over-sixty group for Teeranon (2007) and the Older speakers from Thepboriruk (2010) also
reach the lowest pitch in Tone 4 within the first 25 percent of the tone duration; whereas the
Middle and Younger speakers from the 2010 study reach the lowest pitch at 50 percent of the
tone duration. It is unknown whether the under-twenty group in Teeranon’s reach the lowest
pitch between 25 or 50 percent of the tone duration or not since the semitone values from her
-2.00
-1.00
0.00
1.00
2.00
0% 10% 20% 30% 40% 50% 60% 70% 80% 90% 100%
Se
mit
on
e z
-sco
re
Duration (%)
BKK TONE 4
MBK
TBK
Figure 52. Tone 4 for BKK speakers.

119
study were only plotted every 25 percent of the tone duration and the pitch at 25 and 50 percent
were approximately the same.
MBK speakers have a hook for Tone 4. The most dramatic hook is at the end of Tone 4
for MBK2 whose hook occurs at the final 20 percent of the tone duration and is a drop in pitch of
nearly half of her tone range. The hook for other MBK speakers occurs during the last 10 percent
of the tone duration and has a very small change in pitch between pitch peak and the offset. TBK
speakers have a hook at the end of Tone 4 as well, but the it is very slight. Potisuk et al. (1994),
Tingsabadh & Deeprasert (1997), Morén & Zsiga (2006), and Teeranon (2007) did not report
any hook at the end of Tone 4, though both Luksaneeyanawin (1998) and Older and Middle
speakers from my 2010 study had the hook at the end of Tone 4. The 2010 Younger speakers do
not have a hook, but both groups of LA speakers do. Figure 53 shows the average pitch
trajectories for Tone 4 for the speakers in this study.
Scholars have investigated the on-going changes in Tone 4 in recent years. Of the five
tones in Thai, Tone 4 has had the most dramatic change in pitch trajectory. Teeranon (2007)
divides the changes in Tone 4 into three different periods, from a high-falling tone (Bradley
1911) to a level high tone (Abramson 1962), then to its current shape of a mid-rising tone
(Potisuk et al. 1994). The hook seems to be a left-over feature from when Tone 4 was a level
high tone, similar to one that occurs at the end of Tone 1 (Abramson 1962). Teeranon (2007)
provides convincing perceptual data in support of the on-going changes in Tone 4. Recall that the
-2.00
-1.00
0.00
1.00
2.00
0% 10% 20% 30% 40% 50% 60% 70% 80% 90% 100%
Se
mit
on
e z
-sco
re
Duration (%)
ALL TONE 4
MBK
TBK
MLA
TLA
Figure 53. Tone 4 for all speakers.
120
under-twenty group in her study associate a concave trajectory with Tone 4. The over-sixty
group, however, associate a high level trajectory with Tone 4 and when faced with a concave
trajectory, the over-sixty group confused Tones 4 with Tone 5.
Pittayaporn (2007:1422-23) proposed that the changes observed in Tone 4, a high-falling
tone changing to a mid-rising tone, are due to perceptual maximization, “where the rise of the
tone is enhanced by the lowering of the first half of the tone to create a greater F0 excursion,” so
the that contrast between the highest pitch and lowest pitch is heightened to enhance each other.
Pittayaporn added that the changes in the production are then “phonologized” by the speakers to
become the most canonical form of the tone. Tone 4 was first reported by Bradley (1911) to be a
high falling tone and by Daniel Jones (1918, in Pittayaporn 2007) to manifest as a high level tone
in short closed syllables with initial consonants from the low consonant class. And Tone 4 was,
indeed, a level high tone during the time Abramson (1962) conducted his study, a half century
after Bradley and Jones. By the time Abramson conducted his 1979 study, Tone 4 had become a
high-falling-rising tone, with the onset and offset at approximately the same pitch height as
earlier reports, but with a new shape for the pitch excursion. Tone 4 for all speakers in this study
is a mid-rising tone, as it is for both groups of speakers in Teeranon (2007) and all the speakers
from Thepboriruk (2010).
So if we look at TBK speakers who, presumably, are the most innovative speakers in this
study we see that the lowest and highest pitches are the most contrastive, that is, the pitches are
furthest apart in height than any other group of speakers. And as Pittayaporn predicted, the
heights of the tone onsets and offsets are not affected, remaining consistent and cluster across all
groups of speakers in this study. The same consistency for the heights of the onsets and offsets
was true for the 2010 speakers as well, but the not the shapes of the trajectories. The evidence of
perceptual changes Teeranon found in different aged speakers for Tone 4 supports Pittayaporn’s
hypothesis for the motivations of the changes observed in Tone 4. The trajectory of this tone is
becoming increasingly contrastive in order to increase the perceptibility of the tone in the most
maximally contrastive way from other tones in the Thai paradigm. Based on the results from this
study, the TBK speakers seem to be the furthest along in the “phonologization” of the mid-rising
contour for Tone 4 than the other speakers in this study, including their peers in LA.
5.4.6.5 Tone 5
Tone 5 for BKK speakers have concave or scooped pitch trajectory but the speakers
differ in the height of the onsets, the height of the offsets, and where the speakers reach the

121
lowest pitch in the tone duration. Though the onsets and offsets are fairly close in height for
MBK and TBK speakers, MBK speakers do have lower onsets and higher offsets than TBK
speakers. The difference in onset and offset pitch heights resulted in a smaller difference
between the highest pitch and the lowest pitch for MBK speakers in Tone 5. For TBK speakers,
the lowest pitch is reached later in the tone duration, between 50 to 70 percent of tone duration;
whereas MBK speakers reach the lowest pitch in Tone 5 as early as at 20 percent of the tone
duration. Despite these differences, Tone 5 for both groups of BKK speakers can still be
considered a mid-rising contour, as all of the onsets are between z-scores -1.00 and 0.00 and
none of the offsets exceed 1.00 in z-score. Figure 54 shows average pitch trajectories for Tone 5
for BKK speakers.
The same mid-rising trajectory was reported for Tone 5 by previous studies. What has
changed from earlier report is the location of the lowest pitch in the tone duration. Abramson’s
(1962 and 1979) speakers reach the lowest pitch for Tone 5 at approximately 25 percent of the
tone duration, similar to all speakers from Anivan (1988) and the over-sixty group from
Teeranon (2007). The lowest pitch occurs at the middle of the tone duration for Abramson
(1979), Potisuk et al. (1994), Luksaneeyanawin (1998), the under-twenty group from Teeranon
(2007), the Older and Middle speakers from my 2010 study, and the LA speakers from this
study. The Younger speakers from the 2010 study and TBK speakers from this study reach the
lowest pitch later at 60 percent of the tone duration.
-2.00
-1.00
0.00
1.00
2.00
0% 10% 20% 30% 40% 50% 60% 70% 80% 90% 100%
Se
mit
on
e z
-sco
re
Duration (%)
BKK TONE 5
MBK
TBK
Figure 54. Tone 5 for BKK speakers.
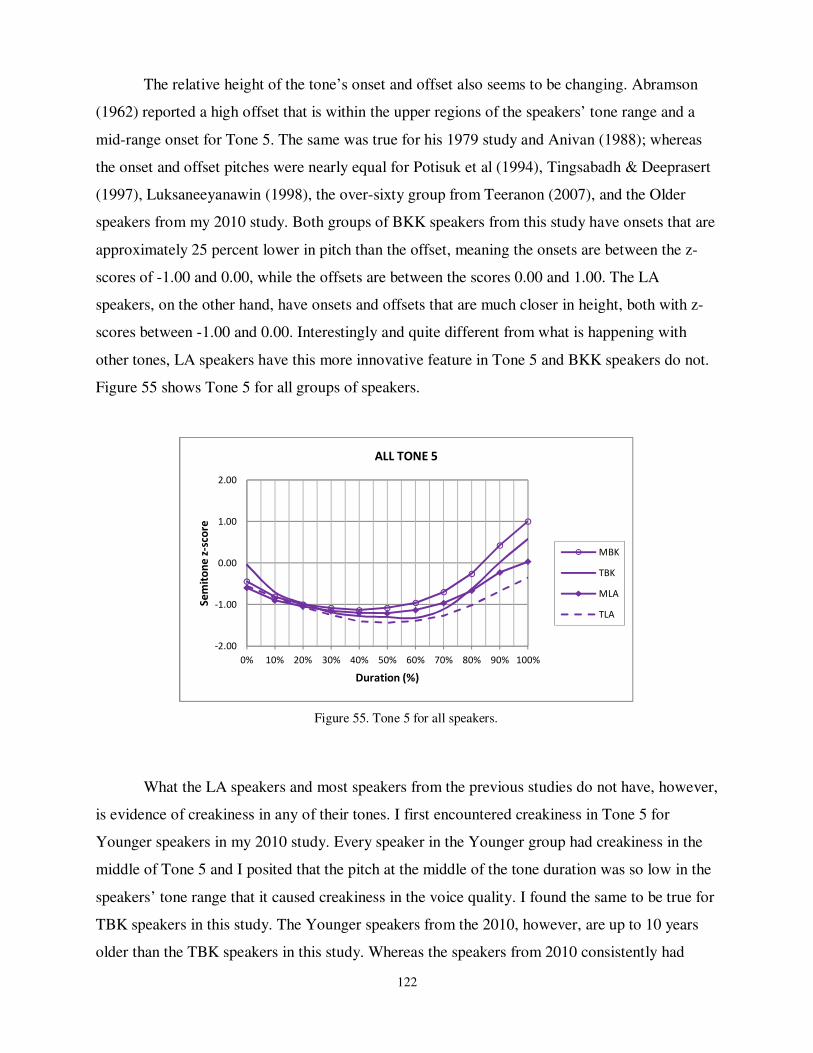
122
The relative height of the tone’s onset and offset also seems to be changing. Abramson
(1962) reported a high offset that is within the upper regions of the speakers’ tone range and a
mid-range onset for Tone 5. The same was true for his 1979 study and Anivan (1988); whereas
the onset and offset pitches were nearly equal for Potisuk et al (1994), Tingsabadh & Deeprasert
(1997), Luksaneeyanawin (1998), the over-sixty group from Teeranon (2007), and the Older
speakers from my 2010 study. Both groups of BKK speakers from this study have onsets that are
approximately 25 percent lower in pitch than the offset, meaning the onsets are between the z-
scores of -1.00 and 0.00, while the offsets are between the scores 0.00 and 1.00. The LA
speakers, on the other hand, have onsets and offsets that are much closer in height, both with z-
scores between -1.00 and 0.00. Interestingly and quite different from what is happening with
other tones, LA speakers have this more innovative feature in Tone 5 and BKK speakers do not.
Figure 55 shows Tone 5 for all groups of speakers.
What the LA speakers and most speakers from the previous studies do not have, however,
is evidence of creakiness in any of their tones. I first encountered creakiness in Tone 5 for
Younger speakers in my 2010 study. Every speaker in the Younger group had creakiness in the
middle of Tone 5 and I posited that the pitch at the middle of the tone duration was so low in the
speakers’ tone range that it caused creakiness in the voice quality. I found the same to be true for
TBK speakers in this study. The Younger speakers from the 2010, however, are up to 10 years
older than the TBK speakers in this study. Whereas the speakers from 2010 consistently had
-2.00
-1.00
0.00
1.00
2.00
0% 10% 20% 30% 40% 50% 60% 70% 80% 90% 100%
Se
mit
on
e z
-sco
re
Duration (%)
ALL TONE 5
MBK
TBK
MLA
TLA
Figure 55. Tone 5 for all speakers.

123
creakiness only in Tone 5, TBK speakers have creakiness predominantly in Tones 1, 2, and 5.
TBK4 was the most consistently creaky speaker in this study, with the longest duration of
creakiness and the highest occurrences of creakiness in all three of those tones.

124
-2.00
-1.00
0.00
1.00
2.00
0% 10% 20% 30% 40% 50% 60% 70% 80% 90% 100%
Se
mit
on
e z
-sco
re
Duration (%)
MOTHERS COMPARISON
MLA Tone 1
MBK Tone 1
MLA Tone 2
MBK Tone 2
MLA Tone 3
MBK Tone 3
MLA Tone 4
MBK Tone 4
MLA Tone 5
MBK Tone 5
Figure 57. Comparison of average pitch trajectories for mothers in BKK and LA.
-2.00
-1.00
0.00
1.00
2.00
0% 10% 20% 30% 40% 50% 60% 70% 80% 90% 100%
Se
mit
on
e z
-sco
re
Duration (%)
TEENS COMPARISON
TLA Tone 1
TBK Tone 1
TLA Tone 2
TBK Tone 2
TLA Tone 3
TBK Tone 3
TLA Tone 4
TBK Tone 4
TLA Tone 5
TBK Tone 5
Figure 56. Comparison of average pitch trajectories for teens in BKK and LA.
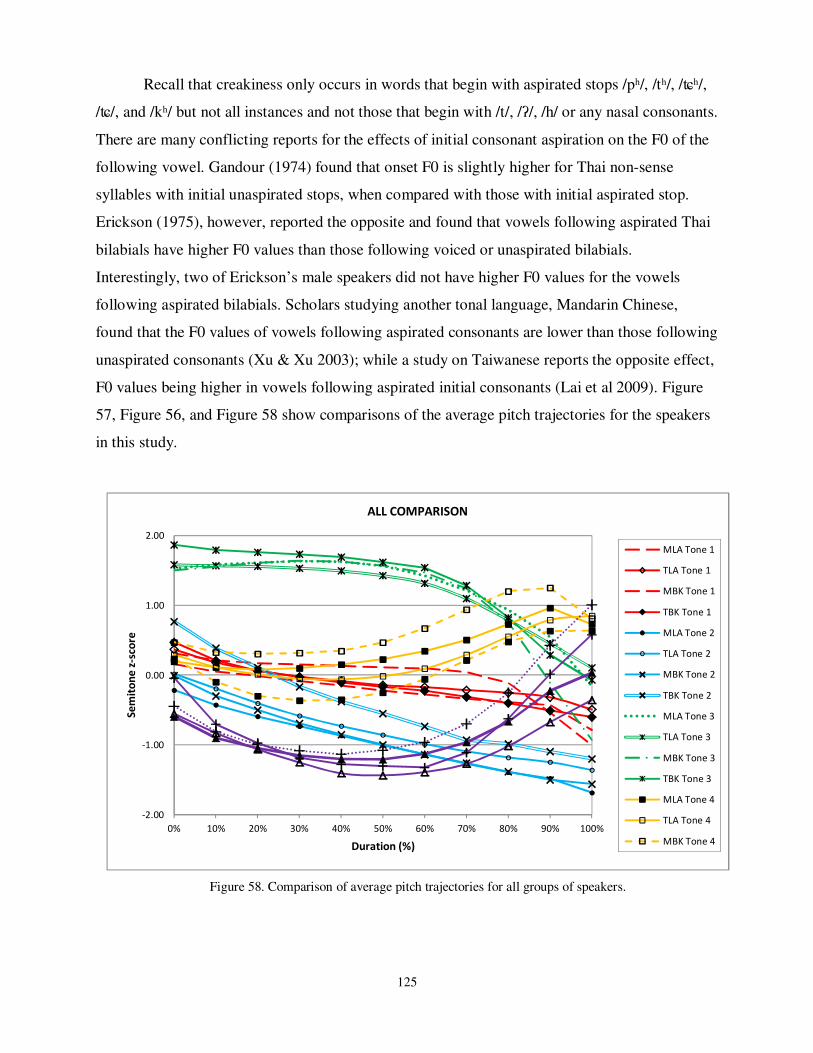
125
Recall that creakiness only occurs in words that begin with aspirated stops /pʰ/, /tʰ/, /ʨʰ/,
/ʨ/, and /kʰ/ but not all instances and not those that begin with /t/, /ʔ/, /h/ or any nasal consonants.
There are many conflicting reports for the effects of initial consonant aspiration on the F0 of the
following vowel. Gandour (1974) found that onset F0 is slightly higher for Thai non-sense
syllables with initial unaspirated stops, when compared with those with initial aspirated stop.
Erickson (1975), however, reported the opposite and found that vowels following aspirated Thai
bilabials have higher F0 values than those following voiced or unaspirated bilabials.
Interestingly, two of Erickson’s male speakers did not have higher F0 values for the vowels
following aspirated bilabials. Scholars studying another tonal language, Mandarin Chinese,
found that the F0 values of vowels following aspirated consonants are lower than those following
unaspirated consonants (Xu & Xu 2003); while a study on Taiwanese reports the opposite effect,
F0 values being higher in vowels following aspirated initial consonants (Lai et al 2009). Figure
57, Figure 56, and Figure 58 show comparisons of the average pitch trajectories for the speakers
in this study.
-2.00
-1.00
0.00
1.00
2.00
0% 10% 20% 30% 40% 50% 60% 70% 80% 90% 100%
Se
mit
on
e z
-sco
re
Duration (%)
ALL COMPARISON
MLA Tone 1
TLA Tone 1
MBK Tone 1
TBK Tone 1
MLA Tone 2
TLA Tone 2
MBK Tone 2
TBK Tone 2
MLA Tone 3
TLA Tone 3
MBK Tone 3
TBK Tone 3
MLA Tone 4
TLA Tone 4
MBK Tone 4
Figure 58. Comparison of average pitch trajectories for all groups of speakers.

126
If we consider again Pittayaporn’s (2007) proposal for the mechanisms for tone change,
we find that the changes observed in Tone 5 for both the 2010 Younger speakers and the TBK
speakers from this study can be explained. The first such mechanism proposed is the segment-
tone interaction, or the effects of the initial consonants on the quality of the tone. Thai tones
historically developed from the phonetic effects of the initial consonants (Li 1977, Brown 1983,
Gedney 1989, etc.), so it would be unsurprising and entirely plausible that initial consonants
should continue to affect the quality and realization of Thai tones today.
The second mechanism for tone change Pittayaporn proposed are two types of contextual
variations that can be generalized and phonologized by the speakers due to higher frequency of
these variations in every day speech than the canonical forms. The first type of contextual
variation is contour reduction, where changes occur in the pitch trajectory but leave the onsets
and offsets mostly intact. Because the onset for Tone 5 has remained in a relatively unchanged
pitch height, at middle of the speakers’ tone range, the differences in pitch between the lowest
and highest is getting smaller, resulting in a tone trajectory that is much flatter in more
innovative speakers.
This is certainly the case for TBK speakers and the Younger speakers from the 2010
study who have less pitch differences between relatively stable the onsets and offsets and the
lowest pitch in the tone; thus, these speakers have a ‘flatter’ contour for Tone 5. The second type
of contextual variation is rightward peak sliding. Again, the onset position stays intact, according
to Pittayaporn. The more innovative speakers do, indeed, have lowest and highest pitches that
occur later in the tone duration for Tones 3, 4, and 5 than other speakers in this study. The onsets
for those tones, however, are consistent across the different speakers with the changes only
manifesting in the shape of the trajectory as predicted by Pittayaporn’s proposal.
The third mechanism for tone change is perceptual maximization. Recall that Tones 4 and
5 are both mid-rising tones with mid-range offsets. The two tones are becoming so similarly
shaped that they are also becoming perceptually confusing (Teeranon 2007 and Zsiga & Nitisaroj
2007). Since the other mechanisms for tone change call for onsets and offsets to be left relatively
intact, other features of the tones must serve as the perceptual cue for the speakers. The results
from the innovative speakers in this study suggest that creakiness may be serving as an
additional acoustic cue for Tone 5 to distinguish it from other tones such as Tone 2 and Tone 4
that share some similarities with Tone 5. Table 7 shows a summary of the tonal features for BKK
speakers.

127
Table 7. Summary of tonal features for BKK speakers.
MBK TBK
Sta
tic
Ton
es
1
Onset Mid High/Mid
Midpoint Mid Low/Mid
Highest Onset Onset
Lowest Offset Offset
Offset Low/Mid Low/Mid
Shape Straight + hook Straight
2
Onset Mid High/Mid
Midpoint Low/Mid Mid
Highest Onset Onset
Lowest Offset Offset
Offset Low Low
Shape Straight Straight
Dy
na
mic
To
nes
3
Onset High High
Midpoint High High
Highest 30% of duration Onset
Lowest Offset Offset
Offset Mid/Low Mid
Shape Convex Neg. slope + fall
4
Onset Mid Mid
Midpoint Mid Mid
Highest 90% of duration Offset
Lowest 20% of duration 30% of duration
Offset Mid/High Mid/High
Shape S-Shaped Concave
5
Onset Mid Mid
Midpoint Low Low
Highest Offset Offset
Lowest 40% of duration 60% of duration
Offset High High/Mid
Shape Concave Concave

128
5.5 Conclusion
TBK speakers have the most innovative tones in this study. The two groups of mothers,
MBK and MLA speakers, have some differences in their tone trajectories but only in the
steepness of the pitch slope or the tone offset. TLA speakers do not have innovative tones,
patterning closer to their mothers than their peers in BKK. TBK have tones that pattern with the
Younger speakers from Thepboriruk (2010) and the under-twenty group from Teeranon (2007),
confirming that Thai tones are undergoing changes in younger BKK speakers but the changes
have yet to reach older or non-BKK speakers.
The two groups of BKK speakers in this study show generational differences in their tone
trajectories but also share some similarities such as the general shapes of the pitch trajectories,
with the exception of Tone 1. Tone 1 seems to be changing from a mid-range straight trajectory
with a final fall (Abramson 1962, etc.) to a mid-range trajectory with a consistent negative slope
(Potisuk et al. 1994, etc.). TBK speakers have the more innovative tone shape for Tone 1, the
downward trajectory, while MBK speakers still have the more conservative trajectory with a
final fall. Likewise, the LA speakers have mid-range straight trajectories with a final fall, or a
hook at the end of the tone. The two groups of mothers in BKK and LA have remarkably similar
tones, despite their distance. The pitch heights of the onsets are mostly consistent across the two
groups of mothers. The pitch heights of the offsets for Tones 1, 2, and 4 in the mother groups are
also consistent. Tones 3 and 5 differ in the pitch height between the two groups of mothers, with
MBK speakers, surprisingly having a more conservative form than MLA speakers. Their tones
otherwise match in terms of the rate of pitch change and location of the highest and lowest
pitches in the tone duration.
Unlike their mothers, the teen speakers in this study show quite a bit of variation in terms
of onset heights, location of the highest and lowest pitches in the tone duration, and offsets
heights. Tone 1 is the most similar for the two groups of teen speakers, and even then, TLA
speakers have the more conservative final pitch fall like their mothers while TBK speakers do
not. TBK speakers have offsets that are higher than the onsets for Tone 5 as do their mothers, but
TLA speakers have onsets and offsets that have roughly equal pitch heights. For Tone 2, the teen
speakers in this study differ in the overall height of the tone, with TBK having a higher onset,
midpoint, and offset than TLA speakers. The total differences in pitch between the highest and
lowest pitch, or the onset and offset, respectively, are much smaller for TLA speakers than for
TBK speakers. Both TLA and TBK speakers have a flatter trajectory for Tone 3 when compared

129
to their mothers. TBK speakers, once again, have innovative features for this tone, that is, a very
high onset pitch, a gradual decrease in pitch from the onset, and a smaller overall change in pitch
from onset to offset. TLA speakers also have the same innovative features in Tone 3, but not to
the same degree as TBK speakers. The Tone 3 onset for TLA speakers are the same as their
mothers’ and not as high as for their peers in BKK.
Overall, Tone 1 and Tone 3 are the most stable, showing the least amount of variation
across the four groups of speakers. Tone 2 has similar negative slope across the different groups,
but vary in terms of overall pitch height for the tone, that is, the height of the onsets and offsets.
TBK speakers are the most innovative and have the highest Tone 2 onset and offset while MLA
speakers are the most conservative and have the lowest. Tone 4, as previously described by both
Pittayaporn (2007) and Teeranon (2007), has consistent pitch heights for the onsets and offsets
across all speakers, but vary in terms of the locations of the pitch peak and trough. TBK speakers
have the lowest overall pitch height for Tone 4 and MBK speakers have the highest. The
speakers in this study share similarities in the first half of Tone 5 then diverge during the second
half of the tone duration, varying greatly in the height of the offset as well as the location of the
pitch trough. TBK speakers have the highest onset for this tone. MBK speakers have the highest
offset while TLA speakers have the lowest. LA speakers have roughly the same pitch height for
the onset and offset in this tone; whereas BKK speakers have higher offsets than onsets for Tone
5.
In conclusion, the results from this study agree with the findings from Anivan (1988) that
BKK speakers are the most innovative speakers in terms of tones and that other speakers outside
of BKK are aiming at older varieties of the tones spoken by the BKK speakers. TBK lead all
other speakers in tonal innovations, as they are born and raised in BKK and are younger
speakers. They are also the only group to have any evidence of creakiness in Tone 5. And
because they are the most innovative, the most salient features of tones, meaning the midpoint,
location of the pitch peak/trough, and the offset, for TBK speakers do not match MBK tones.
TLA speakers, despite their young age, are not tonal innovators in their community, but instead,
pattern with their mothers, MLA speakers, in overall tonal characteristics. Table 8 shows a side-
by-side summary of the tonal features for all speakers in this study. The table highlights the
differences between each group and the innovative tonal features in this study (colored boxes).

130
Table 8. Summary of tonal features for all speakers.
MLA TLA MBK TBK
Sta
tic
Ton
es
1
Onset Mid Mid Mid High/Mid
Midpoint Mid Mid Mid Low/Mid
Highest Onset Onset Onset Onset
Lowest Offset Offset Offset Offset
Offset Mid Mid Low/Mid Low/Mid
Shape Straight + hook Straight + hook Straight + hook Straight
2
Onset Mid Mid Mid High/Mid
Midpoint Low/Mid Low/Mid Low/Mid Mid
Highest Onset Onset Onset Onset
Lowest Offset Offset Offset Offset
Offset Low Low Low Low
Shape Straight + hook Straight Straight Straight
Dy
na
mic
To
nes
3
Onset High High High High
Midpoint High High High High
Highest 30% of duration Onset 30% of duration Onset
Lowest Offset Offset Offset Offset
Offset Mid Mid Mid/Low Mid
Shape Convex Straight + fall Convex Neg. slope + fall
4
Onset Mid Mid Mid Mid
Midpoint Mid Mid Mid Mid
Highest 90% of duration Offset 90% of duration Offset
Lowest 20% of duration 40% of duration 20% of duration 30% of duration
Offset Mid/High Mid/High Mid/High Mid/High
Shape S-Shaped Concave S-Shaped Concave
5
Onset Mid/Low Mid/Low Mid Mid
Midpoint Low Low Low Low
Highest Offset Offset Offset Offset
Lowest 50% of duration 50% of duration 40% of duration 60% of duration
Offset Mid Mid High High/Mid
Shape Concave Concave Concave Concave

131
1 Gandour et al. (1991) found that the variability in F0 production varies inversely with the amount of F0 movement, meaning, the less pitch excursions occur, the greater the variability. His reports also confirm the distinction between ‘dynamic’ tones, or Tones 3 and 5, and ‘static’ tones, or Tones 1, 2, and 4, based on significant differences in F0 movement. There were significant differences between Tones 1 and 2 in his findings. 2 Speaker TBK4 has the lowest z-score for Tone 3 offset at -1.312, well below the middle of the speaker’s tone range. All other TBK speakers have offsets with z-scores just below 0.00.

132
CHAPTER 6. TAKING A THAI STANCE IN LOS ANGELES
6.1 Research questions and goals
In Chapter 3, I established that Thai tones are the most useful way to distinguish between
different generations, between speakers of different dialects of Thai, and between a fluent and a
non-fluent speaker of Thai. Chapter 5 described the tonal conservatism found in LA speakers
when compared to their peers in Bangkok. Despite both groups of speakers consuming the same
Thai language media, such as music and news and television shows, the LA speakers and the
BKK speakers do not have the same tones. The LA teens are also not the linguistic innovators we
expect them to be at their age, whereas their BKK counterparts have tonal features such as
creakiness and the lowest/highest pitches that occur later in the dynamic tones not yet found in
other groups of speakers. Additionally, the two groups of LA speakers have fewer generational
differences in their tones than the BKK speakers (see Table 6 and Table 8). The LA mothers, too,
are conservative when compared to their BKK counterparts and have tones that pattern with
speakers in previous studies who are at least ten years older. In fact, the LA mothers in this study
do not have any innovative features in their tones.
LA participants report consuming up to 20 hours per week of Thai language media in the
form of music, movies, print media, and television shows. Thai language news and entertainment
come in two forms: locally produced in the diaspora or imported from Thailand via satellite and
syndication. Movies and television shows are available via a thriving VHS and DVD rental
system at local Thai markets and direct satellite feed.1 The LA mothers report consuming more
Thai language media than English media while the LA teens report consuming between 10-20
hours of Thai language media per week. Despite being exposed to and consuming some of the
same media as speakers in Bangkok, the LA participants in this study do not share tonal features
with their counterparts in Thailand. Somehow, older forms of tones are being preserved in the
LA speech community and being passed on to younger speakers there.
To explore some possible motivations for the tonal conservatism in LA, I look to the
framework of stance and focus my analysis of the interview data on linguistic stancetaking; in
that I investigate speakers’ positionality, more specifically, the ways the Thai teens in LA
perform Thainess in their speech acts. In this chapter I will examine the linguistic and cultural
attitudes of the LA teens to gain some insights into why 1) the LA speakers are more tonally
conservative than the speakers in BKK and 2) why the LA teens may be modelling their speech
in Thai after older speakers in their community, more specifically, their mothers.

133
I use aliases for all participants in this study to maintain their anonymity throughout the
discussions below. I will first describe the methods employed to collect the data, including the
stances I took as the interviewer and a fellow interlocutor to the teens interviewed. I begin with
brief background on the concept of stance and linguistic stancetaking, followed by how the
choice of pronouns in Thai is a way for speakers to take linguistic stances. And finally, I will
provide examples of linguistic stancetaking from the interview data that offers insights into the
conceptualization of Thainess in the LA teen community as well as why the LA speakers choose
to perpetuate a more conservative variety of Thai in their community.
6.2 Methodology and Participants
6.2.1 Methodology
The interviews were conducted at one of the Thai temples in the LA area between
December 2009 and March 2010. As part of the participant selection process, the LA teens
completed the General Ethnicity Questionnaire (GEQ), adapted from Tsai et al. (2000), to prime
the participants to think about Thainess, the Thai language, and their attitudes towards both the
Thai language and culture. I also used their GEQ answers as one of the topics of discussion
during the interview to help me to breach the topic of Thainess.
Before the interviews began and in addition to the GEQ, I primed the teens by taking the
following stances during our personal introductions as I pretended to set up the recording
equipment:
1. CAMARADERIE:
a. In being raised in the US
I approached all teen interviewees in English to signify our common US
background
b. In being Thai:
I told them that the interview was to be conducted entirely in Thai
2. ELDER/AUTHORITY
a. I told them that the interview was for my Doctoral research
3. NOVICE
a. I emphasized that I grew up in Wisconsin where there were not a lot of Thai
people and was “jealous that I didn’t grow up around other Thais” as the young
participants did

134
b. I also showed my ignorance of popular Thai culture throughout the interview
The goals behind taking these stances were to first, hedge against the discomfort of a
recorded formal interview (through camaraderie) and of me, their elder, asking for their opinions
and judgments (through presenting myself as a novice). I also wanted the teens to feel like
experts in Thainess (to my being a novice) but still speak to me in a more formal style (because I
was their elder and the interview was for academic research).
When asking them questions, I used two strategies to help reduce any effects that I may
have in their choice of pronouns. First, I contextualized the location of the discussion as much as
possible, whether in Thailand or Los Angeles, in order to provide a geographical location the
interviewees can position themselves psychologically prior to answering my questions. Second, I
took a neutral stance by always using the null form of the pronoun or ‘Thai people’ (คนไทย) or
‘American people’ (คนอเมร ก น ) in order to avoid influencing the choice of pronouns in their answer.
6.2.2 Participants
All teen participants in this portion of the study are the same as those who participated in
the phonetic portion. All were born and raised in LA, with exception of Lily who was born in LA
but then lived in Thailand for four years. Everyone self-reported as bilingual and gave
themselves a score of four or five out on a one to five scale, with five being a fluent speaker and
listener of Thai. Likewise, their community of elders at the Thai temple identified them as
“fluent” or “good” speakers of Thai.2 The Thai temple holds weekend Thai language and culture
school for children as young as two years old where every participant attended classes. Table 9
below shows the aliases used for the LA interview participants.
Table 9. LA interview participants.
ID ALIAS AGE BIRTHPLACE PRIOR LOC. YRS
MLA1 49 Saraburi (Central) BKK 30
TLA1 Rose 14 LA
TLA2 Lily 16 LA
MLA2 51 Nakhon Srithammarat (Southern) BKK 13
TLA3 Phet 15 LA
MLA3 49 Udonthani BKK 25
TLA4 Button 15 LA
MLA4 46 Nakhonnayok (Central/Eastern) Nakhonnayok (Central/Eastern) 27
TLA5 Fon 15 LA

135
The teens that I interviewed are all active members of the art and performance
community at the temple. All of them play traditional instruments and are members of the
traditional Thai musical ensemble. Some also perform traditional dances. The temple ensemble
often performs in local events throughout the LA area and at the annual Thai New Year
celebration in Thai Town. Every two years, the temple community members organize a cultural
trip to Thailand where the ensemble performs music and dances for Thai dignitaries. It is no
coincidence that the teens who are most active in ethnic art forms are also some of the most
proficient speakers in their peer group.
6.3 Stance
The following analyses use the framework of stance and stancetaking. Stancetaking
manifests in an amalgam of actions that, if taken repeatedly over time, reaffirms the speaker’s
identity. Taking stances allows speakers to tap into existing social knowledge. Stances also index
previous interactions and cannot be treated as singular isolated events. In simpler terms, stance is
positionality, that is, where we place ourselves as speakers within our environment (social
context, institutional expectations, physical surroundings), in relation to our audience (real,
perceived, imagined, or projected), and in relation to ourselves (past and future). This study is
only concerned with the linguistic aspects of stancetaking and, therefore, will not be addressing
the non-linguistic aspects like body language, physical position, or clothing.
POSITION
or
STANCE
TEXT
• speech
• writing
CONTEXTof
interaction
AUDIENCE
• actual
• imagined
• projected
Figure 59. Speaker positionality in relation to text, audience, and context.

136
Stance serves as a productive entryway into the exploration of identity construction,
especially in the field of linguistics. Linguists have long struggled to grasp the dynamic
dimension of identity construction. Analyses through the perspective of stancetaking support
both the fluid and cooperative nature of identity construction while also recognizing the agency
of the speaker in ways that older analytical models do not. Stance also accounts for the
simultaneous and multilayered ways speakers use linguistic features to portray their personhood,
be it the peculiar pronunciations of particular words, lexical choice, vocal pitch, or the wholesale
use of a phrase (along with its associated pronunciation and social implications), in ways that
other sociolinguistic frameworks cannot. Speakers can tap into their well of learned linguistic
knowledge through stancetaking. With stance, we can accommodate other interlocutors through
our speech acts whether by “picking up” someone’s accent or by speaking differently to folks at
home than to colleagues at work. Stancetaking also allows us to perform our understanding of
social roles through style, indexicality, ideology, and power and how such roles relate to us in
any particular context.
Most importantly, stance is recursive. We draw from the existing pool of linguistic
features – pronunciations, style, intonation, etc. – to build stance, and in so doing, we are
reassociating those linguistic features to the stances and social roles we are performing. Figure
60 visualizes the multi-directionality of stance where all aspects of stance perpetuate itself and
each other. Note how we cannot mobilize one element, be it social and cultural ideology or
linguistics features (accents, vocabulary, etc.) without mobilizing stance. Likewise, we cannot
take stances without implicating our social and cultural ideology or linguistic features.
Figure 60. The multi-directional and recursive relationship between stance, social and cultural
ideology, and linguistic features.
STANCE
LINGUISTIC
FEATURES
SOCIAL &
CULTURAL
IDEOLOGY

137
6.3.1 Thai Pronoun Choice as Stancetaking
One of the most illustrative examples of the recursive and collaborative nature of stance
is the choices for Thai pronominals. Thai has a rich pronoun inventory that denotes the relative
social status of the interlocutors. As such, interlocutors must either choose pronouns based on a
priori assumptions of relative social status (say, a teacher and a pupil) or cooperatively arrive
upon a posteriori pronouns which, in essence, mean the interlocutors have negotiated a different
social relationship outside of normative assumptions.
Iwasaki and Ingkaphirom-Horie (2000) found that Thai speakers choose pronouns
according to perceived or intended social and psychological distance. Besides social and
psychological distance, Thai speakers also consider rank and several other factors such as
politeness, status, potency, and formality when negotiating pronouns during an interaction
(Wichiarajote and Wilkins 1968). For example, when addressing members of the Thai royal
family, a Thai speaker would perceive a combination of large social distance and large
psychological distance that results in the highest degree of formality and deference (perhaps with
the exception of certain royal companions who may have small psychological distance to the
family). A combination of small social distance and small psychological distance, on the other
hand, would render the participants equals and give the interaction a sense of camaraderie like
when two friends are chatting over coffee. Thai speakers can assume a stance immediately after
agreeing on the pronoun system to be used.
Thai is a ‘radical pro-drop’ language, meaning that “it exhibits highly frequent use of null
pronouns” (Phimsawat 2011, i). In the case of the ‘generic you,’ the place-holding pronoun in
expository statements, Thai speakers have two ways to express the concept. In the general
observation of the frequency of rainbows in Hawai‘i, You see rainbows all the time in Hawai‘i,
the ‘you’ does not necessarily mean a particular person. To show the generic nature of the ‘you’,
we can rephrase the sentence as One sees rainbows often in Hawai‘i. Compare the ‘you’ used in
the first example to the ‘you’ in this second example: You forget people’s names all the time. The
‘you’ in the second sentence refers to a specific person that the speaker is addressing. The two
ways Thai speakers can express the ‘generic you’ are shown below:
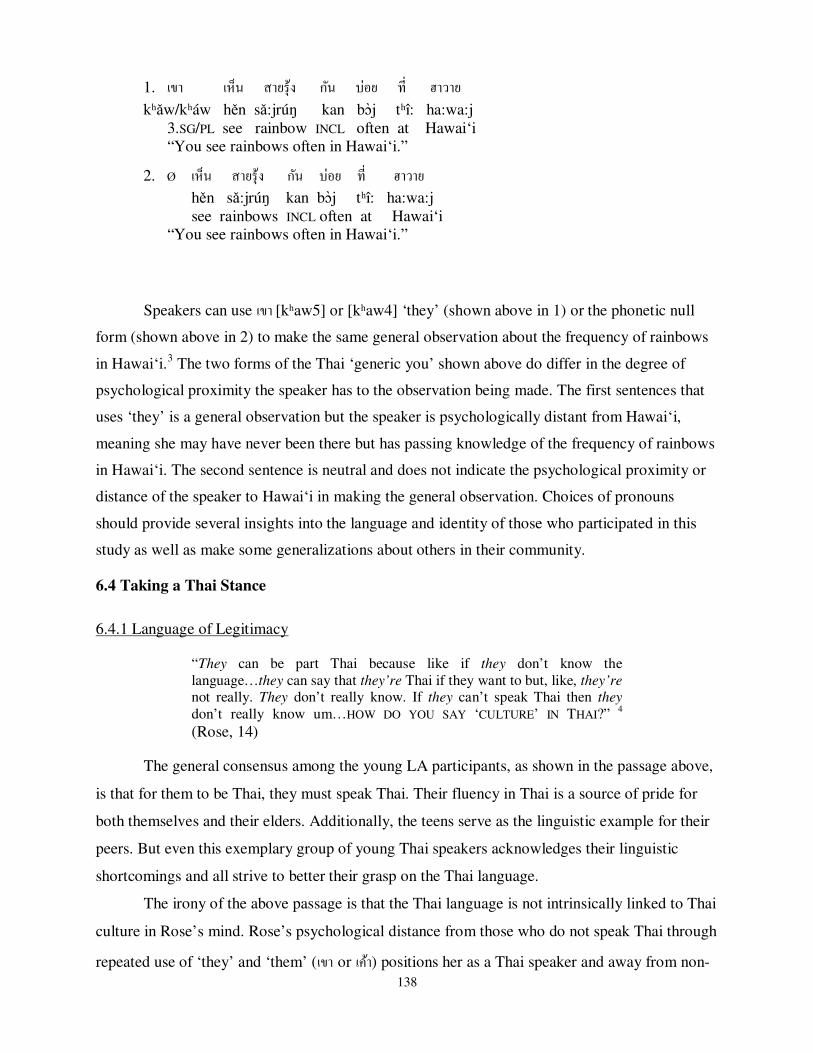
138
1. เขา เห น สายร ง ก น บ อย ท + ฮาวาย
kʰǎw/kʰáw hěn sǎ:jrúŋ kan bɔ j tʰî: ha:wa:j 3.SG/PL see rainbow INCL often at Hawai‘i “You see rainbows often in Hawai‘i.”
2. Ø เห น สายร ง ก น บ อย ท + ฮาวาย
hěn sǎ:jrúŋ kan bɔ j tʰî: ha:wa:j see rainbows INCL often at Hawai‘i “You see rainbows often in Hawai‘i.”
Speakers can use เขา [kʰaw5] or [kʰaw4] ‘they’ (shown above in 1) or the phonetic null
form (shown above in 2) to make the same general observation about the frequency of rainbows
in Hawai‘i.3 The two forms of the Thai ‘generic you’ shown above do differ in the degree of
psychological proximity the speaker has to the observation being made. The first sentences that
uses ‘they’ is a general observation but the speaker is psychologically distant from Hawai‘i,
meaning she may have never been there but has passing knowledge of the frequency of rainbows
in Hawai‘i. The second sentence is neutral and does not indicate the psychological proximity or
distance of the speaker to Hawai‘i in making the general observation. Choices of pronouns
should provide several insights into the language and identity of those who participated in this
study as well as make some generalizations about others in their community.
6.4 Taking a Thai Stance
6.4.1 Language of Legitimacy
“They can be part Thai because like if they don’t know the language…they can say that they’re Thai if they want to but, like, they’re not really. They don’t really know. If they can’t speak Thai then they don’t really know um…HOW DO YOU SAY ‘CULTURE’ IN THAI?” 4 (Rose, 14)
The general consensus among the young LA participants, as shown in the passage above,
is that for them to be Thai, they must speak Thai. Their fluency in Thai is a source of pride for
both themselves and their elders. Additionally, the teens serve as the linguistic example for their
peers. But even this exemplary group of young Thai speakers acknowledges their linguistic
shortcomings and all strive to better their grasp on the Thai language.
The irony of the above passage is that the Thai language is not intrinsically linked to Thai
culture in Rose’s mind. Rose’s psychological distance from those who do not speak Thai through
repeated use of ‘they’ and ‘them’ (เขา or เค า ) positions her as a Thai speaker and away from non-
139
Thai speakers. Rose then adds that “if, like, they can’t speak Thai at all but is fully [ethnic] Thai,
they’re, like, not at all [Thai].” She feels the same way about her ethnic Thai friends who cannot
speak Thai. “They can’t say that they’re really Thai because they like don’t know anything.”
Button, 15, takes a similar stance as Rose towards language and culture when asked if
someone born to Thai parents but cannot speak Thai can be considered Thai. She replied, “[Yes],
because they do everything [else that’s Thai] except for the language. That, they can just go
learn. Language, they can learn.” But when pressed to choose whether one should speak Thai or
have a Thai lifestyle, she answered, “Speak Thai.”5 Again, Button’s use of ‘they’ to refer to those
who do not speak Thai shows her disalignment with non-Thai speakers.
Phet, 15, also finds linguistic proficiency to be an important part of Thainess but does not
consistently align with Thai people in her answers. When asked whether someone born in
Thailand to Thai parents but is not fluent in Thai (because they are educated in the International
School system) can be Thai, Phet replies that speaking a little Thai is better than none. She adds
that someone born to Thai parents but cannot speak Thai should at least be born in Thailand to
have some cultural exposure to counterbalance the lack of linguistic proficiency. Interestingly,
Phet switches alignment towards the end of her explanation by using ‘we’ instead of ‘they’.
“Even if they can’t speak very much Thai, they still, like, at least have some Thai culture and know…They’re more Thai than the other two who are also born in Thailand, mom and dad are Thai, but can’t speak Thai and can’t understand anything. It’s….it’s better. At least we know the language a little but…even if not a lot it’s still better. Like, to know the culture and stuff.”6
Rose and her sister Lily, 16, are both bilingual in Thai and English but speak mostly in
Thai to each other because, according to Rose, her sister Lily “is into Thai so I have to speak
Thai with her.” Lily seems to have a firmer stance on speaking Thai than Rose and aligns herself
with Thai speakers even when interacting with her equally bilingual sister. Lily’s strong
alignment to the Thai language centers on her level of fluency and the social capital associated
with it. Speaking Thai clearly provides her with a lot of benefits with friends and family. Lily
recalls a proud moment when her relatives in Thailand expressed disbelief that she is from the
US while they were at a karaoke restaurant:
“and it’s like, if I go to Thailand, they can’t even tell [that I’m from the
US] because I listen to Thai music, speak Thai, read Thai. When we go
karaoke, they’re like ‘how in the hell can you sing [all these songs] and
stuff.”7

140
Lily also tells of a game she and her sister play at the markets in Thailand. Lily would speak Thai
and then separately, Rose would speak English to the merchants to see how much of a ‘Thai
discount’ they can get. In this game, Lily is always the Thai speaker and Rose always the English
speaker. Positive responses to her speaking Thai from friends and family has reinforced Lily’s
strong stance on the Thai language.
Lily also thinks that being fluent in Thai gives her an advantage in learning Chinese
because “it’s like Thai, [Chinese] has tones, has four tones and it’s the same as Thai and that
makes it easier because we have tones 2, 3, 4, 5 already so it’s already tonal.”8 Note her use of
‘we’ here to align with the Thai language when making comparisons between Thai and Chinese.
When asked why she is so proud to be Thai, Lily answers:
“[because of] our culture, our language and I was born Thai so I’m proud. I’ve never been any other ethnicity, never lived with any other ethnicity. So I’m proud that we’re Thai. Because I see that we’re different and before I could speak English, people would compliment my
Thai and that made me super proud. Stuff like that.”9
Lily’s particularly strong stance towards the use of the Thai language may contribute to
her tones being the most different in the group. Recall that her tones (TLA2) did not pattern with
her mother, her sister, or the other speakers in the TLA group. Interestingly, her tones do not
pattern with the teen speakers in BKK either; they were only different from those who
participated in this study and, perhaps, from the other members of the LA community as well.
Lily is very proud of the fact that she lived in Thailand for four years and that she had to learn
English when she returned to the US. She refers to these two elements in her background
throughout the interview to affirm both her Thainess and uniqueness in the LA teen community,
a uniqueness that also manifests in her tone trajectories.
Fon, 15, is proud to be Thai and gives herself a five out of five rating on the GEQ
questionnaire for Thainess. There are eleven Thai students at her high school who are from
Thailand for whom she serves as the Thai interpreter, according to her mother. Whenever a new
student arrives from Thailand, Fon is their guide and provides orientation and additional support.
Understandably, because of her role as the school interpreter, she highly values her own
linguistic proficiency. When asked about the differences between the Thai kids here and the ones
from Thailand, she answers:
“the kids…Thai kids that are born in Thailand, they’re like THEY’RE
SMARTER [Q: how are they smarter?] They’re better at language…no, not language…uh MATH and they’re like, they’re better than the ones that are born here. [Q: what about the kids in here?] they…they speak English better.”10

141
Fon sees herself as belonging to neither group. The Thai kids from Thailand are ‘they’ as are the
Thai kids in the United States. Earlier in the interview, she states that she considers herself to be
part American because she likes to do American things like go out with friends.
Fon describes being Thai as cultural knowledge, but places emphasis on linguistic
proficiency, “Thai people are, like, people who know nation, one’s [Ø] own nation. And know
Buddha, Buddhist monks, who the King is and….can you [Ø]speak Thai? Can you [Ø]
understand Thai? Can you [Ø] write? But the important thing is, like, can you [Ø] speak and
understand [Thai]?”11 Here, she uses the null form in favor of ‘they’ for the ‘generic you’ and
shows her neutral stance towards Thai people. I will explore the neutral stance in the next
section.
When asked if they were raised in a Thai way (question 1 on the adapted GEQ), all LA
teens answered yes in varying degree. The “Thai Way” was described by the teens as their
mothers speaking only or mostly Thai to them. Interviews with the LA mothers confirm the view
that the “Thai Way” to raise a child is to speak Thai at home, often times at the expense of the
mothers’ desire to practice and learn English. The mothers all express regret that they were not
able to pratice English at home with their native-speaking children but value their children’s
proficiency in Thai more. Those who do occasionally speak English at home also express regret
that they fail to strictly speak Thai at home. The LA teens share their mothers’ sentiments
towards Thai and English. Those who report speaking English at home also wish they did not
and see their need to speak English as a deficiency in their Thai abilities and, to a degree, a
failure. Button, for example, gave her upbringing only a three out of five for Thainess because
she and her mother speak both Thai and English at home so that her mother can practice English.
She also admitted guiltily to speaking English to her mother without cause.
Linguistic proficiency is an important element to being Thai to Rose, her sister Lily, Phet,
and to a lesser degree, Button and Fon, a value their mothers work to cultivate at home. This
view is further reinforced by the community elders who praise linguistic proficiency. Language
is so essential for the LA teens, in fact, that they all place it above all other characteristics such
as physical features, cultural practices or knowledge, and lifestyle. For Fon and Lily, especially,
their fluency in Thai helps support their claim to Thainess since they see themselves as elsewise
not fully Thai.

142
6.4.2 Alignments and Disalignments
“There they’re like, how to compare? They speak Thai so it’s the same.
But I feel like they humble themselves a bit and I’m like…I’m rowdy and
I’m a bit rough and kinda crazy.”12 (Lily, 16)
We discussed earlier that pronoun choice in Thai shows the psychological distance and
proximity of the speaker to the audience and/or topic being discussed. Pronoun choices in the
previous section also hint at ideological alignment or disalignment to perceived Thai norms.
Psychological distance shown through the teens’ choice in pronoun points to the indeterminacy
of their own Thai identity, an identity they all simultaneously defend and challenge throughout
the interview.
During the interview, the LA teens use various pronouns, whether consciously or
subconsciously, when speaking about different topics. They also demonstrate their fluency in the
Thai pronoun system by switching between different registers (formal v. informal) and by their
use of the phonetic null form when appropriate. Non-fluent speakers of Thai have an extremely
difficult time navigating the complex Thai pronoun system and often use the wrong form or
over-use pronouns when the null-form would be acceptable. And because efforts were made to
avoid pronouns when asking the interview questions, we can interpret the pronouns choices in
their answers to be meaningful in the analysis of their stance towards the topic of discussion.
The previous section outlined the close proximity the Thai teens place themselves in
relation to the Thai language and proficiency in the Thai language. Indeed, their own linguistic
proficiency is the pillar for their claim of Thainess. But where would the teens place themselves
when linguistic proficiency cannot be a criterion for Thainess? I asked each to compare Thais to
Americans and also what they like or do not like about each culture. In their explanations and
comparisons, the LA teens take one of three stances: 1) alignment by referring the group being
discussed as ‘we’; 2) disalignment by referring to the group being discussed as ‘they’; or 3)
double disalignment by referring to both Thais and Americans as ‘they’ or by using the phonetic
null form in the place of pronouns.
In the passage above Lily describes the difference between her and the Thai kids she
meets while in Thailand and does not align with them. She continues, “and they…and they’re,
like, really CONSERVATIVE. And they’re kinda quiet and humble and I’m like loud and crazy. But
I do get along with them.”13 Lily has a very egalitarian view of ethnic identity. When asked what
characteristics make a Thai person Thai, she explains, “No characteristic. Like, we want to be

143
Thai…if we want to be…we…it depends on what people think….People have different
standards. My standard is this, if you want to be [Thai], you can be. Some people want to be
[Thai], that’s ok. And some people don’t want to be Thai and they want to be American or
whatever, go ahead.” 14 Lily aligns, here, to a different group that is neither Thai nor American
by saying that if her group wants to be Thai, they can.
Phet, on the other hand, oscillates between taking an alignment stance by using ‘we’ and
taking the disalignment stance by using ‘they’ when referring to Thais. She uses ‘we’ when she
begins to explain why she is proud to be Thai, “I’m proud that we are…born to be…Proud to
have been born as a part of the Buddhist brethren.” Then her alignment to Thainess begins to
waver, losing the stronger conviction shown in the beginning of the interview. When asked what
Thai people are like, Phet answers, “It’s like, Thai people, they have a good heart and
like…like…Thai people they would…humble themselves….” She does not align with Thai
people in her answer here, perhaps because she may not consider herself to be humble. Phet’s
alignment switches again when she continues to explain which characteristics she admires about
Thais. Here, she aligns more closely with Thai people and uses ‘we’, “A Thai characteristic I
admire is….when we see each other, we would like…uh…sincerely smile at each other and not
like just smile in passing.”15
Unlike Phet, Button’s alignment does not oscillate when comparing Thais and
Americans. And similar to Lily, Button aligns with a separate group that is neither Thai nor
American. She takes a double disalignment or neutral stance in her comparison, “especially here
and in Thailand. IT’S LIKE DIFFERENT. Especially because here, they don’t really like JUDGE BODY
TYPES but like in Thailand, they…they look down on fat people and black….dark-skinned
people.”16 Button considers herself to be half Thai and half American because she partakes in
activities that both groups of people do. She is American because she likes to go out with friends
and speaks English at home with her mother. She is Thai because she speakers Thai, prostrate in
front of the Buddha, goes to temple, and does her own laundry.
Fon also takes a neutral stance towards both Thai and American culture, reaffirming it
throughout the interview. At one point she goes as far as refusing to say what qualities in a Thai
person she admires and instead insists that these are the qualities that she admires in all people,
no matter who they are. “They have to be polite. And I don’t like, like, people who talk too much
and who, like, are mean.” She positions herself outside of the Thai community and the American
community, using ‘they’ to refer to both Thais and Americans.
144
Recall also the earlier example of Fon using ‘they’ for both the Thai kids from Thailand
to those born in the United States at her high school. Again, when comparing Thais and
Americans, “THAI PEOPLE, uh, they’re like nice. Not like American people like AMERICAN, LIKE,
WHITE PEOPLE. They’re like indifferent. They don’t usually help other people.” She concludes
that she does not like one group of people more than the other. In her explanation, she creates an
unspecified separate group to which she compares both Thais and Americans, “because they
[Thais], they’re like, they’re EQUALS with us. And Americans and Thais are equals too, like, I
DON’T LIKE ONE MORE THAN THE OTHER.”17
Rose also consistently takes a neutral stance, opting to refer to Thai people only as ‘Thai
people’ or by using the null form. When asked what makes her proud to be Thai she answers,
“Proud that, like Thai people, don’t have, um, the culture isn’t like other people’s. Because it’s
not like other people and stuff like that. Ø [Thai people] don’t copy other people.”18 This
drastically different stance to Thainess and Thai people may be why her tones are not the same
as her sister’s despite being raised in the same household. We can eliminate any influence time
spent in Thailand may have on her sister Lily’s tones because Lily’s tones do not pattern with the
teens in Thailand either. Rose’s and Lily’s different ways of self-positioning with respect to the
Thai people and community manifests phonetically in the differences we see in their tones.
Overall, the LA teens vary in their alignments throughout the interview when pressed to
directly compare Thais with Americans. Unlike the consensus they have on the importance of the
Thai language, they do not agree on which characteristics make a Thai person Thai. Some
common themes do arise: humility, niceness, and being Buddhist. Humility was used as a
description for Thai people by Phet and Lily. Niceness and being Buddhist are considered Thai
characteristics for Phet, Button, and Fon. Rose only mentioned niceness as a Thai trait.
Of the three stances – alignment, disalignment, and double disalignment (neutral) – Fon,
Button, and Rose consistently took a neutral stance by disaligning with both Thais and
Americans. Rose’s sister, Lily and Phet switched between alignment and disalignment,
depending on the subject matter and whether or not they considered themselves to have the same
characteristics as those being discussed. Only Lily specifically commented on her persona (as
loud, rough and crazy), whereas Phet revealed her self-perception through which behavior she
aligned (nice and smiley) or disaligned (humble) with during her comparisons.

145
6.4.3 Locus of Thainess
At the end of the interview, after some of the initial awkwardness of our conversation had
waned, I asked each of the teens to compare and rank four different hypothetical individuals in
terms of the level of Thainess and whether each of them could be considered Thai. The purpose
of this comparison was to see which of the characteristics of Thainess were more important to
the teens. The individuals vary in terms of level of Thai proficiency and cultural knowledge and
participation. The four individuals were as follow:
1. An American-born Thai, cannot speak or understand Thai but comes to temple, does Thai
dancing, plays Thai music, but is not linguistically proficient
2. A half-Thai, half-American (ล กคร ง � ), speaks and understands Thai but cannot read or write
Thai, bicultural (a bit American, a bit Thai) lifestyle, sometimes participates in some
Temple activities
3. Thai-born Thai, attends an international school, can speak and understand Thai but is
educated entirely in English, so can only read and write in English.
4. Thai-born white American, born and raised in Thailand by white American parents, high
level of proficiency in Thai from being educated entirely in Thai schools.
Not surprisingly, the teens find linguistic proficiency in Thai important in their ranking of these
hypothetical individuals. The teens also rank cultural knowledge and participation highly as an
integral aspect of being Thai. Physical appearance does not factor into their ranking of Thainess.
Recall the passage at the beginning of this chapter from Rose who equates linguistic
knowledge with cultural knowledge, saying that those who cannot speak Thai can only be part
Thai, at most. Rose’s stance on linguistic proficiency is strong and she sees the ability to be able
to communicate in Thai as central to being Thai. Physical appearance does not factor into
Thainess for Rose. When asked about the Thainess of her racially mixed peers, she answers:
“It’s irrelevant [to Thainess]. The mixed kids are more Thai than [full ethnic Thais who cannot speak Thai] because at least they know the culture and can speak [Thai]. At least they know. But if they can’t speak Thai and they’re full Thai, they’re like, not at all [Thai].”19 (Rose, 14)
Fon also ranked linguistic proficiency highly and similarly does not equate physical
appearance with Thainess. She placed more importance on having the proficiency in Thai
because she sees the Thai language as a gateway to cultural knowledge and rank the second

146
person as the most Thai “because if they can speak Thai and they can speak English, so, like,
they know, like, the language and their parents can teach them [everything else].”20
Like her peers, Phet places a premium on linguistic proficiency but values cultural
knowledge more than other aspects of Thainess. She highlights the importance of being
surrounded by Thai culture, especially for those who may not have a lot of proficiency in the
Thai language:
“Even if they don’t, can’t really speak Thai much, they’re like…um…even if they…they still have the culture, like, know more about Thainess…because at least they know some Thai but like, even if it’s not a lot, it’s good, like, to know the culture and stuff.”21 (Phet, 15)
But unlike her peers, Phet did not consider the fourth person, the Thai-born white fenake, to be
Thai. She says that, “it’s good that she [the Thai-born white female] can speak Thai and stuff,
like, even if she’s, like, not Thai but she still wants to learn about Thai and Thai culture and stuff
like that. It’s good she can speak [Thai].”
Lily, on the other hand is more egalitarian in her definition of what it means to be Thai.
Like the other LA teens, she values linguistic proficiency and places are premium on cultural
knowledge and participation. She agrees with her sister Rose that physical appearances do not
matter when it comes to being Thai.
“There is no requirement [to be Thai]. If we want to be Thai, if we want to be, we can be. But it depends on opinion. Because some people think there is no requirement, just to be born to Thai parents and that’s being Thai. And some other people think that to be Thai, we have to speak Thai, read Thai, and stuff like that, understand, know the culture, play Thai musical instruments and stuff to be considered Thai. Lots of white people want to be Thai in Thailand, in Esan (Northeastern region of Thailand). They’re like…I consider them to be Thai because they’re, like whoa, they can waw Lao (“speak Lao” in Thai-Lao) super good. They can speak Thai. They know Thai culture. So I think they see themselves as Thai. The way I look at it, I think they’re Thai. But some people say ‘hey, white people with their skinny noses and big eyes can’t be Thai’ but it’s all opinion. different standard for different people. My standard is that if you want to be [Thai], you can be. Some people don’t want to be Thai, they want to be like white people, I say, ‘go ahead’ be whatever you want. It’s not up to me to categorize [people].”22 (Lily, 16)
She also thinks that those born to Thai parents but cannot speak Thai can also be Thai, adding
that as long as they consider themselves to be Thai and are proud to be Thai or if they play Thai
music. Again, cultural participation and knowledge rank higher as integral aspects of Thainess to
147
Lily than physical appearance or linguistic proficiency. She concludes that being Thai is a
choice, more than anything else.
When asked directly what being Thai is, the teens answered with three central themes. In
addition to linguistic and cultural proficiency, being Thai also means being Buddhist. All of the
teens spend a large portion of their free time at the Wat Thai and are active members of the
community at the Temple, so it is not surprisingly that they all would associate being Thai with
being Buddhist. The Thai language and cultural curriculum at the Temple, itself, is not secular.
The teaching staff procures teaching and learning materials directly from education outlets in
Thailand. And since Thailand is not a secular country, much of the teaching materials contain
Buddhist content. Phet, for example, says that she is proud to be Thai because she is “proud to
have been born a part of the Buddhist brethren.”23 Rose also equates being Thai with being
Buddhist. She rated the Thainess of her upbringing with a score of five out of five. When asked
to expand on her answer, she says, “[My mom] speaks Thai to me every day and takes me to
Temple and takes me back to Thailand to go to more temples.”
Despite their own insecurity in being Thai discussed in the previous section, their
definition and conceptualization of Thainess is surprisingly open. The locus of Thainess seems to
be linguistic proficiency. Because the LA teens prioritize Thai language over all other aspects of
Thai, especially for themselves, they also judge Thainess based on that same criterion. Besides
linguistic abilities, the teens also value cultural knowledge and participation. Every participant in
this study is an active member of the art and music community at the Wat Thai, so it is expected
that they should see cultural participation and knowledge as an integral part to Thainess.
Likewise, the desire to be Thai is also an important part of being Thai.
6.5 Summary and Discussion
In the preceding section, I have shown some of the tensions that the LA teens embody in
their conceptualization of Thainess and Americanness through the use of Thai pronouns. Like
their Chinese peers in Central America, second-generation South Asian Americans, and Filipino
Americans, the LA Thai teens struggle for a sense of belonging in their own Thai community
and within the mainstream American community. The general consensus among the LA teens is
that proficiency in the Thai language is important. All that were interviewed placed a premium
on being proficient Thai speakers and aligned strongly with Thai speakers. Inversely, they
positioned themselves away from, or disaligned with, non-Thai speakers, including their Thai
friends who do not speak Thai. The teens all described speaking Thai as affording them certain

148
social benefits in their community and also when they are in Thailand. Speaking Thai also
strengthens their own identity claims and performance. In short, to speak Thai is to be Thai.
In aligning with Thai speakers, the teens are making authenticating moves. Speaking
Thai, in fact, is an authenticating move in of itself. Their disalignment with non-Thai speakers
marks those who do not speak Thai as inauthentic and, once again, reinforces their own
authenticity in the Thai community. I primed the teens to feel comfortable taking an expert
stance during our self-introductions despite our difference in age and the cultural norms for
interacting with an elder. And because authenticating moves require that others be inauthentic,
just as taking an expert stance requires that someone is a novice, I reinforced my own novice
stance during the interview when necessary.
Recall that being authentic requires local consensus from their community. And indeed,
their high level of fluency in Thai grants them acceptance from the Thai community at large as
well as allows them the ability to make claims of authenticity. Their non-Thai-speaking friends,
on the other hand, are inauthentically Thai in comparison because they lack linguistic
proficiency. Lily, in particularly, cultivates her Thai authenticity by speaking mostly in Thai to
both her parents and even her equally bilingual sister. The Thai teens reinforce this paradigm by
psychologically placing themselves away from their friends who do not speak Thai by referring
to them in third person, linguistically excluding them from the community.
The importance of linguistic proficiency is also authentic because of the value attached to
it by community members and those that the teens come into contact with in Thailand. Take the
example of the market game Lily and Rose play to compare the lower prices for merchandise
when speaking Thai instead of English. Such activities confirm the high value of the Thai
language as a useful tool in their lives. Speaking Thai is so important, in fact, that many teens
rank it as more important than physical features and place of birth. Participation in this study
further reinforces the premium on the Thai language.
This preoccupation with authenticity in the LA community may contribute to the tonal
conservatism in this speech community. If we assume that the Thai elders are viewed as the most
authentic in the community, and more locally, the mothers in their homes, it is unsurprising that
the tones of the teen speakers in this study are modeled after whom they deem as most authentic.
And if to speak Thai authentically is to sound like their mothers and other community elders, the
LA teens have no social motivation to be linguistic innovators in Thai or to model their speech
after younger speakers in the Thai language media they consume.

149
When language is removed as a criterion for Thainess, the teens varied in what they
considered to be Thai. Likewise, their previously firm stance and alignment to the Thai
community and language became less certain. The LA teens either had oscillating alignments
between the Thai community and American community or took a firmly neutral stance through
double disalignment from both communities. Phet and Lily alternated using ‘we’ and ‘they’
when referring to Thais and Americans while Lily’s sister Rose, Button, and Fon were decidedly
neutral. Both Button and Fon used ‘they’ to refer to both communities and Rose avoided using
pronouns, opting instead to say ‘Thai people’ or to use the phonetic null form.
Another strategy for taking the neutral stance through double disalignment was to create
a separate community that was neither Thai nor American. Both Lily and Fon aligned with a
group, an unspecified ‘we’, as they made comparisons between the Thai and American
communities. Lily used this neutral ‘we’ when explaining what it takes to be Thai, “We can be
[Thai] if we want to.” Fon used the neutral ‘we’ to insist that everyone is equal, “Thais are equals
to us and Americans are equals to Thais.”
A similar ‘in between’ space was found in the discourse of Filipino Americans
interviewed by Espiritu (2002). Thainess for the teens in LA have become what Espiritu (2002:
45-46) called “an object of cognitive orientation” that can be built upon and challenged. And
because Thai identity can be built and challenged, the teens can move in and out of the sphere of
Thainess in their discourse without losing their sense of authenticity. Likewise, those who would
not be traditionally considered Thai (non-Thai speakers, white Americans), can be considered
Thai if they so choose to identify as Thai.
The choice in Thai pronouns illustrates the psychological proximity and distance the
speaker has with the subject matter or audience. In this study the Thai LA teens have shown
their alignments and disalignments with the Thai language, Thai speakers, non-Thai speakers,
Thai people, and American people. The Thai teens also showed the uncertainty of their sense of
belonging by disaligning with both the Thai community and the American community, a double
disalignment. This strategy hedges against any challenges that may arise against their claim of
Thainess, and by disaligning with both Thai perceived cultural norms and American perceived
cultural norms, the teens provide themselves with an ‘in between’ space where their identity can
tentatively reside and from whence their identity can retract.
The LA teens’ conceptualization of Thainess places a premium on linguistic proficiency
and is congruent with their general stance on the importance of the Thai language. Their
definition of what it means to be Thai ranks linguistic abilities highest, followed by cultural

150
knowledge and participation. Only one participant, Lily, does see linguistic proficiency as a
requisite to Thainess. Instead, she places language and cultural on equal planes and that, in order
to be Thai, one must at least be proficient at the language or the cultural, and not necessarily
both.
Overall, physical appearance does not seem to factor as an aspect of Thainess. When
asked to consider the Thainess of a mixed-raced person and a white person, the teens were
willing to accept both to be Thai, based on their proficiency in the Thai language and culture.
Lily, again, emphasizes the importance of the desire to be Thai, in that, as long as someone
wants to be Thai and takes the necessary steps (e.g. learn the language and culture), then one can
be Thai. Further, Lily adds that if someone does not want to be Thai, they do not have to identify
as Thai. The only participant to resist the idea of a white person being Thai is Phet. When asked
if a Thai-born white person who is proficient in Thai language and culture can be Thai, she
answered in the negative, adding that while it is ‘nice’ that the white person is able to speak Thai
and knows Thai culture, that person cannot be Thai.
The high ranking of fluency/proficiency in Thai fuels the linguistic conservatism in the
LA community that manifests in their tones, preserving features that speakers their age in
Thailand no longer use. In this sense, we can place the LA speakers in the same group as the
regional speakers from Anivan (1988) and Tienmee (1992) who also lag behind Bangkok
speakers in tonal innovations. This study also shows, once again, that BKK speakers lead in tonal
innovations when compared with those living outside of Bangkok.
Because this is the first linguistic study of Thai being spoken outside of Thailand, it is yet
unknown whether diasporic speakers will eventually adopt some of the tonal innovations found
in Bangkok speakers today or whether they will continue to preserve this particular variety of
Thai recorded by this study. It is also unknown at this time what effects new incoming Thai
speakers have on the diasporic community of Los Angeles, whether they assimilate to the
diasporic variety or whether they introduce innovations into the speech community. Lastly, it is
also unknown whether other hubs of Thai settlement in the United States, such as Chicagoland
and the Washington D.C. metropolitan area, have similar patterns of linguistic conservatism in
their tones.

151
1 To learn more about the transnational nature of Thai language media rentals, see Sirida Srisombati’s “BKK-LAX: Transurban mules and low-rent globalization”, Unpublished doctoral dissertation, University of California, Santa Cruz, 2005. 2 To recruit participants, I asked temple elders to identify teen girls who they considered to be “fluent” and “good” speakers of Thai so that I can interview them in Thai. The elders promptly named and, in some cases, personally introduced me to the participants. 3 The third person singular pronoun /kʰaw/ เขา can be pronounced in two ways. If pronounced as spelled, it is
[kʰaw5], but in casual speech it is often pronounced as [kʰaw4]. This pronoun is also used as a singular first person pronoun by some female speakers in casual, familiar settings. 4 I have translated all interview texts from Thai to English. Throughout the study, I will indicate instances of code-switching to English with SMALL CAPS. The rest can be assumed to be in Thai. Henceforth I will provide the Thai
text in footnotes: ก เป นได แค ส วนน งค ะ เพราะว าแบบ ถ าเค าไม ร ภาษา และก เค าก เป น เค าก พ ดว าต วเองเป นคนไทยก ได แต ว า แบบว าเค าไม ค อย เค าไม ค อยร ถ าเค าพ ดภาษาไทยไม ได เค าก แบบไม ค อยร อ ม � HOW DO YOU SAY CULTURE IN THAI?
5 ก เพราะเค าท าท กอย าง ได แต ว าแค ภาษาเค าก ไปเร ยนได [อ ม ... ก ค อภาษาน ม น ...ย งไง � ] ม นก ..เร ยนได [แล วอย างอ นล ะคะ ..เร องว ฒนธรรมการใช � � ช ว ต ] ก ... เหม อนคนไทยอ าค ะ [เหม อนคนไทยนะ ..โอเค ] ค ะ [ก ค อ..ถ า ...ถ าเก ด... ต อง ..ต องเล อกได น ค อแบบน าจะพ ดภาษาไทยได � หร อว าน าจะท า ต วเป นคนไทย ] พ ดภาษาไทยได
6 ค ะ เพราะว า ถ งแม เค าก จา ไม พ ดไทยไม ค อยเยอะเท าไหร เค าก จะแบบ อ ม ถ งแม เค าก ย งม ว ฒนธรรมไทยแบบ ร ความเป นไทยเยอะกว า สอง อ กสองคนท เอ อ มาแล ว เก ดท เม องไทยเหม อนก นพ อแม ก ไทย แ + + ต ว าพ ดไทยไม ออกฟ งไม ร เร องอะไรเง ยค ะ ม นก ม นก จะด กว าค ออย างน อยเราร + 3 ภาษาไทยบ าง แต ว า ถ งไม เยอะก ย งด ไงคะ แบบ ร ว ฒนธรรมก ย งอะไรง 3 7 แล วม นก ถ าหน ไปเม องไทยเค าก ด ไม ออกหรอกเพราะหน ฟ งเพลงไทยพ ดเพลงพ ดภาษาไทยอ านภาษาไทยออก ไปคาราโอเกะก ม งร องได ไงวะ
อะไรอย างเง ย 3
8 Lily uses the Thai names for the tones here but for ease of reading, I have substituted them with numbers as follow:
tone 2 – เอก [ʔè:k]; tone 3 – โท [tʰo:]; tone 4 – ตร [tri:]; tone 5 – จ ตวา [ʨàttawa:]. She does not, however, mention the
first tone, tone 1 – สาม ญ [sǎ:man]. She may not know the name of the tone or excludes it to support her claim that
Thai is like Chinese. 9 ก ว ฒนธรรมเรา ภาษาเรา แล วก ก หน ค อเก ดมาเป นคนไทยม นก ภ ม ใจ เป นชาต อ นแ � ล วเราไม เคยอย ก บชาต อ นเราก ภ ม ใจในความเป นไทยของเรา �
เพราะว าเราเห นว าเราเป นเอกล กษณ ของเรา แล วก หน ก อนท จะพ ดภาษาไทยได ต องม แต คนชมแล วก ภ ม ใจมาก อย างง นน ะค ะ � <
10 เด ก .. ไทยท เก ดเม องไทยเค าแบบ � They are smarter .. [ฉลาดกว าตรงไหน ] ก ..เค าเร ยนภาษา เอ มไม ใช ภาษา เอ อ � Math อ ะ เค าแบบ เค า
ด กว า คนท เก ดท น ค ะ อ อฮ .. � � � [อ ม ...อ าวแล ว เด กอเมร ก นล ะ ] เค า เค า พ ดภาษาอ งกฤษเก งกว า
11 ก ...คนไทยก เป นแบบ คนร จ ก ชาต .. ต วเองอ าค ะ [อ อฮ ] ก ร จ กว า พร ะ พระเป นอะไร พระสงฆ เอ ม ในหลวงเป นใคร แล วก พ ดภาษาไทย �
ได ไหม ฟ งภาษาไทยได ไหม เข ยนได ไหม แต ท ส าค ญก เป นแบบพ ดก บฟ งได ไหม �
12 น นเค าก เปร ยบเท ยบย งไงเค าก พ ดไทยช ดเค าก ก เหม อนๆก นเพราะว าเค าร ส กว าจะแบบอ อนน อมถ อมตนหน อย แล วหน ค อหน ออกห าวแล วก แล วหน ออกห าวๆแล วหน บ าๆ บอๆ

152
13 แล วเค า แล วเค าจะแบบ CONSERVATIVE มาก แล วเค าก แบบเฉยๆอ ะ เพราะ เพราะว าตอนท หน ม เพ อนท เม องไทยเค าก ค ยแบบ อ อเหรอคะ � � �
อะไรแบบ โอ โห อ อนน อมถ อมตนแล วหน ก แล วหน ก ห าว ๆบ าๆบอๆ อย างเง ย แต หน แต หน ก เข ากะเค าได นะ เพราะว าส อสารก นได เข าใจก น < �
14 Lily uses ค ณ [kʰun] ‘you (polite)’ in this instance as a ‘generic you’ as if she is addressing a specific person.
ไม ม ค ณสมบ ต ค อเราอยากเป นคนไทย ถ าเราอยากเป นเรา ก ม นแล วแต คนค ดอ ะ …สแตนดาร ดแต ละคนไม เหม อนก น แล วสแตนดาร ดหน ค อ ถ า
ค ณอยากเป นค ณก เป นได หน ไม ม นพ ดอะไรเพราะโลก โลกเราเราก อย ก นโลกเด ยวอย างง แล วท าไมต องแบ งแยกด วยถ าค ณอยากเป นไ < รค ณก เป น
เลย
15 ค อว า คนไทยเค าม จ ตใจด นะคะ แล ว ก ค อแบบ ค อแบบเอ อ คนไทยเค า จะม อ อ นอบน อมถ อมตนแบบ ค อ มากกว า มากกว า เอ ม มากกว า �
มากว า พวก ศาสนาคร สเต ยนอะไรเง ยค ะ <
16 เฉพาะท น ก บท เม องไทย � � � IT’S LIKE DIFFERENT [ต างก นย งไงอ ะคะ ] เฉพาะท เฉพาะคนท น อ ะ เค า เค าไม ค อย � � � แบบว า JUDGE THE BODY
TYPE แต ว าท เม องไทยเค า .. เค าจะด ถ กคนอ วนก บคนด า � .. ผ วคล า <
17 ก แบบ . . Thai people เอ อ เค าแบบ ใจด อ ะ [อ อฮ ] เค า ... IS HAPPY and ไม เหม อนคนอเมร ก น แบบ AMERICAN LIKE WHITE
PEOPLE [อ อฮ ] THEY LIKE….[เค าไม ค อยอ ะไร…..เค า... ] เค าแค แบบเฉยๆ เค าไม ค อยช วยคนอ น �
ข อส บสามนะคะ บอกว าน บถ อ คนท เป นคนไทย ก ให แต มแค สาม ... ท าไม แค สาม ท าไมไม หน ง ท าไมไม ห า � � ] เพราะว า เค าก แบบ เค า
EQUAL ก บเรา แล วก ท าให อเมร ก นก บไทย EQUAL ให ม น แบบ like อ า DON’T LIKE ONE MORE THAN THE OTHER
18 ก ภ ม ใจว า ก คนไทย ก ไม ม แบบ เอม ว ฒนธรรมไม เหม อนคนอ น � …ม นก ด อะค ะ เพราะว าม น ไม เหม อนของคนอ นอะไรย งเง ยอะค ะ และไม � � <
ลอกคนอ น �
19 [การเป นล กคร งอะไรน เก ยวมะก บการเป นไทย ถ าเก ดว าพ ดไทยได ท าต � � � วเป นไทย แต ล กคร ง � ] ก ไม เก ยวอะค ะ � [แล วเปร ยบเท ยบก บคนท เก ด �
ท เป นไทยแท แต พ ดภาษาไทยไม ได � ] เค าก คนท เป นล กคร งเค าก จะเป นคนไทยมากกว าเพราะเค าย งร แบบว ฒนธรรมและก พ ดได อะไรย งง อะค ะ เค าก � � � <
ย งร แต ว าถ าแบบพ ดไม ได เลยแต ว าเป น ไทยแท เค าก แบบก ไม ใช เลย
20 เพราะว า …เค าค อแบบพ ดภาษาไทยได พ ดภาษาอ งกฤษได ค ะ แล วก เค าก ได ร แบบ ภาษาท แบบ ท พ อแม เค าสอนเค าได � �
21 ถ งแม เค าก จา ไม พ ดไทยไม ค อยเยอะเท าไหร เค าก จะแบบ อ ม ถ งแม เค าก ย งม ว ฒนธรรมไทยแบบ ร ความเป นไทยเยอะกว า สอง อ กสองคนท + เอ อ มาแล ว เก ดท เม องไทยเหม อนก นพ อแม ก ไทย แต ว าพ ดไทยไม ออกฟ งไม ร เร องอะไรเง ยค ะ ม นก ม นก จะด + + 3 กว าค ออย างน อยเราร ภาษาไทยบ าง แต ว า ถ งไม เยอะก ย งด ไงคะ แบบ ร ว ฒนธรรมก ย งอะไรง 3 22 ไม ม ค ณสมบ ต ค อเราอยากเป นคนไทย ถ าเราอยากเป นเราก ม นแล วแต คนค ดอ ะ เพราะ บางคนค ดว าม นไม ม ค ณสมบ ต อะไร แค เก ดมาเพราะว า
ม พ อแม เป นคนไทยก เป นคนไทยแล ว เราว า แล วบางคนก ค ดว า เอ อ อ อเพ อนเป นคนไทยเราต องพ ดภาษาไทยอ านภาษาไทย แบบอะไรอ ะ ฟ ง ร �
ว ฒนธรรมไทยเล นดนตร ไทยอะไรอย างง ไทยก ถ อว าเป นไทย แล วฝร งท อยากเป นไทยม นก ม เยอะแยะ ท เม องไทยไปอ สานเค าก หน ถ < � � � อว าเค าเป นคน
ไทยเพราะว าเค า โอ โหเว าลาวได ส ดยอด เค าพ ด เค าเค าพ ดไทยได เค าร ว ฒนธรรมไทย หน ก ว า เค าก เป น คนไทยอ ะ ในสายตาของเค าแล วใน แล ว
ในสายตาของหน หน ก ว าเค าเป นคนไทย แต ว าม บางคนท บอกว าไอ ฝร ง ไอ คนขาวๆจม กโด งๆอะไรอย างง ตาโตๆเป นคนไทยไ � � < ม ได แต ว า ม นก
แล วแต คนค ด สแตนดาร ดแต ละคนไม เหม อนก น แล วสแตนดาร ดหน ค อ ถ าค ณอยากเป นค ณก เป นได หน ไม ม นพ ดอะไรเพราะโลก โลกเ ราเราก

153
อย ก นโลกเด ยวอย างง แล วท าไมต องแบ งแยกด วยถ าค ณอยากเป นไรค ณก เป นเลย หน ก ไม ได แบ งแยกอะไร อยา < กเป นก เป นไม อยากเป นก โอเค อย าง
บางคนเค าไม อยากเป นคนไทย เค าอยากเป นฝร งเป นอะไร ก เป น ก เช ญ ถ า แล ว ม นแบบ ม นก แล วแต คนค ด หน ไม แบ งแยกอะไร � อย แล ว
23 Interestingly, the term she used was พ ทธศาสนาน กชน [pʰúttʰasà:tsanǎ:níkkaʨʰon] which is incorrect. The correct
term is พ ทธศาสน กชน [pʰútthasǎ:tsaníkkaʨʰon].

154
CHAPTER 7. SUMMARY OF FINDINGS AND CONCLUSION
7.1 Summary of Findings
The first chapter introduces the impetus for conducting the study, including my own
personal experiences growing up as a speaker of Thai in diaspora. A study that began from a
personal inquiry developed into a pilot study of Bangkok tones (Thepboriruk 2010) and led to
the realization that no study has been done on speakers of Thai outside of Thailand. My goal for
this study was to examine the way that the Thai language is spoken by Thais living outside of
Thailand when compared to the Thai spoken by those living in Thailand. The study focused, in
particular, on the production of tones in four different groups of speakers, mothers and daughters
in Los Angeles and Bangkok. Variations in Thai tones mark dialect boundaries (Tingsabadh
citation, Anivan, 1988, Tienmee 1992) as well as differences in the age of the speakers (Panroj
1990, Teeranon 2007, Thepboriruk 2010), so the examination of tone production across age and
geographical groups is especially insightful for Thai.
The second chapter reviews some non-linguistic backgrounds on the Thais in the United
States and provides definitions from outside the field of linguistics that are used in this study.
The chapter begins by providing a brief background of Thais in Los Angeles as well as my
argument for the Thai community’s status as a diasporic community, using Cohen’s (1997)
definition. Here, I also compared Thais to other Asian communities in the United States,
highlighting the unique position that Thais hold in the Asian community at large that have led to
the lack of scholarly interest in the community. The chapter also discusses the process of
diasporization as described by Parreñas and Siu (2007) and how ethnic identities develop under
such diasporization conditions. The discussion then continues with a review of linguistic works
on language and identity that helped shape the path of this study, beginning with pioneer works
on adolescent language and identity (Labov 1974 and Eckert 1989), then moving on to more
recent works on the formation of authentic ethnic identity. The chapter concludes with a short
discussion on stance; the ways that stance shows psychological distance and proximity of the
speaker to the subject matter; and, lastly, how pronoun choices in Thai are a way for Thai
speakers to take linguistic stances that show psychological distance and proximity.
The third chapter reviews previous works on Thai tones, beginning with the earliest
account in 1911 by Cornelius Bradley. The literature shows that Thai tones are undergoing
changes, with younger speakers in Bangkok being the most innovative speakers and leading the
changes found in Tones 1, 3, and 4. Tone 1 is changing from a mid-falling tone with a mostly

155
straight contour (Abramson 1962) to a mid-range tone with a negative slope tone trajectory
(Thepboriruk 2010). Tone 3 is still a high-falling tone but the location of pitch peak in younger
speakers is much later in the tone duration than for older speakers (Thepboriruk 2010). Tone 4
had undergone the most changes in the past 100 years, changing from a high-range tone with a
mostly straight contour (Abramson 1962) to a mid-rising tone (Teeranon 2007 and Thepboriruk
2010).
In fact, even speakers over the age of 60 did not have the contour reported by Abramson
anymore (Teeranon 2007 and Thepboriruk 2010). Younger speakers, additionally, have later
pitch troughs for Tone 4 than older speakers (Thepboriruk 2010). The chapter ends with
differentiation of the BKK variety of Thai in comparison to those outside of BKK. Anivan
(1988) and Tienmee (1992) found that BKK speakers have different tonal characteristics than
speakers from other regions of Thailand, as well as those in nearby areas within the Central
region of Thailand, with BKK speakers having the most innovative forms of Thai tones than the
others. Anivan (1988) also found that speakers outside of BKK seem to be aiming at older
versions of Thai tones, varieties that BKK have since moved away from.
Chapter 4 describes the recruitment and recording method used in this study, beginning
with the fieldwork conducted in Los Angeles between December 2009 and March 2010 at a local
Thai Buddhist temple. The description includes the ways I depended on the Thai elders, those
who I consider to be linguistic gatekeepers in the community, to recruit younger participants for
the study, who then recruited their mothers to participate in the study as well. A different method
was employed for the fieldwork portion in Bangkok between April 2010 and October 2010.
There, I formally contacted the administrators at two different schools, an historical all-girl
school and a new international school, to recruit participants. Administrators at those schools
then recruited participants, in particular students whose mothers also work at the school, for the
study. Both instances of recruitment relied heavily on the existing social networks in each
location. The chapter concludes with the ways in which the sound files were recorded,
segmented, and statistically analyzed for the study.
Chapter 5 is the presentation of phonetic results from the data, beginning with the,
presumably, most conservative speakers, that is the mothers in LA (MLA). Overall, the tones of
MLA speakers pattern with the tones of BKK speakers who are at least 10 years older (Teeranon
2007 and Thepboriruk 2010). Further, MLA speakers have ‘older’ forms of the three tones,
Tones 1, 3, and 4, which show the most innovations in younger speakers. The most innovation
group of speakers in this study is the teen speakers in BKK. Most noticeably is the creakiness

156
found in Tone 5 for TBK4, who had the highest number of creak tokens of all the speakers in her
group. Creakiness only occurs with words that begin with aspirated stops /kʰ/, /ʨʰ/, /ʨ/, /tʰ/, and
/pʰa/ for this speaker but were also found in Younger speakers in an earlier study (Thepboriruk
2010). There are conflicting reports of the effects that aspirated initial consonants have on the F0
of the following vowel but as the Thai tone paradigm was borne from the effects of initial
consonants, it is possible that the initial consonants, once again, are causing changes in the
characteristics in the tones. TLA speakers, on the other hand, are not tonal innovators like their
peers in Thailand but pattern more similarly with their mothers. The locations of the lowest and
highest pitches in the tone duration, generational markers in BKK speakers, occur in the same
places for both groups of LA speakers. In the case of Tone 1, LA speakers have the same tone
trajectories, a gradual decrease in pitch with a final hook; whereas TBK speakers do not show a
final hook while MBK speakers still have it. As Anivan (1988) predicted, non-BKK speakers do
have older forms of Thai than BKK speakers, who are the innovators for tones.
Chapter 6 shifts away from the phonetic study of Thai and explores the ways in which the
teens in LA use the Thai language and how that reflects that ethnic identity. In particularly, I
focused on the choice in pronouns that the LA teens use when speaking about different aspects of
Thainess and their own ethnicity. Recall that Thai pronoun choices reflect the speaker’s
psychological proximity or distance to the interlocutor and the subject matter. Prior to the
interview, I primed the participants by taking several stances during our personal introductions.
The stances I chose were designed to 1) put the teens at ease during the interview (Comradery);
2) alleviate the strong hierarchical nature of Thai culture and language (Novice); yet 3) elicit
careful and, as much as possible, monolingual Thai interaction (Expert).
I found that the LA teens had three different strategies in pronoun choices when
discussing Thai and American people, culture, and identity. First, the teens took a stance in
alignment with the subject matter with which they wanted to be associated by using the plural
first person pronoun เรา /raw1/ ‘we’. Inversely, they disaligned by using the plural third person
pronoun เขา /kʰaw5/ or /kʰaw4/ ‘they’. The teens also took a ‘double disalignment’ stance by not
psychologically placing themselves in proximity or association with any subject matter,
essentially placing themselves outside of both Thai and American culture. The ‘double
disalignment’ stance can be taken in two different ways, by using the plural third person pronoun
เขา /kʰaw5/ or /kʰaw4/ ‘they’ to refer to both Thai people and American people or by
systematically using the available null form for the pronoun.

157
The interview data also show that the LA Thai speakers highly value linguistic
proficiency in Thai, to the point that the LA mothers sacrifice their own opportunities to learn
English at home to ensure that the teens achieve a high level of fluency in Thai. All participants
see speaking Thai as the pillar of being Thai. These views are expressed through various
authenticating moves made by the LA teens in the interview. In fact, the ability to be able to
participate in a Thai language interview is an authenticating move for the teens in performing
their Thainess. The desire to be authentic in Thai provides motivations for the teens to model
their speech after those who are considered to be most authentic in the community, that is, the
elders and not their peers. More specifically, the LA teens model their Thai language after their
mothers’ and, subsequently, have no social motivation to be linguistic innovators in Thai. Their
tones, as a result, do not pattern with their peers in Thailand but with their mothers.
7.2 Implications of the Study
This dissertation contributes to several areas of study. In the field of linguistics, the
findings from this dissertation add to the existing body of work on Thai linguistics and offer
many new insights. This study provides the first, hopefully of many more to come, exploration of
the Thai language as spoken outside of Thailand. The phonetic findings agree with the patterns
proposed by Anivan (1988) and Tienmee (1992) in which speakers outside of Bangkok lag
behind in tonal innovation when compared to Bangkok speakers. Whereas previous studies
compared randomly selected speakers in different age groups (Gandour et al. 1994, Teeranon
2007, Thepboriruk 2010), this study directly compared mother and daughter pairs. The results
show that neither the teens in LA nor their mothers are at the forefront of the linguistic
innovations in Thail that stem from BKK, despite the BKK variety being the variety used in the
Thai language media that speakers from both groups consume. The tonal patterns of the LA
mothers also lag behind their peer group in Thailand and pattern more with speakers who are at
least ten years their senior. The teens in LA, meanwhile, pattern more closely with their mothers;
and thus are perpetuating an older pattern in the diaspora than the innovative variety spoken by
their peers in BKK. The results, therefore, supports what Chambers (2003) described as the
linguistic conservatism of displaced speakers.
The phonetic data, further, confirms the strength of the dialectal divide in the Thai
language that is drawn by tonal characteristics. Long advocated by Thai tone specialists working
from both the diachronic and synchronic perspectives (Gedney 1983, Tingsabadh 2001), the
dialectal demarcations in Thai based on tones has yet to be explored with populations outside of

158
Thailand. The tones of the displaced Thai speakers in this study show that the speakers exist in a
linguistic realm outside of the centrality of Bangkok, yet are distinct from other speakers in
Thailand as they cannot be defined by existing regional characteristics. Additionally, the tonal
characteristics of the teen speakers in LA create a new group of speakers in the field of Thai
linguistics that juxtaposes linguistic conservatism and innovation, a group that warrants future
linguistic investigations beyond tones.
The results from the discourse analysis show the ways in which teen speakers of Thai in
LA align and disalign with the different aspects of Thainess, offering a glimpse into the linguistic
and cultural attitudes of a new generation of Thai speakers in diaspora. An understanding of what
it means to be Thai in diaspora can inform the works of those interested in language preservation
and conservation, as well as immigrant and heritage language curriculum. Further, the linguistic
stance of double disalignment, where the teen speakers in LA create a separate space that is
neither Thai nor American, contributes meta-linguistic evidence to support the concept of ‘Third
Culture Individuals.’ Though the conceptualization by Useem et al. (1963) was based on
American expatriates whose personal, linguistic, and cultural orientations do not align with either
the ‘home’ or ‘host’ country, the double disalignment by the LA teens does suggest that they,
too, exist in a third space despite not being in the same situations as the those Useem et al.
(1963) described. Outside of linguistics, this study provides a glimpse of ethnic identity
construction in an under-studied population. The linguistic stance taken by the teens, as well as
the conservatism of their tones, is an insight into the process of linguistic preservation being
undertaken in the LA Thai community, a process which has yet to be studied.
Outside of the academe, this dissertation offers validation to a population oft ignored in
scholarly discourse. The unique position that Thais hold in the United States as well as within the
Asian American population has left the community outside of the theoretical discourse and
narrative of Asian American studies, as discussed in Chapter 2. Likewise, their geographical
displacement outside of Thailand has also excluded them from the interests of Thai specialists in
all fields. The lack of a trauma narrative leads to scholars in Diaspora Studies to also overlook
displaced Thais. It was my hope that by conducting this study about the Thai diaspora in LA, that
scholars will be drawn to do further research in the future. It is my hope, also, that this
dissertation adds momentum to the nascent field of Thai American and Thai Diaspora Studies. If
nothing else, I hope that this dissertation affords the Thai communities in diaspora an invitation
to the academic discourse party.

159
7.3 Limitations of the Study and Directions for Future Studies
There were several limitations in this study. I will be addressing, first the limitations in
the phonetic portion of this study, then the discourse portion. Though this study attempted to
compare four different populations of speakers, the participants were homogeneous in three
ways. First, two of the field sites, at an all-girl school at a Buddhist temple in BKK and a Thai
language and culture school at a Buddhist temple in LA, respectively, resulted in religious
homogeneity in the participants that may have affected the study, especially the discourse
analysis data. Second, the limitation of the study to only female speakers could have affected the
results. Third, the demographic and settlement pattern of Thais in LA may differ from other
areas of the United States. Lastly, the discourse analysis portion from this study stemmed from
quality of the interview data that proved to be inadequate for quantitative analysis. The absolute
most was made of the hours of interview recorded but inevitably, there were a few limitations to
the discourse data collection and analysis. First, the division of speakers in this study into four
groups of mothers and daughters in BKK and LA overly simplifies any population of speakers.
The first demographic limitation could be addressed by future studies that are more
inclusive in the selection of participants. There are several Thai Christian churches and at least
one Muslim Thai association in the Los Angeles area. In Thailand, Christians and Muslims make
up six percent of the population according to the latest census data (Thai Census, 2010). There
are some efforts within the Christian community to teach the Thai language, mostly, in the form
of language lessons built into the Sunday school infrastructure. But, as far as I know, there are no
programs that are comparable to what is currently offered at the Buddhist temple. The Thai
community in Seattle, WA has a community center that is separate from any religious
institutions that offer language and cultural classes to Thais and Americans. A linguistic study at
such a center may offer different outcomes on Thai identity than those presented in this study.
To address the above limitations, future studies should explore the Thai being spoken in
the Christian Thai communities in LA. Some of the students at the Thai temple are, as
previously mentioned, Christians who limit their participation to just language, music, and dance
lesson while many Christian Thai parents choose not to enroll their children at the school at all
for religious reasons. Many of the Thai-American community leaders in LA are Christians and
there are some struggles in their attempt to integrate and participate fully in the Thai community
as advocates and members, especially when the main Buddhist temple still serves as the physical
and emotional center to many Thais in the LA community. Undoubtedly, the experiences of Thai
160
Christian youths will differ from the those presented by this study due to the minority status of
Christians in the Thai community as well as the overwhelmingly Buddhist orientation of
mainstream Thai culture. The social processes involved in identity construction and language
preservation in the community, therefore, may be different from the experiences of the Buddhist
majority who participated in this study. Questions of curriculum design also arise because the
pedagogical materials readily available in Thailand make no effort to separate Thai culture from
Buddhism. Muslim Thais, likewise, will have experiences that are different from the Buddhist
teens in this study, especially given the ongoing negative presentation of Muslims in the
mainstream American and Thai media.
Future studies can also include participants from the two other metropolitan areas in the
US that have a large concentration of Thais: Chicagoland and the Washington D.C. metropolitan
area. It is understood in the US Thai community that each of the three main population hubs has
very different demographic characteristics that stem from each having a different pattern of
settlement. No study has yet explored the differences and commonality of the three main
concentrations of the Thais in the United States. My colleague Dr. Varisa Patraporn, Department
of Sociology at California State University, Long Beach, and I are designing a demographic
survey to address this lacuna in our understanding of Thais in the United States. The pilot
bilingual survey will be conducted in the Los Angeles metropolitan area, as LA is home to the
largest concentrations of Thais in the US. We then plan to expand the survey to Chicagoland,
then the Washington D.C. metropolitan area. It is our hope that by designing and conducting this
survey, we will be able to create a more comprehensive picture of the US Thai diaspora. Thais
also settled in large numbers in Australia and Europe but not much is known of the communities
in either locations. Further, the population of Thai workers within other parts of Asia and the
Middle East continues to grow as more Thais leave Thailand due to continued political and
economic unrest during the past decades.
Male Thai speakers warrant their own studies as well. Early participants for the studies
on Thai tones were male, due to the relative accessibility of male speakers to the male scholars
who conducted the studies, especially when such studies were done outside of Thailand. Female
students from Thailand did not pursue their education overseas until after WWII and not really in
great number until in the 1960s. Though there has been no phonetic evidence that female and
male speakers have different characteristics in their tones (Gandour et al. 1991), the identity
construction and self-conceptualization presented in this study is based on female teen speakers
and is necessarily limited in perspective. The topic of the construction of masculinity, especially

161
in the face of prevalent emasculating stereotypes of Asian males in the mainstream American
media most likely affects the male youths in the LA Thai community. Likewise, younger male
speakers in BKK most likely have different experiences than their female counter parts. Another
group that has been linguistically neglected is those who do not have heteronormative gender or
sexual identities. Much has been made of the ‘third gender’ in Thailand in other disciplines,
especially gender studies, sociology, and anthropology but very little is known about their
linguistic practices, including pronoun choice. In addition to being hierarchical, pronouns in Thai
are also mostly gendered with very few gender-neutral options available for speakers. An
investigation of pronoun choices in the Queer communities of Thai speakers will offer extremely
interesting linguistic insights.
The bifurcation of speakers in this study into four overly simple relational groups of
younger v. older and mothers v. daughters ignores the intersectionality of real-world identities
that are far more complicated than the binaries assumed in this study and subsequently limited
the scope of this study. As this dissertation was not purely one that investigated ethnic identity
construction, but rather, an attempt to incorporate both phonetic and discourse data, I was unable
to sufficiently address the daily lives of the participants. An understanding of the identity of any
person requires further study and much more time than was available for this study. Future
studies can approach the study of Thais in LA with a community of practice approach for a more
holistic look of linguistic and cultural attitudes of those who participate in temple events.
Another direction would be to focus more on sociolinguistic interviews that would offer a deeper
look at the various stances taken by other members of the Thai community such as the Buddhist
monks who are administrators of the Thai language and culture school as well as other
volunteers who are the working gears of the organization. Such in depth studies of the
community would more clearly show the social grouping within the population.
Lastly, this study ignored the fact that all participants, including those in BKK, are
proficient, in varying degree, in English. There have been very few investigations on Thai-
English bilingual speakers. The interactions between the grammars of both languages in the
speech of bilinguals have yet to be properly described or explored. The phonetic results of this
study suggest that some of the teen speakers in LA utilize a tense/lax distinction found in English
in place of the length distinction found in Thai. And because vocalic variety is not perceptively
marked in Thai, meaning, they are not particular salient, the use of a different distinction in the
vowels does not equate disfluency in the language. Consonantal variation, however, is a dialectal
and generation marker in certain dialects of Thai (Chalermsanyakorn 2000) and are more

162
perceptively salient for Thai speakers. As such, the consonants in the speech of the teens in LA
do not show much variation from the speakers in Thailand.
There are some indications that younger speakers in BKK have some consonantal
innovations which are, as expected, not found in the speakers in LA. The velar stop /kʰ/, for
example, shows signs of backing as well as affrication for the BKK teens, especially in stressed
position. The palatal affricate /ʨʰ/ also show some signs of rounding from, what I suspect to be,
an influence from English, so that the consonant is nearing /tʃ/ in English. It is yet unknown
whether these pronunciations are affectations that have some social index for the speakers that
use them or whether they are, indeed, phonetic innovations in the younger speakers of BKK.
In summary, many issues were given insufficient attention in this study. Future studies
can improve on this project by including 1) Christian and Muslim Thais; 2) male speakers; 3)
members of the community who have various gender identities; and 4) the bilingual realities of
Thais in diaspora. One of the tertiary goals of this project was to increase the academic exposure
of the Thai communities outside of Thailand and to begin the academic discourse about the Thai
diaspora. As such, any future study that helps to fill in the knowledge gap within the academe
and our community is welcomed by scholars and community advocates.

163
Appendix 1a: Biographical Surveys for BKK Participants
Biographical Information (ข อม ลบ คคล ) - Mothers
ช อ � -นามสก ล Name-Last name อาย
Age สถานภาพสมรส 1. โสด 2. สมรส 3. อ นๆ (ระบ ) � Marital Status Single Married Other (please specify)
สถานท เก ด � 1. กร งเทพฯ 2. จ งหว ด............................... Birthplace Bangkok Province…………………. สถานท อาศ ยก อนย ายมาท � � กร งเทพฯ ต าบล/อ าเภอ.............................. .... จ งหว ด.................................... Residence prior to moving to Bangkok District………………………….. Province……………………. ระยะเวลา ………………..ป Length of time ………………..years
ระด บการศ กษา 1. ต ากว าม ธยมศ กษา � 2. ม ธยมศ กษา 3. ปวช. ปวส. Educational Level Less than High School High School Technical School 4. ปร ญ ญาตร 5. ปร ญญาโท 6. ปร ญญาเอก Bachelor’s Degree Master’s Degree Doctorate Degree อาช พ Occupation รายได ครอบคร วต อป Annual Household Income
ระยะเวลาท ค ณอาศ ยอย ท กร งเทพฯ � � …………….ป The amount of time you have been residing in Bangkok …………….years
Dependent(s)’s Information (ข อม ลบ ตร )
จ านวนบ ตร ไม ม ม บ ตรชาย...............คน บ ตรหญ ง.............ค น Number of Dependents None Number of Son(s)……. Number of Daughter(s)……. อาย บ ตร Dependent(s)’ Age(s)
สถานท เก ดของบ ตร � 1. กร งเทพฯ 2. ท อ น (ระบ ) � � Dependent(s)’ Birthplace(s) Bangkok Other (please specify) อาย ของบ ตรตอนท ย � ายมากร งเทพฯ (ถ าไม เก ดท กร งเทพฯ) � Your dependent(s)’ age(s) when s/he moved to Bangkok (if born outside of Bangkok)

164
Linguistic Information (ข อม ล ทางภาษา)
ภาษาแรก / ภาษาบ ดามารดา First language(s) ภาษาอ นๆ �
Other language(s) ภาษาท ใช ท บ าน � � ส าเน ยง Home language(s) Dialect(s) ภาษาท ใช ท ก บบ ตร � � Language(s) used with dependent(s) ส าเน ยง Dialect(s)
ขออน ญาตต ดต อค ณเพ อส มภาษณ ได หร อไม � อน ญาต ไม อน ญาต May I contact you for a follow-up interview? Yes No หมายเลขโทรศ พท
Phone number

165
Biographical Information (ข อม ลบ คคล ) - Daughters
ช อ � -นามสก ล Name-Last name อาย
Age สถานท เก ด � 1. กร งเทพฯ 2. จ งหว ด.................... ........... Birthplace Bangkok Province…………………. สถานท อาศ ยก อนย ายมาท กร งเทพฯ � � ต าบล/อ าเภอ.................................. จ งหว ด..................................... Residence prior to moving to Bangkok District………………………….. Province…………………... ระยะเวลา ………………..ป Length of time ………………..years ช นศ กษา 7 Grade
ระยะเวลาท ค ณอาศ ยอ � ย ท กร งเทพฯ � …………….ป The amount of time you have been residing in Bangkok …………….years
Linguistic Information (ข อม ล ทางภาษา)
ภาษาแรก / ภาษาบ ดามารดา First language(s) ภาษาอ นๆ �
Other language(s) ภาษาท ใช ท บ าน � � ส าเน ยง Home language(s) Dialect(s) ภาษาท ใช ท ก บบ ดามารดา / ผ ปกครอง / พ เล ยง � � � 7 Language(s) used with parent(s) ส าเน ยง Dialect(s)
ขออน ญาตต ดต อค ณเพ อส มภาษณ ได หร อไม � อน ญาต ไม อน ญาต May I contact you for a follow-up interview? Yes No หมายเลขโทรศ พท
Phone number

166
Appendix 1b: Biographical Survey for LA Participants
Biographical Information (ข อม ลบ คคล ) - Mothers
ช อ � -นามสก ล Name-Last name อาย
Age สถานภาพสมรส 1. โสด 2. สมรส 3. อ นๆ (ระบ ) � Marital Status Single Married Other (please specify)
สถานท เก ด � 1. กร งเทพ 2. จ งหว ด............. .................. Birthplace Bangkok Province………………….
สถานท อาศ ยก อนย ายมาท � � Los Angeles 1. กร งเทพ 2. จ งหว ด.................................... Residence prior to moving to L.A. Bangkok Province………………….. ระยะเวลา ………………..ป Length of time ………………..years
ระด บการศ กษา 1. ต ากว าม ธยมศ กษา � 2. ม ธยมศ กษา 3. ปวช. ปวส. Educational Level Less than High School High School Technical School 4. ปร ญญาตร 5. ปร ญญาโท 6. ปร ญญาเอก Bachelor’s Degree Master’s Degree Doctorate Degree อาช พ Occupation รายได ครอบคร วต อป Annual Household Income
ระยะเวลาท ค ณอาศ ยอย ท นคร � � Los Angeles, California …………….ป The amount of time you have been residing in Los Angeles …………….years
Dependent(s)’s Information (ข อม ลบ ตร )
จ านวนบ ตร ไม ม ม บ ตรชาย...............คน บ ตรหญ ง.............ค น Number of Dependents None Number of Son(s)……. Number of Daughter(s)……. อาย บ ตร Dependent(s)’ Age(s)
สถานท เก ดของบ ตร � 1. ประเทศไทย 2. สหร ฐอเมร กา 3. ท อ น (ระบ ) � � Dependent(s)’ Birthplace(s) Thailand U.S.A. Other (please specify) อาย ของบ ตรตอนท �ย ายมาจากประเทศไทย (ถ าเก ดท ประเทศไทย) � Your dependent(s)’ age(s) when s/he moved from Thailand (if born in Thailand)

167
Linguistic Information (ข อม ล ทางภาษา)
ภาษาแรก First language(s) ภาษาอ นๆ �
Other language(s) ภาษาท ใช ท บ าน � � ส าเน ยง Home language(s) Dialect(s) ภาษาท ใช ท ก บบ ตร � � Language(s) used with dependent(s)
ขออน ญาตต ดต อค ณเพ อส มภาษณ ได หร อไม � อน ญาต ไม อน ญาต May I contact you for a follow-up interview? Yes No หมายเลขโทรศ พท
Phone number

168
Biographical Information (ข อม ลบ คคล ) - Daughters
ช อ � -นามสก ล Name-Last name อาย
Age สถานท เก ด � 1. สหร ฐอเมร กา 2. กร งเทพ 3. จ งหว ด............................... Birthplace United States Bangkok Province………………….
สถานท อาศ ยก อนย ายมาท � � Los Angeles 1. ร ฐ................ 2. กร งเทพ 3. จ งหว ด................... Residence prior to moving to L.A. State……… Bangkok Province………… ระยะเวลา ………………..ป Length of time ………………..years ช นศ กษา 7 Grade
ระยะเวลาท ค ณอาศ ยอย ท นคร � � Los Angeles, California …………….ป The amount of time you have been residing in Los Angeles …………….years
Linguistic Information (ข อม ล ทางภาษา)
ภาษาแรก First language(s) ภาษาอ นๆ �
Other language(s) ภาษาท ใช ท บ าน � � ส าเน ยง Home language(s) Dialect(s) ภาษาท ใช ท ก บบ ดามารดา � � Language(s) used with parent(s)
ขออน ญาตต ดต อค ณเพ อส มภาษณ ได หร อไม � อน ญาต ไม อน ญาต May I contact you for a follow-up interview? Yes No หมายเลขโทรศ พท
Phone number

169
Appendix 2: Adapted General Ethnicity Questionnaire
Please use the following scale to indicate how much you agree with the following statements. Circle
your response.
1 2 3 4 5
Strongly Disagree Neutral Agree Strongly Disagree Agree
1. I was raised in way that was Thai. 1 2 3 4 5
2. When I was growing up, I was exposed to Thai culture. 1 2 3 4 5
3. Now, I am exposed to Thai culture. 1 2 3 4 5
4. Compared to how much I negatively criticize other cultures,
I criticize Thai culture less. 1 2 3 4 5
5. I am embarrassed/ashamed of Thai culture. 1 2 3 4 5
6. I am proud of Thai culture. 1 2 3 4 5
7. Thai culture has had a positive impact on my life. 1 2 3 4 5
8. I believe that my children should read, write, and speak Thai. 1 2 3 4 5
9. I have a strong belief that my children should have Thai names only. 1 2 3 4 5
10. I go to places where people are Thai. 1 2 3 4 5
11. I am familiar with Thai cultural practices and customs. 1 2 3 4 5
12. I relate to my partner or spouse in a way that is Thai. 1 2 3 4 5
13. I admire people who are Thai. 1 2 3 4 5
14. I would prefer to live in a Thai community. 1 2 3 4 5
15. I listen to Thai music. 1 2 3 4 5
16. I perform Thai dance. 1 2 3 4 5
17. I engage in Thai forms of recreation. 1 2 3 4 5
18. I celebrate Thai holidays. 1 2 3 4 5
19. At home, I eat Thai food. 1 2 3 4 5
20. At restaurants, I eat Thai food. 1 2 3 4 5
21. When I was a child, my friends were Thai. 1 2 3 4 5
22. Now, my friends are Thai. 1 2 3 4 5
23. I wish to be accepted by Thais. 1 2 3 4 5
24. The people I date are Thai. 1 2 3 4 5
25. Overall, I am Thai. 1 2 3 4 5

170
Please use the following scale to answer the following questions. Circle your response.
1 2 3 4 5
Very much Much Somewhat A little Not at all
26. How much do you speak Thai at home? 1 2 3 4 5
27. How much do you speak Thai at school? 1 2 3 4 5
28. How much do you speak Thai at work? 1 2 3 4 5
29. How much do you speak Thai at prayer? 1 2 3 4 5
30. How much do you speak Thai with friends? 1 2 3 4 5
31. How much do you view, read, or listen to Thai on TV? 1 2 3 4 5
32. How much do you view, read, or listen to Thai in film? 1 2 3 4 5
33. How much do you view, read, or listen to Thai on the radio? 1 2 3 4 5
34. How much do you view, read, or listen to Thai in literature? 1 2 3 4 5
35. How fluently do you speak Thai? 1 2 3 4 5
36. How fluently do you read Thai? 1 2 3 4 5
37. How fluently do you write Thai? 1 2 3 4 5
38. How fluently do you understand Thai? 1 2 3 4 5

171
Appendix 3: MS PowerPoint Slides Used for Wordlist Elicitation
Figure 61. Wordlist slides (from top left to bottom right): Frame sentence; 1. หา /ha:5/ ‘to look for’; 2. ผ า /pʰa:2/ ‘to
split’; 3. มา /ma:1/ ‘to come’; 4. ชาต /ʨʰa:t3/ ‘nation’; and 5. ท า /tʰa:4/ ‘to challenge, compete’

172
Figure 62. Wordlist slides: 6. จ า /ʨa:5/ ‘a nickname’; 7. ผ า /pʰa:3/ ‘cloth’; 8. อา /ʔa:1/ ‘paternal younger uncle/aunt’;
9. ม า /ma:4/ ‘horse’; 10. ถาด /tʰa:t2/ ‘tray’; and 11. ห า /ha:3/ ‘five’

173
Figure 63. Wordlist slides: 12. หมาก /ma:k2/ ‘betel’; 13. หน า /na:3/ ‘face’; 14. ค า /kʰa:4/ ‘commerce’; 15. คา /kʰa:1/
‘tall coarse grass’; 16. ชา /ʨʰa:1/ ‘tea’; and 17. (มา)ม า /ma:3/ ‘a popular brand of instant noodles’

174
Figure 64. Wordlist slides: 18. หาด /ha:t2/ ‘beach’; 19. (น อย )หน า /na:2/ ‘apple custard’; 20. ฐาน /tʰa:n5/ ‘pedestal’;
21. ช า /ʨʰa:4/ ‘slow’; 22. พา /pʰa:1/ ‘to bring along’; and 23. ผา /pʰa:5/ ‘cliff’

175
Figure 65. Wordlist slides: 24. ข า /kʰa:2/ ‘galangal’; 25. หนา /na:5/ ‘thick’; 26. นา /na:1/ ‘rice paddy’; 27. ท า /tʰa:3/
‘pier, dock, port’; 28. ฆ า /kʰa:3/ ‘to kill’; and 29. น า /na:4/ ‘maternal younger uncle/aunt’

176
Figure 66. Wordlist slide: 30. อ า /ʔa:3/ ‘to open wide’; 31. หมา /ma:5/ ‘dog’; 32. ป า /pa:4/ ‘dad (Chinese); 33. ตา
/ta:1/ ‘eye’; 34. ฉ า /ʨʰa:2/ ‘sizzling, splashing (onomatopoeia)’; and 35. ขา /kʰa:5/ ‘leg’

177
Appendix 4: Praat Script
# This script goes through .wav and .TextGrid files in a directory, # opens each Sound and TextGrid pair, calculates the pitch maximum, pitch # minimum, and syllable duration of each LABELED interval, # and saves results to a text file. # # To make other or additional analyses, you can modify this script. # Be sure to make lots of comments to remind you/others what the script does. # # This script is distributed under the GNU General Public License. # Copyright 4.7.2003 Mietta Lennes # Edited by Diana Stojanovic, Victoria Anderson, Kaori Ueki ### FIRST, change lines 3, 6, and 9 below, to indicate the directory ### where your files are kept, and where you want the results to go. ### If you're using a Mac, use slashes. form Analyze Pitch Accents from labeled segments in files comment Directory of sound files text sound_directory C:\Users\Drifter\Documents\Dissertation\Bangkok\BKKwordlist\MLA1\ sentence Sound_file_extension .wav comment Directory of TextGrid files text textGrid_directory C:\Users\Drifter\Documents\Dissertation\Bangkok\BKKwordlist\MLA1\ sentence TextGrid_file_extension .TextGrid comment Full path of the resulting text file: text resultfile C:\Users\Drifter\Documents\Dissertation\Sounds\Bangkok\MLA1_results.xls comment Which tier do you want to analyze? sentence Tier vowels comment Pitch analysis parameters positive Time_step 0.001 positive Minimum_pitch_(Hz) 125 positive Maximum_pitch_(Hz) 400 endform # Here, you make a listing of all the sound files in a directory. # The example gets file names ending with ".wav" from D:\tmp\ Create Strings as file list... list 'sound_directory$'*'sound_file_extension$' numberOfFiles = Get number of strings # Check if the result file exists: if fileReadable (resultfile$) pause The result file 'resultfile$' already exists! Do you want to overwrite it? filedelete 'resultfile$' endif

178
# Write a row with column titles to the result file: # (remember to edit this if you add or change the analyses!) titleline$ = "MLA1 results 'newline$'" fileappend "'resultfile$'" 'titleline$' resultline$ = "FileNum'tab$'soundname'tab$'SyllableNum'tab$'Time'tab$'Pitch'tab$'syllableLabel'tab$''newline$'" fileappend "'resultfile$'" 'resultline$' # Go through all the sound files, one by one: num=0 for ifile to numberOfFiles filename$ = Get string... ifile # A sound file is opened from the listing: Read from file... 'sound_directory$''filename$' num=num+1 # Starting from here, you can add everything that should be # repeated for every sound file that was opened: soundname$ = selected$ ("Sound", 1) To Pitch... time_step minimum_pitch maximum_pitch Rename... pitchFile # Open a TextGrid by the same name: gridfile$ = "'textGrid_directory$''soundname$''textGrid_file_extension$'" if fileReadable (gridfile$) Read from file... 'gridfile$' no=0 # Find the tier number that has the label given in the form: call GetTier 'tier$' tier numberOfIntervals = Get number of intervals... tier # Pass through all intervals in the selected tier: for interval to numberOfIntervals label$ = Get label of interval... tier interval if label$ <> "" no=no+1 # if the interval has an unempty label, GET ITS START AND END start = Get starting point... tier interval end = Get end point... tier interval # next divide segment into tenths stepsize=(end-start)/10 # get midpoint of next 1/10th interval midpoint=start+stepsize/2 select Pitch pitchFile # GET the PITCH mean at the syllable in question; for step to 11

179
pitch=Get value at time... midpoint Hertz Linear resultline$ = "'num''tab$''soundname$''tab$''no''tab$''midpoint:3''tab$''pitch:3''tab$''label$''newline$'" fileappend "'resultfile$'" 'resultline$' midpoint=midpoint+stepsize endfor select TextGrid 'soundname$' endif endfor # Remove the TextGrid object from the object list select TextGrid 'soundname$' Remove endif # Remove the temporary objects from the object list select Sound 'soundname$' plus Pitch pitchFile Remove select Strings list # and go on with the next sound file! endfor Remove #------------- # This procedure finds the number of a tier that has a given label. procedure GetTier name$ variable$ numberOfTiers = Get number of tiers itier = 1 repeat tier$ = Get tier name... itier itier = itier + 1 until tier$ = name$ or itier > numberOfTiers if tier$ <> name$ 'variable$' = 0 else 'variable$' = itier - 1 endif if 'variable$' = 0 exit The tier called 'name$' is missing from the file 'soundname$'! endif endproc

180
Bibliography
Abramson, A. S. The Vowels and Tones of Standard Thai: Acoustical Measurements and
Experiments. Vol. 20. Bloomington, IN: Indiana University Research Center in
Anthropology, Folklore, and Linguistics, 1962.
—. "The Tones of Central Thai: Some Perceptual Experiments." In Studies in Thai Linguistics in
Honor of William Gedney, edited by John G. Harris and J. R. Chamberlain, 1-16.
Bangkok: Central Institute of English Language, 1975.
—. "Static and Dynamic Acoustic Cues in Distinctive Tones." Language and Speech 21 (1978):
319-325.
—. "The Coarticulation of Tones: an Acoustic Study of Thai." In Studies in Tai and Mon-Khmer
Phonetics and Phonology in Honour of Eugenie J.A. Henderson, edited by Theraphan L.
Thongkum, Pranee Kallavanijaya, Vichin Panupong and Kallaya Tingsabadh, 1-9.
Bangkok: Chulalongkorn University Press, 1979.
—. "The Noncategorical Perception of Tone Categories in Thai." In Frontiers of Speech
Communication Research, by B. Lindblom and S. Ohman, 127-34. London: Academic,
1979.
—. "Tones and Voice Registers." In South and Southeast Asian Psycholinguistics, edited by
Heather Winskel and Prakash Padakannaya, 223-232. Cambridge: Cambridge University
Press, 2013.
Anivan, Sarinee. "Evolution of Bangkok Tones." In The International Symposium on Language
and Linguistics, edited by Cholticha Bamroongraks, et al., 7-21. Bangkok: Thammasat
University, 1988.
Audacity Team. "Audacity® Version 2.0.5 [Computer Program]." 2010.
Boersma, Paul, and David Weenink. "Praat: doing phonetics by computer [Computer program].
Version 5.2." January 2010.
Bradley, Cornelius B. "Graphic Analysis of the Tone-Accents of the Siamese Language (with
one plate)." Journal of the American Oriental Society 31, no. 3 (1911): 282-289.
Cadge, Gwendolyn. "Seeking the Heart: the First Generation Practices Theravada Buddism in
America." Unpublished doctoral dissertation. Princeton University, 2002.
Chalermsanyakorn, Suntaree. "Variation of (kh) in Bangkok Thai by phonetic environments and
speakers' age." Unpublished masters thesis. Chulalongkorn University, 2000.
Chamberlain, James R. "A New Look at the History and Classification of the Tai dialects." In
Studies in Tai Linguistics in Honor of William J. Gedney, edited by J. G. Harris and J. R.
181
Chamberlain, 49-60. Bangkok: Central Institute of English Language, Office of State
Universities, 1989.
Chambers, J.K. Sociolinguistic Theory: Linguistic Variation and Its Social Significance
(Language in Society). 2nd. Oxford: Blackwell Publishers, 2003.
Cohen, Robin. Global Diasporas: An Introduction. Seattle, WA: University of Washington
Press, 1997.
Commerce, United States Department of. QT-P8 Race reporting for the Asian Population by
Selected Categories: 2010, 2010 Census Summary File 1. Washington, DC: United States
Census Bureau, 2011.
Coupland, Nikolas, Hywel Bishop, and Peter Garrett. "Home Truths: Globalisation and the
Iconising of Welsh in a Welsh-American Newspaper." Journal of Multilingual and
Multicultural Development 24, no. 3 (2003): 153-177.
Dufoix, Stéphane. Diasporas. Berkeley and Los Angeles, CA: University of California Press,
2008.
Eckert, Penelope. Jocks and Burnouts: Social Identity in the High School. New York: Teachers
College Press, 1989.
—. "Language and Adolescent Peer Groups." Edited by Angie Williams. Journal of Language
and Social Psychology (International Association of Language and Social Psychology)
22, no. 1 (2003): 112-118.
—. "Variation and the Indexical Field." Journal of Sociolinguistics 12, no. 4 (2008): 453-76.
—. "Three Waves of Variation Study: The Emergence of Meaning in the Study of
Sociolinguistic Variation." Annual Review of Anthropology 41 (2012): 87-100.
Ecklund, Elaine H. "'Us' and 'Them': The Role of Religion in Mediating and Challenging the
'Model Minority' and Other Civic Boundaries." Ethnic and Racial Studies 28, no. 1
(2005): 132-150.
Erickson, Donna M. "A Physiological Analysis of the Tones of Thai." Unpublished doctoral
dissertation. University of Connecticut, 1976.
Espiritu, Yen Le. "The Intersection of Race, Ethnicity, and Class: the Multiple Identities of
Second-Generation Filipinos." In Second Generation: Ethnic Identity Among Asian
Americans (Critical Perspectives on Asian Pacific Americans Series), edited by Pyong
Gap Min, 19-52. Walnut Creek, CA: AltaMira Press, 2001.
Gandour, Jack. "The Perception of Tone." In Tone: A Linguistic Survey, edited by V.A. Fromkin,
41-76. New York: Academic Press, 1978.

182
—. "Tone Perception in Far Eastern Languages." Journal of Phonetics 11 (1983): 149-175.
Gandour, Jack, Siripong Potisuk, and Sumalee Dechongkit. "Inter- and intraspeaker variability in
fundamental frequency of Thai tones." Speech Communication 10 (1991): 355-372.
Gedney, William J. "A Checklist for Determining Tones in Tai Dialects." In Selected Papers on
Comparative Tai Studies, edited by Robert Bickner, John F. Hartmann, Thomas J. Hudak
and Patcharin Peyasanitwong, 191-206. Ann Arbor, MI: Center for South and Southeast
Asia Studies, University of Michigan, 1989.
—. Selected Papers on Comparative Tai Studies. Ann Arbor, MI: University of Michigan Press,
1989.
Georgiou, Myria. "Watching Soap Opera in the Diaspora: Cultural Proximity or Critical
Proximity?" Ethnic and Racial Studies 35, no. 5 (2011): 868-887.
Henderson, Eugenie J. A. "The Phonetics Sixty Years Ago: Gleanings from the Unpublished
Notes of Daniel Jones." In Tai Linguistics in Honor of Fang-Kuei Li, edited by Thomas
W. Gething, John G. Harris and Pranee Kullvanijaya, 162-70. Bangkok: Chulalongkorn
University, 1976.
Huang, Karen. "A Study of Neutral-Tone Syllables in Taiwan Mandarin." Unpublished doctoral
dissertation. University of Hawai‘i at Mānoa, 2012.
Hymes, Dell. Foundations in Sociolinguistics: An Ethnographic Approach. Philadelphia, PA:
University of Pennsylvania Press, 1974.
Iwasaki, Shoichi, and Preeya Ingkaphirom. "Creating Speech Register in Thai Conversation."
Language in Society 29, no. 4 (2000): 519-554.
Jaffe, Alexandra. Stance: Sociolinguistic Perspective. New York, NY: Oxford University Press,
2009.
Kaeonil, Narong. "The Thai Community in Los Angeles: an Attitudinal Study of Its Socio-
economic Structure." Unpublished doctoral dissertation. United States International
University, 1977.
Kallayanamit, Saovapak. "Intonation in Standard Thai: Contours, Registers and Boundary
Tones." Unpublished doctoral dissertation. Department of Linguistics, Georgetown
University, 2004.
Kim, Su Yeong, and Ruth K. Chao. "Heritage Language Fluency, Ethnic Identity, and School
Effort of Immigrant Chinese and Mexican Adolescents." Cultural Diversity and Ethnic
Minority Psychology 15, no. 1 (2009): 27-37.
Labov, Teresa. "Social and Language Boundaries among Adolescents." American Speech 67, no.
4 (1992): 339-366.
183
Labov, William. "The Linguistic Consequences of Being a Lame." Language in Society
(Cambridge University Press) 2, no. 1 (April 1973): 81-115.
—. The Social Stratification of English in New York City. Cambridge: Cambridge University
Press, 1966.
Li, Fang Kuei. A Handbook of Comparative Tai. Oceanic Linguistics Special Publication.
Honolulu, HI: University of Hawai'i Press, 1977.
Luksaneeyanawin, Sudaporn. "Intonation in Thai." In Intonation Systems: a System of Twenty
Languages, edited by Daniel Hirst and Albert Di Cristo, 376-94. Cambridge: Cambridge
University Press, 1998.
Martorell, Chanchanit, and Beatrice "Tippe" Morlan. Thais in Los Angeles, Images of America
Series. Charleston, NC: Arcadia Publishing, 2011.
McFarland, George Bradley. Thai-English Dictionary. Redwood City, CA: Stanford University
Press, 1944.
Mills, Jean. "Connecting Communities: Identity, Language and Diaspora." International Journal
of Bilingual Education and Bilingualism 8, no. 4 (2005): 253-274.
Morén, Bruce, and Elizabeth Zsiga. "The Lexical and Post-Lexical Phonology of Thai Tones."
Natural Language and Linguistics Theory 24, no. 1 (February 2006): 113-78.
Murkherjee, Dipika. "Role of Women in Language Maintenance and Language Shift: Focus on
the Bengali Community in Malaysia." International Journal of Sociology of Language
161 (2003): 103-120.
Padoongpatt, Tanachai Mark. "Thais that Bind: U.S. Empire, Food, and Community in Los
Angeles, 1945-2008." Unpublished doctoral dissertation. University of Southern
California, 2011.
Panroj, Piyachut. "Acoustic Characteristics of Tones in Bangkok Thai: Variation by Age
Groups." Unpublished doctoral dissertation. Chulalongkorn University, 1990.
Parreñas, Rhacel, and Lok C.D. Siu. "Introduction: Asian diasporas - new concepts, new
frameworks." In Asian Diasporas: New Formations, New Conceptions, by Rhacel
Parreñas and Lok C.D. Siu, 1-28. Stanford, CA: Stanford University Press, 2007.
Phimsawat, On-Usa. "The Syntax of Pro-drop in Thai." Unpublished doctoral dissertation.
Newcastle University, 2011.
Phinney, Jean S. "Ethnic Identity in Adolescents and Adults: Review of Research."
Psychological Bulletin 108, no. 3 (1990): 499-514.

184
Pittayaporn, Pittayawat. "Directionality of Tone Change." Presented at The 16th International
Congress of Phonetic Sciences (ICPhS2007). Saarbrücken, Germany, 2007.
Portes, Alejandro, and Min Zhou. "The New Second Generation: Segmented assimilation and its
variants." Annals of the American Academy of Political and social Sciences 530 (Nov.
1993): 74-96.
Potisuk, Siripong, Jackson T. Gandour, and Mary P. Harper. "F0 Correlates of Stress in Thai."
Linguistics of the Tibeto-Burman Area 17, no. 2 (1994): 1-2.
Purkayastha, Bandana. Negotiating Ethnicity: Second-Generation South Asian Americans
Traverse a Transational World. New Brunswick, NJ: Rutgers University Press, 2005.
Shenk, Petra Scott. "'I'm Mexican, remember?' Constructing Ethnic Identities via Authenticating
Discourse." Journal of Sociolinguistics 11, no. 2 (2007): 194-220.
Shin, Hyon B., and Rosalind Bruno. Language Use and English-Speaking Ability: 2000
(C2KBR-29). Census 2000 Brief, Washington, DC: United States Census Bureau, 2003.
Siu, Lok C.D. "The Queen of the Chinese Colony: Contesting nationalism, engendering
diaspora." In Asian Diasporas: New Formation, New Conceptions, edited by Rhacel
Parreñas and Lok C.D. Siu, 105-140. Stanford, CA: Stanford University Press, 2007.
Srisombati, Sirida. "BKK-LAX: Transuburban Mules and Low-Rent Globalization."
Unpublished doctoral dissertation. University of California, Santa Cruz, 2005.
Subhan, Subi. "Heritage Language Maintenance among Bangladeshi Immigrants in Toronto."
Unpublished doctoral dissertation. Northern Arizona University, 2007.
Tagliamonte, Sali A., and Alexandra D'Arcy. "Peaks Beyond Phonology: Adolescence,
Incrementation, and Language Change." Language 85, no. 1 (2009): 58-108.
Teeranon, Phanintra. "The change of Standard Thai high tone: an acoustic study and a perceptual
experiment." SKASE Journal of Theoretical Linguistics (online) 4, no. 3 (2007).
Thepboriruk, Kanjana. "Bangkok Thai Tones Revisited." Journal of South East Asian Linguistic
Society (JSEALS) 3, no. 1 (2010): 86-105.
Thepboriruk, Kanjana. "Translation Counts: Comparative Analysis of Thai Texts for the 2010
U.S. Census." In Southeast Asian Diaspora in the United States: Memories & Visions,
Yesterday, Today, & Tomorrow, edited by Jonathan H.X. Lee, 47-72. London and New
York: Cambridge Scholars Publishing, 2014.
Thongmark, Wannaporn. "The Linguistic Borderline between Central Thai and Southern Thai: a
Lexical Study." Unpublished masters thesis. Bangkok: Chulalongkorn University, 1983.

185
Tienmee, Wanna. "Classification by Tone Shapes and Patterns of Tonal Splits and Coalescences
(Thai Dialects of Thailand)." The Mon-Khmer Studies Journal 21 (1992): 229-236.
Tingsabadh, M.R. Kallaya. "Thai Tone Geography." In Essays in Tai Linguistics, edited by M.R.
Kallaya Tingsabadh and A. S. Abramson, 205-228. Bangkok: Chulalongkorn University
Press, 2001.
Tsai, J. L., Y.-W. Ying, and P. A. Lee. "The Meaning of 'Being Chinese' and 'Being American':
Variation Among Chinese American Young Adults." Journal of Cross-Cultural
Psychology 31 (2000): 302-331.
United States Census Bureau. C2PO 2010 Census Integrated Communications Research
Memoranda Series, 15. Washington, DC: United States Census Bureau, 2009.
Useem, John, Ruth Useem, and John Donoghue. "Men in the Middle of the Third Culture: the
Roles of American and Non-Western People in Cross-Cultural Administration." Human
Organization 22, no. 3 (1963): 169-179.
Wayland, Ratree. "Non-Native Production of Thai: Acoustic Measurements and Accentedness
Ratings." Applied Linguistics 18, no. 3 (1997): 345-73.
Wichiarajote, W., and Marilyn Wilkins. Role Differentiation in Thai Social Structure in Terms of
a Semantic Analysis of Thai Pronouns and Roles. Technical Report No. 57, Department
of Psychology, University of Illinois-Urbana, Urbana: Institute of Communications
Research, 1968.
Zsiga, Elizabeth, and Rattima Nitisaroj. "Tone Features, Tone Perception, and Peak Alignment in
Thai." Language and Speech 50, no. 3 (2007): 343-83.