th May 2016 - Bourse€¦ · 12th May 2016 TalkTalk Telecom Group PLC Preliminary results for the...
29
12 th May 2016 TalkTalk Telecom Group PLC Preliminary results for the 12 months to 31 March 2016 (FY16) Strong recovery in Q4: net adds flat, +148k RGUs, lowest ever churn at 1.3% FY EBITDA * of £260m in line with guidance; material step up in H2 margin to 18.4% Reiterating FY17 guidance * : modest revenue growth and £320m-£360m EBITDA * Net debt/EBITDA * reduced to 2.6x (H1: 2.8x); expected to fall towards target of 2x by Y/E FY17 Dividend per share up 15% to 15.87p (FY15: 13.80p), in line with commitment FY17 dividend expected to be at least in line with FY16 and covered by free cashflow *Headline financials FY16 Financial Highlights Headline total revenue +2.4% to £1,838m (FY15: £1,795m) On-net revenue +5.0% to £1,399m (FY15: £1,333m); ARPU +5.8% Corporate revenue +2.4% to £384m (FY15: £375m); Data revenues +23.7% Headline EBITDA +6.1% to £260m (FY15: £245m); Headline EPS up 2.4% to 8.4p (FY15: 8.2p) Statutory Profit Before Tax £14m (FY15: £32m) - after exceptional items of £83m (FY15: £46m) Statutory EPS 0.2p (FY15: 7.8p) Q4 Operating Highlights On-net net adds flat; RGU growth +148k Mobile +90k (14.9% share of new SIM market); fibre +72k; TV -14k Lowest ever quarterly churn at 1.3% On-Net revenue flat year on year; ARPU +3.9% Corporate revenue -2.9% year on year against strong comparative; Data revenues +40.0% Dido Harding, Chief Executive of TalkTalk commented: The business bounced back strongly in the final quarter following the cyber attack in October. We recorded our lowest ever churn and stabilised the broadband base, testimony to the speed with which customer sentiment towards TalkTalk has recovered, the success of our greater focus on existing customers, and the growing benefits of our simplification programme. We reported full year results in line with our guidance and have declared a 15% higher dividend for the year. TalkTalk is well positioned to build upon our already strong credentials as the UK’s leading value for money quad-play and B2B operator. There has never been a clearer space for a trusted value champion and our learnings from and experience since the cyber attack have helped to focus our plans for the year ahead. We see strong opportunities for growth across all our products, both for consumers and for businesses, against the backdrop of an increasingly supportive regulatory environment. As a result we are reiterating our financial guidance for FY17 of £320m-£360m EBITDA.
-
Upload
truongthien -
Category
Documents
-
view
218 -
download
4
Transcript of th May 2016 - Bourse€¦ · 12th May 2016 TalkTalk Telecom Group PLC Preliminary results for the...

12th May 2016
TalkTalk Telecom Group PLC
Preliminary results for the 12 months to 31 March 2016 (FY16)
Strong recovery in Q4: net adds flat, +148k RGUs, lowest ever churn at 1.3%
FY EBITDA* of £260m in line with guidance; material step up in H2 margin to 18.4%
Reiterating FY17 guidance*: modest revenue growth and £320m-£360m EBITDA*
Net debt/EBITDA* reduced to 2.6x (H1: 2.8x); expected to fall towards target of 2x by Y/E FY17
Dividend per share up 15% to 15.87p (FY15: 13.80p), in line with commitment
FY17 dividend expected to be at least in line with FY16 and covered by free cashflow *Headline financials
FY16 Financial Highlights
Headline total revenue +2.4% to £1,838m (FY15: £1,795m)
On-net revenue +5.0% to £1,399m (FY15: £1,333m); ARPU +5.8%
Corporate revenue +2.4% to £384m (FY15: £375m); Data revenues +23.7%
Headline EBITDA +6.1% to £260m (FY15: £245m); Headline EPS up 2.4% to 8.4p (FY15: 8.2p)
Statutory Profit Before Tax £14m (FY15: £32m) - after exceptional items of £83m (FY15: £46m)
Statutory EPS 0.2p (FY15: 7.8p)
Q4 Operating Highlights
On-net net adds flat; RGU growth +148k
Mobile +90k (14.9% share of new SIM market); fibre +72k; TV -14k
Lowest ever quarterly churn at 1.3%
On-Net revenue flat year on year; ARPU +3.9%
Corporate revenue -2.9% year on year against strong comparative; Data revenues +40.0%
Dido Harding, Chief Executive of TalkTalk commented:
The business bounced back strongly in the final quarter following the cyber attack in October. We recorded our lowest ever churn and stabilised the broadband base, testimony to the speed with which customer sentiment towards TalkTalk has recovered, the success of our greater focus on existing customers, and the growing benefits of our simplification programme. We reported full year results in line with our guidance and have declared a 15% higher dividend for the year.
TalkTalk is well positioned to build upon our already strong credentials as the UK’s leading value for money quad-play and B2B operator. There has never been a clearer space for a trusted value champion and our learnings from and experience since the cyber attack have helped to focus our plans for the year ahead. We see strong opportunities for growth across all our products, both for consumers and for businesses, against the backdrop of an increasingly supportive regulatory environment. As a result we are reiterating our financial guidance for FY17 of £320m-£360m EBITDA.

Presentation for analysts and investors
8.30am for 9.00am start
Andaz Hotel, 40 Liverpool Street, EC2M 7QN
Call and webcast details UK & International: +44 (0) 20 3003 2666
http://cache.merchantcantos.com/webcast/webcaster/4000/7464/16533/60197/Lobby/default.htm
Replay (available for 7 days) UK & International +44 (0) 20 8196 1998 PIN code 5704086#
Enquiries Analysts / Investors: Mal Patel +44 (0) 20 3417 1037/07725 448277 Media: Isobel Bradshaw +44 (0) 20 3417 1027/07584 708351

Financials
Headline Profit & Loss 2016 2015
Revenue (£m) 1,838 1,795
EBITDA (1) (£m) 260 245
EBITDA margin 14.1% 13.6%
EBIT(2) (£m) 131 117
Profit after tax(1)(£m) 79 76
EPS(1)(p) 8.4 8.2
Dividend per share (p) 15.87 13.80
(1) Excludes net exceptional items and amortisation of acquisition intangibles
(2) Excludes net exceptional items
Headline Cash flow (£m) 2016 2015
Headline EBITDA 260 245
Working capital 10 (19)
Capital expenditure (166) (112)
Operating free cashflow 104 114
Interest and Tax (22) (24)
Free cash flow 82 90
Exceptional items (88) (30)
Acquisitions and disposals (12) (38)
Share sale 63 2
Dividends (135) (116)
Net Debt (679) (589)
Statutory Profit & Loss 2016 2015
EBITDA (£m) 177 199
Operating profit (£m) 38 54
Profit before tax (£m) 14 32
Profit after tax (£m) 2 72
Statutory EPS (p) 0.2 7.8

Q4 TRADING
The business recovered strongly in Q4 as customer sentiment following the cyber attack in Q3 improved quickly:
- Our open and honest communications were recognised by customers as designed to help them protect themselves from potential fraud and the vast majority of customers believe we looked after them as a result
- Our decision to focus promotional investment on existing customers enabled us to retain customers at a higher rate than before the attack; and
- The unconditional free upgrade offer that we made available to all customers through December drove high levels of engagement with 489k customers choosing to take an upgrade.
These actions have driven higher customer engagement, with trust in the brand and brand consideration both higher than they were before the attack.
Churn improved significantly during the quarter and at 1.3%, was at its lowest level in our history. A key indicator of churn, unsolicited cease requests, fell to its lowest ever level towards the end of the quarter. As a result we held the on-net base flat in Q4 after a 101k decline in Q3, illustrating the speed with which customer sentiment towards TalkTalk has recovered, the success of our greater focus on existing customers and the benefits of the Making TalkTalk Simpler (“MTTS”) program.
Q4 also showed strong progress in Revenue Generating Units (“RGUs”) with growth of 148k and RGU/Customer up by 9.0% year on year to 1.70. Mobile and Fibre net adds were particularly strong: the mobile base grew by 90k with TalkTalk achieving the third highest share of the new SIM only market in the quarter (14.9%) including the successful launch of a mobile proposition in TalkTalk Business, and the fibre base grew by 72k. As we focused trading activity on growing mobile and fibre, the TV base declined by 14k. The growth in RGUs and the benefit of our autumn pricing activity, offset by promotional initiatives and mix, delivered on-net ARPU growth of 3.9%, which on a smaller customer base, resulted in on-net revenues stable year on year at £351m.
TalkTalk Business also ended the year strongly, with continuing strength in Data revenues (+40% and 2.3k new connections). This growth was offset by flat Carrier trading and the established decline in legacy Voice revenues (-30.2%). As a result, against a strong comparative (Q4 FY15: +14.3%), Corporate revenues as a whole fell by 2.9% year on year.
Off-net revenues, which comprise less than 3% of total group revenue (Q4FY15: 4.2%), fell by 25% year on year, reflecting the final impact of the disposal of our off-net base at the end of FY15. The combination of stable on-net revenues, a modest fall in Corporate revenue and the decline in off-net revenues drove a decline in total group revenue of 1.7% to £467m.
FY17 GUIDANCE
Revenue and EBITDA We expect FY17 revenues to grow modestly, driven by a broadly stable broadband base and continued growth in TalkTalk Business; and Headline EBITDA of £320m-£360m. Consistent with the trends seen in Q4, we expect to see headline revenue decline in H1 2017, reflecting the smaller on net base, and return to growth in H2 as comparatives ease.
In line with this, we expect EBITDA to reflect an H2 bias, with an H1:H2 weighting of broadly one third:two thirds
Net debt We expect Net debt/EBITDA to fall towards our target leverage of 2x by the end of FY17. With capex planned at 6%-7% of revenues and a material reduction in cash exceptional costs we expect year end net debt to be broadly similar to that at the end of FY16
Dividend We expect the FY17 dividend to be at least in line with that of FY16 and covered by free cashflow

FY16 BUSINESS REVIEW
We made considerable progress during the year towards our strategic ambition of becoming the UK’s leading value for money quad-play operator and delivered FY revenue growth of 2.4% and Headline EBITDA in line with our revised guidance of £260m.
The cyber attack in Q3 drove elevated churn for a short period, an extended period through which we were unable to trade effectively, and led to delays in implementing a number of initiatives in the Making TalkTalk Simpler Programme. However, as expected, H2 still showed a strong step up in profitability with Headline EBITDA margin of 18.4% (H1: 9.9%), helped by the benefits of Making TalkTalk Simpler coming through strongly, and lower SAC & marketing costs.
The actions we took following the cyber attack, to focus on our existing customers and to restore normality have more than mitigated any lasting impact on the business. This focus, together with the customer experience benefits of MTTS, helped us to stabilise the broadband base in Q4, drive strong growth in RGUs and deliver the lowest ever churn in our history (1.3%). Equally the learnings from our detailed review of systems and processes following the cyber attack have helped us to prioritise elements of our trading approach and strategy, which will help us deliver material improvements in profitability in FY17.
The Board has recommended a Final Dividend of 10.58p taking the full year dividend to 15.87p, 15% higher year on year, and in line with our commitment.
BROADBAND - base stabilised and significant improvement in churn in Q4 We ended FY16 with an on-net base of 3,996k customers taking our core phone and broadband service (FY15: 4,177k).
The change in the base reflects two principal effects:
- an adjustment arising from a change in credit terms from 180 days to the industry standard of 90 days, which resulted in 72k non-paying customers being disconnected during H1; and
- a 95k impact in Q3 resulting from the cyber attack, reflecting churn in the immediate aftermath of the attack and much lower additions activity as it took longer than expected to return the business to normal sales effectiveness
The balance of the fall of 14k reflects underlying activity of -8k in H1 and -6k in Q3, with Q4 net adds flat. We also completed the migration of Tesco broadband customers, and saw continuing growth in our profitable B2B wholesale broadband base to 830k (FY15: 737k).
While average churn across the year was 1.6% (including the cyber related churn), we saw a significant improvement in Q4 to 1.3%.
MOBILE - Fast growing quadplay penetration; 13.5% share of SIM-only market in the year
The mobile base grew strongly in FY16 with 235k net adds taking the total base to 699k customers, 19% of the base vs 12% a year ago. We saw strong take-up of bundled SIMs by our Plus TV customers, and further strong growth across our other value for money SIMs including over the summer, our Unlimited SIM. We also launched, in TalkTalk Business, our new O2 mobile proposition for business customers. In aggregate these value for money propositions helped drive our share of the new acquisitions SIM only market to 13.5% in the year (FY15: 10.3%).
We have a defined three stage plan to build out our mobile business which will see further expansion of the base, growing revenues and profitability.
Phase 1 – FY16/17 We began the build of our new billing system and other associated functionalities such as CRM and network migration development during H1. On completion of the new systems we will be able to launch 4G and national roaming services on our new MVNO agreement with O2 and extend our full mobile proposition to business customers. The new system suite will allow us to manage our own number range with TalkTalk SIMs, offer mobile sales and service capability through multiple

channels, and provide increased self service capability for customers. We will complete billing and CRM migration in H2FY17, and begin customer migration from Vodafone to Telefonica. This process will involve a SIM swap and we will take a careful approach to the planning of this transfer in order to minimise customer disruption.
The economics of our mobile proposition are expected to improve materially as we move customers from Vodafone to O2, with the full benefit being seen in FY18.
Phase 2 – FY17/18 Our MVNO agreement with O2 also provides an opportunity to move to a deeper integration with O2’s radio access network through the building of a “thick” core system. This will allow us to control much more of our customers’ mobile experience including real time management of traffic, alignment with our converged (fixed and mobile) infrastructure for creating truly integrated quad-play propositions, and work with other network providers e.g. for national roaming. We have begun to develop our plans for the thick core, including some early testing of the necessary hardware equipment. We shall continue detailed planning and testing through FY17 with a view towards full implementation in early FY18.
Moving our customers onto the thick core will further improve the economics of our mobile business.
Phase 3 – FY18+ Our thick core will also enable us to roll out femto cells across our fixed line base, thus creating an inside-out fixed-mobile network that will leverage our Guardband spectrum. Ofcom is currently consulting the industry on our request to vary the Guardband licence for 4G usage and we expect a resolution in the summer. Femto cells on 4G spectrum will vastly improve customers’ in-home mobile experience, especially in areas with poor radio network coverage, and will allow us to offload mobile traffic onto our fixed line network, thus delivering savings on MVNO costs. We began laboratory testing of femto cells during FY16, and have seen encouraging results on off-load capability and service quality. We expect roll-out to commence once the thick core is fully functional.
Over time there will be further opportunities to drive down data costs across this inside-out network, potentially by building a larger small-cell network combined with suitable high frequency spectrum.
FIBRE - Continuing strong growth with 225k net adds in year and improved customer experience
We added 225k net new fibre customers during the year, taking the base to 704k, 19% of the broadband base vs 13% a year ago. Demand has been helped by customers’ growing recognition of the benefits of higher speeds and bandwidths, and the availability of our self-install option which is used by over 90% of customers. Fibre customers are amongst our most satisfied customers with strong NPS scores and significantly lower propensity to call, which is driving lower churn compared to broadband customers.
We have continued to improve our customers’ experience of fibre by investing in our backhaul network and ended the year with significant improvements in network performance. Over the next two years we will invest further in enhancing the capability of our next generation access and edge networks, which will drive significant further improvements in customer satisfaction and reduce our operating costs.
We are making significant progress meeting the key operating metrics (cost per home passed, customer experience and penetration) in Ultra Fibre Optic (UFO), our fibre to the premise (FTTP) trial in York. We completed the build of the first 8,000 homes at a cost of under £500 per home and are now testing penetration. Customer trials ended at the end of March, when we launched the proposition commercially. Over 90% of the trial participants have chosen to retain the service and pay £21.70 per month which is particularly notable, as the vast majority were not existing TalkTalk customers. After two months TalkTalk UFO penetration stands at 7% of homes passed and

continues to accelerate. Feedback from the first customers has been extremely positive and we are polling customers in other York neigbourhoods to establish interest for the next phase of building.
Based on these experiences, we remain confident about the potential to roll out FTTP at scale. At a build cost of under £500 per premise passed and 30%-40% take-up, we believe it will be possible to build a c10million household network across the UK. We see Ultra Fibre Optic as an opportunity to build a mass market, value for money proposition that delivers value for consumers and shareholders through keen pricing and rapid scaling. We expect to review progress and decide on the next phase of development later in the year.
TV - Over one-third of base taking TV; growing engagement with product
The TV base declined modestly during the year by 25k to 1,389k as we focused on deepening the engagement with our existing TV customers. With over a third of our base now taking TV the product has been a remarkable success story for us in driving triple play growth with 1.4m customers (38% of our phone and broadband base) from launch 4 years ago. Customers genuinely value the YouView experience that integrates free, Pay, OTT, and premium channels, and we see benefits to engagement, NPS, and churn. In addition we have seen growing purchases of transactional video as customers become more comfortable and knowledgeable with the range of content on offer, with on-demand usage growing 20% year on year.
We are now evolving the proposition for the future, based on what our value conscious customers want, which is access to the widest range of content, on flexible terms and on multiple devices. Amongst other developments, TalkTalk TV customers can now sign up and pay for Netflix on their TalkTalk bill, and from June 2016, will be able to subscribe to BT Sport channels in addition to our existing portfolio of all Sky Sports channels.
In April we launched the TalkTalk TV store, which enables all of our customers, including broadband only customers, to access pay TV content on multiple devices. This is an important development on our TV journey, using the technology we acquired from blinkbox, as a set top box will no longer be the only way to gain access to a broad range of TalkTalk TV content.
TALKTALK BUSINESS – Delivering high margin growth through data
TalkTalk Business revenues account for over 30% of the Group and grew by over 5% during the year. It is a significant, profitable and fast growing part of the group and our ambition is to double its size over the medium term driven by continuing growth in data products, next generation voice services and broadband customer base growth delivered via our direct and partner (wholesale) channels.
The on-net wholesale base (TTB is one of only two national wholesalers of broadband and fibre to the cabinet), comprising the retail customers of businesses such as the Post Office and Utility Warehouse, was not directly affected by the cyber attack and therefore grew year on year, as did TTB’s Direct channel on-net base.
Corporate revenues within TTB were up 2.4% against a strong prior year comparative (FY15: +10.3%), with compound annual growth since FY14 of over 6.0%.
Data revenues once again grew strongly (+23.7%), with over 9,000 new high speed data lines connected and a strong pipeline of orders at the year end. High Speed data now accounts for 31% of our corporate revenue. Business demand for high speed data is growing fast and TalkTalk Business is well placed to provide value for money high speed connectivity that is margin accretive. The main constraint to this growth continues to be BT Openreach’s inability to provision orders on time.
Carrier revenues grew strongly in H1 (+34.1%) but as expected, were flat year on year in H2, with full year growth at 13.3%, and are expected to remain broadly stable in FY17. Voice revenues continued to decline (-16.2%) in line with market trends. During the year we acquired and integrated tIPicall, a leader in Next Generation Voice services. Customer reception to the new products launched on the back of this acquisition has been very positive, and we expect the rate of decline in total voice to moderate as this business grows.
MAKING TALKTALK SIMPLER
Making TalkTalk Simpler (“MTTS”) is our wide ranging transformation programme that is delivering material improvements to our customers’ experience, driving operating cost savings, and reducing subscriber acquisition costs (“SAC”) through lower churn and costs per add (“CPA”).
We made significant progress in FY16, achieving £21m of cost savings in the year through, amongst other things:
- better network performance from improved traffic management and the deployment of faster backhaul circuits;
- fewer missed engineer appointments and improved resolution of problem orders through case management;
- the implementation of live chat and voice biometrics; and
- improved fault diagnosis and resolution, reducing engineering cost and unnecessary customer contacts.
The cyber attack in Q3 highlighted the need to put our existing customers first and to accelerate the development of even more secure, simplified and resilient processes. MTTS is at the heart of this process and whilst we had to reprioritise some work-streams as a result of redirecting online resources to addressing the cyber attack, we exited the year on track to deliver £35m-£40m incremental benefits in FY17. In total therefore, we expect cumulative benefits from the start of the programme in FY13, to reach c£90m by the end of FY17. With considerable further benefits to come from the programme, savings beyond FY17 are expected to annualise at a substantially higher level.
TALKTALK NETWORK – Leveraging our capability and enhancing customer’s experience
Our network gives us a significant competitive advantage as we look towards building upon our value for money positioning. At the heart of our network, is the unbundling equipment (digital subscriber line access multiplexers, multi-service access nodes and Ethernet switches) that we have installed in over 3,000 BT exchanges, giving us c96% coverage of the UK – the largest such deployment in the UK and a significant barrier to entry. This allows us to take control of the copper line that connects customer premises to the exchange, at a regulated cost that has fallen over time.
The exchanges are connected via collector nodes that aggregate all of the 3,000+ exchanges and connect these to the core network. The equipment in these locations (a mixture of BT Openreach exchanges and our own data centres) is owned by TalkTalk. The nodes are connected by 10 Gigabits per second circuits to the core network for delivery of voice and data services. These circuits are either leased bandwidth or leased dark fibre, both of which are well-served markets.
Our dark fibre core optical network is the fundamental underlay of the network - a high-speed, high-capacity all-IP national backbone that enables efficient and flexible routing of voice and data traffic. The size and all-IP nature of this network allow it to be scaled very efficiently for growing usage, enabling it to support growing customer demand for high speeds and greater data consumption.
We have a defined programme of investment in the network to improve capacity and efficiency in line with the expected growth in demand for high speeds and data consumption. In FY16 we completed the first phase of our backhaul upgrade to deliver significant improvements in network performance for fibre customers. Over the next two years we will invest further in enhancing the capability of our next generation access and edge networks, which will reduce our costs to serve for all our customers, and drive significant further improvements in customer satisfaction. In addition we have designed the investments in the network to future proof 3 priority areas; the growth in fibre from FTTC to FTTP, the best Ethernet business network of choice, and mobile expansion. We expect these investments to fall within our capex envelope of 6%-7% of revenues.
Overall, as we continue to reduce the marginal cost of capacity of our network, we will be able to sustain a cost advantage that we can translate into compelling value for money propositions.

Finance Review
Headline financial information (£m)
2016 2015
On-net
1,399 1,333
Off-net
55 87
Corporate
384 375
Revenue
1,838 1,795
Gross Margin
993 980
%
54.0% 54.6%
Operating expenses excluding amortisation and depreciation
(473) (426)
SAC and Marketing
(260) (309)
Headline EBITDA
260 245
%
14.1% 13.6%
Exceptional items
(83) (46)
Statutory EBITDA
177 199
Depreciation and amortisation
(121) (120)
Non-operating depreciation and amortisation
(10) (17)
Share of JVs
(8) (8)
Operating profit
38 54
Finance costs
(24) (22)
Profit before tax
14 32
Tax
(12) 40
Profit after tax 2 72
Overview We delivered FY16 Headline financial results in line with the guidance we gave at the time of the H1 results. FY revenue grew by 2.4% to £1,838m (FY15: £1,795) and Headline EBITDA by 6.1% to £260m (FY15: £245m). The Board has recommended a Final dividend of 10.6p taking the total dividend for the year to 15.87p (FY15: 13.80p), in line with our commitment to grow the dividend by 15%. Net debt/EBITDA of 2.6x (FY15: 2.4x) was in line with the guidance set at H1.
H1 saw strong revenue growth (4.7%) but Headline EBITDA was impacted by increased operating costs related to our transformation projects, innovation and network investment. In H2 we delivered revenue growth of 0.2%, reflecting the impact on the customer base of the cyber attack in Q3, but strong progress in margins (H2 EBITDA margin 18.4%) helped by the benefits of Making TalkTalk Simpler coming through (£15m in addition to the £6m delivered in H1), and a significant reduction in SAC. In addition operating metrics recovered strongly in Q4 with the customer base returning to stability, strong RGU growth and material churn reduction (1.3%, the lowest ever churn in our history). Exceptional items amounted to £83m for the year, of which £42m were related to the cyber attack. As a result of the strong improvement in profitability in H2, Net debt/EBITDA at the year end of 2.6x, was, as guided, lower than the 2.8x at the end of H1.
The business has taken a number of key strategic decisions in the aftermath of the cyber attack which in addition to driving the recovery in Q4, have set us up for a robust performance in FY17, with further EBITDA growth expected.

Revenue Total revenues grew by +2.4% to £1,838m (FY15: £1,795m), with H1 growth of 4.7% and H2 growth of 0.2%. H2 revenues were directly impacted by the cyber attack which resulted in a spike in churn and an extended period over which we were unable to trade from our online channels. The impact on Q4 revenues was more pronounced than in Q3 as we entered the quarter with a smaller customer base and it took longer than we had originally anticipated to fully restore our online channels.
On-Net revenues grew by 5.0% to £1,399m (FY15: £1,333m). ARPU grew by +5.8% year on year driven by 3.9% growth in RGUs and pricing, offset by lower usage, mix and promotional activity.
Corporate revenues grew by 2.4% to £384m (FY15: £375m) against a strong prior year comparative (FY15: +10.3%). Data revenues continued to grow strongly (+23.7% year on year), driven by 9,000 new connections to our Ethernet and EFM base. Carrier revenues grew by 13.3% and as expected, moderated significantly in H2. The growth in Data revenues and Carrier helped offset the ongoing decline in legacy Voice revenues (-16.2%).
Off-Net revenues, which comprise less than 3% of total revenues (FY15: 4.8%), declined by 36.8% to £55m (FY15:£87m), impacted principally by the disposal of our consumer off-net base at the beginning of year.
Gross Profit Gross profit increased by 1.3% to £993m (FY15: £980m) with the gross margin rate falling from 54.6% to 54.0%. As expected we saw an improvement in the gross margin from H1 (53.4%) to H2 (54.5%), as some of the timing differences related to regular procurement benefits that depressed the H1 gross margin, reversed in H2. The movement in gross margin during the year reflects a number of effects: pricing activity and high margin data revenue growth, together with the benefits of disconnecting non-pay customers (c£5m) and MTTS (c£2m), were offset by the impact of higher than expected mobile data usage from our Unlimited SIM promotion in H1, continued reduction in voice revenues, and adverse mix.
Operating expenses Operating expenses were up by £47m over the prior year to £473m. The increase reflects a combination of our ongoing investment in innovation programmes (mobile, fibre to the premise and blinkbox: £13m); infrastructure, network and IT (£15m); and transformation costs of £31m (including MTTS, property related costs; and management overheads) offset by £12m of benefits from MTTS. Although year on year costs were up, we saw a significant reduction in opex from H1 to H2, of £17m, with transformation costs lower than H1 and a step up in MTTS benefits.
SAC and Marketing SAC & Marketing costs reduced by 15.9% in the year to £260m with H2 expenditure significantly lower than H1. The key drivers of the overall reduction in SAC were: reduced volumes in Broadband and TV; lower costs per add in fibre y-o-y from the significant step-up in self-installation; a less SAC intensive mix in mobile compared to the prior year; and a much improved distribution channel mix. During H2, our focus on existing customers and the benefits of MTTS helped to reduce churn and enabled us to maintain a stable broadband base with fewer gross additions. This, together with the impact of more efficient distribution channels on costs per add, delivered a £31m reduction in SAC. In addition we refocused marketing spend (£6m reduction) and saw a one-off reduction of £8m as a result of the disruption caused by the cyber attack.
EBITDA Headline EBITDA increased by 6.1% to £260m (FY15: £245m) reflecting an EBITDA margin of 14.1% (FY15: 13.6%), driven by revenue growth, MTTS benefits and SAC efficiencies. The H2 margin of 18.4% was a significant improvement over H1 (9.9%), reflecting the H2 weighted delivery of MTTS benefits and SAC reduction.

Depreciation and amortisation Depreciation and amortisation expense was broadly flat year on year at £121m (FY15: £120m).
Finance costs Net finance costs of £24m (FY15: £22m) comprised the blended interest rate of 3.07% (FY15: 3%) on higher levels of average net debt during the year. Finance costs in FY17 are expected to be in the range £26m - £28m.
Amortisation of acquisition intangibles The amortisation of acquisition intangibles amounted to £10m (FY15: £12m) relating to the acquisitions of the Virgin Media and Tesco broadband bases and Blinkbox in FY15. In the prior year, amortisation of acquisition intangibles included accelerated amortisation of £6m in relation to legacy software.
Exceptional items
The net exceptional charge in the year amounted to £83m (FY15: £46m) and comprises the costs incurred during Q3 FY16 in relation to the cyber attack, and one off costs related to delivering the Making TalkTalk Simpler programme. The one-off exceptional costs associated with the cyber attack were £42m (FY15: Nil) which includes the direct incident response costs and customer management costs including additional call centre agents, communication and marketing costs incurred during October and November; the costs of restoring our online capability with enhanced security features; and the increased retention costs including the cost of providing free upgrades to those customers who chose to take one. Making TalkTalk Simpler continued to gain momentum during the year delivering a further £21m of benefits and we expect to deliver a further £35m-£40m of savings in FY17. £41m of exceptional costs were incurred across these programmes as a result of improving customer experience systems and processes and implementing changes to the Group’s organisational structure, exiting office locations and preparing for the move in April 2017 from our sites in Irlam and Warrington to a new single location at the Soapworks, Salford.
Cash exceptional costs of £88m (FY15: £30m), include a number of timing differences between the incurrence of the provision and the resulting cash outflow, most notably the timing of broadband base migrations which were provided for in FY15 but completed during FY16 and the provision in FY16 for cyber attack related technology costs and surplus property costs which will be incurred in FY17 and beyond. Cash exceptional costs for FY17 are expected to be £30m-£35m
Profit before tax Profit before tax decreased 56% year on year to £14m (FY15: £32m), reflecting the increase in exceptional costs offset by the increase in EBITDA.
Taxation The effective headline rate in the year was 26% (FY15: 20%), representing a tax charge of £28m (FY15: £19m). The increased rate is due to the impact on the deferred tax asset of a reduction in the UK statutory corporation tax rate from 20% to 17% over the period from 1 April 2017 to 1 April 2020. In addition, a £2m tax charge has been recognised in exceptionals reflecting the impact of the same rate change on the deferred tax asset recognised through exceptional items in the prior year.

Earnings per share
2016 2015
Headline earnings (£m)
79 76
Basic EPS
8.4p 8.2p
Diluted EPS
8.3p 8.1p
Statutory earnings (£m)
2 72
Basic EPS
0.2p 7.8p
Diluted EPS 0.2p 7.7p
EPS on a Headline basis is provided alongside our Statutory measures to allow easier comparison year on year, due to the impact of exceptional items. A full reconciliation to Statutory results can be found in Note 9 to the financial statements.
Headline EPS increased to 8.4p (FY15: 8.2p) driven by the increase in EBITDA, with the profile during the year showing significant improvement from 1.2p in H1 to 8.4p full year. The basic number of shares increased to 946m (FY15: 922m), driven by the ESOT share sale in H1. Statutory EPS decreased to 0.2p (FY15: 7.8p).
Cashflow and net debt
2016 2015
Headline EBITDA
260 245
Working capital
10 (19)
Capex
(166) (112)
Operating free cash flow
104 114
Interest and tax (22) (24)
Free cash flow 82 90
Exceptional items
(88) (30)
Acquisitions and disposals
(12) (38)
Dividends paid
(135) (116)
Share Sale
63 2
Net cashflow
(90) (92)
Opening net debt
(589) (497)
Closing net debt (679) (589)
Working capital
The working capital inflow of £10m in the year (FY15: £19m outflow) reflected a receipt in respect of the historic termination charge settlements with mobile network operators.
Capital expenditure As expected, capex of £166m (9% of revenues) in FY16 was higher than our long run average of 6%-7% (FY15: 6.2%) of revenues as a result of the phasing of our investment in innovation projects and some pulling forward of MTTS investment as a result of the cyber attack. This expenditure was focused on meeting the forecast demands for our network (eg higher capacity backhaul circuits); MTTS programmes; and innovation (eg hardware equipment for the Ultra Fibre Optic trial in York and the build of our new mobile billing system and associated functionalities).
We expect capex on our network, expenditure related to MTTS programmes and any further spend on completing the build of mobile billing systems to fall back to 6-7% of revenues in FY17.

Acquisitions and disposals Acquisition expenditure in the year of £12m (FY15: £38m) mainly represents £8m in respect of the YouView joint venture (FY15: £8m), £1m in respect of the York FTTP joint venture (FY15: £3m) and £5m in respect of the initial consideration for tiPicall, offset by £2m received in relation to the disposal of the off-net broadband customer base. During the prior year, the Group paid £29m in respect of the initial consideration for the Virgin Media off-net broadband base and the Tesco broadband base, and blinkbox.
Dividends Dividends of £135m paid in the year (FY15: £116m) comprised the final dividend for FY15 9.20p and the interim dividend for FY16 of 5.29p.
The Board has declared a final dividend of 10.58p which will be paid on 3rd August 2016, subject to approval at the AGM on 20th July 2016 for shareholders on the register 8th July 2016 (ex-dividend 7th July 2016). The total declared dividend for the year was 15.87p, a year on year increase of 15%, with dividend cover improving to 0.53x (FY15: 0.59x).
Interest and Tax Interest paid in the year was £22m. No cash tax was paid in the year.
Sale of own shares The £61m inflow from the employee share ownership trust (ESOT) reflects a decision taken by the trustees of the ESOT to reassess the number of shares required to satisfy the ESOT’s obligations under the Group’s share award plans. The ESOT continues to hold 9.3m shares (0.97% of total share capital). The remaining £2m relates to the in-year settlement of group share schemes.
Funding
The group is financed through a combination of bank facilities and US private placement notes, retained profits and equity. Committed facilities at the year end totalled £944m (FY15: £819m) and further detail is given in the notes to the accounts. At 31 March 2016 £689m (FY15: £599m) had been drawn down under these facilities leaving £255m of undrawn facilities. Covenants are substantially the same across all funding facilities and the group was in compliance with its covenants throughout the current and prior year.
Net debt and capital structure Net debt in the year increased by £90m to £679m (FY15: £589m) driven by an increase in the dividend, exceptional costs and increased capex spend, offset by £61m proceeds from the sale of surplus shares in the ESOT. As a result the net debt to EBITDA ratio increased modestly from 2.4x at the end of FY15 to 2.6x at the end of FY16. The Board regularly reviews the capital structure of the Group and we expect leverage to fall towards our target of 2x by the end of FY17.
Going Concern
The Directors have acknowledged the guidance ‘Going Concern and Liquidity Risk: Guidance for Directors of UK Companies 2009’, published by the FRC in October 2009.
Our business activities, together with the factors likely to affect our future development, performance and position are set out in the Business Review. Our financial position, cash and borrowing facilities are described within this Finance review.
The breadth of our base, our value for money proposition, continuing improvements in operating efficiency and the largest unbundled network in the UK means that the Directors are confident in our ability to continue to compete effectively in the UK telecoms sector.
We have £944m of committed credit facilities and as at 31 March 2016 the headroom on these facilities was £255m. Our forecasts and projections, taking into account reasonably possible changes in trading performance, indicate that there is sufficient cash and covenant headroom on our facilities and that this, together with our market positioning, means that we are well placed to manage our business risks successfully and have adequate resources to continue in operational existence for the foreseeable future. The Directors have therefore adopted the going concern basis of accounting preparing the financial statements.

Consolidated income statement For the year ended 31 March 2016
2016 2015
Headline - before
amortisation of acquisition
intangibles and exceptional
items £m
Amortisation of acquisition
intangibles and exceptional
items £m
Statutory - after
amortisation of acquisition
intangibles and exceptional
items £m
Headline - before
amortisation of acquisition
intangibles and exceptional
items £m
Amortisation of acquisition
intangibles and exceptional
items £m
Statutory - after
amortisation of acquisition
intangibles and exceptional
items £m
Revenue 1,838 (3) 1,835 1,795 – 1,795
Cost of sales (845) – (845) (815) – (815)
Gross profit 993 (3) 990 980 – 980
Operating expenses excluding amortisation and depreciation (733) (80) (813) (735) (46) (781)
EBITDA 260 (83) 177 245 (46) 199
Depreciation (72) – (72) (78) (5) (83)
Amortisation (49) (10) (59) (42) (12) (54)
Share of results of joint ventures (8) – (8) (8) – (8)
Operating profit 131 (93) 38 117 (63) 54
Net finance costs (24) – (24) (22) – (22)
Profit before taxation 107 (93) 14 95 (63) 32
Taxation (28) 16 (12) (19) 59 40
Profit for the year attributable to the owners of the Company 79 (77) 2 76 (4) 72
Earnings per ordinary share
Basic 0.2p 7.8p
Diluted 0.2p 7.7p
Statutory operating profit 38 54
Adjusted for:
Amortisation of acquisition intangibles 10 12
Exceptional items 83 51
Headline operating profit 131 117
Consolidated statement of comprehensive income For the year ended 31 March 2016
2016 £m
2015 £m
Profit for the year attributable to the owners of the Company 2 72
Other comprehensive income
Items that may be reclassified to profit or loss:
Gains/(losses) on a hedge of a financial instrument 2 (5)
Currency translation differences 1 (1)
Total other comprehensive income/(expense) 3 (6)
Total comprehensive income 5 66
All amounts relate to continuing operations.

Consolidated balance sheet As at 31 March 2016
2016
£m 2015
£m
Non-current assets
Goodwill 495 490
Other intangible assets 227 178
Property, plant and equipment 302 290
Investment in joint venture 9 10
Trade and other receivables 3 –
Derivative financial instruments 18 11
Deferred tax assets 115 130
1,169 1,109
Current assets
Inventories 57 31
Trade and other receivables 294 313
Current income tax receivable 3 1
Cash and cash equivalents 10 10
364 355
Total assets 1,533 1,464
Current liabilities
Trade and other payables (563) (516)
Borrowings (25) –
Provisions (18) (34)
(606) (550)
Non-current liabilities
Borrowings (684) (615)
Derivative financial instruments (1) (1)
Provisions (11) (1)
(696) (617)
Total liabilities (1,302) (1,167)
Net assets 231 297
Equity
Share capital 1 1
Share premium 684 684
Translation reserve (64) (65)
Demerger reserve (513) (513)
Retained earnings and other reserves 123 190
Total equity 231 297
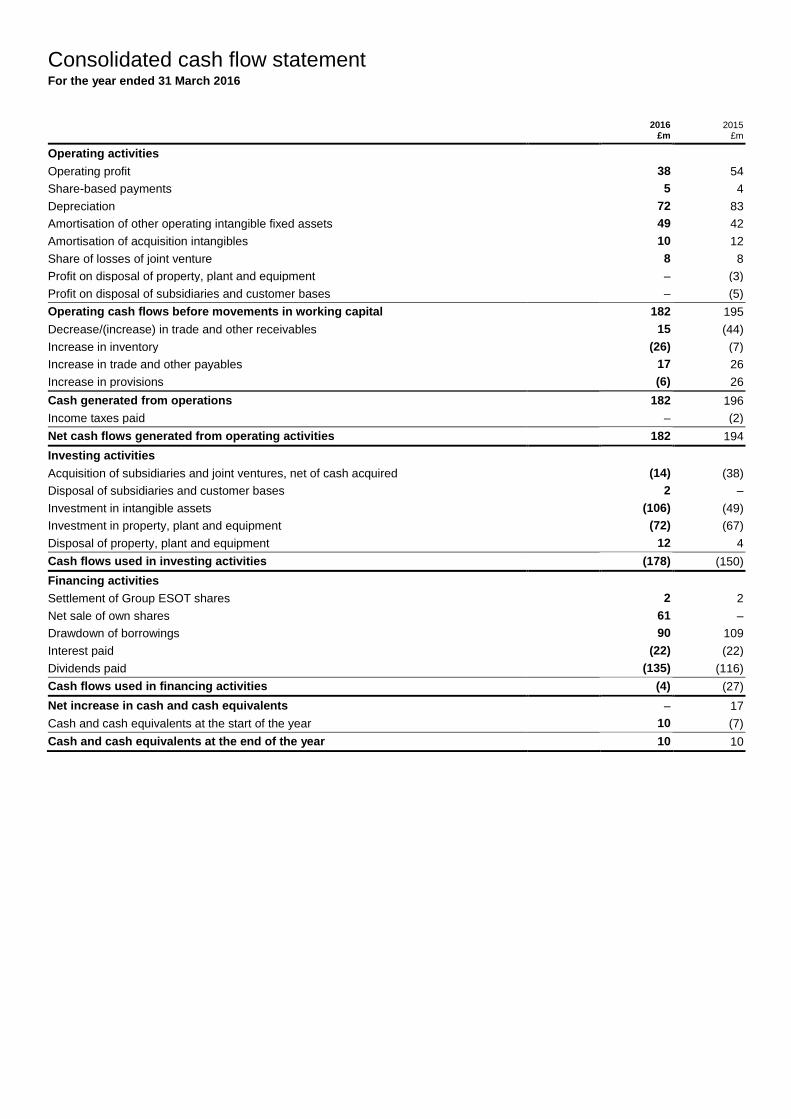
Consolidated cash flow statement For the year ended 31 March 2016
2016
£m 2015
£m
Operating activities
Operating profit 38 54
Share-based payments 5 4
Depreciation 72 83
Amortisation of other operating intangible fixed assets 49 42
Amortisation of acquisition intangibles 10 12
Share of losses of joint venture 8 8
Profit on disposal of property, plant and equipment – (3)
Profit on disposal of subsidiaries and customer bases – (5)
Operating cash flows before movements in working capital 182 195
Decrease/(increase) in trade and other receivables 15 (44)
Increase in inventory (26) (7)
Increase in trade and other payables 17 26
Increase in provisions (6) 26
Cash generated from operations 182 196
Income taxes paid – (2)
Net cash flows generated from operating activities 182 194
Investing activities
Acquisition of subsidiaries and joint ventures, net of cash acquired (14) (38)
Disposal of subsidiaries and customer bases 2 –
Investment in intangible assets (106) (49)
Investment in property, plant and equipment (72) (67)
Disposal of property, plant and equipment 12 4
Cash flows used in investing activities (178) (150)
Financing activities
Settlement of Group ESOT shares 2 2
Net sale of own shares 61 –
Drawdown of borrowings 90 109
Interest paid (22) (22)
Dividends paid (135) (116)
Cash flows used in financing activities (4) (27)
Net increase in cash and cash equivalents – 17
Cash and cash equivalents at the start of the year 10 (7)
Cash and cash equivalents at the end of the year 10 10

Consolidated statement of changes in equity For the year ended 31 March 2016
Share capital
£m
Share premium
£m
Translation reserve
£m
Demerger reserve
£m
Retained earnings
and other reserves
£m
Total equity
£m
At 1 April 2014 1 684 (64) (513) 239 347
Profit for the year – – – – 72 72
Other comprehensive income
Items that may be reclassified to profit or loss:
Loss on hedge of a financial instrument – – – – (5) (5)
Currency translation differences – – (1) – – (1)
Total other comprehensive expense – – (1) – (5) (6)
Total comprehensive income – – (1) – 67 66
Transactions with the owners of the Company
Share-based payments reserve credit – – – – 4 4
Share-based payments reserve debit – – – – (3) (3)
Settlement of Group ESOT – – – – 2 2
Equity dividends – – – – (116) (116)
Taxation of items recognised directly in reserves – – – – (3) (3)
At 31 March 2015 1 684 (65) (513) 190 297
Profit for the year – – – – 2 2
Other comprehensive income
Items that may be reclassified to profit or loss:
Gain on hedge of a financial instrument – – – – 2 2
Currency translation differences – – 1 – – 1
Total other comprehensive income – – 1 – 2 3
Total comprehensive income – – 1 – 4 5
Transactions with the owners of the Company
Share-based payments reserve credit – – – – 5 5
Share-based payments reserve debit – – – – (1) (1)
Sale of own shares – – – – 61 61
Settlement of Group ESOT – – – – 2 2
Equity dividends – – – – (135) (135)
Taxation of items recognised directly in reserves – – – – (3) (3)
At 31 March 2016 1 684 (64) (513) 123 231

Notes to the consolidated financial information
1. Basis of preparation
The financial information is derived from the Group’s consolidated financial statements for the year ended 31 March 2016, which have been prepared on the going concern basis in accordance with International Financial Reporting Standards (IFRS) as adopted for use in the European Union, IFRS Interpretations Committee and those parts of the Companies Act 2006 (‘the Act’) applicable to companies reporting under IFRS. There are no new or revised standards and interpretations that have had a material impact on the Group during the year. The financial statements have been prepared on the historical cost basis, except for the revaluation of certain financial instruments and investments. The financial statements are presented in Sterling, rounded to the nearest million, because that is the currency of the principal economic environment in which the Group operates.
The consolidated financial statements were approved by the Directors on 12 May 2016. The financial information does not constitute statutory accounts within the meaning section 435 of the Companies Act 2006 or contain sufficient information to comply with the disclosure requirements of IFRS. The Company’s auditors, Deloitte LLP, have given an unqualified report on the consolidated financial statements for the year ended 31 March 2016, which did not include reference to any matters to which the auditors drew attention without qualifying their report and did not contain any statement under section 498 of the Companies Act 2006.
Subject to approval by the Company’s shareholders, the consolidated financial statements will be filed with the Registrar of Companies following the Company’s Annual General Meeting on 20 July 2016. 2. Segmental reporting
Accounting policy
IFRS 8 ‘Operating Segments’ requires the segmental information presented in the financial statements to be that used by the chief operating decision maker (CODM) to evaluate the performance of the business and decide how to allocate resources. The Group has identified the Board as its CODM. The Board considers the results of the business as a whole when assessing the performance of the business and making decisions about the allocation of resources. Accordingly the Group has one operating segment with all operations based in the United Kingdom.
2016
£m 2015
£m
Headline revenue 1,838 1,795
Headline EBITDA 260 245
Depreciation (72) (78)
Amortisation of operating intangibles (49) (42)
Share of results of joint ventures (8) (8)
Headline profit before interest and taxation 131 117
Amortisation of acquisition intangibles (10) (6)
Exceptional items – Revenue (3) –
Exceptional items – operating expenses (80) (46)
Exceptional items – Impairment loss – (11)
Statutory profit before interest and taxation 38 54
The Group’s revenue is split by On-net, Off-net and Corporate products as this information is provided to the Group’s CODM. On-net and Off-net comprise Consumer and Business customers that receive similar services.
2016 £m
2015 £m
On-net 1,399 1,333
Corporate 384 375
Off-net 55 87
1,838 1,795
The Group has no material overseas operations; as a result, a split of revenue and total assets by geographical location has not been disclosed.

3. Operating profit
Operating profit is stated after charging/(crediting):
2016 £m
2015 £m
Depreciation of property, plant and equipment 72 78
Amortisation of acquisition intangibles 10 6
Amortisation of other operating intangible fixed assets 49 42
Profit on disposal of property, plant and equipment – (3)
Impairment loss recognised on trade receivables 71 62
Staff costs 139 122
Cost of inventories recognised in expenses 72 115
Rentals under operating leases 100 95
Supplier rebates 1 (13) (33)
Auditor’s remuneration 1 1
Exceptional items 83 46
Exceptional items – Impairment loss – 11
1 Included within operating profit for the prior year is a credit of £20m to offset associated increased costs of £25m.
4. Net finance costs
Net finance costs are analysed as follows:
2016
£m 2015
£m
Interest on bank loans and overdrafts 21 17
Facility fees and similar charges 3 5
24 22
During the year ended 31 March 2016 and 2015 the impact of finance income was not material.
In FY16, the Group signed two new revolving credit facilities. Arrangement fees of £1m were paid and are amortised over the life of the facilities. In FY15, the Group refinanced its term loan and revolving credit facility with bank debt and US Private Placement Notes and paid £5m in respect of arrangement and legal fees. The fees are being amortised over the expected life of the loan and notes and are included within facility fees and similar charges above. The average interest rate in the year was 3.10% (2015: 3.00%).
5. Taxation
Accounting policy
Current tax, including UK corporation tax and overseas tax, is provided at amounts expected to be paid or recovered using the tax rates and laws that have been enacted or substantively enacted at the balance sheet date.
Deferred tax is provided on temporary differences between the carrying amount of an asset or liability in the balance sheet and its tax base.
Deferred tax liabilities represent tax payable in future periods in respect of taxable temporary differences. Deferred tax assets represent tax recoverable in future periods in respect of deductible temporary differences, and the carry-forward of unused tax losses and credits. Deferred tax is determined using the tax rates that have been enacted or substantively enacted at the balance sheet date and are expected to apply when the deferred tax asset is realised or the deferred tax liability is settled.
A deferred tax asset is recognised only to the extent that it is probable that future taxable profits will be available against which the asset can be utilised. Current and deferred tax is recognised in the income statement except where it relates to an item recognised directly in reserves, in which case it is recognised directly in reserves.
Deferred tax assets and liabilities are offset where there is a legal right to do so in the relevant jurisdictions.
Critical judgements in applying the Group’s accounting policy
The extent to which tax losses can be utilised depends on the extent to which taxable profits are generated in the relevant jurisdictions for the foreseeable future, and on the tax legislation then in force, and as such the value of associated deferred tax assets is uncertain.

Tax – income statement
The tax charge/(credit) comprises:
2016
£m 2015
£m
Current tax:
UK corporation tax – –
Adjustments in respect of prior years:
UK corporation tax (1) –
UK corporation tax – exceptional credit – (14)
Total current tax credit (1) (14)
Deferred tax:
Origination and reversal of timing differences 7 –
Origination and reversal of timing differences – exceptional credit – (29)
Effect of change in tax rate 6 1
Adjustments in respect of prior years – deferred tax (credit)/charge (3) 4
Adjustments in respect of prior years – exceptional charge/(credit) 3 (2)
Total deferred tax 13 (26)
Total tax charge/(credit) 12 (40)
The tax charge on headline earnings for the year ended 31 March 2016 was £28m (2015: £19m), representing an effective tax rate on pre-tax profits of 26% (2015: 20%). The tax charge on statutory earnings for the year ended 31 March 2016 was £12m (2015: credit of £40m).
The principal differences between the tax charge and the amount calculated by applying the standard rate of UK corporation tax of 20% (2015: 21%) to the profit before taxation are as follows:
2016
£m 2015
£m
Profit before taxation 14 32
Tax at 20% (2015: 21%) 3 7
Items attracting no tax relief or liability 1 1
Effect of change in tax rate 6 1
Adjustments in respect of prior years (3) 4
Adjustments in respect of prior years – exceptional charge/(credit) 3 (16)
Movement in recognised tax losses during the year 3 –
Movement in unrecognised tax losses during the year (1) (8)
Movement in unrecognised tax losses during the year – exceptional credit – (29)
Total tax charge/(credit) through income statement 12 (40)
Tax – retained earnings and other reserves
Tax on items recognised directly in retained earnings and other reserves is as follows:
2016
£m 2015
£m
Total tax charge/(credit) through income statement 12 (40)
Deferred tax charge recognised directly in retained earnings and other reserves 3 3
Total tax charge/(credit) through retained earnings and other reserves 15 (37)
The deferred tax charge recognised directly in retained earnings and other reserves for the years ended 31 March 2016 and 31 March 2015 relates to share-based payments.

Tax – balance sheet
The deferred tax assets recognised by the Group and movements thereon during the year are as follows:
Share-based payments
£m
Timing differences on
capitalised costs
£m
Tax losses
£m
Other timing differences
£m Total
£m
At 1 April 2015 6 54 69 1 130
(Charge)/credit to the income statement – (1) (13) 2 (12)
Charge to reserves (3) – – – (3)
At 31 March 2016 3 53 56 3 115
Share-based payments
£m
Timing differences on
capitalised costs
£m
Tax losses
£m
Timing differences on
acquisition intangibles
£m
Other timing differences
£m Total
£m
At 1 April 2014 7 61 39 (1) 1 107
Credit/(charge) to the income statement 2 (7) 30 1 – 26
Charge to reserves (3) – – – – (3)
At 31 March 2015 6 54 69 – 1 130
No deferred tax assets and liabilities have been offset in either year, except where there is a legal right to do so in the relevant jurisdictions.
On 26 October 2015, a reduction in the UK statutory rate of taxation was substantively enacted, bringing the tax rate down from 20% to 19% with effect from 1 April 2017 and from 19% to 18% from 1 April 2020. Accordingly, the tax assets and liabilities recognised at 31 March 2016 take account of these changes. This has resulted in a tax charge of £9m to the income statement as the value of the Group’s tax assets has been reduced, of which £3m relates to the prior year exceptional items.
During the prior year, the Company reviewed the period over which it recognises assets in respect of brought forward tax losses and revised this from five years to ten years due to the increased stability of the TV proposition. The incremental movement of £29m was recognised through exceptional items.
At 31 March 2016, the Group had unused tax losses of £650m (2015: £674m) available for offset against future taxable profits. A deferred tax asset of £56m (2015: £69m) has been recognised in respect of £299m (2015: £347m) of such losses, based on expectations of recovery in the foreseeable future.
No deferred tax asset has been recognised in respect of the remaining £351m (2015: £327m) as there is insufficient evidence that there will be suitable taxable profits against which these losses can be recovered. All losses may be carried forward indefinitely.
6. Dividends
Accounting policy
Dividend income is recognised when payment has been received. Final dividend distributions are recognised as a liability in the financial statements in the year in which they are approved by the relevant shareholders. Interim dividends are recognised in the year in which they are paid.
The following dividends were paid by the Group to its shareholders:
2016 £m
2015 £m
Ordinary dividends
Final dividend for the year ended 31 March 2014 of 8.00p per ordinary share – 74
Interim dividend for the year ended 31 March 2015 of 4.60p per ordinary share – 42
Final dividend for the year ended 31 March 2015 of 9.20p per ordinary share 85 –
Interim dividend for the year ended 31 March 2016 of 5.29p per ordinary share 50 –
Total ordinary dividends 1 135 116
(1) Deducted from Company reserves.
The proposed final dividend for the year ended 31 March 2016 of 10.58p (2015: 9.20p) per ordinary share on approximately 946 million (2015: 922 million) ordinary shares (approximately £100m) was approved by the Board on 12 May 2016 and will be recommended to shareholders at the AGM on 20 July 2016. The dividend has not been included as a liability as at 31 March 2016.
The Group ESOT has waived its rights to receive dividends in the current and prior year and this is reflected in the analysis above.

7. Reconciliation of headline information to statutory information
Headline information is provided because the Directors consider that it provides assistance in understanding the Group’s underlying performance.
Accounting policy
Headline results are stated before the amortisation of acquisition intangibles and exceptional items. Exceptional items are those that are considered to be one-off or non-recurring in nature and so material that the Directors believe that they require separate disclosure to avoid distortion of the presentation of underlying performance and should be separately presented on the face of the income statement.
Critical judgements in applying the Group’s accounting policy
The classification of items as exceptional is subjective in nature and therefore judgement is required to determine whether the item is in line with the accounting policy criteria outlined above. Determining whether an item is exceptional is a matter of qualitative assessment, making it distinct from the Group’s other critical accounting judgements where the basis for judgement is estimat ion.
Year ended 31 March 2016 EBITDA
£m
Operating profit
£m
Profit before
taxation £m
Taxation £m
Profit for the year
£m
Headline results 260 131 107 (28) 79
Exceptional items – Revenue - cyber attack (a) (3) (3) (3) 1 (2)
Exceptional items – Operating expenses - cyber attack (b) (39) (39) (39) 8 (31)
Exceptional items – Operating efficiencies (c) (41) (41) (41) 8 (33)
Exceptional items – Acquisitions and disposal (d) – – – – –
Exceptional items – tax (e) – – – (3) (3)
Amortisation of acquisition intangibles (f) – (10) (10) 2 (8)
Statutory results 177 38 14 (12) 2
Year ended 31 March 2015 EBITDA
£m
Operating profit
£m
Profit before
taxation £m
Taxation £m
Profit for the year
£m
Headline results 245 117 95 (19) 76
Exceptional items – Revenue (a) – – – – –
Exceptional items – Operating efficiencies (c) (29) (29) (29) 7 (22)
Exceptional items – Acquisitions and disposal (d) (9) (9) (9) 2 (7)
Exceptional items – Mobile Migration (8) (8) (8) 2 (6)
Exceptional items – Impairment loss – (11) (11) 2 (9)
Amortisation of acquisition intangibles (f) – (6) (6) 1 (5)
Exceptional items – Tax (e) – – – 45 45
Statutory results 199 54 32 40 72
a) Revenue
Cyber attack
On 21 October 2015, there was a significant and sustained cyber attack on the TalkTalk website. Following this attack the Group has issued an increased number of credits to retain its customers. The costs of these credits are recognised against revenue and amount to £3m (2015: £nil).
A total taxation credit of £1m has been recognised on these costs in the year ended 31 March 2016 (2015: £nil).
Other
In the prior year statutory results were two items relating to ongoing commercial discussions; the treatment of prompt payment discounts and historical termination charge settlements with other Mobile Network Operators. The net impact of these two items was not material.
b) Cyber attack
The Group has incurred costs in the year ended 31 March 2016 of £39m (2015: £nil). These costs include restoring our online capability with enhanced security features, associated IT, incident response and consultancy costs and providing free upgrades to our customers.
A total taxation credit of £8m (2015: £nil) has been recognised in relation to these items in the year ended 31 March 2016.
c) Operating efficiencies – Making TalkTalk Simpler (MTTS)
During the year ended 31 March 2016, the Group continued its wide ranging transformation programme that is delivering material improvements to our customers’ experience, driving operating cost savings, and reducing SAC through lower churn and costs per add (CPA).
The costs incurred in the year include work on improving Consumer and TalkTalk Business systems and processes which focus on customer experience; the review of the organisational structure of the business and the sites where the Group operates.

These programmes have resulted in £41m (2015: £29m) of costs, including project management, redundancy, property, consultancy, migration and call centre costs.
A total taxation credit of £8m has been recognised on these costs in the year ended 31 March 2016 (2015: £7m).
d) Acquisitions and disposal
In the prior year, the Group acquired broadband and voice customer bases from both Virgin Media Limited (‘Virgin Media’) and Tesco Stores Limited (‘Tesco’). The Group has recognised an exceptional credit of £2m in the year ended 31 March 2016 in relation to the acquisition of Virgin Media, following the reassessment of the value of contingent consideration recognised for this acquisition.
During the year ended 31 March 2015, exceptional charges of £4m were recognised in relation to the migration of Virgin Media and Tesco customers onto the Group’s network and integration costs including redundancy. Further to this, the Group also provided for £10m of costs in respect of committed future programmes predominantly in respect of migration, reorganisation and related costs.
A total taxation charge of £nil (2015: £2m) has been recognised in relation to these items in the year ended 31 March 2016.
Also in the prior year, the Group disposed of its off-net broadband customer base to Fleur Telecom Limited. Following a delay in the migration of these customers, the Group has recognised an exceptional charge of £2m (2015: exceptional credit of £5m).
e) Tax items
The Group has recognised a tax charge of £3m which relates to the impact of the statutory corporation tax rate change from 20% to 19% and then to 18% on prior year exceptional tax assets. In the prior year, the time period over which VNL losses were recognised was increased from five to ten years which resulted in the recognition of an additional tranche of losses. This movement was treated as an exceptional item and, as such, the reduction in the tax rate relating to these losses has also been treated as exceptional in 2016.
f) Amortisation of acquisition intangibles
An amortisation charge in respect of acquisition intangibles of £10m was incurred in the year ended 31 March 2016 (2015: £6m).
A total taxation credit of £2m has been recognised in the year ended 31 March 2016 (2015: £1m).
8. Earnings per ordinary share Earnings per ordinary share are shown on a headline and statutory basis to assist in the understanding of the performance of the Group.
2016
£m 2015
£m
Headline earnings 79 76
Statutory earnings 2 72
Weighted average number of shares (millions):
Shares in issue 955 955
Less weighted average holdings by Group ESOT (19) (33)
For basic EPS 936 922
Dilutive effect of share options 11 15
For diluted EPS 947 937
2016
Pence 2015
Pence
Basic earnings per ordinary share
Headline 8.4 8.2
Statutory 0.2 7.8
2016
Pence 2015
Pence
Diluted earnings per ordinary share
Headline 8.3 8.1
Statutory 0.2 7.7
There are no share options considered anti-dilutive in the year ended 31 March 2016 (2015: nil).

9. Goodwill and other intangible assets
(a) Goodwill
Accounting policy
Goodwill arising on the acquisition of subsidiary undertakings and businesses, representing the excess of the fair value of the consideration given over the fair value of the identifiable assets and liabilities acquired is recognised initially as an asset at cost and is subsequently measured at cost less any accumulated impairment losses.
On disposal of a subsidiary undertaking, the relevant goodwill is included in the calculation of the profit or loss on disposal.
Critical judgements in applying the Group’s accounting policy
The Group has two cash generating units (CGU) – Consumer and TalkTalk Business. For the purpose of impairment testing, at the acquisition date, goodwill is allocated to each of the CGUs expected to benefit from the synergies of the acquisition. The Group’s shared costs and assets relating mainly to infrastructure and central overheads are allocated across the two CGUs based on the relative future cash flows that those shared costs support.
Determining whether goodwill is impaired requires estimation of the value in use of the CGUs to which the goodwill has been allocated. The value in use calculation involves estimation of both the future cash flows of the CGUs and the selection of appropriate discount rates to use to calculate present values.
Impairment of goodwill
Goodwill is not subject to amortisation but is tested for impairment annually or whenever there is an indication that the asset may be impaired; this review is performed at a CGU level.
Impairment is determined by assessing the future cash flows of the CGU to which the goodwill relates. The future cash flows of the Group are taken from the Board approved five year plan and extrapolated out to 20 years based on the UK’s long-term growth rate. This is discounted by the CGU’s weighted average cost of capital pre-tax to give the net present value of that CGU. Where the net present value of future cash flows is less than the carrying value of the unit, the impairment loss is allocated first to reduce the carrying amount of any goodwill allocated to the CGU and then to the other assets of the CGU pro-rata on the basis of the carrying amount of each asset in the unit. Any impairment loss is recognised in the income statement and is not subsequently reversed.
Sensitivity analysis is performed using reasonably possible changes in the key assumptions.
2016
£m 2015
£m
Opening cost and net book value 490 479
Acquisitions 5 11
Closing cost and net book value 495 490
The goodwill acquired in business combinations is allocated at acquisition to the CGUs that are expected to benefit from that business combination. The allocation of goodwill across the CGUs is as follows:
2016
£m 2015
£m
Consumer 347 348
TalkTalk Business 148 142
495 490
Impairment review
The key assumptions used in the Group’s goodwill impairment review are as follows:
• Long-term growth rates
Long-term revenue growth rates applied are based on the growth rate for the UK per the Organisation for Economic Co-operation and Development (OECD). The rate applied in the current year was 2.0% (2015: 2.2%).
• Discount rate
The underlying discount rate for each CGU is based on the UK ten year gilt rate adjusted for an equity risk premium and the systematic risk of the CGU. The average pre-tax rate for both CGUs used to discount the forecast cash flows is 10.2% (2015: 9.0%). The assumptions used in the calculation of the CGUs’ discount rate are benchmarked to externally available data. The same discount rate has been applied to both CGUs due to the similarity of risk factors and geographical location.
• Capital expenditure
Forecast capital expenditure is based on senior management expectations of future required support of the network and current run rate of expenditure, typically at 6% of revenue.
• Customer factors
The key assumptions for the forecast cash flows of each of the CGUs are based on expected customer growth rates, ARPU, direct costs including acquisition costs, and changes in product mix. The value assigned to each of these assumptions has been determined based on the extrapolation of historical trends in the Group, adjusted for the impact of the cyber attack in the year and external information on expected trends of future market developments.
Sensitivity analysis has been performed for each key assumption and the Directors have not identified any reasonably possible changes in the key assumptions that would cause the carrying value of goodwill to exceed the recoverable amount.
(b) Other intangible assets
Accounting policy
Operating intangibles
Operating intangibles include internal infrastructure and design costs incurred in the development of software for internal use. Internally generated software is recognised as an intangible asset only if it can be separately identified, it is probable that the asset

will generate future economic benefits, and the development cost can be measured reliably. Where these conditions are not met, development expenditure is recognised as an expense in the year in which it is incurred. Directly attributable costs that are capitalised include employee costs specifically incurred in the development of the intangible asset. Operating intangibles are amortised on a straight line basis over their estimated useful economic lives of up to eight years.
Acquisition intangibles
Acquired intangible assets such as customer bases and other intangible assets acquired through a business combination are capitalised separately from goodwill and amortised over their expected useful lives of up to six years on a straight line basis. The value attributed to such assets is based on the future economic benefit that is expected to be derived from them, calculated as the present value of future cash flows after a deduction for contributory assets.
Critical judgements in applying the Group’s accounting policy
Impairment
At the acquisition date, acquisition intangibles are allocated to each of the CGUs expected to benefit from the synergies of the combination. The Group’s shared costs and assets relating mainly to infrastructure and central overheads are allocated across the two CGUs based on the relative future cash flows.
Determining whether the carrying amounts of operating and acquisition intangibles have any indication of impairment requires judgement. If an indication of impairment is identified, further judgement is required to assess whether the carrying amounts can be supported by the value in use of the CGU that the asset is allocated to.
The value in use calculation involves estimation of both the future cash flows of the CGUs and the selection of appropriate discount rates to use to calculate present values.
Useful economic lives
The assessment of the useful economic lives of these operating and acquisition intangibles requires judgement. Amortisation is charged to the income statement based on the useful economic life selected. This assessment requires estimation of the period over which the Group will benefit from the assets.
Impairment of assets
The Group reviews the carrying amounts of its intangible assets to determine whether there is any indication that those assets have suffered an impairment loss at each reporting date. Where an indicator of impairment exists, the Group makes a formal estimate of the asset’s recoverable amount and the extent of any impairment loss.
The recoverable amount is the higher of an asset’s fair value less costs to sell and its value in use. In assessing value in use, the estimated cash flows are discounted to their present value using a pre-tax discount rate that reflects the current market assessments of the time value of money and the risks specific to the asset for which the estimates of future cash flows have not been adjusted.
If the recoverable amount of an asset is estimated to be less than the carrying amount, the carrying amount of the asset or CGU is reduced to its recoverable amount.
Other intangible assets are analysed as follows:
Operating intangibles
£m
Acquisition intangibles
£m
Total other intangibles
£m
Opening balance at 1 April 2015 136 42 178
Additions 106 – 106
Finalisation of provisional acquisition intangible – 2 2
Amortisation (49) (10) (59)
Closing balance at 31 March 2016 193 34 227
Cost (gross carrying amount) 458 142 600
Accumulated amortisation (265) (108) (373)
Closing balance at 31 March 2016 193 34 227
Operating intangibles
£m
Acquisition intangibles
£m
Total other intangibles
£m
Opening balance at 1 April 2014 135 6 141
Additions 49 – 49
Acquisition of subsidiary business combination – 42 42
Amortisation (42) (6) (48)
Impairment loss (6) – (6)
Closing balance at 31 March 2015 136 42 178
Cost (gross carrying amount) 352 140 492
Accumulated amortisation (216) (98) (314)
Closing balance at 31 March 2015 136 42 178
Operating intangibles Operating intangibles includes internally generated assets with a net book value of £88m (2015: £59m), which are amortised over a period of up to eight years. This includes additions of £43m (2015: £31m) and an amortisation charge of £14m (2015: £10m) in the year ended 31 March 2016.
Included within operating intangibles is the following asset, which is material to the Group:

• TRIO, the customer billing system, which has a net book value of £47m (2015: £66m). TRIO is amortised over a period of up to eight years depending on the release date of the relevant component. The weighted average remaining useful economic life of the components of TRIO is two years (2015: three years).
Acquisition intangibles
Acquisition intangibles relate largely to the broadband customer bases acquired from Virgin Media and Tesco in the prior year; these customer bases are valued from the discounted future cash flows expected from them, after a deduction for contributory assets. The remainder of acquisition intangibles relates to the website acquired as part of the blinkbox transaction also in the prior year.
At 31 March 2016, the net book value of the acquired broadband bases are material to the Group; with the Virgin Media base valued at £16m (2015: £22m) and the Tesco base valued at £15m (2015: £16m), with remaining useful economic lives of 46 months (2015: 58 months) and 47 months (2015: 59 months) respectively.
10. Trade and other receivables
Critical judgements in applying the Group’s accounting policy
Judgement is required in order to evaluate the likelihood of collection of customer debt after revenue has been recognised and hence the value of the bad and doubtful debt. These provisions are based on historical trends in the percentage of debts which are not recovered.
Trade and other receivables comprise:
2016
£m 2015
£m
Current – trade and other receivables
Trade receivables – gross 174 178
Less provision for impairment (30) (25)
Trade receivables – net 144 153
Other receivables 84 79
Prepayments 21 29
Accrued income 45 51
Assets held for sale – 1
Trade and other receivables 294 313
The Directors estimate that the carrying amount of trade receivables approximates to their fair value.
The average credit period taken on trade receivables, calculated by reference to the amount owed at the year end as a proportion of total revenue in the year, was 29 days (2015: 30 days).
The Group’s trade receivables are denominated in the following currencies:
2016
£m 2015
£m
UK Sterling 163 166
Other 11 12
174 178
The ageing of gross trade receivables is as follows:
2016
£m 2015
£m
Not yet due 65 95
0 to 2 months 28 20
2 to 4 months 21 19
Over 4 months 60 44
174 178
The ageing of the provision for impairment of trade receivables is as follows:
2016
£m 2015
£m
Not yet due (1) (1)
0 to 2 months (1) (1)
2 to 4 months – –
Over 4 months (28) (23)
(30) (25)
Movements in the provisions for impairment of trade receivables are as follows:
2016
£m 2015
£m
Opening balance (25) (34)
Charged to the income statement (71) (62)

Receivables written off as irrecoverable 66 71
(30) (25)
Trade receivables of £80m (2015: £59m) were past due, but not impaired. These balances primarily relate to Consumer and TalkTalk Business fixed line customers. The Group has made provisions based on historical rates of recoverability and all unprovided amounts are considered to be recoverable. The ageing analysis of these trade receivables is as follows:
2016 £m
2015 £m
0 to 2 months 27 19
2 to 4 months 21 19
Over 4 months 32 21
80 59
11. Cash and cash equivalents and borrowings
(a) Cash and cash equivalents are as follows:
2016 £m
2015 £m
Cash at bank and in hand 10 10
The effective interest rate on bank deposits and money market funds was 0.3% (2015: 0.6%).
(b) Borrowings comprise:
Maturity 2016
£m 2015
£m
Current (£100m term loan) 2017 25 –
Maturity 2016
£m 2015
£m
Non-current
$185m US Private Placement (USPP) Notes 2021, 2024, 2026 129 125
£560m revolving credit facility 2019 430 340
£100m bilateral agreements 2019 50 50
£100m term loan (of which £25m is current) 2018, 2019 75 100
£100m revolving credit facility 2017 – –
Non-current borrowings before derivatives 684 615
Total borrowings before derivatives 709 615
Derivatives (20) (16)
Borrowings after derivatives 689 599
Maturity
2016 £m
2015 £m
Undrawn available committed facilities 2017, 2019 255 220
The book value and fair value of the Group’s borrowings, all of which are in Sterling, are as follows:
2016
£m 2015
£m
Less than 1 year 25 –
1 to 2 years 25 25
2 to 3 years – 25
3 to 4 years 530 –
4 to 5 years – 440
Greater than 5 years 109 109
Borrowings after derivatives 689 599
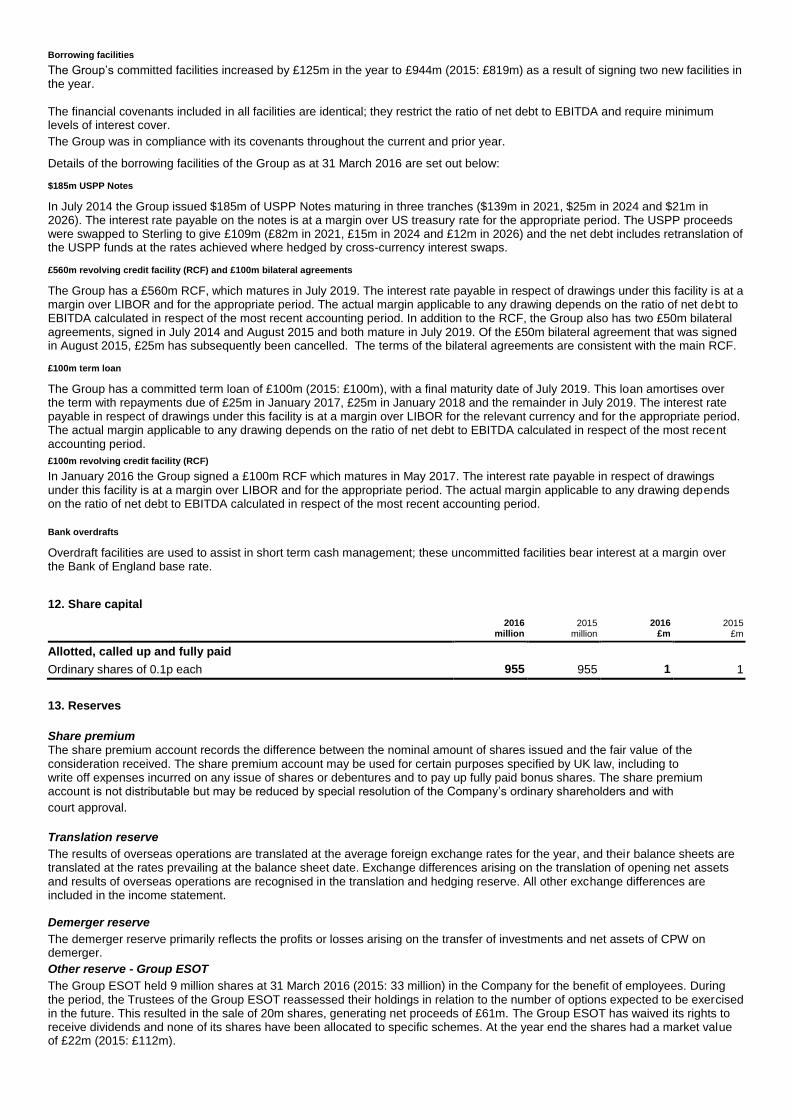
Borrowing facilities
The Group’s committed facilities increased by £125m in the year to £944m (2015: £819m) as a result of signing two new facilities in the year. The financial covenants included in all facilities are identical; they restrict the ratio of net debt to EBITDA and require minimum levels of interest cover.
The Group was in compliance with its covenants throughout the current and prior year.
Details of the borrowing facilities of the Group as at 31 March 2016 are set out below:
$185m USPP Notes
In July 2014 the Group issued $185m of USPP Notes maturing in three tranches ($139m in 2021, $25m in 2024 and $21m in 2026). The interest rate payable on the notes is at a margin over US treasury rate for the appropriate period. The USPP proceeds were swapped to Sterling to give £109m (£82m in 2021, £15m in 2024 and £12m in 2026) and the net debt includes retranslation of the USPP funds at the rates achieved where hedged by cross-currency interest swaps.
£560m revolving credit facility (RCF) and £100m bilateral agreements
The Group has a £560m RCF, which matures in July 2019. The interest rate payable in respect of drawings under this facility is at a margin over LIBOR and for the appropriate period. The actual margin applicable to any drawing depends on the ratio of net debt to EBITDA calculated in respect of the most recent accounting period. In addition to the RCF, the Group also has two £50m bilateral agreements, signed in July 2014 and August 2015 and both mature in July 2019. Of the £50m bilateral agreement that was signed in August 2015, £25m has subsequently been cancelled. The terms of the bilateral agreements are consistent with the main RCF.
£100m term loan
The Group has a committed term loan of £100m (2015: £100m), with a final maturity date of July 2019. This loan amortises over the term with repayments due of £25m in January 2017, £25m in January 2018 and the remainder in July 2019. The interest rate payable in respect of drawings under this facility is at a margin over LIBOR for the relevant currency and for the appropriate period. The actual margin applicable to any drawing depends on the ratio of net debt to EBITDA calculated in respect of the most recent accounting period.
£100m revolving credit facility (RCF)
In January 2016 the Group signed a £100m RCF which matures in May 2017. The interest rate payable in respect of drawings under this facility is at a margin over LIBOR and for the appropriate period. The actual margin applicable to any drawing depends on the ratio of net debt to EBITDA calculated in respect of the most recent accounting period. Bank overdrafts
Overdraft facilities are used to assist in short term cash management; these uncommitted facilities bear interest at a margin over the Bank of England base rate.
12. Share capital
2016
million 2015
million 2016
£m 2015
£m
Allotted, called up and fully paid
Ordinary shares of 0.1p each 955 955 1 1
13. Reserves
Share premium The share premium account records the difference between the nominal amount of shares issued and the fair value of the consideration received. The share premium account may be used for certain purposes specified by UK law, including to write off expenses incurred on any issue of shares or debentures and to pay up fully paid bonus shares. The share premium account is not distributable but may be reduced by special resolution of the Company’s ordinary shareholders and with
court approval.
Translation reserve
The results of overseas operations are translated at the average foreign exchange rates for the year, and their balance sheets are translated at the rates prevailing at the balance sheet date. Exchange differences arising on the translation of opening net assets and results of overseas operations are recognised in the translation and hedging reserve. All other exchange differences are included in the income statement. Demerger reserve
The demerger reserve primarily reflects the profits or losses arising on the transfer of investments and net assets of CPW on demerger.
Other reserve - Group ESOT
The Group ESOT held 9 million shares at 31 March 2016 (2015: 33 million) in the Company for the benefit of employees. During the period, the Trustees of the Group ESOT reassessed their holdings in relation to the number of options expected to be exercised in the future. This resulted in the sale of 20m shares, generating net proceeds of £61m. The Group ESOT has waived its rights to receive dividends and none of its shares have been allocated to specific schemes. At the year end the shares had a market value of £22m (2015: £112m).
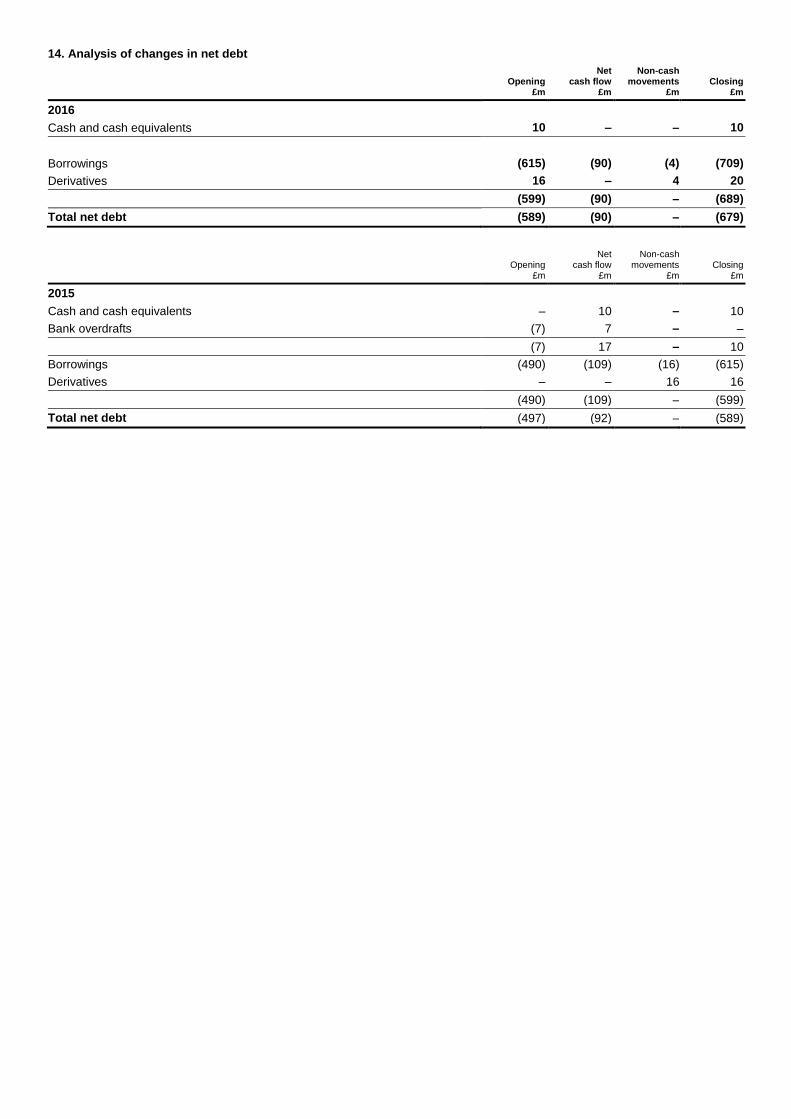
14. Analysis of changes in net debt
Opening
£m
Net cash flow
£m
Non-cash movements
£m Closing
£m
2016
Cash and cash equivalents 10 – – 10
Borrowings (615) (90) (4) (709)
Derivatives 16 – 4 20
(599) (90) – (689)
Total net debt (589) (90) – (679)
Opening
£m
Net cash flow
£m
Non-cash movements
£m Closing
£m
2015
Cash and cash equivalents – 10 – 10
Bank overdrafts (7) 7 – –
(7) 17 – 10
Borrowings (490) (109) (16) (615)
Derivatives – – 16 16
(490) (109) – (599)
Total net debt (497) (92) – (589)