TF_Template_Word_Windows_2010 - University of...
64
To cost an elephant: An exploratory survey on cost estimating practice in the light of Product-Service- Systems Ettore Settanni*, Nils E. Thenent, Linda B. Newnes Department of Mechanical Engineering, University of Bath, Bath, BA2 7AY, United Kingdom Glenn Parry Faculty of Business & Law, UWE Frenchay Campus, Bristol, United Kingdom Yee Mey Goh Wolfson School of Mechanical and Manufacturing Engineering, Loughborough University, Loughborough, LE11 3TU, United Kingdom *Corresponding author: [email protected] Acknowledgments. The authors gratefully acknowledge the support provided by the Department of Mechanical Engineering at the University of Bath, the Innovative electronics Manufacturing Research Centre (IeMRC) and the Engineering and Physical Sciences Research Council (EPSRC) for funding the i 1 2 3 4 5 6 7 8 9 10 11 12 13 14 15 16 17 18 19
Transcript of TF_Template_Word_Windows_2010 - University of...

To cost an elephant: An exploratory survey on cost estimating practice in
the light of Product-Service-Systems
Ettore Settanni*, Nils E. Thenent, Linda B. Newnes
Department of Mechanical Engineering, University of Bath, Bath, BA2 7AY, United
Kingdom
Glenn Parry
Faculty of Business & Law, UWE Frenchay Campus, Bristol, United Kingdom
Yee Mey Goh
Wolfson School of Mechanical and Manufacturing Engineering, Loughborough University,
Loughborough, LE11 3TU, United Kingdom
*Corresponding author: [email protected]
Acknowledgments. The authors gratefully acknowledge the support provided by the
Department of Mechanical Engineering at the University of Bath, the Innovative electronics
Manufacturing Research Centre (IeMRC) and the Engineering and Physical Sciences
Research Council (EPSRC) for funding the research. We gratefully acknowledge Dr. Paulo
Botas and Miss Alex Griffiths from the University of Bath for support in the questionnaire
design, and the members from SCAF community and LinkedIn cost engineering and
parametric cost estimation groups who kindly took part in this study.
i
1
2
3
4
5
6
7
8
9
10
11
12
13
14
15
16
17
18
19
20

To cost an elephant: An exploratory survey on cost estimating practice in
the light of Product-Service-Systems
Businesses now contracting for availability are regarded as part of a paradigm shift away from the familiar ‘product and support’ business model. The main difference being that such businesses eventually commit to provide a service outcome via Product-Service-System (PSS). The research presented in this paper investigates how current cost estimating practice relates with the idea of having as the point of focus for the analysis a PSS delivering service outcomes, rather than a product. Since the topic is in its infancy, an exploratory survey was designed and circulated via the Internet amongst practitioners with the aim of looking for initial patterns, ideas and hypotheses, rather than to confirm existing ones. The picture that seems to emerge is that respondents would not necessarily see the representation and modeling of a PSS as being a precondition to estimate the cost of the service it provides. In line with most academic literature, respondents would rather consider the cost of providing a service via PSS as conceptually equivalent to the cost of the in-service stage of a durable product. Although now allowing for generalization, this research reveals paths that may be worth exploring further.
Keywords: product-service-systems (PSS); availability contracts; cost estimating;
exploratory research; Internet survey.
ii
21
22
232425262728293031323334353637
38
39
40

1 INTRODUCTION
A renowned version of a universally known fable features several blind men who try and
figure out what an elephant looks like1. As each in turn approaches the animal and touches
a different part of it, he concludes that the elephant has the appearance of that part – be it
smooth and sharp as a spear, mighty and plain as a tree, broad and sturdy like a wall and so
on. The men dispute “loud and long” without coming to an agreement as to the elephant’s
appearance: though each is partly in the right, all are in the wrong!
The ‘elephant’ of interest here is a Product Service Systems (PSS). PSS is a construct used
to emphasize that products and services are entangled within a knowledge-intensive socio-
technical system aimed to enable the customer to attain beneficial service outcomes, or
value ‘in-use’ (Meier, Roy & Seliger, 2010). A specific type of PSS operates under
availability or performance-based contracts whereby manufacturers commit to ensure the
usability of the physical assets acquired by their customers. For example, under a whole-
aircraft availability-contract the customers’ needs are met when a fighter jet is on the apron
in a fit state for the women and men of the national air force to fly it (BAE Systems, 2009).
Especially in defence aerospace availability contracts are regarded as an alternative to a
business model where handing over the equipment to the customers and providing after-
sales support constitute distinct responsibilities and potential streams of revenue (Caldwell
& Settle, 2011).
The representation and modeling of a PSS and the evaluation of the cost of the service
outcome(s) delivered by a PSS are different angles from which insight about the same
phenomenon can be provided. Recent works summarize the academic literature on the topic
1 The fable, titled “the blind men and the elephant”, can be found in Saxe, JG. 1868. The Poems of John Godfrey Saxe. Boston: Ticknor and Fields, pp. 259-261 [digitalised by Google].
1
41
42
43
44
45
46
47
48
49
50
51
52
53
54
55
56
57
58
59
60
61
62
12

with a focus on either PSS modeling or cost evaluation (Cavalieri & Pezzotta, 2012,
Phumbua & Tjahjono, 2012, Settanni et al., 2014, Tukker, 2013, Vasantha et al., 2011).
An aspect seldom addressed in the literature is whether representing and modeling a PSS is
a precondition to provide a meaningful estimate of its service outcomes’ cost. From a
critical reading of the existing reviews one has the opposite impression: PSS modeling and
costing tend to be carried out separately, and underpinned by concepts and assumptions that
are different and sometimes contradictory. Hence, much like the men in the fable, scholars
coping with designing, modeling and costing in the context of PSS seem content with the
evidence gained from experiencing partial aspects of ‘the beast’.
The research presented in this paper aims to provide a preliminary investigation of
practitioners’ attitude towards the idea that representing and modeling a PSS is a
precondition to provide a meaningful estimate the cost of the service it provides. To this
purpose an Internet survey amongst an on-line community of practitioners was carried out.
Previous surveys about PSS have focused on aspects related to the use Information and
Communication Technology within the firm (Belvedere, Grando & Bielli, 2013,
Hernandez-Pardo, 2013) and were not Internet surveys. Since there is no comparable study
on the topic, the research presented in this paper sets out to look for new patterns, ideas, or
hypotheses and reveal paths that may be worth exploring further rather than attempting to
confirmation existing ones, hence it classifies as exploratory (Vogt, 2005). Internet surveys
work well for exploratory research (Sue & Ritter, 2007).
Internet surveys have become an essential tool for a wide range of research fields mostly
due to benefits such as the absence of interviewers; the possibility for the respondents to
complete the questionnaire at the time, place and pace which is most convenient to them;
2
63
64
65
66
67
68
69
70
71
72
73
74
75
76
77
78
79
80
81
82
83
84
85

and the provision of data that are immediately storable and ready for further processing
(Vehovar & Lozar Manfreda, 2008). However, due to the relative novelty of this type of
survey limitations arise. Compared to more traditional surveys, the response rates usually
do not favour Internet surveys (Manfreda et al., 2008), and the sampling methods are not
developed enough to provide data that are projectable to general populations (Best &
Harrison, 2009).
The remainder of the paper is as follows. The next section identifies some concepts and
assumptions underpinning the representation and modeling of PSS, and the current cost
estimating practices. It is followed by an outline of the choices underpinning how the
survey was designed, conducted and analyzed. The limitations encountered are also
highlighted. Then the findings from the results of the analysis of both quantitative and
qualitative data gathered through the survey are shown and discussed. The paper closes
providing directions regarding paths that may be worth exploring in future research.
2 BACKGROUND
A crucial aspect for the representation and modelling of a Product-Service System (PSS) is
its qualification as a ‘system’. Broadly speaking, a system is a combination of interacting
elements organized to achieve a stated purpose (BS ISO/IEC, 2002). In the specific case of
a PSS, the system of interest is socio-technical in nature (Meier et al. 2010), that is, social
and technical elements are entangled within a broader transformation system. Although the
concept of system is somehow embedded in that of PSS, the qualification of a PSS as a
‘system’ has received only scant attention so far when it comes to modelling (Cavalieri &
Pezzotta, 2012).
3
86
87
88
89
90
91
92
93
94
95
96
97
98
99
100
101
102
103
104
105
106
107

Following Baines & Lightfoot (2013), under availability-based contracts the system of
interest is the delivery system which underpins the provision of an ‘advanced service’. An
advanced service is a type of service which is critical to their customers’ core business
processes; and the underpinning delivery system is just as important as the service offering
itself. Hence, a PSS is to an advanced service as a manufacturing system is to a product.
From a cost evaluation perspective, an advanced service provider is concerned with the cost
of delivering a result via PSS (Tukker & Tischner, 2006). Settanni et al. (2014) review the
literature extensively and conclude that in the absence of a formalized qualification of a
PSS as a ‘system’ and a clear identification of the intended final outcome meant to be
pursued by the work of a PSS the question ‘how much does it cost to deliver such an
advanced service as availability under a performance or availability-based contract?’ tends
to be substituted with ‘what are the disbursements accumulated during the in-service stage
of a repairable physical asset which stochastically fails and is restored to operation?’. In
this sense, there is no substantial difference between newly proposed computational
approaches meant for use in PSS and those employed in a ‘product and support’ business
model. For example, Datta & Roy, (2010) suggest a framework which is centered on the
cost breakdown structure of a stand-alone service, not on a PSS; Similarly Huang, Newnes
& Parry (2012) evaluate cost estimation techniques at the individual service level. Although
without specific reference to a PSS, a ‘system’ approach is often claimed in cost estimation.
However it is not always clear how the system nature of the phenomenon of interest affects
the way cost evaluation is carried out – see, for example Wang et al. (2012); Valerdi
(2011); Hart et al. (2012).
4
108
109
110
111
112
113
114
115
116
117
118
119
120
121
122
123
124
125
126
127
128
129

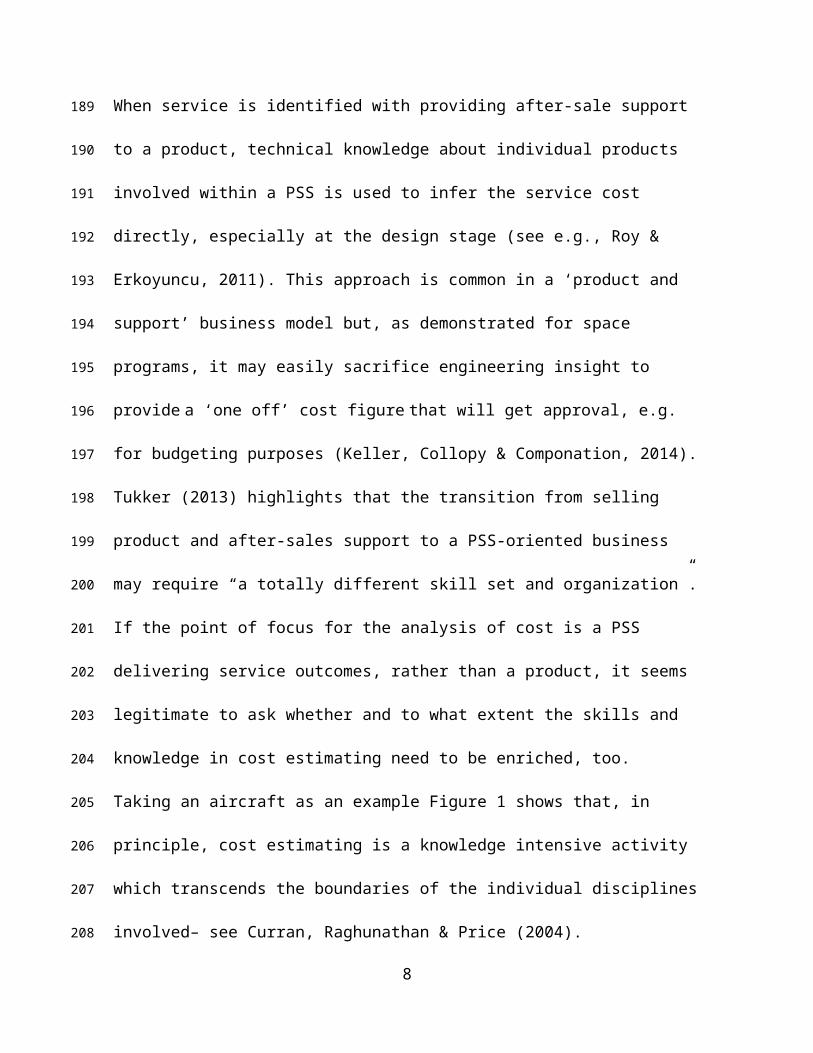
When service is identified with providing after-sale support to a product, technical
knowledge about individual products involved within a PSS is used to infer the service cost
directly, especially at the design stage (see e.g., Roy & Erkoyuncu, 2011). This approach is
common in a ‘product and support’ business model but, as demonstrated for space
programs, it may easily sacrifice engineering insight to provide a ‘one off’ cost figure that
will get approval, e.g. for budgeting purposes (Keller, Collopy & Componation, 2014).
Tukker (2013) highlights that the transition from selling product and after-sales support to a
PSS-oriented business may require “a totally different skill set and organization”. If the
point of focus for the analysis of cost is a PSS delivering service outcomes, rather than a
product, it seems legitimate to ask whether and to what extent the skills and knowledge in
cost estimating need to be enriched, too.
Taking an aircraft as an example Figure 1 shows that, in principle, cost estimating is a
knowledge intensive activity which transcends the boundaries of the individual disciplines
involved– see Curran, Raghunathan & Price (2004).
Insert Figure 1 HERE
A typical cost estimating process will include interaction of technical, business or financial
specialties and accounting, mathematical or statistical skills (Stewart, 1982; Amos, 2004).
However, these interdisciplinary skills seem to be expected to coexist within the individual
cost estimator. In other fields, for example design, collaboration among experts to grasp
multi-faceted problems as, for example, in whole system visualization is explicitly
discussed (Charnley, Lemon & Evans, 2011).
In practice, “…cost is viewed as a relatively simple thing, to be resolved in the course of a
design or development project, but certainly not one that should be at the center of the
5
130
131
132
133
134
135
136
137
138
139
140
141
142
143
144
145
146
147
148
149
150
151
152

engineering effort” (Field, Kirchain & Roth, 2007). A recurrent assumption is that a cost
estimate can and should be generated in the absence of an understanding of the product, the
methods of manufacture/process and relationships between processes (Roy, 2003).
Typically, the knowledge and expertise embedded in individuals concerning the factors
involved in a cost estimate are used to derive rule-based inference systems to assess the
“goodness of fit” of a cost estimate (Serpell, 2004). For example a survey showed that in
the UK construction sector project cost estimating is regarded as a multi-disciplinary
function involving engineering, financing and management decisions (Akintoye &
Fitzgerald, 2000). The same survey highlights that the lack of practical knowledge of the
construction processes by those responsible for the estimating function is perceived as a
major shortcoming. Similarly, lack of knowledge about the manufacturing process is
mentioned as one of the difficulties associated with product costing (Jiao & Tseng, 1999).
This overview led to the following research questions:
RQ1: Is representing and modeling a PSS perceived as a precondition to provide a
meaningful estimate the cost of the service it provides?
RQ2: Is there a counterpart in current cost estimating practice of the system
approach which underpins the representation and modelling of a PSS?
RQ3: Do cost estimators use their knowledge about the underpinning service
delivery system –a PSS – along with data on product-related features?
These research questions were investigated following the methodology described in the
next section.
6
153
154
155
156
157
158
159
160
161
162
163
164
165
166
167
168
169
170
171
172
173

3 METHODOLOGY
In order to understand how the current cost estimation practices may relate to the concept
of PSS and which challenges may raise an internet-user community of international
practitioners was surveyed. These individuals represent the unit of analysis in the study
(Blessing & Chakrabarti, 2009). The following subsections discuss the underlying research
strategy, how the survey was designed and conducted, and also provide some caveats
regarding the analysis of the data gathered.
3.1 Research strategy
Based on the assumption that there is a community of cost estimators that share common
views, and that cost estimation is a task that can be distinguished from other tasks within an
organization, a survey using questionnaires was considered suitable (Hawkins & Orlady,
1993).
A computerized self-administered questionnaire on a Web-based survey host was chosen as
the data collection method as it enables coverage of a relatively large number of
respondents if compared to one-to-one interviews. A word of caution, however, is
necessary. Although the sample size in online survey research may sound as potentially
extremely large, it can be extremely difficulty to construct good sampling frames due to the
nature of the Internet (Denscombe, 2010, Blank, 2008). Not only is a ‘good’ sampling
frame relevant to the research topic, but also but also complete, precise and up-to-date
(Denscombe, 2010). Hence, one of the main disadvantages of using Internet surveys is that
the data produced are hardly projectable to draw conclusions about general populations
(Sue & Ritter, 2007, Best & Harrison, 2009).
7
174
175
176
177
178
179
180
181
182
183
184
185
186
187
188
189
190
191
192
193
194
195

Since no finite sample exists, transmission of the online data collection instrument to the
appropriate respondents is a crucial step (Best & Krueger, 2008). Ideally, contacting
respondents by e-mail first favors greatest response to online surveys but requires access to
appropriate e-mail lists (Sue & Ritter, 2007). Initially, the researchers have attempted to
obtain lists directly from an association of professionals with interests and experience in
cost analysis and forecasting. Using the organization’s list was not possible, however, due
to the sensitivity of the data. The alternative was to advertise the survey in a representative
internet-user community, namely the members of cost estimating/cost engineering LinkedIn
groups, to direct potential respondents to the Web-based survey host. These forums were
deemed adequate to provide access to a purposive sample of people that most likely have
the expertise to provide quality information and valuable insights, thus allowing the
researchers to concentrate on instances which would best illuminate the research questions
at hand (Denscombe, 2010).
As Sue & Ritter (2007) point out, the alternative to direct e-mail contact used here reduces
the benefits of speed and efficiency compared to having an existing list, and may raise
validity concerns due to respondents self-selection into the study. However, since it is not
unusual for internet surveys to be based on general invitations to follow a link to the
survey, they are almost inherently related to a non-probability sample, and to a sample
selection bias which is outside the researchers’ control (Vehovar & Lozar Manfreda, 2008).
3.2 Questionnaire design
The questionnaire consisted of four categorical variables each describing age, gender,
sector and expertise; 23 Likert-type (standard 5-points “agree-disagree” ordinal categories)
statements (items); and one “tick all that apply” statement. For each statement the
8
196
197
198
199
200
201
202
203
204
205
206
207
208
209
210
211
212
213
214
215
216
217
218
respondent was provided with a non-mandatory free text field to comment on their answer.
A summary of the questionnaire is provided in APPENDIX I.
Likert scaling is a widely employed method for assessing attitude, opinion or perception by
scoring a series of items, each consisting of a statement to which the respondent is asked to
react, and a response scale (Barnette, 2007).
In the case considered here, the items were specifically designed around the research
questions. The questionnaire combined concepts and assumptions that underpin the
representation and modeling of a PSS with those that underpin product-centric cost
estimation. Participants’ responses have been associated with such values that:
A favorable disposition towards having PSS delivering service outcomes as the
point of focus for the analysis has higher score;
A favorable disposition towards product-centric view had lower score.
Some items (namely: Q04; Q05; Q06; Q07; Q09; Q14; Q19; Q20; Q22; and Q24) have
been phrased in the semantically opposite direction to help prevent response bias. These
items had to be reverse-scored prior to the analysis in order to make them comparable to the
other items (Weems, 2007).
The choice of target respondents and to design the questionnaire as described created a
situation likely to disconfirm the ideas underpinning the research questions. This practice
can be useful for generalization purposes when a non-statistical sampling approach is used,
as it gives the researchers the best chance of falsifying their argument (Blank, 2008).
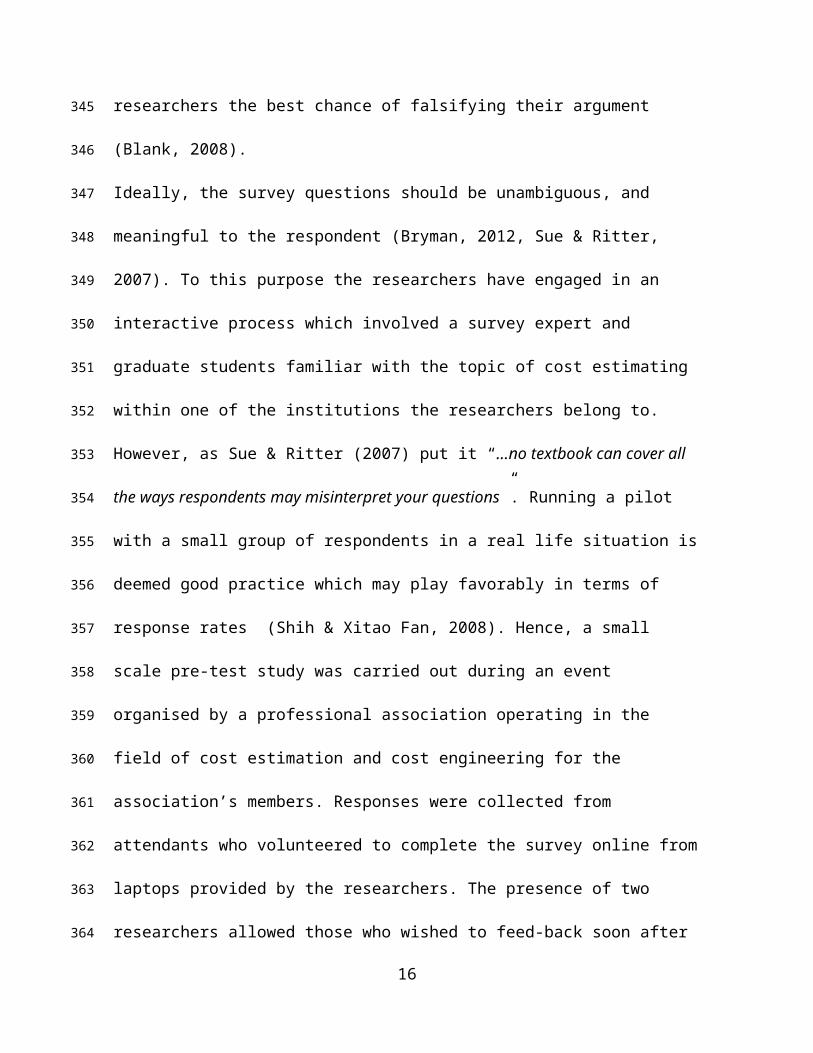
Ideally, the survey questions should be unambiguous, and meaningful to the respondent
(Bryman, 2012, Sue & Ritter, 2007). To this purpose the researchers have engaged in an
interactive process which involved a survey expert and graduate students familiar with the
9
219
220
221
222
223
224
225
226
227
228
229
230
231
232
233
234
235
236
237
238
239
240
241

topic of cost estimating within one of the institutions the researchers belong to. However, as
Sue & Ritter (2007) put it “…no textbook can cover all the ways respondents may
misinterpret your questions”. Running a pilot with a small group of respondents in a real
life situation is deemed good practice which may play favorably in terms of response rates
(Shih & Xitao Fan, 2008). Hence, a small scale pre-test study was carried out during an
event organised by a professional association operating in the field of cost estimation and
cost engineering for the association’s members. Responses were collected from attendants
who volunteered to complete the survey online from laptops provided by the researchers.
The presence of two researchers allowed those who wished to feed-back soon after the
questionnaire completion. Participants were also provided with a glossary with definitions
of key terms such as ‘system’ and ‘product-service-system (PSS)’. The pilot led to a
questionnaire with a slightly revised terminology and structure. More self-contained
statements were deemed necessary since it seemed that respondents would not take a
glossary into account. This has not affected positively the length of some questions.
Finally, the uniformity and usability of the internet data collection instrument in the
response environment is an important aspect (Best & Krueger, 2008). To this purpose the
researchers chose to subscribe to the services of a commercial survey software tool capable
to support different internet browsers.
3.3 Analysis
From the end of June 2012 to the end of January, 2013 a total of 132 participants
volunteered to entered the survey, 98 of which completed the survey in full. Respondent’s
information is summarized in Figure 2, whilst the answers to the ‘tick all that apply’ are
summarized in Figure 3.
10
242
243
244
245
246
247
248
249
250
251
252
253
254
255
256
257
258
259
260
261
262
263
264

Insert Figure 2 here
Insert Figure 3 here
As specified earlier, the online community has not been used here as a sampling frame,
rather, as a way to advertise the survey. Hence it would not make much sense to use the
whole umber of members that joined such communities as a proxy for the number of
‘eligible’ units investigated. For the same reason, however, the self-selection of respondents
may raise a validity issue, as mentioned earlier.
The main use of a response rate is as a measure of how well the survey results can be
generalized, but generalization is not the aim of this exploratory research presented here
(besides being inherently problematic when employing internet surveys, as shown by the
literature). Rather, responses from a non-probability sample such as the one adopted here
can be still useful in developing hypothesis in exploratory research: according to Fricker
(2008) “…simply because a particular method does not allow for generalizing beyond the
sample does not imply that the methods and resulting data are not useful in other research
contexts”.
Finally, good practice demands that to avoid response bias researchers should find out if
respondents are different from non-respondents in some way that is relevant to the survey
(Denscombe, 2010). However, it seems that there is no way to assess nonresponse bias in
internet surveys due to lack of information about those that choose not to complete a survey
(Fricker, 2008).
Having these caveats in mind, the data gathered directly from the online survey instrument
were analyzed. To capture insight from both the Likert-type items and the free text field,
the former have been investigated through a quantitative approach, the latter through a
11
265
266
267
268
269
270
271
272
273
274
275
276
277
278
279
280
281
282
283
284
285
286
287

qualitative approach. This practice is often referred to as simultaneous mixed methods
(Denscombe, 2010). The outcomes of these analyses are shown in the next section.
4 FINDINGS
4.1 Findings from quantitative data analysis
Descriptive statistics for the gathered data are presented in Table 1.
Insert Table 1 here
Likert items are categorical ordinal variables, although they are often implicitly treated as
continuous for analytical purposes. Since the outcomes of categorical variables may be
coded as number but are not numbers one should not ask for mean, standard deviation and
skewedness. Rather, the frequency of occurrence for each value, the median or the mode,
and the Inter Quartile Range (IQR) are more appropriate (Pallant, 2010, Harvey, 1998).
Mode and IQR for each Likert item can be represented graphically via Box Plots (Massart
et al., 2005) as shown in Figure 4.
Insert Figure 4 here
Each Box Plot in Figure 4 has been generated using the statistical software SPSS. It
represents the variation in the sample of responses to each Likert item without making
assumptions about its underlying statistical distribution, rather, through their quartiles. The
median (second quartile) is shown as a band within the each box, whilst variability outside
the third and first quartiles (top and bottom of the box) is indicated by lines extending
vertically. The ‘shorter’ the box, the less variation in the data. In Figure 4 outliers are
plotted as individual points (stars if extreme outliers).
12
288
289
290
291
292
293
294
295
296
297
298
299
300
301
302
303
304
305
306
307
308

In order to explore the to Likert responses Principal Component Analysis—PCA was
adopted. PCA is a statistical technique used to trim down variables that may be measuring
the same construct and hence are interdependent, or significantly correlated (Dunteman,
1989, Coleman, 2010). Sometimes these clusters, or principal components, are identified
upfront by the researchers, and confirmed via PCA or similar analyses. Examples are the
distinctive consumer attitudes towards music purchasing in Parry (2012) or the aspects of
defense projects that assumedly affect using Life Cycle Costing in Tysseland (2008). This,
however, is not the case for the research presented in this paper, due to its exploratory
nature.
PCA is often carried out by making implicit assumptions on the distribution of the variables
being investigated especially if analysis is undertaken via SPSS (Field, 2005; Pallant,
2010). Here, polychoric correlation has been used to avoid making such assumptions
upfront, and to prevent the correlation coefficients from being underestimated (Panter et al.,
1997). Other examples in which a similar approach is used include Battisti & Stoneman
(2010). The statistical software R (R Development Core Team, 2012) was employed to
generate polychoric correlations via the “polycor” package (Fox, 2010).
To facilitate factor’s interpretation the Varimax option for factor rotation was selected in
SPSS due to the absence of expectations about how well the items of the questionnaire
inter-correlate. As an empirical rule, loading of each variable onto a certain factors above
0.512 is deemed adequate for a sample of 100 (Field, 2005). The number of components or
factors to be retained has been determined through the use of Parallel Analysis (Watkins,
2006). A Cronbach’s Alpha of 0.6 has been used as an acceptable measure of the reliability
of the scale composed by the questions that cluster together under each component
13
309
310
311
312
313
314
315
316
317
318
319
320
321
322
323
324
325
326
327
328
329
330
331

(although values above 0.7 are typically sought, for exploratory research a lower value is
also accepted - see e.g. (Tysseland, 2008).
The exploratory PCA led to the identification of three components shown in Table 2. The
topic underlying each factor indicated in Table 2 has been deduced from the contents of the
questions that loaded onto that factor.
Insert Table 2 here
To the low reliability scores obtained, the identified components are used here as an
attention focusing device, to explore possible conceptual links between different items of
the survey that are determined by the answers given, and that may be worth being further
explored in future research.
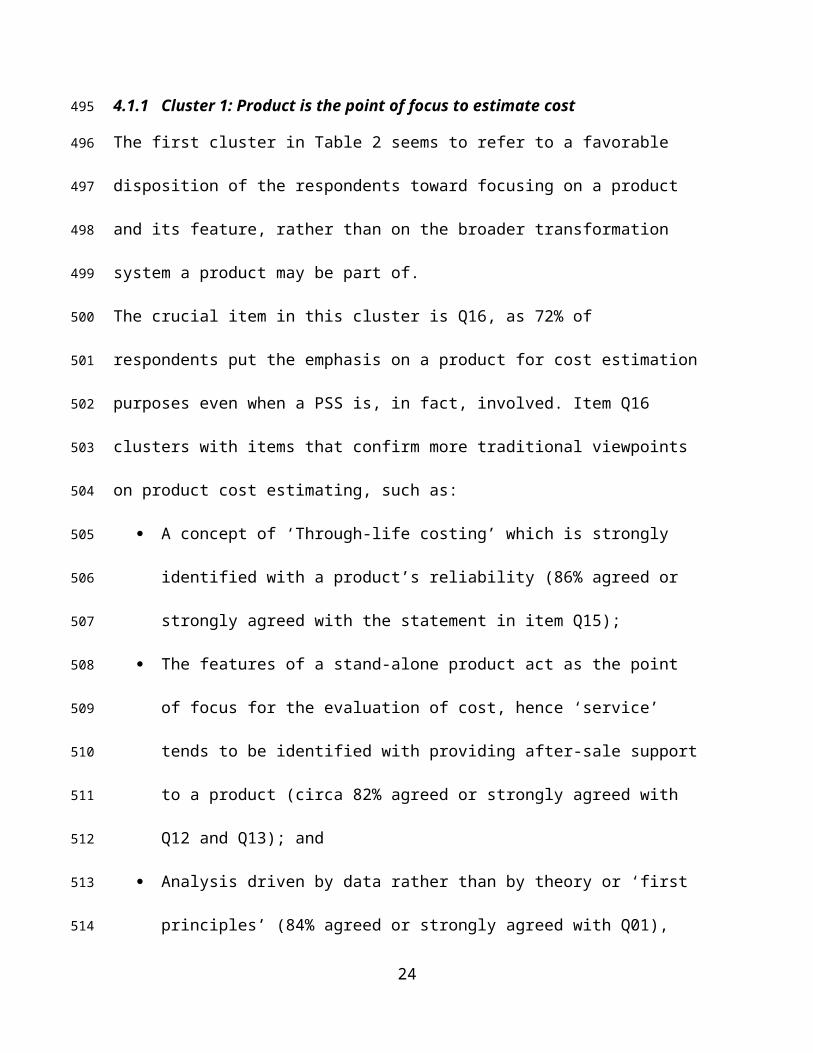
4.1.1 Cluster 1: Product is the point of focus to estimate cost
The first cluster in Table 2 seems to refer to a favorable disposition of the respondents
toward focusing on a product and its feature, rather than on the broader transformation
system a product may be part of.
The crucial item in this cluster is Q16, as 72% of respondents put the emphasis on a product
for cost estimation purposes even when a PSS is, in fact, involved. Item Q16 clusters with
items that confirm more traditional viewpoints on product cost estimating, such as:
A concept of ‘Through-life costing’ which is strongly identified with a product’s
reliability (86% agreed or strongly agreed with the statement in item Q15);
The features of a stand-alone product act as the point of focus for the evaluation of
cost, hence ‘service’ tends to be identified with providing after-sale support to a
product (circa 82% agreed or strongly agreed with Q12 and Q13); and
14
332
333
334
335
336
337
338
339
340
341
342
343
344
345
346
347
348
349
350
351
352
353

Analysis driven by data rather than by theory or ‘first principles’ (84% agreed or
strongly agreed with Q01), and conducted by techniques tailored around the idea of
product life-cycle (83% agreed or strongly agreed with Q17).
4.1.2 Cluster 2: ‘System’ is a synonym for ‘product’
The second cluster in Table 2 seems to indicate a favorable disposition toward the concept
of ‘system’ which, however, turned out to be a problematic concept to deal with as it tends
to be most commonly applied as a synonym for ‘product’, and hardly associated to the
broader transformation system to which it contributes. The central item in this cluster is
Q11, which suggests the idea that underpinning a service is a system of interlinked
activities (the service delivery system) and that this system plays a role in the evaluation of
the service’s cost: 59% endorse this view. This item clusters with items that were meant to
investigate to whether system representation and modeling play a role in cost estimation.
For example, when specific techniques for the diagrammatic representation of a system are
mentioned, only 42% of respondents acknowledge that system representation and cost
estimation are not two intellectual silos (Item Q02). Item Q04 is analogous to Q11 but with
a product acting as a point of focus, in which case 86% of respondents agrees or strongly
agrees. Almost 90% of respondents agreed with Item Q07 suggesting that, at least in
principle, there is an interest from the practitioners for the broader context in which a cost
estimate is generated. Respondents also deem beneficial integrating system modelling with
cost estimating if a PSS is investigated (82% agree or strongly agree with Item Q14).
By contrast, the respondents are almost symmetrically divided went it is suggested that,
unlike Item Q11, knowledge the service delivery system can be reduced to knowledge
about a product in-service (Item Q03). Respondents are similarly divided when it is
15
354
355
356
357
358
359
360
361
362
363
364
365
366
367
368
369
370
371
372
373
374
375
376

suggested that at the early design stage knowledge about the product can be reduced to
knowledge about its features (Item Q08); as well as when, in contrast to Q04, a partial
focus on a product’s life cycle is suggested (Item Q23).
Finally, since 80% of respondents agrees or strongly agrees with Item Q10 it seems
that the concept of systems is mostly associated to a hierarchical architecture of the
physical entities involved, what Bartolomei et al. (2012) define as the technical
domain of System Engineering.
4.1.3 Cluster 3: Going about a cost estimate requires knowing about a product
The last cluster seems to group responses to items that target how the respondents go about
building up an estimate. The central item for this cluster is Q06, which challenges the
respondents to ‘give up’ a familiar set of data about products if they are provided with
insight about the broader transformation system those products are part of. Only 26%
considers the insight about the PSS superior in order to perform their estimate.
Some items in this cluster highlight the peculiarity of dealing with a service delivery
system. For example, 65% of respondents acknowledge that insight into delivering a
service and evaluating its cost cannot be achieved solely by means of historical data (Item
Q05). The respondents are symmetrically divided, however, when it comes to chose
whether or not to estimate the cost of a PSS by adding the estimated cost of the product
involved to the estimated in-service support cost for that product, as they would be doing in
a product-centric, traditional Through-life costing anyway (Item Q09). By contrast, 78% of
respondents agree or strongly agree with Item Q24 that tangible products and activities
form a system meant to achieve a common purpose (the service outcome).
16
377
378
379
380
381
382
383
384
385
386
387
388
389
390
391
392
393
394
395
396
397
398
Also within this cluster are items related to traditional product cost estimation revealing
that priority is accorded to the generation of a cost figure, over questioning the
underpinning methodological and computational aspects. For example, cost figures
generated on heterogeneous grounds are deemed comparable (Item Q19). Respondents,
however, are divided on the well known assumptions, seldom questioned in practice, that
most product costs are locked in at design (Item Q20), and so are they when asked this
assumption unjustifiably shift attention away from actions that can be taken outside the
design silo (Item Q22).
4.2 Difference between groups
A Kruskal-Wallis test has been chosen to explore possible differences between groups
whilst relaxing the assumption commonly made in parametric approaches, such as two-
ways analysis of variances that the underlying distribution of scores in the population from
which the sample is drawn is normal. The test revealed no statistically significant
differences in the above mentioned scores across groups defined by ‘Gender’, ‘Age’,
‘Expertise’ and most of the ‘tick all that apply’ options in Q18 (see Appendix). However,
the test revealed:
A significant difference in the disposition toward system understanding through
reduction/isolation across sectors, χ2(12 , n=97)=20.657, p=.056. An inspection
of the mean ranks suggests that the group ‘Other service activities’ recorded a
higher median score (Md=37) whilst ‘Real estate activities’ recorded the lowest (
Md=25);
A significant difference in the disposition toward the adaptation of feature-cantered
methods in cost estimations across those thinking that the “availability of software
17
399
400
401
402
403
404
405
406
407
408
409
410
411
412
413
414
415
416
417
418
419
420
421

packages” and “computations following well-known mathematical rules” are the
most important aspects for selecting the cost estimating techniques to be used,
respectively χ2(1 , n=97)=5.326, p=.021; and χ2(1 , n=97)=12.575, p=.000. An
inspection of the mean ranks suggests that the group that did not picked up these
options recorded a higher median score (Md=12).
4.3 Additional findings from the free text fields
Free text comments provide additional insights into the respondents’ opinions and why a
certain answer was given, thus complementing quantitative data. An overview of the free
text responses gathered via the questionnaire is given in Table 1.
Insert Table 3 here
The text answers have been subject to a qualitative analysis using the software package
NVivo. The central aim was to uncover common schemes that may give further insight into
the attitudes and practices of the population surveyed. Lower level codes and higher-level
categories were generated, allowing the extraction of key themes from the qualitative data
available, similarly to a thematic analysis (Bryman, 2012).
A word frequency analysis of the comments on the questionnaire items grouped according
to the clusters identified by the quantitative analysis has shown that in all the three clusters
“data” was frequently repeated. Therefore all 265 comments have been analyzed with
respect to how they relate to the concept of data.
Three schemes were identified (Fig. 1).
Insert Fig 5 here
Two of them give insight into the attitude of the respondents towards data as being
enthusiastic or careful. The third summarizes the comments on data availability. This one
18
422
423
424
425
426
427
428
429
430
431
432
433
434
435
436
437
438
439
440
441
442
443
444

was conceptually linked to remarks that comment on the quality of a cost estimate. For
illustrative purposes Fig. 1 shows selected comments on the cost estimators’ attitude
towards data. Comments that were assigned to the concept of data availability highlight the
problem of gathering the required data or having data available in the appropriate format.
Respondents linked this explicitly to the accuracy of an estimate. However there were also
statements suggesting that “understanding of the system being estimated is the [most
important] factor in accurate estimates”. This relates to a formal system representation as
proposed in the questionnaire. In this regard, there were a number of comments suggesting
a critical attitude towards the usage of data, as shown in Fig. 1.
In particular two comments highlighted the challenge identified in this paper: “Cost
estimate architecture has to follow system architecture […]”, which suggests that the cost
estimator is/or at least should be aware of the system architecture to base the estimate upon.
Practices however are stated as being different: “My experience is that while these System
Engineering methods are useful from a procedural / architectural mapping perspective, I
have never seen them used in the actual cost estimating process.” However, none of these
comments explicitly relates the availability of data or the accuracy of an estimate to
collaboration with other disciplines. Rather, “subject matter experts” are considered as
“another source of historical data [...]”. The same respondent nevertheless acknowledges
that experts “are better [than datasets] at providing cost data that applies to system to be
delivered.”
The absence of concepts related to collaboration other than identifying experts as sources of
knowledge is interpreted as an indication for the respondents perceiving themselves mainly
19
445
446
447
448
449
450
451
452
453
454
455
456
457
458
459
460
461
462
463
464
465
466

as collectors of data relevant to their needs. However, highly contrasting views on the
reliability of data also emerge.
5 DISCUSSION
In the following the findings presented in the previous section are used to address the
research questions.
The first component identified by the PCA seems to relate to RQ1 (whether representing
and modeling a PSS is perceived as a precondition for a meaningful estimate the cost of the
service outcomes provided). Respondents’ scores within this cluster of items suggest an
overall unfavorable disposition of the respondents towards the idea that representing and
modeling a PSS is a precondition to provide a meaningful estimate the cost of the service it
provides. In line with most academic literature, the idea of having as the point of focus for
the analysis a PSS delivering service outcomes rather than a product is still marginal.
Respondents were likely to consider the cost of providing a service via PSS and the cost of
the in-service stage of a durable product as conceptually equivalent.
The second component identified by the PCA appears to relate more closely to RQ2
(whether there is a counterpart in current cost estimating practice of the system approach
underpinning the representation and modelling of a PSS). Based on the items included in
this cluster, it seems that the term ‘systems’ is often used as a synonym for ‘product’, and
that the structure of such systems is mostly a breakdown. However, terminological
ambiguity played a major role in designing and conducting this survey, and despite the
researcher’s efforts (e.g., providing a glossary during the pilot survey) could not be entirely
eliminated.
20
467
468
469
470
471
472
473
474
475
476
477
478
479
480
481
482
483
484
485
486
487
488

From the items included in third component identified by the PCA, it seems difficult to
answer either positively or negatively to RQ3 (whether cost estimators use their knowledge
about the underpinning service delivery system along with data on product-related
features). As the analysis of the free text field showed, System Engineering methods may
be associated by the respondent to a procedural mapping, but not to the process of cost
estimating. In the absence of a non-ambiguous understanding of PSS as a particular type of
‘system’ it is difficult to evaluate the importance of representing and modeling the PSS as a
precondition to evaluating the cost of the service it provides. This ‘grey’ zone is probably
worth further investigation, especially since claims of a ‘system’ approach is common in
cost estimation, but such claims are seldom accompanied by a clear computational structure
which shows how the system nature of the phenomenon of interest affects the way cost
evaluation is carried out.
6 CONCLUSIONS AND FURTHER WORK
This paper has presented an exploratory research aimed to investigate how current cost
estimating practice relates with the idea of having as the point of focus for the analysis a
PSS delivering service outcomes, rather than a product.
Partly because the topic is in its infancy, and partly because an Internet survey has been
used, this researcher has no aspiration to make definitive, generalizable claims. The reasons
for this were discussed in the methodology section. Rather, it aimes to look for initial
patterns, ideas and hypotheses via an Internet survey.
As shown in the findings section, the scores given by the respondents to certain clusters of
questionnaire items suggest a negative answer to the three research questions. Practitioners
do not seem excessively destabilized by the concept of PSS. In line with the incumbent
21
489
490
491
492
493
494
495
496
497
498
499
500
501
502
503
504
505
506
507
508
509
510
511

trend in the academic literature, the respondents would go about a PSS in the same way
they would go about a product’s ‘in-service’ phase. Since the concept of ‘system’ is often
used as a synonym for ‘product’, it does not seem that a PSS is perceived as a system in its
own right when the aim is to evaluate cost. This suggests a tendency to understand a PSS
through the technical domain only, which reduces to the individual product component of a
PSS. Less attention is paid the broader transformation system a product partakes to.
However, the qualitative analysis of the comments revealed that the respondents were
aware that the concept of PSS links with systems engineering and potentially requires
exchange of knowledge that goes beyond mere data gathering and manipulation.
The limitations of this research are mainly due to the use of a non-statistical sampling, and
to the difficulty of avoiding non-response bias. The use of the online forms to advertise the
survey allowing participants self-selection may also raise validity concerns. These aspects
are to some extent endemic when using Internet surveys, nevertheless they considerably
reduces the possibility to generalize the research findings beyond the sample.
Despite its limitations, this research can provide impulse to the current debate by raising
awareness that inconsistencies may arise if the concept of PSS is reduced to the products
involved rather than considered as transformation system in its own right. For example, the
nature of an availability-based contract suggests that the underpinning PSS must
continuously deliver the contractually agreed service outcomes (e.g., aircraft on the apron
in a fit state to fly). A cost evaluation that is meant to support those involved in the
contract working together to achieve a common objective over time, rather than foster
tensions and litigation, should reflect the ongoing nature of the work of a PSS, and the
system nature of a PSS. There is, however, not a ready answer on how to go about it. To be
22
512
513
514
515
516
517
518
519
520
521
522
523
524
525
526
527
528
529
530
531
532
533
534

ahead of their game, therefore, practitioners may found beneficial to consider the current
challenges of representing and modeling a PSS, and how they may relate to the evaluation
of the cost of the service outcome delivered by a PSS.
LITERATURE CITED
Akintoye A, Fitzgerald E. 2000. A survey of current cost estimating practices in the UK.
Construction Management and Economics. Construction Man. & Econ. 18 (2): 161–72.
http://dx.doi.org/10.1080/014461900370799
Amos SJ, ed. 2004. Skills & knowledge of cost engineering. A continuing project of the
AACE International Education Board. Morgantown, WV: AACE International. 5th ed.
rev
BAE Systems. 2009. Availability contracting. MAS procurement handbook, Lancashire
Baines T, Lightfoot H. 2013. Made to serve. How manufacturers can compete through
servitization and product-service systems. Hoboken, N.J, Chichester: Wiley; John Wiley
[distributor]
Barnette JJ. 2007. Likert scaling. In Encyclopedia of measurement and statistics, N Salkind
(ed.). Thousand Oaks, CA: SAGE, pp. 715–19
Bartolomei JE, Hastings DE, Neufville R de, Rhodes DH. 2012. Engineering Systems
Multiple-Domain Matrix: An organizing framework for modeling large-scale complex
systems. Syst. Engin. 15 (1): 41–61
Battisti G, Stoneman P. 2010. How Innovative are UK Firms? Evidence from the Fourth
UK Community Innovation Survey on Synergies between Technological and
Organizational Innovations. Br J Management 21 (1): 187–206.
http://dx.doi.org/10.1111/j.1467-8551.2009.00629.x
23
535
536
537
538
539
540
541
542
543
544
545
546
547
548
549
550
551
552
553
554
555
556
557

Belvedere V, Grando A, Bielli P. 2013. A quantitative investigation of the role of
information and communication technologies in the implementation of a product-
service system. International Journal of Production Research 51 (2): 410–26
Best SJ, Harrison CH. 2009. Internet Survey Methods. In The SAGE handbook of applied
social research methods, L Bickman, DJ Rog (eds.). Los Angeles, London: SAGE. 2nd
ed, pp. 413–35
Best SJ, Krueger BS. 2008. Internet Survey Design. In The SAGE Handbook of Online
Research Methods, N Fielding, RM Lee, G Blank (eds.). 1 Oliver's Yard, 55 City
Road, London England EC1Y 1SP United Kingdom: SAGE Publications, Ltd, pp.
217–36
Blank G. 2008. Online Research Methods and Social Theory. In The SAGE Handbook of
Online Research Methods, N Fielding, RM Lee, G Blank (eds.). 1 Oliver's Yard, 55
City Road, London England EC1Y 1SP United Kingdom: SAGE Publications, Ltd,
pp. 537–50
Blessing LTM, Chakrabarti A. 2009. DRM, a design research methodology. Heidelberg,
London, New York: Springer
Bryman A. 2012. Social research methods. Oxford, New York: Oxford University Press.
4th ed.
BS ISO/IEC. 2002. Systems engineering. System life cycle processes: BSI
Caldwell ND, Settle V. 2011. Incentives and contracting for availability: procuring
complex performance. In Complex engineering service systems. Concepts and research,
ICL Ng, GC Parry, P Wild, D McFarlane, P Tasker (eds.). Berlin: Springer, pp. 147–60
24
558
559
560
561
562
563
564
565
566
567
568
569
570
571
572
573
574
575
576
577
578
579
Cavalieri S, Pezzotta G. 2012. Product–Service Systems Engineering. State of the art and
research challenges. Computers in Industry 63 (4): 278–88.
http://www.sciencedirect.com/science/article/pii/S0166361512000401
Charnley F, Lemon M, Evans S. 2011. Exploring the process of whole system design. Des
Stud 32 (2): 156–79.
http://www.sciencedirect.com/science/article/pii/S0142694X10000621
Coleman JSM. 2010. Principal Components Analysis. In Encyclopedia of research design,
NJ Salkind (ed.). Los Angeles [etc.]: SAGE reference
Curran R, Raghunathan S, Price M. 2004. Review of aerospace engineering cost modelling:
The genetic causal approach. Prog Aerosp Sci 40 (8): 487–534
Datta PP, Roy R. 2010. Cost modelling techniques for availability type service support
contracts. A literature review and empirical study. CIRP J. Manuf. Sci. Technol. 3 (2):
142–57
Denscombe M. 2010. The good research guide. For small-scale social research projects.
Maidenhead, England: McGraw-Hill/Open University Press. 4th ed.
Dunteman GH. 1989. Principal components analysis. Newbury Park: Sage Publications
Field A. 2005. Discovering statistics using SPSS. (and sex, drugs and rock 'n' roll). London
[etc.]: SAGE. 2nd ed.
Field F, Kirchain R, Roth R. 2007. Process cost modeling. Strategic engineering and
economic evaluation of materials technologies. JOM-J MIN MET MAT S 59 (10): 21–
32
Fielding JP. 1999. Introduction to aircraft design. Cambridge: Cambridge University Press
Fox J. 2010. polycor: Polychoric and Polyserial Correlations. R package version 0.7-8
25
580
581
582
583
584
585
586
587
588
589
590
591
592
593
594
595
596
597
598
599
600
601
602

Fricker RD. 2008. Sampling Methods for Web and E-mail Surveys. In The SAGE
Handbook of Online Research Methods, N Fielding, RM Lee, G Blank (eds.). 1 Oliver's
Yard, 55 City Road, London England EC1Y 1SP United Kingdom: SAGE
Publications, Ltd, pp. 195–217
Hart CG, He Z, Sbragio R, Vlahopoulos N. 2012. An advanced cost estimation
methodology for engineering systems. Syst. Engin. 15 (1): 28–40
Harvey J, ed. 1998. Evaluation cookbook. Edinburgh: Institute for Computer Based
Learning
Hawkins FH, Orlady HW. 1993. Human factors in flight. Aldershot: Ashgate. 2nd ed.
Hernandez-Pardo RJ. 2013. Exploring SME Perceptions of Sustainable Product Service
Systems. IEEE Transactions on Engineering Management 60 (3): 483–96
Huang X, Newnes LB, Parry GC. 2012. The adaptation of product cost estimation
techniques to estimate the cost of service. Int J Comput Integrated Manuf 25 (4-5):
417–31
Jiao J, Tseng MM. 1999. A pragmatic approach to product costing based on standard time
estimation. International Journal of Operations & Production Management 19 (7):
738–55
Keller S, Collopy P, Componation P. 2014. What is wrong with space system cost models?
A survey and assessment of cost estimating approaches. Acta Astronautica 93: 345–51.
http://www.sciencedirect.com/science/article/pii/S0094576513002464
Manfreda KL, Berzelak J, Vehovar V, Bosnjak M, Haas I. 2008. Web surveys versus other
survey modes: A meta-analysis comparing response rates. International Journal of
Market Research 50 (1): 79–104
26
603
604
605
606
607
608
609
610
611
612
613
614
615
616
617
618
619
620
621
622
623
624
625

Massart DL, Smeyers-Verbeke J, Capron X, Schlesier K. 2005. Visual Presentation of Data
by Means of Box Plots. LC●GC Europe 18 (4): 215–18
Meier H, Roy R, Seliger G. 2010. Industrial Product-Service Systems—IPS2. CIRP Ann-
Manuf. Technol. 59 (2): 607–27
Pallant J. 2010. SPSS survival manual. Maidenhead: McGraw Hill. 4th ed.
Panter AT, Swygert KA, Grant Dahlstrom W, Tanaka JS. 1997. Factor Analytic
Approaches to Personality Item-Level Data. J Pers Assess 68 (3): 561–89.
http://dx.doi.org/10.1207/s15327752jpa6803_6
Parry G. 2012. Servitisation and value co-production in the UK music industry: An
empirical study of Consumer Attitudes. International Journal of Production Economics
135 (1): 320–33
Phumbua S, Tjahjono B. 2012. Towards product-service systems modelling. a quest for
dynamic behaviour and model parameters. International Journal of Production
Research 50 (2): 425–42
R Development Core Team. 2012. R: A Language and Environment for Statistical
Computing. Vienna, Austria. http://www.R-project.org/
Roy R. 2003. Cost engineering: why, what and how? Decision Engineering Report Series,
Cranfield, UK
Roy R, Erkoyuncu JA. 2011. Service cost estimation challenges in Industrial Product-
Service Systems. In Functional thinking for value creation. Proceedings of the 3rd
CIRP International Conference on Industrial Product Service Systems, J Hesselbach, C
Herrmann (eds.). Berlin Heidelberg: Springer-Verlag, pp. 1–10
27
626
627
628
629
630
631
632
633
634
635
636
637
638
639
640
641
642
643
644
645
646
647

Serpell AF. 2004. Towards a knowledge-based assessment of conceptual cost estimates.
Build. Res. Inf. 32 (2): 157–64. http://dx.doi.org/10.1080/0961321032000172373
Settanni E, Newnes LB, Thenent NE, Parry GC, Goh YM. 2014. A Through-life costing
methodology for use in Product-Service-Systems. Int J Prod Econ 153: 161–77.
http://www.sciencedirect.com/science/article/pii/S0925527314000656
Shih T, Xitao Fan. 2008. Comparing Response Rates from Web and Mail Surveys: A Meta-
Analysis. Field Methods 20 (3): 249–71
Stewart RD. 1982. Cost estimating. New York: Wiley
Sue VM, Ritter LA. 2007. Conducting online surveys. Los Angeles: Sage Publications
Tukker A. 2013. Product services for a resource-efficient and circular economy – a review.
Journal of Cleaner Production (0).
http://www.sciencedirect.com/science/article/pii/S0959652613008135
Tukker A, Tischner U. 2006. Product-services as a research field: past, present and future.
Reflections from a decade of research. J Clean Prod 14 (17): 1552–56.
http://www.sciencedirect.com/science/article/pii/S0959652606000862
Tysseland BE. 2008. Life cycle cost based procurement decisions. Int J Proj Manag 26 (4):
366–75
Valerdi R. 2011. Heuristics for Systems Engineering Cost Estimation. Systems Journal,
IEEE. Systems Journal, IEEE DOI - 10.1109/JSYST.2010.2065131 5 (1): 91–98
Vasantha GVA, Roy R, Lelah A, Brissaud D. 2011. A review of product–service systems
design methodologies. Journal of Engineering Design 23 (9): 635–59.
http://dx.doi.org/10.1080/09544828.2011.639712
28
648
649
650
651
652
653
654
655
656
657
658
659
660
661
662
663
664
665
666
667
668
669

Vehovar V, Lozar Manfreda K. 2008. Overview: Online Surveys. In The SAGE Handbook
of Online Research Methods, N Fielding, RM Lee, G Blank (eds.). 1 Oliver's Yard, 55
City Road, London England EC1Y 1SP United Kingdom: SAGE Publications, Ltd,
pp. 176–95
Vogt WP. 2005. Dictionary of Statistics & Methodology. Thousand Oaks, CA: SAGE
Publications, Inc. 3rd
Wang G, Valerdi R, Roedler GJ, Ankrum A, Gaffney JE. 2012. Harmonising software
engineering and systems engineering cost estimation. Int J Comput Integrated Manuf 25
(4-5): 432–43
Watkins MW. 2006. Determining Parallel Analysis Criteria. Journal of Modern Applied
Statistical Methods 5 (2): 344–46. http://edpsychassociates.com/Papers/ParallelAnalysis
%282007%29.pdf
Weems G. 2007. Reverse scaling. In Encyclopedia of measurement and statistics, N
Salkind (ed.). Thousand Oaks, CA: SAGE, pp. 844–47
29
670
671
672
673
674
675
676
677
678
679
680
681
682
683

APPENDIX I
Online questionnaire
Q01
Consider a new military aircraft program. To estimate the cost of such a program, a rich dataset of previous programs, the features of the products delivered, and their cost is indispensable.
Q02
The techniques to estimate the cost of a “system” and the techniques to represent such a system formally (for example British Standard 15228:2002 - “System Engineering”, IDEF0, UML, Petri Networks, Influence diagrams, Service Blueprints, etc.) are used separately and do not affect each other.
Q03
The cost of a Product Service System can NOT be estimated in the absence of DATA about SERVICES previously delivered, their features and cost. For example, the cost of providing aircraft availability cannot be estimated without historical data about maintenance, repair etc.
Q04
When estimating the through-life cost of a PRODUCT at the early design stage you consider that the manufacturing, sustaining, using and disposing of that product are systems of activities linked with each other.
Q05
You believe that in the absence of specific expertise within the service-providing organization historical data alone is not enough to gain insight into the service delivered and its cost.
Q06
Consider a hypothetical Product-Service-System (PSS) delivering a number of dried hands by means of a hand dryer. If, in the early stage you have access to a formal representation of that PSS - e.g., IDEF0, Service Blueprint etc. - you will choose NOT to infer its cost from the available historical datasets about say, generic hand dryers.
Q07
In order to generate cost estimates which are useful for decision making the cost engineer should be continuously involved in the evolving understanding of the system investigated – e.g., how a service is supposed to be delivered, how a product is meant to be used/operated, who is supposed to do what, how they interact etc.
Q08
At the early design stage there is no other feasible way to estimate the cost of a new product than inferring it statistically from the features and cost of existing products.
Q09
Assume that the delivery of a number of “dried pairs of hands” over a certain period is a Product-Service-System (PSS). To estimate the cost of such a PSS is NOT to estimate the cost of e.g., a hand dryer (a product) and, separately that of its expected maintenance/repair (a service) over that period.
Q10
To estimate the cost of a system means to estimate the cost of a long-life product (aircraft, car etc.) by HIERARCHICALLY breaking it down into its components (sub-systems).
Q11
To best estimate the cost of a service you WILL NOT consider such a service as being a system of interlinked activities performed by both the service provider and the service receiver.
Q12
When you estimate the cost of a new PRODUCT from existing products you expect to RETRIEVE (e.g. from a handbook, ask an expert, browse a database) the latter’s cost and any other measurable feature you need.
Q13
The cost of a service can be inferred from measurable features of such service. For example, if the service is “machine repair”, such features include the distance between the machine provider and the customer, number of call outs for repair services etc.
Q14
If the object of cost estimation is a Product Service System – not an individual product or service – then the transparent and regular integration of system modeling with cost estimation is crucial in order to improve usefulness of a cost estimate for decision making.
Q15
In estimating the through life cost of a product, its performance through-life can be studied through selected “designed-in” features, such as Mean Time Between Failures, Mean Time To Repair, etc.
Q16
The through-life cost of a Product Service System (e.g., selling painted car bodies instead of a painting line), can be determined by selected characteristics of the PRODUCT involved (e.g., the painting line) such as its failure rates, mean time to repair, availability of spares etc.
Q17
The use of different cost estimation techniques (e.g., parametric, analytical, etc.) is required for different life cycle stages in order to estimate the cost of a product through-life (e.g., design, production, utilization etc.).
1
684

Online questionnaire
Q18
Please select what you think are the most important aspects for selecting the cost estimating techniques to be used at each stage.
1. Availability of data2. Ability to represent the system formally (e.g., by means of networks, Service Blueprints, etc.)3. Ease of use of techniques and software4. Availability of software packages5. Computations follow well-known mathematical rules e.g., regression etc.6. Familiarity with the technique7. Acceptance of the technique within organizations8. No opinion
Q19
Assume that cost estimates for different lifecycle stages of a product have been obtained using different techniques (parametric, activity-based costing, case-based reasoning). These figures are hardly comparable (e.g., for validation purposes) because each technique used is based on different assumptions, logics and computational mechanisms.
Q20
The claim that most of the through-life cost of a product (say for example between 65-85%) is “locked-in” at the early design stages is an assumption with little or no practical evidence.
Q21
Most of (say e.g., 65-85%) the through-life cost of a Product Service System (PSS) is locked-in at the PRODUCT design stage. So if the Product Service System is e.g., the provision of the availability of an aircraft, most of its through-life cost is locked-in when the aircraft is designed.
Q22
The claim that most of a product’s life-cycle cost (65-85%) is locked-in at the design stage shifts the entire focus of cost reduction on product design, neglecting the actions that can be taken at other stages.
Q23
Because a great portion (say 65-85%) of a long-life product (e.g., aircraft) through-life cost OCCURS while in-service, it is justified to focus on that stage when estimating costs through-life, and take the cost of other stages (e.g., manufacturing) as given.
Q24
When estimating the cost of a “system” NOT ONLY do you identify multiple organized elements (either tangible as e.g., the engines, avionics, fuselage, etc. of an aircraft or intangible as e.g., activities), BUT you ALSO specify how they interact to accomplish a specific purpose.
2

Table 1 Descriptive statistics
Q01Q02 Q03 Q0
4_RQ05_R
Q06_R
Q07_R
Q08 Q09_R
Q10 Q11Q12 Q13 Q14
_R
Q15 Q16 Q17 Q19
_RQ20_R
Q21 Q22
_R
Q23 Q24
_RObservations
Valid 127 126 120 118 117 111 108 108 106 104 104 103 101 99 99 98 98 98 98 98 98 97 97Missing 11 12 18 20 21 27 30 30 32 34 34 35 37 39 39 40 40 40 40 40 40 41 41
Frequency
1 40.2 2.4 12.
5 0 0 2.7 0 3.7 5.7 22.1 1.0 18.
413.
9 1.0 22.2
11.2
32.7 7.1 11.
213.
34.1 6.2 1.0
2 44.1
14.3
35.8 6.8 9.4 41.
4 4.6 38.0
30.2
53.8
20.2
62.1
67.3 0 63.
662.
251.
045.
927.
653.
130.
622.
76.2
3 10.2
40.5
10.8 8.5 15.
429.
7 1.9 16.7
27.4
13.5
20.2 9.7 12.
916.
211.
114.
311.
215.
333.
724.
517.
320.
614.
44 4.7 34.
135.
855.
954.
723.
436.
133.
330.
2 9.6 41.3 8.7 5.9 62.
6 2.0 11.2 5.1 24.
523.
5 8.2 39.8
36.1
63.9
5 .8 8.7 5.0 28.8
20.5 2.7 57.
4 8.3 6.6 1.0 17.3 1.0 0 20.
2 1.0 1.0 0 7.1 4.1 1.0 8.2 14.4
14.4
Median 2.0 3.0 3.0 4.0 4.0 3.0 5.0 3.0 3.0 2.0 4.0 2.0 2.0 4.0 2.0 2.0 2.0 2.0 3.0 2.0 3.0 4.0 4.0
Mode 2.0 3.0 2a 4.0 4.0 2.0 5.0 2.0 2.00 2.0 4.0 2.0 2.0 4.0 2.0 2.0 2.0 2.0 3.0 2.0 4.0 4.0 4.0
Inter Quartile Range 1.0 1.0 2.0 1.0 0.5 2.0 1.0 2.0 2.0 0.0 1.0 0.0 0.0 0.0 0.0 1.0 1.0 2.0 2.0 1.0 2.0 2.0 0.0
3
685

Table 2 Components interpretation and scale reliability
Component
Underlying topicsItems included
Chronbach’s Alpha
1 Disposition toward adaptation of feature-centered methods in cost estimations (favorable scores less)
Q01**; Q12; Q13; Q15; Q16; Q17*
.629
2 Disposition toward system understanding through reduction/isolation (favorable scores less)
Q02; Q03; Q04_R**; Q07_R; Q08; Q10**; Q11; Q14_R**; Q23
.626
3 Disposition toward endorsing common practice and assumptions in cost estimation (favorable scores less)
Q05_R; Q06_R; Q09_R; Q19_R*; Q20_R**; Q22_R; Q24_R;
.594
Note: * = loading below .512; ** = loading below .4
4
686
687

Table 1. Summary of free text responses
Percentage of respondents leaving at least one comment 61%Number of comments analyzed 265Number of comment per topic
Feature-based approachSystem understanding by reductionEndorsement of common practices
768880
5
688
689

Disciplines involved in cost estimation
Statistics
Accounting
Engineering
Mathematics
Economics
Industrial Management
Conceptual Design Tools
Aerodynamic Modelling inc.
CFD
Structural Modelling inc. FEM
Systems Modelling
Reliability and Maintainability
Modelling
Aircraft Operational Simulation Modelling
Manufacturing Modelling
Flight Simulation Modelling
Engineering
Figure 1 Interdisciplinary aspect of cost engineering using aircraft as an example (based on (Fielding, 1999, Curran, Raghunathan & Price, 2004) and (Stewart, 1982))
6
690
691

9.8%
31.1%
23.5%
23.5%
12.1%
0.0% 10.0% 20.0% 30.0% 40.0%
61 or more
51 to 60
41 to 50
31 to 40
less than 30
Age range
Count of Respondent
14.4%
85.6%
0.0% 20.0% 40.0% 60.0% 80.0% 100.0%
Female
Male
Gender
Count of Respondent
5.38%
14.62%
18.46%
61.54%
0.00% 10.00% 20.00% 30.00% 40.00% 50.00% 60.00% 70.00%
Less than 2
2 to 5
6 to 10
More than 10
Expertise
Count of Respondent
(a) (b) (c)
2.3%
0.0% 0.0% 0.0% 0.0% 0.0% 0.0% 0.0% 0.0% 0.0% 0.0% 0.0%0.8%
0.8%
0.0% 0.0% 0.0% 0.0% 0.0% 0.0% 0.0% 0.0% 0.0% 0.0% 0.0%0.0%
2.3%
0.0% 0.0%1.5%
0.0% 0.0% 0.0% 0.0% 0.0% 0.0% 0.0% 0.0%0.0%
0.8%
0.0% 0.0%
0.0%
0.0% 0.0% 0.0% 0.0% 0.0% 0.0% 0.0% 0.0%0.0%
0.8%
0.0% 0.0%
0.0%
0.0% 0.0% 0.0% 0.0% 0.0% 0.0% 0.0% 0.0%0.0%
0.8%
0.0% 0.0%
0.0%
0.0% 0.0% 0.0% 0.0% 0.0% 0.0% 0.0% 0.0%0.0%
0.8%
0.0% 0.0%
0.0%
0.0% 0.0% 0.0% 0.0% 0.0% 0.0% 0.0% 0.0%0.0%
1.5%
0.0% 0.0%
1.5%
0.0% 0.0% 0.0% 0.0%0.8%
0.0% 0.0% 0.0%0.0%
0.0%
0.0% 0.0%
0.0%
0.0% 0.0% 0.0% 0.0%0.0%
0.0%0.8%
0.0%0.0%
0.8%
0.0% 0.0%
0.0%
0.0% 0.0% 0.0% 0.0%0.0%
0.0%0.0%
0.0%0.0%
0.8%
0.0% 0.0%
0.0%
0.0% 0.0% 0.0% 0.0%0.0%
0.0%0.0%
0.0%0.0%
1.5%
1.5%
15.4%
0.8%
0.8% 0.8%
23.1%
3.1%
16.2%
3.8% 3.1%
0.8%
12.3%
0.0%
5.0%
10.0%
15.0%
20.0%
25.0%
other Real estate activities Professional, scientificand technical activities
Other service activities Mining and quarrying Financial andinsurance activities
Manufacturing Information andcommunication
Construction Education (includesUniversity)
Electricity, gas, steamand air conditioning
supply
Water supply;sewerage, wastemanagement and
remediation activities
Public administrationand
defence;compulsorysocial security
Aerospace Cost estimating and risk for the process industries Defence contracting & engineering Engineering
Green energy provider Naval Shipbuilding and Commercial Ship Repair Oil & Gas, Mining and Defence Oil and gas
Power and Process Industry R&D Television software Not further specified
Sector specify: homogenisation
Sector
Count of Respondent
(d)Figure 2 Respondents information: (a) age; (b) gender; (c) expertise; (d) sector
7
692

90.8%
42.9%35.7%
19.4%
29.6%
48.0%43.9%
4.1%
9.2%
57.1%64.3%
80.6%
70.4%
52.0%56.1%
95.9%
0%
10%
20%
30%
40%
50%
60%
70%
80%
90%
100%
Availability of data Ability to representthe system formally(e.g., by means ofnetworks, ServiceBlueprints, etc.)
Ease of use oftechniques and
software
Availability ofsoftware packages
Computations followwell-known
mathematical rulese.g., regression etc.
Familiarity with thetechnique
Acceptance of thetechnique within
organizations
No opinion
Picked up Not picked up
Figure 3: Answer to the 'select all that apply' question
8
693
694

Figure 4 Box plots for each items in the questionnaire. Points are outliers, asterisks are extreme outliers. Numbers indicate the respondents who are outliers.
9
695
696
697

Critical
Data
Enthusiastic“Why would you not use an available data set?”
“Once you have data the rest is easy […]”
“Any metric or parameter and its know[n] relationship with cost is always welcome”
“[…] I never turn away data!”
“Historical data is absolutely necessary […]”
“Data is essential.”
“You need insight into the nature of the service to understand what will drive the cost. Historical data alone won't give that insight.”
“Legacy data should not be relied upon […]”
“The use of a rich dataset (i.e. parametrics) is not always necessary or accurate. Experience based factualization of the dataset is essential otherwise the dataset is just statistics that can be manipulated to any desired answer.”
Availability
Quality of the cost estimate
Impacts on
Attitude towards Attitude towards
System understanding
Impacts on
Fig. 1. Concepts derived from the core concept “data”, showing different attitudes and the link to the quality of a cost estimate
10
698
699
700
701