TFL 25 Timber Supply Analysis - British Columbia · Timber Supply Analysis MANAGEMENT PLAN 10 March...
120
Tree Farm Licence 25 Timber Supply Analysis MANAGEMENT PLAN 10 March 2003 R. Paul Bavis, R.P.F Regional Forester Western Forest Products Limited
Transcript of TFL 25 Timber Supply Analysis - British Columbia · Timber Supply Analysis MANAGEMENT PLAN 10 March...

Tree Farm Licence 25
Timber Supply Analysis
MANAGEMENT PLAN 10
March 2003
R. Paul Bavis, R.P.F Regional Forester Western Forest Products Limited

TFL 25 - Timber Supply Analysis Page i
Executive Summary
This analysis examines timber supply projections for Tree Farm Licence 25, which is comprised
of five administrative units. Two are located on Vancouver Island at Jordan River (Block 1) and
Naka Creek (Block 3). Two are on the Mainland coast at Loughborough Inlet (Block 2) and
Swanson Bay (Block 5) and the fifth is on Moresby Island (Block 6) in Haida Gwaii.
Complan 3.0, a spatially-explicit harvest model, was used to simulate current management
practices for protection and maintenance of ecological values and to estimate the residual
timber potential through the year 2252.
After allowances for non-recoverable losses, the simulation of current management practice as
agreed and set out in the associated information package suggests the following area-based
AAC by block for the term of the proposed management plan:
Block Location AAC (hectares)
1 Jordan River 290
2 Loughborough Inlet 123
3 Naka Creek 87
5 Central Coast 491
6 Haida Gwaii 251
Total 1,242
The proposed harvest levels should accommodate ecological concerns in the short and longer
terms. The simulation suggests that a minimum of 124,600 ha (46% of productive forest) will be
maintained in older forests (>140 yrs) and a minimum 64,000,000 m3 of merchantable growing
stock will be retained throughout the 250-year simulation horizon. These forests are expected

TFL 25 - Timber Supply Analysis Page ii
to contribute significantly to biodiversity conservation and complement protected areas
(~240,800 ha) adjacent to the Tree Farm Licence. The timber flowing from the proposed
harvests would be sufficient to maintain existing people and communities dependent on
harvesting and forest management in the short term, and may allow for an expansion in the
future.
The analysis suggests that with time, timber volumes realized from this fixed harvest area will
begin to increase as will stand ages, standing volume, and associated environmental values.
Projections of cedar harvest and availability suggest that these species remain available for
cultural and commercial uses throughout the simulation.
Sensitivity analyses suggest that the current management simulation is sensitive to land base
and minimum harvest age changes. Policies that change either or both of these parameters
may have significant impacts on area and volume harvest levels.

TFL 25 - Timber Supply Analysis Page iii
TABLE OF CONTENTS
EXECUTIVE SUMMARY ......................................................................................................................................I
1.0 INTRODUCTION.........................................................................................................................................1 1.1 PURPOSE...................................................................................................................................................1 1.2 OBJECTIVES...............................................................................................................................................1 1.3 TIMBER SUPPLY MODEL..............................................................................................................................2
2.0 CURRENT MANAGEMENT OR BASE CASE...........................................................................................3
3.0 BLOCK 1 ANALYSIS (JORDAN RIVER)...................................................................................................7 3.1 CURRENT MANAGEMENT – 292 HA/YEAR.....................................................................................................7 3.2 ALTERNATE HARVEST LEVELS...................................................................................................................13 3.3 SENSITIVITY ANALYSES.............................................................................................................................15
4.0 BLOCK 2 ANALYSIS (STAFFORD-APPLE-HEYDON) ..........................................................................17 4.1 CURRENT MANAGEMENT - 124 HA/YEAR ...................................................................................................17 4.2 ALTERNATE HARVEST LEVELS...................................................................................................................23 4.3 SENSITIVITY ANALYSES.............................................................................................................................25
5.0 BLOCK 3 ANALYSIS (NAKA) .................................................................................................................27 5.1 CURRENT MANAGEMENT - 88 HA/YEAR......................................................................................................27 5.2 ALTERNATE HARVEST LEVELS...................................................................................................................33 5.3 SENSITIVITY ANALYSES.............................................................................................................................35
6.0 BLOCK 5 ANALYSIS (CENTRAL COAST) .............................................................................................37 6.1 CURRENT MANAGEMENT ..........................................................................................................................37 6.2 ALTERNATE HARVEST LEVELS...................................................................................................................44 6.3 SENSITIVITY ANALYSES.............................................................................................................................46
7.0 BLOCK 6 ANALYSIS (HAIDA GWAII).....................................................................................................48 7.1 CURRENT MANAGEMENT - 254 HA/YEAR ...................................................................................................48 7.2 ALTERNATE HARVEST LEVELS...................................................................................................................54 7.3 SENSITIVITY ANALYSES.............................................................................................................................56
8.0 ANALYSIS OF COMBINED BLOCKS .....................................................................................................59
9.0 MARGINALLY ECONOMIC OPPORTUNITY ..........................................................................................59
10.0 CULTURAL CEDAR SUPPLY..................................................................................................................60
11.0 UNCERTAINTIES .....................................................................................................................................63
12.0 RECOMMENDATIONS.............................................................................................................................67

TFL 25 - Timber Supply Analysis Page iv
List of Tables TABLE 1. CURRENT MANAGEMENT HARVEST SUMMARY ....................................................................... 6 TABLE 2. BLOCK 1 SENSITIVITY RESULTS ......................................................................................... 16 TABLE 3. BLOCK 2 SENSITIVITY RESULTS ......................................................................................... 26 TABLE 4. BLOCK 3 SENSITIVITY RESULTS......................................................................................... 36 TABLE 5. BLOCK 5 SENSITIVITY RESULTS ......................................................................................... 47 TABLE 6. BLOCK 6 SENSITIVITY RESULTS ......................................................................................... 57 TABLE 7. POTENTIAL PERIODIC HARVESTS OF MARGINALLY-INOPERABLE POLYGONS......................... 60 TABLE 8. ESTIMATED LARGER DIAMETER (≥ 70 CM) CEDAR TREES AVAILABLE THROUGH 2252............. 62 TABLE 9. ANNUAL AREA HARVEST SUMMARY ................................................................................. 103 TABLE 10. CHANGE IN ANNUAL AREA HARVEST SUMMARY.............................................................. 104 TABLE 11. PERCENTAGE CHANGE IN ANNUAL AREA HARVEST SUMMARY......................................... 105 TABLE 12. VOLUME HARVEST SUMMARY........................................................................................ 106 TABLE 13. SIMULATION RUN LABELS AND DESCRIPTIONS................................................................ 108
List of Figures FIGURE 1. AREA HARVEST (BACKGROUND BANDS) AND PREDICTED VOLUME FLOW (LINES) TO 2252 FOR
EACH BLOCK UNDER CURRENT MANAGEMENT ................................................................... 5 FIGURE 2. BLOCK 1 CURRENT MANAGEMENT HARVEST STATISTICS THROUGH 250 YEARS .................... 7 FIGURE 3. AGE CLASS PROGRESSION ON BLOCK 1 THLB (+ TOTAL FORESTED) FOR CURRENT
MANAGEMENT THROUGH 250 YEARS................................................................................ 8 FIGURE 4. MERCHANTABLE GROWING STOCK ON TOTAL BLOCK 1 LAND BASE THROUGH 250 YEARS ...... 9 FIGURE 5. MERCHANTABLE GROWING STOCK ON BLOCK 1 THLB THROUGH 250 YEARS ..................... 10 FIGURE 6. AGE-GROUP AREAS FOR BLOCK 1 TOTAL LAND BASE THROUGH 250 YEARS........................ 11 FIGURE 7. MERCHANTABLE GROWING STOCK IN HARVESTABLE (>MDBHQ) STANDS THROUGH 250 YEARS
FOR BLOCK 1................................................................................................................ 12 FIGURE 8. BLOCK 1 HARVEST STATISTICS THROUGH 250 YEARS FOR CURRENT MANAGEMENT AREA
HARVEST PLUS 10%...................................................................................................... 14 FIGURE 9. BLOCK 1 HARVEST STATISTICS THROUGH 250 YEARS FOR CURRENT MANAGEMENT AREA
HARVEST LESS 10%...................................................................................................... 15 FIGURE 10. BLOCK 2 CURRENT MANAGEMENT HARVEST STATISTICS THROUGH 250 YEARS ................. 17 FIGURE 11. AGE CLASS PROGRESSION ON BLOCK 2 THLB (+ TOTAL FORESTED) FOR CURRENT
MANAGEMENT THROUGH 250 YEARS.............................................................................. 18 FIGURE 12. MERCHANTABLE GROWING STOCK ON TOTAL BLOCK 2 LAND BASE THROUGH 250 YEARS .. 19 FIGURE 13. MERCHANTABLE GROWING STOCK ON BLOCK 2 THLB THROUGH 250 YEARS ................... 20 FIGURE 14. AGE-GROUP AREAS FOR BLOCK 2 TOTAL LAND BASE THROUGH 250 YEARS....................... 21 FIGURE 15. MERCHANTABLE GROWING STOCK IN HARVESTABLE (>MDBHQ) STANDS THROUGH 250 YEARS
FOR BLOCK 2................................................................................................................ 22 FIGURE 16. BLOCK 2 HARVEST STATISTICS THROUGH 250 YEARS FOR CURRENT MANAGEMENT AREA
HARVEST PLUS 10%...................................................................................................... 24 FIGURE 17. BLOCK 2 HARVEST STATISTICS THROUGH 250 YEARS FOR CURRENT MANAGEMENT AREA
HARVEST LESS 10%...................................................................................................... 25 FIGURE 18. BLOCK 3 CURRENT MANAGEMENT HARVEST STATISTICS THROUGH 250 YEARS ................. 27 FIGURE 19. AGE CLASS PROGRESSION ON BLOCK 3 THLB (+ TOTAL FORESTED) FOR CURRENT
MANAGEMENT THROUGH 250 YEARS.............................................................................. 28

TFL 25 - Timber Supply Analysis Page v
FIGURE 20. MERCHANTABLE GROWING STOCK ON TOTAL BLOCK 3 LAND BASE THROUGH 250 YEARS .. 30 FIGURE 21. MERCHANTABLE GROWING STOCK ON BLOCK 3 THLB THROUGH 250 YEARS ................... 30 FIGURE 22. AGE-GROUP AREAS FOR BLOCK 3 TOTAL LAND BASE THROUGH 250 YEARS ...................... 31 FIGURE 23. MERCHANTABLE GROWING STOCK IN HARVESTABLE (>MDBHQ) STANDS THROUGH 250 YEARS
FOR BLOCK 3................................................................................................................ 32 FIGURE 24. BLOCK 3 HARVEST STATISTICS THROUGH 250 YEARS FOR CURRENT MANAGEMENT AREA
HARVEST PLUS 10%...................................................................................................... 34 FIGURE 25. BLOCK 3 HARVEST STATISTICS THROUGH 250 YEARS FOR CURRENT MANAGEMENT AREA
HARVEST LESS 10%...................................................................................................... 35 FIGURE 26. BLOCK 5 CURRENT MANAGEMENT HARVEST STATISTICS THROUGH 250 YEARS ................ 37 FIGURE 27. AGE CLASS PROGRESSION ON BLOCK 5 THLB (+ TOTAL FORESTED) FOR CURRENT
MANAGEMENT THROUGH 250 YEARS.............................................................................. 39 FIGURE 28. MERCHANTABLE GROWING STOCK ON TOTAL BLOCK 5 LAND BASE THROUGH 250 YEARS .. 40 FIGURE 29. MERCHANTABLE GROWING STOCK ON BLOCK 5 THLB THROUGH 250 YEARS ................... 41 FIGURE 30. AGE-GROUP AREAS FOR BLOCK 5 TOTAL LAND BASE THROUGH 250 YEARS ...................... 42 FIGURE 31. MERCHANTABLE GROWING STOCK IN HARVESTABLE (>MDBHQ) STANDS THROUGH 250 YEARS
FOR BLOCK 5................................................................................................................ 43 FIGURE 32. BLOCK 5 CURRENT MANAGEMENT WITH CANDIDATE PROTECTION AREAS EXCLUDED - HARVEST
STATISTICS THROUGH 250 YEARS.................................................................................. 44 FIGURE 33. BLOCK 5 HARVEST STATISTICS THROUGH 250 YEARS FOR CURRENT MANAGEMENT AREA
HARVEST PLUS 10%...................................................................................................... 45 FIGURE 34. BLOCK 5 HARVEST STATISTICS21 THROUGH 250 YEARS FOR CURRENT MANAGEMENT AREA
HARVEST LESS 10%...................................................................................................... 46 FIGURE 35. BLOCK 6 CURRENT MANAGEMENT HARVEST STATISTICS THROUGH 250 YEARS ................ 48 FIGURE 36. AGE CLASS PROGRESSION ON BLOCK 6 THLB (+ TOTAL FORESTED) FOR CURRENT
MANAGEMENT THROUGH 250 YEARS.............................................................................. 50 FIGURE 37. MERCHANTABLE GROWING STOCK ON TOTAL BLOCK 6 LAND BASE THROUGH 250 YEARS .. 51 FIGURE 38. MERCHANTABLE GROWING STOCK ON BLOCK 6 THLB THROUGH 250 YEARS ................... 52 FIGURE 39. AGE-GROUP AREAS FOR BLOCK 6 TOTAL LAND BASE THROUGH 250 YEARS ...................... 52 FIGURE 40. MERCHANTABLE GROWING STOCK IN HARVESTABLE (>MDBHQ) STANDS THROUGH 250 YEARS
FOR BLOCK 6................................................................................................................ 53 FIGURE 41. BLOCK 6 HARVEST STATISTICS THROUGH 250 YEARS FOR CURRENT MANAGEMENT AREA
HARVEST PLUS 10%...................................................................................................... 55 FIGURE 42. BLOCK 6 HARVEST STATISTICS THROUGH 250 YEARS FOR CURRENT MANAGEMENT AREA
HARVEST LESS 10%...................................................................................................... 56 FIGURE 43. PROJECTED CEDAR HARVEST BY BLOCK THROUGH 250 YEARS. ....................................... 61 FIGURE 44. CEDAR GROWING STOCK AND ANNUAL HARVEST VOLUMES THROUGH 250 YEARS. ............ 62 FIGURE 45. BLOCK 1 CMA +OE ...................................................................................................... 70 FIGURE 46. BLOCK 1 CMA –OH ...................................................................................................... 70 FIGURE 47. BLOCK 1 CMA –SI3M ................................................................................................... 71 FIGURE 48. BLOCK 1 CMA -AGE...................................................................................................... 71 FIGURE 49. BLOCK 1 CMA +AGE..................................................................................................... 72 FIGURE 50. BLOCK 1 CMA –RNDAGE.............................................................................................. 72 FIGURE 51. BLOCK 1 CMA-MIDVQ .................................................................................................. 73 FIGURE 52. BLOCK 1 CMA UNCON ................................................................................................. 73 FIGURE 53. BLOCK 1 CMA +AGEX2 ................................................................................................ 74 FIGURE 54. BLOCK 1 CMA –AGEX2 ................................................................................................ 74 FIGURE 55. BLOCK 1 CMV (VOLUME REGULATED) ........................................................................... 75 FIGURE 56. BLOCK 2 CMA +OE ...................................................................................................... 76 FIGURE 57. BLOCK 2 CMA -OH....................................................................................................... 76

TFL 25 - Timber Supply Analysis Page vi
FIGURE 58. BLOCK 2 CMA –SI3M ................................................................................................... 77 FIGURE 59. BLOCK 2 CMA -AGE...................................................................................................... 77 FIGURE 60. BLOCK 2 CMA +AGE..................................................................................................... 78 FIGURE 61. BLOCK 2 CMA -RNDAGE .............................................................................................. 78 FIGURE 62. BLOCK 2 CMA -MIDVQ.................................................................................................. 79 FIGURE 63. BLOCK 2 CMA +BEO ................................................................................................... 79 FIGURE 64. BLOCK 2 CMA -OC....................................................................................................... 80 FIGURE 65. BLOCK 2 CMA UNCON ................................................................................................. 80 FIGURE 66. BLOCK 2 CMA -HRULES ............................................................................................... 81 FIGURE 67. BLOCK 2 CMV (VOLUME REGULATED) ........................................................................... 81 FIGURE 68. BLOCK 3 CMA +OE ...................................................................................................... 82 FIGURE 69. BLOCK 3 CMA -OH....................................................................................................... 82 FIGURE 70. BLOCK 3 CMA –SI3M ................................................................................................... 83 FIGURE 71. BLOCK 3 CMA -AGE...................................................................................................... 83 FIGURE 72. BLOCK 3 CMA +AGE..................................................................................................... 84 FIGURE 73. BLOCK 3 CMA -RNDAGE .............................................................................................. 84 FIGURE 74. BLOCK 3 CMA -MIDVQ ................................................................................................. 85 FIGURE 75. BLOCK 3 CMA UNCON ................................................................................................. 85 FIGURE 76. BLOCK 3 CMV (VOLUME REGULATED) ........................................................................... 86 FIGURE 77. BLOCK 5 CMA +OE ...................................................................................................... 87 FIGURE 78. BLOCK 5 CMA -OH....................................................................................................... 87 FIGURE 79. BLOCK 5 CMA –SI3M ................................................................................................... 88 FIGURE 80. BLOCK 5 CMA -AGE...................................................................................................... 88 FIGURE 81. BLOCK 5 CMA +AGE..................................................................................................... 89 FIGURE 82. BLOCK 5 CMA -RNDAGE .............................................................................................. 89 FIGURE 83. BLOCK 5 CMA -PA....................................................................................................... 90 FIGURE 84. BLOCK 5 CMA -PA -OA................................................................................................ 90 FIGURE 85. BLOCK 5 CMA -MIDVQ ................................................................................................. 91 FIGURE 86. BLOCK 5 CMA +BEO ................................................................................................... 91 FIGURE 87. BLOCK 5 CMA –SSSIEST.............................................................................................. 92 FIGURE 88. BLOCK 5 CMA UNCON ................................................................................................. 92 FIGURE 89. BLOCK 5 CMA –PA –SI3M............................................................................................ 93 FIGURE 90. BLOCK 5 CMA –PA -AGE.............................................................................................. 93 FIGURE 91. BLOCK 5 CMA –PA +AGE ............................................................................................. 94 FIGURE 92. BLOCK 5 CMA –PA -RNDAGE....................................................................................... 94 FIGURE 93. BLOCK 5 CMA –PA -MIDVQ.......................................................................................... 95 FIGURE 94. BLOCK 5 CMA –PA +BEO............................................................................................ 95 FIGURE 95. BLOCK 5 CMA –PA -SSSIEST....................................................................................... 96 FIGURE 96. BLOCK 5 CMV (VOLUME REGULATED) ........................................................................... 96 FIGURE 97. BLOCK 6 CMA +OE ...................................................................................................... 97 FIGURE 98. BLOCK 6 CMA -OH....................................................................................................... 97 FIGURE 99. BLOCK 6 CMA –SI3M ................................................................................................... 98 FIGURE 100. BLOCK 6 CMA -AGE.................................................................................................... 98 FIGURE 101. BLOCK 6 CMA +AGE................................................................................................... 99 FIGURE 102. BLOCK 6 CMA -RNDAGE ............................................................................................ 99 FIGURE 103. BLOCK 6 CMA -MIDVQ ............................................................................................. 100 FIGURE 104. BLOCK 6 CMA -OC................................................................................................... 100 FIGURE 105. BLOCK 6 CMA UNCON ............................................................................................. 101 FIGURE 106. BLOCK 6 CMA -DR ................................................................................................... 101 FIGURE 107. BLOCK 6 -HRULES.................................................................................................... 102

TFL 25 - Timber Supply Analysis Page vii
FIGURE 108. BLOCK 6 CMV (VOLUME REGULATED) ....................................................................... 102 FIGURE 109. TEST ESTIMATE OF CULTURAL CEDAR AVAILABILITY FOR TFL 25 THROUGH 250 YEARS.110
List of Appendices APPENDIX V-A HARVEST STATISTICS FOR SIMULATION RUNS .............................................................69
APPENDIX V-B CHANGE SUMMARIES FOR SIMULATION RUNS ............................................................103
APPENDIX V-C DESCRIPTION OF SIMULATION RUNS ............................................................................108
APPENDIX V-D MODELING FOR CULTURAL CEDAR................................................................................109

TFL 25 - Timber Supply Analysis Page viii
Acknowledgements David Byng, R.P.F. prepared yield tables, performed GIS analysis and inventory preparation,
and set up model parameters. Mike Landers, R.P.F. assisted and established base case runs,
performed many sensitivity analyses, and prepared dozens of output graphs. David and Mike
also provided many valuable editorial comments and interpretations of model outputs. Jim
Wilson of Timberline Forest Inventory Consultants analysed historic cruise data to estimate
cedar diameter distributions.

TFL 25 - Timber Supply Analysis Page 1
1.0 Introduction
1.1 Purpose
Tree Farm Licence 25 is located in coastal British Columbia and consists of five
independent blocks encompassing 480,149 hectares, of which 138,078 hectares
are considered available for long term timber production. The TFL was
established in 1958 with the intent of maintaining a sustainable harvest level
indefinitely. Since that time the AAC has been re-determined periodically and
more recently at five-year intervals. This report provides the technical basis for
re-determination of the AAC.
1.2 Objectives
The primary objective of this report is to estimate achievable and sustainable
annual area harvests and associated timber flows for the consideration of the
Provincial Chief Forester in making his determination of Allowable Annual Cut for
the term of Management Plan 10. More specifically the timber supply model is to
be programmed to ensure the following primary objectives:
1. Non-timber values such as fish and wildlife habitat, biodiversity,
recreation, visual quality, and terrain stability are to be given priority over
timber. Protection of non-timber values will be satisfied by land base
removals, yield net downs and/or by maintaining a percentage of
polygons in older stands.
2. Annual harvest area is to be derived as a residual after non-timber values
are accommodated. The proposed harvest level will consider harvestable
inventory, growth potential of present and future stands, silvicultural
treatments, potential timber losses, operational and legislative
constraints.
3. Annual area harvested is held constant throughout the 250-year time
horizon of the simulation.

TFL 25 - Timber Supply Analysis Page 2
Secondary objectives include:
4. Estimation of growing stock and age class changes through time as a
coarse gauge of future habitat supply.
5. Evaluation of the impacts of and effectiveness of existing and alternative
forest policies and land uses.
6. Identification of potential silvicultural or other interventions that may have
social and/or ecological benefit.
7. Identification of data, inventory, or modelling uncertainties or
shortcomings that may, if reduced or eliminated in future, significantly
improve model predictions.
1.3 Timber Supply Model
Timber supply simulations were completed with Complan 3.2006 software
developed by Olympic Resource Management and predecessors and currently
owned by Timberline Forest Inventory consultants. Complan is a spatially-explicit
supply model and is described in more detail in the associated information
package (MP 10, Appendix IV, section 4.1)
The inventory database was current to January 1, 2001 and the simulation was
set up to include a one-year initial harvest period to force actual 2001 harvesting
to bring the effective inventory date ahead to 2002. This initialization year was
included in all runs but is not presented in the tables or graphs herein. For each of
the five blocks, a 20-year plan was prepared based on the first two decades of
model output to depict the current management simulation. Total simulation
horizon was set at 250 years.
Analysis units and associated yield curve parameters are described in more detail
in the associated information package (MP 10, Appendix IV, sections 7 & 8).
To ensure optimization of harvest scenarios, harvest request levels were
incrementally changed until a one-hectare change induced a small deficit, typically
occurring in the vicinity of the transition to second growth. The reported harvest
level is the last requested level where no deficit is evident.

TFL 25 - Timber Supply Analysis Page 3
2.0 Current Management or Base Case
The current management (CM) simulation includes the following assumptions and
modelling parameters that are described in more detail in the associated
information package (MP 10, Appendix IV, section 3.2):
• Future Wildlife Tree Patches are projected to occupy 13% of the land base, 3.25% of which is assumed to come from the otherwise harvestable land base1,2. Universal volume reductions ranging from 5.0% (Blocks 1, 2, 3, 6) to 8.5% (Block 5) were used to simulate the overall volume impacts of WTPs, partial cutting, and EBM. Old seral stage targets are maintained based on specific Biodiversity Emphasis Options where available, or the TSR II recommendations of 10% high, 45% intermediate, and 45% low biodiversity emphasis where landscape units have not been drafted or finalized. Green-up heights are assigned based on Resource Management Zoning established in the Vancouver Island Land Use Plan. Vancouver Island “Special” and
1 As the locations of future WTPs and partial cutting are not known, the percentage is not area based. Therefore growing stock and age class distributions and summaries do not reflect this reserved area or volume. As these volume deductions are not reflected in area calculations some options for determination of AAC and cut control are: Option A – net down the area-based AAC Determination for WTPs (assumed 3.25%) in THLB and partial cutting (% as below). Then when determining area harvested for cut control, do not include partial cutting. This approach would require establishment of a threshold basal area removal, may invite partial cutting manipulations or abuses to avoid cut control, and assumes the WTP/THLB overlap is as estimated. (Cut control area = net block clearcut area + harvestable productive forest in PAS right-of-way outside cutblocks2). Option B – net down the area-based Determination for partial cutting only (1.75% for Blocks 1,2,3,6 and 5.25% for Block 5). Then for cut control purposes include as area harvested any WTP area overlapping the THLB, but as per Option A ignore partial cutting areas. Including WTP on THLB as part of area harvested is a more direct approach to determining the percentage of THLB occupied by WTP and brings the concept of THLB closer to the operational level. The timber resource would be better utilized if field personnel observed an immediate cut control effect from unnecessary or excessive reservation of THLB. As well this approach would facilitate better tracking of WTP overlap with THLB to determine the validity of the currently assumed 3.25% and encourage updating of THLB mapping to reflect block level assessments of terrain, etc. (Cut control area = net block clearcut area + THLB in WTP + harvestable productive forest in PAS right-of-way outside cutblocks2). Option C – do not adjust the area-based AAC Determination for WTPs or partial cutting but include as area harvested for cut control any WTP area overlapping the THLB and include partial cutting using a percentage-of-basal-area-removed adjustment to calculate a clearcut equivalency area. This direct-measurement-of-results approach reduces potential partial cutting abuses and makes percentage estimates of the WTP/THLB overlap and/or partial cutting irrelevant to the AAC Determination. (Cut control area = net block clearcut area + THLB in WTP + partial cut area stated as clearcut equivalent + harvestable productive forest in PAS right-of-way outside cutblocks2). Note that if partially cut area were to be included as 100% clearcut, operational personnel would find this approach unfair and partial cutting could be unduly discouraged. 2 If the “disturbed area” approach to determining area harvested for cut control is used, in theory it is also necessary to make an upward adjustment of the AAC Determination to make allowance for NP (e.g. non-forested area on access road) or unmerchantable stands (young, unharvestable second growth or lower site stands outside the THLB) that may be disturbed in developing cutblocks. A direct measurement of this at the cut control stage would be more transparent.

TFL 25 - Timber Supply Analysis Page 4
“General” zones as well as Mainland blocks have a 3m green-up requirement, whereas “Enhanced” zones on Vancouver Island have a 1.3m limit.
• The operable land base includes stands accessible to helicopter and conventional cable or ground-based harvesting systems.
• All harvested stands are planted promptly. Future plantations are assumed to use seed orchard stock. Yield reductions for stocking gaps and decay are 20% at one hundred years.
• Visual quality restrictions are based on the latest inventory revisions with upper range denudation assumed. Recreation constraints as described in the information package are generally of little impact.
• Minimum harvestable ages are based on attainment of profitable minimum mean stand diameters. Minimum acceptable stand diameters increased 10cm from poor to good growing sites and 7cm from low cost, south coast operations to higher cost operations to the north.
• Alder volumes contribute to the timber supply.
• Harvest priorities are generally to minimize growth loss and harvest oldest stands. In Block 1 the oldest first rule was not invoked to better reflect current operations that include significant second growth harvesting. Existing forest development plan blocks were harvested in the initial years as model constraints permitted.
The Current Management summary statistics for each block are presented in
Table 1 below and harvest levels are presented in Figure 1 below. More detailed
graphs of output parameters and sensitivity analyses are presented by TFL block
in the sections following and in Appendix V-A (page 69).
In terms of annual area harvest, the order of importance of the blocks is: Block 5
(40%), Block 1 (23%), Block 6 (20%), Block 2 (10%), Block 3 (7%). This order
remains even after Central Coast Candidate Protected Areas announced April 1,
2001 are removed, although the Block 5 area harvest is reduced by about a
quarter (128 ha or 26%). In terms of projected annual volume flow, the short term
block order is the same, but in the longer term Block 6 surpasses Block 1 as the
age class imbalance induced by the 1988 withdrawal of the Gwaii Haanas reserve
from the management unit is eventually overcome.

TFL 25 - Timber Supply Analysis Page 5
0
200
400
600
800
1,000
1,200
1,400
2002
2012
2022
2032
2042
2052
2062
2072
2082
2092
2102
2112
2122
2132
2142
2152
2162
2172
2182
2192
2202
2212
2222
2232
2242
ha/yr
0
100,000
200,000
300,000
400,000
500,000
600,000
700,000
m3/yr
Blk 6 ha Blk 5 ha Blk 3 ha Blk 2 ha Blk 1 haBlk 6 m3 Blk 5 m3 Blk 3 m3 Blk 2 m3 Blk 1 m3
Figure 1. Area harvest (background bands) and predicted volume flow (lines) to
2252 for each block under current management
The indicated annual harvest area for the TFL of 1,250 ha is less than both the
Long-Run Sustainable Area harvest calculation (LRSA) and the Long-Run
Sustainable Area harvest calculation if all stands were harvested when marginally
profitable (mLRSA). Future stands would on average be harvested beyond
culmination of mean annual increment and be of sufficient size to ensure a
reasonable economic return for future generations.

TFL 25 - Timber Supply Analysis Page 6
Table 1. Current management harvest summary
Block mDBHq3
(cm)
Indicated
Annual
Harvest
(ha)
THLB4
(ha)
Implied
average
rotation
age5
(yrs)
Predicted
average
annual volume
to 20226
(m3/yr)
Average
culmination
age4
(yrs)
LRSA7
(ha)
Average
age
mDBHq
attained
mLRSA8
(ha)
NRL4
(ha)
1 40/35/30 292 25,562 88 164,534 95 269 85 301 2
2 43/38/34 124 15,002 121 90,234 96 156 115 130 1
3 43/38/34 88 9,444 107 68,342 105 90 108 87 1
5 47/42/37 492 62,901 128 284,258 103 611 126 499 1
5-PA 47/42/37 364 47,9669 132 210,134 104 461 128 375 1
6 47/42/37 254 25,169 99 140,873 83 303 85 296 3
All 1,250 138,078 110 748,241 100 1,429 109 1,313 8
All-PA 1,122 123,143 110 674,117 97 1,279 107 1,189 8
3 Minimum harvestable quadratic mean stand diameter for Good, Medium, and Poor sites respectively. 4 from the information package (MP 10, Appendix IV) for future stands. 5 THLB divided by expected annual area harvest. 6 Actual harvest volume will vary; this parameter is not suitable for conversion of area to volume for administrative or operational purposes. 7 Theoretical Long Run Sustainable Area harvest calculated as THLB divided by area-weighted culmination age of future managed stands. 8 Theoretical Long Run Sustainable Area if harvest occurs at mDBHq, calculated as THLB divided by area-weighted age that future managed stands attain mDBHq. 9 Original THLB hectares less THLB in Order-in-Council designated Protected Areas.

TFL 25 - Timber Supply Analysis Page 7
3.0 Block 1 Analysis (Jordan River)
3.1 Current Management – 292 ha/year
Figure 2 below summarizes for the current management or “base case”
simulation, the trends for harvest variables including timber volume, harvest age,
mean stand diameter (DBHq), and proportion of helicopter harvesting.
TFL 25 Blk 1 CMA: 292 ha mDBHq: 40/35/30
0
100
200
300
400
500
600
700
800
900
2002
2012
2022
2032
2042
2052
2062
2072
2082
2092
2102
2112
2122
2132
2142
2152
2162
2172
2182
2192
2202
2212
2222
2232
2242
2252
First Year of Period
m3 /h
a, D
BH
q - m
m
0
20
40
60
80
100
120
140
160
180
200
220
240
260
280
300
320
Area
Har
vest
ed -
ha, H
arve
st V
ol. -
m3 X
10
00, A
geMean Volume (m3/ha) Mean DBHq Area harvest (ha/yr) Mean age
Volume harvest (m3/yr) Heli (m3/yr) Heli (ha/yr)
Figure 2. Block 1 Current Management harvest statistics through 250 years10
As the transition to second growth occurs, average age and diameter of harvested
stands declines until the transition is complete. The transition will be largely
complete within the next 40 years but nevertheless old forests would be a
significant portion of the harvest profile until about 90 years into the future. As the
transition progresses average merchantable stand volumes at harvest increase

TFL 25 - Timber Supply Analysis Page 8
from under 600 m3/ha initially to the 800-850 m3/ha range in the long term. This
effect is primarily related to expected gains from current silviculture practices. As
the area harvest is constant, annual harvest volumes increase11 in tandem with
the increasing stand volumes. In the long term, ages at harvest average 82-88
years and average harvest diameters are around 35-37 cm (individual stands
ranging 30-65+ cm).
-
1,000
2,000
3,000
4,000
5,000
6,000
7,000
8,000
9,000
0 - 20 21 - 40 41 - 60 61 - 80 81 - 100 101 - 120 121 - 140 141 - 250 251+Age Class Group (years)
Fore
sted
Are
a (h
a)
-
1 , 000
2 , 000
3 , 000
4 , 000
5 , 000
6 , 000
7 , 000
8 , 000
9 , 000
total forested Harvest Period: 2002 2052 2102 2152 2202 2252
Figure 3. Age class progression on Block 1 THLB (+ total forested) for current
management through 250 years
In this Block the indicated harvest level is midway between the LRSA and mLRSA
calculations (Table 1), suggesting that near the pinch point (circa 2082) and
beyond stands are on average harvested before culmination of mean annual
10 Red arrow indicates point where an area harvest deficit occurs if harvest request is increased by 1 ha. 11 This “fall-up” effect is the reverse of the oft-cited “falldown” effect observed in some stands (Douglas-fir for example).
At the stand level the effect is commonly observed on coastal hemlock, balsam, or cedar sites where old forests are severely decayed and of low merchantable volume when compared to second growth growing on similar sites.

TFL 25 - Timber Supply Analysis Page 9
increment but above the threshold minimum harvest age needed to ensure a
profitable harvest.
Age class distributions are examined in Figure 3 above. On the THLB, with the
exception of the 41-60 class, the age classes less than 101 years increase
modestly from current levels initially and then stabilize through the remainder of
the simulation. 101- to 250-year-old stands remain present in low abundance
throughout the simulation. On the THLB the oldest stands decline dramatically
through the first part of the simulation as the transition to second growth
harvesting is completed.
0
2,000,000
4,000,000
6,000,000
8,000,000
10,000,000
12,000,000
2002
2012
2022
2032
2042
2052
2062
2072
2082
2092
2102
2112
2122
2132
2142
2152
2162
2172
2182
2192
2202
2212
2222
2232
2242
Year
Volu
me
(m3 )
>=140 years 70-140 years <=70 years annual harvest
Figure 4. Merchantable growing stock on total Block 1 land base through 250 years
On the total forest land base, forest greater than 250 years old declines from the
current level of about 7,800 ha to about 2,400 ha and then rebuilds to the 4,600
ha level. However during the deficit period stands in the 141- to 250-year-old
class are increasing so that at least 3,900 ha of forest older than 140 years is

TFL 25 - Timber Supply Analysis Page 10
forecasted to be present and contributing to the perpetuation of old-growth
dependent processes or organisms.
Figure 4 above illustrates gross growing stock levels for the total land base.
Initially levels are somewhat below 10 million m3 but rise modestly to near 11
million m3 in the longer term. The proportion of older forest drops initially from the
current level of about 4.4 million m3 to about 1.6 million m3 and then stabilizes
near 2.6 million m3 in the long term. This 10-11 million m3 standing inventory of
wood permanently provides the basis for sustainable timber flow in the long term
and provides substantial habitat and other environmental benefits to supplement
values in adjacent park land (935 ha). The proportion of younger growing stock is
initially 42% and in the long term stabilizes in the range of 43-47% of total growing
stock. The 71- to 140-year-old growing stock provides the primary source of
sustainable timber production through the simulation.
0
2,000,000
4,000,000
6,000,000
8,000,000
10,000,000
12,000,000
14,000,000
2002
2012
2022
2032
2042
2052
2062
2072
2082
2092
2102
2112
2122
2132
2142
2152
2162
2172
2182
2192
2202
2212
2222
2232
2242
Year
Volu
me
(m3 )
>=140 years 70-140 years <=70 years annual harvest
Figure 5. Merchantable growing stock on Block 1 THLB through 250 years
In the future the older growing stock is for the most part, but not entirely, in
reserves or area projected to be unavailable for timber harvest. Figure 5 above
displays growing stock through time for the THLB only. For non-timber reasons,
some timber is held significantly beyond normal rotation ages and reaches ages in

TFL 25 - Timber Supply Analysis Page 11
excess of 140 years before other stands become equally or more suitable for
satisfying the non-timber objective(s). When this timber is released, its harvest
could provide a small but ongoing supply of older stems possibly suitable for
specialty manufacturing or cultural purposes.
0
5,000
10,000
15,000
20,000
25,000
30,000
35,000
2002
2012
2022
2032
2042
2052
2062
2072
2082
2092
2102
2112
2122
2132
2142
2152
2162
2172
2182
2192
2202
2212
2222
2232
2242
Year
Area
(ha)
>=140 years 70-140 years <=70 years annual harvest
Figure 6. Age-group areas for Block 1 total land base through 250 years
Figure 6 above is as per Figure 4 except data is presented on an area basis
rather than a volume basis and simplifies the age class data presented in Figure
3. There is a slight drop in the productive forest area from the initial level as new
roads are built and withdrawn from the productive area.
Initially the area of old growth declines, the area of maturing stands increases,
and the area of younger stands remains relatively stable. Contrary to popular
opinion, as the transition from old growth progresses, at the landscape level old
growth area is not replaced by clearcut area (young stands decrease from 64% to
63% through 2252), but rather by 71- to 140-year-old stands (increases from 8%
to 25%). Under the current management regime, young stands will occur no more
frequently after the completion of the transition to second growth than they do
today.

TFL 25 - Timber Supply Analysis Page 12
Figure 6 also clearly demonstrates that the age class distribution is already much
different than the natural disturbance type (NDT1) or recent historical range of
natural variability for the area would dictate. Clearly any attempt to impose or
return to an age class distribution representative of infrequent disturbances would
be extremely difficult, as well as economically devastating and socially
irresponsible.
TFL 25 Blk 1 Growing Stock/Area CMA: 292 ha mDBHq: 40/35/30
0
5,000
10,000
15,000
20,000
25,000
30,000
35,000
2002
2012
2022
2032
2042
2052
2062
2072
2082
2092
2102
2112
2122
2132
2142
2152
2162
2172
2182
2192
2202
2212
2222
2232
2242
2252Period
ha
0
2,000,000
4,000,000
6,000,000
8,000,000
10,000,000
12,000,000
14,000,000
m3
productive land base (ha) THLB (ha)Area >= mDBHq on THLB (ha) Area >= mDBHq on Total LB (ha)Volume >= mDBHq on THLB (m3) Volume >= mDBHq on Total LB (m3)
Figure 7. Merchantable growing stock in harvestable (>mDBHq) stands through
250 years for Block 1.
Figure 7 above presents growing stock in terms of merchantable volume and area
that is larger than the minimum harvestable12 DBHq.
Roughly 4,200 ha or 14% of the productive land base is unavailable for harvesting
for the long term. Because the locations of future Wildlife Tree Patches and
partial retention along streams or elsewhere could not be easily predicted, they
were modelled as a yield curve volume net down. Consequently these net downs
12 The term “merchantable” is used to refer to the net volume as indicated by growth and yield models: typically less a 30 cm high stump, a 10 cm top diameter, trees less than 12.5 cm dbh, and decay, waste and breakage estimates. The term “harvestable” is used here to refer to stands that have grown to mDBHq. Although a particular stand may have some, or considerable, merchantable volume it is not considered harvestable until it has attained sufficient volume and stem sizes to be deemed profitable.

TFL 25 - Timber Supply Analysis Page 13
are not represented in any of the aforementioned Figures and the actual volume
and/or hectares illustrated understate the old forest reserved from harvest by
about 5% of THLB area or volume.
On the THLB, harvestable stands become less available until the transition to
second growth is complete and are maintained thereafter between 3,100 and
3,500 ha, or roughly 11-14 years worth of harvesting at the indicated harvest
level. The ratio of harvestable area to annual harvest is somewhat higher than for
other blocks and reflects a higher influence of policy factors (adjacency, cover %)
rather than a shortage of physically available stands (mDBHq, age class
structure). This confirms that the annual harvest area recommendation after
making provision for non-timber values, makes more or less optimal use of the
land base’s residual timber capacity. Operational flexibility in the selection of
harvest locations can be expected to be most limited around pinch points at 2062,
2082 and 2122.
A strategic focus for silviculture treatments could be to increase the harvestability
of stands through the 2052-2132 period where area available for harvesting is
projected to be lowest. A second objective would be to increase volume/ha during
the anticipated dip from 2052-2082 (Figure 2, p. 7). Generally though, the
differences are subtle and silviculture treatments which increase the future
volume, merchantability or quality of stands may be more or less equal in terms of
strategic importance and could therefore be ranked using stand-level financial
analysis.
3.2 Alternate Harvest Levels
3.2.1 10% Increase
Figure 8 below shows that a higher area harvest request induces area and
volume shortfalls at the transition to second growth and the rotations beyond.
Average harvest age and DBHq decline sooner and remain somewhat lower in
the long term. Average volume per hectare is lower in the longer term as stands
are harvested earlier than was the case in the current management run. Note that
relative to the current management simulation, this run produces modestly more
volume (625,348 m3 or 2,500 m3 annually on average) through 250 years (see
Appendix V-B, Table 12, p.106).

TFL 25 - Timber Supply Analysis Page 14
TFL 25 Blk 1 CMA_up10: 321.2 ha mDBHq: 40/35/30
0
100
200
300
400
500
600
700
800
900
2002
2012
2022
2032
2042
2052
2062
2072
2082
2092
2102
2112
2122
2132
2142
2152
2162
2172
2182
2192
2202
2212
2222
2232
2242
2252Period
m3 /h
a, D
BHq
- mm
0
20
40
60
80
100
120
140
160
180
200
220
240
260
280
300
320
Area
Har
vest
ed -
ha, H
arve
st V
ol. -
m3 X
100
0, A
ge
Mean volume (m3/ha) Mean DBHq Area harvest (ha/yr)Volume harvest (m3/yr) Mean age CMA
Figure 8. Block 1 harvest statistics13 through 250 years for current management
area harvest plus 10%
3.2.2 10% Decrease
Lowering the harvest request level by 10% (Figure 9 below) has the effect in the
short term of lowering the harvest volume in proportion (-10.1%) to the area
change. This is because existing old growth stands are assumed to be neither
adding nor losing volume through time. Once second growth becomes an
appreciable component of the harvest profile, harvest age and DBHq are
significantly higher (longer rotation) with the result that stand volumes per hectare
at harvest are higher as well. This tends to compensate for the loss of area
harvested such that the overall volume harvest is less affected in the longer term
(-5.6%) versus the short term (-10.1%) (Appendix V-B, Table 12, p.106).
13 Dashed lines in background represent current management statistics.

TFL 25 - Timber Supply Analysis Page 15
TFL 25 Blk 1 CMA_down10: 262.8 ha mDBHq: 40/35/30
0
100
200
300
400
500
600
700
800
900
2002
2012
2022
2032
2042
2052
2062
2072
2082
2092
2102
2112
2122
2132
2142
2152
2162
2172
2182
2192
2202
2212
2222
2232
2242
2252Period
m3 /h
a, D
BHq
- mm
0102030405060708090100110120130140150160170180190200210220230240250260270280290300310320
Area
Har
vest
ed -
ha, H
arve
st V
ol. -
m3 X
100
0, A
ge
Mean volume (m3/ha) Mean DBHq Area harvest (ha/yr)Volume harvest (m3/yr) Mean age CMA
Figure 9. Block 1 harvest statistics through 250 years for current management area harvest less 10%
3.3 Sensitivity Analyses
Harvest output statistics for all sensitivity runs are presented in Appendix V-A (p.
69). In the harvest output graphs, decreases in area harvest relative to the base
case are presented both unadjusted and as a new flat line. For increases in area
harvest, a new, higher, flat-line harvest level was established. Flat-line flows were
established by increasing area harvest requested until a deficit occurred, and then
dropping back to the nearest whole number where the deficit disappears.
Appendix V-B (p.103) summarizes changes in area (Table 10, Table 11) and
near, mid, and long term volume (Table 12).
Table 2 presents the area results of sensitivity analyses for Block 1.

TFL 25 - Timber Supply Analysis Page 16
Block 1 is most sensitive to changes that alter the minimum harvest age (-SI3m,
+age, +ageX2). The “+/-age” results are unbalanced and suggest that an
increase in rotation age has a much stronger impact than a decrease in rotation
age. This effect is most pronounced in Block 1 and is related to a pinch-point shift
from harvestability limitations at the pinch point to increased adjacency or cover
restrictions as rotation ages shorten (see +ageX2, +age, -age, and –ageX2
sensitivities).
Table 2. Block 1 Sensitivity results
HarvestRun ID (ha) (ha) %CMA 292 - - Area-based current management option
+Oe 294 2.0 0.7 Include Oce and Ohe polygons in THLB (1.0% of THLB)
-Oh 286 -6.0 -2.1 Remove helicopter operable polygons (1.6% of THLB)
-SI3m 236 -56.0 -19.2 Reduce SI estimates for age class 1-2 and future stands by 3m
-age 309 17.0 5.8 Lower minimum harvest age by decreasing mDBHq by 3 cm
+age 239 -53.0 -18.2 Increase minimum harvest age by increasing mDBHq by 3 cm
-RndAge 283 -9.0 -3.1 Uses the mDBHq ages rounded up to the nearest 10th year (effectively adds 5 years to mDBHq)
-midVQ 289 -3.0 -1.0 Use mid range disturbance target
+ageX2 196 -96.0 -32.9 Increase minimum harvest age by increasing mDBHq by 3X2=6cm
-ageX2 318 26.0 8.9 Decrease minimum harvest age by decreasing mDBHq by 3X2=6cm
DescriptionChange

TFL 25 - Timber Supply Analysis Page 17
4.0 Block 2 Analysis (Stafford-Apple-Heydon)
4.1 Current Management - 124 ha/year
Figure 10 summarizes for the current management or “base case” simulation, the
trends for harvest variables including timber volume, harvest age, mean stand
diameter (DBHq), and proportion of helicopter harvesting.
TFL 25 Blk 2 CMA: 124 ha mDBHq: 43/38/34
0
100
200
300
400
500
600
700
800
900
1,000
1,100
1,200
1,300
2002
2012
2022
2032
2042
2052
2062
2072
2082
2092
2102
2112
2122
2132
2142
2152
2162
2172
2182
2192
2202
2212
2222
2232
2242
2252
First Year of Period
m3 /h
a, D
BH
q - m
m
0
20
40
60
80
100
120
140
160
180
200
220
240
260
Area
Har
vest
ed -
ha, H
arve
st V
ol. -
m3 X
10
00, A
geMean Volume(m3/ha) Mean DBHq Area harvest (ha/yr) Mean ageVolume harvest (m3/yr) Heli (m3/yr) Heli (ha/yr)
Figure 10. Block 2 Current Management harvest statistics through 250 years14
In this simulation the transition to second growth occurs quickly as average
harvest age drops abruptly through the 2052 to 2062 periods and stabilizes
around 113-124 years. Average stand diameter at harvest also drops abruptly at
the transition and a gradual decline continues through the mid term before settling
into the 39-42 cm range in the long term. As the second growth comes on stream
14 Red arrow indicates point where area harvest deficit occurs if harvest request is increased by 1 ha.

TFL 25 - Timber Supply Analysis Page 18
average merchantable stand volumes at harvest “fall up”11 from the old growth
norm of about 750 m3/ha to about 1000 m3/ha and continue to trend upward to
near 1100 m3/ha in the long term. The volume harvest directly reflects the
volume/ha trend as it holds steady at about 89,000 m3/year, jumps to 115,000
after the transition, and slowly climbs to near 127,000 m3/year in the long term.
In this block, timber only accessible to heli-logging makes up a significant portion
of the land base and the harvest profile. In the current model configuration there
is no satisfactory method to regulate the helicopter portion within the overall area
regulation. However, a simulation of the flat line harvest flow from the helicopter-
accessible land base only (CMA-Oc, Table 3) and the difference between the
base case (CMA) and conventional only (CMA-Oh) harvest levels suggest that the
helicopter portion makes up about 23-24 ha of the 124 ha annual flow forecast.
-
2,000.0
4,000.0
6,000.0
8,000.0
10,000.0
12,000.0
14,000.0
16,000.0
18,000.0
0 - 20 21 - 40 41 - 60 61 - 80 81 - 100 101 - 120 121 - 140 141 - 200 200+Age Class Group (years)
Fore
sted
Are
a (h
a)
-
2 , 000
4 , 000
6 , 000
8 , 000
1 0, 000
1 2 , 000
1 4 , 000
1 6 , 000
1 8 , 000
total forested Harvest Period: 2002 2052 2102 2152 2202 2252
Figure 11. Age class progression on Block 2 THLB (+ total forested) for current
management through 250 years

TFL 25 - Timber Supply Analysis Page 19
In this Block the indicated harvest level is less than both the LRSA and mLRSA
calculations (Table 1). This illustrates that the pinch point or bottleneck at 2122 is
preventing an optimal area harvest and in effect for most of the simulation stand
harvests are delayed well beyond culmination age and beyond the mDBHq age.
This pinch point is also noteworthy in that it is not associated with the old growth
to second growth transition.
Age class distributions are examined in Figure 11. The younger age (≤ 60 years)
classes remain relatively stable from the current state and occupy between 2,350
and 2,900 ha each indefinitely. Second growth age classes approaching
harvestable ages increase significantly in the first 50-year period and then
stabilize. 121- to 200-year-old stands are present in low abundance throughout
the simulation and are actually increasing in abundance through the first century.
On the THLB the oldest stands decline dramatically through the first part of the
simulation as the transition to second growth harvesting is completed.
0
2,000,000
4,000,000
6,000,000
8,000,000
10,000,000
12,000,000
14,000,000
16,000,000
2002
2012
2022
2032
2042
2052
2062
2072
2082
2092
2102
2112
2122
2132
2142
2152
2162
2172
2182
2192
2202
2212
2222
2232
2242
Year
Vol
ume
(m3 )
>=140 years 70-140 years <=70 years annual harvest
Figure 12. Merchantable growing stock on total Block 2 land base through 250 years
On the total forest land base, forest greater than 200 years old declines from the
current level of just under eighteen thousand hectares to a stable long term level

TFL 25 - Timber Supply Analysis Page 20
of about twelve thousand hectares. Old forest will continue to dominate this
landscape under current management assumptions.
Figure 12 above illustrates gross growing stock levels for the total land base.
Initially levels drop slightly and then slowly build to in excess of fourteen million
cubic metres (m3). The proportion of older forest drops initially from the current
level of about twelve million m3 and stabilizes at 7-8 million m3. The older forest
volume is replaced by middle-aged volumes (rising to 32-37%), whereas the
younger stands remain more or less constant at around 11-15% of total
merchantable growing stock. This fourteen million m3 standing inventory of wood
permanently provides substantial habitat and other environmental value while the
smaller five million m3 of 71- to 140-year-old stock therein provides the primary
source of sustainable timber production (represented by the thickness of the
orange “line” in Figure 12.
0
2,000,000
4,000,000
6,000,000
8,000,000
10,000,000
12,000,000
14,000,000
16,000,000
2002
2012
2022
2032
2042
2052
2062
2072
2082
2092
2102
2112
2122
2132
2142
2152
2162
2172
2182
2192
2202
2212
2222
2232
2242
Volu
me
(m3 )
>=140 years 70-140 years <=70 years annual harvest
Figure 13. Merchantable growing stock on Block 2 THLB through 250 years
In future, the older growing stock volume is for the most part, but not entirely, in
reserves or area projected to be unavailable for timber harvest. Figure 13
displays growing stock through time for the THLB only. For non-timber reasons,
some harvestable timber is held significantly beyond normal rotation ages and

TFL 25 - Timber Supply Analysis Page 21
reaches ages in excess of 140 years before other stands become equally or more
suitable for satisfying the non-timber objective(s). When this timber is released,
its harvest could provide a small but ongoing supply of older stems possibly
suitable for specialty manufacturing or cultural purposes.
0
5,000
10,000
15,000
20,000
25,000
30,000
35,000
2002
2012
2022
2032
2042
2052
2062
2072
2082
2092
2102
2112
2122
2132
2142
2152
2162
2172
2182
2192
2202
2212
2222
2232
2242
Year
Area
(ha)
>=140 years 70-140 years <=70 years annual harvest
Figure 14. Age-group areas for Block 2 total land base through 250 years
Figure 14 is as per Figure 12 except data is presented on an area basis rather
than a volume basis and simplifies the age class data presented in Figure 11.
Initially the area of old forest declines, the area of maturing stands increases, and
the area of younger stands remains relatively stable. Contrary to popular opinion,
as the transition from old forest progresses, at the landscape level old forest area
is not replaced by clearcut area, but rather by 71- to 140-year-old stands. A
century into the future under the current management regime, young stands will
occur no more frequently than they do today and continue to occupy less than a
third of the forested landscape throughout the simulation.
Figure 14 also demonstrates that the age class distribution is already different
than the natural disturbance type (NDT1) or recent historical range of natural
variability for the area would dictate. To impose or return to an age class

TFL 25 - Timber Supply Analysis Page 22
distribution representative of infrequent disturbances would be very difficult as
well as economically disruptive.
Figure 15 presents growing stock in terms of merchantable volume and area that
is larger than the minimum harvestable DBHq.
Roughly 12,300 ha or 45% of the productive land base is unavailable for
harvesting for the long term. Because the locations of future Wildlife Tree
Patches and partial retention along streams could not be easily predicted, they
were modelled as a yield curve volume net down. Consequently these net downs
are not represented in any of the aforementioned Figures and the actual volume
and/or hectares illustrated understate the old forest reserved from harvest by
about 5% of THLB area or volume.
TFL 25 Blk 2 Growing Stock/Area CMA: 124 ha mDBHq: 43/38/34
0
5,000
10,000
15,000
20,000
25,000
30,000
35,000
2002
2012
2022
2032
2042
2052
2062
2072
2082
2092
2102
2112
2122
2132
2142
2152
2162
2172
2182
2192
2202
2212
2222
2232
2242
2252
Period
ha
0
2,000,000
4,000,000
6,000,000
8,000,000
10,000,000
12,000,000
14,000,000
m3
productive land base (ha) THLB (ha)Area >= mDBHq on THLB (ha) Area >= mDBHq on Total LB (ha)Volume >= mDBHq on THLB (m3) Volume >= mDBHq on Total LB (m3)
Figure 15. Merchantable growing stock in harvestable (>mDBHq) stands through
250 years for Block 2.
On the THLB, harvestable (>mDBHq) stands become less available until the pinch
point is passed and then rebuid thereafter. At the low point harvestable stands
amount to about 588 ha, or roughly 5 years worth of harvesting at the indicated

TFL 25 - Timber Supply Analysis Page 23
harvest level. As the ratio of harvestable area to annual harvest is lower than in
other blocks, policy factors such as adjacency are less important than the physical
availablity of harvestable stands. The annual harvest area recommendation
makes optimal use of the land base’s residual timber capacity but operational
flexibility could prove difficult through the 2122 to 2161 period. This pinch point
rematerializes in the rotation beyond at the end of the simulation.
A strategic focus for silviculture treatments and density regimes could be to
increase the number of harvestable stands through the 2122-2161 period where
area available for harvesting is projected to be lowest. If the harvestability can be
improved an Allowable Cut Effect could be realized. In terms of volume/ha and
volume flow there is a slight decline associated with the pinch point so treatments
that increase volume per hectare through this period would be of operational
benefit.
Silviculture treatments which increase the future volume, merchantability or quality
of stands outside the critical harvestability period would be more or less equal in
terms of strategic importance and should therefore be ranked using stand-level
financial analysis.
4.2 Alternate Harvest Levels
4.2.1 10% Increase
Figure 16 shows that a higher area harvest request induces large area and
volume shortfalls starting seventy years into the future. Average harvest age and
DBHq decline sooner, recover to base case levels and then decline again at the
end of the simulation where a 130-year echo of the 2112 deficit occurs. Average
volume per hectare becomes lower in association with area deficits as stands are
harvested earlier than was the case in the current management run. Note
however volume/ha is relatively unchanged elsewhere in the simulation so that
relative to the current management simulation, this run produces 1.7% more
volume (487,356 m3 or 2,000 m3 annually on average) through 250 years (see
Appendix V-B, Table 12, page 106).

TFL 25 - Timber Supply Analysis Page 24
TFL 25 Blk 2 CMA_up10: 136.4 ha mDBHq: 43/38/34
0
100
200
300
400
500
600
700
800
900
1,000
1,100
1,200
1,300
2002
2012
2022
2032
2042
2052
2062
2072
2082
2092
2102
2112
2122
2132
2142
2152
2162
2172
2182
2192
2202
2212
2222
2232
2242
2252Period
m3 /h
a, D
BH
q - m
m
0
20
40
60
80
100
120
140
160
180
200
220
240
260
Area
Har
vest
ed -
ha, H
arve
st V
ol. -
m3 X
100
0, A
ge
Mean Volume (m3/ha) Mean DBHq Harvest area (ha/yr)Volume harvest (m3/yr) Mean age CMA
Figure 16. Block 2 harvest statistics15 through 250 years for current management area harvest plus 10%
4.2.2 10% Decrease
Lowering the harvest request level by 10% has the effect in the short term of
lowering the harvest volume about in proportion (-10.3%) to the area change.
This is because existing old growth stands harvested in the short term are
assumed to be neither adding nor losing volume through time. The lower request
delays the transition to second growth by a decade but once second growth
becomes an appreciable component of the harvest profile, harvest age and DBHq
are significantly higher (longer rotation) with the result that stand volumes per
hectare at harvest are higher as well. This tends to compensate for the loss of
area harvested such that the overall volume harvest is less affected in the longer
term (-5.0%) versus the short term (-10.3%) (Appendix V-B, Table 12).
15 Dashed lines in background represent current management statistics.

TFL 25 - Timber Supply Analysis Page 25
TFL 25 Blk 2 CMA_down10: 111.6 ha mDBHq: 43/38/34
0
100
200
300
400
500
600
700
800
900
1,000
1,100
1,200
1,300
2002
2012
2022
2032
2042
2052
2062
2072
2082
2092
2102
2112
2122
2132
2142
2152
2162
2172
2182
2192
2202
2212
2222
2232
2242
2252Period
m3 /h
a, D
BH
q - m
m
0
20
40
60
80
100
120
140
160
180
200
220
240
260
Area
Har
vest
ed -
ha, H
arve
st V
ol. -
m3 X
100
0, A
ge
Mean volume (m3/ha) Mean DBHq Area harvest (ha/yr)Volume harvest (m3/yr) Mean age CMA (ha)
Figure 17. Block 2 harvest statistics16 through 250 years for current management
area harvest less 10%
4.3 Sensitivity Analyses
Harvest output statistics for all sensitivity runs are presented in Appendix V-A. In
the harvest output graphs, decreases in area harvest relative to the base case are
presented both unadjusted and as a new flat line. For increases in area harvest,
a new, higher, flat-line harvest level was established. Flat-line flows were
established by increasing area harvest requested until a deficit occurred, and then
dropping back to the nearest whole number where the deficit disappears.
Appendix V-B (p.103) summarizes changes in area (Table 10, Table 11) and
near, mid, and long term volume (Table 12).
16 Dashed lines in background represent current management statistics.

TFL 25 - Timber Supply Analysis Page 26
Table 3. Block 2 Sensitivity results
HarvestRun ID (ha) (ha) %CMA 124 - - Area-based current management option
+Oe 126 2.0 1.6 Include Oce and Ohe polygons in THLB (3.7% of THLB)
-Oh 101 -23.0 -18.5 Remove helicopter operable polygons (20.0% of THLB)
-SI3m 106 -18.0 -14.5 Reduce SI estimates for age class 1-2 and future stands by 3m
-age 142 18.0 14.5 Lower minimum harvest age by decreasing mDBHq by 3 cm
+age 105 -19.0 -15.3 Increase minimum harvest age by increasing mDBHq by 3 cm
-RndAge 120 -4.0 -3.2 Uses the mDBHq ages rounded up to the nearest 10th year (effectively adds 5 years to mDBHq)
-midVQ 122 -2.0 -1.6 Use mid range disturbance target
+BEO 120 -4.0 -3.2 Apply specific BEOs to draft or legislated landscape units where not included in CM0
-Oc 24 -100.0 -80.6 Simulation on THLB accessible by helicopter only to estimate flat line portion of harvest attributable to helicopter harvesting.
-HRules 125 1.0 0.8 turn off oldest first and minimize growth loss harvest rules.
Change Description
Table 3 presents the area results of sensitivity analyses for Block 2.
Block 2 is most sensitive to changes that alter the minimum harvest age (-SI3m,
+/- age). Removing the area operable to helicopters only also has a large impact
(-18.5%), but this area represents 20% of the THLB.
The –Oc run was done to test if the large fluctuation in the helicopter harvest
component of the base case (Figure 10) was of management concern or merely a
modelling artefact. As the flatline harvest indicated by –Oc is about the same as
the deficit created by the –Oh run, the fluctuation is more likely a modelling
artefact. Harvesting of helicopter operable polygons should target 100 to 120 ha
for the next five years of cut control. If harvest average exceeds 17 ha/year (75%
of –Oh area change) through the short term, disruptions of future harvest flows
should be unlikely and later adjustments, if needed, would not have to be drastic.

TFL 25 - Timber Supply Analysis Page 27
5.0 Block 3 Analysis (Naka)
5.1 Current Management - 88 ha/year
Figure 18 summarizes for the Block 3 current management simulation, the trends
for harvest variables including timber volume, harvest age, mean stand diameter
(DBHq), and proportion of helicopter harvesting.
TFL 25 Blk 3 CMA: 88 ha mDBHq: 43/38/34
0
100
200
300
400
500
600
700
800
900
1,000
1,100
200220122022203220422052206220722082209221022112212221322142215221622172218221922202221222222232224222522262
First Year of Period
m3 /h
a, D
BH
q - m
m
-5
15
35
55
75
95
115
135
155
175
195
215
235
255
275
Area
Har
vest
ed -
ha, H
arve
st V
ol. -
m3 X
100
0,
Age
Mean DBHq Mean Volume (m3/ha) Heli (ha/yr) Area harvest (ha/yr)Mean age Volume harvest (m3/yr) Heli (m3/yr)
Figure 18. Block 3 Current Management harvest statistics through 250 years17
In this block the transition to second growth is abrupt. Average age and diameter
of harvested stands declines rapidly within only two decades. Some older stands
linger for another few decades and the pinch point occurs as the last of these are
being harvested. The pinch point may be associated with an age class imbalance
created by the sudden curtailment of harvesting in this block when Blocks 2, 3,

TFL 25 - Timber Supply Analysis Page 28
and 5 were uncoupled for the purposes of AAC determination and cut control. Old
forests make up the entire harvest profile until about 50 years into the future. As
the transition progresses average merchantable stand volumes at harvest
increase from just over 800 m3/ha initially and with some fluctuation settle into the
940-970 m3/ha range in the long term. This effect is primarily related to expected
gains from current silviculture practices. As the area harvest is constant, annual
harvest volumes increase11 in tandem with the increasing stand volumes. In the
long term, ages at harvest average 101-106 years and average harvest diameters
are around 39 cm (individual stands ranging 30-47 cm).
-
1,000
2,000
3,000
4,000
5,000
6,000
7,000
8,000
9,000
0 - 20 21 - 40 41 - 60 61 - 80 81 - 100 101 - 120 121 - 140 141 - 200 200+Age Class Group (years)
Fore
sted
Are
a (h
a)
-
1 , 000
2 , 000
3 , 000
4 , 000
5 , 000
6 , 000
7 , 000
8 , 000
9 , 000
total forested Harvest Period: 2002 2052 2102 2152 2202 2252
Figure 19. Age class progression on Block 3 THLB (+ total forested) for current
management through 250 years
In this Block the LRSA and mLRSA calculations are very similar (Table 1) and the
suggested harvest level falls between the two. On average in the long term,
17 Red arrow indicates point where an area harvest deficit occurs if harvest request is increased by 1 ha.

TFL 25 - Timber Supply Analysis Page 29
stands are harvested near culmination of mean annual increment and close to the
threshold minimum harvest age needed to ensure profitability.
Age class distributions are examined in Figure 19. On the THLB, there is initially
a disproportionate area in the youngest age class. Previously this block was the
focus of harvesting for the combined Block 2, 3, 5 AAC and this regeneration
pulse carries through from the 0-20 to the 61-80 age class by 2052. The 21-40
age class is low initially because harvesting began in this block only about 25
years ago. By the next century a more or less balanced age class distribution is
attained. Harvestable second growth age classes increase dramatically by the
next century and become the basis of the sustainable harvest. 101- to 200-year-
old stands remain present in low abundance throughout the simulation. On the
THLB the oldest stands decline dramatically through the first one hundred years
of the simulation as the transition to second growth harvesting is completed.
On the total forest land base, forest greater than 200-years-old declines from the
current level of about 8,800 ha to about 3,200 ha in the long term. This
unharvested old forest should facilitate the perpetuation of most old-growth
dependent processes or organisms and complement the 6,640 ha of adjacent
ecological reserve and park in the Tsitika Valley.
Figure 20 illustrates gross growing stock levels for the total land base. Initially
levels are about 7 million m3 but decline to 5.6 million m3 before recovering in the
longer term to near 6 million m3. The proportion of older forest drops from the
current level of 6.7 million m3 to about 2.3 million m3 in the long term. The 6 million
m3 standing inventory of wood permanently provides the basis for sustainable
timber flow in the long term and provides substantial habitat and other
environmental benefits to supplement values in adjacent park land (6,640 ha).
The proportion of younger growing stock increases initially and then stabilizes at
about 22% of total growing stock. The 71- to 140-year-old growing stock provides
the primary source of sustainable timber production (orange band) through the
simulation.

TFL 25 - Timber Supply Analysis Page 30
0
1,000,000
2,000,000
3,000,000
4,000,000
5,000,000
6,000,000
7,000,000
8,000,000
2002
2012
2022
2032
2042
2052
2062
2072
2082
2092
2102
2112
2122
2132
2142
2152
2162
2172
2182
2192
2202
2212
2222
2232
2242
Year
Volu
me
(m3)
>=140 years 71-140 years <=70 years annual harvest
Figure 20. Merchantable growing stock on total Block 3 land base through 250
years
0
1,000,000
2,000,000
3,000,000
4,000,000
5,000,000
6,000,000
7,000,000
8,000,000
2002
2012
2022
2032
2042
2052
2062
2072
2082
2092
2102
2112
2122
2132
2142
2152
2162
2172
2182
2192
2202
2212
2222
2232
2242
Year
Volu
me
(m3)
>=140 years 71-140 years <=70 years annual harvest
Figure 21. Merchantable growing stock on Block 3 THLB through 250 years

TFL 25 - Timber Supply Analysis Page 31
By the next century the older growing stock is for the most part, but not entirely, in
reserves or area projected to be unavailable for timber harvest. Figure 21
displays growing stock through time for the THLB only. For non-timber or
scheduling reasons, some timber is held significantly beyond normal rotation ages
and reaches ages in excess of 140 years before being harvested. This harvest
could provide a small but ongoing supply of older stems possibly suitable for
specialty manufacturing or cultural purposes.
Figure 22 below is as per Figure 20 except data is presented on an area basis
rather than a volume basis and simplifies the age class data presented in Figure
19.
Initially the area of old growth declines, the area of young stands increases and
the area of maturing stands remains small. As the transition from old growth
nears completion, at the landscape level old growth area is not replaced by
clearcut area, but rather by maturing 71- to 140-year-old stands.
0
2,000
4,000
6,000
8,000
10,000
12,000
14,000
2002
2012
2022
2032
2042
2052
2062
2072
2082
2092
2102
2112
2122
2132
2142
2152
2162
2172
2182
2192
2202
2212
2222
2232
2242
Year
Area
(ha)
>=140 years 71-140 years <=70 years annual harvest
Figure 22. Age-group areas for Block 3 total land base through 250 years
Figure 22 also clearly demonstrates that the age class distribution is already
different than the natural disturbance type (NDT1) or recent historical range of

TFL 25 - Timber Supply Analysis Page 32
natural variability for the area would dictate. Clearly any attempt to impose or
return to an age class distribution representative of infrequent disturbances would
be very difficult and create timber shortages.
Figure 23 presents growing stock in terms of merchantable volume and area that
is larger than the minimum harvestable12 DBHq.
TFL 25 Blk 3: Growing Stock/Area CMA: 88 ha mDBHq: 43/38/34
0
2,000
4,000
6,000
8,000
10,000
12,000
14,000
2002
2012
2022
2032
2042
2052
2062
2072
2082
2092
2102
2112
2122
2132
2142
2152
2162
2172
2182
2192
2202
2212
2222
2232
2242
2252Period
ha
0
1,000,000
2,000,000
3,000,000
4,000,000
5,000,000
6,000,000
7,000,000
8,000,000
m3
Total Landbase (ha) THLB (ha)Area>=mDBHq - THLB (ha) Area>=mDBHq - Total LB (ha)Volume >= mDBHq - THLB (m3) Volume >= mDBHq - Total LB (m3)
Figure 23. Merchantable growing stock in harvestable (>mDBHq) stands through
250 years for Block 3.
Roughly 3,250 ha or 26% of the productive land base is unavailable for harvesting
for the long term. Because the locations of future Wildlife Tree Patches and
partial retention along streams or elsewhere could not be easily predicted, they
were modelled as a yield curve volume net down. Consequently these net downs
are not represented in any of the aforementioned Figures and the actual volume
and/or hectares illustrated understate the old forest reserved from harvest by
about 5% of THLB area or volume.
On the THLB, harvestable stands become less available and at the pinch point
955 ha, or roughly 11 years worth of harvesting at the indicated harvest level, is of
harvestable size. Two decades past the pinch point, this drops to 285 ha or only

TFL 25 - Timber Supply Analysis Page 33
3 years worth of harvesting suggesting that adjacency or cover factors are
important at the pinch point but thereafter become less important as newly
recruited stands are harvested soon after mDBHq is attained. By this point the
annual harvest area recommendation makes near optimal use of the land base’s
residual timber capacity. Operational flexibility in the selection of harvest
locations can be expected to be most limited around pinch points at 2102 and
2152.
A strategic focus for silviculture treatments could be to increase the harvestability
of stands around the 2082 pinch point and through the 2092-2181 period where
area available for harvesting is projected to be lowest. A second objective would
be to increase volume/ha during the anticipated dips from 2042 to 2061 and 2102
through 2192 (Figure 18). Otherwise silviculture treatments which increase the
future volume, merchantability or quality of stands maturing within the next
century may be more or less equal in terms of strategic importance and should
therefore be ranked using stand-level financial analysis.
5.2 Alternate Harvest Levels
5.2.1 10% Increase
Figure 24 shows that a higher area harvest request induces area and volume
shortfalls at the transition to second growth and several points in the simulation
thereafter. Average harvest age and DBHq dips sooner and remains somewhat
lower in the long term. Average volume per hectare is lower and declining in the
longer term as stands are harvested earlier than was the case in the current
management run. Note that relative to the current management simulation, this
run produces slightly more volume (267,522 m3 or 1.4%) through 250 years
(Appendix V-B, Table 12), most of which is realized in the nearer terms.

TFL 25 - Timber Supply Analysis Page 34
TFL 25 Blk 3 CMA_up10: 96.8 ha mDBHq: 43/38/34
0
100
200
300
400
500
600
700
800
900
1,000
1,100
2002
2012
2022
2032
2042
2052
2062
2072
2082
2092
2102
2112
2122
2132
2142
2152
2162
2172
2182
2192
2202
2212
2222
2232
2242
2252Period
m3 /h
a, D
BHq
- mm
0
20
40
60
80
100
120
140
160
180
200
220
240
260
Area
Har
vest
ed -
ha, H
arve
st V
ol. -
m3 X
100
0, A
ge
Mean volume (m3/ha) Mean DBHq Area harvest (ha/yr)Volume harvest (m3/yr) Mean age CMA
Figure 24. Block 3 harvest statistics18 through 250 years for current management
area harvest plus 10%
5.2.2 10% Decrease
Lowering the harvest request level by 10% (Figure 25) has the effect in the short
plus mid term of lowering the harvest volume in proportion (-10.4%) to the area
change. This is because existing old growth stands are assumed to be neither
adding nor losing volume through time. Once second growth becomes an
appreciable component of the harvest profile, harvest age and DBHq are
significantly higher (longer rotation) with the result that stand volumes per hectare
at harvest are higher as well. This tends to compensate for the loss of area
harvested such that the overall volume harvest is less affected in the longer term
(-4.6%) (Appendix V-B, Table 12).
18 Dashed lines in background represent current management statistics.

TFL 25 - Timber Supply Analysis Page 35
TFL 25 Blk 3 CMA_down10: 79.2 ha mDBHq: 43/38/34
0
100
200
300
400
500
600
700
800
900
1,000
1,100
2002
2012
2022
2032
2042
2052
2062
2072
2082
2092
2102
2112
2122
2132
2142
2152
2162
2172
2182
2192
2202
2212
2222
2232
2242
2252Period
m3 /h
a, D
BHq
- mm
0
20
40
60
80
100
120
140
160
180
200
220
240
260
Area
Har
vest
ed -
ha, H
arve
st V
ol. -
m3 X
100
0, A
ge
Mean volume (m3/ha) Mean DBHq Area harvest (ha/yr)Volume harvest (m3/yr) Mean age CMA
Figure 25. Block 3 harvest statistics through 250 years for current management
area harvest less 10%
5.3 Sensitivity Analyses
Harvest output statistics for all sensitivity runs are presented in Appendix V-A. In
the harvest output graphs, decreases in area harvest relative to the base case are
presented both unadjusted and as a new flat line. For increases in harvest
opportunity, a new, higher, flat-line harvest level was established. Flat-line flows
were established by increasing area harvest requested until a deficit occurred,
and then dropping back to the nearest whole number where the deficit
disappears. Appendix V-B (p.103) summarizes changes in area (Table 10, Table
11) and near, mid, and long term volume (Table 12).
Table 4 presents the area results of sensitivity analyses for Block 3.

TFL 25 - Timber Supply Analysis Page 36
Block 3 is most sensitive to changes that alter the minimum harvest age (-SI3m,
+/- age). Removing the area operable only by helicopter has an impact (-9.1%),
about proportional to the 8.9% of the THLB excluded from the simulation.
Visual quality is an important issue along the shores of Johnstone Strait and
further reducing the allowable disturbance in this area had an impact of –8.0%.
Table 4. Block 3 Sensitivity Results
HarvestRun ID (ha) (ha) %CMA 88 - - Area-based current management option
+Oe 90 2.0 2.3 Include Oce and Ohe polygons in THLB (2.3% of THLB)
-Oh 80 -8.0 -9.1 Remove helicopter operable polygons (8.9% of THLB)
-SI3m 71 -17.0 -19.3 Reduce SI estimates for age class 1-2 and future stands by 3m
-age 101 13.0 14.8 Lower minimum harvest age by decreasing mDBHq by 3 cm
+age 74 -14.0 -15.9 Increase minimum harvest age by increasing mDBHq by 3 cm
-RndAge 84 -4.0 -4.5 Uses the mDBHq ages rounded up to the nearest 10th year (effectively adds 5 years to mDBHq)
-midVQ 81 -7.0 -8.0 Use mid range disturbance target
Change Description

TFL 25 - Timber Supply Analysis Page 37
6.0 Block 5 Analysis (Central Coast)
6.1 Current Management
6.1.1 Protected Area Candidates Included – 492 ha/year
Figure 26 summarizes for the current management or “base case” simulation, the
trends for harvest variables including timber volume, harvest age, mean stand
diameter (DBHq), and proportion of helicopter harvesting.
TFL 25 Blk 5 CMA: 492 ha mDBHq: 47/42/37
0
100
200
300
400
500
600
700
800
900
1,000
1,100
1,200
2002
2012
2022
2032
2042
2052
2062
2072
2082
2092
2102
2112
2122
2132
2142
2152
2162
2172
2182
2192
2202
2212
2222
2232
2242
2252
First Year of Period
m3 /h
a, D
BH
q - m
m
0
50
100
150
200
250
300
350
400
450
500
550
600
Area
Har
vest
ed -
ha, H
arve
st V
ol. -
m3 X
10
00, A
ge
Mean Volume (m3/ha) Mean DBHq Area harvest (ha/yr) Mean age
Volume harvest (m3/yr) Heli (m3/yr) Heli (ha/yr)
Figure 26. Block 5 Current Management harvest statistics through 250 years19
In this Block the primary transition to second growth is not forecast to occur until
the start of the next century hence average stand age at harvest climbs until
second growth harvesting becomes common. Mean diameters of harvested
19 Red arrow indicates point where an area harvest deficit occurs if harvest request is increased by 1 ha.

TFL 25 - Timber Supply Analysis Page 38
stands remain relatively constant as existing old stands are assumed to neither
grow or decline. However a slight downward trend in DBHq, a flattening harvest
age trend, and a slow increase in volume per hectare are evident after sixty
years, indicating that a small proportion of second growth begins contributing to
the harvest before the primary transition occurs. The bulk of the harvest will be
from old forest for at least the next one hundred years.
The primary transition to second growth occurs rapidly within a 30-year period as
harvest age and DBHq drop sharply. As the transition progresses average
merchantable stand volumes at harvest increase from under 650 m3/ha to the
1000-1070 m3/ha range in the long term. This effect is primarily related to
expected gains from current silviculture practices. As neither site series
ecological mapping nor a Vegetation Resource Inventory have been completed
for this Block, the second growth yield forecasts used are less certain than in
other Blocks. It is conceivable that second growth yield is overstated, yet the
volumes/ha indicated are comparable to Block 5 where both ecological mapping
and VRI have been recently completed or updated. In any event, the harvest for
the foreseeable future is not second growth dependent.
As the area harvest is constant, annual harvest volumes increase11 in tandem with
the increasing stand volumes. In the long term, ages at harvest average 120-124
years and average harvest diameters are around 42-44 cm (individual stands
ranging up to 65+ cm).
In this Block the indicated harvest level is well below the LRSA and slightly below
mLRSA calculations (Table 1, p.6), suggesting that near the pinch point (circa
2142) and beyond stands are on average harvested near the threshold minimum
harvest age needed to ensure profitability and well beyond the culmination of
mean annual increment.
Harvest from helicopter-operable polygons averages 83 ha per year through the
simulation.
Age class distributions are examined in Figure 27. On the THLB, the younger age
classes initially increase from current levels and then stabilize through the

TFL 25 - Timber Supply Analysis Page 39
remainder of the simulation. Second growth stands in the 61-100 age classes do
not increase significantly until the second century and then stabilize. 101- to 200-
year-old stands build modestly through the simulation and 250 years into the
simulation occupy more area than at present. On the THLB the oldest stands
decline dramatically through the first half of the simulation as old forest is
harvested but small amounts do remain indefinitely.
-
20,000
40,000
60,000
80,000
100,000
120,000
140,000
0 - 20 21 - 40 41 - 60 61 - 80 81 - 100 101 - 120 121 - 140 141 - 200 200+Age Class Group (years)
Fore
sted
Are
a (h
a)
-
2 0, 000
4 0, 000
6 0, 000
8 0, 000
1 00, 000
1 2 0, 000
1 4 0, 000
total forested Harvest Period: 2002 2052 2102 2152 2202 2252
Figure 27. Age class progression on Block 5 THLB (+ total forested) for current
management through 250 years
On the total forest land base, forest greater than 200 years old declines from the
current level of just under 140,000 ha to about 63% of that level in the long term.
At least 88,000 hectares of old forest is forecasted to be present and contributing
to the perpetuation of old-growth dependent processes and organisms in the long
term.
Figure 28 illustrates gross growing stock levels for the total land base. Initially
levels are about 76 million m3 and fall to about 66 million m3 through the old forest

TFL 25 - Timber Supply Analysis Page 40
harvesting phase before recovering to 70 million m3 in the longer term. The
proportion of older forest drops initially from the current level of 74 million m3 to
about 43 million m3 and then stabilizes near 44 million m3 in the long term. The
66-76 million m3 standing inventory of wood permanently provides the basis for
sustainable timber flow in the long term and provides substantial habitat and other
environmental benefits supplementing values present in the adjacent Fiordland
Recreation Area (84,750 ha).
0
10,000,000
20,000,000
30,000,000
40,000,000
50,000,000
60,000,000
70,000,000
80,000,000
90,000,000
2002
2012
2022
2032
2042
2052
2062
2072
2082
2092
2102
2112
2122
2132
2142
2152
2162
2172
2182
2192
2202
2212
2222
2232
2242
Year
Volu
me
(m3 )
>=140 years 71-140 years <=70 years annual harvest
Figure 28. Merchantable growing stock on total Block 5 land base through 250 years
The proportion of younger growing stock increases gradually and then stabilizes
at about 11% of total growing stock. The 71- to 140-year-old growing stock,
amounting to 26% of total growing stock in the long term, provides the primary
source of sustainable timber production through the simulation (represented by
the thickness of the orange “line”).
The older growing stock is for the most part, but not entirely, in reserves or area
projected to be unavailable for timber harvest. Figure 29 displays growing stock
through time for the THLB only. For non-timber reasons, 9-12% of growing stock
is held significantly beyond normal rotation ages and reaches ages in excess of

TFL 25 - Timber Supply Analysis Page 41
140 years before other stands become equally or more suitable for satisfying the
model’s non-timber objective(s). When this timber is released, its harvest could
provide a small but ongoing supply of older stems possibly suitable for specialty
manufacturing or cultural purposes.
0
10,000,000
20,000,000
30,000,000
40,000,000
50,000,000
60,000,000
70,000,000
80,000,000
90,000,000
2002
2012
2022
2032
2042
2052
2062
2072
2082
2092
2102
2112
2122
2132
2142
2152
2162
2172
2182
2192
2202
2212
2222
2232
2242
Year
Vol
ume
(m3 )
>=140 years 71-140 years <=70 years annual harvest
Figure 29. Merchantable growing stock on Block 5 THLB through 250 years
Figure 30 below is as per Figure 28 except data is presented on an area basis
rather than a volume basis and simplifies the age class data presented in Figure
27.
The area of old forest declines gradually and the area of young forest increases in
proportion through the first 70 years. As the transition to second growth
harvesting approaches, the area of younger forest stabilizes and the area of
maturing forest builds to provide the basis of a sustainable second growth harvest
after the transition. Even in the long term, old forests would dominate this
landscape.
Figure 31 presents growing stock in terms of merchantable volume and area that
is larger than the minimum harvestable12 DBHq.

TFL 25 - Timber Supply Analysis Page 42
0
50,000
100,000
150,000
200,000
2002
2012
2022
2032
2042
2052
2062
2072
2082
2092
2102
2112
2122
2132
2142
2152
2162
2172
2182
2192
2202
2212
2222
2232
2242
Year
Area
(ha)
>=140 years 71-140 years <=70 years annual harvest
Figure 30. Age-group areas for Block 5 total land base through 250 years
Roughly 86,000 ha or 59% of the productive land base is unavailable for
harvesting for the long term. Because the locations of future Wildlife Tree
Patches, partial harvests along streams, or retention associated with ecosystem-
based management could not be easily predicted, they were modelled as a yield
curve volume net down. Consequently these net downs are not represented in
any of the aforementioned Figures and the actual volume and/or hectares
illustrated understate the old forest reserved from harvest by about 8.5% of THLB
area or volume.
On the THLB, harvestable stands become less available until the pinch point and
at 2152 amount to about 2,900 ha, or roughly 6 years worth of harvesting at the
indicated harvest level. This confirms that the annual harvest area
recommendation, after considering non-timber values, makes more or less
optimal use of the land base’s residual timber capacity while maintaining flexibility
to locate harvest blocks. Operational flexibility in the selection of harvest locations
can be expected to be most limited through the 2142 through 2181 period where
that ration or harvestable area to annual harvest is lowest.

TFL 25 - Timber Supply Analysis Page 43
TFL 25 Blk 5 Growing Stock/Area CMA: 492 ha mDBHq: 47/42/37
0
20,000
40,000
60,000
80,000
100,000
120,000
140,000
160,000
2002
2012
2022
2032
2042
2052
2062
2072
2082
2092
2102
2112
2122
2132
2142
2152
2162
2172
2182
2192
2202
2212
2222
2232
2242
2252Period
ha
0
10,000,000
20,000,000
30,000,000
40,000,000
50,000,000
60,000,000
70,000,000
m3
productive land base (ha) THLB (ha)Area >= mDBHq on THLB (ha) Area >= mDBHq on Total LB (ha)Volume >= mDBHq on THLB (m3) Volume >= mDBHq on Total LB (m3)
Figure 31. Merchantable growing stock in harvestable (>mDBHq) stands through
250 years for Block 5
Silviculture treatments to increase the harvestability or volumes of stands through
the 2142-2181 period may prove worthwhile, but given the modelling and land use
uncertainties involved, require more study before recommendation. Silviculture
treatments which increase the future volume, merchantability or quality of stands
may be more or less equal in terms of strategic importance and should therefore
be ranked using stand-level financial analysis.
6.1.2 Protected Area Candidates Excluded – 364 ha/year
Figure 32 summarizes the current management simulation with Candidate
Protected areas excluded. Trends for harvest variables including timber volume,
harvest age, mean stand diameter (DBHq), and proportion of helicopter
harvesting are presented.
In this simulation the output statistics and characteristics relative to the base case
- with the large exceptions of area and volume harvested - are relatively
unchanged. Annual area and short term volume harvest are reduced by 26% or

TFL 25 - Timber Supply Analysis Page 44
128 ha and 74,000 m3/year. In the long term the impact is greater as annual
volume harvest is reduced 128,000 m3/year (27%) by the end of the simulation.
TFL 25 Blk 5 CMA-PA: 364ha mDBHq: 47/42/37
0
100
200
300
400
500
600
700
800
900
1,000
1,100
1,200
2002
2012
2022
2032
2042
2052
2062
2072
2082
2092
2102
2112
2122
2132
2142
2152
2162
2172
2182
2192
2202
2212
2222
2232
2242
2252Period
m3 /h
a, D
BHq
- mm
0
50
100
150
200
250
300
350
400
450
500
550
600
Area
Har
vest
ed -
ha, H
arve
st V
ol. -
m3 X
100
0, A
ge
Mean volume (m3/ha) Mean DBHq Area harvest unadjustedVolume harvest (m3/yr) Mean age Area harvest (ha/yr)
Figure 32. Block 5 Current Management with Candidate Protection Areas
excluded - harvest statistics through 250 years20
6.2 Alternate Harvest Levels
6.2.1 10% Increase
Figure 33 shows that a higher area harvest request induces area and volume
shortfalls at the transition to second growth and advances the transition by a
decade. Note that the volume trough created at 2112 remains above volume
estimates for the next 80 years. Average harvest age and DBHq dips sooner but
is only slightly lower in the long term. Average volume per hectare trends
somewhat lower in the long term. Note that relative to the current management
20 Dashed lines in background represent current management statistics.

TFL 25 - Timber Supply Analysis Page 45
simulation, this run produces more volume (5,789,110 m3 or 23,200 m3 annually
on average) through 250 years (see Appendix V-B, Table 12).
TFL 25 Blk 5 CMA_up10: 541.2 ha mDBHq: 47/42/37
0
100
200
300
400
500
600
700
800
900
1,000
1,100
1,2002002
2012
2022
2032
2042
2052
2062
2072
2082
2092
2102
2112
2122
2132
2142
2152
2162
2172
2182
2192
2202
2212
2222
2232
2242
2252Period
m3 /h
a, D
BHq
- mm
0
50
100
150
200
250
300
350
400
450
500
550
600
Area
Har
vest
ed -
ha, H
arve
st V
ol. -
m3 X
100
0, A
ge
Mean volume (m3/ha) Mean DBHq Area harvest (ha/yr)Volume harvest (m3/yr) Mean age CMA
Figure 33. Block 5 harvest statistics through 250 years for current management
area harvest plus 10%
6.2.2 10% Decrease
Lowering the harvest request level by 10% (Figure 34) has the effect in the short
plus mid term of lowering the harvest volume in proportion (-10.0%) to the harvest
area change. This is because existing old growth stands are assumed to be
neither adding nor losing volume through time. Once second growth becomes an
appreciable component of the harvest profile, harvest age and DBHq are higher
(longer rotation) with the result that stand volumes per hectare at harvest are
higher as well. This tends to compensate for the loss of area harvested such that
the overall volume harvest is somewhat less affected in the longer term (-9.2%)
(Appendix V-B, Table 12) and near the end of the simulation (-4 to -7%).

TFL 25 - Timber Supply Analysis Page 46
TFL 25 Blk 5 CMA_down10: 442.8 ha mDBHq: 47/42/37
0
100
200
300
400
500
600
700
800
900
1,000
1,100
1,200
2002
2012
2022
2032
2042
2052
2062
2072
2082
2092
2102
2112
2122
2132
2142
2152
2162
2172
2182
2192
2202
2212
2222
2232
2242
2252Period
m3 /h
a, D
BHq
- mm
0
50
100
150
200
250
300
350
400
450
500
550
600
Area
Har
vest
ed -
ha, H
arve
st V
ol. -
m3 X
100
0, A
ge
Mean volume (m3/ha) Mean DBHq Area harvest (ha/yr)Volume harvest (m3/yr) Mean age CMA
Figure 34. Block 5 harvest statistics20 through 250 years for current management
area harvest less 10%
6.3 Sensitivity Analyses
Harvest output statistics for all sensitivity runs are presented in Appendix V-A. In
the harvest output graphs, decreases in area harvest relative to the base case are
presented both unadjusted and as a new flat line. For increases in area harvest,
a new, higher, flat-line harvest level was established. Flat-line flows were
established by increasing area harvest requested until a deficit occurred, and then
dropping back to the nearest whole number where the deficit disappears.
Appendix V-B (p.103) summarizes changes in area (Table 10, Table 11) and
near, mid, and long term volume (Table 12).
Table 5 presents the area results of sensitivity analyses for Block 5.

TFL 25 - Timber Supply Analysis Page 47
Table 5. Block 5 Sensitivity results
Harvest HarvestRun ID (ha) (ha) % (ha) (ha) %CMA 492 - - 364 -128 -26.0 Area-based current management option
+Oe 511 19 3.9 - Include Oce and Ohe polygons in THLB (4.7 % of THLB)
-Oh 404 -88 -17.9 - Remove helicopter operable polygons (18.0% of THLB)
-SI3m 434 -58 -11.8 323 -41 -11.3 Reduce SI estimates for age class 1-2 and future stands by 3m
-age 559 67 13.6 409 45 12.4 Lower minimum harvest age by decreasing mDBHq by 3 cm
+age 448 -44 -8.9 336 -28 -7.7 Increase minimum harvest age by increasing mDBHq by 3 cm
-RndAge 483 -9 -1.8 358 -6 -1.6 Uses the mDBHq ages rounded up to the nearest 10th year (effectively adds 5 years to mDBHq)
-PA 364 -128 -26.0 - Remove protected area candidates as identified in April, 2001 announcement
-PA-OA 206 -286 -58.1 - As above and also remove Option Areas identified in April, 2001 announcement
-midVQ 477 -15 -3.0 349 -15 -4.1 Use mid range disturbance target
+BEO 492 0 0.0 364 0 0.0 Apply specific BEOs to draft or legislated landscape units where not included in CM0
-SsSIest 469 -23 -4.7 347 -17 -4.7 Adjust SI so that Good site Spruce SI=34m instead of 39m - Piece size remains 47-42-37
Change DescriptionChangeCMA-PA
Removal of the Candidate Protected Areas identified in the April, 2001 agreement
will result in a 26% reduction of area harvest. Additional removal of the Option
Areas identified at that time would result in a total area harvest reduction of 58%
or 286 ha.
Land base reductions aside, Block 5 is most sensitive to changes that alter the
minimum harvest age (-SI3m, +/- age). Removing the area operable only by
helicopter has an impact proportional to the THLB excluded from the simulation.
Visual quality is an important issue along the Inside Passage and further reducing
the allowable disturbance in this area had an impact of –3.0%.

TFL 25 - Timber Supply Analysis Page 48
7.0 Block 6 Analysis (Haida Gwaii)
7.1 Current Management - 254 ha/year
Figure 35 summarizes for the current management or “base case” simulation, the
trends for harvest variables including timber volume, harvest age, mean stand
diameter (DBHq), and proportion of helicopter harvesting.
TFL 25 Blk 6 CMA: 254 ha mDBHq: 47/42/37
0
100
200
300
400
500
600
700
800
900
1,000
1,100
1,200
1,300
1,400
2002
2012
2022
2032
2042
2052
2062
2072
2082
2092
2102
2112
2122
2132
2142
2152
2162
2172
2182
2192
2202
2212
2222
2232
2242
2252
First Year of Period
m3 /h
a, D
BH
q - m
m
0
20
40
60
80
100
120
140
160
180
200
220
240
260
280
300
320
340
Area
Har
vest
ed -
ha, H
arve
st V
ol. -
m3 X
10
00, A
geMean Volume (m3/ha) Mean DBHq Area harvest (ha/yr) Mean age
Volume harvest (m3/yr) Heli (m3/yr) Heli (ha/yr)
Figure 35. Block 6 Current Management harvest statistics through 250 years21
In this Block the transition to second growth is expected within the next few
decades. As this occurs, average age of harvested stands declines abruptly until
the transition is complete. Average DBHq at harvest declines from around 51 cm
at present to 44 cm after 30 years and rebuilds to 47-50 cm in the long term.
Within twenty years average merchantable stand volumes at harvest start to

TFL 25 - Timber Supply Analysis Page 49
increase from current levels of under 600 m3/ha and rapidly rise to in excess of
1,100 m3/ha within 70 years. This effect is related to maturing second growth
becoming available for harvest. Current AAC has been significantly depressed
due to the age class imbalance created by the 1988 withdrawal of Gwaii Haanas
reserve from forest management. Expected gains from current silviculture
practices add to the second growth fall up11 later in the simulation. As the area
harvest is constant, annual harvest volumes increase in tandem with the
increasing stand volumes. In the long term, ages at harvest average 93-98 years
and average harvest diameters are around 47-50 cm (individual stands ranging
37-70+ cm).
In this Block the indicated harvest level is less than the LRSA and mLRSA
calculations (Table 1, p.6), suggesting that throughout the simulation and even at
the pinch point circa 2042 stands are on average harvested well beyond
culmination of mean annual increment and the threshold minimum harvest age
needed to ensure profitability.
Harvesting in helicopter-operable polygons makes up about 60 ha annually in the
short term, but on average 11% or 28 ha per year of the annual harvest is from
helicopter polygons. In the current model set-up there is no satisfactory method
to regulate the helicopter portion within the overall area regulation so the short
term heli-portion may be overstated. The appropriate level of harvesting from
helicopter-operable polygons is discussed further in section 7.3.
Age class distributions are examined in Figure 38. On the THLB, the 21-60 age
classes initially decline from current levels (which reflect a larger pre-1988 AAC
and the concentration of early harvesting on the northern portion of Moresby
Island) and then stabilize through the remainder of the simulation. Older (61- to
120-year-old) second growth age classes increase significantly in the first 50-year
period and then stabilize. 121- to 250-year-old stands remain present in low
abundance throughout the simulation. On the THLB the oldest stands decline in
the first 50 years from 6,000 ha to 200 ha as the transition to second growth
harvesting is completed.
21 Red arrow indicates point where an area harvest deficit occurs if harvest request is increased by 1 ha.

TFL 25 - Timber Supply Analysis Page 50
-
2,000
4,000
6,000
8,000
10,000
12,000
14,000
16,000
18,000
20,000
22,000
0 - 20 21 - 40 41 - 60 61 - 80 81 - 100 101 - 120 121 - 140 141 - 250 251+Age Class Group (years)
Fore
sted
Are
a (h
a)
-
2 , 000
4 , 000
6 , 000
8 , 000
1 0, 000
1 2 , 000
1 4 , 000
1 6 , 000
1 8 , 000
2 0, 000
2 2 , 000
total forested Harvest Period: 2002 2052 2102 2152 2202 2252
Figure 36. Age class progression on Block 6 THLB (+ total forested) for current
management through 250 years
On the total forest land base, forest greater than 250 years old declines from the
current level of just under 20,000 ha to about 18,000 ha and then rebuilds to
above the 21,000 ha level as 141- to 250-year-old stands are recruited into the
oldest age class. In this landscape, the future proportion of old forest remains
essentially unaltered from current conditions.
Figure 37 illustrates gross growing stock levels for the total land base. Initially
levels are about 17.5 million m3 and rise above 25 million m3 in the longer term.
The proportion of older forest drops initially from the current level of about 12.5
million m3 to about 9 million m3 and then stabilizes near 12 million m3 in the long
term. This building standing inventory of wood permanently provides the basis for
sustainable timber flow in the long term and provides substantial habitat and other
environmental benefits to supplement values in the adjacent Gwaii Haanas
reserve (148,500 ha). The proportion of younger growing stock increases initially
and then stabilizes at about 24% of total growing stock. The 71- to 140-year-old

TFL 25 - Timber Supply Analysis Page 51
growing stock provides the primary source of sustainable timber production
through the simulation and increases from near nil initially to 28% in the long term.
0
5,000,000
10,000,000
15,000,000
20,000,000
25,000,000
30,000,000
2002
2012
2022
2032
2042
2052
2062
2072
2082
2092
2102
2112
2122
2132
2142
2152
2162
2172
2182
2192
2202
2212
2222
2232
2242
2252
Year
Volu
me
(m3 )
>=140 years 71-140 years <=70 years annual harvest
Figure 37. Merchantable growing stock on total Block 6 land base through 250 years
The older growing stock is for the most part, but not entirely, in reserves or area
projected to be unavailable for timber harvest. Figure 38 displays growing stock
through time for the THLB only. For non-timber or scheduling reasons, some
timber is held significantly beyond normal rotation ages and reaches ages in
excess of 140 years before other stands become equally or more suitable for
satisfying non-timber objective(s). When this timber is released, its harvest could
provide a small but ongoing supply of older stems possibly suitable for specialty
manufacturing or cultural purposes.
Figure 39 is as per Figure 37 except data is presented on an area basis rather
than a volume basis and simplifies the age class data presented in Figure 36.
Initially the area of old growth declines, the area of maturing stands increases,
and the area of younger stands expands and then contracts. Contrary to popular
opinion, as the transition from old growth progresses, at the landscape level old

TFL 25 - Timber Supply Analysis Page 52
0
5,000,000
10,000,000
15,000,000
20,000,000
25,000,000
30,000,000
2002
2012
2022
2032
2042
2052
2062
2072
2082
2092
2102
2112
2122
2132
2142
2152
2162
2172
2182
2192
2202
2212
2222
2232
2242
2252
Year
Volu
me
(m3 )
>=140 years 71-140 years <=70 years annual harvest
Figure 38. Merchantable growing stock on Block 6 THLB through 250 years
0
5,000
10,000
15,000
20,000
25,000
30,000
35,000
40,000
45,000
50,000
2002
2012
2022
2032
2042
2052
2062
2072
2082
2092
2102
2112
2122
2132
2142
2152
2162
2172
2182
2192
2202
2212
2222
2232
2242
Year
Area
(ha)
>=140 years 71-140 years <=70 years annual harvest
Figure 39. Age-group areas for Block 6 total land base through 250 years
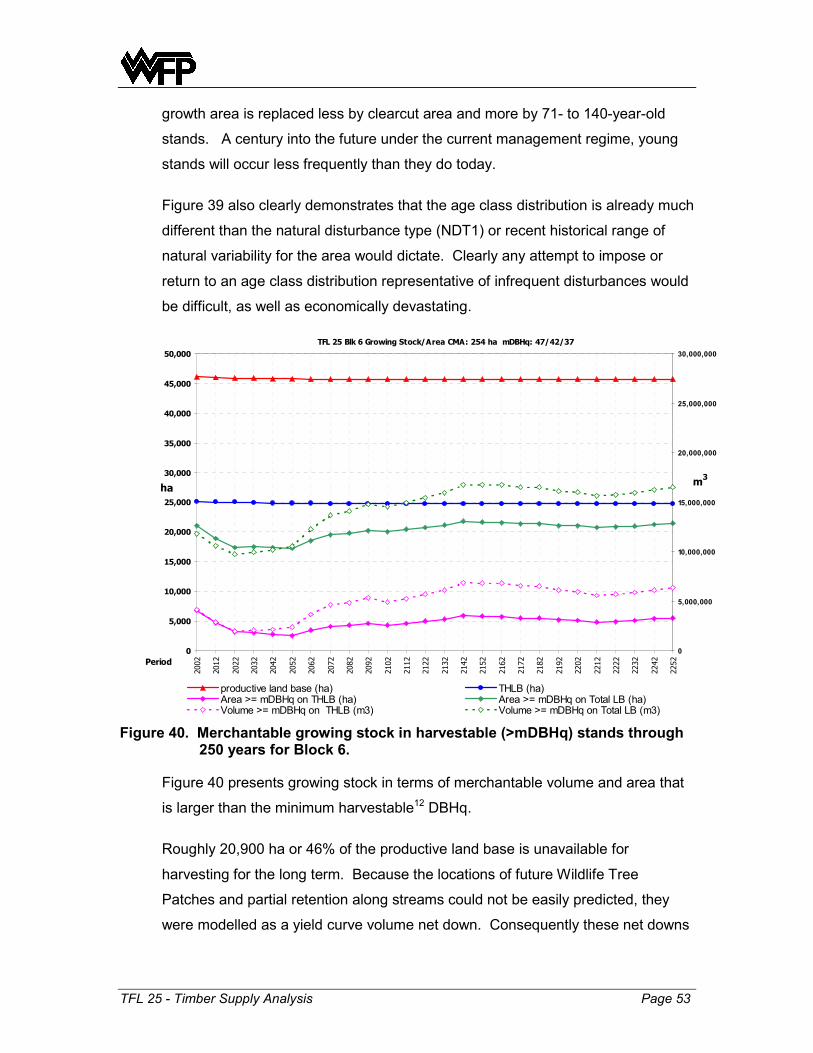
TFL 25 - Timber Supply Analysis Page 53
growth area is replaced less by clearcut area and more by 71- to 140-year-old
stands. A century into the future under the current management regime, young
stands will occur less frequently than they do today.
Figure 39 also clearly demonstrates that the age class distribution is already much
different than the natural disturbance type (NDT1) or recent historical range of
natural variability for the area would dictate. Clearly any attempt to impose or
return to an age class distribution representative of infrequent disturbances would
be difficult, as well as economically devastating.
TFL 25 Blk 6 Growing Stock/Area CMA: 254 ha mDBHq: 47/42/37
0
5,000
10,000
15,000
20,000
25,000
30,000
35,000
40,000
45,000
50,000
2002
2012
2022
2032
2042
2052
2062
2072
2082
2092
2102
2112
2122
2132
2142
2152
2162
2172
2182
2192
2202
2212
2222
2232
2242
2252Period
ha
0
5,000,000
10,000,000
15,000,000
20,000,000
25,000,000
30,000,000
m3
productive land base (ha) THLB (ha)Area >= mDBHq on THLB (ha) Area >= mDBHq on Total LB (ha)Volume >= mDBHq on THLB (m3) Volume >= mDBHq on Total LB (m3)
Figure 40. Merchantable growing stock in harvestable (>mDBHq) stands through
250 years for Block 6.
Figure 40 presents growing stock in terms of merchantable volume and area that
is larger than the minimum harvestable12 DBHq.
Roughly 20,900 ha or 46% of the productive land base is unavailable for
harvesting for the long term. Because the locations of future Wildlife Tree
Patches and partial retention along streams could not be easily predicted, they
were modelled as a yield curve volume net down. Consequently these net downs

TFL 25 - Timber Supply Analysis Page 54
are not represented in any of the aforementioned Figures and the actual volume
and/or hectares illustrated understate the old forest reserved from harvest by
about 5% of THLB area or volume.
On the THLB, harvestable stands become less available until the transition to
second growth is complete and at the lowest point 2,557 ha are of harvestable
size. This represents ten years worth of harvesting at the indicated harvest level.
Operational flexibility in the selection of harvest locations can be expected to be
most limited during the coming decades from 2012 through 2071.
A strategic focus for silviculture treatments could be to increase the harvestability
of stands through the 2012-2071 period where area available for harvesting is
projected to be lowest. However, there is expected to be ample volume available
through the latter half of this period. Silviculture treatments which increase the
future volume, merchantability or quality of stands beyond 2072 may be more or
less equal in terms of strategic importance and should therefore be ranked using
stand-level financial analysis.
7.2 Alternate Harvest Levels
7.2.1 10% Increase
Figure 41 shows that a higher area harvest request induces area and volume
shortfalls at the transition to second growth. Note that the volume trough created
at 2032 is about equal to the volume harvest levels from 2002-2031. Average
harvest age and DBHq decline somewhat sooner but are notably lower in the long
term. Average volume per hectare is lower in the long term as stands are
harvested earlier than in the CMA simulation. Relative to the current
management simulation, this run produces more volume (2,104,640 m3 or 8,400
m3 annually on average) through 250 years (see Appendix V-B). In the short term
volume harvest is 9.9% higher but in the long term the volume harvest increases
only 3.0%.

TFL 25 - Timber Supply Analysis Page 55
TFL 25 Blk 6 CMA_up10: 279.4ha mDBHq: 47/42/37
300
400
500
600
700
800
900
1,000
1,100
1,200
1,300
1,400
2002
2012
2022
2032
2042
2052
2062
2072
2082
2092
2102
2112
2122
2132
2142
2152
2162
2172
2182
2192
2202
2212
2222
2232
2242
2252Period
m3 /h
a, D
BHq
- mm
0
50
100
150
200
250
300
350
Area
Har
vest
ed -
ha, H
arve
st V
ol. -
m3 X
100
0, A
ge
Mean volume (m3/ha) Mean DBHq Area harvest (ha/yr)Volume harvest (m3/yr) Mean age CMA
Figure 41. Block 6 harvest statistics22 through 250 years for current management
area harvest plus 10%
7.2.2 10% Decrease
Lowering the harvest request level by 10% (Figure 42) has the effect in the short
term of lowering the harvest volume in proportion (-10.3%) to the harvest area
change. This is because existing old growth stands are assumed to be neither
adding nor losing volume through time. Once second growth becomes an
appreciable component of the harvest profile, harvest age and DBHq are higher
(longer rotation) with the result that stand volumes per hectare at harvest become
higher as well. The higher volume per hectare tends to compensate for the loss
of area harvested such that the overall volume harvest is less affected in the
longer term (-4.6%) (Appendix V-B).
22 Dashed lines in background represent current management statistics.

TFL 25 - Timber Supply Analysis Page 56
TFL 25 Blk 6 CMA_down10: 228.6 ha mDBHq: 47/42/37
300
400
500
600
700
800
900
1,000
1,100
1,200
1,300
1,400
2002
2012
2022
2032
2042
2052
2062
2072
2082
2092
2102
2112
2122
2132
2142
2152
2162
2172
2182
2192
2202
2212
2222
2232
2242
2252Period
m3 /h
a, D
BHq
- mm
0
50
100
150
200
250
300
350
Area
Har
vest
ed -
ha, H
arve
st V
ol. -
m3 X
100
0, A
ge
Mean volume (m3/ha) Mean DBHq Area harvest (ha/yr)Volume harvest (m3/yr) Mean age CMA
Figure 42. Block 6 harvest statistics23 through 250 years for current management
area harvest less 10%
7.3 Sensitivity Analyses
Harvest output statistics for all sensitivity runs are presented in Appendix V-A. In
the harvest output graphs, decreases in area harvest relative to the base case are
presented both unadjusted and as a new flat line. For increases in area harvest,
a new, higher, flat-line harvest level was established. Flat-line flows were
established by increasing area harvest requested until a deficit occurred, and then
dropping back to the nearest whole number where the deficit disappears.
Appendix V-B (p.103) summarizes changes in area (Table 10, Table 11) and
near, mid, and long term volume (Table 12).
Table 6 presents the area results of sensitivity analyses for Block 6.
23 Dashed lines in background represent current management statistics.

TFL 25 - Timber Supply Analysis Page 57
Table 6. Block 6 Sensitivity results Harvest
Run ID (ha) (ha) %CMA 254 - - Area-based current management option
+Oe 262 8.0 3.1 Include Oce and Ohe polygons in THLB (2.9% of THLB)
-Oh 215 -39.0 -15.4 Remove helicopter operable polygons (10.8% of THLB)
-SI3m 176 -78.0 -30.7 Reduce SI estimates for age class 1-2 and future stands by 3m
-age 283 29.0 11.4 Lower minimum harvest age by decreasing mDBHq by 3 cm
+age 200 -54.0 -21.3 Increase minimum harvest age by increasing mDBHq by 3 cm
-RndAge 229 -25.0 -9.8 Uses the mDBHq ages rounded up to the nearest 10th year (effectively adds 5 years to mDBHq)
-midVQ 239 -15.0 -5.9 Use mid range disturbance target
-Oc 30 -224.0 -88.2 Simulation on THLB accessible by helicopter only to estimate flat line portion of harvest attributable to helicopter harvesting.
UnCon 297 43.0 16.9 Remove all non-timber land base and volume constraints to simulate timber potential.
-Dr 234 -20.0 -7.9 Remove alder leading stands from the harvest flow permanently (no long term succession to conifers).
Change Description
Block 6 is most sensitive to changes that increase the minimum harvest age
(-SI3m, +age) or reduce THLB (-Oh).
As was the case in Block 1, the +/-age sensitivities are not proportional to one and
other.
Reducing the THLB by 11% by removing helicopter-operable area has a
disproportionate negative impact that may be an artefact caused by the
unregulated peak of helicopter activity inherent in the CMA simulation (Figure 35)
immediately prior to the pinch point. However the volume/year vs area/year for
the first three decades indicates that the short term helicopter harvest is old
growth dependent and a higher short term helicopter harvest is important.
Simulations of the harvesting on the conventional land base only (-Oh) indicate a
harvest level of 215 ha, suggesting that no more than 39 ha of helicopter
harvesting is needed annually in the short term to sustain the current
management harvest level. Adding the –Oc and –Oh runs suggests a harvest
level of 245 ha, or 9 ha less than the base case. Therefore the combination of
conventional and helicopter harvesting is synergistic. Cumulative harvesting from
helicopter-operable polygons should exceed 150 ha within the forthcoming five

TFL 25 - Timber Supply Analysis Page 58
years (at least 75% of –Oh change and equal to –Oc result) to ensure future
harvest flow is not disrupted and adjustments, if needed as suggested by the next
TSR, will not be severe.
The flow of red alder volume from the base case simulation and the –Dr
simulation indicate that alder needs to be a significant proportion of the harvest
profile in the short term. The annual volume harvest from stands with an alder
component should be at least 15,000 m3/year24 in the short term and build to
higher levels thereafter as the transition to second growth proceeds.
24 For operational implementation the minimum is stated in terms of volume, rather than area, because alder generally comes from mixed stands that cannot be easily stated on an area basis.

TFL 25 - Timber Supply Analysis Page 59
8.0 Analysis of Combined Blocks
All blocks were combined into one management unit to test the effect of age class
or other synergies among blocks. Combining the blocks resulted in a 24 ha or 2%
increase25 in annual harvest area, suggesting that some synergies between
blocks may be present.
From an operational perspective, a logical block combination could be Blocks 2
and 3 which are in the same geographic vicinity, have relatively small AACs, and
are at remote locations both serviced from east Vancouver Island. However, a
run combining these blocks actually resulted in a harvest level somewhat below
the combined harvest levels suggested earlier. The model seems to harvest
exclusively in each block for extended periods thus creating adjacency and other
bottlenecks. Further investigation is needed to reconfigure the model to prevent
this artefact and properly investigate any potential synergy among Blocks 2 and 3.
9.0 Marginally Economic Opportunity
As part of operability mapping, a significant area of timber was identified as being
“marginally economic”. In other words, it is not economically viable to harvest
these stands during average market conditions as cost estimates exceed
expected revenues. This area is assumed inoperable for the purposes of this
timber supply analysis.
However, during market cycle peaks, stand values would exceed costs so that
such stands could be harvested at a profit. The AAC Determination generally
does not consider this opportunity wood. Even when markets peak and such
stands become profitable, they are seldom the focus of harvesting as other stands
within the regular AAC indicate a higher profit margin.
To realize this opportunity, a regulation mechanism needs to allow a periodic
harvest of marginally economic stands over and above regular AAC. While a
25 These results were based on preliminary modelling. Subsequently input files were corrected for a minor input error but were not recompiled for this combined run as creation of the combined file was onerous. Results would not be expected to change significantly.

TFL 25 - Timber Supply Analysis Page 60
partitioned harvest could accomplish this, harvesting would not be expected for
perhaps many years in succession. If a partition were stated in terms of an
annual allowable harvest there could be a perceived underharvest of the partition
for many years, and then an apparent over harvest once every five to ten years.
A periodic allowable harvest more in sync with market cycles would be the
preferred approach.
For example, the +Oe sensitivity run suggests that the following (Table 7) periodic
harvests could be acceptable.
Table 7. Potential Periodic Harvests of Marginally-Inoperable Polygons
Periodic Harvest (m3/period) TFL
Block
+Oe result
(ha/yr) within 5 year period within 10 year period
1 2 10 20
2 2 10 20
3 2 10 20
5 19 95 190
6 8 40 80
10.0 Cultural Cedar Supply
The normal harvest profiles will contain significant amounts of cedar suitable for
cultural purposes such as bark stripping, small dugouts, poles, carving, or root
collection. Figure 43 presents the projected cedar volume harvest for each block
of the TFL through the next 250 years.
Figure 44 shows the cedar growing stock present through the simulation.
Although there is a modest decline, at no point does the growing stock fall below
82% of current levels.

TFL 25 - Timber Supply Analysis Page 61
0
10,000
20,000
30,000
40,000
50,000
60,000
70,000
80,000
90,000
100,000
110,000
120,000
130,000
140,000
150,000
2002
2012
2022
2032
2042
2052
2062
2072
2082
2092
2102
2112
2122
2132
2142
2152
2162
2172
2182
2192
2202
2212
2222
2232
2242
2252
First Year of Period
m3 /y
ear
Block 1 Block 2 Block 3 Block 5 Block 6
Figure 43. Projected cedar harvest by block through 250 years.
A small but continuous supply of monumental cedar (suitable for large dugouts,
very large poles, split beams and planks) can be expected to be available from
reserved areas including riparian reserves, old-growth management areas, and
other inoperable forests. Wildlife tree patches and other trees retained within
blocks were not included in this analysis and hence cedar retention estimates
herein are underestimated by up to 5-8%.
A crude model was developed to estimate the availability through time of larger or
“monumental” cedar trees suitable for special cultural purposes such as pole
carving and dugout canoe construction. The model is described and discussed in
more detail in Appendix V-D. Table 8 indicates the minimum and average number
of larger diameter (≥70cm) trees predicted through the simulation for each Block.
Although there is variation throughout the simulation, considerable numbers of

TFL 25 - Timber Supply Analysis Page 62
larger cedar trees are forecast and contrary to some speculations such trees do
not disappear.
0
5,000,000
10,000,000
15,000,000
20,000,000
25,000,000
30,000,00020
02
2012
2022
2032
2042
2052
2062
2072
2082
2092
2102
2112
2122
2132
2142
2152
2162
2172
2182
2192
2202
2212
2222
2232
2242
2252
Year
Volu
me
(m3 )
Block 1 Block 2 Block 3 Block 5 Block 6 combined annual harvest
Figure 44. Cedar growing stock and annual harvest volumes through 250 years.
Table 8. Estimated larger diameter (≥ 70 cm) cedar trees available through 2252
Block Minimum Average
1 64,819 86,878
2 210,281 231,430
3 46,817 63,946
5 1,296,297 1,567,810
6 339,366 375,696
Total 1,957,580 2,325,760

TFL 25 - Timber Supply Analysis Page 63
11.0 Uncertainties
In the course of preparing for, and developing this analysis, a number of
uncertainties in the underlying data and assumptions have become evident.
These are listed below in order of perceived potential impact on timber supply and
the direction (area harvest increase/decrease) of the potential change.
+/- The 3.25% volume allowance for future Wildlife Tree Patches
needs to be verified against actual area withdrawals from the
timber harvesting land base for WTP designations. Under area-
based regulation, including WTP/THLB overlap area as part of
the cut1 should allow accurate tracking of the proportion of
WTPs that would otherwise be THLB. This should facilitate
simulation of WTPs as THLB area withdrawals (rather than as
volume net downs) for future analyses.
-/-- Ecosystem Based Management is an evolving concept that
WFP has agreed to test and where feasible implement in parts
of the TFL. It is expected to include increased reserve areas
and use of partial retention silviculture systems28 and at the
same time it is to maintain or enhance the economic feasibility of
forestry. Modelling forest re-growth in response to dispersed,
stand-level partial retention/harvesting remains problematic and
has not been attempted for this analysis. Intuitively, shading,
scarring, and mistletoe effects on regeneration and productivity
seem likely, yet some proponents of selection and other partial
harvest systems suggest productivity is actually improved by
advanced regeneration and efficient capture of photosynthetic
energy. Field studies, calibration of uneven-aged growth models
for coastal use, and development of ecological process models
are needed to forecast the outcomes of heretofore-unknown
silvicultural practices. However, to determine an area-based
harvesting level in an increasingly uneven-aged modelling
environment, mDBHq lessens in modelling importance. Perhaps
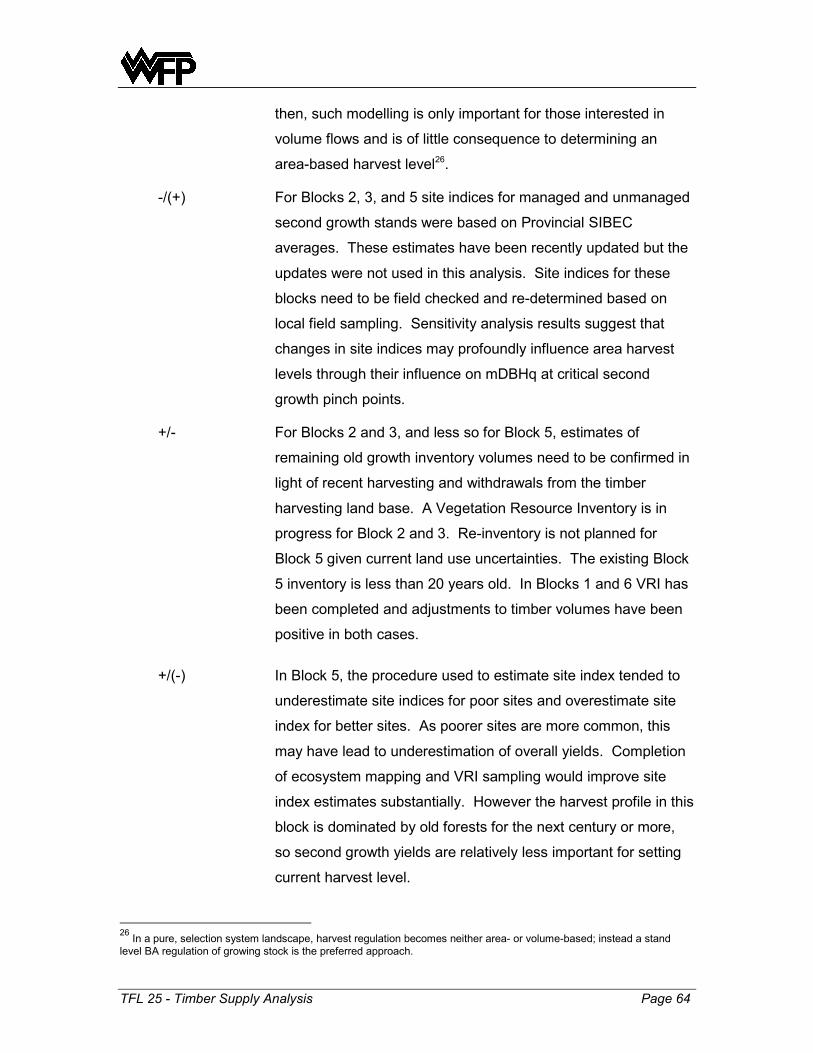
TFL 25 - Timber Supply Analysis Page 64
then, such modelling is only important for those interested in
volume flows and is of little consequence to determining an
area-based harvest level26.
-/(+) For Blocks 2, 3, and 5 site indices for managed and unmanaged
second growth stands were based on Provincial SIBEC
averages. These estimates have been recently updated but the
updates were not used in this analysis. Site indices for these
blocks need to be field checked and re-determined based on
local field sampling. Sensitivity analysis results suggest that
changes in site indices may profoundly influence area harvest
levels through their influence on mDBHq at critical second
growth pinch points.
+/- For Blocks 2 and 3, and less so for Block 5, estimates of
remaining old growth inventory volumes need to be confirmed in
light of recent harvesting and withdrawals from the timber
harvesting land base. A Vegetation Resource Inventory is in
progress for Block 2 and 3. Re-inventory is not planned for
Block 5 given current land use uncertainties. The existing Block
5 inventory is less than 20 years old. In Blocks 1 and 6 VRI has
been completed and adjustments to timber volumes have been
positive in both cases.
+/(-) In Block 5, the procedure used to estimate site index tended to
underestimate site indices for poor sites and overestimate site
index for better sites. As poorer sites are more common, this
may have lead to underestimation of overall yields. Completion
of ecosystem mapping and VRI sampling would improve site
index estimates substantially. However the harvest profile in this
block is dominated by old forests for the next century or more,
so second growth yields are relatively less important for setting
current harvest level.
26 In a pure, selection system landscape, harvest regulation becomes neither area- or volume-based; instead a stand level BA regulation of growing stock is the preferred approach.

TFL 25 - Timber Supply Analysis Page 65
+/- Operational adjustment factors for managed stands were TIPSY
defaults. Field estimates for the more common stand types
would improve estimates of mid to long term yield. Anecdotally
OAF1 net downs may be underestimated for Block 5 where
brush problems abound and herbicide use is restricted and may
be overestimated in Blocks 1, 3, and 6 where stocking tends to
be very good.
+ Historic spacing and fertilization treatments need to be digitized,
entered into the GIS, and appropriately modeled. As the
mDBHq criterion is critical to this analysis, these treatments may
have an important positive impact at the area-based pinch point
by effectively reducing rotation age.
- As retention and partial harvesting systems become more
common both in riparian management and more widely, yield
adjustments to reflect increased shading of crop trees and
harvest damage of residual crop trees will be needed. Long
term estimates of retention and its nature are as yet unreliable
due to the short period of application and variability of
implementation strategies to date.
+ Commercial thinning27,28 is proven in Douglas-fir stands in the
drier variants of the Coastal Western Hemlock Zone and may be
used in future to alleviate timber supply shortfalls. Further
analyses are warranted for Block 1, although recently CT has
proven uneconomic where hemlock is a significant stand
component.
27 For cut control of commercial thinning we suggest that an equivalent clearcut area (ECCA) be calculated to go against area AAC. ECCA would be calculated based on the expected volume opportunity lost at final harvest as follows: ECCACT (ha) = CT (ha) X (BAiptc – BACtaiptc) / BAi where, BAi = initial BA BAiptc = initial BA projected to culmination (or for 20 years if culmination is less than 20 years away.) BACTaiptc = post-CT BA projected to age of BAiptc 28 For cut control of partial cutting in older, less responsive stands we suggest that ECCA be simply harvest area X (BA removed / BAi)

TFL 25 - Timber Supply Analysis Page 66
+ The capability to model future cultural cedar tree availability
would be improved by improving growth and yield data and
modelling of 2nd growth cedar. Samples of older second growth
cedar are uncommon and diameter distributions projected from
current models may be unreliable at older ages. Timber supply
modelling assumptions for regeneration strategies need to be
refined to better reflect current species-specific reforestation
practices for western red cedar and yellow cypress.
-/+ Land base reductions and/or volume net downs for future
riparian management need to be confirmed in light of evolving
practices, shifting expectations, and the relatively short
implementation experience so far. Although no-harvest zones
had dominated earlier management thinking, more recently
there has been a move to more active intervention and flexibility
around streams. If a “disturbed area” model is to be used for cut
control, there will be a need to model partial cut area and basal
area removal.
+ Future tree improvement gains are expected to be larger than
modelled herein. Where the gains are not realized until beyond
pinch points they are expected to have little influence under a
flat line area-regulation scenario.
+/- Higher elevation site index estimates are less certain than for
lower elevation ecosystems where older second growth is
common and site index estimates are more reliable.
+/- These simulations are not optimized for harvest sequencing
(model follows inherent stand database or model priority order)
although variations in harvest sequence may yield higher
harvest levels. This would however be a time consuming
exercise in the current modelling environment. In any case
operational forest development is not inherently optimized either.

TFL 25 - Timber Supply Analysis Page 67
12.0 Recommendations
• Area-regulated harvest level for TFL 25 should be set at 1,250 ha less 8 ha of
non-recoverable losses. This level will ensure that both the timber harvested
for human use and the growing stock performing environmental services
increases for future generations.
• Should economic conditions become favourable, efforts to prove the feasibility
of harvesting in forest types deemed marginally uneconomic (not included in
base case analyses) are to be encouraged. Such harvests should not be
charged against AAC and should be permitted to occur periodically when
conditions allow. We recommend that a marginally economic area allocation29
be allowed to accumulate for a rolling or “evergreen” 10-year period and be
harvestable at the Licensee’s discretion when economic conditions permit.
Based on “+Oe” runs, recommended annual accumulations for Blocks 1, 2, 3,
5, and 6 respectively are: 2, 2, 2, 19, and 8 ha. Therefore within the upcoming
5-year cut control period, harvests by Block could not exceed 10, 10, 10, 95,
and 40 ha respectively.
• A strategic silviculture analysis, if funded, would identify future timber and
habitat shortfalls and devise strategies to alleviate these. As well the analysis
should investigate opportunities for fertilization, thinning, or other interventions
that may lower minimum profitable harvest ages at critical pinch points, and
analyse the outcome of such strategies in terms of habitat availability, timber
volume and quality, and return-on-investment.
• The Licensee should ensure that for the next 5-year cut control period the
area harvested from polygons accessible only by helicopter exceeds the
following (~75% of “-Oh” area change times 5 years) for each Block:
• Block 1: 23 ha
• Block 2: 86 ha
29 Small incidental harvests of marginally uneconomic area would go against AAC, and the exemption would be
activated for area sums greater than 2 ha by TFL Block.

TFL 25 - Timber Supply Analysis Page 68
• Block 3: 30 ha
• Block 5: 330 ha
• Block 6: 150 ha
• Government to Licensee discussions should be continued to explore
administrative and policy changes associated with area-regulation that may
reduce costs to government and increase Licensee profitability. Reforms may
be possible with respect to, but not limited to, the following:
• elimination of waste and residue sampling and billing programs.
• area-based cut control and SBFEP allocations.
• area-based stumpage ($/ha harvested) or an “all found” annual
tenure rental.

TFL 25 - Timber Supply Analysis Page 69
Appendix V-A Harvest Statistics for Simulation Runs
In the graphs following, The solid coloured trend lines presented are the output
variables for the sensitivity’s flat line flow. Dashed lines of the same colour
represent the current management (CMA) or base case statistics for comparison
purposes. A flat dashed line represents the CMA flat line flow and the unadjusted
deficit flow, where it occurs, is presented as a dashed line below CMA.
Run naming conventions and descriptions of each run are presented in Appendix
V-C.
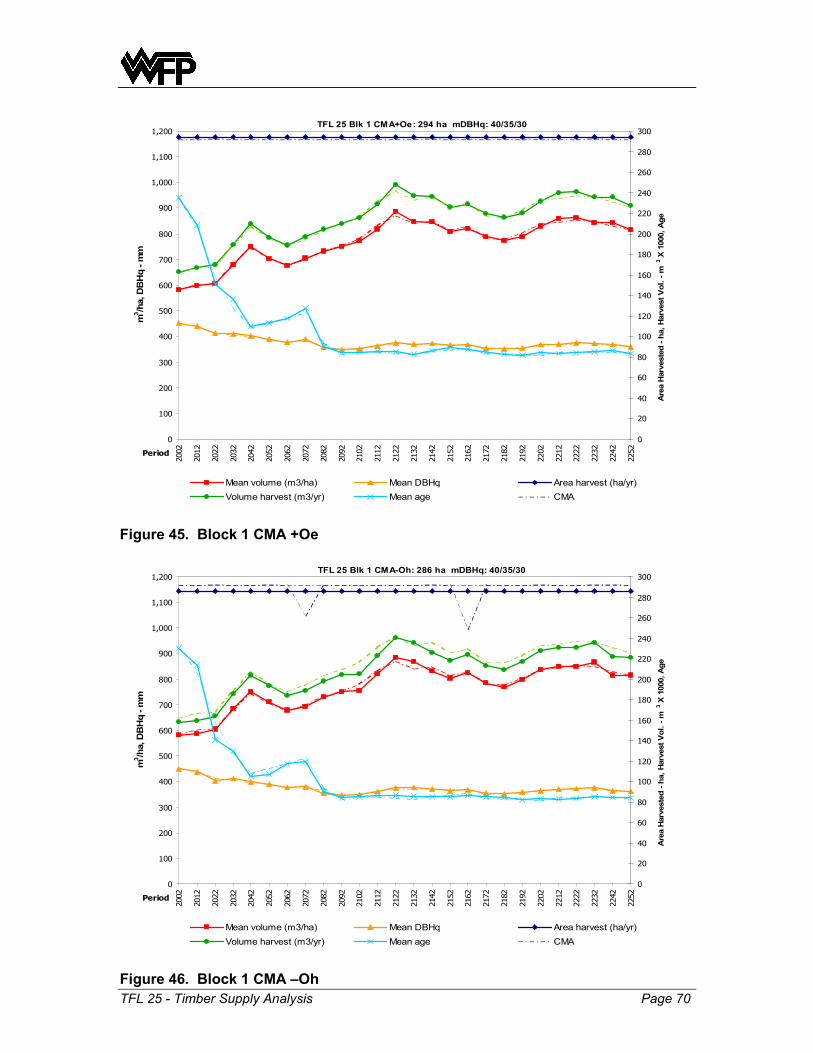
TFL 25 - Timber Supply Analysis Page 70
TFL 25 Blk 1 CMA+Oe: 294 ha mDBHq: 40/35/30
0
100
200
300
400
500
600
700
800
900
1,000
1,100
1,200
2002
2012
2022
2032
2042
2052
2062
2072
2082
2092
2102
2112
2122
2132
2142
2152
2162
2172
2182
2192
2202
2212
2222
2232
2242
2252Period
m3 /h
a, D
BH
q - m
m
0
20
40
60
80
100
120
140
160
180
200
220
240
260
280
300
Area
Har
vest
ed -
ha, H
arve
st V
ol. -
m3 X
100
0, A
ge
Mean volume (m3/ha) Mean DBHq Area harvest (ha/yr)Volume harvest (m3/yr) Mean age CMA
Figure 45. Block 1 CMA +Oe
TFL 25 Blk 1 CMA-Oh: 286 ha mDBHq: 40/35/30
0
100
200
300
400
500
600
700
800
900
1,000
1,100
1,200
2002
2012
2022
2032
2042
2052
2062
2072
2082
2092
2102
2112
2122
2132
2142
2152
2162
2172
2182
2192
2202
2212
2222
2232
2242
2252Period
m3 /h
a, D
BH
q - m
m
0
20
40
60
80
100
120
140
160
180
200
220
240
260
280
300
Area
Har
vest
ed -
ha, H
arve
st V
ol. -
m3 X
100
0, A
ge
Mean volume (m3/ha) Mean DBHq Area harvest (ha/yr)Volume harvest (m3/yr) Mean age CMA
Figure 46. Block 1 CMA –Oh

TFL 25 - Timber Supply Analysis Page 71
TFL 25 Blk 1 CMA-SI3m: 236 ha mDBHq: 40/35/30
0
100
200
300
400
500
600
700
800
900
1,000
1,100
1,200
2002
2012
2022
2032
2042
2052
2062
2072
2082
2092
2102
2112
2122
2132
2142
2152
2162
2172
2182
2192
2202
2212
2222
2232
2242
2252Period
m3 /h
a, D
BH
q - m
m
0
20
40
60
80
100
120
140
160
180
200
220
240
260
280
300
Area
Har
vest
ed -
ha, H
arve
st V
ol. -
m3 X
100
0, A
ge
Mean volume (m3/ha) Mean DBHq Area harvest (ha/yr)Volume harvest (m3/yr) Mean age CMA
Figure 47. Block 1 CMA –SI3m
TFL 25 Blk 1 CMA-Age: 309 ha mDBHq: 37/32/27
0
100
200
300
400
500
600
700
800
900
1,000
1,100
1,200
2002
2012
2022
2032
2042
2052
2062
2072
2082
2092
2102
2112
2122
2132
2142
2152
2162
2172
2182
2192
2202
2212
2222
2232
2242
2252Period
m3 /h
a, D
BH
q - m
m
0
20
40
60
80
100
120
140
160
180
200
220
240
260
280
300
320
Area
Har
vest
ed -
ha, H
arve
st V
ol. -
m3 X
100
0, A
ge
Mean volume (m3/ha) Mean DBHq Area harvest (ha/yr)Volume harvest (m3/yr) Mean age CMA
Figure 48. Block 1 CMA -age

TFL 25 - Timber Supply Analysis Page 72
TFL 25 Blk 1 CMA+Age: 239 ha mDBHq: 43/38/33
0
100
200
300
400
500
600
700
800
900
1,000
1,100
1,200
2002
2012
2022
2032
2042
2052
2062
2072
2082
2092
2102
2112
2122
2132
2142
2152
2162
2172
2182
2192
2202
2212
2222
2232
2242
2252Period
m3 /h
a, D
BH
q - m
m
0
20
40
60
80
100
120
140
160
180
200
220
240
260
280
300
320
Area
Har
vest
ed -
ha, H
arve
st V
ol. -
m3 X
100
0, A
ge
Mean volume (m3/ha) Mean DBHq Area harvest (ha/yr)Volume harvest (m3/yr) Mean age CMA
Figure 49. Block 1 CMA +age
TFL 25 Blk 1 CMA-RndAge: 283 ha mDBHq: 40/35/30
0
100
200
300
400
500
600
700
800
900
1,000
1,100
1,200
2002
2012
2022
2032
2042
2052
2062
2072
2082
2092
2102
2112
2122
2132
2142
2152
2162
2172
2182
2192
2202
2212
2222
2232
2242
2252Period
m3 /h
a, D
BH
q - m
m
0
20
40
60
80
100
120
140
160
180
200
220
240
260
280
300
Area
Har
vest
ed -
ha, H
arve
st V
ol. -
m3 X
100
0, A
ge
Mean volume (m3/ha) Mean DBHq Area harvest (ha/yr)Volume harvest (m3/yr) Mean age CMA
Figure 50. Block 1 CMA –RndAge

TFL 25 - Timber Supply Analysis Page 73
TFL 25 Blk 1 CMA-midVQ: 289 ha mDBHq: 40/35/30
0
100
200
300
400
500
600
700
800
900
1,000
1,100
1,200
2002
2012
2022
2032
2042
2052
2062
2072
2082
2092
2102
2112
2122
2132
2142
2152
2162
2172
2182
2192
2202
2212
2222
2232
2242
2252Period
m3 /h
a, D
BH
q - m
m
0
20
40
60
80
100
120
140
160
180
200
220
240
260
280
300
Area
Har
vest
ed -
ha, H
arve
st V
ol. -
m3 X
100
0, A
ge
Mean volume (m3/ha) Mean DBHq Area harvest (ha/yr)Volume harvest (m3/yr) Mean age CMA
Figure 51. Block 1 CMA-midVQ TFL 25 Blk 1 CMA UnCon: 307 ha mDBHq: 40/35/30
0
100
200
300
400
500
600
700
800
900
1,000
1,100
1,200
2002
2012
2022
2032
2042
2052
2062
2072
2082
2092
2102
2112
2122
2132
2142
2152
2162
2172
2182
2192
2202
2212
2222
2232
2242
2252Period
m3 /h
a, D
BH
q - m
m
0
20
40
60
80
100
120
140
160
180
200
220
240
260
280
300
320
Area
Har
vest
ed -
ha, H
arve
st V
ol. -
m3 X
100
0, A
ge
Mean volume (m3/ha) Mean DBHq Area harvest (ha/yr)Volume harvest (m3/yr) Mean age CMA
Figure 52. Block 1 CMA UnCon

TFL 25 - Timber Supply Analysis Page 74
TFL 25 Blk 1 CMA+AgeX2: 196 ha mDBHq: 46/41/36
0
100
200
300
400
500
600
700
800
900
1,000
1,100
1,200
2002
2012
2022
2032
2042
2052
2062
2072
2082
2092
2102
2112
2122
2132
2142
2152
2162
2172
2182
2192
2202
2212
2222
2232
2242
2252Period
m3 /h
a, D
BH
q - m
m
0
20
40
60
80
100
120
140
160
180
200
220
240
260
280
300
320
Area
Har
vest
ed -
ha, H
arve
st V
ol. -
m3 X
100
0, A
ge
Mean volume (m3/ha) Mean DBHq Area harvest (ha/yr)Volume harvest (m3/yr) Mean age CMA
Figure 53. Block 1 CMA +ageX2
TFL 25 Blk 1 CMA-AgeX2: 318 ha mDBHq: 34/29/24
0
100
200
300
400
500
600
700
800
900
1,000
1,100
1,200
2002
2012
2022
2032
2042
2052
2062
2072
2082
2092
2102
2112
2122
2132
2142
2152
2162
2172
2182
2192
2202
2212
2222
2232
2242
2252Period
m3 /h
a, D
BH
q - m
m
0
20
40
60
80
100
120
140
160
180
200
220
240
260
280
300
320
Area
Har
vest
ed -
ha, H
arve
st V
ol. -
m3 X
100
0, A
ge
Mean volume (m3/ha) Mean DBHq Area harvest (ha/yr)Volume harvest (m3/yr) Mean age CMA
Figure 54. Block 1 CMA –ageX2

TFL 25 - Timber Supply Analysis Page 75
TFL 25 Blk 1 CMV: 185,000 m3 mDBHq: 40/35/30
0
100
200
300
400
500
600
700
800
900
1,000
2002
2012
2022
2032
2042
2052
2062
2072
2082
2092
2102
2112
2122
2132
2142
2152
2162
2172
2182
2192
2202
2212
2222
2232
2242
2252
First Year of Period
m3 /h
a, D
BHq
- mm
0
50
100
150
200
250
300
350
Area
Har
vest
ed -
ha, H
arve
st V
ol. -
m3 X
10
00, A
ge
Mean Volume (m3/ha) Mean DBHq Area harvest (ha/yr) Mean age
Volume harvest (m3/yr) Heli (m3/yr) Heli (ha/yr)
Figure 55. Block 1 CMV (Volume Regulated)

TFL 25 - Timber Supply Analysis Page 76
TFL 25 Blk 2 CMA+Oe: 126 ha mDBHq: 43/38/34
0
100
200
300
400
500
600
700
800
900
1,000
1,100
1,200
1,300
2002
2012
2022
2032
2042
2052
2062
2072
2082
2092
2102
2112
2122
2132
2142
2152
2162
2172
2182
2192
2202
2212
2222
2232
2242
2252Period
m3 /h
a, D
BH
q - m
m
0
20
40
60
80
100
120
140
160
180
200
220
240
260
Area
Har
vest
ed -
ha, H
arve
st V
ol. -
m3 X
100
0, A
ge
Mean volume (m3/ha) Mean DBHq Area harvest (ha/yr)Volume harvest (m3/yr) Mean age CMA
Figure 56. Block 2 CMA +Oe TFL 25 Blk 2 CMA-Oh: 101 ha mDBHq: 43/38/34
200
300
400
500
600
700
800
900
1,000
1,100
1,200
1,300
2002
2012
2022
2032
2042
2052
2062
2072
2082
2092
2102
2112
2122
2132
2142
2152
2162
2172
2182
2192
2202
2212
2222
2232
2242
2252Period
m3 /h
a, D
BH
q - m
m
40
60
80
100
120
140
160
180
200
220
240
260
Area
Har
vest
ed -
ha, H
arve
st V
ol. -
m3 X
100
0, A
ge
Mean volume (m3/ha) Mean DBHq Area harvest (ha/yr)Volume harvest (m3/yr) Mean age CMA
Figure 57. Block 2 CMA -Oh

TFL 25 - Timber Supply Analysis Page 77
TFL 25 Blk 2 CMA-SI3m: 106 ha mDBHq: 43/38/34
200
300
400
500
600
700
800
900
1,000
1,100
1,200
1,300
2002
2012
2022
2032
2042
2052
2062
2072
2082
2092
2102
2112
2122
2132
2142
2152
2162
2172
2182
2192
2202
2212
2222
2232
2242
2252Period
m3 /h
a, D
BH
q - m
m
40
60
80
100
120
140
160
180
200
220
240
260
Area
Har
vest
ed -
ha, H
arve
st V
ol. -
m3 X
100
0, A
ge
Mean volume (m3/ha) Mean DBHq Area harvest (ha/yr)Volume harvest (m3/yr) Mean age CMA
Figure 58. Block 2 CMA –SI3m TFL 25 Blk 2 CMA-Age: 142 ha mDBHq: 40/35/31
200
300
400
500
600
700
800
900
1,000
1,100
1,200
1,300
2002
2012
2022
2032
2042
2052
2062
2072
2082
2092
2102
2112
2122
2132
2142
2152
2162
2172
2182
2192
2202
2212
2222
2232
2242
2252Period
m3 /h
a, D
BH
q - m
m
40
60
80
100
120
140
160
180
200
220
240
260
Area
Har
vest
ed -
ha, H
arve
st V
ol. -
m3 X
100
0, A
ge
Mean volume (m3/ha) Mean DBHq Area harvest (ha/yr)Volume harvest (m3/yr) Mean age CMA
Figure 59. Block 2 CMA -age

TFL 25 - Timber Supply Analysis Page 78
TFL 25 Blk 2 CMA+Age: 105 ha mDBHq: 46/41/37
200
300
400
500
600
700
800
900
1,000
1,100
1,200
1,300
2002
2012
2022
2032
2042
2052
2062
2072
2082
2092
2102
2112
2122
2132
2142
2152
2162
2172
2182
2192
2202
2212
2222
2232
2242
2252Period
m3 /h
a, D
BH
q - m
m
40
60
80
100
120
140
160
180
200
220
240
260
Area
Har
vest
ed -
ha, H
arve
st V
ol. -
m3 X
100
0, A
ge
Mean volume (m3/ha) Mean DBHq Area harvest (ha/yr)Volume harvest (m3/yr) Mean age CMA
Figure 60. Block 2 CMA +age TFL 25 Blk 2 CMA-RndAge: 120 ha mDBHq: 43/38/34
200
300
400
500
600
700
800
900
1,000
1,100
1,200
1,300
2002
2012
2022
2032
2042
2052
2062
2072
2082
2092
2102
2112
2122
2132
2142
2152
2162
2172
2182
2192
2202
2212
2222
2232
2242
2252Period
m3 /h
a, D
BH
q - m
m
40
60
80
100
120
140
160
180
200
220
240
260
Area
Har
vest
ed -
ha, H
arve
st V
ol. -
m3 X
100
0, A
ge
Mean volume (m3/ha) Mean DBHq Area harvest (ha/yr)Volume harvest (m3/yr) Mean age CMA
Figure 61. Block 2 CMA -RndAge

TFL 25 - Timber Supply Analysis Page 79
TFL 25 Blk 2 CMA-midVQ: 122 ha mDBHq: 43/38/34
200
300
400
500
600
700
800
900
1,000
1,100
1,200
1,300
2002
2012
2022
2032
2042
2052
2062
2072
2082
2092
2102
2112
2122
2132
2142
2152
2162
2172
2182
2192
2202
2212
2222
2232
2242
2252Period
m3 /h
a, D
BH
q - m
m
40
60
80
100
120
140
160
180
200
220
240
260
Area
Har
vest
ed -
ha, H
arve
st V
ol. -
m3 X
100
0, A
ge
Mean volume (m3/ha) Mean DBHq Area harvest (ha/yr)Volume harvest (m3/yr) Mean age CMA
Figure 62. Block 2 CMA -midVQ TFL 25 Blk 2 CMA+BEO: 120ha mDBHq: 43/38/34
200
300
400
500
600
700
800
900
1,000
1,100
1,200
1,300
2002
2012
2022
2032
2042
2052
2062
2072
2082
2092
2102
2112
2122
2132
2142
2152
2162
2172
2182
2192
2202
2212
2222
2232
2242
2252Period
m3 /h
a, D
BH
q - m
m
40
60
80
100
120
140
160
180
200
220
240
260
Area
Har
vest
ed -
ha, H
arve
st V
ol. -
m3 X
100
0, A
ge
Mean volume (m3/ha) Mean DBHq Area harvest (ha/yr)Volume harvest (m3/yr) Mean age CMA
Figure 63. Block 2 CMA +BEO

TFL 25 - Timber Supply Analysis Page 80
TFL 25 Blk 2 CMA-Oc: 24 ha mDBHq: 43/38/34
0
100
200
300
400
500
600
700
800
900
1,000
1,100
1,200
1,300
2002
2012
2022
2032
2042
2052
2062
2072
2082
2092
2102
2112
2122
2132
2142
2152
2162
2172
2182
2192
2202
2212
2222
2232
2242
2252Period
m3 /h
a, D
BH
q - m
m
0
20
40
60
80
100
120
140
160
180
200
220
240
260
Area
Har
vest
ed -
ha, H
arve
st V
ol. -
m3 X
100
0, A
ge
Mean volume (m3/ha) Mean DBHq Area harvest (ha/yr)Volume harvest (m3/yr) Mean age CMA
Figure 64. Block 2 CMA -Oc TFL 25 Blk 2 CMA UnCon: 133 ha mDBHq: 43/38/34
200
300
400
500
600
700
800
900
1,000
1,100
1,200
1,300
2002
2012
2022
2032
2042
2052
2062
2072
2082
2092
2102
2112
2122
2132
2142
2152
2162
2172
2182
2192
2202
2212
2222
2232
2242
2252Period
m3 /h
a, D
BH
q - m
m
40
60
80
100
120
140
160
180
200
220
240
260
Area
Har
vest
ed -
ha, H
arve
st V
ol. -
m3 X
100
0, A
ge
Mean volume (m3/ha) Mean DBHq Area harvest (ha/yr)Volume harvest (m3/yr) Mean age CMA
Figure 65. Block 2 CMA UnCon

TFL 25 - Timber Supply Analysis Page 81
TFL 25 Blk 2 CMA-HRules: 125 ha mDBHq: 43/38/34
200
300
400
500
600
700
800
900
1,000
1,100
1,200
1,300
2002
2012
2022
2032
2042
2052
2062
2072
2082
2092
2102
2112
2122
2132
2142
2152
2162
2172
2182
2192
2202
2212
2222
2232
2242
2252Period
m3 /h
a, D
BH
q - m
m
40
60
80
100
120
140
160
180
200
220
240
260
Area
Har
vest
ed -
ha, H
arve
st V
ol. -
m3 X
100
0, A
ge
Mean volume (m3/ha) Mean DBHq Area harvest (ha/yr)Volume harvest (m3/yr) Mean age CMA
Figure 66. Block 2 CMA -HRules TFL 25 Blk 2 CMV: 102,000 m3 mDBHq: 43/38/34
0
100
200
300
400
500
600
700
800
900
1,000
1,100
1,200
2002
2012
2022
2032
2042
2052
2062
2072
2082
2092
2102
2112
2122
2132
2142
2152
2162
2172
2182
2192
2202
2212
2222
2232
2242
2252
First Year of Period
m3 /h
a, D
BHq
- mm
0
50
100
150
200
250
300
Area
Har
vest
ed -
ha, H
arve
st V
ol. -
m3 X
10
00, A
ge
Mean Volume (m3/ha) Mean DBHq Area harvest (ha/yr) Mean age
Volume harvest (m3/yr) Heli (m3/yr) Heli (ha/yr)
Figure 67. Block 2 CMV (Volume Regulated)

TFL 25 - Timber Supply Analysis Page 82
TFL 25 Blk 3 CMA+Oe: 90 ha mDBHq: 43/38/34
200
300
400
500
600
700
800
900
1,000
1,100
1,200
2002
2012
2022
2032
2042
2052
2062
2072
2082
2092
2102
2112
2122
2132
2142
2152
2162
2172
2182
2192
2202
2212
2222
2232
2242
2252Period
m3 /h
a, D
BH
q - m
m
40
60
80
100
120
140
160
180
200
220
240
260
280
300
Area
Har
vest
ed -
ha, H
arve
st V
ol. -
m3 X
100
0, A
ge
Mean volume (m3/ha) Mean DBHq Area harvest (ha/yr)Volume harvest (m3/yr) Mean age CMA
Figure 68. Block 3 CMA +Oe
TFL 25 Blk 3 CMA-Oh: 80 ha mDBHq: 43/38/34
200
300
400
500
600
700
800
900
1,000
1,100
1,200
2002
2012
2022
2032
2042
2052
2062
2072
2082
2092
2102
2112
2122
2132
2142
2152
2162
2172
2182
2192
2202
2212
2222
2232
2242
2252Period
m3 /h
a, D
BH
q - m
m
40
60
80
100
120
140
160
180
200
220
240
260
280
300
Area
Har
vest
ed -
ha, H
arve
st V
ol. -
m3 X
100
0, A
ge
Mean volume (m3/ha) Mean DBHq Area harvest (ha/yr)Volume harvest (m3/yr) Mean age CMA
Figure 69. Block 3 CMA -Oh

TFL 25 - Timber Supply Analysis Page 83
TFL 25 Blk 3 CMA-SI3m: 71 ha mDBHq: 43/38/34
200
300
400
500
600
700
800
900
1,000
1,100
1,200
2002
2012
2022
2032
2042
2052
2062
2072
2082
2092
2102
2112
2122
2132
2142
2152
2162
2172
2182
2192
2202
2212
2222
2232
2242
2252Period
m3 /h
a, D
BH
q - m
m
40
60
80
100
120
140
160
180
200
220
240
260
280
300
Area
Har
vest
ed -
ha, H
arve
st V
ol. -
m3 X
100
0, A
ge
Mean volume (m3/ha) Mean DBHq Area harvest (ha/yr)Volume harvest (m3/yr) Mean age CMA
Figure 70. Block 3 CMA –SI3m
TFL 25 Blk 3 CMA-Age: 101 ha mDBHq: 40/35/31
200
300
400
500
600
700
800
900
1,000
1,100
1,200
2002
2012
2022
2032
2042
2052
2062
2072
2082
2092
2102
2112
2122
2132
2142
2152
2162
2172
2182
2192
2202
2212
2222
2232
2242
2252Period
m3 /h
a, D
BH
q - m
m
40
60
80
100
120
140
160
180
200
220
240
260
280
300
Area
Har
vest
ed -
ha, H
arve
st V
ol. -
m3 X
100
0, A
ge
Mean volume (m3/ha) Mean DBHq Area harvest (ha/yr)Volume harvest (m3/yr) Mean age CMA
Figure 71. Block 3 CMA -age
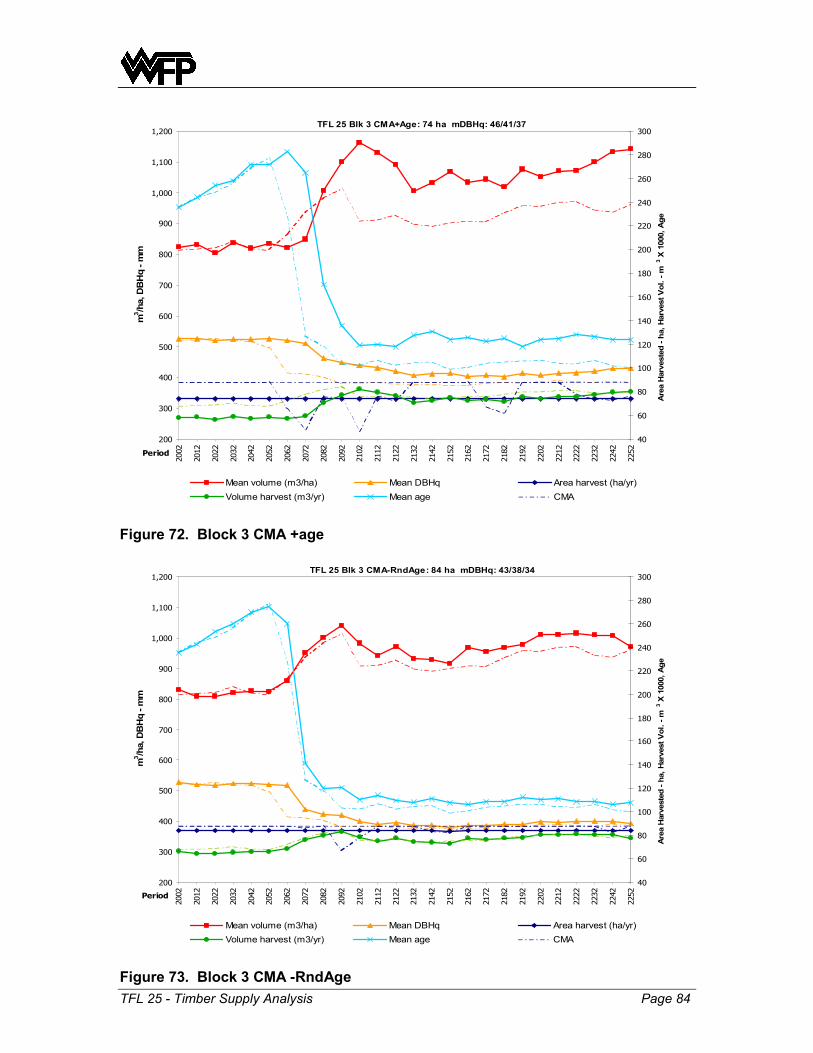
TFL 25 - Timber Supply Analysis Page 84
TFL 25 Blk 3 CMA+Age: 74 ha mDBHq: 46/41/37
200
300
400
500
600
700
800
900
1,000
1,100
1,200
2002
2012
2022
2032
2042
2052
2062
2072
2082
2092
2102
2112
2122
2132
2142
2152
2162
2172
2182
2192
2202
2212
2222
2232
2242
2252Period
m3 /h
a, D
BH
q - m
m
40
60
80
100
120
140
160
180
200
220
240
260
280
300
Area
Har
vest
ed -
ha, H
arve
st V
ol. -
m3 X
100
0, A
ge
Mean volume (m3/ha) Mean DBHq Area harvest (ha/yr)Volume harvest (m3/yr) Mean age CMA
Figure 72. Block 3 CMA +age
TFL 25 Blk 3 CMA-RndAge: 84 ha mDBHq: 43/38/34
200
300
400
500
600
700
800
900
1,000
1,100
1,200
2002
2012
2022
2032
2042
2052
2062
2072
2082
2092
2102
2112
2122
2132
2142
2152
2162
2172
2182
2192
2202
2212
2222
2232
2242
2252Period
m3 /h
a, D
BH
q - m
m
40
60
80
100
120
140
160
180
200
220
240
260
280
300
Area
Har
vest
ed -
ha, H
arve
st V
ol. -
m3 X
100
0, A
ge
Mean volume (m3/ha) Mean DBHq Area harvest (ha/yr)Volume harvest (m3/yr) Mean age CMA
Figure 73. Block 3 CMA -RndAge

TFL 25 - Timber Supply Analysis Page 85
TFL 25 Blk 3 CMA-midVQ: 81 ha mDBHq: 43/38/34
200
300
400
500
600
700
800
900
1,000
1,100
1,200
2002
2012
2022
2032
2042
2052
2062
2072
2082
2092
2102
2112
2122
2132
2142
2152
2162
2172
2182
2192
2202
2212
2222
2232
2242
2252Period
m3 /h
a, D
BH
q - m
m
40
60
80
100
120
140
160
180
200
220
240
260
280
300
Area
Har
vest
ed -
ha, H
arve
st V
ol. -
m3 X
100
0, A
ge
Mean volume (m3/ha) Mean DBHq Area harvest (ha/yr)Volume harvest (m3/yr) Mean age CMA
Figure 74. Block 3 CMA -midVQ
TFL 25 Blk 3 CMA UnCon: 92 ha mDBHq: 43/38/34
200
300
400
500
600
700
800
900
1,000
1,100
1,200
2002
2012
2022
2032
2042
2052
2062
2072
2082
2092
2102
2112
2122
2132
2142
2152
2162
2172
2182
2192
2202
2212
2222
2232
2242
2252Period
m3 /h
a, D
BH
q - m
m
40
60
80
100
120
140
160
180
200
220
240
260
280
300
Area
Har
vest
ed -
ha, H
arve
st V
ol. -
m3 X
100
0, A
ge
Mean volume (m3/ha) Mean DBHq Area harvest (ha/yr)Volume harvest (m3/yr) Mean age CMA
Figure 75. Block 3 CMA UnCon

TFL 25 - Timber Supply Analysis Page 86
TFL 25 Blk 3 CMV: 73,000 m3 mDBHq: 43/38/34
0
100
200
300
400
500
600
700
800
900
1,000
2002
2012
2022
2032
2042
2052
2062
2072
2082
2092
2102
2112
2122
2132
2142
2152
2162
2172
2182
2192
2202
2212
2222
2232
2242
2252
First Year of Period
m3 /h
a, D
BHq
- mm
0
50
100
150
200
250
300
350
Area
Har
vest
ed -
ha, H
arve
st V
ol. -
m3 X
10
00, A
ge
Mean Volume (m3/ha) Mean DBHq Area harvest (ha/yr) Mean age
Volume harvest (m3/yr) Heli (m3/yr) Heli (ha/yr)
Figure 76. Block 3 CMV (Volume Regulated)

TFL 25 - Timber Supply Analysis Page 87
TFL 25 Blk 5 CMA+Oe: 511 ha mDBHq: 47/42/37
0
100
200
300
400
500
600
700
800
900
1,000
1,100
1,200
2002
2012
2022
2032
2042
2052
2062
2072
2082
2092
2102
2112
2122
2132
2142
2152
2162
2172
2182
2192
2202
2212
2222
2232
2242
2252Period
m3 /h
a, D
BH
q - m
m
0
50
100
150
200
250
300
350
400
450
500
550
600
Area
Har
vest
ed -
ha, H
arve
st V
ol. -
m3 X
100
0, A
ge
Mean volume (m3/ha) Mean DBHq Area harvest (ha/yr)Volume harvest (m3/yr) Mean age CMA
Figure 77. Block 5 CMA +Oe
TFL 25 Blk 5 CMA-Oh: 404 ha mDBHq: 47/42/37
0
100
200
300
400
500
600
700
800
900
1,000
1,100
1,200
2002
2012
2022
2032
2042
2052
2062
2072
2082
2092
2102
2112
2122
2132
2142
2152
2162
2172
2182
2192
2202
2212
2222
2232
2242
2252Period
m3 /h
a, D
BH
q - m
m
0
50
100
150
200
250
300
350
400
450
500
550
600
Area
Har
vest
ed -
ha, H
arve
st V
ol. -
m3 X
100
0, A
ge
Mean volume (m3/ha) Mean DBHq Area harvest (ha/yr)Volume harvest (m3/yr) Mean age CMA
Figure 78. Block 5 CMA -Oh

TFL 25 - Timber Supply Analysis Page 88
TFL 25 Blk 5 CMA-SI3m: 434 ha mDBHq: 47/42/37
0
100
200
300
400
500
600
700
800
900
1,000
1,100
1,200
2002
2012
2022
2032
2042
2052
2062
2072
2082
2092
2102
2112
2122
2132
2142
2152
2162
2172
2182
2192
2202
2212
2222
2232
2242
2252Period
m3 /h
a, D
BH
q - m
m
0
50
100
150
200
250
300
350
400
450
500
550
600
Area
Har
vest
ed -
ha, H
arve
st V
ol. -
m3 X
100
0, A
ge
Mean volume (m3/ha) Mean DBHq Area harvest (ha/yr)Volume harvest (m3/yr) Mean age CMA
Figure 79. Block 5 CMA –SI3m
TFL 25 Blk 5 CMA-Age: 559 ha mDBHq: 44/39/34
0
100
200
300
400
500
600
700
800
900
1,000
1,100
1,200
2002
2012
2022
2032
2042
2052
2062
2072
2082
2092
2102
2112
2122
2132
2142
2152
2162
2172
2182
2192
2202
2212
2222
2232
2242
2252Period
m3 /h
a, D
BH
q - m
m
0
50
100
150
200
250
300
350
400
450
500
550
600
Area
Har
vest
ed -
ha, H
arve
st V
ol. -
m3 X
100
0, A
ge
Mean volume (m3/ha) Mean DBHq Area harvest (ha/yr)Volume harvest (m3/yr) Mean age CMA
Figure 80. Block 5 CMA -age

TFL 25 - Timber Supply Analysis Page 89
TFL 25 Blk 5 CMA+Age: 448 ha mDBHq: 50/45/40
0
100
200
300
400
500
600
700
800
900
1,000
1,100
1,200
2002
2012
2022
2032
2042
2052
2062
2072
2082
2092
2102
2112
2122
2132
2142
2152
2162
2172
2182
2192
2202
2212
2222
2232
2242
2252Period
m3 /h
a, D
BH
q - m
m
0
50
100
150
200
250
300
350
400
450
500
550
600
Area
Har
vest
ed -
ha, H
arve
st V
ol. -
m3 X
100
0, A
ge
Mean volume (m3/ha) Mean DBHq Area harvest (ha/yr)Volume harvest (m3/yr) Mean age CMA
Figure 81. Block 5 CMA +age
TFL 25 Blk 5 CMA-RndAge: 483 ha mDBHq: 47/42/37
0
100
200
300
400
500
600
700
800
900
1,000
1,100
1,200
2002
2012
2022
2032
2042
2052
2062
2072
2082
2092
2102
2112
2122
2132
2142
2152
2162
2172
2182
2192
2202
2212
2222
2232
2242
2252Period
m3 /h
a, D
BH
q - m
m
0
50
100
150
200
250
300
350
400
450
500
550
600
Area
Har
vest
ed -
ha, H
arve
st V
ol. -
m3 X
100
0, A
ge
Mean volume (m3/ha) Mean DBHq Area harvest (ha/yr)Volume harvest (m3/yr) Mean age CMA
Figure 82. Block 5 CMA -RndAge

TFL 25 - Timber Supply Analysis Page 90
TFL 25 Blk 5 CMA-PA: 364ha mDBHq: 47/42/37
0
100
200
300
400
500
600
700
800
900
1,000
1,100
1,200
2002
2012
2022
2032
2042
2052
2062
2072
2082
2092
2102
2112
2122
2132
2142
2152
2162
2172
2182
2192
2202
2212
2222
2232
2242
2252Period
m3 /h
a, D
BHq
- mm
0
50
100
150
200
250
300
350
400
450
500
550
600
Area
Har
vest
ed -
ha, H
arve
st V
ol. -
m3 X
100
0, A
ge
Mean volume (m3/ha) Mean DBHq Area harvest unadjustedVolume harvest (m3/yr) Mean age Area harvest (ha/yr)
Figure 83. Block 5 CMA -PA
TFL 25 Blk 5 CMA-PA-OA: 206ha mDBHq: 47/42/37
0
100
200
300
400
500
600
700
800
900
1,000
1,100
1,200
2002
2012
2022
2032
2042
2052
2062
2072
2082
2092
2102
2112
2122
2132
2142
2152
2162
2172
2182
2192
2202
2212
2222
2232
2242
2252Period
m3 /h
a, D
BHq
- mm
0
50
100
150
200
250
300
350
400
450
500
550
600
Area
Har
vest
ed -
ha, H
arve
st V
ol. -
m3 X
100
0, A
ge
Mean volume (m3/ha) Mean DBHq Area harvest (ha/yr)
Volume harvest (m3/yr) Mean age CMA -PA (ha/yr)
Figure 84. Block 5 CMA -PA -OA

TFL 25 - Timber Supply Analysis Page 91
TFL 25 Blk 5 CMA-midVQ: 477 ha mDBHq: 47/42/37
0
100
200
300
400
500
600
700
800
900
1,000
1,100
1,200
2002
2012
2022
2032
2042
2052
2062
2072
2082
2092
2102
2112
2122
2132
2142
2152
2162
2172
2182
2192
2202
2212
2222
2232
2242
2252Period
m3 /h
a, D
BH
q - m
m
0
50
100
150
200
250
300
350
400
450
500
550
600
Area
Har
vest
ed -
ha, H
arve
st V
ol. -
m3 X
100
0, A
ge
Mean volume (m3/ha) Mean DBHq Area harvest (ha/yr)Volume harvest (m3/yr) Mean age CMA
Figure 85. Block 5 CMA -midVQ
TFL 25 Blk 5 CMA+BEO: 492 ha mDBHq: 47/42/37
0
100
200
300
400
500
600
700
800
900
1,000
1,100
1,200
2002
2012
2022
2032
2042
2052
2062
2072
2082
2092
2102
2112
2122
2132
2142
2152
2162
2172
2182
2192
2202
2212
2222
2232
2242
2252Period
m3 /h
a, D
BH
q - m
m
0
50
100
150
200
250
300
350
400
450
500
550
600
Area
Har
vest
ed -
ha, H
arve
st V
ol. -
m3 X
100
0, A
ge
Mean volume (m3/ha) Mean DBHq Area harvest (ha/yr)Volume harvest (m3/yr) Mean age CMA
Figure 86. Block 5 CMA +BEO

TFL 25 - Timber Supply Analysis Page 92
TFL 25 Blk 5 CMA-SsSIest: 469 ha mDBHq: 47/42/37
0
100
200
300
400
500
600
700
800
900
1,000
1,100
1,200
2002
2012
2022
2032
2042
2052
2062
2072
2082
2092
2102
2112
2122
2132
2142
2152
2162
2172
2182
2192
2202
2212
2222
2232
2242
2252Period
m3 /h
a, D
BH
q - m
m
0
50
100
150
200
250
300
350
400
450
500
550
600
Area
Har
vest
ed -
ha, H
arve
st V
ol. -
m3 X
100
0, A
ge
Mean volume (m3/ha) Mean DBHq Area harvest (ha/yr)Volume harvest (m3/yr) Mean age CMA
Figure 87. Block 5 CMA –SsSIest
TFL 25 Blk 5 CMA UnCon: 543 ha mDBHq: 47/42/37
0
100
200
300
400
500
600
700
800
900
1,000
1,100
1,200
2002
2012
2022
2032
2042
2052
2062
2072
2082
2092
2102
2112
2122
2132
2142
2152
2162
2172
2182
2192
2202
2212
2222
2232
2242
2252Period
m3 /h
a, D
BH
q - m
m
0
50
100
150
200
250
300
350
400
450
500
550
600
Area
Har
vest
ed -
ha, H
arve
st V
ol. -
m3 X
100
0, A
ge
Mean volume (m3/ha) Mean DBHq Area harvest (ha/yr)Volume harvest (m3/yr) Mean age CMA
Figure 88. Block 5 CMA UnCon

TFL 25 - Timber Supply Analysis Page 93
TFL 25 Blk 5 CMA-PA-SI3m: 323ha mDBHq: 47/42/37
0
100
200
300
400
500
600
700
800
900
1,000
1,100
1,200
2002
2012
2022
2032
2042
2052
2062
2072
2082
2092
2102
2112
2122
2132
2142
2152
2162
2172
2182
2192
2202
2212
2222
2232
2242
2252Period
m3 /h
a, D
BHq
- mm
0
50
100
150
200
250
300
350
400
450
500
550
600
Area
Har
vest
ed -
ha, H
arve
st V
ol. -
m3 X
100
0, A
ge
Mean volume (m3/ha) Mean DBHq Area harvest (ha/yr)
Volume harvest (m3/yr) Mean age CMA -PA (ha/yr)
Figure 89. Block 5 CMA –PA –SI3m
TFL 25 Blk 5 CMA-PA-Age: 409ha mDBHq: 44/39/34
0
100
200
300
400
500
600
700
800
900
1,000
1,100
1,200
2002
2012
2022
2032
2042
2052
2062
2072
2082
2092
2102
2112
2122
2132
2142
2152
2162
2172
2182
2192
2202
2212
2222
2232
2242
2252Period
m3 /h
a, D
BHq
- mm
0
50
100
150
200
250
300
350
400
450
500
550
600
Area
Har
vest
ed -
ha, H
arve
st V
ol. -
m3 X
100
0, A
ge
Mean volume (m3/ha) Mean DBHq Area harvest (ha/yr)
Volume harvest (m3/yr) Mean age CMA -PA (ha/yr)
Figure 90. Block 5 CMA –PA –age

TFL 25 - Timber Supply Analysis Page 94
TFL 25 Blk 5 CMA-PA+Age: 336ha mDBHq: 50/45/40
0
100
200
300
400
500
600
700
800
900
1,000
1,100
1,200
2002
2012
2022
2032
2042
2052
2062
2072
2082
2092
2102
2112
2122
2132
2142
2152
2162
2172
2182
2192
2202
2212
2222
2232
2242
2252Period
m3 /h
a, D
BHq
- mm
0
50
100
150
200
250
300
350
400
450
500
550
600
Area
Har
vest
ed -
ha, H
arve
st V
ol. -
m3 X
100
0,
Age
Mean volume (m3/ha) Mean DBHq Area harvest (ha/yr)
Volume harvest (m3/yr) Mean age CMA -PA (ha/yr)
Figure 91. Block 5 CMA –PA +age
TFL 25 Blk 5 CMA-PA-RndAge: 358ha mDBHq: 47/42/37
0
100
200
300
400
500
600
700
800
900
1,000
1,100
1,200
2002
2012
2022
2032
2042
2052
2062
2072
2082
2092
2102
2112
2122
2132
2142
2152
2162
2172
2182
2192
2202
2212
2222
2232
2242
2252Period
m3 /h
a, D
BHq
- mm
0
50
100
150
200
250
300
350
400
450
500
550
600
Area
Har
vest
ed -
ha, H
arve
st V
ol. -
m3 X
100
0, A
ge
Mean volume (m3/ha) Mean DBHq Area harvest (ha/yr)
Volume harvest (m3/yr) Mean age CMA -PA (ha/yr)
Figure 92. Block 5 CMA –PA –RndAge

TFL 25 - Timber Supply Analysis Page 95
TFL 25 Blk 5 CMA-PA-midVQ: 349 ha mDBHq: 47/42/37
0
100
200
300
400
500
600
700
800
900
1,000
1,100
1,200
2002
2012
2022
2032
2042
2052
2062
2072
2082
2092
2102
2112
2122
2132
2142
2152
2162
2172
2182
2192
2202
2212
2222
2232
2242
2252Period
m3 /h
a, D
BHq
- mm
0
50
100
150
200
250
300
350
400
450
500
550
600
Area
Har
vest
ed -
ha, H
arve
st V
ol. -
m3 X
100
0, A
ge
Mean volume (m3/ha) Mean DBHq Area harvest (ha/yr)
Volume harvest (m3/yr) Mean age CMA -PA (ha/yr)
Figure 93. Block 5 CMA –PA –midVQ
TFL 25 Blk 5 CMA-PA+BEO: 364ha mDBHq: 47/42/37
0
100
200
300
400
500
600
700
800
900
1,000
1,100
1,200
2002
2012
2022
2032
2042
2052
2062
2072
2082
2092
2102
2112
2122
2132
2142
2152
2162
2172
2182
2192
2202
2212
2222
2232
2242
2252Period
m3 /h
a, D
BHq
- mm
0
50
100
150
200
250
300
350
400
450
500
550
600
Area
Har
vest
ed -
ha, H
arve
st V
ol. -
m3 X
100
0, A
ge
Mean volume (m3/ha) Mean DBHq Area harvest (ha/yr)
Volume harvest (m3/yr) Mean age CMA-PA_NF
Figure 94. Block 5 CMA –PA +BEO

TFL 25 - Timber Supply Analysis Page 96
TFL 25 Blk 5 CMA-PA-SsSIest: 347 ha mDBHq: 47/42/37
0
100
200
300
400
500
600
700
800
900
1,000
1,100
1,200
2002
2012
2022
2032
2042
2052
2062
2072
2082
2092
2102
2112
2122
2132
2142
2152
2162
2172
2182
2192
2202
2212
2222
2232
2242
2252Period
m3 /h
a, D
BHq
- mm
0
50
100
150
200
250
300
350
400
450
500
550
600
Area
Har
vest
ed -
ha, H
arve
st V
ol. -
m3 X
100
0, A
ge
Mean volume (m3/ha) Mean DBHq Area harvest (ha/yr)
Volume harvest (m3/yr) Mean age CMA-PA_NF
Figure 95. Block 5 CMA –PA –SsSIest
TFL 25 Blk 5 CMV: 355,500 m3 mDBHq: 47/42/37
0
100
200
300
400
500
600
700
800
900
1,000
1,100
1,200
1,300
2002
2012
2022
2032
2042
2052
2062
2072
2082
2092
2102
2112
2122
2132
2142
2152
2162
2172
2182
2192
2202
2212
2222
2232
2242
2252
First Year of Period
m3 /h
a, D
BHq
- mm
0
50
100
150
200
250
300
350
400
450
500
550
600
650
Area
Har
vest
ed -
ha, H
arve
st V
ol. -
m3 X
10
00, A
ge
Mean Volume (m3/ha) Mean DBHq Area harvest (ha/yr) Mean age
Volume harvest (m3/yr) Heli (m3/yr) Heli (ha/yr)
Figure 96. Block 5 CMV (Volume Regulated)

TFL 25 - Timber Supply Analysis Page 97
TFL 25 Blk 6 CMA+Oe: 262 ha mDBHq: 47/42/37
0
100
200
300
400
500
600
700
800
900
1,000
1,100
1,200
1,300
1,400
2002
2012
2022
2032
2042
2052
2062
2072
2082
2092
2102
2112
2122
2132
2142
2152
2162
2172
2182
2192
2202
2212
2222
2232
2242
2252Period
m3 /h
a, D
BH
q - m
m
0
20
40
60
80
100
120
140
160
180
200
220
240
260
280
300
320
Area
Har
vest
ed -
ha, H
arve
st V
ol. -
m3 X
100
0, A
ge
Mean volume (m3/ha) Mean DBHq Area harvest (ha/yr)Volume harvest (m3/yr) Mean age CMA
Figure 97. Block 6 CMA +Oe
TFL 25 Blk 6 CMA-Oh: 215 ha mDBHq: 47/42/37
0
100
200
300
400
500
600
700
800
900
1,000
1,100
1,200
1,300
1,400
2002
2012
2022
2032
2042
2052
2062
2072
2082
2092
2102
2112
2122
2132
2142
2152
2162
2172
2182
2192
2202
2212
2222
2232
2242
2252Period
m3 /h
a, D
BH
q - m
m
0
20
40
60
80
100
120
140
160
180
200
220
240
260
280
300
320
340
Area
Har
vest
ed -
ha, H
arve
st V
ol. -
m3 X
100
0, A
ge
Mean volume (m3/ha) Mean DBHq Area harvest (ha/yr)Volume harvest (m3/yr) Mean age CMA
Figure 98. Block 6 CMA -Oh

TFL 25 - Timber Supply Analysis Page 98
TFL 25 Blk 6 CMA-SI3m: 176 ha mDBHq: 47/42/37
0
100
200
300
400
500
600
700
800
900
1,000
1,100
1,200
1,300
1,400
1,500
1,600
2002
2012
2022
2032
2042
2052
2062
2072
2082
2092
2102
2112
2122
2132
2142
2152
2162
2172
2182
2192
2202
2212
2222
2232
2242
2252Period
m3 /h
a, D
BH
q - m
m
0
20
40
60
80
100
120
140
160
180
200
220
240
260
280
300
320
Area
Har
vest
ed -
ha, H
arve
st V
ol. -
m3 X
100
0, A
ge
Mean volume (m3/ha) Mean DBHq Area harvest (ha/yr)Volume harvest (m3/yr) Mean age CMA
Figure 99. Block 6 CMA –SI3m
TFL 25 Blk 6 CMA-Age: 283 ha mDBHq: 44/39/34
0
100
200
300
400
500
600
700
800
900
1,000
1,100
1,200
1,300
1,400
2002
2012
2022
2032
2042
2052
2062
2072
2082
2092
2102
2112
2122
2132
2142
2152
2162
2172
2182
2192
2202
2212
2222
2232
2242
2252Period
m3 /h
a, D
BH
q - m
m
0
20
40
60
80
100
120
140
160
180
200
220
240
260
280
300
320
340
Area
Har
vest
ed -
ha, H
arve
st V
ol. -
m3 X
100
0, A
ge
Mean volume (m3/ha) Mean DBHq Area harvest (ha/yr)Volume harvest (m3/yr) Mean age CMA
Figure 100. Block 6 CMA -age

TFL 25 - Timber Supply Analysis Page 99
TFL 25 Blk 6 CMA+Age: 200 ha mDBHq: 50/45/40
0
100
200
300
400
500
600
700
800
900
1,000
1,100
1,200
1,300
1,400
1,500
1,600
2002
2012
2022
2032
2042
2052
2062
2072
2082
2092
2102
2112
2122
2132
2142
2152
2162
2172
2182
2192
2202
2212
2222
2232
2242
2252Period
m3 /h
a, D
BH
q - m
m
0
20
40
60
80
100
120
140
160
180
200
220
240
260
280
300
320
Area
Har
vest
ed -
ha, H
arve
st V
ol. -
m3 X
100
0, A
ge
Mean volume (m3/ha) Mean DBHq Area harvest (ha/yr)Volume harvest (m3/yr) Mean age CMA
Figure 101. Block 6 CMA +age
TFL 25 Blk 6 CMA-RndAge: 229 ha mDBHq: 47/42/37
0
100
200
300
400
500
600
700
800
900
1,000
1,100
1,200
1,300
1,400
2002
2012
2022
2032
2042
2052
2062
2072
2082
2092
2102
2112
2122
2132
2142
2152
2162
2172
2182
2192
2202
2212
2222
2232
2242
2252Period
m3 /h
a, D
BH
q - m
m
0
20
40
60
80
100
120
140
160
180
200
220
240
260
280
300
320
340
Area
Har
vest
ed -
ha, H
arve
st V
ol. -
m3 X
100
0, A
ge
Mean volume (m3/ha) Mean DBHq Area harvest (ha/yr)Volume harvest (m3/yr) Mean age CMA
Figure 102. Block 6 CMA -RndAge

TFL 25 - Timber Supply Analysis Page 100
TFL 25 Blk 6 CMA-midVQ: 239 ha mDBHq: 47/42/37
0
100
200
300
400
500
600
700
800
900
1,000
1,100
1,200
1,300
1,400
2002
2012
2022
2032
2042
2052
2062
2072
2082
2092
2102
2112
2122
2132
2142
2152
2162
2172
2182
2192
2202
2212
2222
2232
2242
2252Period
m3 /h
a, D
BH
q - m
m
0
20
40
60
80
100
120
140
160
180
200
220
240
260
280
300
320
340
Area
Har
vest
ed -
ha, H
arve
st V
ol. -
m3 X
100
0, A
ge
Mean volume (m3/ha) Mean DBHq Area harvest (ha/yr)Volume harvest (m3/yr) Mean age CMA
Figure 103. Block 6 CMA -midVQ
TFL 25 Blk 6 CMA-Oc: 30 ha mDBHq: 47/42/37
0
100
200
300
400
500
600
700
800
900
1,000
1,100
1,200
1,300
1,400
2002
2012
2022
2032
2042
2052
2062
2072
2082
2092
2102
2112
2122
2132
2142
2152
2162
2172
2182
2192
2202
2212
2222
2232
2242
2252Period
m3 /h
a, D
BH
q - m
m
0
20
40
60
80
100
120
140
160
180
200
220
240
260
280
300
320
340
Area
Har
vest
ed -
ha, H
arve
st V
ol. -
m3 X
100
0, A
ge
Mean volume (m3/ha) Mean DBHq Area harvest (ha/yr)Volume harvest (m3/yr) Mean age CMA
Figure 104. Block 6 CMA -Oc

TFL 25 - Timber Supply Analysis Page 101
TFL 25 Blk 6 CMA UnCon: 297 ha mDBHq: 47/42/37
0
100
200
300
400
500
600
700
800
900
1,000
1,100
1,200
1,300
1,400
2002
2012
2022
2032
2042
2052
2062
2072
2082
2092
2102
2112
2122
2132
2142
2152
2162
2172
2182
2192
2202
2212
2222
2232
2242
2252Period
m3 /h
a, D
BH
q - m
m
0
20
40
60
80
100
120
140
160
180
200
220
240
260
280
300
320
340
Area
Har
vest
ed -
ha, H
arve
st V
ol. -
m3 X
100
0, A
ge
Mean volume (m3/ha) Mean DBHq Area harvest (ha/yr)Volume harvest (m3/yr) Mean age CMA
Figure 105. Block 6 CMA UnCon
TFL 25 Blk 6 CMA-Dr: 234 ha mDBHq: 47/42/37
0
100
200
300
400
500
600
700
800
900
1,000
1,100
1,200
1,300
1,400
2002
2012
2022
2032
2042
2052
2062
2072
2082
2092
2102
2112
2122
2132
2142
2152
2162
2172
2182
2192
2202
2212
2222
2232
2242
2252Period
m3 /h
a, D
BH
q - m
m
0
20
40
60
80
100
120
140
160
180
200
220
240
260
280
300
320
340
Area
Har
vest
ed -
ha, H
arve
st V
ol. -
m3 X
100
0, A
ge
Mean volume (m3/ha) Mean DBHq Area harvest (ha/yr)Mean age Volume harvest (m3/yr) CMA Dr harvest (m3/yr)CMA
Figure 106. Block 6 CMA -Dr
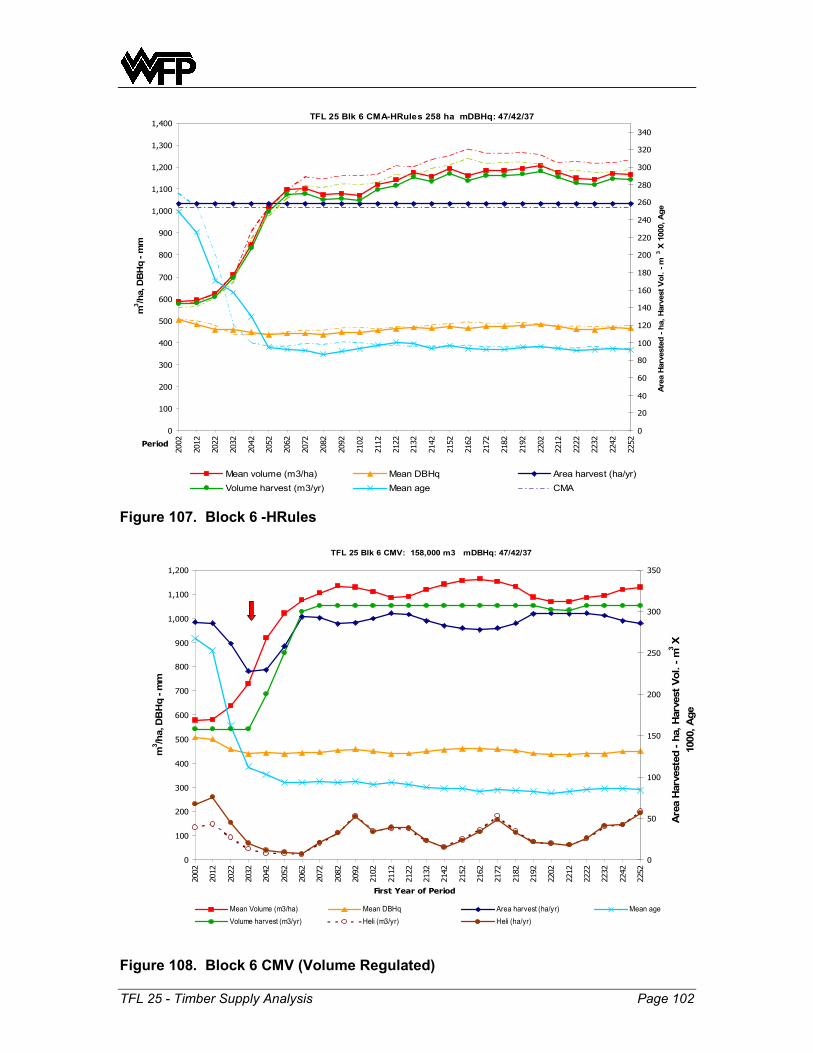
TFL 25 - Timber Supply Analysis Page 102
TFL 25 Blk 6 CMA-HRules 258 ha mDBHq: 47/42/37
0
100
200
300
400
500
600
700
800
900
1,000
1,100
1,200
1,300
1,400
2002
2012
2022
2032
2042
2052
2062
2072
2082
2092
2102
2112
2122
2132
2142
2152
2162
2172
2182
2192
2202
2212
2222
2232
2242
2252Period
m3 /h
a, D
BH
q - m
m
0
20
40
60
80
100
120
140
160
180
200
220
240
260
280
300
320
340
Area
Har
vest
ed -
ha, H
arve
st V
ol. -
m3 X
100
0, A
ge
Mean volume (m3/ha) Mean DBHq Area harvest (ha/yr)Volume harvest (m3/yr) Mean age CMA
Figure 107. Block 6 -HRules
TFL 25 Blk 6 CMV: 158,000 m3 mDBHq: 47/42/37
0
100
200
300
400
500
600
700
800
900
1,000
1,100
1,200
2002
2012
2022
2032
2042
2052
2062
2072
2082
2092
2102
2112
2122
2132
2142
2152
2162
2172
2182
2192
2202
2212
2222
2232
2242
2252
First Year of Period
m3 /h
a, D
BH
q - m
m
0
50
100
150
200
250
300
350
Area
Har
vest
ed -
ha, H
arve
st V
ol. -
m3 X
10
00, A
ge
Mean Volume (m3/ha) Mean DBHq Area harvest (ha/yr) Mean age
Volume harvest (m3/yr) Heli (m3/yr) Heli (ha/yr)
Figure 108. Block 6 CMV (Volume Regulated)

TFL 25 - Timber Supply Analysis Page 103
Appendix V-B Change Summaries for Simulation Runs
Relative to CM
Table 9. Annual Area Harvest Summary
Harvest (ha)Run ID 1 2 3 5 5-PA 6CMA 292 124 88 492 364 254_up10 321.2 136.4 96.8 541.2 279.4_down10 262.8 111.6 79.2 442.8 228.6+Oe 294 126 90 511 262-Oh 286 101 80 404 215-SI3m 236 106 71 434 323 176-age 309 142 101 559 409 283+age 239 105 74 448 336 200-RndAge 283 120 84 483 358 229-PA 364-PA-OA 206-midVQ 289 122 81 477 349 239+BEO 120 492 364-SsSIest 469 347-Oc 24 30UnCon 307 133 92 543 297-Dr 234-HRules 125 258+ageX2 196-ageX2 318
Block

TFL 25 - Timber Supply Analysis Page 104
Table 10. Change in Annual Area Harvest Summary
Change (ha)Run ID 1 2 3 5 5-PA 6CMA 292 124 88 492 364 254_up10 29 12 9 49 25_down10 -29 -12 -9 -49 -25 +Oe 2 2 2 19 8-Oh -6 -23 -8 -88 -39 -SI3m -56 -18 -17 -58 -41 -78 -age 17 18 13 67 45 29+age -53 -19 -14 -44 -28 -54 -RndAge -9 -4 -4 -9 -6 -25 -PA -128 -PA-OA -286 -midVQ -3 -2 -7 -15 -15 -15 +BEO -4 0 0-SsSIest -23 -17 -Oc -100 -224 UnCon 15 9 4 51 43-Dr -20 -HRules 1 4+ageX2 -96 -ageX2 26
Block

TFL 25 - Timber Supply Analysis Page 105
Table 11. Percentage Change in Annual Area Harvest Summary
Change (%)Run ID 1 2 3 5 5-PA 6CMA 292 124 88 492 364 254_up10 10.0 10.0 10.0 10.0 10.0_down10 -10.0 -10.0 -10.0 -10.0 -10.0 +Oe 0.7 1.6 2.3 3.9 3.1-Oh -2.1 -18.5 -9.1 -17.9 -15.4 -SI3m -19.2 -14.5 -19.3 -11.8 -11.3 -30.7 -age 5.8 14.5 14.8 13.6 12.4 11.4+age -18.2 -15.3 -15.9 -8.9 -7.7 -21.3 -RndAge -3.1 -3.2 -4.5 -1.8 -1.6 -9.8 -PA -26.0 -PA-OA -58.1 -midVQ -1.0 -1.6 -8.0 -3.0 -4.1 -5.9 +BEO -3.2 0.0 0.0-SsSIest -4.7 -4.7 -Oc -80.6 -88.2 UnCon 5.1 7.3 4.5 10.4 16.9-Dr -7.9 -HRules 0.8 1.6+ageX2 -32.9 -ageX2 8.9
Block

TFL 25 - Timber Supply Analysis Page 106
Table 12. Volume Harvest Summary30
Run ID 1 2 3 5 5-PA 6 -PACMA Near 3,290,689 1,804,675 1,366,849 5,685,158 4,202,677 2,817,458 14,964,829 13,482,348
Mid 9,485,043 4,529,882 3,486,836 14,224,787 10,631,840 10,477,782 42,204,329 38,611,383
Long 40,497,623 22,003,138 14,110,692 77,965,375 57,282,168 52,937,604 207,514,432 186,831,225
total 53,273,355 28,337,695 18,964,377 97,875,320 72,116,686 66,232,844 264,683,590 238,924,956_up10 Near 295,286 161,777 149,366 606,013 280,090 1,492,532
Mid 210,996 546,603 91,613 1,455,009 231,007 2,535,228Long 119,066 -221,025 26,543 3,728,089 1,593,543 5,246,217
total 625,348 487,356 267,522 5,789,110 0 2,104,640 9,273,977 0_down10 Near -331,979 -186,512 -118,184 -592,618 -290,416 -1,519,709
Mid -850,346 -464,403 -387,890 -1,394,214 -1,211,057 -4,307,909 Long -2,276,797 -1,094,557 -358,527 -6,994,001 -2,413,468 -13,137,351
total -3,459,122 -1,745,471 -864,601 -8,980,833 0 -3,914,942 -18,964,969 0+Oe Near 5,881 18,121 44,461 195,718 70,613 334,794
Mid 50,784 98,774 54,386 383,054 223,140 810,138Long 204,829 397,782 403,834 1,395,432 1,139,030 3,540,907
total 261,494 514,677 502,681 1,974,204 0 1,432,784 4,685,840 0-Oh Near -113,792 -341,175 -125,560 -1,007,168 -456,765 -2,044,460
Mid -168,064 -805,616 -320,814 -2,531,151 -1,424,607 -5,250,252 Long -995,535 -4,052,905 -1,284,923 -13,381,738 -6,402,669 -26,117,769
total -1,277,392 -5,199,695 -1,731,297 -16,920,057 0 -8,284,041 -33,412,481 0-SI3m Near -646,329 -264,691 -256,024 -674,991 -466,242 -848,975 -2,691,010 -2,482,261
Mid -1,290,332 -703,709 -704,861 -1,736,730 -1,354,326 -4,251,409 -8,687,042 -8,304,638 Long -2,332,405 -1,675,352 -993,693 -11,353,601 -7,890,131 -9,248,464 -25,603,514 -22,140,045
total -4,269,066 -2,643,752 -1,954,578 -13,765,322 -9,710,700 -14,348,848 -36,981,566 -32,926,944 -age Near 131,295 252,886 215,696 779,472 501,442 318,744 1,698,093 1,420,063
Mid 150,460 698,426 474,796 2,026,703 1,266,600 1,038,259 4,388,645 3,628,542Long -44,262 519,351 -59,956 6,594,617 4,591,111 1,324,443 8,334,193 6,330,686
total 237,493 1,470,663 630,536 9,400,793 6,359,153 2,681,446 14,420,930 11,379,291+age Near -614,724 -295,108 -201,921 -535,572 -358,268 -640,327 -2,287,652 -2,110,349
Mid -776,149 -693,513 -588,626 -1,305,648 -963,409 -2,932,219 -6,296,154 -5,953,915 Long -2,302,275 -1,675,794 -705,531 -10,459,084 -6,960,139 -5,004,809 -20,147,492 -16,648,548
total -3,693,148 -2,664,415 -1,496,077 -12,300,303 -8,281,817 -8,577,356 -28,731,298 -24,712,812 -RndAge Near -101,964 -49,920 -56,918 -112,573 -70,187 -291,307 -612,681 -570,296
Mid 44,484 -147,413 -181,702 -249,000 -332,354 -1,209,512 -1,743,143 -1,826,497 Long -275,867 -334,777 -62,507 -942,316 -684,677 -1,792,302 -3,407,768 -3,150,130
total -333,346 -532,110 -301,127 -1,303,889 -1,087,219 -3,293,121 -5,763,593 -5,546,923 -PA Near -1,482,481
Mid -3,592,946 Long -20,683,207
total 0 0 0 -25,758,634 0 0 0 0-PA-OA Near -3,318,322 -1,835,841
Mid -8,223,637 -4,630,691 Long -46,412,503 -25,729,296
total 0 0 0 -57,954,462 -32,195,827 0 0 0
BlockVolume Changes Totals
30 “Near” refers to first two decades; “Mid” to next five decades; “Long” to decade 8 and beyond.

TFL 25 - Timber Supply Analysis Page 107
Run ID 1 2 3 5 5-PA 6 -PA-midVQ Near -51,139 -30,844 -113,352 -191,526 -201,782 -164,816 -551,677 -561,933
Mid -64,649 -78,783 -277,738 -377,468 -461,055 -749,954 -1,548,592 -1,632,179 Long -297,555 -352,932 -612,421 -2,121,303 -2,203,528 -2,482,001 -5,866,213 -5,948,437
total -413,343 -462,560 -1,003,511 -2,690,298 -2,866,365 -3,396,771 -7,966,482 -8,142,550 +BEO Near -46,983 0 0
Mid -149,357 0 0Long -387,443 0 0
total 0 -583,784 0 0 0 0 0 0-SsSIest Near -240,880 -240,221
Mid -688,840 -616,604 Long -7,001,528 -5,138,009
total 0 0 0 -7,931,248 -5,994,834 0 0 0-Oc Near -1,458,314 -2,456,582
Mid -3,670,563 -9,574,542 Long -17,961,127 -47,309,926
total 0 -23,090,004 0 0 0 -59,341,050 0 0UnCon Near 85,147 130,858 71,172 538,208 456,414 1,281,798
Mid 290,445 302,657 130,936 1,321,438 1,845,719 3,891,194Long 1,653,518 1,688,789 670,334 6,569,146 5,471,160 16,052,948
total 2,029,110 2,122,304 872,442 8,428,792 0 7,773,294 21,225,941 0-Dr Near -128,155
Mid -521,853 Long -3,875,219
total 0 0 0 0 0 -4,525,228 0 0-HRules Near 5,082 77,988
Mid -21,029 44,865Long -499,888 -2,246,364
total 0 -515,835 0 0 0 -2,123,511 0 0+ageX2 Near -614,724
Mid -776,149 Long -2,302,275
total -3,693,148 0 0 0 0 0 0 0-ageX2 Near 224,191
Mid 272,761Long -113,328
total 383,624 0 0 0 0 0 0 0
BlockVolume Changes Totals
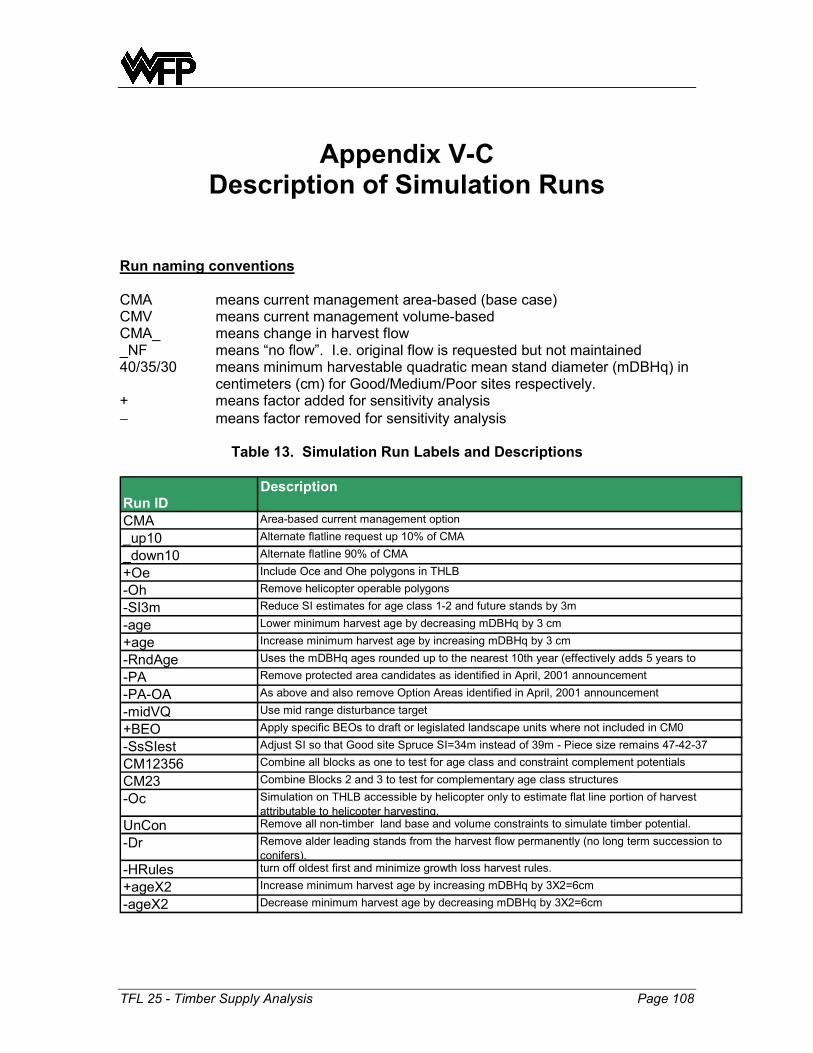
TFL 25 - Timber Supply Analysis Page 108
Appendix V-C Description of Simulation Runs
Run naming conventions CMA means current management area-based (base case) CMV means current management volume-based CMA_ means change in harvest flow _NF means “no flow”. I.e. original flow is requested but not maintained 40/35/30 means minimum harvestable quadratic mean stand diameter (mDBHq) in
centimeters (cm) for Good/Medium/Poor sites respectively. + means factor added for sensitivity analysis − means factor removed for sensitivity analysis
Table 13. Simulation Run Labels and Descriptions
CMA Area-based current management option
_up10 Alternate flatline request up 10% of CMA
_down10 Alternate flatline 90% of CMA
+Oe Include Oce and Ohe polygons in THLB
-Oh Remove helicopter operable polygons
-SI3m Reduce SI estimates for age class 1-2 and future stands by 3m
-age Lower minimum harvest age by decreasing mDBHq by 3 cm
+age Increase minimum harvest age by increasing mDBHq by 3 cm
-RndAge Uses the mDBHq ages rounded up to the nearest 10th year (effectively adds 5 years to
-PA Remove protected area candidates as identified in April, 2001 announcement
-PA-OA As above and also remove Option Areas identified in April, 2001 announcement
-midVQ Use mid range disturbance target
+BEO Apply specific BEOs to draft or legislated landscape units where not included in CM0
-SsSIest Adjust SI so that Good site Spruce SI=34m instead of 39m - Piece size remains 47-42-37
CM12356 Combine all blocks as one to test for age class and constraint complement potentials
CM23 Combine Blocks 2 and 3 to test for complementary age class structures
-Oc Simulation on THLB accessible by helicopter only to estimate flat line portion of harvest attributable to helicopter harvesting.
UnCon Remove all non-timber land base and volume constraints to simulate timber potential.
-Dr Remove alder leading stands from the harvest flow permanently (no long term succession to conifers).
-HRules turn off oldest first and minimize growth loss harvest rules.
+ageX2 Increase minimum harvest age by increasing mDBHq by 3X2=6cm
-ageX2 Decrease minimum harvest age by decreasing mDBHq by 3X2=6cm
DescriptionRun ID

TFL 25 - Timber Supply Analysis Page 109
Appendix V-D Modeling for Cultural Cedar
As there is interest in the sustainability of cedar harvesting, a preliminary model
was developed to predict cedar availability into the future. WFP cruise information
from TFL 25 and the adjacent Timber Supply Areas was analysed to develop a
cedar diameter class distribution for old growth stands and TIPSY was used to
generate distributions for second growth at various stand ages. These
distributions were used, based on inventory or estimated future stand species
composition and simulation age, to forecast the cedar component of harvests and
growing stock through the 250-year simulation.
There are a number of difficulties with such a model:
• Although TIPSY does produce a diameter distribution, it does not report
diameters beyond 90 cm DBH.
• TIPSY is calibrated for predicting second growth volumes and may not reliably
predict diameter distributions at older stand ages that are approaching and
beyond the ages within the calibration data set.
• The western redcedar data set on which TIPSY is calibrated is much smaller
than for other coastal species and therefore predictions are less certain.
There is no data for yellow cedar hence it is assumed to mimic western
redcedar in its growth and yield habits.
• “Monumental” and cultural cedar is not easily defined. Tree sizes and quality
needed for cultural purposes likely vary considerably depending on the use.
For example, large totem poles, canoes, and buildings would need large,
sound trees. Large decayed trees could provide split planks and carving
blocks. Sound but smaller trees may provide for smaller canoes, poles,
roundwood posts and beams, and sawn planks/blocks. Trees of almost any

TFL 25 - Timber Supply Analysis Page 110
size could provide bark for stripping if a section of clear bole is present.
Perhaps smaller or more vigorous cedars provide good roots. Clearly
guidance is needed from First Nations to better define the characteristics of
various types of cultural cedars.
• Cruise data was used to estimate cedar diameter distributions in old growth
forests, but associated decay-indicator data was not felt suitable for predicting
the percentage of old growth trees that are sound and suitable for monumental
purposes. Again guidance is needed from First Nations to estimate the
proportion of larger trees actually suitable.
TFL 25 Cultural Cedar Estimate
0
20,000
40,000
60,000
80,000
100,000
120,000
140,000
160,000
180,000
200,000
2002
2012
2022
2032
2042
2052
2062
2072
2082
2092
2102
2112
2122
2132
2142
2152
2162
2172
2182
2192
2202
2212
2222
2232
2242
2252
2262
First Year of Period
Estim
ated
Num
ber o
f Sou
nd C
edar
s >7
0cm
DB
H
Block 1 Block 2 Block 3 Block 5 Block 6 Total
Figure 109. Test Estimate of Cultural Cedar Availability for TFL 25 through 250 years.
Figure 109 presents the results of a model test for each TFL Block using the
assumptions that one in twenty large diameter old growth cedars (likely many

TFL 25 - Timber Supply Analysis Page 111
centuries old) is sound and that most second growth cedars (<200-years-old) are
sound. The data indicates the estimated number of larger, sound cedar trees
occurring on the land base through time. In all blocks there is an initial decline
until harvesting shifts to second growth forests and most blocks recover in the
long term. In Block 5 the decline is 34% but much extended as old forest is the
primary source of timber for the next century. Block 5 dwarfs the other
management units due to its large land area and high percentage of timber
reserved from harvest for operability or environmental reasons.
For the TFL as a whole, estimated availability of larger cedars declines 22%
through the middle of the simulation but recovers in the long term to current
levels.