TFAWS Short Course - TFAWS 2017 | Thermal & Fluids ... · Thermal cycling (along with vibration...
119
Thermal Testing Presented By Eric W. Grob NASA Goddard Space Flight Center ([email protected]) Thermal & Fluids Analysis Workshop TFAWS 2014 August 4-8, 2014 NASA John H. Glenn Research Center Cleveland, OH TFAWS Short Course
Transcript of TFAWS Short Course - TFAWS 2017 | Thermal & Fluids ... · Thermal cycling (along with vibration...

Thermal Testing
Presented By
Eric W. Grob
NASA Goddard Space Flight Center
Thermal & Fluids Analysis Workshop
TFAWS 2014
August 4-8, 2014
NASA John H. Glenn Research Center
Cleveland, OH
TFAWS Short Course

Agenda
• Introduction
• Background/History
• Thermal Testing Overview
• Requirements
• Test Setup
• Thermal Analysis and Documentation
TFAWS – August 4-8, 2014 2

1.0 Introduction & Overview
• “Thermal testing” is a broad topic that would be impossible to cover in
a short course format. There are so many unique situations and
specialties that a week of short courses could easily be filled.
• This short course presents the basics of satellite thermal testing, with
a slant to the Goddard philosophy. Hopefully will generate interest for
more detailed discussions/topics and even similar courses on other
specialties at future TFAWS.
• Please ask questions where you think appropriate, and I will answer or
defer to a later point in the course, or sidebar.
• Please provide comments or suggestions on how to improve this
course – likely it will be used again.
TFAWS – August 4-8, 2014 3

Why Do We Need Thermal Testing ?
• Discussion in the clase…..
TFAWS – August 4-8, 2014 4

History/Background
• To understand how today’s requirements came to be, some historical
perspective is needed.
• Environmental testing has it’s roots in World War II with the
development of electronic systems. As technology improved, and
products downsized, complexity increased. Compliance to design
requirements no longer equated to reliability over an extended
lifetime.
• Burn-in testing – powering electronics at high temperatures for
extended time periods– was introduced in the 1960’s to precipitate
these early failures.
• The military introduced standards requiring testing in simulated
environmental extremes. Thermal cycling (along with vibration testing)
became the basis for Environmental Stress Screening (ESS).
TFAWS – August 4-8, 2014 5
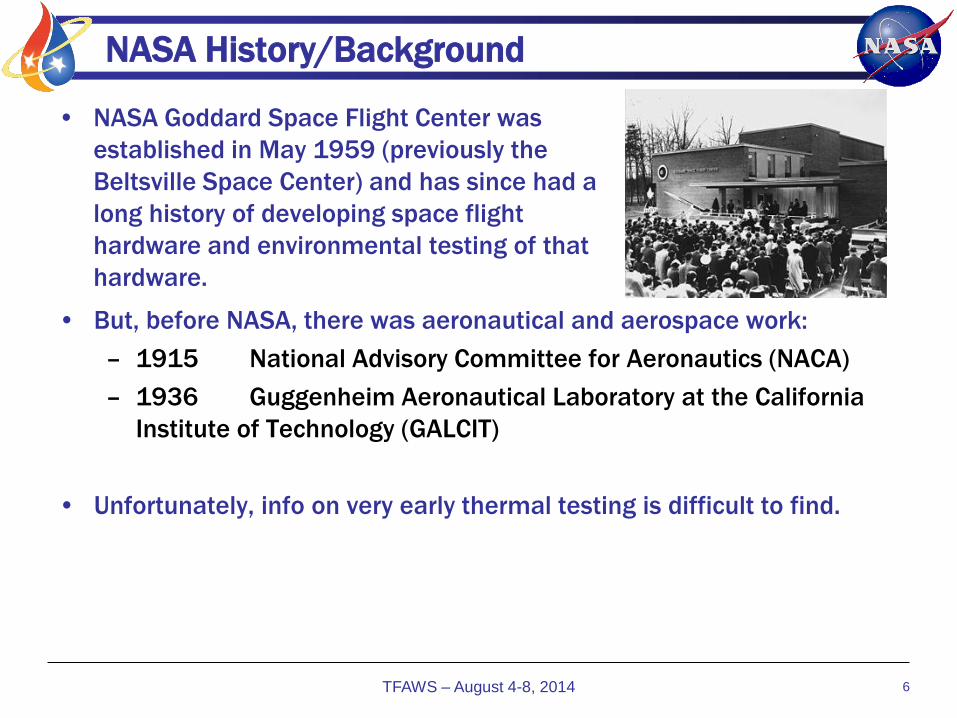
NASA History/Background
• NASA Goddard Space Flight Center was
established in May 1959 (previously the
Beltsville Space Center) and has since had a
long history of developing space flight
hardware and environmental testing of that
hardware.
TFAWS – August 4-8, 2014 6
• But, before NASA, there was aeronautical and aerospace work:
– 1915 National Advisory Committee for Aeronautics (NACA)
– 1936 Guggenheim Aeronautical Laboratory at the California
Institute of Technology (GALCIT)
• Unfortunately, info on very early thermal testing is difficult to find.

Early Testing at GSFC
• NASA TN D-1748 “EXPERIENCE IN THERMAL-VACUUM TESTING EARTH SATELLITES AT GODDARD SPACE FLIGHT CENTER” (A. Timmins, K. Rosette), August 1963
– Summarized testing of first 3 spacecraft
• Explorer X 1 prototype, 3 flight
• Explorer XII 1 prototype, 2 flight
• Ariel I 1 prototype, 2 flight
TFAWS – August 4-8, 2014 7
• While it isn’t clearly documented, it seems
that thermal vac testing back then was
only a few days with multi-day hot and cold
soaks, and a “thermal gradient” test, that
evolved into several cycles.

Early Test Results
TFAWS – August 4-8, 2014 8
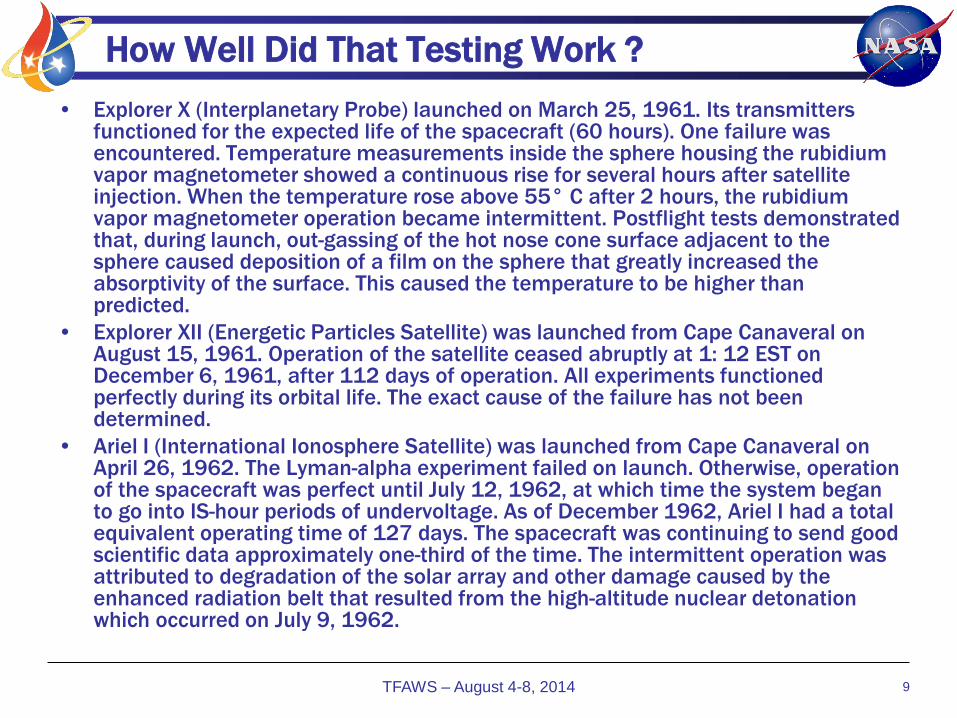
How Well Did That Testing Work ?
• Explorer X (Interplanetary Probe) launched on March 25, 1961. Its transmitters functioned for the expected life of the spacecraft (60 hours). One failure was encountered. Temperature measurements inside the sphere housing the rubidium vapor magnetometer showed a continuous rise for several hours after satellite injection. When the temperature rose above 55° C after 2 hours, the rubidium vapor magnetometer operation became intermittent. Postflight tests demonstrated that, during launch, out-gassing of the hot nose cone surface adjacent to the sphere caused deposition of a film on the sphere that greatly increased the absorptivity of the surface. This caused the temperature to be higher than predicted.
• Explorer XII (Energetic Particles Satellite) was launched from Cape Canaveral on August 15, 1961. Operation of the satellite ceased abruptly at 1: 12 EST on December 6, 1961, after 112 days of operation. All experiments functioned perfectly during its orbital life. The exact cause of the failure has not been determined.
• Ariel I (International Ionosphere Satellite) was launched from Cape Canaveral on April 26, 1962. The Lyman-alpha experiment failed on launch. Otherwise, operation of the spacecraft was perfect until July 12, 1962, at which time the system began to go into IS-hour periods of undervoltage. As of December 1962, Ariel I had a total equivalent operating time of 127 days. The spacecraft was continuing to send good scientific data approximately one-third of the time. The intermittent operation was attributed to degradation of the solar array and other damage caused by the enhanced radiation belt that resulted from the high-altitude nuclear detonation which occurred on July 9, 1962.
TFAWS – August 4-8, 2014
9

Recommendations ?
• The laboratory and flight data presented were insufficient to form any
firm test times. However, some useful estimates were made, such as:
– Prototype spacecraft: (hot) 6 days (cold) 4 days
– Flight unit spacecraft: (hot) 4 days (cold) 4 days
– The ± 10°C margin used for prototype spacecraft testing should be
continued.
TFAWS – August 4-8, 2014 10
• Update in 1966 (NASA TN D-3713):
– Seven of the 10 operated for the full
planned lifetime of the satellite, and the
other three had lifetimes of 112, 193,
and 312 days.
– Recommend minimum of six days at
each thermal extreme
– simulation of high rate of change of
temperatures as well as simulation of
large thermal gradients when applicable.

More Updates
• Current (and future) test philosophy is (will be) based on success record.
• Study done in 1970 summarized the total space life performance of 57 Goddard Space Flight Center spacecraft. This was done to justify a continuation of the Goddard philosophy requiring a system level environmental test.
– Four meteorological spacecraft
– Two astronomical observatories
– Six geophysical observatories
– Six solar observatories
– Six applications technology spacecraft
– Seven interplanetary monitoring platforms
– Twelve operational weather spacecraft
– Fourteen miscellaneous scientific missions
• The time distribution of 449 malfunctions, of which 248 were classified as failures, is presented. Test data were available for 39 of the spacecraft and permitted a comparison of system test performance with the first day, first-month, and total space life performance.
11
GSFC Philosophy – leads to GEVS predecessors
TFAWS – August 4-8, 2014
Evolution of GEVS
• Throughout most of the 1960’s, test requirements were created for each launch vehicle and provided specific tests and test levels. • 1962 General Environmental Test Specification for Delta Launched Spacecraft,
Goddard Space Flight Center, Preliminary Draft,.
• In 1969 the first general environmental test specification was published covering several expendable launch vehicles (ELV’s).
• It is important to understand how GEVS has developed over the years. These methods have resulted in a record of mission success.
• Historical GEVS-type documents at GSFC
– 1969 S-320-G-1 General Environmental Test Specification for Spacecraft and Components
– ??? GETS General Environmental Test Specification for ELV Payloads • last revision in 1978
– 1984 GEVS General Environmental Verification Specification for STS Payloads, Subsystems and Components
– 1990 GEVS-SE General Environmental Verification Specification for STS & ELV Payloads, Subsystems and Components
• Rev A 1996
– 2005 GSFC-STD-7000 GENERAL ENVIRONMENTAL VERIFICATION STANDARD (GEVS) For GSFC Flight Programs and Projects
• Rev A 2013
12 TFAWS – August 4-8, 2014
GEVS
• GEVS: General Environmental Verification Specification for NASA
Goddard Space Flight Center. It provides requirements and guidelines for
environmental verification programs for GSFC missions, at the payload,
subsystem and component (units) level.
– The Systems Management Office (SMO) which is part of the Goddard
Office of Systems Safety and Mission Assurance (OSSMA) is
responsible for setting verification policy and publishing the GEVS. The
requirements are constantly under evaluation and recommendations
for changes being gathered. The revision process is worked very
closely with the Applied Engineering and Technology Directorate
(AETD).
13 TFAWS – August 4-8, 2014
More Later

How do you generate test requirements?
• What is/are the expected failure mechanisms?
• Develop a test philosophy to exploit those weaknesses.
• Failures typically fall into 4 categories:
– Early failures caused by a major design weakness.
– Early failures resulting from defects in material or workmanship.
– Random failures whose frequency of occurrence is a function of
design and quality control.
– Wear-out failures.
• The systems test program is directed chiefly at eliminating those
failures which arise from the first two causes.
– Prototype testing is directed at qualifying the design and
eliminating failures due to the first category.
– Testing of the [proto]flight unit is intended then to discover failures
in the second category.
TFAWS – August 4-8, 2014 14
2.0 Thermal Testing Overview
• Types of thermal testing, includes qualification, engineering development, life test, and verification testing. We’ll be focusing on verification testing.
• Thermal verification testing is one of several environmental screening tests done in support of flight projects .
– At the instrument and spacecraft level, thermal testing is the most complex and costly of the environmental tests, and can last for weeks or months.
• Thermal Balance:
– Verification of the thermal design in simulated mission bounding environments/conditions
– Provide data for model correlation to give confidence in final mission predictions
– Demonstrate performance over range of simulated mission temperatures in different modes.
• Thermal Cycles:
– Environmental Stress Screening (ESS) of test article
– Demonstrate the performance of the test item in vacuum at a temperature range outside those allowed for the mission.
TFAWS – August 4-8, 2014 15
What is Environmental Stress Screening (ESS) ?
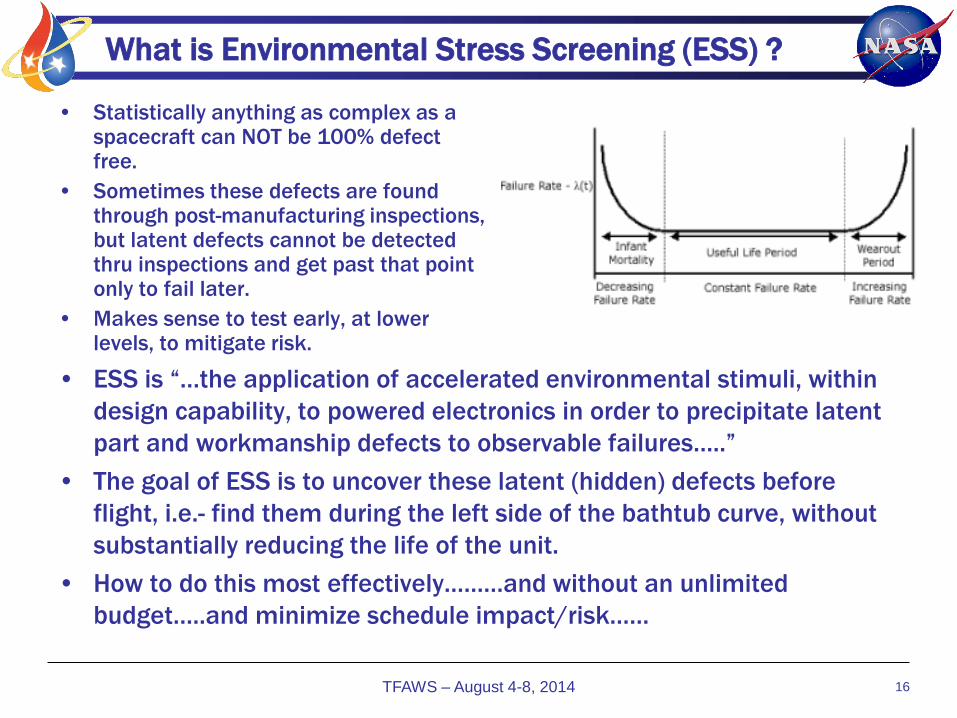
• Statistically anything as complex as a spacecraft can NOT be 100% defect free.
• Sometimes these defects are found through post-manufacturing inspections, but latent defects cannot be detected thru inspections and get past that point only to fail later.
• Makes sense to test early, at lower levels, to mitigate risk.
TFAWS – August 4-8, 2014 16
• ESS is “…the application of accelerated environmental stimuli, within
design capability, to powered electronics in order to precipitate latent
part and workmanship defects to observable failures…..”
• The goal of ESS is to uncover these latent (hidden) defects before
flight, i.e.- find them during the left side of the bathtub curve, without
substantially reducing the life of the unit.
• How to do this most effectively………and without an unlimited
budget…..and minimize schedule impact/risk……
Types of Failures/Issues
• Parts defects: bulging packages, case rupture,
• PCB defects: delam, trace lift, card guide under-torque
• Solder issues: poor fillets, coverage
• Bond separations: for “high” power parts to boards
• Tolerance stack-up issues: CTE effects could cause shorting
• Thermal mismatches:
• Changes in electrical characteristics: FPGAs, timing,
TFAWS – August 4-8, 2014 17

Level of Assembly
• Spacecraft: Observatory (SC Bus + Science Instruments), LV Payload,
• Module: Spacecraft Bus, Science Payload, Payload Fairing
• Subsystem: Instrument/Experiment, Structure, Attitude Control,
C&DH, Thermal Control, Electrical Power, TT&C, Propulsion
• Section: Electronic Tray or Pallet, Stacked units, Electronic Boxes
Mounted on a Panel, Solar Array Sections
• Unit: Electronic Box, Gyro Package, Motor, Actuator, Battery,
Receiver, Transmitter, Antenna, Solar Panel, Valve Regulator
• Assembly: Power Amplifier, Regulator
• Subassembly: Wire harness, Loaded PCB
• Part: Resistor, Capacitor, IC, Switch, Connector, Bolt, Screw,
Gasket, Bracket, Valve Stem
18 TFAWS – August 4-8, 2014
Robust testing at lower levels of assembly mitigates issues at
higher levels when schedule impact of anomalies is more severe

Units
• Without trying to provide an absolute definition of what a “unit”, I
think of a “unit” typically as the “smallest thing you bolt on” at SC
assembly. Most commonly:
– Electronic boxes of all types
– Propulsion valves, thrusters, pressure transducers,
– Batteries
– RWAs
– RF stuff (besides SSPAs, amps, etc)
– Antennas (of all types)
– Mechanisms: hinges, dampers, SADAs, gimbals,
– Structural stuff
– Solar arrays
TFAWS – August 4-8, 2014 19
Unit Level Thermal Testing
• Units typically are “procured” and can have a purely conductive or radiativel (or both) thermal design, with mounting I/F temperature range specified that they must operate and meet performance requirements within.
• Testing at the unit level is almost always only for stress screening and performance margin. Typically mount to a platen/coldplate inside a vacuum chamber that is controlled to the spec temperatures.
• “Survival” and “Safe” (or “Safehold”) are spacecraft operating modes. In these modes, units are either ON or OFF. Units have “Operational” and “Non-Operational” modes
– The unit dissipations may be different due to usage: voltage converter efficiencies vs load, battery dissipation versus IBUS or DOD, etc, COM in “quiescent/idle” vs “transmit, RWA rpm, etc
– Non-Op is OFF – plain and simple……
• Objectives of Unit testing:
– Environmental Stress Screening (ESS) thermal cycles; burn-in; survival/turn-on
• Electronics: typically temperature controlled platen, with ambient or controlled radiative sink
• Mechanisms: lamps, heaters, controlled radiative sink
– Measure electronics power at temperature extremes
– Bakeout
TFAWS – August 4-8, 2014
Subsystem/Instrument Level
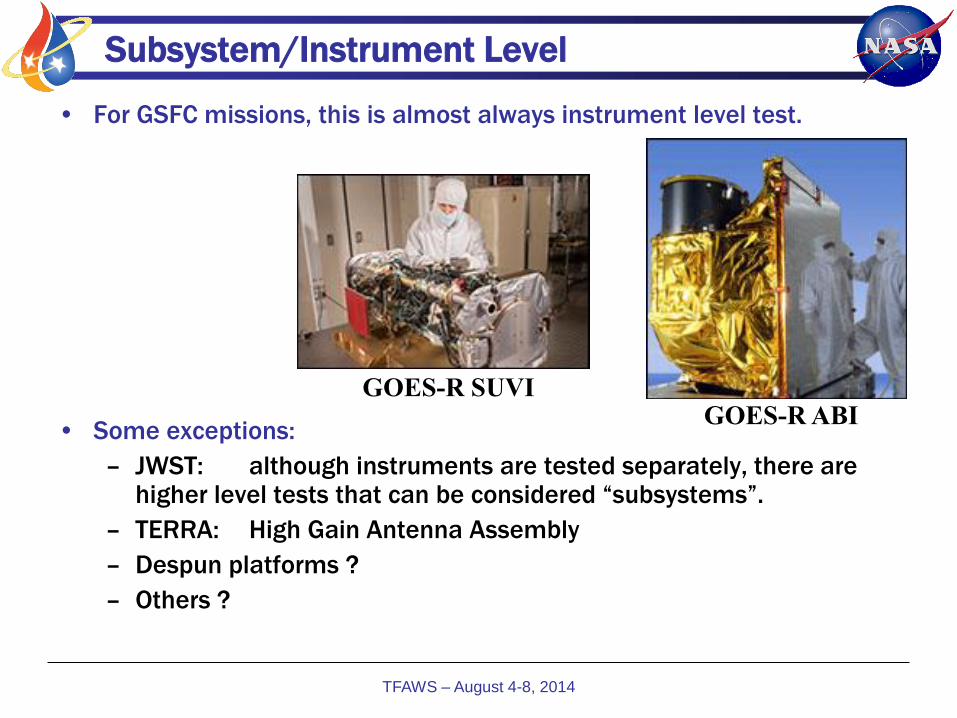
• For GSFC missions, this is almost always instrument level test.
• Some exceptions:
– JWST: although instruments are tested separately, there are higher level tests that can be considered “subsystems”.
– TERRA: High Gain Antenna Assembly
– Despun platforms ?
– Others ?
TFAWS – August 4-8, 2014
GOES-R ABI GOES-R SUVI

Instrument Level Thermal Testing
• Instruments are almost always “procured” separately from the SC, and have their own specs/contracts/etc. Most are thermally isolated, but still have I/F temperature requirements where they must operate and meet performance requirements at.
– Sometimes there are separate electronics boxes with a conductive I/F; thermal testing of these will be like units.
• Instrument can be like unit, either ON or OFF, but usually they are more confusing.
• Objectives of Instrument testing:
– Environmental Stress Screening (ESS) thermal cycles; burn-in; survival/turn-on
– Thermal balance testing: Radiative zones w/temperature controlled I/F’s
• Thermal control verification
• Thermal model correlation
– Measure electronics power at temperature extremes
– Bakeout
TFAWS – August 4-8, 2014
Spacecraft Level Thermal Testing
• Also referred to as “System” level testing.
• Note that most likely there will be NO conductive I/Fs for the SC during the mission ! So the key to thermal testing is the radiative environments you need to determine and simulate.
• Spacecraft are never (?) OFF after launch; some minimal configuration is ON to provide basic power distribution and C&C function. This is usually “Survival” mode.
• Objectives of SC testing:
– Final Environmental Stress Screening (ESS) thermal cycles; burn-in; survival/turn-on
– Thermal balance testing: Radiative zones w/temperature controlled I/F’s
• Thermal control verification
• Thermal model correlation
– Measure electronic power at temperature extremes
– Final bakeout
TFAWS – August 4-8, 2014
Ambient Pressure Thermal Cycles
• Thermal vacuum testing is the preferred approach.
• Cost savings of cycling in ambient pressure lead to the obvious
question “can we substitute ambient pressure cycles for the preferred
vacuum cycles”?
• Issues include:
– Temperature distribution differences due to additional convective
heat transfer paths
• Timing differences, TMAX masked,
– Vacuum sensitivity (corona, multipaction, fluid/lubricant
leakage/migration, part deformation, etc)
• NASA Preferred Reliability Practice PT-TE-1409 “Thermal-Vacuum
Versus Thermal Atmospheric Tests of Electronic Assemblies”.
– “….if analysis shows that the T effect is less than 5°C on all piece
parts, solder joints, etc., and there are no known pure vacuum
effects, then performing a T/A test in lieu of a T/V test might be
allowed depending of the criticality of the unit under test. “
TFAWS – August 4-8, 2014
24
Ambient Pressure Thermal Cycles
• GSFC GEVS did allow for this (at the unit level), provided:
– 50% additional cycles were completed
– Operational temperature range extended by 15C at both ends.
• Some programs asked for convective analysis and would allow
ambient testing if the “T effect” was shown to b <5°C.
– To my knowledge, this was only done once for a MAVEN unit that
had heritage ambient, vacuum test, and flight data that showed
this criteria was met.
• GSFC has removed this as an “option” in GEVS to force the waivers to
completed with a full technical review before project approval can be
obtained. This is intended for all units with dissipation, and/or vacuum
sensitivity.
TFAWS – August 4-8, 2014
25
“The safest and simplest course of action is to T/V everything.”

Thermal Balance Testing
• Typically done at subsystem/instrument and spacecraft levels.
– Unit level thermal testing at plateaus is usually stable enough so
that those models can be correlated.
– Vendors usually have correlated models (if heritage). Otherwise,
should insist on model and some level of model validation.
• The main objectives are to:
– Verify the thermal design meets requirements. Demonstrate
system requirements are met at over expected mission
temperature range.
– Verify the thermal model for mission predictions
– Confirm thermal interfaces
• Minimum of 3 cases:
– Operational mode at Hot and Cold mission environments
– Non-operational mode at Cold Environment (sometimes Hot too)
– Some missions may require more.
TFAWS – August 4-8, 2014 26
Thermal Vacuum Testing (Cycles)
• Thermal vacuum cycling is one of the environmental tests done in
support of flight projects. - usually performed last in the environmental
test campaign (after mechanical) and has two purposes:
– Demonstrate performance at temperatures outside (Qualification,
Proto-flight, Acceptance) of the allowable operational limits
– Environmental Stress Screening - thermal cycling is considered to
be the single most stressful screening test of the environmental
test campaign.
• GSFC practice is 12 cycles before flight –cycles at lower levels
mitigates risk early in project - gives confidence that workmanship
flaws are uncovered
– Unit: 8
– Instrument: 4 (and 4 at unit, or all 8 at instrument)
– Spacecraft: 4
TFAWS – August 4-8, 2014 27
3.0 Requirements
• 3.1 General Environmental Verification Specification
• 3.2 GOLD Rules
TFAWS – August 4-8, 2014 28

GEVS
• GEVS applies to GSFC hardware and associated software that is to be launched on an ELV and applies to:
– All space flight hardware, including interface hardware, that is developed as part of a payload managed by GSFC, whether developed by (1) GSFC or any of its contractors, (2) another NASA center, or (3) an independent agency; and
– All space flight hardware, including interface hardware that is developed by GSFC or any of its contractors and that is provided to another NASA installation or independent agency as part of a payload that is not managed by GSFC.
• GSFC test verification has evolved over many years and many successful missions:
– System performance
– Electrical
– Structural and Mechanical
– Electro-Magnetic Compatibility
– Thermal
– Contamination Control
– End-to-End Testing
29 TFAWS – August 4-8, 2014

What is the purpose of GEVS ?
• Describes methods for implementing those requirements and contains a baseline verification plan to demonstrate satisfactory performance of hardware in the expected mission environments, and that minimum workmanship standards have been met.
– elaborates on those requirements,
– gives guideline test levels,
– provides guidance in the choice of test options, and
– describes acceptable test and analytical methods for implementing the requirements.
• GEVS shall be used by GSFC projects and contractors.
– tailor to create a project specific verification plan and verification specification.
– GSFC projects must select from the options to fulfill the specific payload (spacecraft) requirements in accordance with the launch vehicle to be used, or to cover other mission-specific considerations.
• Most importantly – GEVS as a “ref doc” does NOT make it a requirement on a contractor……CUT & PASTE into your contractual documentation.
GEVS is not the Bible; rather it is a ***General*** guideline to be used to develop a
project thermal (and mechanical, etc) environmental verification plan.
TFAWS – August 4-8, 2014
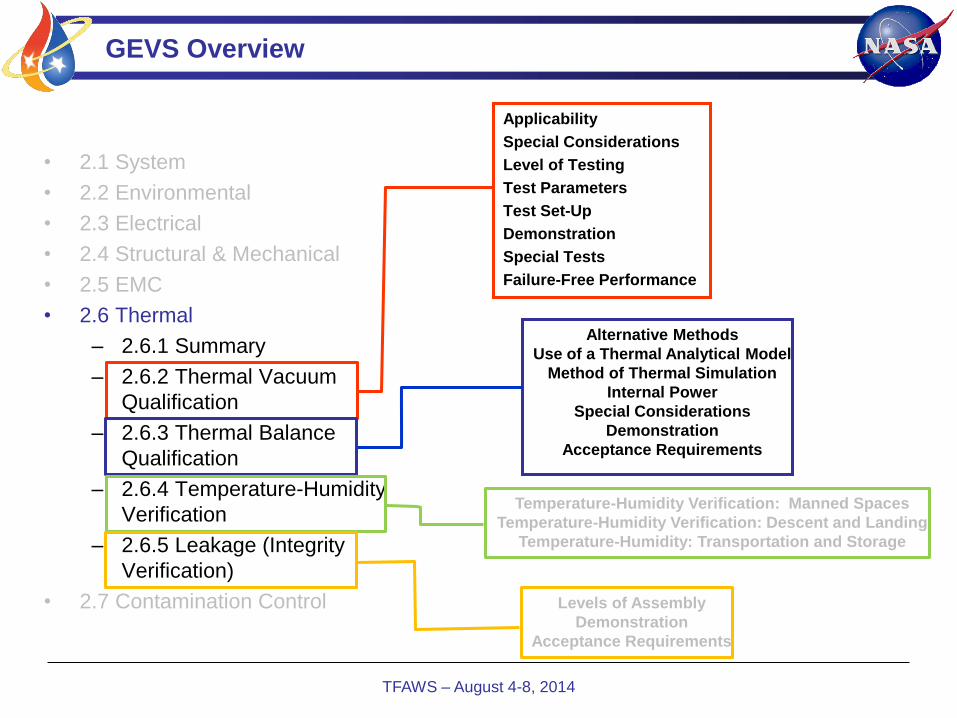
GEVS Overview
• 2.1 System
• 2.2 Environmental
• 2.3 Electrical
• 2.4 Structural & Mechanical
• 2.5 EMC
• 2.6 Thermal
– 2.6.1 Summary
– 2.6.2 Thermal Vacuum
Qualification
– 2.6.3 Thermal Balance
Qualification
– 2.6.4 Temperature-Humidity
Verification
– 2.6.5 Leakage (Integrity
Verification)
• 2.7 Contamination Control
Applicability
Special Considerations
Level of Testing
Test Parameters
Test Set-Up
Demonstration
Special Tests
Failure-Free Performance
Alternative Methods
Use of a Thermal Analytical Model
Method of Thermal Simulation
Internal Power
Special Considerations
Demonstration
Acceptance Requirements
Temperature-Humidity Verification: Manned Spaces
Temperature-Humidity Verification: Descent and Landing
Temperature-Humidity: Transportation and Storage
Levels of Assembly
Demonstration
Acceptance Requirements
TFAWS – August 4-8, 2014
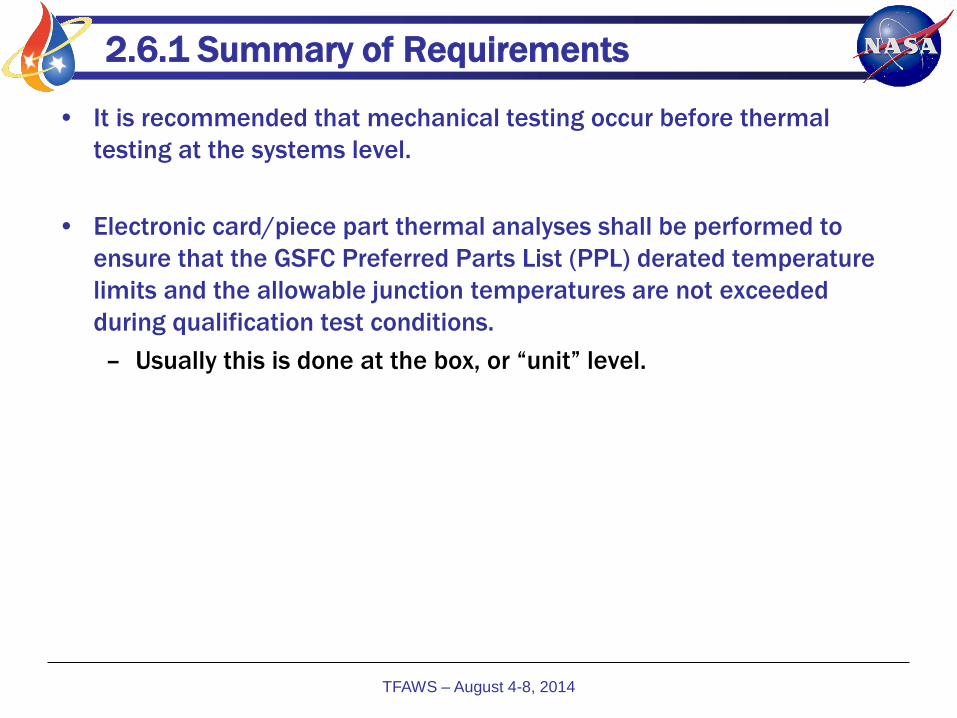
2.6.1 Summary of Requirements
• It is recommended that mechanical testing occur before thermal
testing at the systems level.
• Electronic card/piece part thermal analyses shall be performed to
ensure that the GSFC Preferred Parts List (PPL) derated temperature
limits and the allowable junction temperatures are not exceeded
during qualification test conditions.
– Usually this is done at the box, or “unit” level.
TFAWS – August 4-8, 2014

2.6.2 Thermal Vacuum Qualification
2.6.2.1 Applicability
2.6.2.2 Special Considerations
Unrealistic Failure Modes
Avoiding Contamination
Card Level Analysis Verification
Test Temperature Sensor Location
2.6.2.3 Level of Testing:
2.6.2.4 Test Parameters
Workmanship Margins
Temperature Cycling
Duration
Pressure
All fight h/w shall be thermal vacuum tested
GSFC utilizes a protoflight qualification test
program
Don’t overstress.
Chamber bakeout/certification
Verify unit level analysis.
Unit, subsystem/instrument,
payload/spacecraft/system
Passive: 10C beyond AFT range
Active (cmd): 5Cbeyond setpoint range
Active (fix): 30% add’l
Cryo: project specific
Unit: 4 or 8, sub/Instr: min 4, SC: 4
Unit: 4hrs, sub/Instr: 12 hrs, SC: 24
< 1 X 10⁻⁵ torr
GR 4.27
GR 4.29
TFAWS – August 4-8, 2014
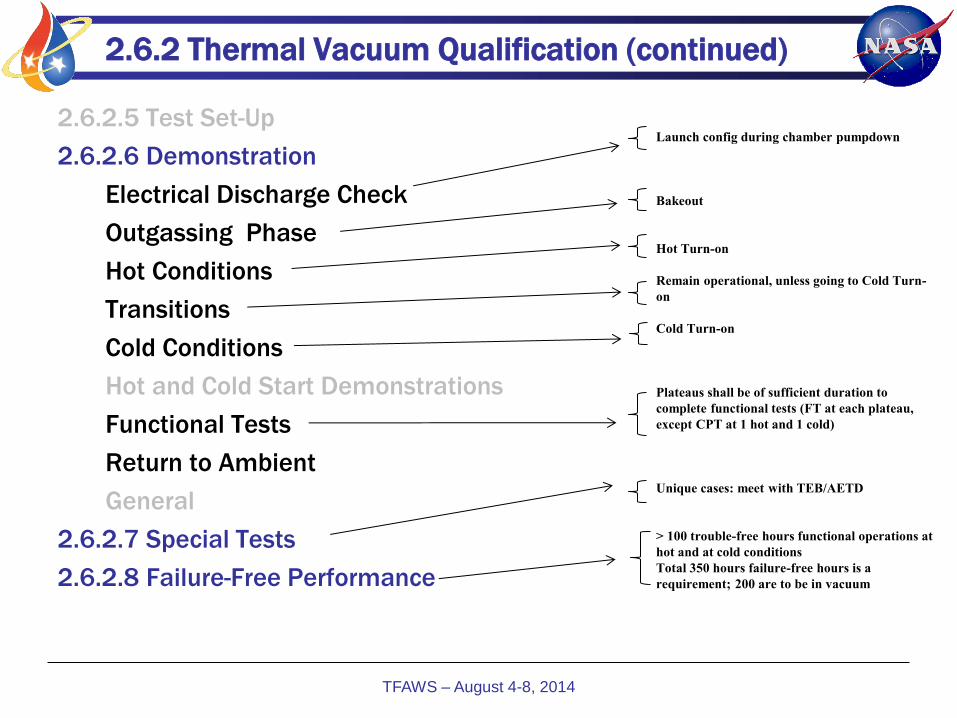
2.6.2 Thermal Vacuum Qualification (continued)
2.6.2.5 Test Set-Up
2.6.2.6 Demonstration
Electrical Discharge Check
Outgassing Phase
Hot Conditions
Transitions
Cold Conditions
Hot and Cold Start Demonstrations
Functional Tests
Return to Ambient
General
2.6.2.7 Special Tests
2.6.2.8 Failure-Free Performance
TFAWS – August 4-8, 2014
Launch config during chamber pumpdown
Bakeout
Hot Turn-on
Remain operational, unless going to Cold Turn-
on
Cold Turn-on
Plateaus shall be of sufficient duration to
complete functional tests (FT at each plateau,
except CPT at 1 hot and 1 cold)
Unique cases: meet with TEB/AETD
> 100 trouble-free hours functional operations at
hot and at cold conditions
Total 350 hours failure-free hours is a
requirement; 200 are to be in vacuum
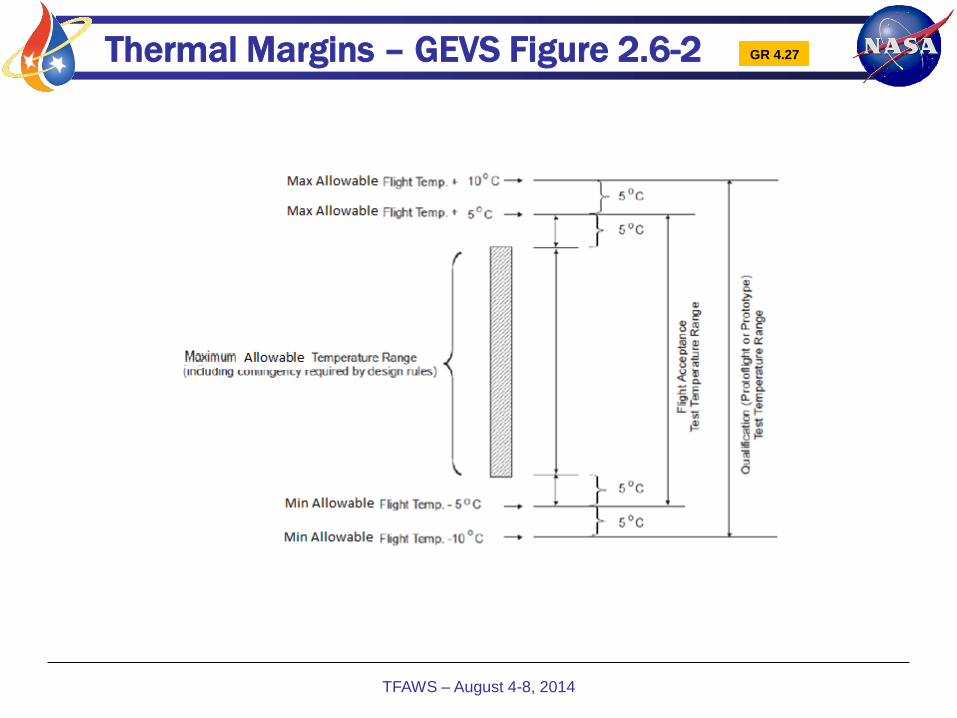
Thermal Margins – GEVS Figure 2.6-2 GR 4.27
TFAWS – August 4-8, 2014
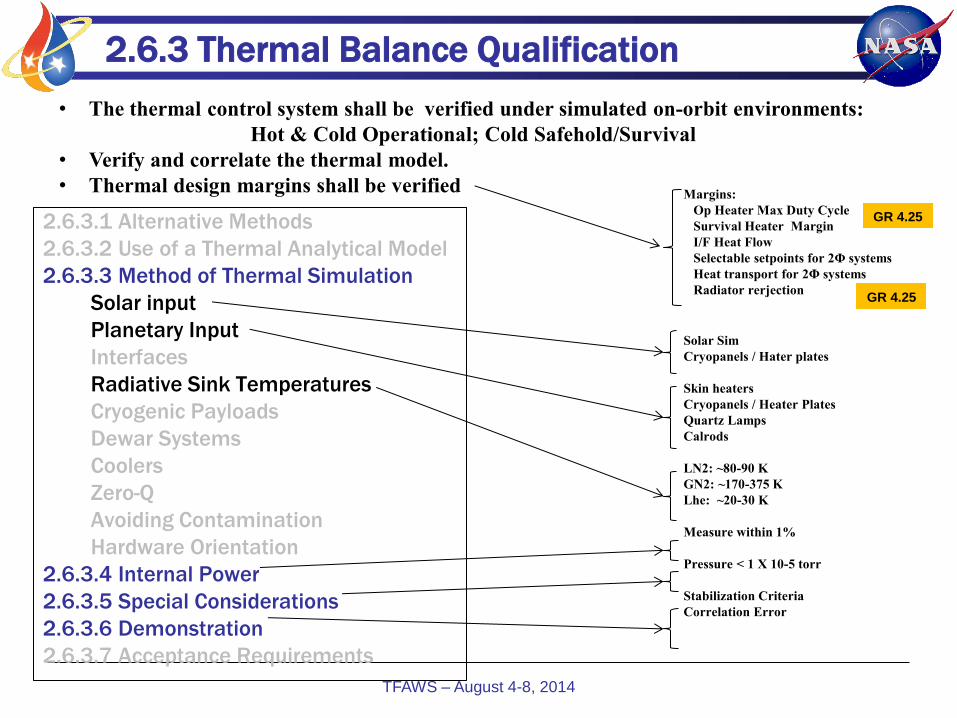
2.6.3 Thermal Balance Qualification
2.6.3.1 Alternative Methods
2.6.3.2 Use of a Thermal Analytical Model
2.6.3.3 Method of Thermal Simulation
Solar input
Planetary Input
Interfaces
Radiative Sink Temperatures
Cryogenic Payloads
Dewar Systems
Coolers
Zero-Q
Avoiding Contamination
Hardware Orientation
2.6.3.4 Internal Power
2.6.3.5 Special Considerations
2.6.3.6 Demonstration
2.6.3.7 Acceptance Requirements
Margins:
Op Heater Max Duty Cycle
Survival Heater Margin
I/F Heat Flow
Selectable setpoints for 2Φ systems
Heat transport for 2Φ systems
Radiator rerjection
Solar Sim
Cryopanels / Hater plates
Skin heaters
Cryopanels / Heater Plates
Quartz Lamps
Calrods
LN2: ~80-90 K
GN2: ~170-375 K
Lhe: ~20-30 K
Measure within 1%
Pressure < 1 X 10⁻⁵ torr
Stabilization Criteria
Correlation Error
• The thermal control system shall be verified under simulated on-orbit environments:
Hot & Cold Operational; Cold Safehold/Survival
• Verify and correlate the thermal model.
• Thermal design margins shall be verified
GR 4.25
GR 4.25
TFAWS – August 4-8, 2014

GOLD Rules
(Goddard Open Learning Design)
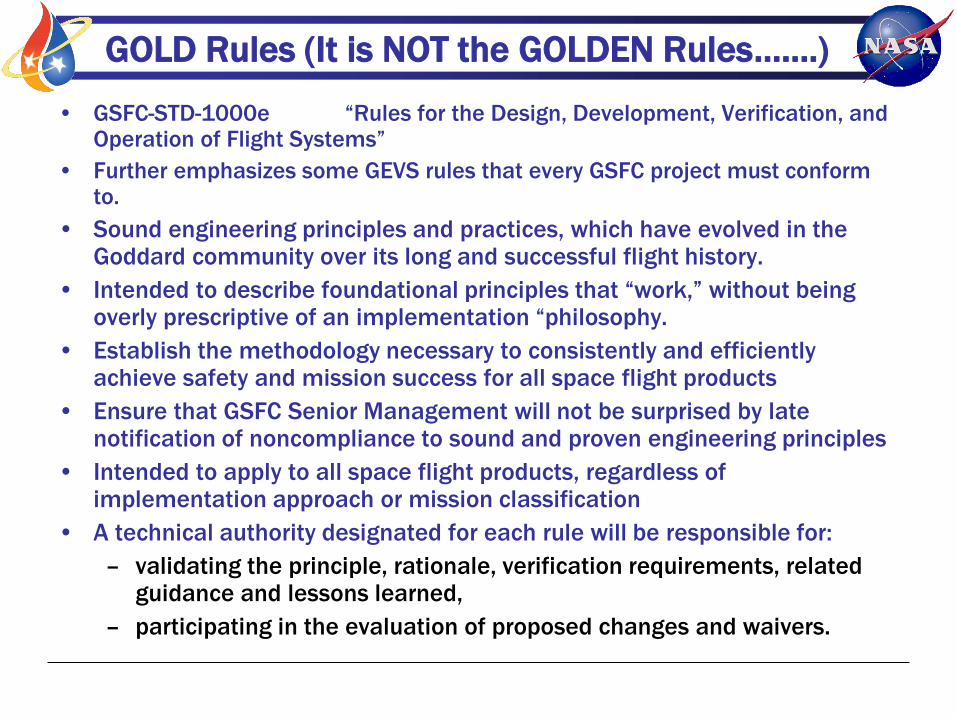
GOLD Rules (It is NOT the GOLDEN Rules…….)
• GSFC-STD-1000e “Rules for the Design, Development, Verification, and Operation of Flight Systems”
• Further emphasizes some GEVS rules that every GSFC project must conform to.
• Sound engineering principles and practices, which have evolved in the Goddard community over its long and successful flight history.
• Intended to describe foundational principles that “work,” without being overly prescriptive of an implementation “philosophy.
• Establish the methodology necessary to consistently and efficiently achieve safety and mission success for all space flight products
• Ensure that GSFC Senior Management will not be surprised by late notification of noncompliance to sound and proven engineering principles
• Intended to apply to all space flight products, regardless of implementation approach or mission classification
• A technical authority designated for each rule will be responsible for:
– validating the principle, rationale, verification requirements, related guidance and lessons learned,
– participating in the evaluation of proposed changes and waivers.
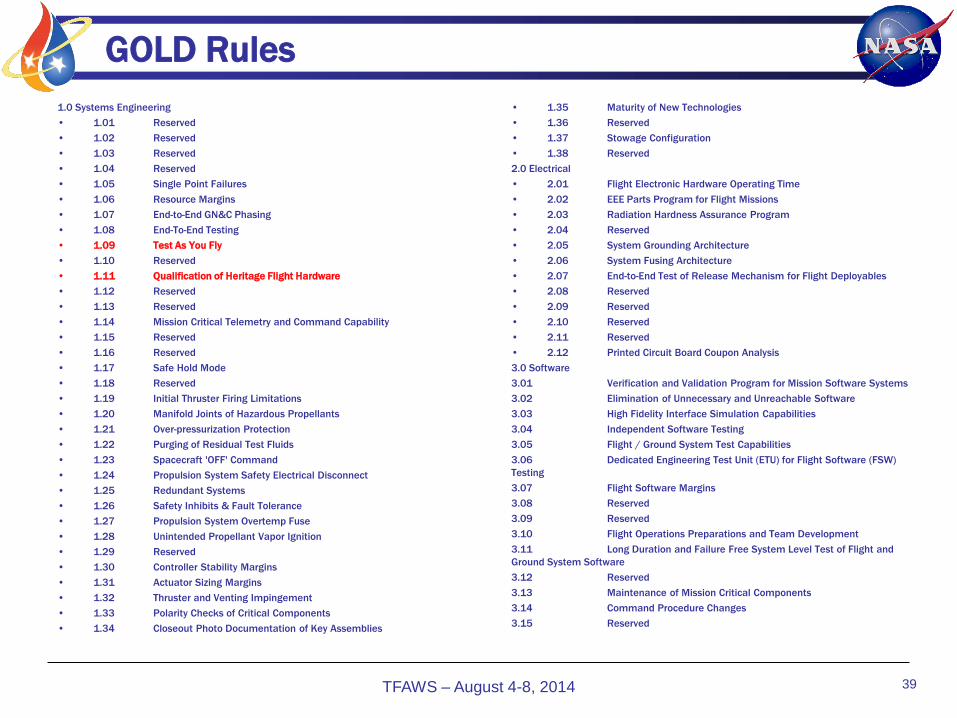
GOLD Rules
1.0 Systems Engineering
• 1.01 Reserved
• 1.02 Reserved
• 1.03 Reserved
• 1.04 Reserved
• 1.05 Single Point Failures
• 1.06 Resource Margins
• 1.07 End-to-End GN&C Phasing
• 1.08 End-To-End Testing
• 1.09 Test As You Fly
• 1.10 Reserved
• 1.11 Qualification of Heritage Flight Hardware
• 1.12 Reserved
• 1.13 Reserved
• 1.14 Mission Critical Telemetry and Command Capability
• 1.15 Reserved
• 1.16 Reserved
• 1.17 Safe Hold Mode
• 1.18 Reserved
• 1.19 Initial Thruster Firing Limitations
• 1.20 Manifold Joints of Hazardous Propellants
• 1.21 Over-pressurization Protection
• 1.22 Purging of Residual Test Fluids
• 1.23 Spacecraft 'OFF' Command
• 1.24 Propulsion System Safety Electrical Disconnect
• 1.25 Redundant Systems
• 1.26 Safety Inhibits & Fault Tolerance
• 1.27 Propulsion System Overtemp Fuse
• 1.28 Unintended Propellant Vapor Ignition
• 1.29 Reserved
• 1.30 Controller Stability Margins
• 1.31 Actuator Sizing Margins
• 1.32 Thruster and Venting Impingement
• 1.33 Polarity Checks of Critical Components
• 1.34 Closeout Photo Documentation of Key Assemblies
TFAWS – August 4-8, 2014 39
• 1.35 Maturity of New Technologies
• 1.36 Reserved
• 1.37 Stowage Configuration
• 1.38 Reserved
2.0 Electrical
• 2.01 Flight Electronic Hardware Operating Time
• 2.02 EEE Parts Program for Flight Missions
• 2.03 Radiation Hardness Assurance Program
• 2.04 Reserved
• 2.05 System Grounding Architecture
• 2.06 System Fusing Architecture
• 2.07 End-to-End Test of Release Mechanism for Flight Deployables
• 2.08 Reserved
• 2.09 Reserved
• 2.10 Reserved
• 2.11 Reserved
• 2.12 Printed Circuit Board Coupon Analysis
3.0 Software
3.01 Verification and Validation Program for Mission Software Systems
3.02 Elimination of Unnecessary and Unreachable Software
3.03 High Fidelity Interface Simulation Capabilities
3.04 Independent Software Testing
3.05 Flight / Ground System Test Capabilities
3.06 Dedicated Engineering Test Unit (ETU) for Flight Software (FSW)
Testing
3.07 Flight Software Margins
3.08 Reserved
3.09 Reserved
3.10 Flight Operations Preparations and Team Development
3.11 Long Duration and Failure Free System Level Test of Flight and
Ground System Software
3.12 Reserved
3.13 Maintenance of Mission Critical Components
3.14 Command Procedure Changes
3.15 Reserved
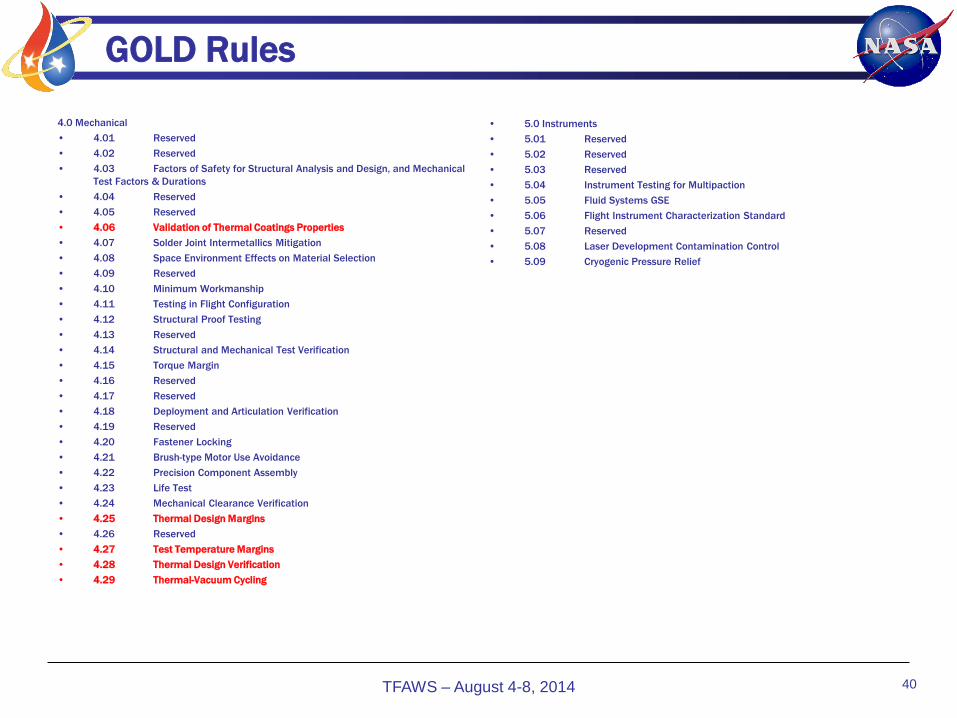
GOLD Rules
4.0 Mechanical
• 4.01 Reserved
• 4.02 Reserved
• 4.03 Factors of Safety for Structural Analysis and Design, and Mechanical
Test Factors & Durations
• 4.04 Reserved
• 4.05 Reserved
• 4.06 Validation of Thermal Coatings Properties
• 4.07 Solder Joint Intermetallics Mitigation
• 4.08 Space Environment Effects on Material Selection
• 4.09 Reserved
• 4.10 Minimum Workmanship
• 4.11 Testing in Flight Configuration
• 4.12 Structural Proof Testing
• 4.13 Reserved
• 4.14 Structural and Mechanical Test Verification
• 4.15 Torque Margin
• 4.16 Reserved
• 4.17 Reserved
• 4.18 Deployment and Articulation Verification
• 4.19 Reserved
• 4.20 Fastener Locking
• 4.21 Brush-type Motor Use Avoidance
• 4.22 Precision Component Assembly
• 4.23 Life Test
• 4.24 Mechanical Clearance Verification
• 4.25 Thermal Design Margins
• 4.26 Reserved
• 4.27 Test Temperature Margins
• 4.28 Thermal Design Verification
• 4.29 Thermal-Vacuum Cycling
TFAWS – August 4-8, 2014 40
• 5.0 Instruments
• 5.01 Reserved
• 5.02 Reserved
• 5.03 Reserved
• 5.04 Instrument Testing for Multipaction
• 5.05 Fluid Systems GSE
• 5.06 Flight Instrument Characterization Standard
• 5.07 Reserved
• 5.08 Laser Development Contamination Control
• 5.09 Cryogenic Pressure Relief

GOLD Rule 4.25 - Thermal Design Margins
TFAWS – August 4-8, 2014 41

GOLD Rule 4.27 - Test Temperature Margins
TFAWS – August 4-8, 2014 42

GOLD Rule 4.28 - Thermal Design Verification
TFAWS – August 4-8, 2014 43
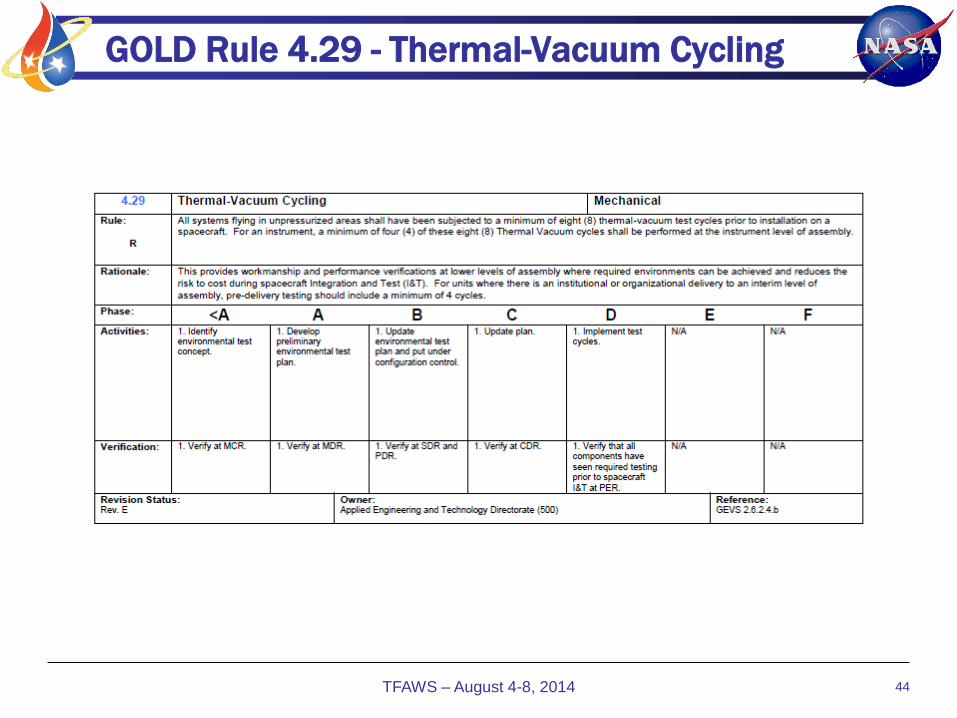
GOLD Rule 4.29 - Thermal-Vacuum Cycling
TFAWS – August 4-8, 2014 44
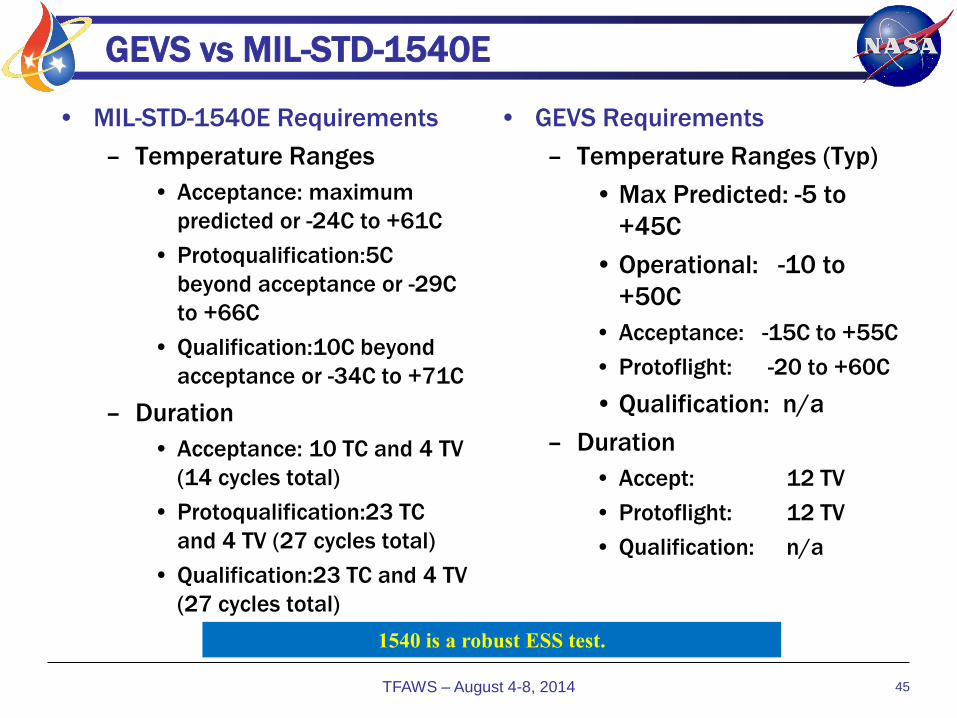
GEVS vs MIL-STD-1540E
• MIL-STD-1540E Requirements
– Temperature Ranges
• Acceptance: maximum
predicted or -24C to +61C
• Protoqualification:5C
beyond acceptance or -29C
to +66C
• Qualification:10C beyond
acceptance or -34C to +71C
– Duration
• Acceptance: 10 TC and 4 TV
(14 cycles total)
• Protoqualification:23 TC
and 4 TV (27 cycles total)
• Qualification:23 TC and 4 TV
(27 cycles total)
TFAWS – August 4-8, 2014 45
• GEVS Requirements
– Temperature Ranges (Typ)
• Max Predicted: -5 to
+45C
• Operational: -10 to
+50C
• Acceptance: -15C to +55C
• Protoflight: -20 to +60C
• Qualification: n/a
– Duration
• Accept: 12 TV
• Protoflight: 12 TV
• Qualification: n/a
1540 is a robust ESS test.
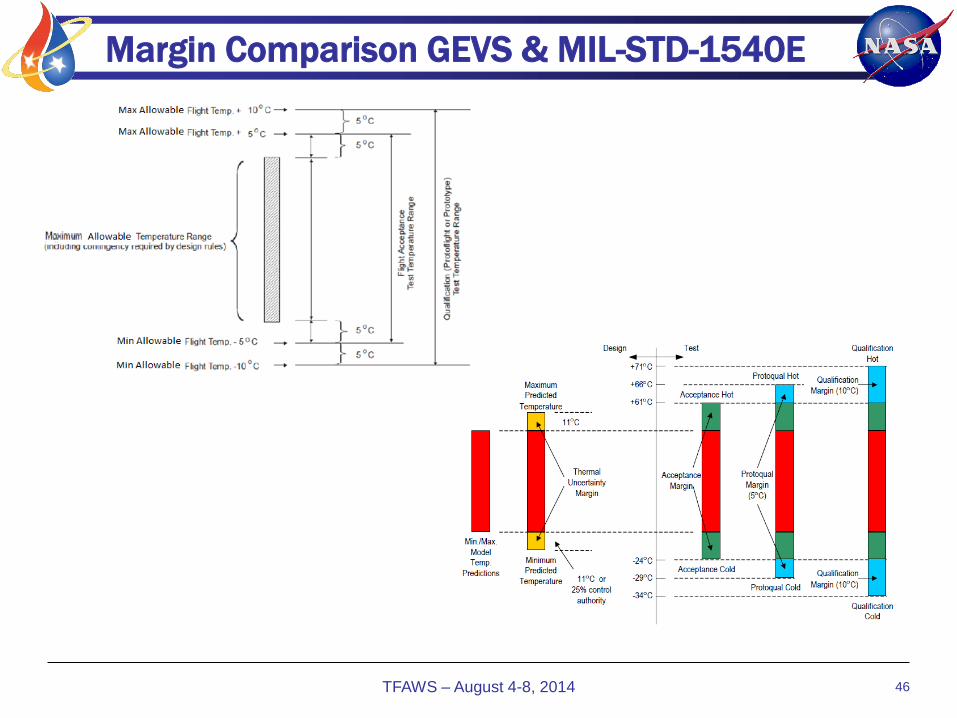
Margin Comparison GEVS & MIL-STD-1540E
TFAWS – August 4-8, 2014 46

4.0 Test Set-up
• 4.1 Mission Environments
• 4.2 Chambers/GSE
• 4.3 Temperature Sensors/Alarm Limits
TFAWS – August 4-8, 2014 47

Mission Environments
• Before choosing how to simulate your environment, you should first
determine what mission environments you are trying to simulate.
• GSFC practice is to simulate worst case (bounding) hot and cold
mission environments, and include (at a minimum) operational and
survival configurations.
– Simple geometry spacecraft are more easily determined.
– Complex external geometry/configuration leads to complex
environments due to reflections, solar entrapment, and significant
IR backloads.
• Simulating your mission environments correctly is key to a successful
thermal balance test.
TFAWS – August 4-8, 2014 48
The goal is to simulate worst case bounding mission
environments accurately and in a stable, consistent manner.

Equivalent Sink Temperature
• For any spacecraft surface, there is a single temperature that
represents the summation of all external environmental heating
sources .This is the “equivalent sink temperature” and is the
equilibrium temperature reached by a passive radiating surface when
placed in the external environment.
• The equivalent sink temperature includes direct and reflected
environments (solar, albedo, IR) and backloading from other SC
surfaces. Mathematically based on energy balance:
TFAWS – August 4-8, 2014 49
)( 4,1
4
,
j
N
j
iijEarthIRalbedosolar
outbackloadEarthIRalbedosolar
Outenvin
TTRadkQQQ
QQQQQ
(where surface “i” is the passive radiating surface)
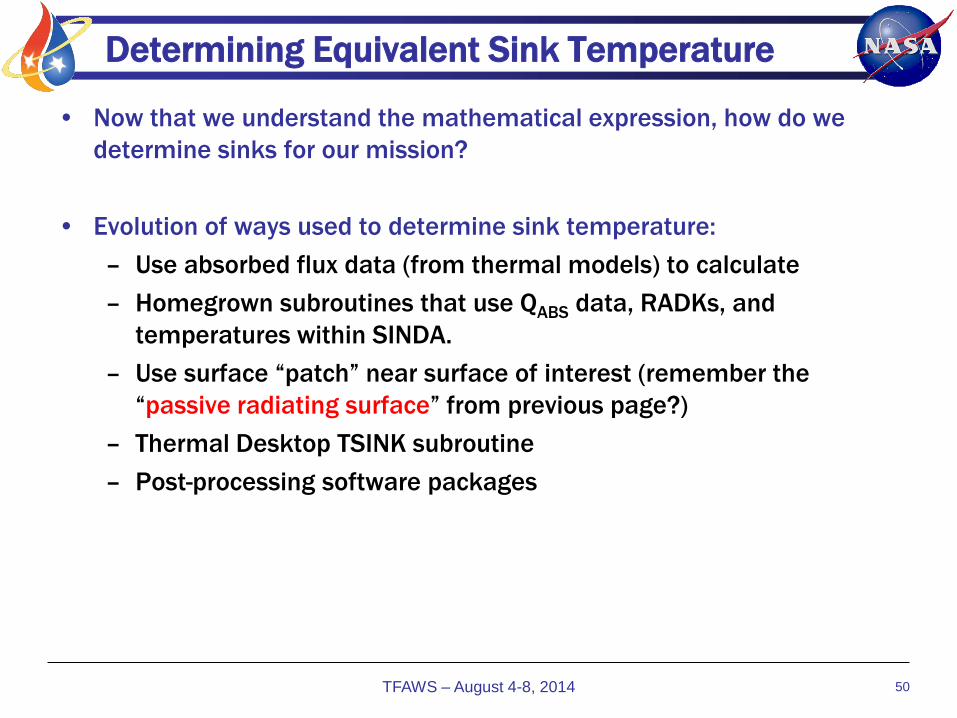
Determining Equivalent Sink Temperature
• Now that we understand the mathematical expression, how do we
determine sinks for our mission?
• Evolution of ways used to determine sink temperature:
– Use absorbed flux data (from thermal models) to calculate
– Homegrown subroutines that use QABS data, RADKs, and
temperatures within SINDA.
– Use surface “patch” near surface of interest (remember the
“passive radiating surface” from previous page?)
– Thermal Desktop TSINK subroutine
– Post-processing software packages
TFAWS – August 4-8, 2014 50

Absorbed Fluxes
• Use mission HEAT RATE data from thermal model, use absorbed fluxes
for primary thermal surfaces of SC (or instrument or unit).
– Convert to sink temperature
• Note that this doesn’t include IR backloads, which is included in the
thermal solution in the SINDA run.
– May be accurate enough for surfaces with little backloading.
– SINDA User subroutines to use HEAT RATE data and RADKs for
more accurate sink calculations.
TFAWS – August 4-8, 2014 51
𝒒(𝒂𝒃𝒔) = 𝜺 (𝑻𝟒 − 𝑻𝒔𝒑𝟒)
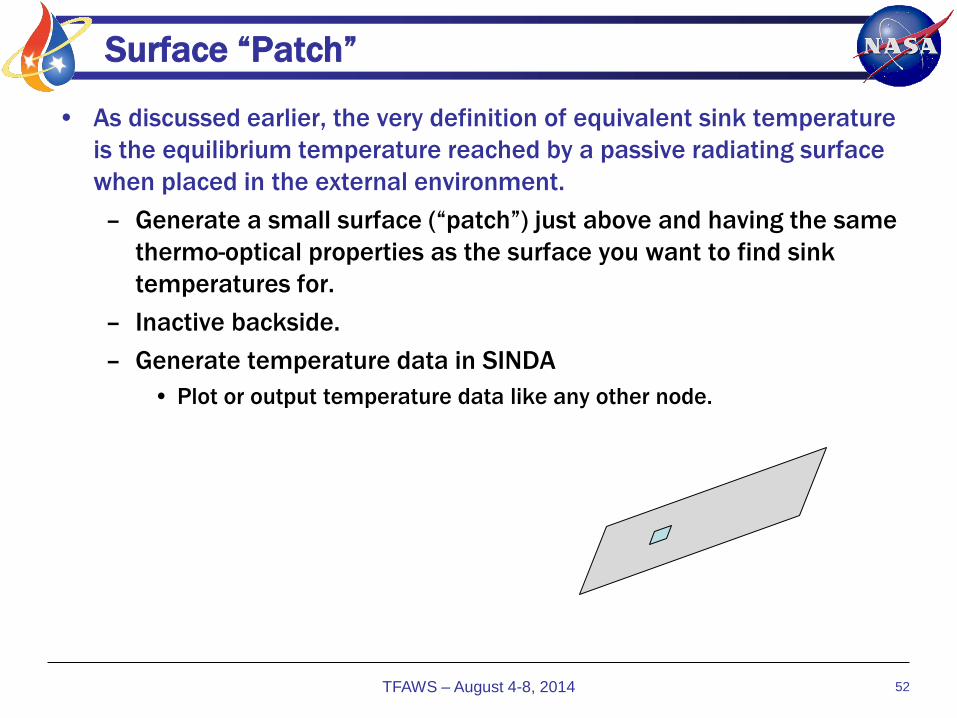
Surface “Patch”
• As discussed earlier, the very definition of equivalent sink temperature
is the equilibrium temperature reached by a passive radiating surface
when placed in the external environment.
– Generate a small surface (“patch”) just above and having the same
thermo-optical properties as the surface you want to find sink
temperatures for.
– Inactive backside.
– Generate temperature data in SINDA
• Plot or output temperature data like any other node.
TFAWS – August 4-8, 2014 52
Thermal Desktop TSINK
• TSINK uses Save files in Thermal Desktop, and performs the same
function as the TSINK and TSINK1 commands in SINDA/FLUINT.
– Per the SINDA/FLUINT manual: the sink temperature
approximation is normally used (1) to eliminate recalculation of
radiative environments in order to speed up parametric sweeps
and sensitivity studies, and (2) to enable a designer of a
component or subsystem to work independently of a full system
model
– Including or excluding heat rate terms
– Including only radiative terms, or only linear terms, or both. (Use
radiative only for this application)
– TSINK1 (single node) and TSINK (multiple nodes)
TFAWS – August 4-8, 2014 53
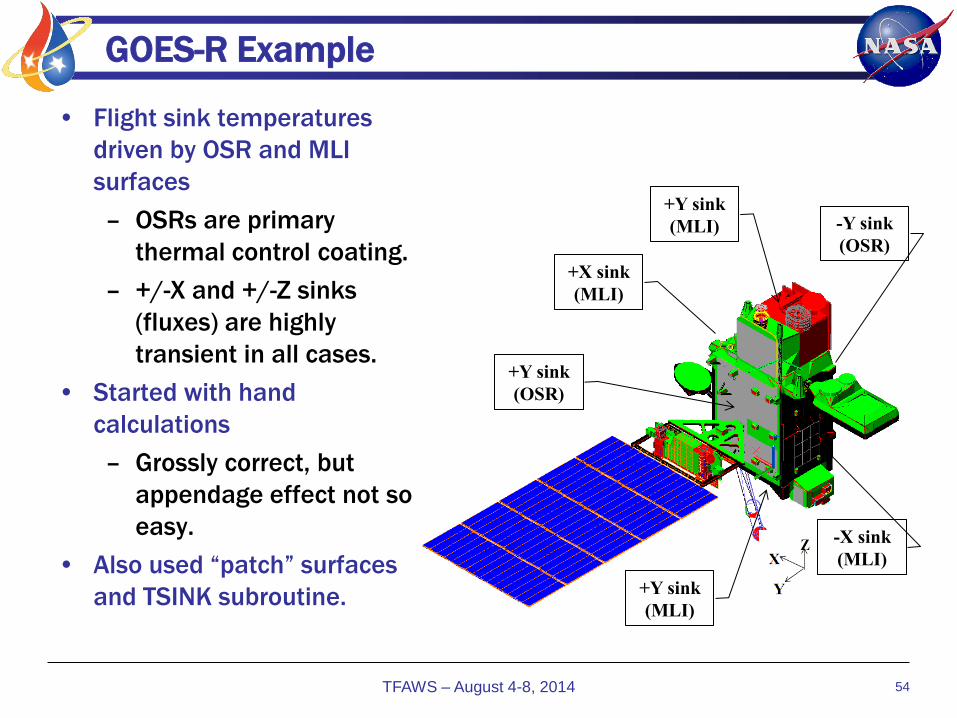
GOES-R Example
• Flight sink temperatures
driven by OSR and MLI
surfaces
– OSRs are primary
thermal control coating.
– +/-X and +/-Z sinks
(fluxes) are highly
transient in all cases.
• Started with hand
calculations
– Grossly correct, but
appendage effect not so
easy.
• Also used “patch” surfaces
and TSINK subroutine.
TFAWS – August 4-8, 2014 54
+Y sink
(OSR)
-Y sink
(OSR)
+Y sink
(MLI)
+X sink
(MLI)
-X sink
(MLI)
+Y sink
(MLI)

Sink Temperature Example
• For a geosynchronous communications satellite, with seasonal ecliptic
declination resulting in +/-23.5°solar incident angle on the
North/South radiators, resulting in worst hot case direct solar loading
of 115 and 126 W/m2 on the north and south radiators, respectively.
(The difference is the solar intensity variation between SS and WS).
• Typically, bounding hot & cold environments are:
– Hot:
• Winter Solstice: max sun angle on south side, max SOL
• Summer Solstice: max sun angle on north side, high SOL
– Cold:
• Equinox: no sun on north/south, min SOL
• Neglecting any reflections or IR backloading, these fluxes on OSRs
result in equivalent sink temperatures of:
– 115 W/m2: -48°C
– 126 W/m2: -42°C
TFAWS – August 4-8, 2014 55
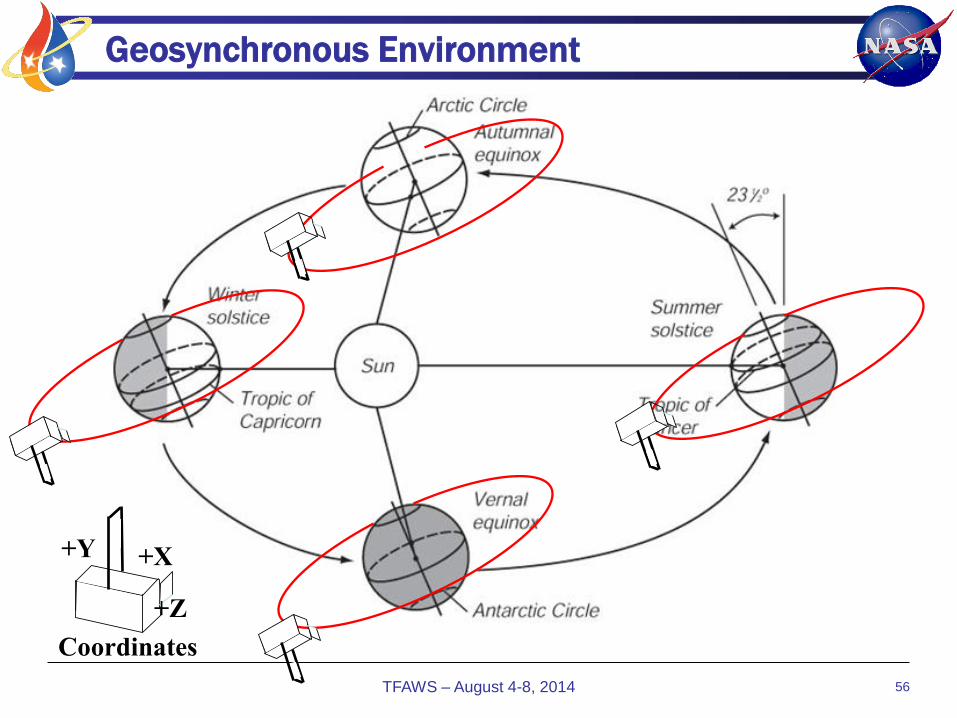
Geosynchronous Environment
56
+Y
+Z
+X
Coordinates
TFAWS – August 4-8, 2014
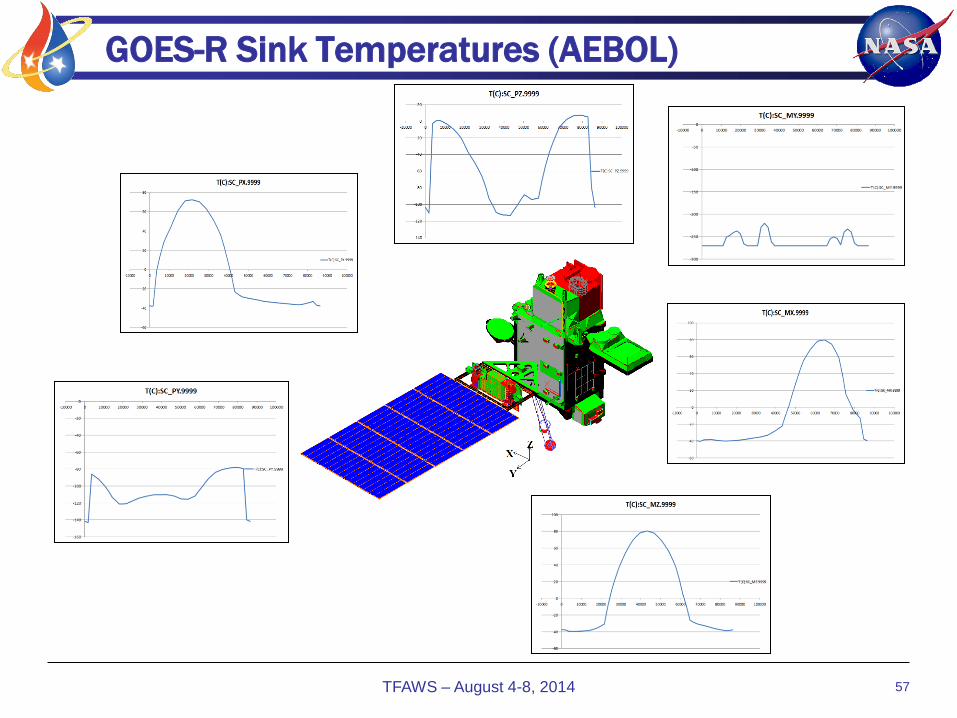
GOES-R Sink Temperatures (AEBOL)
TFAWS – August 4-8, 2014 57
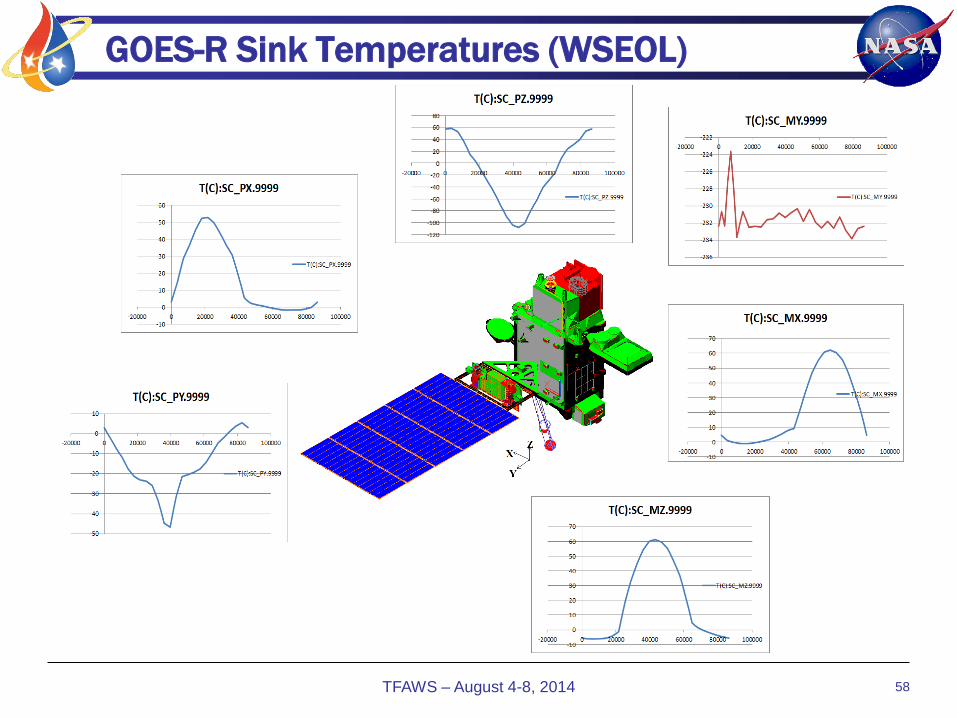
GOES-R Sink Temperatures (WSEOL)
TFAWS – August 4-8, 2014 58

GOES-R Sink Temperatures (SSEOL)
TFAWS – August 4-8, 2014 59

GOES-R Sinks - Summary
• TSINK results used to determine equivalent sink temperatures for the
mission.
• As seen in the plots, the orbit average of the +/-X and of the +/-Z sinks
is “not that different”, so “sun averages” are being planned for hot
cases and “orbit average” used for AEBOL sinks.
TFAWS – August 4-8, 2014
60
SSEOL (°C) WSEOL (°C) AEBOL (°C)
MX (west), MLI -8 22 -2
PX (east), MLI 14 33 2
MY (north), Rad -57 -175 -175
PY (south), Rad -102 -16 -104
MZ (zenith), MLI 34 18 5
PZ (nadir), MLI -14 59 -37
Thermal Balance Stability Criteria
• Thermal Balance testing is actually an “Energy Balance” test.
• How stable does YOUR test need to be ?
• GEVS says “ 0.05°C/hour for 6 hours”, or a 2-5% energy balance. What is that ?
– Energy balance:
• QIN = QOUT
• %*Q = M*CP*dT/dt
• Applying this overall, or (better yet) for “thermally separate areas” of your Test Article will optimize the transition time while meeting stability requirements.
• Examples: ((assume CP = aluminum)
– 100kg SC w/100W => dT/dt: 0.015°C/hour
– 400kg radiator w/units @1200W => 0.05°C/hour
– 5000kg SC w/3000W => dT/dt: 0.009°C/hour
• If heater controlled, then <2-5% change in duty cycle.
• But must still watch parts buried deep within the SC (Prop tanks, structure, etc)
TFAWS – August 4-8, 2014 61

Tailored Thermal Balance Criteria

4.0 Test Set-up
• 4.1 Mission Environments
• 4.2 Chambers/GSE
• 4.3 Temperature Sensors/Alarm Limits
TFAWS – August 4-8, 2014 63

Test Chamber Capability
• Know your chamber capabilities early in your test planning.
• Environmental simulation
– Temperature capability, GN2 / LN2, total heat load
– Vacuum levels
• Data Systems
• Test Sensors
• Power Supplies
• Understand the test orientation in the design phase to make sure
heat pipes operate
TFAWS – August 4-8, 2014 64

Test Flow - Unit
• Unit level verification testing includes performance testing at required temperatures and Environmental Stress Screening.
– Performance testing at hot and cold temperature extremes (Side A/B)
– Functional testing during all transitions (the box stays ON)
– Hot and cold starts
– Units are cycles between hot and cold extremes while operating.
– Electronics: typically temperature controlled platen, with ambient or controlled radiative sink
– Mechanisms: lamps, heaters, controlled radiative sink
• Although thermal balance plateaus are usually not explicitly included, there is usually sufficiently steady operations and data to correlate the unit level thermal models using flight telemetry or test sensors.
TFAWS – August 4-8, 2014 65
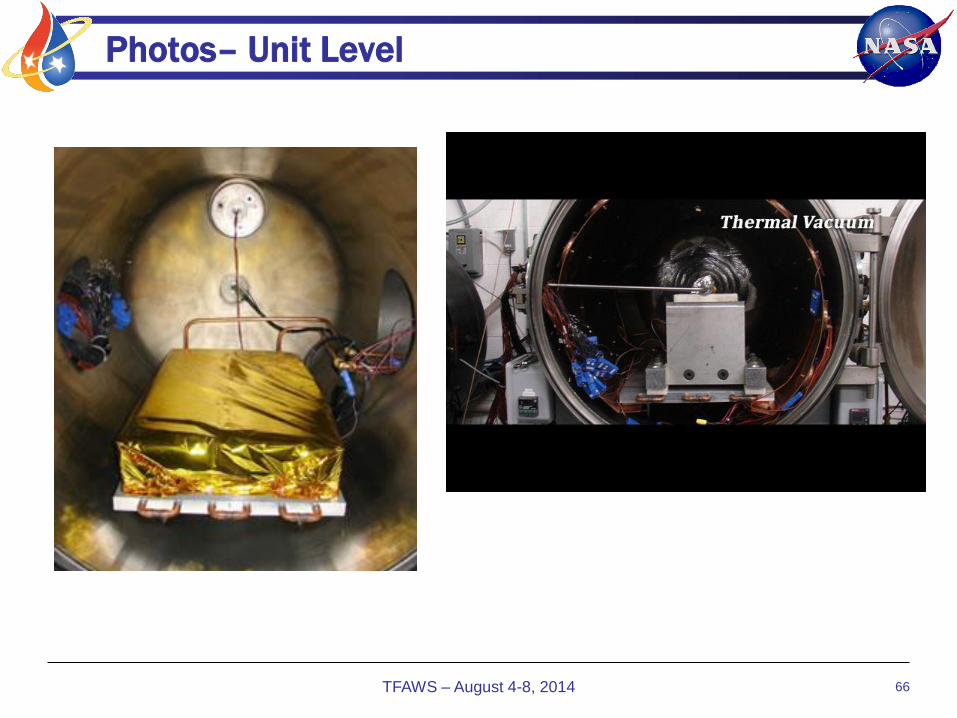
Photos– Unit Level
TFAWS – August 4-8, 2014 66

Test Flow - Instrument
• Types of thermal testing, includes qualification, engineering development, life test, and verification testing.
• For subsystem/instrument and spacecraft level testing, there are usually two types of thermal verification tests:
– Thermal Balance:
– Thermal Vacuum Cycles:
TFAWS – August 4-8, 2014 67
• Typically very unique requirements for different types of instruments. Besides the usual radiative zones w/temperature controlled I/Fs:
– Optical/lasers: extensive OGSE in chamber
– IR: Passive cryo requires very cold sinks (LN2 or maybe LHe)
– Heat pipe orientation
• For some tests, removing the MLI following balance testing is done to enhance transitions to the cycles plateaus.
• Almost always deliverable reduced thermal models to SC and LV analysis, so correlation and model reduction is critical.
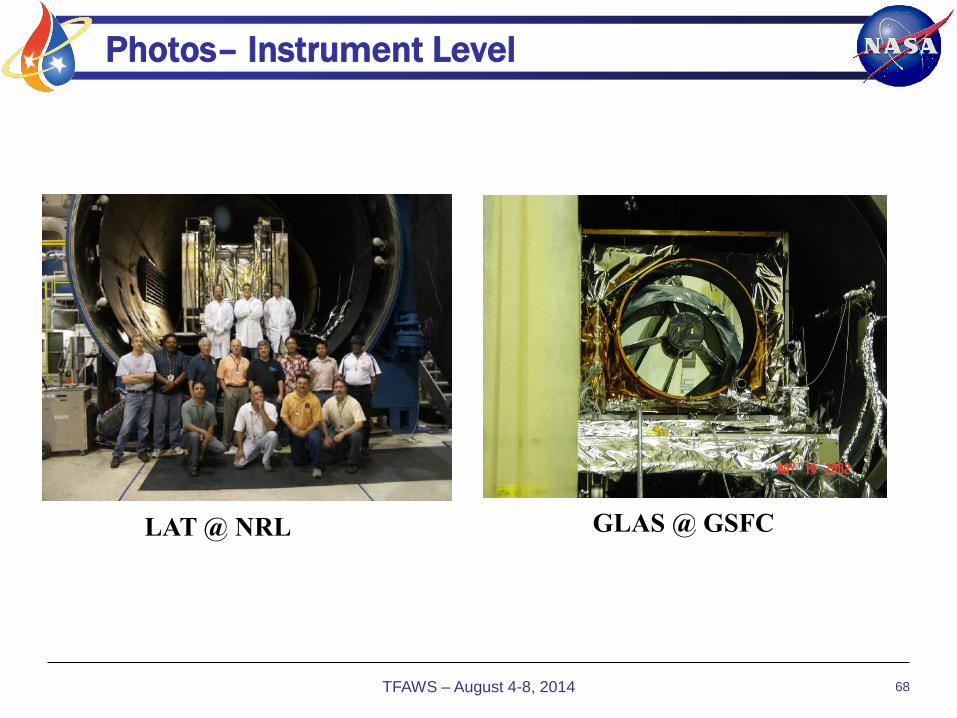
Photos– Instrument Level
TFAWS – August 4-8, 2014 68
LAT @ NRL GLAS @ GSFC
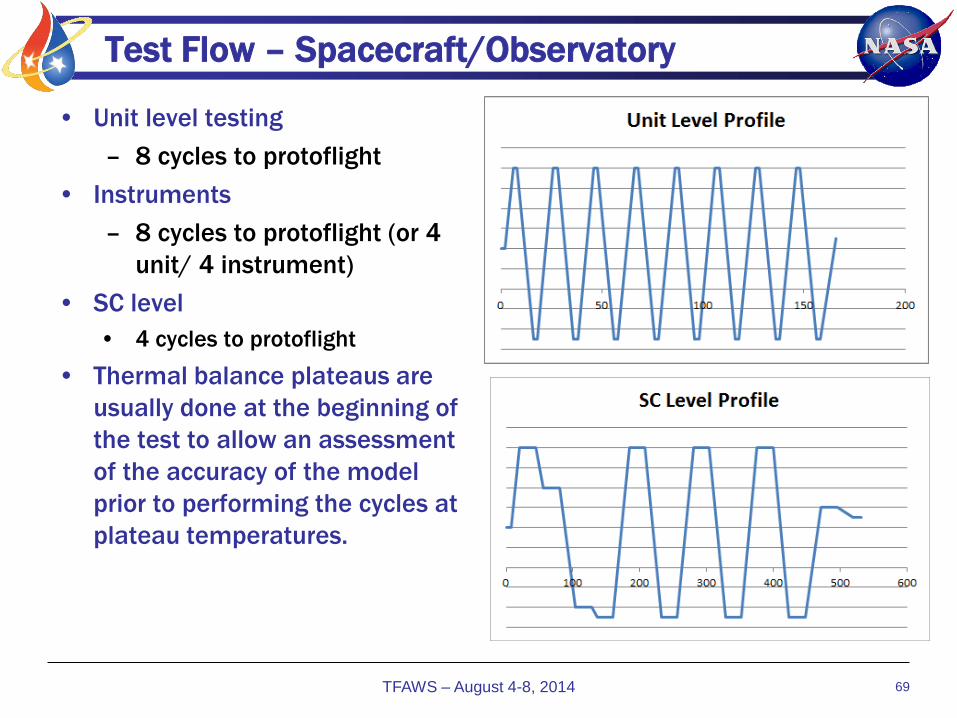
Test Flow – Spacecraft/Observatory
• Unit level testing
– 8 cycles to protoflight
• Instruments
– 8 cycles to protoflight (or 4
unit/ 4 instrument)
• SC level
• 4 cycles to protoflight
• Thermal balance plateaus are
usually done at the beginning of
the test to allow an assessment
of the accuracy of the model
prior to performing the cycles at
plateau temperatures.
TFAWS – August 4-8, 2014 69
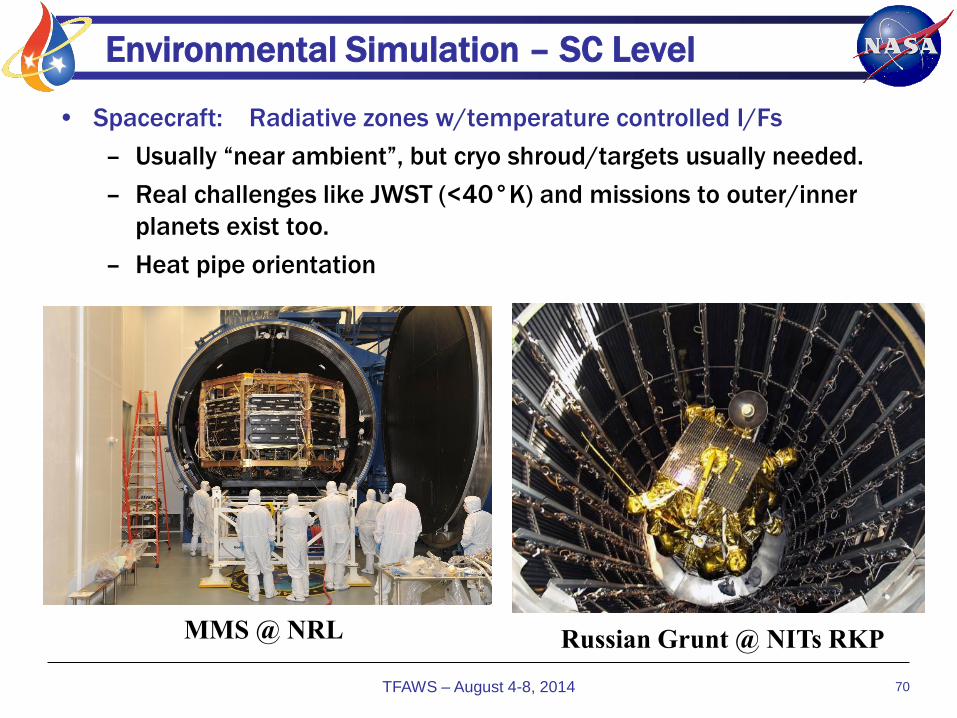
Environmental Simulation – SC Level
• Spacecraft: Radiative zones w/temperature controlled I/Fs
– Usually “near ambient”, but cryo shroud/targets usually needed.
– Real challenges like JWST (<40°K) and missions to outer/inner
planets exist too.
– Heat pipe orientation
TFAWS – August 4-8, 2014 70
Russian Grunt @ NITs RKP MMS @ NRL

Thermal Vacuum Chambers
TFAWS – August 4-8, 2014 71
SAC-D Argentina
LCROSS @ NGAS

Space Environment Simulator (SES)
• Test pressure: 13.3 μpa (10-7 torr)
• Shroud temperature:
– GN2 mode: -130°C to 100°C (-202°F to 212°F)
– LN2 mode: -180°C (-292°F)
• Chamber pumping speed:
– 8 cryopumps: 2.4 x 10⁵ lit/sec (5.1 x 10⁵ cfm) @ 133 μpa (10-6
torr)
– Turbomolecular pump: 6,000 lit/sec (12,700 cfm) @ 133 μpa (10-6
torr)
• PHYSICAL CHARACTERISTICS:
– Test volume: 8.23m diameter x 12.19m H (27' x 40')
– Payload support: 9,072 Kg (20,000 lb)
– Removable floor: 11,794 Kg (26,000 lb)
– Viewports: 30 cm (12") two each
– Std. electrical feedthroughs: 37-pin, 7-pin, 4-pin, RF
• WF3 video
• MAVEN into chamber
• RBSP into TV Chamber
• JWST in Chamber A
TFAWS – August 4-8, 2014 72 ISIM ISIM
GPM
Grab Your Popcorn
• WF3 video
• RBSP into TV Chamber
• JWST in Chamber A
• GPM into Tvac
• MAVEN into chamber
• TIRS in TVac
TFAWS – August 4-8, 2014 73
Environmental Simulation
• Environmental control must be able to accurately simulate the desired
mission environments (for thermal balance).
– Typically done with external targets of various types, but
sometimes heaters on hardware are used.
– Electrical heaters, IR “targets”, and solar simulators are the 3
primary means of environment simulation in thermal vacuum
testing.
– The selected method should be the same for balance and to
achieve protoflight temperatures (for thermal cycles).
• Whatever method is used, care must be taken:
– To ensure correct simulation of mission environments
– To allow protoflight temperatures to be achieved during
subsequent thermal vacuum cycling
– To ensure adequate cooling to reach cold limits or excessive
transition times depending on the size of the plates and test article
dissipations.
TFAWS – August 4-8, 2014 74

Environmental Simulation - IR
• Predominantly, mission environments are simulated using IR targets.
– Black painted plates (with heaters and temperature controlled) are
probably most common method used.
– IR targets can simulate the total heat flux onto a satellite, but can
not simulate the collimation and spectral characteristics of solar
irradiance.
• IR
– GN2 or LN2 coldplates: can be used to establish warm or cold
sinks. Cold flushing helps with hot-cold transitions.
– Heater plates: Most simulations use IR plates/sources. With
only radiative cooling to cold shroud, hot-cold transitions are
longer.
– Quartz lamps: tubular bulbs singular or arranged in array
– Cal rods: tubular ceramic heaters arranged in an array to provide
relatively smooth sink.
TFAWS – August 4-8, 2014 75
Environmental Simulation – Solar Sim
• Solar simulation can not simulate the planetary IR loading.
• Few facilities in the U.S or elsewhere; especially for large test articles
(spacecraft).
• Benefit of reflections, etc for orbit simulations. True orbit simulations
possible, but requires complex facility versus static (fixed) position.
• Assess possible sink simulation types, considering:
– Cost, facility limitations, contamination, etc
TFAWS – August 4-8, 2014 76
Test Sinks – IR Heater/Controlled Plates
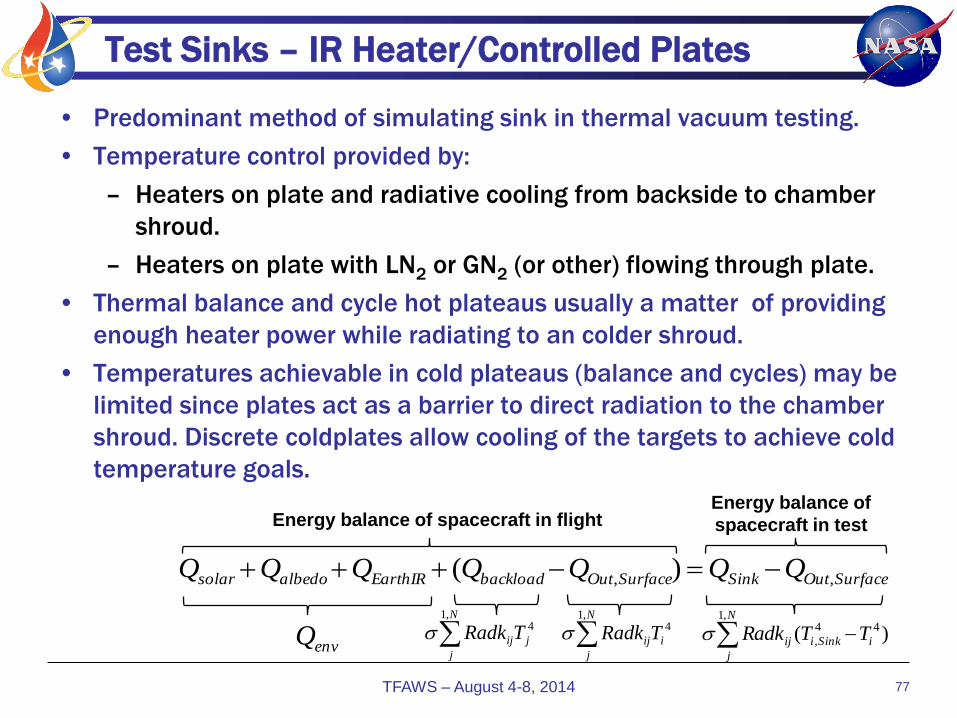
• Predominant method of simulating sink in thermal vacuum testing.
• Temperature control provided by:
– Heaters on plate and radiative cooling from backside to chamber
shroud.
– Heaters on plate with LN2 or GN2 (or other) flowing through plate.
• Thermal balance and cycle hot plateaus usually a matter of providing
enough heater power while radiating to an colder shroud.
• Temperatures achievable in cold plateaus (balance and cycles) may be
limited since plates act as a barrier to direct radiation to the chamber
shroud. Discrete coldplates allow cooling of the targets to achieve cold
temperature goals.
TFAWS – August 4-8, 2014 77
SurfaceOutSinkSurfaceOutbackloadEarthIRalbedosolar QQQQQQQ ,, )(
envQ N
j
jijTRadk,1
4 N
j
iijTRadk,1
4 )( 44
,
,1
iSinki
N
j
ij TTRadk
Energy balance of spacecraft in flight Energy balance of
spacecraft in test

Thermal Conditioning Units (TCUs)
• Use of GN2 to provide temperature control of IR targets inside TV
chamber require thermal conditioning outside the chamber.
• Typical applications for these units include independent thermal
control of test articles and contamination monitoring devices such as
mirrors and TQCMs.
• Chamber penetrations are configured to accommodate the thermal
conditioning units.
TFAWS – August 4-8, 2014 78
Heater Controllers
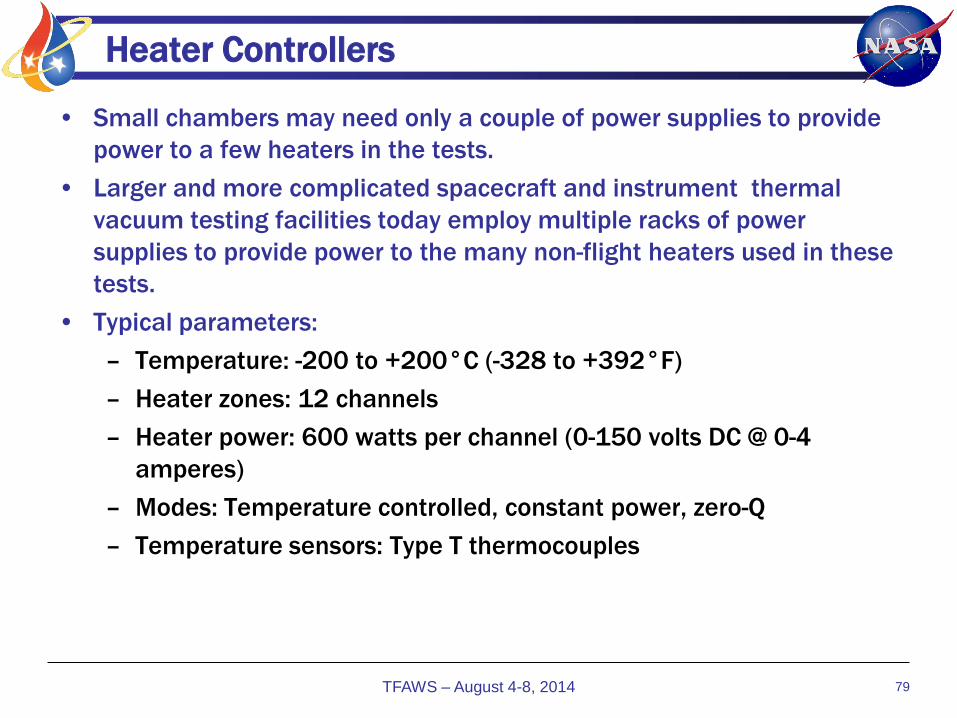
• Small chambers may need only a couple of power supplies to provide
power to a few heaters in the tests.
• Larger and more complicated spacecraft and instrument thermal
vacuum testing facilities today employ multiple racks of power
supplies to provide power to the many non-flight heaters used in these
tests.
• Typical parameters:
– Temperature: -200 to +200°C (-328 to +392°F)
– Heater zones: 12 channels
– Heater power: 600 watts per channel (0-150 volts DC @ 0-4
amperes)
– Modes: Temperature controlled, constant power, zero-Q
– Temperature sensors: Type T thermocouples
TFAWS – August 4-8, 2014 79

Contamination Monitoring
• Contamination control is key for satellites – even more so for those with scientific instruments sensitive to contamination from molecular outgassing onto critical optical or thermal surfaces.
– RGA: Residual Gas Analyzer – used to measure the partial pressures of ionized molecules over a mass range of 1 to 200 atomic mass units (AMU). Oriented to maximize the detection of the outgassing species and activated after the facility pressure reaches 10-4 torr.
– TQCM: Thermoelectric Quartz Crystal Microbalance measures and records condensable masses (outgassing) that deposit on a piezoelectric crystal which changes frequency proportionally to the amount of payload outgassing. Turned on <10-5 torr.
– Cold Finger (CF): Condensable vapors are collected by the cold finger and analyzed after the test. In some cases, a large cold plate is used to collect the condensable materials.
– The cold finger is maintained at LN2 temperature during test, rinsed with IPA and analyzed after the test.
– CCMs – Contamination Control Mirrors are used in the thermal vacuum chambers; however, they may be placed anywhere to collect condensable matter.
TFAWS .– August 4-8, 2014 80

IR Lamps
• Typical tungsten filament within
quartz glass shell.
• Can be used for all levels of
testing (unit, instrument, SC)
– mechanism testing where
movement precludes
mounting a heater
– arrays for radiator
(subassembly testing)
– Small size would require
large, complex arrays for
most SC testing, but it is
possible.
• Requires sink detector
TFAWS – August 4-8, 2014 81
• Spectral energy changes over
temperature. These lamps can be
very hot (TFILAMENT >4000°C) at high
power.
• At that temperature distribution is
mostly UV (see above normalized
intensity plot)
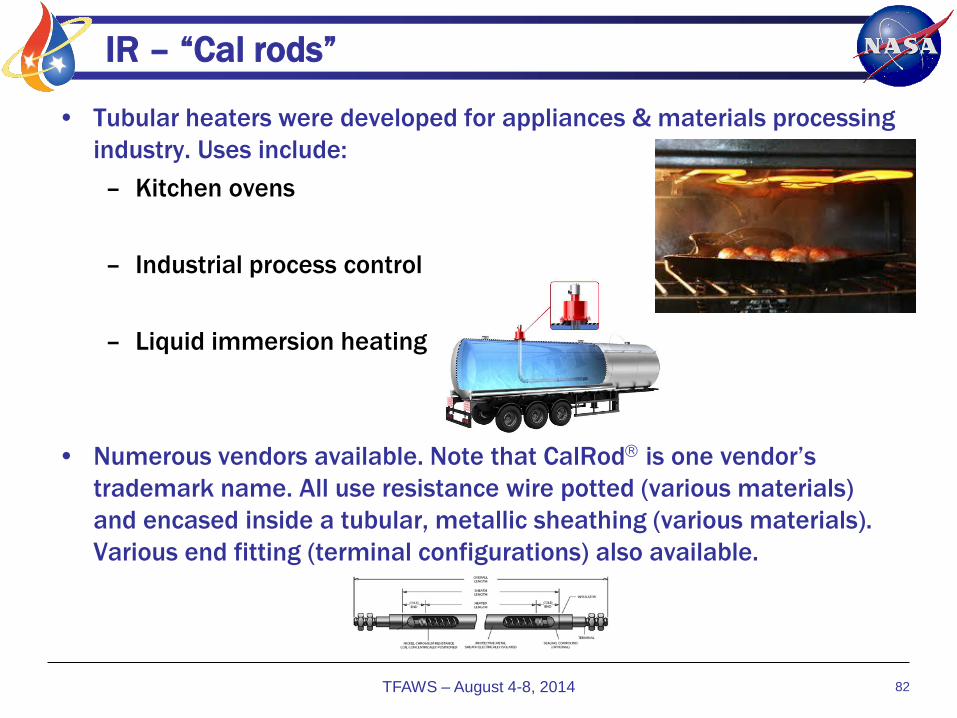
IR – “Cal rods”
• Tubular heaters were developed for appliances & materials processing
industry. Uses include:
– Kitchen ovens
– Industrial process control
– Liquid immersion heating
• Numerous vendors available. Note that CalRod is one vendor’s
trademark name. All use resistance wire potted (various materials)
and encased inside a tubular, metallic sheathing (various materials).
Various end fitting (terminal configurations) also available.
TFAWS – August 4-8, 2014 82

Cal Rods – Pros & Cons
• Long length available makes using them with large test articles simpler than IR lamps. This concept also utilizes the radiative view to the cold chamber shroud COMBINED with the local heating from these small diameter tubular heaters.
• These things do get hot – typically 600C is the realistic limit, although they are rated much higher…..you get into contamination issues, power supply issues, etc.
– Planck’s Law shows at 600°C, these remain in the IR regime, unlike the IR lamps discussed earlier.
• They also allow the equivalent sink to cool rapidly when they are turned off, providing transient sink capability, if desired.
• Since the goal is to provide a relatively isothermal sink, spacing and setback are key parameters to consider. Some data is presented on the following slide, but I encourage you to perform your own calculations.
• Most importantly, special monitors are needed to verify sink temperatures achieved. Although given many names, I call them “Equivalent Sink Detectors” or ESDs.
TFAWS – August 4-8, 2014 83
Cal Rod Basics
• For a given power level (voltage setting) the intensity (I) of the heat
generated by the cal rod will vary with the square of the radial distance
from it.
• You can parametrically study various cal rod set-ups using thermal
software, or Excel, or simple hand calculations.
• I recently went through this for my project (GOES-R) to optimize cal rod
spacing and setback to achieve a relatively even flux distribution on
the radiators.
– The GOES-R radiators are very large, but contain many heat pipes
to spread the electronics heat (aka “isothermalize” the panels), so
a perfectly even flux distribution isn’t critical.
TFAWS – August 4-8, 2014 84
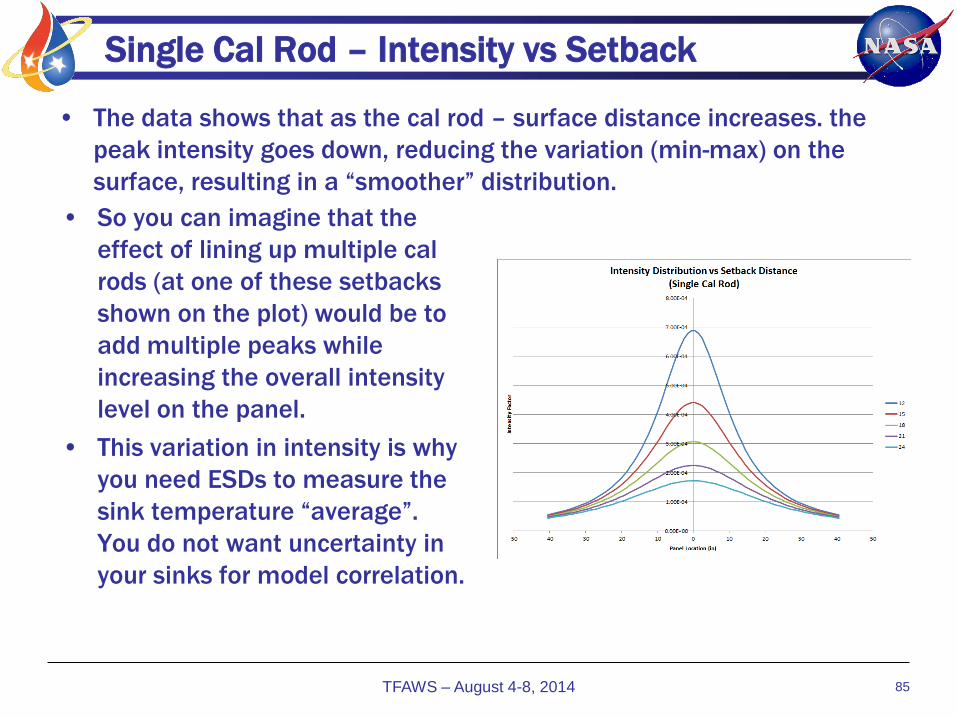
Single Cal Rod – Intensity vs Setback
• The data shows that as the cal rod – surface distance increases. the
peak intensity goes down, reducing the variation (min-max) on the
surface, resulting in a “smoother” distribution.
TFAWS – August 4-8, 2014 85
• So you can imagine that the
effect of lining up multiple cal
rods (at one of these setbacks
shown on the plot) would be to
add multiple peaks while
increasing the overall intensity
level on the panel.
• This variation in intensity is why
you need ESDs to measure the
sink temperature “average”.
You do not want uncertainty in
your sinks for model correlation.

Effect of Multiple Cal Rods at Fixed Setback
• Assumed 80” wide panel
• Single cal rod set back 12” from
panel
TFAWS – August 4-8, 2014 86
• Three cal rods set back 12” from
panel; spaced 40” apart.

Multiple Cal Rods - continued
TFAWS – August 4-8, 2014 87
• Five cal rods set back 12” from
panel; spaced 20” apart
• Nine cal rods set back 21” from
panel; spaced 10“ apart.
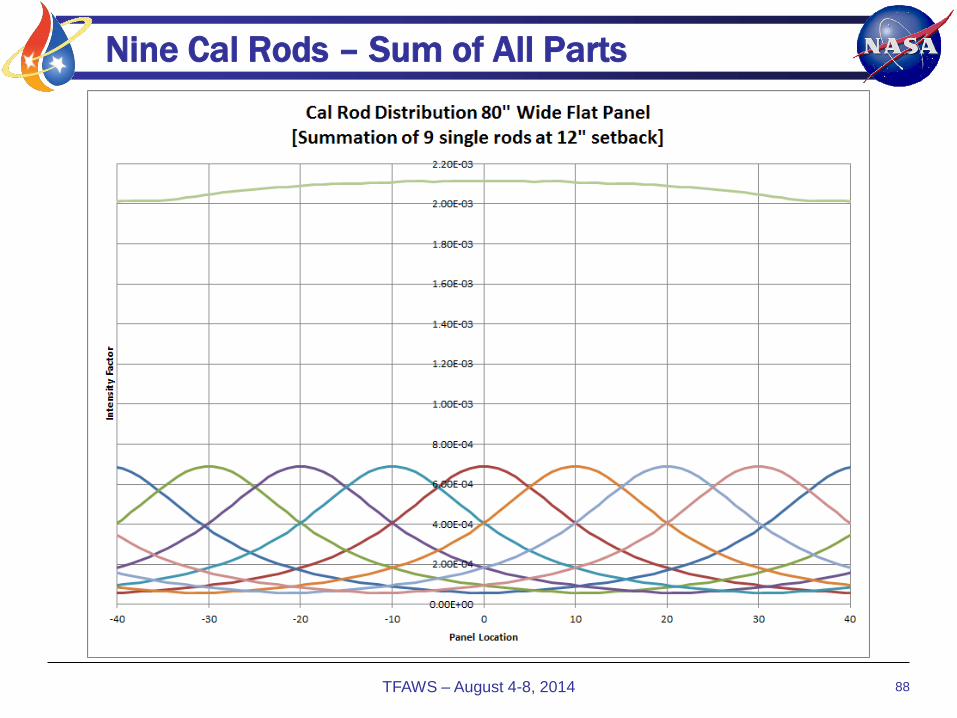
Nine Cal Rods – Sum of All Parts
TFAWS – August 4-8, 2014 88
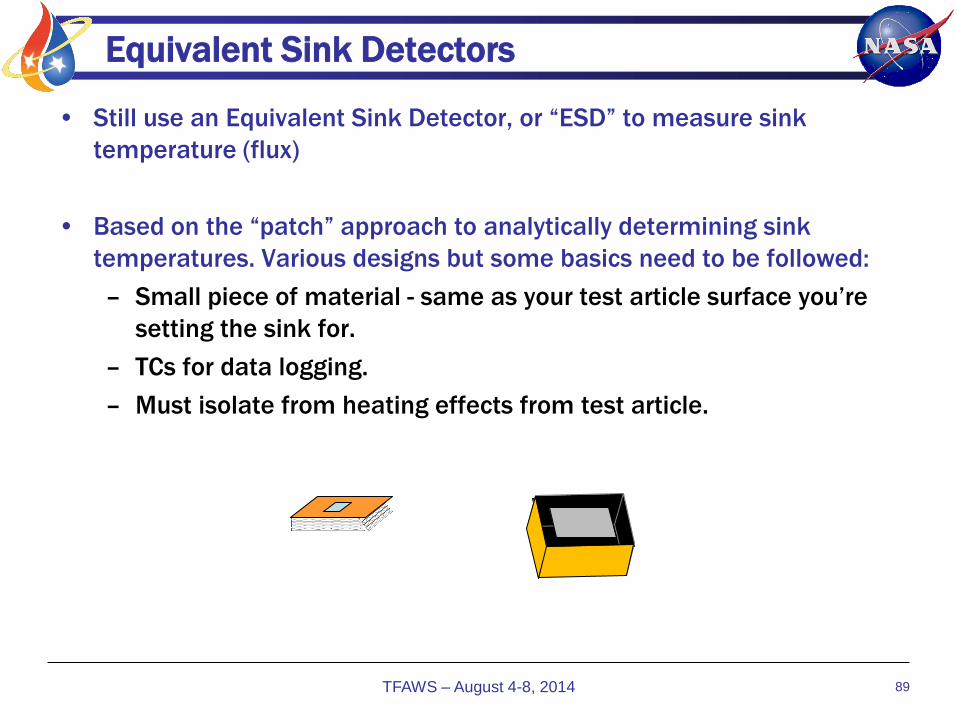
Equivalent Sink Detectors
• Still use an Equivalent Sink Detector, or “ESD” to measure sink
temperature (flux)
• Based on the “patch” approach to analytically determining sink
temperatures. Various designs but some basics need to be followed:
– Small piece of material - same as your test article surface you’re
setting the sink for.
– TCs for data logging.
– Must isolate from heating effects from test article.
TFAWS – August 4-8, 2014
89

GOES-R SCTV configuration
• Cal rod “zones” around
the -Y, +/-X, +/-Z sides of
the SC.
– +Y uses GN2
temperature
controlled coldplate
• Deployed solar array
(yoke and instrument
platform – no cell panels)
uses heater plates to
provide discrete
environments to co-
located instruments
TFAWS – August 4-8, 2014 90

Modeling the GOES-R Test - Example
• Cal rod zones modeled as black plates in SCTV thermal model, set at
desired equivalent sink temperature.
• Mylar baffles separating zones are also modeled.
TFAWS – August 4-8, 2014 91
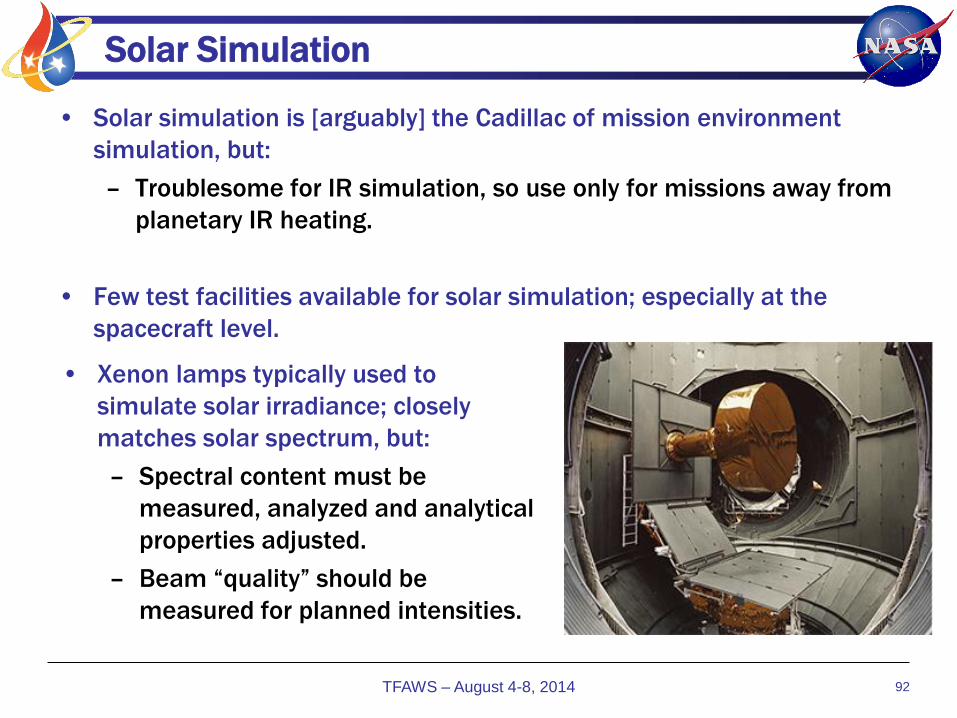
Solar Simulation
• Solar simulation is [arguably] the Cadillac of mission environment
simulation, but:
– Troublesome for IR simulation, so use only for missions away from
planetary IR heating.
• Few test facilities available for solar simulation; especially at the
spacecraft level.
TFAWS – August 4-8, 2014 92
• Xenon lamps typically used to
simulate solar irradiance; closely
matches solar spectrum, but:
– Spectral content must be
measured, analyzed and analytical
properties adjusted.
– Beam “quality” should be
measured for planned intensities.

UV vs Xenon Spectra
TFAWS – August 4-8, 2014 93

Spectral Energy Distribution
• Solar simulation is just that – not perfect but can be very close.
• Since α and I are f(λ), the differences in spectral energy distribution
between UV and Xenon require re-calculating thermo-optical properties
for correlation.
TFAWS – August 4-8, 2014
94
αEFF = 𝒊 λ α λ 𝒅(λ)
𝒊 λ α λ
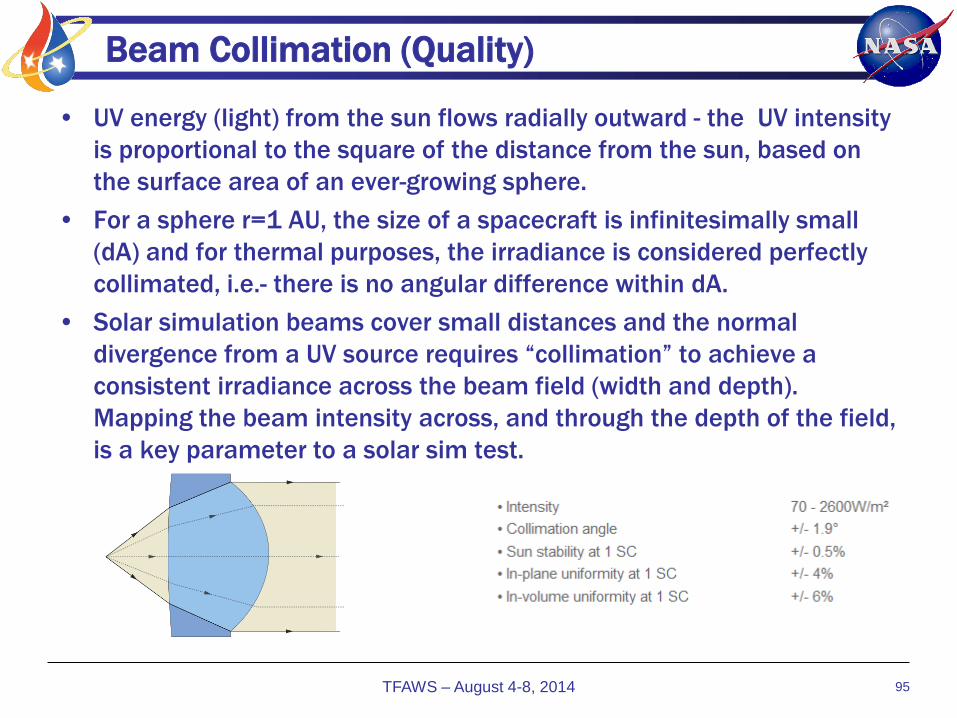
Beam Collimation (Quality)
TFAWS – August 4-8, 2014 95
• UV energy (light) from the sun flows radially outward - the UV intensity
is proportional to the square of the distance from the sun, based on
the surface area of an ever-growing sphere.
• For a sphere r=1 AU, the size of a spacecraft is infinitesimally small
(dA) and for thermal purposes, the irradiance is considered perfectly
collimated, i.e.- there is no angular difference within dA.
• Solar simulation beams cover small distances and the normal
divergence from a UV source requires “collimation” to achieve a
consistent irradiance across the beam field (width and depth).
Mapping the beam intensity across, and through the depth of the field,
is a key parameter to a solar sim test.

Beam Intensity Mapping
TFAWS – August 4-8, 2014 96

4.0 Test Set-up
• 4.1 Mission Environments
• 4.2 Chambers/GSE
• 4.3 Temperature Sensors/Alarm Limits
TFAWS – August 4-8, 2014 97
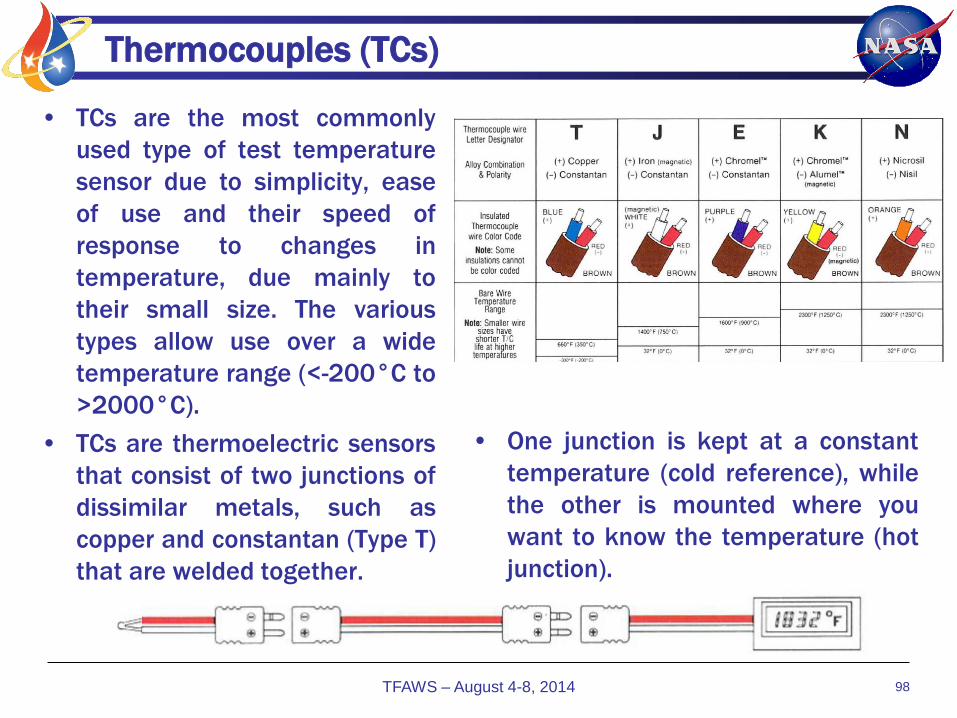
Thermocouples (TCs)
• TCs are the most commonly
used type of test temperature
sensor due to simplicity, ease
of use and their speed of
response to changes in
temperature, due mainly to
their small size. The various
types allow use over a wide
temperature range (<-200°C to
>2000°C).
• TCs are thermoelectric sensors
that consist of two junctions of
dissimilar metals, such as
copper and constantan (Type T)
that are welded together.
TFAWS – August 4-8, 2014 98
• One junction is kept at a constant
temperature (cold reference), while
the other is mounted where you
want to know the temperature (hot
junction).
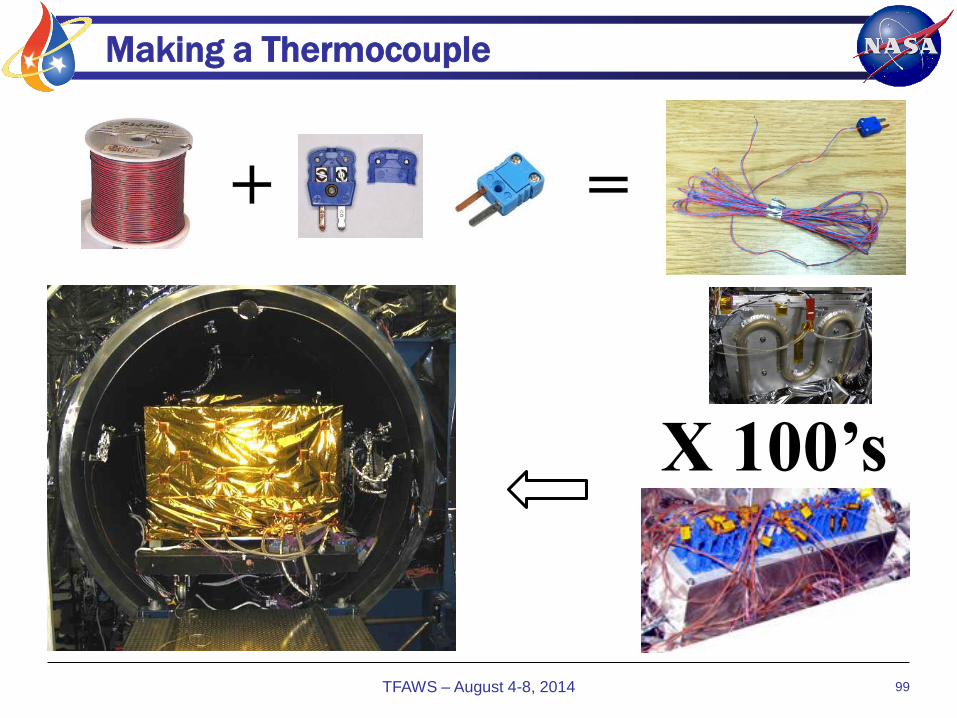
Making a Thermocouple
TFAWS – August 4-8, 2014 99
+ =
X 100’s

Installing Thermocouples
• The vast majority of
thermocouples are mounted
with adhesive-backed aluminum
tape. Form the end of the
thermocouple wire pair into a
"U" shape to hold the
thermocouple in place in case
the wire is accidentally pulled.
• Connect to facility data system
and verify all TCs read close to
ambient.
• Touch test.
TFAWS – August 4-8, 2014
100

Resistive Temperature Devices
• Precision temperature sensors made from high-purity conducting metals such as platinum, copper or nickel wound into a coil and whose electrical resistance changes as a function of temperature, similar to that of the thermistor.
• Also available are thin-film RTD’s. These devices have a thin film of platinum paste is deposited onto a white ceramic substrate
• Thermistors
– THERM-ally sensitive res-ISTOR: special type of resistor which changes its physical resistance when exposed to changes in temperature.
– Generally made from ceramic materials such as oxides of nickel, manganese or cobalt coated in glass which makes them easily damaged. Main advantages: speed of response to any changes in temperature, accuracy and repeatability.
• Negative Temperature Coefficient of resistance or (NTC), that is their resistance value goes DOWN with an increase in the temperature,
• Positive Temperature Coefficient, (PTC) resistance value goes UP with an increase in temperature.
• Silicon Diode: The silicon diode sensor is a device that has been developed specifically for the cryogenic temperature range. Essentially, they are linear devices where the conductivity of the diode increases linearly in the low cryogenic regions.
• Platinum Resistance Thermomoeter (PRT): stable unreactive metal which can be drawn down to fine wires but is not too soft. Using very pure wires, thermometers can be made with closely similar resistance characteristics and achieve good reproducibility in use.
• Cernox™ thin film resistance cryogenic temperature sensors
– Temperature range of 100 mK to 420 K (model dependent)
– High sensitivity at low temperatures and good sensitivity over a broad range
TFAWS – August 4-8, 2014 101

1-Wire Sensor
• Digital thermometer used by MMS for GSE temperature sensing.
– -55°C < TOPER < +125°C; +/-0.5° accuracy -55°C < TOPER < +85°C
– Sensors actually have three wires (Data, Power and Ground)
– Install same as thermostats & thermistors (Stycast, Ecoobond, etc)
• Pros – Each sensor has a unique 64-bit address
allowing multiple sensors to be wired in series – similar to Christmas Tree lights
– Compared to a typical thermocouple that uses two wires, the 1-Wire sensors can save GSE mass and can be read using a USB interface and laptop computer.
• Cons – If 1-wire bus shorts to ground you lose
the entire string
MMS used six 1-wire buses w/64 sensors each. So for ~400 sensors, only had 18 wires going to the chamber connector. TCs would have required ~800 wires.

Data Systems
• Institutional heritage usually drives the TC data system set up and
capability.
• Mission unique telemetry parameters drive the TLM display.
• Thermal test telemetry should utilize ALL temperature, heater, and
current telemetry to the maximum extent possible.
• Set up display pages before test begins – although they will
undoubtedly be modified as the test progresses, Some suggestions:
– Create virtual channels for gradients, dT/dt, etc
– Labview displays using schematics with telemetry displayed, i.e. –
propulsion systems, two-phase thermal systems,
– Stability pages to monitor required dT/dt for all sensors
TFAWS – August 4-8, 2014 103
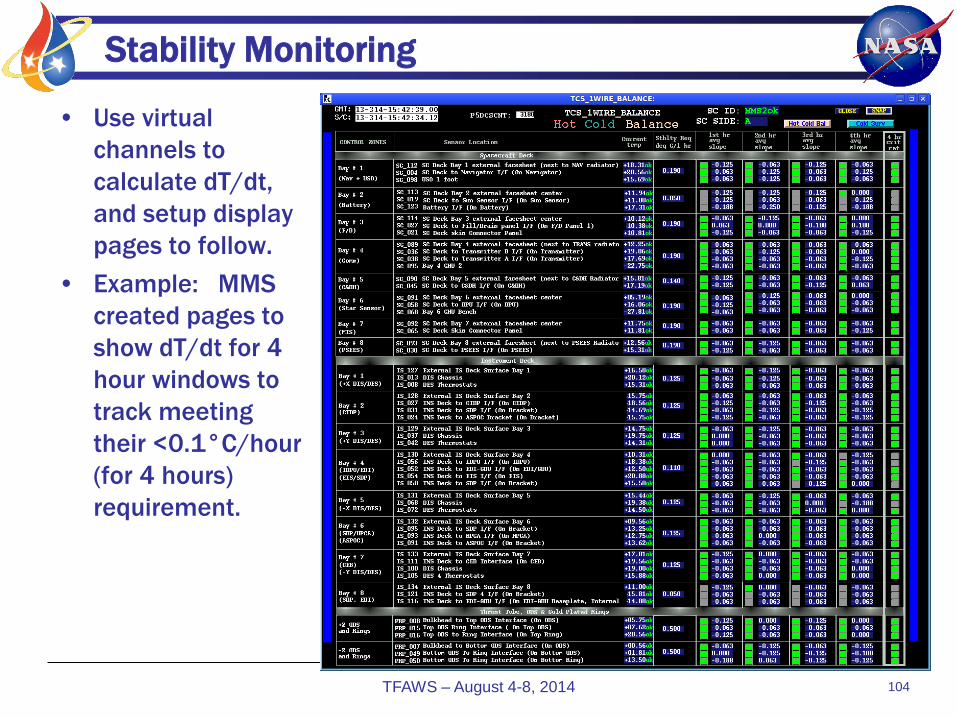
Stability Monitoring
• Use virtual
channels to
calculate dT/dt,
and setup display
pages to follow.
• Example: MMS
created pages to
show dT/dt for 4
hour windows to
track meeting
their <0.1°C/hour
(for 4 hours)
requirement.
TFAWS – August 4-8, 2014 104

Alarm Limits
• Most companies/institutions have their own idea on where to set
YEL/RED limits.
• The key is to understand what happens if a limits is
reached/exceeded; driven by hardware safety and mission assurance.
• GSFC practice usually sets these limits as:
– Yellow: outside of allowable operational range
– Red: outside of hardware test range(i.e. protoflight, etc)
• Tolerances ?
TFAWS – August 4-8, 2014 105
RED = Stop. You shouldn’t be here.
Paperwork is generated
YEL = use caution. This is not a typical range.
No paperwork generated.
Green = good.

4.0 Thermal Analysis & Documentation
• “The job ain’t over til the paperwork is done”.
TFAWS – August 4-8, 2014 106
Thermal Test Documentation
• GSFC-STD-1001 “Criteria for Flight Project Critical Milestones” defines
requirements for critical reviews.
• Documentation for thermal verification testing begins at CDR:
– Test plans complete
– Environmental verification flow from component to system level.
– Test facilities have been defined. Facilities are available and, if
needed, utilization agreements are complete
• At PER, “…. comprehensive environmental test sequence at
appropriate exposure levels is planned that will complete all remaining
required verification activities.”
TFAWS – August 4-8, 2014 107

Documentation Requirements
• The Goddard Space Flight Center Thermal Branch requires analysis
documentation (report / charts):
– Pre-Test: complete set of test predictions (temperatures & heater
power) for all thermal balance plateaus and hot/cold cycles, plus
transient assessment to verify transition times/schedule.
– Post-Test:
• Quick-look memo (within 2 weeks of balance completion)
documenting thermal balance temperatures compared to pre-test
predictions with NO model correlation.
• Post-Correlation thermal model review
• Final thermal test report
– Thermal balance model correlation
– Summary of cycle plateau temperatures achieved and margin analysis to
MAT and predicts
– Mission predictions
• We have some preferred products/formats, which I will try to go thru
with some examples.
TFAWS – August 4-8, 2014 108
Pre-Test Analysis
• Present at PER
• Document in engineering memos, reports, etc
– Target design, sizing, etc
• Analysis must include:
– all balance plateaus: present in “rainbow” format, with
“errors” between simulated and corresponding mission cases
tabulated and in histograms.
– hot & cold cycle plateaus: present in “rainbow” format, with
“errors” between predict and protoflight temperatures tabulated
and in histograms.
• CPT/LPT operations may differ from planned mission operations, but
this is usually the dissipation configuration we use.
– Transients: to assess durations, and to ID possible
contamination issues
TFAWS – August 4-8, 2014 109

Example - Balance vs Mission
• Single Excel file containing all
reported items:
– Unit I/F’s
– TLM sensors
– Gradients
– Heater Power
• Along with all analysis results,
TLM mnemonics, corresponding
node numbers, circuit ref des,
etc.
• Summary tables are important
for documenting all detail, but
not very user friendly for quick-
look understanding.
TFAWS – August 4-8, 2014 110
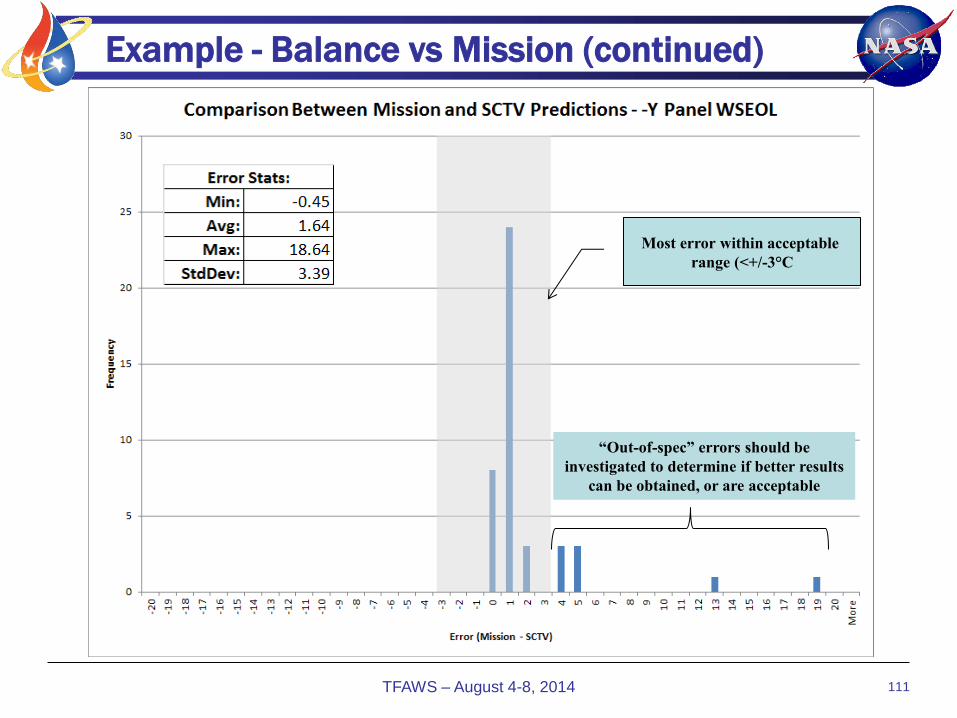
Example - Balance vs Mission (continued)
TFAWS – August 4-8, 2014 111
Most error within acceptable
range (<+/-3°C
“Out-of-spec” errors should be
investigated to determine if better results
can be obtained, or are acceptable

Example - SC TVAC Transient Time Estimate
TFAWS – August 4-8, 2014
112
0
10
20
30
40
50
60
70
80
Tim
e (
Hr)
Cold to Hot Hot to cold
Post-Test Analysis
• “Quick-Look” report:
– Release within 2 weeks of the completion of thermal balance testing. Document “Model – Data” errors; this is the starting point for the correlation effort.
– Tabulate data in rainbow format with histograms. Include summary timeline for test.
– Include “as measured” power – if available within the time constraints – this will be the basis for correlation.
– Compare transients.
• Thermal Model Correlation report (by PSR) must include:
– after correlation is completed for all balance plateaus; present in “rainbow” format, with “errors” between simulated and corresponding mission cases tabulated and in histograms (temperatures & heater powers).
– Summary table of all changes made to the model, with their effect on statistical results; include statistics/trend for initial, final and “significant” changes.
– Hot & cold cycle plateaus: present in “rainbow” format, with “errors” between predicted and actual protoflight temperatures tabulated and in histograms.
• Final mission predictions (by PSR):
– Use correlated model for all mission cases. Document changes made as a result of the testing, if applicable.
TFAWS – August 4-8, 2014 113
Model Correlation Review
• Held when thermal model correlation is completed, or very close to it.
– Use grey beards, other analysts, and independents
• Correlation statistical requirements are:
– T (avg): +/- 1.0°C mean deviation
– : 2.5°C standard deviation
– Calculate: and show Min T and Max T
• All errors > 5°C must be assessed as to why that is OK.
– Calculate and show %error <3°C and %error < 5°C
– Show transient comparisons
• Present all changes made to the model and the statistical analysis of
the effect of each change on the error. Tabulate “the statistics” for the
“non-significant” changes, tabulate and histograms for the
“significant” changes.
• Identify changes to the flight design, if needed.
TFAWS – August 4-8, 2014 114

Example – Correlation Results (Initial & Final)
TFAWS – August 4-8, 2014
115
Thermal Balance Test Report
• This is basically a report summary of the model correlation peer review
charts and data package.
– Usually part of a CDRL requirement for Pre-Ship Review, along with
the final models.
• Include overview of the test and major/significant finds/events/
issues/etc.
• You could include your final mission predicts here, although a separate
document (CDRL?) is usually required.
• Please use a technical report format, and not a PowerPoint format !!
TFAWS – August 4-8, 2014 116
Mission Correlation
• Usually not done, unless issues are seen in early mission.
• Difficult to do:
– establishing exact environment that is steady enough to correlate,
or
– to do a transient correlation.
• While there are no “requirements” for the correlation, if telemetry is
significantly off from the final predicts, it is still necessary to
understand why. Usually:
– Dissipation differences, environments
– Property degradation
• Again, present all changes made to the model and the statistical
analysis of the effect of each change on the error. Tabulate “the
statistics” for the “non-significant” changes, tabulate and histograms
for the “significant” changes.
TFAWS – August 4-8, 2014 117

118
Sources / References
• Fundamental information on thermal vacuum testing presented herein
has been extracted from several sources, all of which are available in
the public domain.
• References/Sources:
– GSFC-STD-7000A “General Environmental Verification Standard
(GEVS), For GSFC Flight Programs and Projects”, April 22, 2013
– MIL-STD-1540D “Product Verification Requirements for Launch,
Upper Stage, and Space Vehicles”, January 15, 1999
– Cullimore & Ring [www.crtech.com]
– “Spacecraft Thermal Control Handbook – Vols 1&2. Fundamental
Technologies”, Aerospace Corp, D. Gilmore, (Editor)
– Space Mission Analysis and Design, Wertz & Larson
– Various Aerospace Corp. papers, etc on Test Effectiveness
– NASA Technical Reports Server, http://ntrs.nasa.gov
TFAWS – August 4-8, 2014

5.0 QUESTIONS ?
119 TFAWS – August 4-8, 2014