Textual Analysis – A Working Technique for Visual · PDF fileThe article is for example...
23
Textual Analysis and Visual Modeling © Copyright 2009, BCS - Dr. Jürgen Pitschke Provided courtesy of BCS – Dr. Jürgen Pitschke Page 1 Textual Analysis – A Working Technique for Visual Modeling Version 1.0 This document developed by … Dr. Jürgen Pitschke, BCS-Dr. Jürgen Pitschke, www.enterprise-design.eu This material may be used freely on an in-house, non-commercial basis. Commercial re-use or re-transmission of any portion of this material is prohibited without written permission of BCS – Dr. Jürgen Pitschke. Contact BCS – Dr. Jürgen Pitschke for licensing and re-use arrangements. Please include this notice in all reproduction.
Transcript of Textual Analysis – A Working Technique for Visual · PDF fileThe article is for example...
Textual Analysis and Visual Modeling
© Copyright 2009, BCS - Dr. Jürgen Pitschke Provided courtesy of BCS – Dr. Jürgen Pitschke Page 1
Textual Analysis – A Working Technique for Visual
Modeling Version 1.0 This document developed by …
Dr. Jürgen Pitschke, BCS-Dr. Jürgen Pitschke, www.enterprise-design.eu
This material may be used freely on an in-house, non-commercial basis. Commercial re-use or re-transmission of any portion of this material is prohibited without written permission of BCS – Dr. Jürgen Pitschke. Contact BCS – Dr. Jürgen Pitschke for licensing and re-use arrangements. Please include this notice in all reproduction.
Textual Analysis and Visual Modeling
© Copyright 2009, BCS - Dr. Jürgen Pitschke Provided courtesy of BCS – Dr. Jürgen Pitschke Page 2
Content
1 Do we need „Textual Analysis“? ................................................................................. 3
2 Origins of Textual Analysis ........................................................................................ 4
2.1 Textual Analysis – The Abbott Article .................................................................. 4
2.2 Textual Analysis and UML Models ....................................................................... 4
2.3 Textual Analysis and BPMN Models ..................................................................... 6
2.4 Textual Analysis and other Model Elements ......................................................... 6
3 Textual Analysis in the Modeling Process .................................................................... 7
3.1 The Zachman Framework .................................................................................. 7
3.2 Process Models and the BCS Modeling Process ..................................................... 8
3.2.1 Identify Concepts ....................................................................................... 9
3.2.2 Building a Fact Model ................................................................................ 10
3.2.3 Business Rules, RuleSpeak® and Textual Analysis ......................................... 12
3.2.4 Textual Analysis and Process Decomposition ................................................ 12
4 How Textual Analysis Really Works .......................................................................... 15
4.1 Evaluation of Candidate Objects for Model Content ............................................. 15
4.2 Language and Textual Analysis ........................................................................ 16
5 Tool Support for Textual Analysis ............................................................................ 17
6 Summary ............................................................................................................. 18
Literature .................................................................................................................. 19
Annex A: Sample Service Desk .................................................................................... 20
Unsorted Information Collection (Abridged) ................................................................. 20
Collection of Terms (Macro Level, Abridged) ................................................................ 22
Fact Model (Macro Level) .......................................................................................... 22
Process Model (Macro process Incident Management) ................................................... 23
Textual Analysis and Visual Modeling
© Copyright 2009, BCS - Dr. Jürgen Pitschke Provided courtesy of BCS – Dr. Jürgen Pitschke Page 3
1 Do we need „Textual Analysis“?
“Textual Analysis” is a working technique used to extract model element information from unstructured information systematically. In the first moment user are skeptical when being confronted with textual analysis. Do we really need this? Why should we use it? My answer is very simple: Every modeler is using this technique. We usually have unstructured, non-formal information first, most often in the form of a textual description, when developing visual models. This information collection must be analyzed and transformed into models. Every modeler is doing this transformation, at least in his head. Usually this step is done intuitively and is not formalized or documented. So it is not traceable. It seems that the model appear out of nowhere. If we execute this step anyway it makes a lot of sense to choose a systematic approach and to present the result explicitly. Using a systematic approach applied by all project team members allows to plan and to repeat this step. Results are comparable. Because of the explicit presentation the result becomes traceable. For sure, this is often also a tool question. A tool supporting textual analysis eases use and documentation.
Textual Analysis and Visual Modeling
© Copyright 2009, BCS - Dr. Jürgen Pitschke Provided courtesy of BCS – Dr. Jürgen Pitschke Page 4
2 Origins of Textual Analysis
The basic idea of textual analysis is originated in an article of Russel J. Abbott1 in Communications of the ACM, November 1983 titled „Program Design by Informal English Descriptions“. For sure there were approaches for a systematic analysis of textual information before. Abbott had the idea to extract data types, variables, operators and control structures from natural language text to develop Ada programs. I don’t know how successful his approach was. But 20 years later, with the rise of visual modeling, his idea found new users and was enhanced. The article is for example referenced in „Mentoring Object Technology Projects“2 by Richard Dué published in 2002.
2.1 Textual Analysis – The Abbott Article
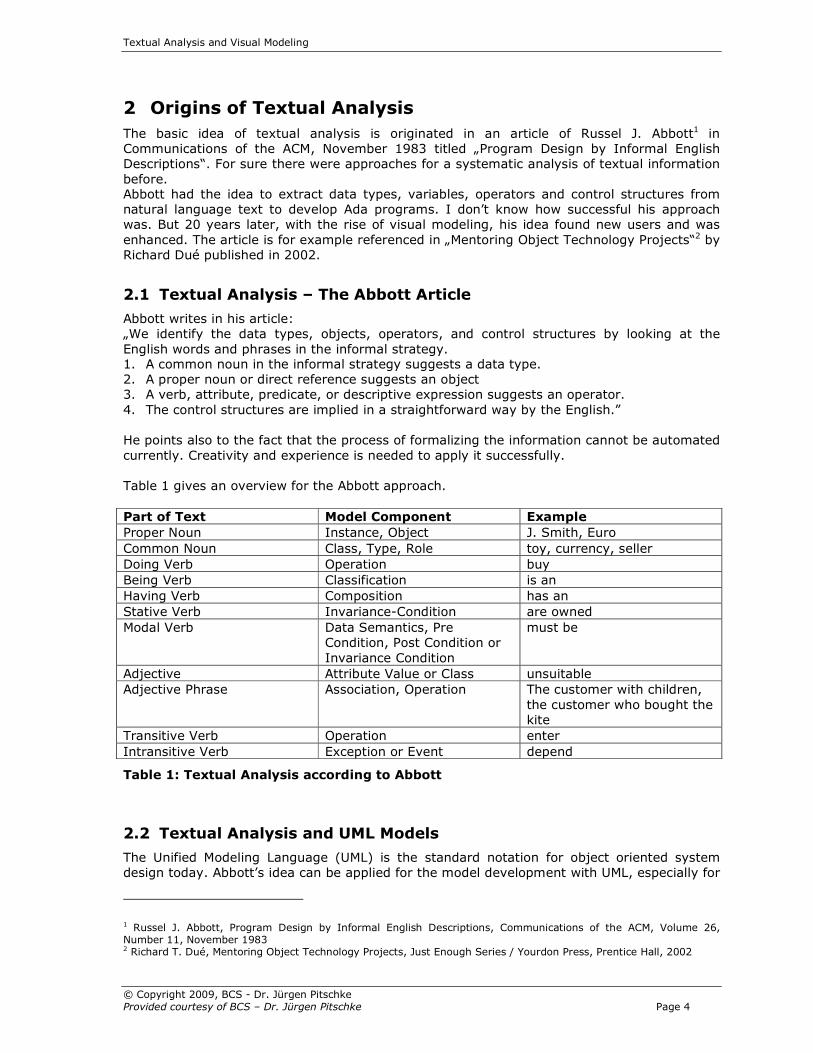
Abbott writes in his article: „We identify the data types, objects, operators, and control structures by looking at the English words and phrases in the informal strategy. 1. A common noun in the informal strategy suggests a data type. 2. A proper noun or direct reference suggests an object 3. A verb, attribute, predicate, or descriptive expression suggests an operator. 4. The control structures are implied in a straightforward way by the English.” He points also to the fact that the process of formalizing the information cannot be automated currently. Creativity and experience is needed to apply it successfully. Table 1 gives an overview for the Abbott approach. Part of Text Model Component Example
Proper Noun Instance, Object J. Smith, Euro
Common Noun Class, Type, Role toy, currency, seller Doing Verb Operation buy Being Verb Classification is an Having Verb Composition has an Stative Verb Invariance-Condition are owned Modal Verb Data Semantics, Pre
Condition, Post Condition or Invariance Condition
must be
Adjective Attribute Value or Class unsuitable Adjective Phrase Association, Operation The customer with children,
the customer who bought the kite
Transitive Verb Operation enter
Intransitive Verb Exception or Event depend
Table 1: Textual Analysis according to Abbott
2.2 Textual Analysis and UML Models
The Unified Modeling Language (UML) is the standard notation for object oriented system design today. Abbott’s idea can be applied for the model development with UML, especially for
1 Russel J. Abbott, Program Design by Informal English Descriptions, Communications of the ACM, Volume 26, Number 11, November 1983 2 Richard T. Dué, Mentoring Object Technology Projects, Just Enough Series / Yourdon Press, Prentice Hall, 2002
Textual Analysis and Visual Modeling
© Copyright 2009, BCS - Dr. Jürgen Pitschke Provided courtesy of BCS – Dr. Jürgen Pitschke Page 5
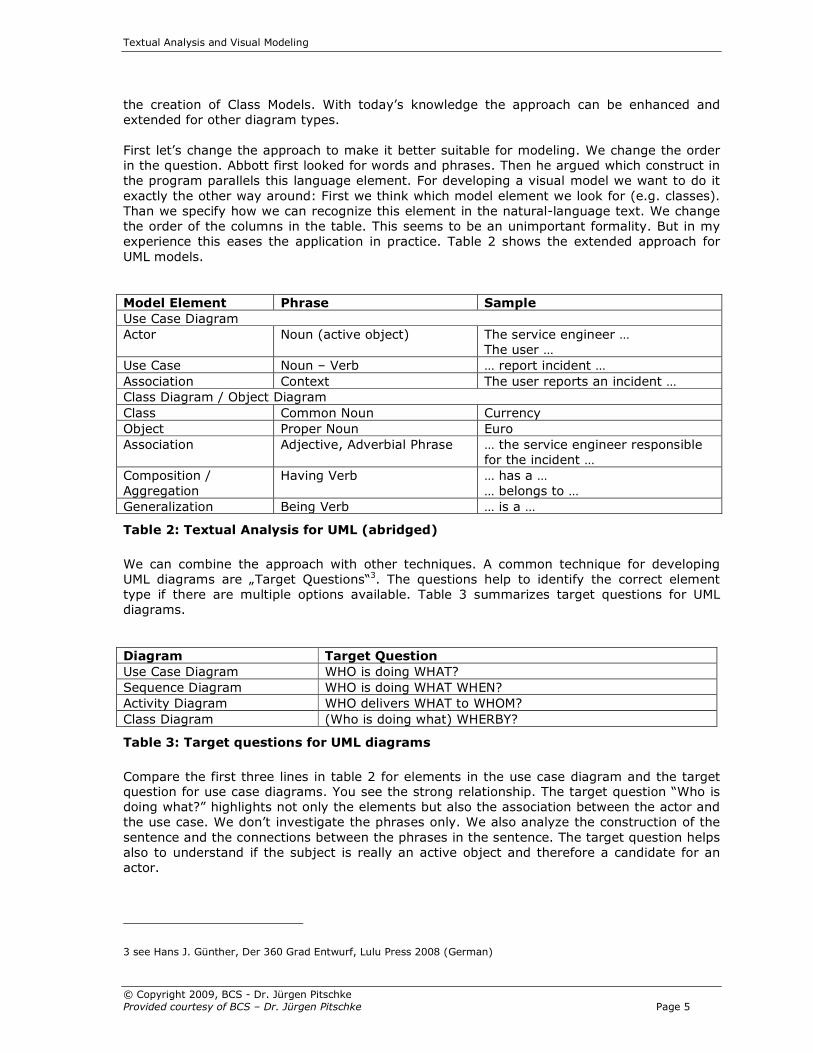
the creation of Class Models. With today’s knowledge the approach can be enhanced and extended for other diagram types. First let’s change the approach to make it better suitable for modeling. We change the order in the question. Abbott first looked for words and phrases. Then he argued which construct in the program parallels this language element. For developing a visual model we want to do it exactly the other way around: First we think which model element we look for (e.g. classes). Than we specify how we can recognize this element in the natural-language text. We change the order of the columns in the table. This seems to be an unimportant formality. But in my experience this eases the application in practice. Table 2 shows the extended approach for UML models.
Model Element Phrase Sample
Use Case Diagram Actor Noun (active object) The service engineer …
The user … Use Case Noun – Verb … report incident …
Association Context The user reports an incident … Class Diagram / Object Diagram
Class Common Noun Currency Object Proper Noun Euro Association Adjective, Adverbial Phrase … the service engineer responsible
for the incident … Composition / Aggregation
Having Verb … has a … … belongs to …
Generalization Being Verb … is a …
Table 2: Textual Analysis for UML (abridged)
We can combine the approach with other techniques. A common technique for developing UML diagrams are „Target Questions“3. The questions help to identify the correct element type if there are multiple options available. Table 3 summarizes target questions for UML diagrams.
Diagram Target Question
Use Case Diagram WHO is doing WHAT? Sequence Diagram WHO is doing WHAT WHEN? Activity Diagram WHO delivers WHAT to WHOM?
Class Diagram (Who is doing what) WHERBY?
Table 3: Target questions for UML diagrams
Compare the first three lines in table 2 for elements in the use case diagram and the target question for use case diagrams. You see the strong relationship. The target question “Who is doing what?” highlights not only the elements but also the association between the actor and the use case. We don’t investigate the phrases only. We also analyze the construction of the sentence and the connections between the phrases in the sentence. The target question helps also to understand if the subject is really an active object and therefore a candidate for an actor.
3 see Hans J. Günther, Der 360 Grad Entwurf, Lulu Press 2008 (German)
Textual Analysis and Visual Modeling
© Copyright 2009, BCS - Dr. Jürgen Pitschke Provided courtesy of BCS – Dr. Jürgen Pitschke Page 6
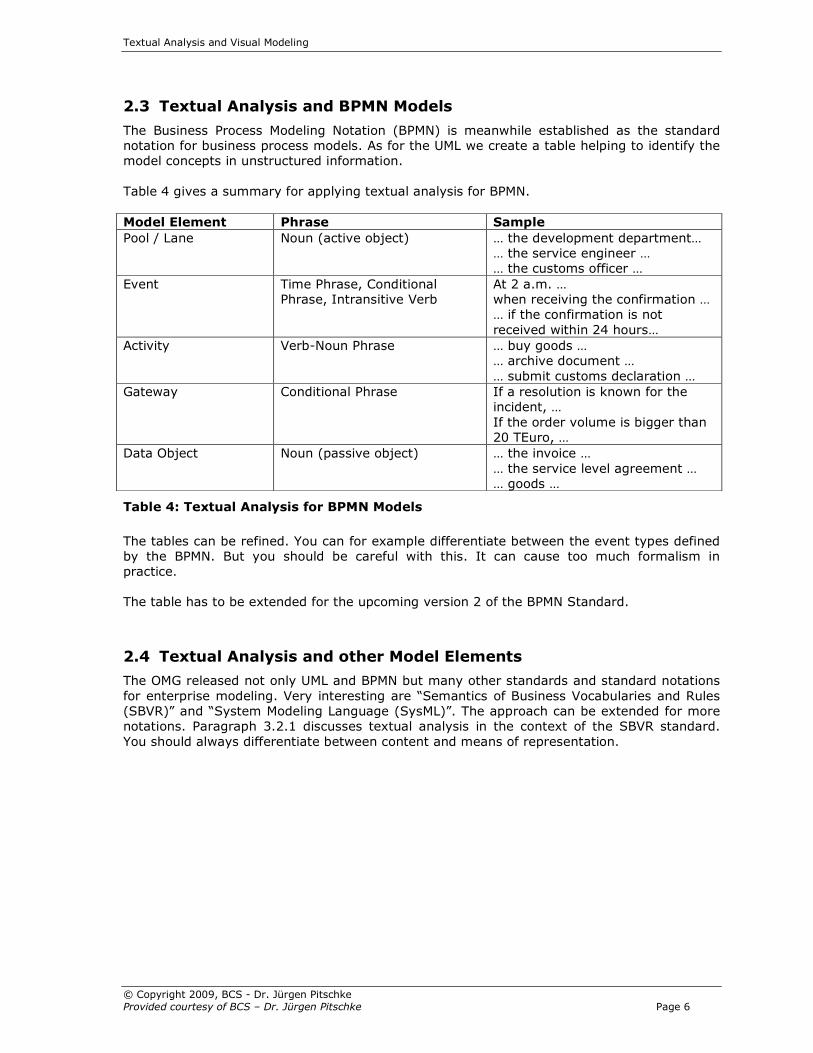
2.3 Textual Analysis and BPMN Models
The Business Process Modeling Notation (BPMN) is meanwhile established as the standard notation for business process models. As for the UML we create a table helping to identify the model concepts in unstructured information. Table 4 gives a summary for applying textual analysis for BPMN. Model Element Phrase Sample
Pool / Lane Noun (active object) … the development department… … the service engineer … … the customs officer …
Event Time Phrase, Conditional Phrase, Intransitive Verb
At 2 a.m. … when receiving the confirmation … … if the confirmation is not received within 24 hours…
Activity Verb-Noun Phrase … buy goods … … archive document … … submit customs declaration …
Gateway Conditional Phrase If a resolution is known for the incident, … If the order volume is bigger than 20 TEuro, …
Data Object Noun (passive object) … the invoice … … the service level agreement … … goods …
Table 4: Textual Analysis for BPMN Models
The tables can be refined. You can for example differentiate between the event types defined by the BPMN. But you should be careful with this. It can cause too much formalism in practice. The table has to be extended for the upcoming version 2 of the BPMN Standard.
2.4 Textual Analysis and other Model Elements
The OMG released not only UML and BPMN but many other standards and standard notations for enterprise modeling. Very interesting are “Semantics of Business Vocabularies and Rules (SBVR)” and “System Modeling Language (SysML)”. The approach can be extended for more notations. Paragraph 3.2.1 discusses textual analysis in the context of the SBVR standard. You should always differentiate between content and means of representation.
Textual Analysis and Visual Modeling
© Copyright 2009, BCS - Dr. Jürgen Pitschke Provided courtesy of BCS – Dr. Jürgen Pitschke Page 7
3 Textual Analysis in the Modeling Process
Often users think that Textual Analysis is applied only at the beginning of the modeling process. That’s completely wrong. We saw in chapter 2 that we can apply Textual Analysis to identify very different model elements. It would be counterproductive to try to identify all the different model elements in one step. When and how often we apply Textual Analysis depends on our modeling process. I don’t discuss different process models here. Our own process model (BCS Modeling Process) is iterative and aligned along the Zachman Framework (see 3.1). That ensures that all relevant results are taken into account and created. The process uses working techniques, representation means and approaches from other established methods as the Unified Process. An important difference to the tables shown in chapter 2 is that we search for specific content presented by specific model elements. We don’t search classes, actors, use cases or similar. We look for terms, facts, roles, business activities, system functions and more. This is an important difference which is lost in many modeling projects. The notation is not the content! We can use the same notation to present different content. The same content can be presented by different notations.
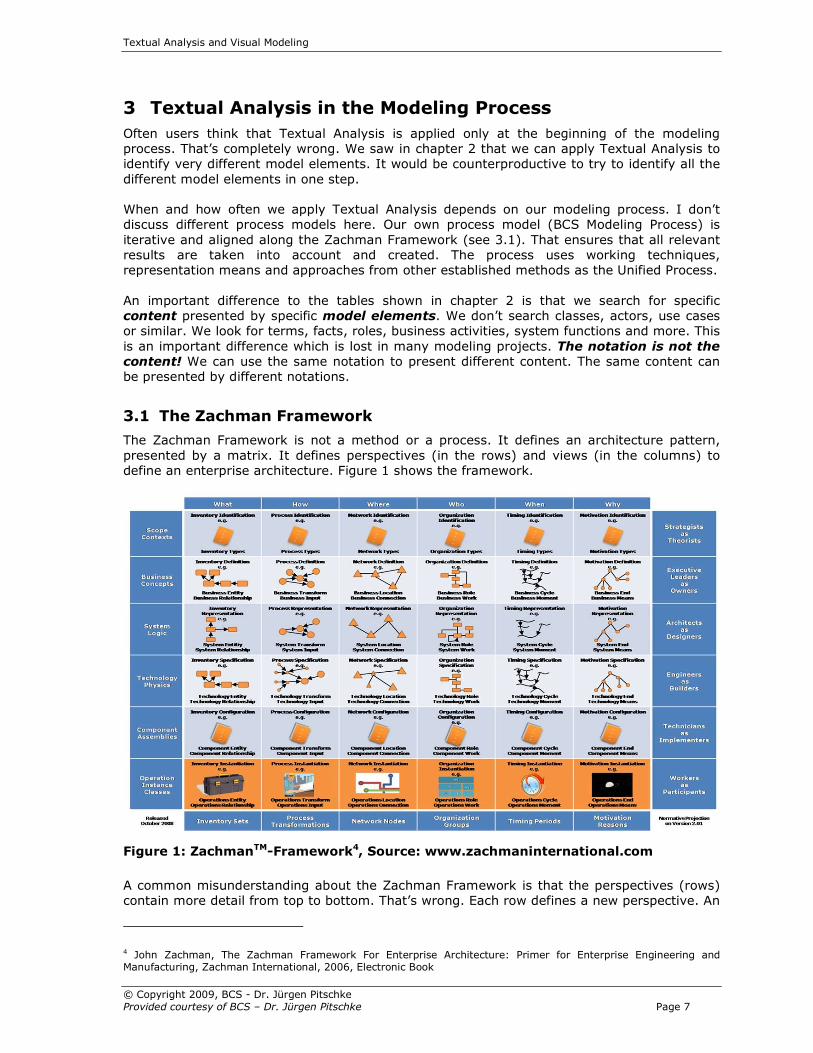
3.1 The Zachman Framework
The Zachman Framework is not a method or a process. It defines an architecture pattern, presented by a matrix. It defines perspectives (in the rows) and views (in the columns) to define an enterprise architecture. Figure 1 shows the framework.
Figure 1: ZachmanTM-Framework4, Source: www.zachmaninternational.com
A common misunderstanding about the Zachman Framework is that the perspectives (rows) contain more detail from top to bottom. That’s wrong. Each row defines a new perspective. An
4 John Zachman, The Zachman Framework For Enterprise Architecture: Primer for Enterprise Engineering and Manufacturing, Zachman International, 2006, Electronic Book
Textual Analysis and Visual Modeling
© Copyright 2009, BCS - Dr. Jürgen Pitschke Provided courtesy of BCS – Dr. Jürgen Pitschke Page 8
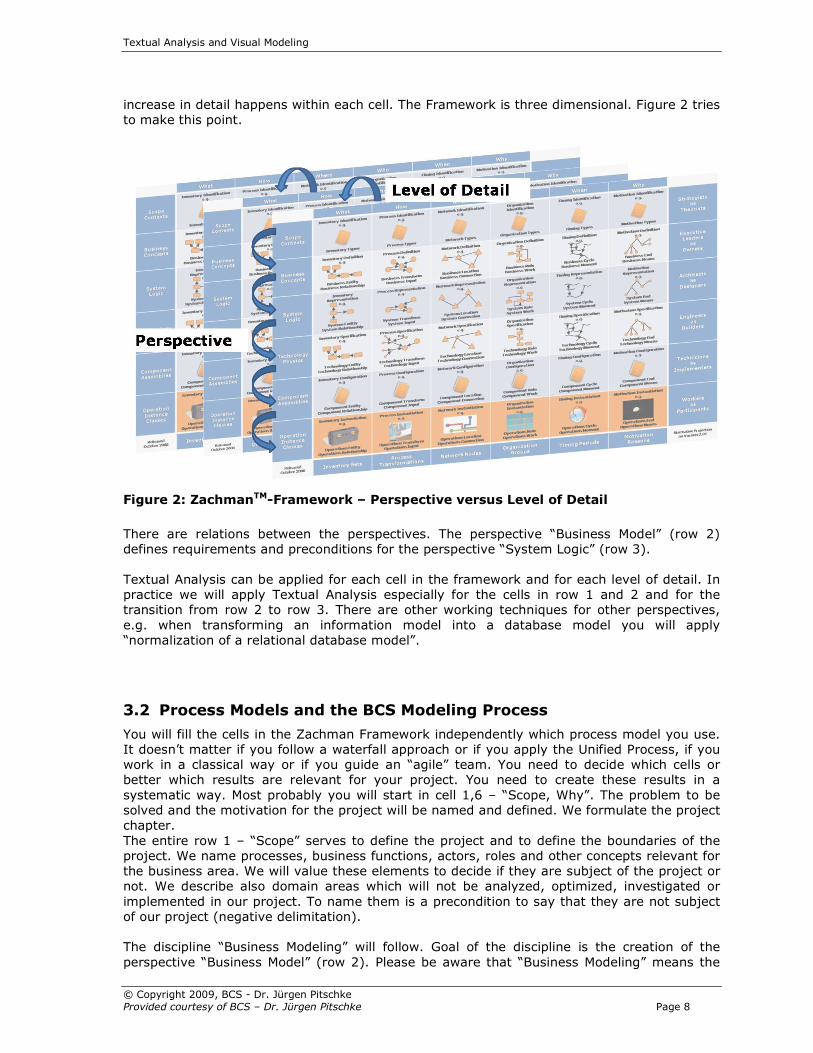
increase in detail happens within each cell. The Framework is three dimensional. Figure 2 tries to make this point.
Figure 2: ZachmanTM-Framework – Perspective versus Level of Detail
There are relations between the perspectives. The perspective “Business Model” (row 2) defines requirements and preconditions for the perspective “System Logic” (row 3). Textual Analysis can be applied for each cell in the framework and for each level of detail. In practice we will apply Textual Analysis especially for the cells in row 1 and 2 and for the transition from row 2 to row 3. There are other working techniques for other perspectives, e.g. when transforming an information model into a database model you will apply “normalization of a relational database model”.
3.2 Process Models and the BCS Modeling Process
You will fill the cells in the Zachman Framework independently which process model you use. It doesn’t matter if you follow a waterfall approach or if you apply the Unified Process, if you work in a classical way or if you guide an “agile” team. You need to decide which cells or better which results are relevant for your project. You need to create these results in a systematic way. Most probably you will start in cell 1,6 – “Scope, Why”. The problem to be solved and the motivation for the project will be named and defined. We formulate the project chapter. The entire row 1 – “Scope” serves to define the project and to define the boundaries of the project. We name processes, business functions, actors, roles and other concepts relevant for the business area. We will value these elements to decide if they are subject of the project or not. We describe also domain areas which will not be analyzed, optimized, investigated or implemented in our project. To name them is a precondition to say that they are not subject of our project (negative delimitation). The discipline “Business Modeling” will follow. Goal of the discipline is the creation of the perspective “Business Model” (row 2). Please be aware that “Business Modeling” means the
Textual Analysis and Visual Modeling
© Copyright 2009, BCS - Dr. Jürgen Pitschke Provided courtesy of BCS – Dr. Jürgen Pitschke Page 9
creation of the artifacts for all cells in the perspective not only the Business Process or the Business Activities. It includes also the Business Rules, the Business Vocabulary, etc. Our process model – the BCS Modeling Process – is a process driven approach. This means the business process is the central concept for modeling and analysis. The process model needs other models and model elements as the business vocabulary and business rules to be defined. Identified business activities will be supported or automated by system functions. But even if the approach is process driven the first step is not the definition of processes and contained business activities. The very first step is the definition of a first version of the business vocabulary5. In the most cases we can “inherit” a first version of the vocabulary. When you are dealing with logistics you will find in the internet, in dictionaries or textbooks terms used by all business people in this area. Each logistician will know what a container, a LCL container or a FCL container is. When you plan to organize a Service Desk you can look into the ITIL standard to derive basic terms and facts for your project. The vocabulary can be presented in the form of a glossary or – better – you follow the SBVR standard and define terms and facts. It is good practice to start early developing a vocabulary. You can avoid useless discussions and a lot of work in modeling and analyzing processes, rules and functions with a good vocabulary. The BCS Modeling Process follows an iterative approach. The vocabulary, the process model and other artifacts are not created in a “Big Bang”. First we contemplate a macro level view, a rough structure of the process or the definition of the most important concepts. Than we refine this, e.g. to the sub process level and later to the detail level, e.g. the task level. You should avoid to use more than three detail levels. In the most cases it is too difficult to handle. Exceptions don’t proof this rule. They are just exceptions.
3.2.1 Identify Concepts You will find an abridged text sample used in our courses in annex A. It contains information about the business area “Service Desk” in a completely unstructured form. It contains information about goals, about the business process, about system functions, about implementation details, about stakeholder and constraints. We can use the techniques described earlier to identify concept of interest – classes, objects, actors, functions, goals, requirements, etc. The result will be a first collection of model elements. We have to evaluate these elements to match them with the appropriate cell in the Zachman Framework and with the appropriate detail level. That’s a typical but not an optimal approach to develop process and system models. The sample doesn’t show a good information collection. Obviously it was created with the pattern “Write down everything which comes to your mind about Service Desk!”. This is not a good idea. If we look for certain information we have to ask “targeted” questions. We ask “target questions” again. But this time we target to content not presentation elements. For a first step the following questions would be helpful: • Name the terms relevant for the application areas “Service Desk”. • Give a short definition for each term. In case we use an inherited vocabulary (e.g. from the ITIL standard) the following question is mandatory:
5 Participants of our courses know about the Bible story and know why you first define a vocabulary.
Textual Analysis and Visual Modeling
© Copyright 2009, BCS - Dr. Jürgen Pitschke Provided courtesy of BCS – Dr. Jürgen Pitschke Page 10
• Assign the terms to the given definitions. A very important add-on question is: • Name important alternative terms for this concept. Did you read the questions attentively? Did you recognize that the first question is not: • Name all terms relevant for the application areas “Service Desk”. The second question is aiming for a short definition. Have in mind that our modeling process is iterative. For the first step it is enough to have a definition of the most important term. For the sample “Service Desk” this are maybe the terms “Service”, “Incident”, “Problem”, “Change Request”, “Configuration Item”, “User”, “Service Desk Engineer”. For sure the business users will give you many more terms. Limit the number of terms in the first step. I have seen projects delivering approximately 30 pages filled with terms. Such projects get bogged down too often. Therefore a good modification of our question would be: • Name the most important (max. 20) terms relevant for the business area “Service
Desk”. Instead of 20 you can also ask for the 30 most important terms. 20 is a good number from our experiences. Often customers tell us that they have much more concepts. That is absolutely right. But we want to know the 20 most important concepts. If the customer insists that there are much more than 20 “most important” concepts than the first step – Define Scope – was not successful. I prefer a lower number of 10 to 15 terms in my projects exactly because of this reason. If you get much more concepts and all concepts are important and on the same level of detail – you should try to scope the business area better in the next iteration. The terms found will help you in this. We can now analyze the lists of terms and definition we got this way. This is not especially difficult. We follow Abbott’s original approach and differentiate proper nouns, describing individual concepts (e.g. Euro, Pound Sterling, US-Dollar) and common nouns, describing general concepts (e.g. currency). A big problem is often the use of synonyms. Different names are used for a single concept in daily practice. We have to trade off. We want to have only a few synonyms to reduce effort. At the same time we need to pay attention to the language used by the target audience. SBVR offers the concept of “Communities” which can help. Within a community we try to restrict the number of synonyms. The identified concepts can be presented as a glossary or as entries in a repository. This depends on the tools used to support our modeling process. 3.2.2 Building a Fact Model
A “Fact Model” is part of the vocabulary. The Fact Model is build using the identified terms. It shows relations or relationships between the terms. In other words: The Fact Model establishes the vocabulary. The Fact Model shows Fact Types (e.g. Country uses Currency) and Facts (Germany uses Euro). The next logical step in the textual analysis is the identification of Fact Types and Facts. This can happen together with the identification of Terms (Paragraph 3.2.1). I suggest to separate these steps if the term base is still instable and not very well established. In later iterations we will execute both steps together.
Textual Analysis and Visual Modeling
© Copyright 2009, BCS - Dr. Jürgen Pitschke Provided courtesy of BCS – Dr. Jürgen Pitschke Page 11
We extend the questionnaire for the following questions: • Name the relations between the concepts. • Give a short description of the relation. Ron Ross characterizes fact types as: „Fact types recognize what is possible to know, but given that, no other constraints.“6 We can see Facts and Fact Types also as results of business activities. E.g. we know a Fact Type “Service Desk Engineer is responsible for Incident”. Than we know that there must be a business activity creating this result. The Fact Model helps us to identify and structure business rules, business activities, business processes and system functions. That’s why creating a Fact Model based on Terms is a very essential first step. If we think about what is needed to produce the result “Service Desk Engineer is responsible for Incident” we will find the following business activities: • Classify the Incident (Classify means assigning the Incident to a main category, e.g.
Hardware) • Search an available Service Desk Engineer who has knowledge about the Incident
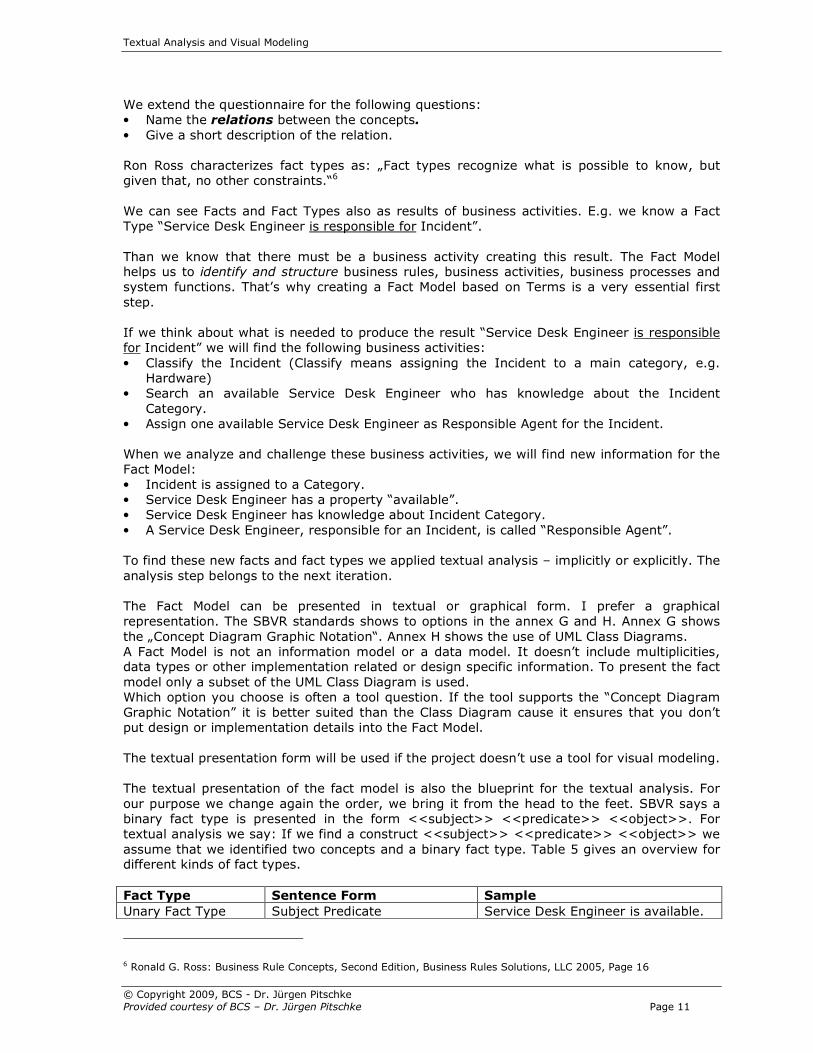
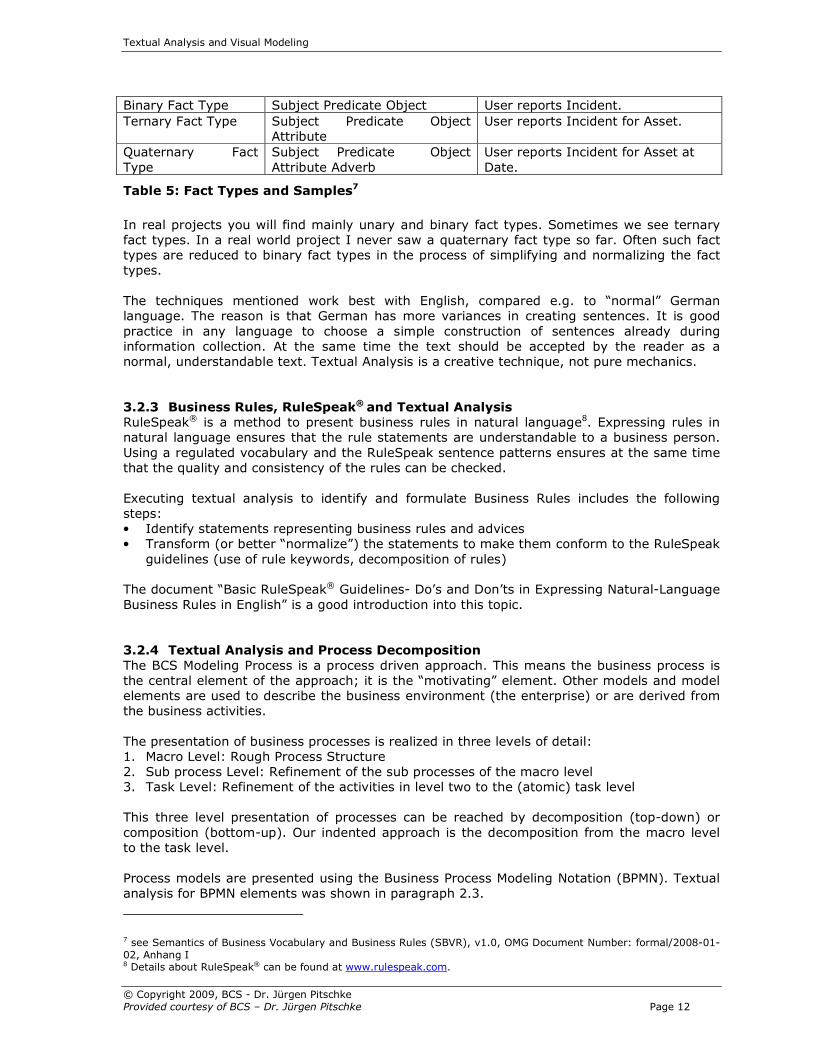
Category. • Assign one available Service Desk Engineer as Responsible Agent for the Incident. When we analyze and challenge these business activities, we will find new information for the Fact Model: • Incident is assigned to a Category. • Service Desk Engineer has a property “available”. • Service Desk Engineer has knowledge about Incident Category. • A Service Desk Engineer, responsible for an Incident, is called “Responsible Agent”. To find these new facts and fact types we applied textual analysis – implicitly or explicitly. The analysis step belongs to the next iteration. The Fact Model can be presented in textual or graphical form. I prefer a graphical representation. The SBVR standards shows to options in the annex G and H. Annex G shows the „Concept Diagram Graphic Notation“. Annex H shows the use of UML Class Diagrams. A Fact Model is not an information model or a data model. It doesn’t include multiplicities, data types or other implementation related or design specific information. To present the fact model only a subset of the UML Class Diagram is used. Which option you choose is often a tool question. If the tool supports the “Concept Diagram Graphic Notation” it is better suited than the Class Diagram cause it ensures that you don’t put design or implementation details into the Fact Model. The textual presentation form will be used if the project doesn’t use a tool for visual modeling. The textual presentation of the fact model is also the blueprint for the textual analysis. For our purpose we change again the order, we bring it from the head to the feet. SBVR says a binary fact type is presented in the form <<subject>> <<predicate>> <<object>>. For textual analysis we say: If we find a construct <<subject>> <<predicate>> <<object>> we assume that we identified two concepts and a binary fact type. Table 5 gives an overview for different kinds of fact types.
Fact Type Sentence Form Sample
Unary Fact Type Subject Predicate Service Desk Engineer is available.
6 Ronald G. Ross: Business Rule Concepts, Second Edition, Business Rules Solutions, LLC 2005, Page 16
Textual Analysis and Visual Modeling
© Copyright 2009, BCS - Dr. Jürgen Pitschke Provided courtesy of BCS – Dr. Jürgen Pitschke Page 12
Binary Fact Type Subject Predicate Object User reports Incident.
Ternary Fact Type Subject Predicate Object Attribute
User reports Incident for Asset.
Quaternary Fact Type
Subject Predicate Object Attribute Adverb
User reports Incident for Asset at Date.
Table 5: Fact Types and Samples7
In real projects you will find mainly unary and binary fact types. Sometimes we see ternary fact types. In a real world project I never saw a quaternary fact type so far. Often such fact types are reduced to binary fact types in the process of simplifying and normalizing the fact types. The techniques mentioned work best with English, compared e.g. to “normal” German language. The reason is that German has more variances in creating sentences. It is good practice in any language to choose a simple construction of sentences already during information collection. At the same time the text should be accepted by the reader as a normal, understandable text. Textual Analysis is a creative technique, not pure mechanics.
3.2.3 Business Rules, RuleSpeak® and Textual Analysis
RuleSpeak® is a method to present business rules in natural language8. Expressing rules in natural language ensures that the rule statements are understandable to a business person. Using a regulated vocabulary and the RuleSpeak sentence patterns ensures at the same time that the quality and consistency of the rules can be checked. Executing textual analysis to identify and formulate Business Rules includes the following steps: • Identify statements representing business rules and advices • Transform (or better “normalize”) the statements to make them conform to the RuleSpeak
guidelines (use of rule keywords, decomposition of rules) The document “Basic RuleSpeak® Guidelines- Do’s and Don’ts in Expressing Natural-Language Business Rules in English” is a good introduction into this topic. 3.2.4 Textual Analysis and Process Decomposition
The BCS Modeling Process is a process driven approach. This means the business process is the central element of the approach; it is the “motivating” element. Other models and model elements are used to describe the business environment (the enterprise) or are derived from the business activities. The presentation of business processes is realized in three levels of detail: 1. Macro Level: Rough Process Structure 2. Sub process Level: Refinement of the sub processes of the macro level 3. Task Level: Refinement of the activities in level two to the (atomic) task level This three level presentation of processes can be reached by decomposition (top-down) or composition (bottom-up). Our indented approach is the decomposition from the macro level to the task level. Process models are presented using the Business Process Modeling Notation (BPMN). Textual analysis for BPMN elements was shown in paragraph 2.3.
7 see Semantics of Business Vocabulary and Business Rules (SBVR), v1.0, OMG Document Number: formal/2008-01-02, Anhang I 8 Details about RuleSpeak® can be found at www.rulespeak.com.

Textual Analysis and Visual Modeling
© Copyright 2009, BCS - Dr. Jürgen Pitschke Provided courtesy of BCS – Dr. Jürgen Pitschke Page 13
We will change the approach again to be more goal-oriented. We ask for content not for model elements. We identify the model elements in the following order in our projects: • General participants in the process (presented by pools) • Roles (presented by lanes) • Process events, Milestones (presented by start, intermediate and end events) • Business Activities (presented by sub processes and tasks) • Order (sequence flow) of Business Activities, including alternative, parallel and optional
flows (presented by sequence flows and gateways) • Information Exchange and Interfaces between Process Participants (presented by message
flows) • Information Objects (presented by data objects). Version 2 of BPMN which will be available shortly contains new diagram types and model elements. Many new elements are especially targeted to improve the implementation level modeling. But many new elements are also interesting for the business view. Especially better options to model the information exchange will be important for the business modeler. Our approach will be adapted to these changes and will enhance the presentation of information exchange between process participants. For the moment we stay with the content named and with BPMN 1.2. The order of the content in the list above is not a coincidence. Because of theoretical and practical reasons this approach has been proven to help to get a well structured and maintainable process model. Our questionnaire for information collection for process modeling related to a process under investigation has the following content: • What is the benefit of the process for the customer of the process? What is the intended
result of the process? • Name the process participants. • Classify the participant for internal or external participants. • Name roles9 within the internal participants. • Which business events cause the process to start? • Which business events represent reaching the intended result of the process? • Are there important milestones within the process? • What are the activities within the process? • Assign the activities to the process phases: Which activities are executed between start
and milestone 1, between milestone 1 and 2 … • Give a short description of the activities. What is the expected result of the activity10? • Which preconditions exist for the execution of the activity? Which exceptions can occur
during execution of the activity? • Which information objects is needed to execute the activity? Which information objects are
changed or produced by the activity? We will define guidelines how many activities we want to see in our process model depending on the detail level (macro process level, sub process level, task level). E.g. for the macro level the guideline is to name not more than 10 sub processes. Tasks are not allowed on the macro process level. There are strong logical connections between the questions visible. To name roles it is very helpful to know and classify activities within the process. I point again to our iterative approach. The order of the questions is not a dogma.
9 This question assumes a common understanding of the term „Role“. This is not discussed here. 10 We see a strong connection to the fact model. The result must be presented in the fact model.

Textual Analysis and Visual Modeling
© Copyright 2009, BCS - Dr. Jürgen Pitschke Provided courtesy of BCS – Dr. Jürgen Pitschke Page 14
Textual Analysis and Visual Modeling
© Copyright 2009, BCS - Dr. Jürgen Pitschke Provided courtesy of BCS – Dr. Jürgen Pitschke Page 15
4 How Textual Analysis Really Works
In chapter 2 and 3 we pretended to identify model elements directly. That’s not true in practice. The principal approach is: 1. Identify candidates for model elements 2. Evaluate the element candidates 3. Create a model element for relevant candidates What we saw in chapter 2 and 3 covers the first point. With the techniques we identified candidates for model content. We asked targeted questions and analyzed the information. What I said in the beginning is also true for step 2: Every modeler is doing this step. Often only in his head. The evaluation criteria is often not defined, the result is often not documents. For sure – the tool question is important here again. Only a few tools support the documentation of the modeling process in an easy way.
4.1 Evaluation of Candidate Objects for Model Content
We evaluate the candidate by quantity and quality. Quantitative evaluation uses statistical information. How often was the concept named in our information collection? Was it named by many different people? If a concept is named quite often we assume it is more relevant than others, named less often. But looking for quantity only would not be sufficient. Maybe a concept was named only a few times because only a few people are familiar with this concept. Maybe the workshop or the questionnaire was poorly prepared and we asked suggestive questions. The answers were guided into a single direction than. We have to look for a qualitative evaluation too. For this we need to analyze the context for each concept. E.g. a concept was named only a few times. But it is related to an important concept named very often. So it is possibly relevant for our project. We anticipated a valuation formulating our questionnaires. We asked e.g. for the most important concepts. We excluded other concepts doing this. There is a risk that we don’t find all concepts important for our project. Our modeling process needs to address this risk explicitly. Our iterative approach is well suited for this. We saw in paragraph 3.2.2 that a refinement of the process model causes also a refinement of the fact model. We will apply our questionnaire again in the decomposition of the macro process. But the questionnaire will be extended and precised cause we are working now on a finer detail level. The questions will be rephrased targeted to the content and concepts of the detail level. We also give more freedom to the business user to provide additional information important in his opinion. This information is important for the qualification of the element candidates.
Textual Analysis and Visual Modeling
© Copyright 2009, BCS - Dr. Jürgen Pitschke Provided courtesy of BCS – Dr. Jürgen Pitschke Page 16
4.2 Language and Textual Analysis
A problem in textual analysis is the use of different terms for the same concept (see 3.2.2). To overcome this issue we will formalize the collected information. First we will replace synonyms by terms we defined as the main terms for our project. We rephrase the collected information to support statistical and qualitative evaluation of the identified element candidates. This includes unification of the used verbs. They should correspond to the fact types in the fact model. Tools often have a problem handling different verb forms. Usually English is easier to handle for textual analysis compared to German. When we rephrase parts of the information we have to make sure that the text is still accepted and understood by the business user and we have to ensure traceability to the original information.
Textual Analysis and Visual Modeling
© Copyright 2009, BCS - Dr. Jürgen Pitschke Provided courtesy of BCS – Dr. Jürgen Pitschke Page 17
5 Tool Support for Textual Analysis
Having a tool supporting textual analysis improves acceptance within the modeling team a lot. Some modeling tools as Visual Paradigm support textual analysis as a working technique. Especially the option to connect the result of textual analysis with artifacts derived from the candidate elements allows traceability back to the original information. Most often not all aspects discussed in this paper are covered. Business users often use Microsoft Word as the text processor to capture information. Add-Ins allowing the transformation of text into model information would make a lot of sense. EssWork from Ivar Jacobson International is following this path. An evaluation of tools with regard of the support for textual analysis is not content of this paper.

Textual Analysis and Visual Modeling
© Copyright 2009, BCS - Dr. Jürgen Pitschke Provided courtesy of BCS – Dr. Jürgen Pitschke Page 18
6 Summary
“Textual Analysis” is a working technique supporting the systematic development of models. Applying such working techniques makes modeling an engineering discipline which is repeatable and planable. The basic assumption for textual analysis is that model elements are derived from natural language statements. Models need to be translated back into natural language cause the main purpose of business models is the communication between business users and between business user and other project team members. With Abbott’s original approach it is possible to identify some simple model elements. To value identified content, to recognize relationships between concept, and to derive mode complex concepts we need to analyze complete sentence statements. Approaches as target questions or RuleSpeak® meet these concerns. We need to change Abbot’s approach by looking for content elements instead of presentation elements. Tool support for textual analysis is often limited to some model elements.
Textual Analysis and Visual Modeling
© Copyright 2009, BCS - Dr. Jürgen Pitschke Provided courtesy of BCS – Dr. Jürgen Pitschke Page 19
Literature
Ross, Ronald G., Principles of the Business Rule Approach, Addison-Wesley, 2003 Ross, Ronald G., Business Rule Concepts, Second Edition, Business Rule Solutions, LLC, 2005 Zachman, John F., John Zachman, The Zachman Framework For Enterprise Architecture: Primer for Enterprise Engineering and Manufacturing, Zachman International, 2006, Electronic Book Ross, R., Pitschke, J., RuleSpeak® Satzformen, Business Rules in natürlich sprachlichem Deutsch spezifizieren, Business Rules Solutions, LLC und BCS, Dr. Jürgen Pitschke, Version 1.1, 2009 Ross, R., Pitschke, J., RuleSpeak® Guidelines- Grundlagen Geschäftsregeln in natürlich sprachlichem Deutsch darstellen – was man tun sollte und was nicht, Business Rules Solutions, LLC und BCS, Dr. Jürgen Pitschke, Version 1.1, 2009 Pitschke, J., RuleSpeak® - Kommentare zu den Basisdokumenten, BCS, Dr. Jürgen Pitschke, Version 1.1, 2009 Abbott, Russel J., An Integrated Approach to Software Development, John Wiley & Sons, 1986 Dué, Richard T., Mentoring Object Technology Projects, Prentice Hall, 2002
Textual Analysis and Visual Modeling
© Copyright 2009, BCS - Dr. Jürgen Pitschke Provided courtesy of BCS – Dr. Jürgen Pitschke Page 20
Annex A: Sample Service Desk
Unsorted Information Collection (Abridged)
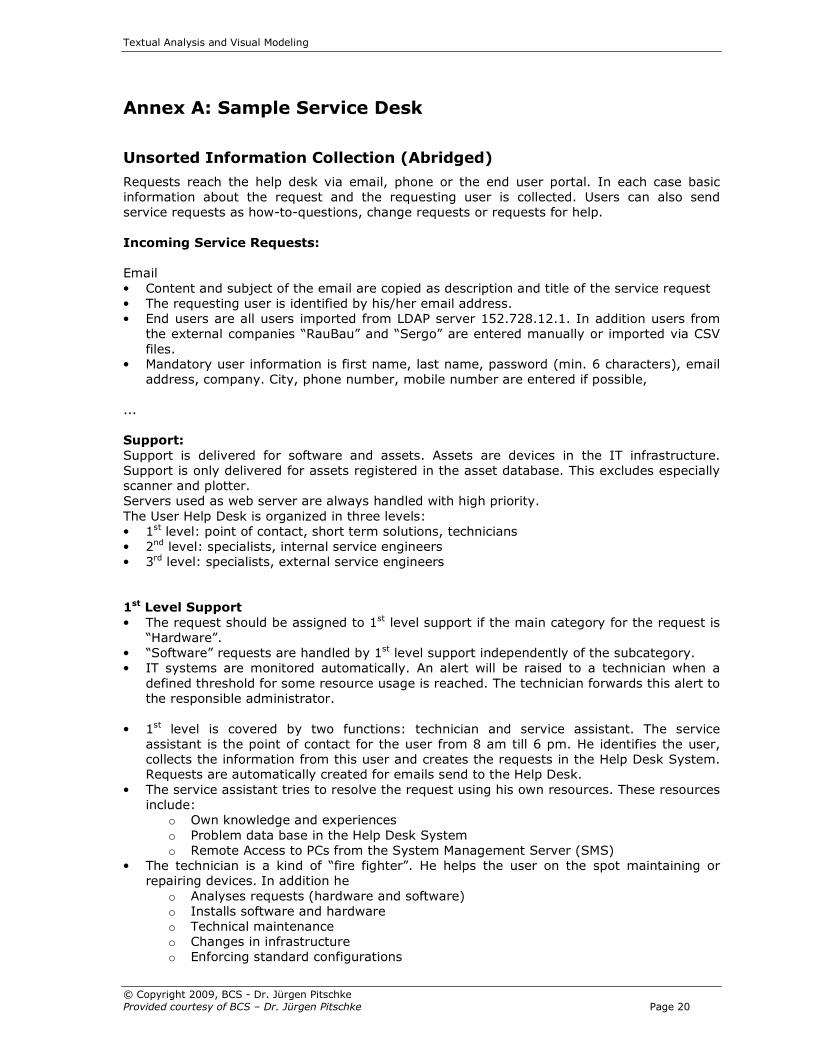
Requests reach the help desk via email, phone or the end user portal. In each case basic information about the request and the requesting user is collected. Users can also send service requests as how-to-questions, change requests or requests for help. Incoming Service Requests:
Email • Content and subject of the email are copied as description and title of the service request • The requesting user is identified by his/her email address. • End users are all users imported from LDAP server 152.728.12.1. In addition users from
the external companies “RauBau” and “Sergo” are entered manually or imported via CSV files.
• Mandatory user information is first name, last name, password (min. 6 characters), email address, company. City, phone number, mobile number are entered if possible,
...
Support:
Support is delivered for software and assets. Assets are devices in the IT infrastructure. Support is only delivered for assets registered in the asset database. This excludes especially scanner and plotter. Servers used as web server are always handled with high priority. The User Help Desk is organized in three levels: • 1st level: point of contact, short term solutions, technicians • 2nd level: specialists, internal service engineers • 3rd level: specialists, external service engineers
1st Level Support
• The request should be assigned to 1st level support if the main category for the request is “Hardware”.
• “Software” requests are handled by 1st level support independently of the subcategory. • IT systems are monitored automatically. An alert will be raised to a technician when a
defined threshold for some resource usage is reached. The technician forwards this alert to the responsible administrator.
• 1st level is covered by two functions: technician and service assistant. The service assistant is the point of contact for the user from 8 am till 6 pm. He identifies the user, collects the information from this user and creates the requests in the Help Desk System. Requests are automatically created for emails send to the Help Desk.
• The service assistant tries to resolve the request using his own resources. These resources include:
o Own knowledge and experiences o Problem data base in the Help Desk System o Remote Access to PCs from the System Management Server (SMS)
• The technician is a kind of “fire fighter”. He helps the user on the spot maintaining or repairing devices. In addition he
o Analyses requests (hardware and software) o Installs software and hardware o Technical maintenance o Changes in infrastructure o Enforcing standard configurations
Textual Analysis and Visual Modeling
© Copyright 2009, BCS - Dr. Jürgen Pitschke Provided courtesy of BCS – Dr. Jürgen Pitschke Page 21
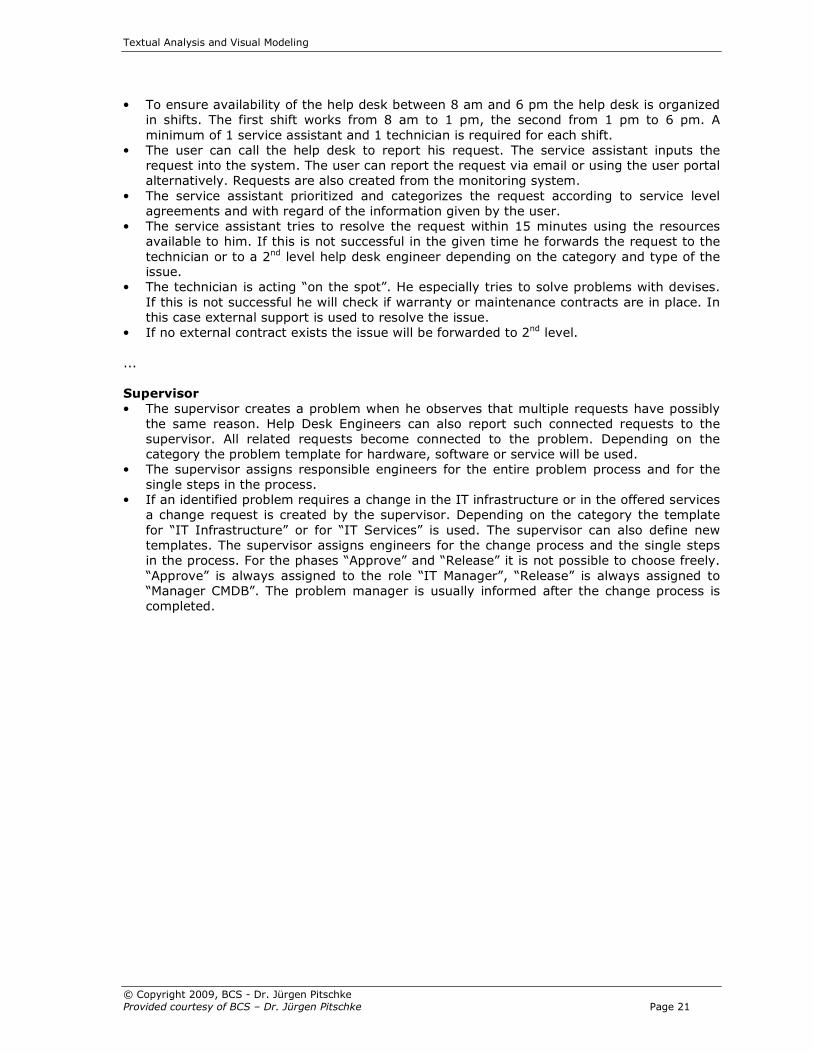
• To ensure availability of the help desk between 8 am and 6 pm the help desk is organized in shifts. The first shift works from 8 am to 1 pm, the second from 1 pm to 6 pm. A minimum of 1 service assistant and 1 technician is required for each shift.
• The user can call the help desk to report his request. The service assistant inputs the request into the system. The user can report the request via email or using the user portal alternatively. Requests are also created from the monitoring system.
• The service assistant prioritized and categorizes the request according to service level agreements and with regard of the information given by the user.
• The service assistant tries to resolve the request within 15 minutes using the resources available to him. If this is not successful in the given time he forwards the request to the technician or to a 2nd level help desk engineer depending on the category and type of the issue.
• The technician is acting “on the spot”. He especially tries to solve problems with devises. If this is not successful he will check if warranty or maintenance contracts are in place. In this case external support is used to resolve the issue.
• If no external contract exists the issue will be forwarded to 2nd level. ...
Supervisor
• The supervisor creates a problem when he observes that multiple requests have possibly the same reason. Help Desk Engineers can also report such connected requests to the supervisor. All related requests become connected to the problem. Depending on the category the problem template for hardware, software or service will be used.
• The supervisor assigns responsible engineers for the entire problem process and for the single steps in the process.
• If an identified problem requires a change in the IT infrastructure or in the offered services a change request is created by the supervisor. Depending on the category the template for “IT Infrastructure” or for “IT Services” is used. The supervisor can also define new templates. The supervisor assigns engineers for the change process and the single steps in the process. For the phases “Approve” and “Release” it is not possible to choose freely. “Approve” is always assigned to the role “IT Manager”, “Release” is always assigned to “Manager CMDB”. The problem manager is usually informed after the change process is completed.
Textual Analysis and Visual Modeling
© Copyright 2009, BCS - Dr. Jürgen Pitschke Provided courtesy of BCS – Dr. Jürgen Pitschke Page 22
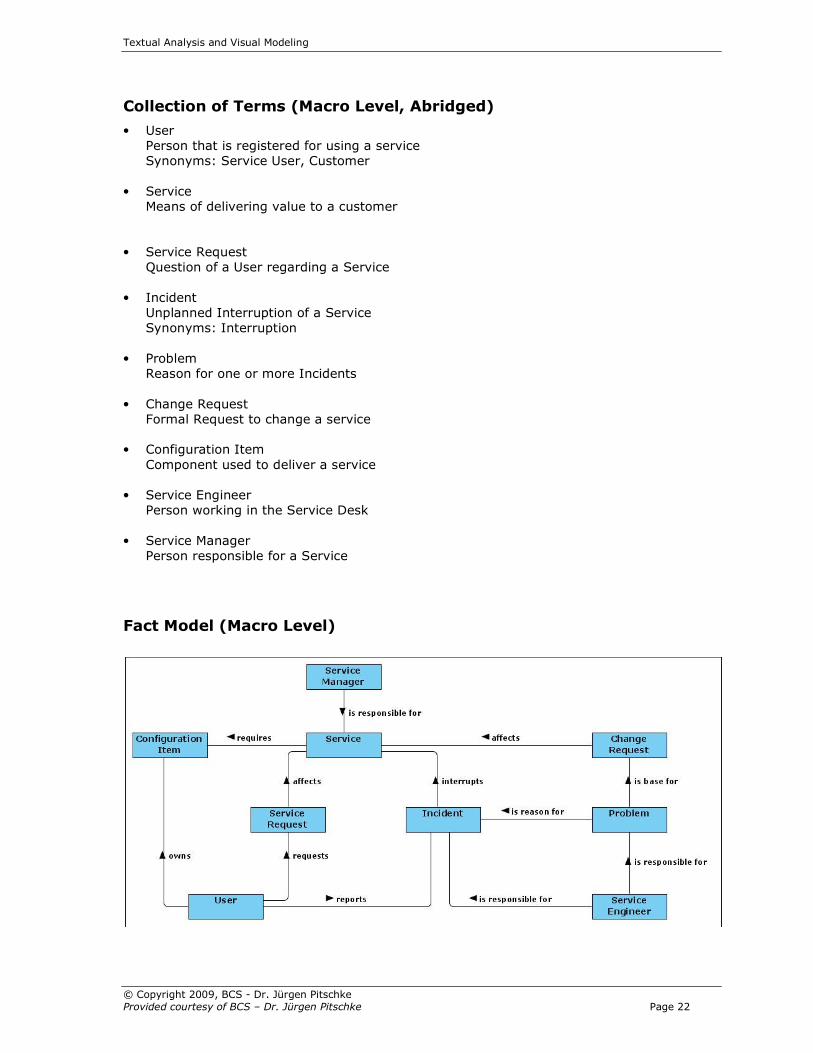
Collection of Terms (Macro Level, Abridged)
• User Person that is registered for using a service Synonyms: Service User, Customer
• Service
Means of delivering value to a customer
• Service Request Question of a User regarding a Service
• Incident
Unplanned Interruption of a Service Synonyms: Interruption
• Problem Reason for one or more Incidents
• Change Request
Formal Request to change a service • Configuration Item
Component used to deliver a service
• Service Engineer Person working in the Service Desk
• Service Manager Person responsible for a Service
Fact Model (Macro Level)
Textual Analysis and Visual Modeling
© Copyright 2009, BCS - Dr. Jürgen Pitschke Provided courtesy of BCS – Dr. Jürgen Pitschke Page 23
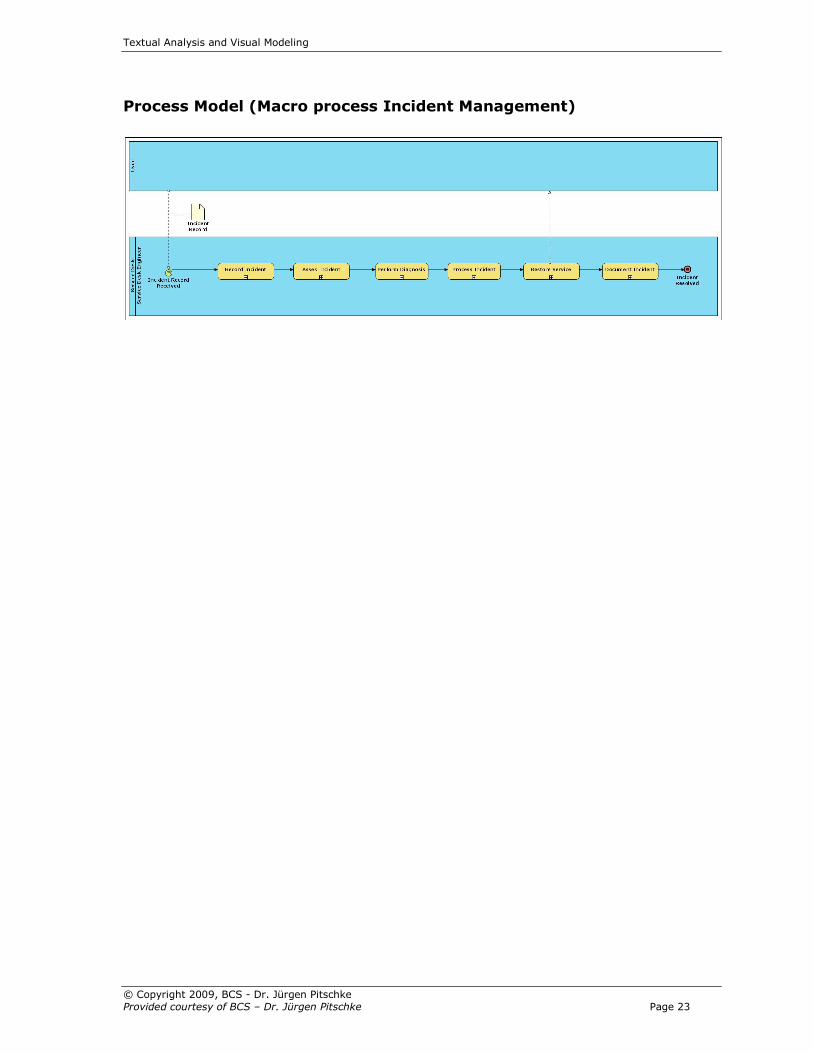
Process Model (Macro process Incident Management)