Textile and Wearing Apparel Sector Liberalization ... important because the CEEC as well as Turkey...
14
1 Textile and Wearing Apparel Sector Liberalization - Consequences for the Bangladesh Economy 6 th Conference on Global Economic The Hague, The Netherlands, June 12 – 14, 2003 April 2003 Markus Lips*, Andrzej Tabeau*, Frank van Tongeren*, Nazneen Ahmed** and Claudia Herok*** 1 Abstract This paper analyzes the impact of the Agreement on Textile and Clothing (ATC) and a worldwide tariff reduction on textiles and wearing apparels on Bangladesh. In both scenarios Bangladesh reduces its wearing apparel production and faces a welfare loss. The main reason is that Bangladesh has free access to its most important export market, the EU. Further trade liberalizations are therefore worsening the Bangladeshi position opposite to its competitors. The analysis stands on the general equilibrium model of the Global Trade Analysis Project (GTAP). 1 We would like to thank Hajo Provo-Kluit from the Dutch Embassy in Bangladesh as well as Evelyn Heinel and Robert Light from the European Commission for their assistance. * Agricultural Economics Research Institute (LEI), Burgemeester Patijnlaan 19, Postbus 29703, 2502 LS Den Haag, The Netherlands, [email protected] ** Bangladesh Institute of Development Studies (BIDS), E-17 Agargaon, Sher-e-Bangla Nagar, 1207 Dhaka, Bangladesh *** Federal Ministry of Education and Research, Bonn, Germany
Transcript of Textile and Wearing Apparel Sector Liberalization ... important because the CEEC as well as Turkey...

1
Textile and Wearing Apparel Sector Liberalization - Consequences for the Bangladesh Economy
6th Conference on Global Economic The Hague, The Netherlands, June 12 – 14, 2003
April 2003
Markus Lips*, Andrzej Tabeau*, Frank van Tongeren*, Nazneen Ahmed** and Claudia Herok***1
Abstract
This paper analyzes the impact of the Agreement on Textile and Clothing (ATC) and
a worldwide tariff reduction on textiles and wearing apparels on Bangladesh. In both
scenarios Bangladesh reduces its wearing apparel production and faces a welfare loss.
The main reason is that Bangladesh has free access to its most important export
market, the EU. Further trade liberalizations are therefore worsening the Bangladeshi
position opposite to its competitors.
The analysis stands on the general equilibrium model of the Global Trade Analysis
Project (GTAP).
1 We would like to thank Hajo Provo-Kluit from the Dutch Embassy in Bangladesh as well as Evelyn Heinel and Robert Light from the European Commission for their assistance.
* Agricultural Economics Research Institute (LEI), Burgemeester Patijnlaan 19, Postbus 29703, 2502 LS Den Haag, The Netherlands, [email protected]
** Bangladesh Institute of Development Studies (BIDS), E-17 Agargaon, Sher-e-Bangla Nagar, 1207 Dhaka, Bangladesh
*** Federal Ministry of Education and Research, Bonn, Germany

2
1 Introduction Since the 1980s the export oriented wearing apparel sector of Bangladesh has
experienced an extraordinary evolution: Having started with 9 enterprises in the late
seventies, the number has now grown to over 30002. This trend was accompanied by a
tremendous rise in the export share from 0.2 percent in 1980 to nearly 75 percent in
1997-98.
The main policy framework is given by the WTO’s Agreement on Textiles and
Clothing (ATC). The ATC was decided in the Uruguay Round and has replaced the
Multifiber Agreement (MFA) in 1995. The ATC includes the phase-out of export
quantities restrictions of textile and wearing apparels. By December 31st, 2004, all
quota restrictions will be abolished. The phase-out of export quotas has been widely
analyzed in different studies (Hertel et al., 1996; Yang et al., 1997; Bach et al., 1997;
Diao and Somwaru, 2001). They all conclude that world trade and welfare increase
and consumer price decline.
In spite of the prediction for a world welfare gain, it is not straightforward for all the
countries. It has already been noted that the benefit for South Asian countries depends
on how severe the export restrictions are (Yang et al., 1997). Islam (2001) points out
that export quotas are lower for Bangladesh, Pakistan and Nepal than for China and
India, which means that under a quota free regime, Bangladesh will face
comparatively greater competition from China and India. Bhattacharya and Rahman
(2001), Zohir (2001) as well as Dowlah (1999) are convinced that the survival of the
wearing industry in Bangladesh depends on the development of strong cost effective
backward linkages and product and market diversification. Furthermore, maintenance
of labor standards and improvement of labor productivity and quality of products
deserve considerable attention.
This paper analyzes the impacts of the ATC, more specifically, quota phase out under
ATC, on Bangladesh. In addition, we analyze an import tariff reduction for textile and
wearing apparel as a result of the ongoing WTO Doha Round. Our analysis stands on
various policy simulations applying the general equilibrium model of the Global
Trade Analysis Project (GTAP, Hertel, 1997).
The paper is organized as follows: We discuss the used data aggregation as well as the
definitions of the scenarios in section two. For the modeling of import tariff
2 The number has decreased during the last year.

3
reductions in Bangladesh a change of the model is necessary, which is described in
section three. The results are presented in section four, while the conclusions are
drawn in the last section.
2 Data and Scenarios We apply the version 5.1 of the GTAP database, which refers to the year 1997
(Dimaranan and McDougall, 2002). For the analysis we employ an aggregation with
14 regions and 12 sectors. They are presented in the Tables 1 and 2 respectively.
Table 1: Regions Region Description Bangladesh India Sri Lanka rSAFTA Rest of South Asian Free Trade Association (Bhutan, Maldives, Nepal, Pakistan) China China and Hong Kong hASIA Japan, Korea, Singapore, Taiwan oASIA Indonesia, Malaysia, Philippines, Thailand, Vietnam EU EU-15 CEEC Hungary, Poland, Rest of Central and Eastern European Countries Turkey USA Canada cAMERICA Mexico, Central America and Caribbean ROW Rest of the World
Besides Bangladesh our aggregation includes India and Sri Lanka, two other countries
of the South Asian Free Trade Association (SAFTA). All other member countries are
in the region “rSAFTA”. While China and Hong Kong build an own region the rest of
the Asian countries are distinguished between high income countries “hASIA” and
others “oASIA”. The EU, the USA and Canada are important textile importers. The
Central and Eastern European Countries (“CEEC”) and Turkey are important due to
the Eastern Enlargement of the EU respectively the preferential access to the EU.
For our analysis all textile related sectors like plant based fibers (“Fibres)”,
“Textiles”, “Wearing apparel” and “Leather products” are crucial. The sector “Rice”
includes the production of paddy rice as well as the rice processing. All non-rice
grains are in the sector “Grains”, while all other agricultural activities are included
into the sector “rAGR”. The sector “Food” covers the whole food processing without

4
processed rice. Forestry, fishing and extraction activities are in the sector “Extract”.
The manufacturing is split into a labor intensive (“LiMANF”) and capital intensive
(“CiMANF”) sector. The last sector includes all services.
Table 2: Sectors
Sector Description Rice Paddy Rice and processed Rice Grains Non Rice Grains Fibers Plant-based Fibers rAGR Rest of Agriculture (Oil Seeds, Sugar Beet, Cattle, Pig and Poultry, Milk) Food Processed Food without processed Rice Textiles Wearing apparel Leather products Extract Fishing, Forestry, Coal, Oil, Gas, Minerals LiMANF Labor intensive Manufactures CiMANF Capital intensive Manufactures Services Services
We define two scenarios (Table 3). The base scenario revealed the implementation of
the Agreement on Textiles and Clothing (ATC). It includes a complete phase-out of
quantitative restrictions on textiles and wearing apparel. The export quotas,
respectively the quota rents are included as export tariff equivalents in the GTAP5
database (Francois and Spinanger, 2002). Eliminating export quotas in the simulation
means that the export tariff equivalents are completely dismissed. In 1997 the
Bangladeshi export quotas to the EU have not anymore existed. Furthermore,
Bangladeshi imports in the EU face no import tariffs3. Although the GTAP database
includes both, export tariff equivalents and import tariffs for Bangladeshi textile
exports to the EU, we do not change them in our simulation. Since the EU is the most
important importer of Bangladeshi textile and wearing apparel both matters of fact
have a huge impact on our analysis.
Besides the ATC the base scenario includes some further changes. The accession of
China to the WTO implies import tariff reduction for China in order to respect the
Most Favorite Nation clause. We consider such tariff reduction for two products:
textiles and wearing apparel. Furthermore, the base scenario includes Eastern
Enlargement of the EU as well as a preferential trade agreement with Turkey. That is
3 We assume that the rule of origin for textiles as well as the export license for textile and clothing products, which are falling under the surveillance system, have just an administrative nature.

5
important because the CEEC as well as Turkey are exporting wearing apparel to the
EU.
Table 3: Scenarios4 Scenario Base Agreement on Textile and Clothing (ATC)
WTO Accession of China for Sectors TEX and WAP EU Eastern Enlargement (No Tariffs between EU and CEEC) Preferential Agreement EU - Turkey
WTO Base Scenario + Worldwide Import Tariff Reduction of 36 percent for TEX and WAP
In the WTO scenario we simulate a worldwide import tariff reduction of 36 percent
for textiles and wearing apparel, as it is a possible outcome of the on-going Doha
Round of the WTO. The WTO scenario includes also all changes of the base scenario.
3 Model The analysis is carried out with the comparative static general equilibrium model of
the Global Trade Analysis Project (GTAP, Hertel, 1997).
The tariff reduction in the WTO scenario has also to be applied for textiles and
wearing apparel imports of Bangladesh. A simple import tariff reduction cannot be
adopted, since Bangladesh applies the Duty Drawback regime (DD)5. Ianchovichina
(2003) provides an approach to depict DD in the GTAP model. Therefore, the
production of every sector is split into two sub sectors. One is only producing for
domestic use while the other produces exported goods. The approach requires a
substantial change of the GTAP standard model. Since we need the depiction of the
DD regime just for two sectors of one particular region, we apply another approach.
4 In a related paper (Lips M., Tabeau A. and van Tongeren F. (2003). Multilateral and Regional Trade Agreements: Options for Bangladesh) the base scenario is similar, except the presence of economies of scale. 5 Under various export incentive programs, inputs used for exported goods are disburdened from paying import tariffs. Such incentives are available mainly for export-oriented firms (exporting at least 70 percent of their production) of important export goods including wearing apparel. Two of the most important incentives in Bangladesh are DD facility and Bonded Warehouse Facility (BWF). Under the DD, the exporters are refunded not only the duties paid on the imported inputs but also the value added tax paid on domestic inputs used in the production of the exports. The BWF is even more profitable for exporters. Under this system a firm can delay the payments of duties until they are ready to consume raw materials imported earlier and if theses raw materials are used for producing export goods then they are not required to pay the duty. It implies that the firms do not require capital to finance import tariffs.

6
DD means that only domestic consumers have to pay tariffs on imported textiles and
wearing apparel. In the GTAP model all consumers of a region build the private
household. In Figure 1 the values of textile and wearing apparel imports are included.
While textiles for $ 1913 million are imported, $ 739 million worth of textiles go
directly to the private household (GTAP 5 database). $ 573 million and $ 564 million
are used as inputs in the textile and wearing apparel sectors respectively. The textile
sector delivers $ 1633 million directly to the private household. The private household
is buying domestic wearing apparel for $ 329 million6.
Figure 1: Consumer Subsidy for the Private Household
Consumer Subsidy
1633
739 32
Private Household
Textiles Values in Million $:
Wearing Apparel
Imports
329
573
5641
1913 33
Sector Wearing Apparel
Sector Textile
Instead of reducing import tariffs we introduce a virtual consumer subsidy for the
private household. The subsidy leads to price decrease for the private household,
which is an imitation of a tariff reduction under the DD regime. Since domestic
products also include imported imports there is a subsidy for both domestic and
imported textiles and wearing apparels. The corresponding flows are marked with a
circle in Figure 1.
To connect the import tariffs and the virtual consumer subsidies in the GTAP model
we introduce the coefficient TN_L(r). It is the relation between consumer subsidies
and import tariffs in region r.
6 These numbers reveal that in value terms the domestic consumption of textile is much more important than that of wearing apparel.

7
∑∑
∑ ∑+= TEXTREG
TEXT TEXT
rsiMTAX
riIPTAXriDPTAXrLTN
),,(
),(),()(_ (1)
DPTAX(i,r) is the virtual consumer subsidy on the domestic good i in region r. The
virtual consumer subsidy on the imported good i in region r is denoted as IPTAX(i,r)7.
Both consumer subsidies are summed over all elements of the set TEXT. TEXT
contains two elements: textile and wearing apparel and is a subset of TRAD_COMM,
the set of the traded commodities. MTAX is the import tariff for good i, which is
exported from region s into region r. MTAX, has to be summed up for all elements of
the set TEXT as well as all origin regions s which are included in the set REG8. In the
database there are no consumer subsidies, hence all used DPTAX and IPTAX
coefficients have values nearly by zero.
Concerning the modeling we linearize the above equation (1), attending that the
consumer subsidies DPTAX and IPTAX has to be formulated as differences of agent
and market values9.
Since domestic textiles and wearing apparels includes a significant share of imported
inputs as shown in Figure 1 we assume that the subsidies on domestic and imported
goods are changing in the same way. Therefore, we introduce a new variable tz(r),
which indicates the percentage change of the consumer subsidies of imported as well
as domestic goods of the set TEXT. Looking at the modeling, we had to add two
equations for all goods i which belongs to the set TEXT:
tpd(i,r) = tz(r) (2)
tpm(i,r) = tz(r) (3)
While tpd(i,r) indicates the percentage change of the subsidy for the private household
of the domestic good i in region r, tpm(i,r) presents the referring percentage change of
7 Both consumer subsidies [DPTAX(i,r) and IPTAX(i,r)] can also serve as taxes, depending on their value. While a negative value is a subsidy a positive indicates a tax. 8 The set REG includes all regions (Table 1). 9 DPTAX(i,r) = VDPA(i,r) - VDPM(i,r) and IPTAX(i,r) = VIPA(i,r) - VIPM(i,r)

8
the imported good i10. As a consequence of the model change, the consumer taxes
tpd(i,r) and tpm(i,r) for textiles and wearing apparel cannot longer be given
exogenously to the model as it is the case in the GTAP standard model. In our
application they are endogenous while the change of TN_L(r) is exogenous11.
During the simulation for the WTO scenario the value of the coefficient TN_L is
exogenously changed towards –0.36 in order to offset 36 percent of the tariff by
consumer subsidies. The reason for the negative sign is the notation of the consumer
subsidies, which are denoted as negative values. A consumer tax would have a
positive value.
4 Results 4.1 Worldwide Results
The elimination of the export quotas and hence the quota rent lead to price decreases
of textiles and wearing apparel exports. The magnitude of the price decreases depend
on the fact how restrictive the quotas are and can be up to 30 percent (Base scenario).
India and China exports of wearing apparel increase largely, since they have the most
restrictive quotas (Figure 2).
Figure 2: Exported Value of Wearing Apparel in Bill. $
0
10
20
30
40
50
60
Bangla
desh
India
Sri Lan
ka
rSAFTA
China
hASIA
oASIA EU
CEECTurke
yUSA
Canada
cAMERIKA
ROW
Valu
e of
Wea
ring
App
arel
Exp
orts
in B
ill. $
1997Base ScenarioWTO Scenario
10 Capital letters indicate absolute values (like TN_L) lower case letters presents the referring percentage change. 11 In our case the set TEXT has two elements (textiles and wearing apparel). Looking at a particular region r, we totally add five equations to the model (linarized version of equation 1, equations 2 and 3. Accordingly, there are five new endogenous variables [tz(r), tpd(i,r), tpm(i,r)], while tn(r), the percentage change of the coefficient TN_L(r), is exogenous.

9
The production of wearing apparel increases by 107 percent in India and 29 percent in
China (Table 4). The increases are transferred to the domestic textile sectors, the most
important supplier of wearing apparel sector. Since in both countries the textile sector
is larger than the wearing apparel industry, the increases are smaller.
Table 4: Output Changes in Percent (Base Scenario)
Bang
la-
desh
Indi
a
Sri L
anka
rSA
FTA
Chi
na
hAS
IA
oAS
IA
EU
CE
EC
Turk
ey
US
A
Can
ada
cAM
ER
ICA
RO
W
Rice 0.0 -0.7 -0.0 -0.3 -0.3 0.0 -0.0 0.0 3.6 -1.7 0.5 0.6 0.2 0.2 Grains 2.6 -0.1 0.6 -0.2 -0.9 0.1 -0.0 0.6 -2.1 -1.3 0.1 0.3 0.4 0.1 Fibers 2.8 -0.5 0.6 0.7 7.5 1.2 0.2 -0.5 0.5 10.3 -1.7 0.1 -5.0 0.1 rAGR 0.4 -0.5 -0.2 0.1 -0.4 0.0 -0.0 0.2 -0.9 -1.2 0.1 0.2 0.5 0.0 Food 1.1 -2.8 -1.1 -0.9 -1.1 0.0 -0.1 0.1 0.7 -1.0 0.1 0.1 0.3 -0.0 Textiles 1.0 7.2 12.7 6.9 8.2 2.8 4.4 -3.3 3.8 21.7 -6.1 -9.5 -9.7 -2.0 Wearing Apparel -11.3 106.7 -2.4 -2.6 29.3 -1.7 1.2 -11.1 29.7 34.0 -16.8 -26.8 -27.5 -5.0 Leather Products 14.0 -19.5 4.1 -6.5 -5.4 1.0 0.5 2.3 10.1 -0.3 1.5 0.8 2.5 0.7 Extract 0.0 -2.8 -0.4 -0.7 -1.1 0.0 -0.1 -0.0 -2.6 -1.8 0.2 0.2 0.8 0.1 LiMANF 2.9 -3.4 -0.2 -0.8 -1.7 0.0 -0.2 0.3 -3.3 -3.8 0.1 0.3 1.3 0.1 CiMANF 4.8 -5.0 1.5 -1.3 -2.9 0.1 -0.3 0.3 -3.4 -0.3 0.6 0.6 4.1 0.4 Services -0.2 -0.2 -0.7 -0.3 -0.3 -0.0 -0.0 0.0 0.4 -0.1 0.0 0.1 0.0 0.0
The “enlargement” processes, i.e. the EU Eastern enlargement and the preferential
agreement between EU and Turkey cause large increases of the wearing apparel
sectors in the CEEC and Turkey. Both of them augment their production by at least 30
percent (Table 4). In Table 5 the quantity changes are assigned to the different parts of
base scenario12. It becomes clear that the main reason of the quantity changes is not
the ATC but rather the direct access to the EU (Table 5). The ATC has a negative
impact on both regions CEEC and Turkey. This leads to the conclusion that the
increases of wearing apparel production in India and China as a consequence of the
ATC go in line with a decrease in all other regions except oASIA, which shows a
modest increase.
12 Therefore, we apply the function subtotals of the Gempack software.

10
Table 5: Decomposition of Wearing Apparel Output Changes of CEEC and Turkey (Base Scenario)
ATC China
Accession EU
EnlargementEU Turkey Agreement
Total
China 31.0 0.5 -1.5 -0.8 29.3 CEEC -13.0 -0.1 46.2 -3.5 29.7 Turkey -12.5 -0.1 -5.2 51.9 34.0
The decomposition of the output change of China’s wearing apparel sector shows,
that the Chinese WTO accession has just a minor effect compared to the ATC (Table
5). The USA, Canada as well as Central America, face strong reductions (16.8
percent, 26.8 percent and 27.5 percent respectively, Table 4), while the production in
the EU is reduced by 11.1 percent.
A worldwide tariff reduction on textiles and wearing apparel (WTO scenario) increase
even more the wearing apparel production in India and China (Table 6). Increases can
also be observed in other Asian regions like Sri Lanka, rSAFTA and oASIA. The
CEEC and Turkey show reductions compared with the base scenario due to declines
of the exports to the EU. The reason is the tariff reduction in the EU for Asian
countries. Therefore, countries with a preferential treatment like the CEEC, Turkey
and Bangladesh face a harder competition.
Table 6: Output Changes in Percent (WTO Scenario)
Bang
la-
desh
Indi
a
Sri L
anka
rSA
FTA
Chi
na
hAS
IA
oAS
IA
EU
CE
EC
Turk
ey
US
A
Can
ada
cAM
ER
ICA
RO
W
Rice 0.0 -0.8 -0.2 -0.4 -0.4 0.0 -0.0 0.3 3.7 -1.6 0.8 0.8 0.3 0.3 Grains 2.7 -0.1 -3.7 -0.4 -1.2 0.0 -0.3 0.6 -1.9 -1.2 0.2 0.4 0.5 0.1 Fibers 3.2 -0.6 -3.5 0.6 8.7 2.4 0.2 -1.6 -1.3 9.4 -1.9 0.2 -5.6 -0.1 rAGR 0.4 -0.5 -1.1 0.1 -0.5 0.0 -0.1 0.3 -0.8 -1.2 0.2 0.3 0.6 0.1 Food 1.2 -3.1 -4.1 -1.3 -1.4 0.0 -0.3 0.1 0.9 -1.0 0.1 0.2 0.4 0.0 Textiles 1.3 7.8 13.4 7.8 9.6 9.0 10.1 -4.8 1.2 19.8 -8.0 -13.5 -11.1 -3.7 Wearing Apparel -11.4 118.2 24.3 3.9 41.1 -2.4 12.6 -15.0 18.8 29.9 -20.5 -34.2 -30.6 -6.2 Leather Products 14.4 -21.7 -16.2 -10.8 -6.8 1.0 3.7 2.4 11.3 -0.8 2.0 0.9 2.9 0.9 Extract -0.0 -3.2 -2.0 -1.1 -1.5 0.0 -0.3 0.0 -2.4 -1.6 0.2 0.3 0.9 0.2 LiMANF 3.1 -3.8 -4.5 -1.6 -2.4 -0.0 -0.7 0.4 -2.8 -3.6 0.2 0.4 1.4 0.2 CiMANF 5.1 -5.6 -12.5 -2.1 -3.9 -0.1 -1.3 0.5 -2.7 0.2 0.8 1.0 4.6 0.5 Services -0.2 -0.2 -1.1 -0.3 -0.3 -0.0 -0.1 0.0 0.4 -0.0 0.0 0.2 0.0 0.0
11
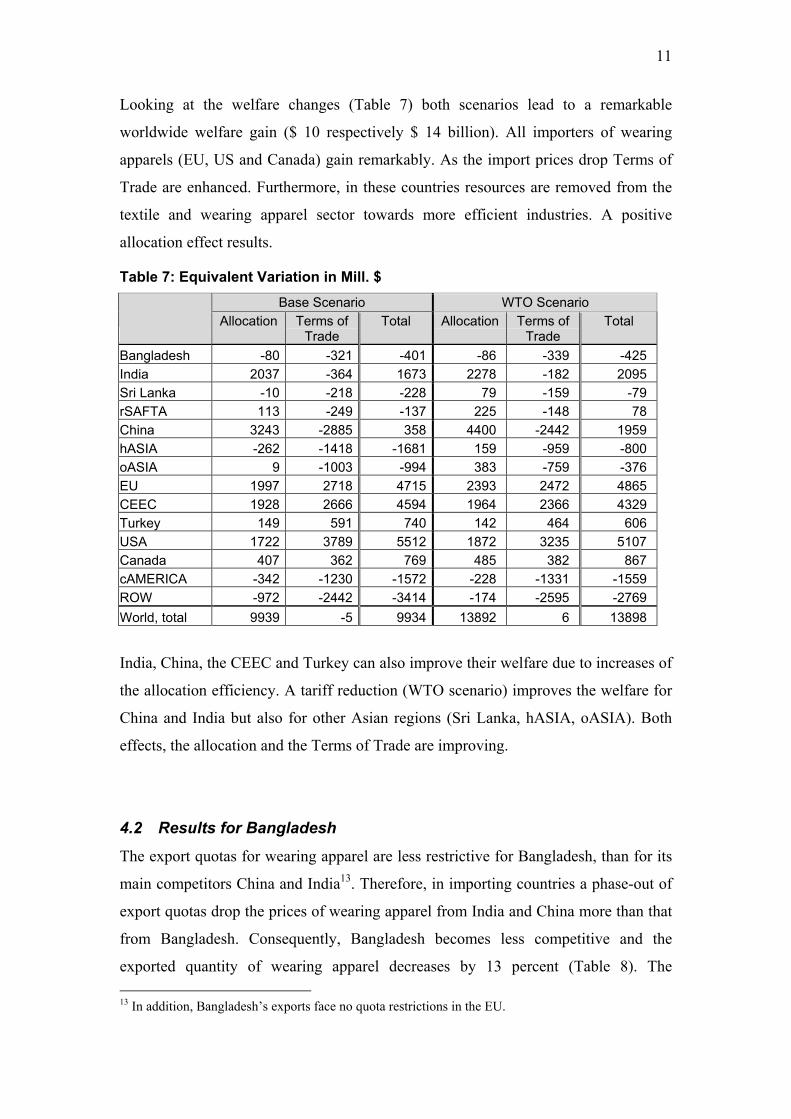
Looking at the welfare changes (Table 7) both scenarios lead to a remarkable
worldwide welfare gain ($ 10 respectively $ 14 billion). All importers of wearing
apparels (EU, US and Canada) gain remarkably. As the import prices drop Terms of
Trade are enhanced. Furthermore, in these countries resources are removed from the
textile and wearing apparel sector towards more efficient industries. A positive
allocation effect results.
Table 7: Equivalent Variation in Mill. $ Base Scenario WTO Scenario
Allocation Terms of
Trade Total Allocation Terms of
Trade Total
Bangladesh -80 -321 -401 -86 -339 -425 India 2037 -364 1673 2278 -182 2095 Sri Lanka -10 -218 -228 79 -159 -79 rSAFTA 113 -249 -137 225 -148 78 China 3243 -2885 358 4400 -2442 1959 hASIA -262 -1418 -1681 159 -959 -800 oASIA 9 -1003 -994 383 -759 -376 EU 1997 2718 4715 2393 2472 4865 CEEC 1928 2666 4594 1964 2366 4329 Turkey 149 591 740 142 464 606 USA 1722 3789 5512 1872 3235 5107 Canada 407 362 769 485 382 867 cAMERICA -342 -1230 -1572 -228 -1331 -1559 ROW -972 -2442 -3414 -174 -2595 -2769 World, total 9939 -5 9934 13892 6 13898
India, China, the CEEC and Turkey can also improve their welfare due to increases of
the allocation efficiency. A tariff reduction (WTO scenario) improves the welfare for
China and India but also for other Asian regions (Sri Lanka, hASIA, oASIA). Both
effects, the allocation and the Terms of Trade are improving.
4.2 Results for Bangladesh
The export quotas for wearing apparel are less restrictive for Bangladesh, than for its
main competitors China and India13. Therefore, in importing countries a phase-out of
export quotas drop the prices of wearing apparel from India and China more than that
from Bangladesh. Consequently, Bangladesh becomes less competitive and the
exported quantity of wearing apparel decreases by 13 percent (Table 8). The 13 In addition, Bangladesh’s exports face no quota restrictions in the EU.

12
production is reduced by 11 percent (Base scenario, Table 4). At the same time the
textile sector augment its output by more than 1 percent due to an increase of exports.
In contrast to wearing apparels, the ATC improves the Bangladeshi position for
textiles exports to the USA and Canada. Generally speaking, the export pattern of
Bangladesh is changing towards a stronger diversification. Besides leather products
also exports of labor intensive manufactures (LiMANF) and services increase. The
export increases of the other sectors are not so relevant since the initial exported
quantities are rather small.
Table 8: Output Changes of Bangladeshi Exports and Imports
Exports Imports
Base
Scenario WTO
Scenario Base
Scenario WTO
Scenario Rice 10 11 -13 -14 Grains 6 6 -1 -1 Fibers 10 11 -2 -2 RAGR 2 3 -6 -6 Food 8 8 -4 -4 Textiles 13 13 -8 -8 Wearing apparel -13 -13 -7 -5 Leather products 18 19 -7 -7 Extract 14 15 -4 -4 LiMANF 10 10 -4 -5 CiMANF 13 14 -3 -3 Services 10 11 -5 -6
In both scenarios all Bangladeshi imports decline. An import substitution takes place.
Bangladesh faces a welfare loss of $ 400 million (Table 7). The main reason is the
deterioration of the Terms of Trade. Since the export quotas are removed, export
prices of textile and wearing apparel decreases and hence, Terms of Trade are
decreasing14. Looking at the Bangladeshi Terms of Trade effect, we have to consider
that the whole export quota rent is allocated to Bangladesh. If at least a part of the
quota rent belongs to companies outside of Bangladesh, the welfare loss would be
smaller15.
14 This is also the case for all other quota-restricted exporters. Some of them can compensate this effect with a positive welfare change from an improved means more efficient allocation (China, India). 15 A large part of wearing apparel exports takes place through buying houses. By a total number of 895 buying houses an analysis of 106 of them revealed the fact that 15 percent are owned by foreigners. Therefore, it can be assumed that a part of the Bangladeshi quota rent is transferred abroad.

13
A reduction of tariffs for textiles and wearing apparels (WTO scenario) has a modest
impact on the Bangladeshi production as well as the traded quantities (Tables 6 and
8). Although Bangladesh is a net exporter of wearing apparel the tariff reduction does
not lead to an increase of the exported quantity. If we look more exact at the quantity
changes of the Bangladeshi wearing apparel exports to the single regions, we can
observe that all of them increase except that to the EU. Since Bangladesh has free
access to the EU the Bangladeshi exports become relatively more expensive. This
effect offsets the increases in all other export regions because the EU is the most
important importer of Bangladeshi wearing apparels.
In the WTO scenario a welfare loss results for Bangladesh, which is slightly larger
than in the base scenario. The reason is a further degradation of the Terms of Trade
(Table 7).
5 Conclusions The results indicate that India and China will benefit most from the Agreement on
Textile and Clothing (ATC). The phase out of their very restrictive export quotas
leads to remarkable increase of their wearing apparel productions.
Contrariwise, Bangladesh reduces its wearing apparel output by more than 10 percent
and faces a welfare loss. The main reason is that Bangladesh has free access to its
most important export market, the EU. Further trade liberalizations are worsening the
Bangladeshi position opposite to its competitors. Due to the same argument, a
worldwide tariff reduction on textiles and wearing apparels as a potential outcome of
the WTO Doha Round is neither favorable. As a result, the export pattern of
Bangladesh is changing towards a stronger diversification.
References Bach, C. F., Dimaranan, B., Hertel, T. W., and Martin, W. (1997). Market Growth
Structural Change and the Gains From the Uruguay Round, DERG Working Paper No. 3.
Bhattacharya, D., and Rahman, R. (2001). Prospects for Internalising Global
Opportunities in the Apparel Sector in Bangladesh, in Sobhan, R., and Khundker, N. (eds), Globalisation and Gender: Changing Patterns of Women's Employment in Bangladesh, Centre for Policy Dialogue, The University Press Limited, Dhaka, 219 - 267.

14
Dimaranan, B. V., and McDougall, R. A. (2002). Global Trade Assistance and
Production: The GTAP 5 Data Base, Center for Global Trade Analysis, Purdue University, West Lafayette.
Diao, X., and Somwaru, A. (2001). Impact of the MFA Phase-Out on the World
Economy: An Intertemporal Global General Equilibrium Analysis, TMD Discussion Paper No. 79, International Food Policy Research Institute.
Dowlah, C. A. F., (1999). The Future of the Readymade Clothing Industry of
Bangladesh in the Post-Uruguay Round World, World Economy 22(7), pp. 933-53.
Francois, J., and Spinanger, D. (2002). ATC Export Tax Equivalents, Chapter 16F, in
Dimaranan, B. V., and McDougall, R. A. (eds); Global Trade Assistance and Production: The GTAP 5 Data Base, Center for Global Trade Analysis, Purdue University, West Lafayette.
Hertel, T. W., Martin, W., Yanagishima, K., and Dimaranan, B. (1996). Liberalizing
Manufactures Trade in a Changing World Economy, in Martin, W., and Winters, A. (eds), The Uruguay Round and the Developing Countries, Cambridge University Press, Cambridge, 183-215.
Hertel, T. W. (1997). Global Trade Analysis Modeling and Applications, Cambridge
University Press, New York. Ianchovichina, E. (2003). GTAP-DD: A Model for Analyzing Trade Reforms in the
Presence of Duty Drawback, GTAP Technical Paper No. 21. Islam, S. (2001). The Textile and Clothing Industry of Bangladesh in a Changing
World Economy, Centre For Policy Dialogue, University Press Limited, Dhaka.
Yang, Y., Martin, W., and Yanagishima, K. (1997). Evaluating the Benefits of
Abolishing the MFA in the Uruguay Round Package, in Hertel, T. W. (ed.), Global Trade Analysis: Modelling and Applications, Cambridge University Press, New York, 253 - 279.
Zohir, S. C. (2001). Beyond 2004: Strategies for the RMG Sector in Bangladesh, in
Abdullah, A., (ed.) Bangladesh Economy 2000, Selected Issues, The Bangladesh Institute of Development, Dhaka, 137 - 163.