![Haller Theory of Stock Market [OCR searchable text]](https://static.fdocuments.in/doc/165x107/5468c1e5b4af9fcc068b46f6/haller-theory-of-stock-market-ocr-searchable-text.jpg)
TEXT SEARCHABLE DOCUMENT - 2010
32
* 1, w *LS* Data Evaluation Report on the Toxicity of Ziram to Fathead Minnow (Primephales promelas), Early Life Cycle PMRA Submission Number ( ...... ) EPA MRID Number 46893 1-04 Data Requirement: PMRA Data Code { ............ 1 EPA DP Barcode D323417 OECD Data Point ( ............ 1 EPA MRTD 46893 1-04 EPA Guideline 850.1400 (OPP $72-4a) Test material: ['4~]~iram Radiochemical Purity: 97% Unlabeled Ziram Technical Purity: 98.2% Common name Ziram Chemical name: IUPAC: Zinc bis(dimethy1dithiocarbamate) CAS name: (T-4)-bis@imethylcarbamodithioato-IcS,KSr)zinc CAS NO. : 13 7-30-4 Synonyms: Ziram PHYTO Primary Reviewer: Christie E. Padova Signature: fld IrC* Lala df . T ~ ~ - - Staff Scientist, Dynamac Corporation Date: 11/13/06 Secondary Reviewer: Teri Myers signature: &1'5 /?/v Senior Scientist, Cambridge Environmental Inc. Primary Reviewe Date: / Secondary Reviewer(s): { .................. (EPA/OECD/PMRA) Date: { ............ 1 ..................... ReferenceISubmission No.: { 1 Company Code { ............ 1 Active Code { ............ 1 Use Site Category C . ) EPA PC Code 034805 [For PMRA] [For PMRA] [For P W] Date Evaluation Completed: {dd-mm-yyyy) CITATION: Palmer, S.J., T.Z. Kendall, and H.O. Krueger. 2006. Ziram: An Early Life-Stage Toxicity Test with the Fathead Minnow (Pimephalespromelas). Unpublished study performed by Wildlife International., Ltd., Easton, MD. Laboratory Project No. 602A-103A. Study submitted by The Ziram Task Force, c/o Cerexagri, Inc., King of Prussia, PA. Study initiated February 8,2006 and submitted July 18,2006. DISCLAIMER: This document provides guidance for EPA and PMRA reviewers on how to complete a data evaluation record after reviewing a scientific study concerning the toxicity of a pesticide to fish, early life cycle. It is not intended to prescribe conditions to any external party for conducting this study nor to establish absolute criteria regarding the assessment of whether the study is scientifically sound and whether the study satisfies any applicable data requirements. Reviewers are expected to review and to determine for each study, on a case-by-case baiis, whether it is scientifically sound and provides sufficient information to satisfy applicable data requirements. Studies that fail to meet any of the conditions may be accepted, if appropriate; similarly, studies that meet all of the conditions may be rejected, if appropriate. In sum, the reviewer is to take into account the totality of factors related to the test methodology and results in determining the acceptability of the study. TEXT SEARCHABLE DOCUMENT - 2010
Transcript of TEXT SEARCHABLE DOCUMENT - 2010

* 1 ,
w
* L S *
Data Evaluation Report on the Toxicity of Ziram to Fathead Minnow (Primephales promelas), Early Life Cycle PMRA Submission Number (...... ) EPA MRID Number 46893 1-04
Data Requirement: PMRA Data Code { ............ 1 EPA DP Barcode D323417 OECD Data Point ( ............ 1 EPA MRTD 46893 1-04 EPA Guideline 850.1400 (OPP $72-4a)
Test material: ['4~]~iram Radiochemical Purity: 97% Unlabeled Ziram Technical Purity: 98.2%
Common name Ziram Chemical name: IUPAC: Zinc bis(dimethy1dithiocarbamate)
CAS name: (T-4)-bis@imethylcarbamodithioato-IcS,KSr)zinc CAS NO. : 13 7-30-4 Synonyms: Ziram PHYTO
Primary Reviewer: Christie E. Padova Signature: fld IrC* Lala df . T ~ ~ - - Staff Scientist, Dynamac Corporation Date: 11/13/06
Secondary Reviewer: Teri Myers signature: &1'5 /?/v Senior Scientist, Cambridge Environmental Inc.
Primary Reviewe Date:
/
Secondary Reviewer(s): { .................. (EPA/OECD/PMRA)
Date: { ............ 1
..................... ReferenceISubmission No.: { 1
Company Code { ............ 1 Active Code { ............ 1 Use Site Category C............. ) EPA PC Code 034805
[For PMRA] [For PMRA] [For P W ]
Date Evaluation Completed: {dd-mm-yyyy)
CITATION: Palmer, S.J., T.Z. Kendall, and H.O. Krueger. 2006. Ziram: An Early Life-Stage Toxicity Test with the Fathead Minnow (Pimephales promelas). Unpublished study performed by Wildlife International., Ltd., Easton, MD. Laboratory Project No. 602A-103A. Study submitted by The Ziram Task Force, c/o Cerexagri, Inc., King of Prussia, PA. Study initiated February 8,2006 and submitted July 18,2006.
DISCLAIMER: This document provides guidance for EPA and PMRA reviewers on how to complete a data evaluation record after reviewing a scientific study concerning the toxicity of a pesticide to fish, early life cycle. It is not intended to prescribe conditions to any external party for conducting this study nor to establish absolute criteria regarding the assessment of whether the study is scientifically sound and whether the study satisfies any applicable data requirements. Reviewers are expected to review and to determine for each study, on a case-by-case baiis, whether it is scientifically sound and provides sufficient information to satisfy applicable data requirements. Studies that fail to meet any of the conditions may be accepted, if appropriate; similarly, studies that meet all of the conditions may be rejected, if appropriate. In sum, the reviewer is to take into account the totality of factors related to the test methodology and results in determining the acceptability of the study.
TEXT SEARCHABLE DOCUMENT - 2010

Data Evaluation Report on the Toxicity of Ziram to Fathead Minnow (Primephales promelas), Early Life Cycle PMRA Submission Number {......I EPA MRID Number 46893 1-04
EXECUTIVE SUMMARY:
The 33-day chronic toxicity of ziram to the early life stage of fathead minnow (Pimephalespvomelas) was studied under flow-through conditions. Fertilized eggslembryos (8O/level, <24 hours old) of fathead minnow were exposed to a mixture ofradiolabeled plus unlabeled zirarn at nominal concentrations of 0 (negative and solvent controls), 47,94, 188, 375, and 750 pg aiL. Mean-measured concentrations were <LOQ, 48, 10 1,195 393 and 750 pg total residues&,. TWA concentrations were <7.26 (<LOQ, controls), 49, 101, 196, 395, and 750 pg total residuesll, respectivel;~. The test system was maintained at 24.0-25.8 "C and a pH of 8.0-8.1. The 33-day ECSo was 218 pg aiIL for post-haich survival and 590 pg total residuesll for hatching success. NOAEC and LOAEC values were 101 and 196 pg totallresidues/L, respectively, based on post-hatch larval survival.
Hatching occurred during days 3 to 5 at all levels, with no treatment-related effect observed. Hatching supcess, however, was statistically-reduced at the 750 pg total residuedl level compared to the negative control (1 0 versus 98%, respectively). All hatched larvae from the 750 pg total residues/L level died within 1 day post-hatch, and all hatched larvae from the 395 pg total residuedl level died within 2 1 days post-hatch. Organisms from thqse two levels were weak andlor small prior to death. Post-hatch larval survival was the most sensitive endpoint, with statistically-significant reductions from the negative control observed at the 2195 pg total residues&, levels. On Day 33 (28 days post-hatch), larvae survival averaged 94% in the negative control group, compared to 88, 95, 97, and 72% in the solvent control and mean-measured 48, 101, and 195 pg total residuesL groups, respectively. No treatment-related effect on terminal growth was observed at up to 195 pg total residuesll.
This study is scientifically sound and is classified as ACCEPTABLE for an early life toxicity study with fathead minnow.
Results, Synopsis
Test Organism Size/Age(mean Weight or Length): Embryos, <24 hours old Test Type (Flow-through, Static, Static Renewal): Flow-through
LOAEC: 195 pg total residuesll
Post-hatch Survival NOAEC: 101 pg total residues&,
Endpoint(s) Affected: hatching success, post-hatch clinical signs of toxicity, and post-hatch survival Most Sensitive Endpoint(s): post-hatch survival
' Page 2 of 32

9 Q * $
3
Data Evaluation Report on the Toxicity of Ziram to Fathead Minnow (Primephales promelas), Early Life Cycle PMRA Submission Number f . . . ...) EPA MRID Number 46893 1-04
I. MATERIALS AND METHODS:
GUIDELINE FOLLOWED: The study protocol was based on procedures outlined in the OECD Guidelines for Testing of Chemicals, Guideline 210, Fish Early-Life Stage Toxicity Test; U.S. EPA Series 850 - Ecological Effects Test Guidelines (draft), OBPTS No. 850.1400 Fish Early Life-Stage Test; ASTM Standard E 124 1-88, Standard Guide for Conducting Early Life-Stage Toxicity Tests with Fish; and U.S. Environmental Protection Agency Standard Evaluation Procedure, Fish Early Life-Stage Test. Deviations fiom OPPTS No. 850.1400 included:
Test samples were analyzed only for total radioactive residues using LSC. The radioactivity was not fkther characterized; therefore, the stability of zirarn under actual use conditions was not verified.
COMPLIANCE: Signed and dated GLP, Quality Assurance, and Data Confidentiality qlaims statements were provided. This study was conducted in accordance with GLP Standards as published in 40 CFR Part 160 with the following exception: periodic analysis of well water for potential contaminants.
A. MATERIALS:
1. Test Material Ziram Technical and 14c-~irarn
Description: Solids
Lot No./Batch No. : G4A005 1877 (non-radiolabeled) and XV/36 (radiolabeled)
Purity: 98.2% (non-radiolabeled) and 97% (radiolabeled)
Stability of compound under test conditions: Unverified. Test samples collected on days 0,7, 14,21,28, and 34 were
analyzed for total radioactivity using LSC. All results were within 20% among replicate measurements; however, the radioactivity was not further ch&acterized.
Storage conditions of test chemicals: Frozen
Physicochemical properties of Ziram. I I I
Parameter
Water solubility at 20EC I I
Values
Not reported
Vapor pressure
W absorption :
Page 3 of 32
Comments
Not reported
Not reported
P K ~
Kow
Not reported
Not reported
(OECD recommends water solubility, stability in water and light, pKa, Pow, and vapor pressure of test compound)

s \
Data Evaluation Report on the Toxicity of Ziram to Fathead Minnow (Primephales promelas), Early Life Cycle PMRA Submission Number {. .....} EPA MRID Number 46893 1-04
2. Test organism:
Species: Fathead minnow (Pimephales promelas) [EPA recommends any of several freshwater fish species, ;including rainbow trout, brook trout, bluegill, fathead minnow, and channel ca@sh. See Standard Evaluation Proceduqe for listing
' of recommended species. OECD recommends min4ow trout, fathead minnows, zebra fish, and ricefish but does aot exclude the use of other spe.cies.1
Age /embryonic stage at test initiation: Embryos, <24 hours old [EPA recommendsfish ehzbryos 2 to 24 hours old.]
Method of collection of the fertilized eggs: Embryos were removed f?om spawning substrattes and examined under a dissecting microscope to select healthy, viable specimens at approximately the same stage of development.
Source: Chesapeake Cultures Inc., Hayes, VA
B. STUDY DESIGN:
1. Experimental Conditions
a. Range-finding study: The concentrations were selected in consultation with the Sponsor, and were based upon the results of exploratory range-finding data (not further specified).
b. Definitive study
I Feeding (type, source, amount given, frequency):
:able 1: Experimental Parameters
80 embryosltreatment level, divided into 20 embryos/cup, 1 cuplaquaxium, and 4 replicate aquarialtreatment.
Fish were not thinned following hatching- . . . . . . . . . . . . . . . . . . . . . . . . . . . . . . . . . . . . . . . . I
Remarks . . . . . . . . . . . . . . . . . . . . . . . . . . . . . . . . . . . . . . . .
Criteria
Embryos collected for use ib the test were purchased, and were from eight individual spawns.
Parameter
Parental acclimation. if any Period:
Conditions (same as test or not):
( Each treatment should include a 1
Details
N!A
I minimum of 20 embgros per replicate cup and a minimum of 30fish per I treatment for post-hatch exposure (OECD recommends at least 60 eggs, divided between at least 2 replicates) 1
Page 4 of 32

'P a
\
Data Evaluation Report on the Toxicity of Ziram to Fathead Minnow (Primephales promelas), Early Life Cycle PMRA Submission Number { .. .. ..) EPA MRID Number 46893 1-04
Page 5 of 32
Parameter
Concentration of test material nominal:
mean measured:
TWA (reviewer-calculated):
Solvent (type, percentage, if used)
Number of replicates control: solvent control: treated ones:
Details
0 (negative and solvent controls), 47,94,188,375, and 750 pg a i n
<7.26 (<LOQ, controls), 48, 101, 195, 393, and 750 pg total residuesL, respectively
Ci'26 confmls)y 49y 196,395, and 750 pg total residuesa, respectively
Dimethyl formarnide, 0.1 ml/L
4 4 4/level
Remarks . . . . . . . . . . . . . . . . . . . . . . . . . . . . . . . . . . . . . . . .
Criteria
Total radioactive concen@ations were determined using LSlC at 0, 7, 14,21,28, and 33 days. All measured concentrations *ere within 20% among replicates. $he radioactivity was not charticterized to determine what percentage was parent material. . . . . . . . . . . . . . . . . . . . . . . . . . . . . . . . . . . . . . . . . A minimum of 5 concentrations and a control, all replicated, plus splvent control ifappropriate should be used. - Toxicant concentration shovld be measured in one tank at each toxicant level every week. - One concentration should adversely affect a life stage and one concentration should not affect any life stade. OECD recommends that 5 copcentrations be spaced by a constant factor not exceeding 3.2; concentrations of test substance in solution should be within V20% of the mean measured values.
- - - - - - - - - - - - - - - - - - - - - - - - - - - < - - - - - - - - - - - -
The solvent should not exceed 0.1 ml/L in ajow-through system. Recommended solvents include dimethylformamide, triethylerte glycol, methanol, acetone, ethanol. OECD recommends that the splvent not have an effect on survival nor produce
any other adverse effects;con~entration should not be greater than 0.1 rnl/L.
. . . . . . . . . . . . . . . . . . . . . . . . . . . . . . . . . . . . . . . . Number of replicates should be 4 per concentration. A solvent control should be used in conjunction with a solubilizing agent.

e
\
Data Evaluation Report on the Toxicity of Ziram to Fathead Minnow (Primephales promelas), Early Life Cycle PMRA Submission Number {......I EPA MRID Number 46893 1-04
Page 6 of 32
Parameter /
Test condition
static renewal/flow-through:
type of dilution system for flow through method:
flow rate:
renewal rate for static renewal:
Aeration, if any
Duration of the test
Details
Flow-through
Continuous-flow serial diluter
A ~ ~ r O x . per day
NIA
None reported.
33 days (28-days post-hatch)
Remarks . . . . . . . . . . . . . . . . . . . . . . . . . . . . . . . . . . . . . . . .
Criteria
The syringe pump and rotameters were calibrated prior to test initiation and verified at approximately weekly intervals during the test.
. . . . . . . . . . . . . . . . . . . . . . . . . . . . . . . . . . . . . . . . Intermittent flow proportionqrl diluters or continuous flow serial dilkters should be used. EPA recommends thatflow rate to larval cups shouldprovidq 90% replacement in 8 to 12 hours (OECD recommends 5 test chamber polumes/24 hours). For static-renewal, ~ E C D recommends 2 renewalproc8dures; ezther transfer eggs and lawge to new, clean vessels or retain organbins in vessels and change at least 2J3 test water. A minimum of 5 toxicbnt concentrations with a dilutioh factor not greater than 0.5 and controld should be used. Toxicant Mixing: I) Mixing chamber is preferred; 2) Aeration should not be used for mixing; 3) The test solution should be completely mixed before intrdduction into the test system; 4) Flow splitting accuracy should be within 10%.
. . . . . . . . . . . . . . . . . . . . . . . . . . . . . . . . . . . . . . . . Dilution water should be aerated to ensure DO concentration at or near 100% saturation. Test tanks and embryo cups should not be aerated.
. . . . . . . . . . . . . . . . . . . . . . . . . . . . . . . . . . . . . . . . Recommended test duration is1 32 days for EPA. OECD recommendations for test duration are species specific and range from 28-60 days.
3
Data Evaluation Report on the Toxicity of Ziram to Fathead Minnow (Primephales promelus), Early Life Cycle PMRA Submission Number (......I EPA MRID Number 46893 1-04
Parameter
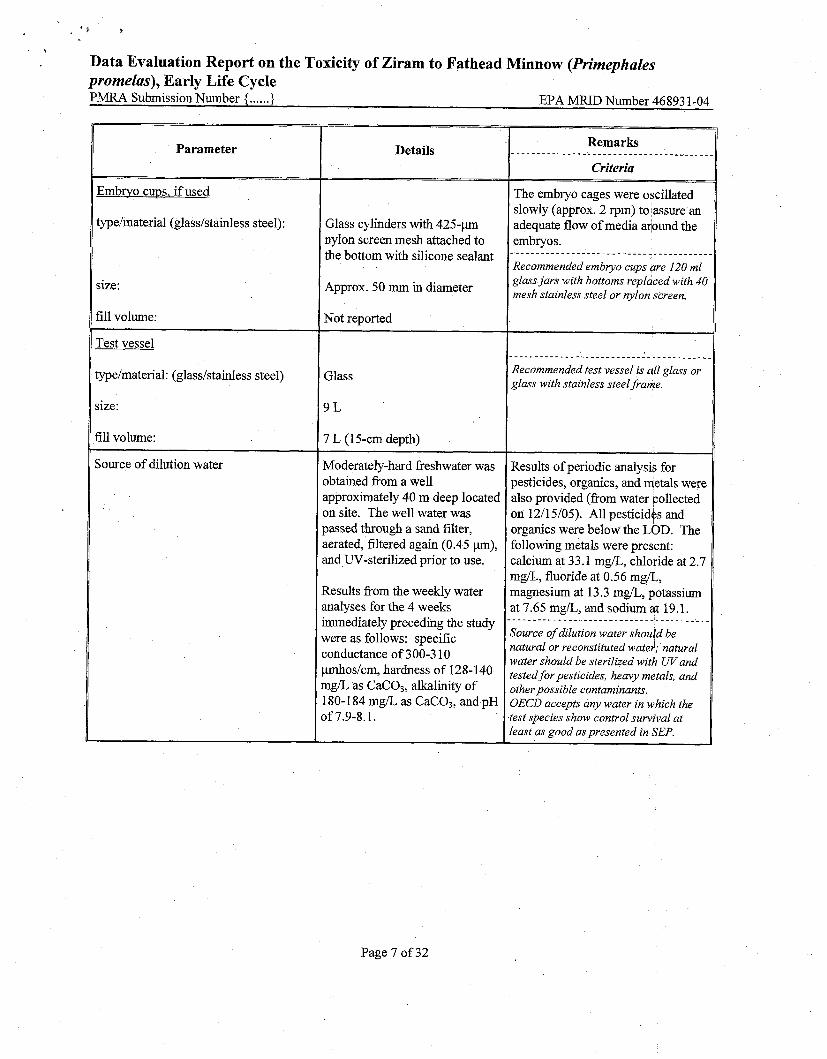
Embryo cups, if used
typelmaterial (glass/stainless steel):
size:
fill volume: - --
Test vessel
typelmaterial: (glass/stainless steel)
size:
fill volume:
Source of dilution water
Details
Glass cylinders with 425-pn nylon screen mesh attached to the bottom with silicone sealant
Approx. 50 rnm in diameter
Not reported
Glass
7 L (1 5-cm depth)
Moderately-hard freshwater was obtained from a well approximately 40 m deep located on site. The well water was passed through a sand filter, aerated, filtered again (0.45 pm), and W-sterilized prior to use.
Results from the weekly water analyses for the 4 weeks immediately preceding the study were as follows: specific conductance of 300-3 10 pmhos/cm, hardness of 128-140 m g k as CaC03, alkalinity of 180-1 84 mgL as CaCO,, and pH of 7.9-8.1.
Remarks . . . . . . . . . . . . . . . . . . . . . . . . . . . . . . . . . . . . . . . .
Criteria
The embryo cages were oscillated slowly (approx. 2 rpm) to assure an adequate flow of media aqound the embryos. -.--------.-------.---------------------
Recommended embryo cups are 120 ml glass jars with bottoms replaced with 40 mesh stainless steel or nylon screen.
Recommended test vessel is all glass or glass with stainless steelfiame. I
Results of periodic analysis for pesticides, organics, and metals were also provided (fi-om water collected on 1211 5/05). All pesticides and organics were below the LOD. The following metals were prespnt: calcium at 33.1 mgL, chlofide at 2.7 mgk, fluoride at 0.56 mga , magnesium at 13.3 mgk, gotassium at 7.65 mgk, and sodium at 19.1. . . . . . . . . . . . . . . . . . . . . . . . . . . . . . . . . . . . . . . . . Source of dilution water should be natural or reconstituted wated; natural water should be sterilized with W a n d tested for pesticides, heavy rndtals, and other possible contaminants. OECD accepts any water in qhich the test species show control survival at least as good aspresented in $EP.
Page 7 of 32

. Data Evaluation Report on the Toxicity of Ziram to Fathead Minnow (Primephales promelas), Early Life Cycle PMRA Submission Number (.. . .. .) EPA MlUD Number 46893 1-04
Page 8 of 32
Parameter
Water parameters hardness:
pH:
dissolved oxygen:
temperature (s) (record all the temperatures used for different life stages):
photoperiod:
salinity (for marine or estuarine species):
other measurements:
interval of water quality measurements:
Post-hatch details when the post-hatch period began:
number of hatched eggs (alevins)/ treatment released to the test chamber:
on what day, the alevins were released from the incubation cups to the test chamber:
Details
132-144 mg/L as CaC03
8.0-8.1
26.4 e 7 8 % saturation)
24.0-25 .S°C (maintained constant throughout study)
16 hours light18 hours dark, with 30-minute transition periods
N/A
Specific conductance of 335-365 d o s / c m ; and alkalinity of 182- 186 mg/L as CaC03
Temperature was measured in each chamber at least weekly and in one negative control replicate continuously. DO was measured in alternating replicates of each level daily during the first 7 days and weekly thereafter. pH was measured in alternating replicates of each level at least weekly. Hardness, alkalinity, and specific conductance were measured in alternating replicates of the negative control and 750 pg ai/L levels at least weekly.
Day 5, when hatching was >90% complete in the negative control chambers.
All hatched larvae were released.
Day 5
Remarks . . . . . . . . . . . . . . . . . . . . . . . . . . . . . . . . . . . . . . . .
Criteria
Light intensity at test initiation was 194 lux over one representative test chamber. ----------------------.-----------------
Recommended hardness: 40.48 mg/L as CaCO,; Recommendedpl%. 7.2 lo 7.6 Dissolved Oxygen (DO) should be -
measured at each concentration at least once a week; Freshwater parameters in a control and one concentration should be pnalyzed Once a week. Temperature depends upon t 6 ~ t species and should not deviate by mope than 2ECfrom appropriate tempeTature. OECD recommends that DO concentvation be between 60 r 90% saturation. As a minimum DO, salinity (iyrelevant) and temperature should be measured weekly, andpH an4 hardness at the beginning and end of the test Temperature should be mmsjred continuously.
Survival ranged fiom 95-10.0% in the negative control replicates. - - - - - - - - ' - - - - - - - - - - - - - - - - - - - - * - - - - - - - - - - Percentage of emb y o s that pr~duce live f q should be 2 50% in each control; percentage of hatch in any coqtrol embyo cup should not be more than times that in another control cap.

. \
Data Evaluation Report on the Toxicity of Ziram to Fathead Minnow (Primephales promelas), Early Life Cycle PMRA Submission Number (......I EPA MRID Number 46893 1-04
Page 9 of 32
Parameter Details
Post-hatch Feeding To ensure that the feeding rate per start date: Day 5 fish remained constant, rations were
adjusted each week to account for typelsource of feed: Live brine shrimp nauplii loslses due to mortality.
(Artemia sp.)
amount given: Not reported
frequency of feeding:
Stability of chemical in the test system
Recovery of chemical:
Frequency of measurement:
LOD: LOQ:
Positive control (if used, indicate the chemical and concentrations)
Fertilization success study, if any
number of eggs used:
on what day the eggs were removed to check the embryonic development:
Other parameters, if any NIA
Three times daily during the first 7 days post-hatch, and at least two times daily thereafter. Fish were not fed during the final 48 hours of the test.
Measurement of total radioactive residues (LSC) indicated relatively constant measured concentrations (within 20% among replicate measurements). However, the stability of ziram was not verified.
93.3-1 13% of nominal
Days 0,7, 14,21,28, and 33
Not reported 7.26 pg total residuesk
N/A
N/ A
Based on LSC analysis of test samples.

. \
Data Evaluation Report on the Toxicity of Ziram to Fathead Minnow (Primephales promelas), Early Life Cycle PMRA Submission Number {......I EPA MRID Number 46893 1-04
2. Observations:
Table 2: Obsewations
Parameters
Parameters measured including the sublethal effectsltoxicity symptoms
Observation intervalddates for:
egg mortality: no. of eggs hatched: mortality of fry (e.g.,alevins): swim-up behavior: growth measurements: embryonic development: other sublethal effects
Water quality was acceptable (YesINo)
Were raw data included?
Other observations, if any
Details
- Embryo survival - ~ i m e to hatch - Hatching success - Larval survival - Measurement of growth (total length, wet weight, and dry weight) - Clinical signs of toxicity or abnormal behavior
Remarks
Criteria
- - - - - - - - - - - - - - - - - - - - - - - - - - + - - - - - - - - - - .
Recornmendedparameters measured lnclude: - Number of embryos hatched; - Time to hatch; - Mortality of embryos, largae, and
Juveniles: - Time to swim-up (ifappropriate); - Measurement of growth; - Incidence ofpathological or Histological effects; - Obsewations ofother effebts or clinical signs.
Daily Daily Daily NIA Day 33 Not determined Daily
Yes
Yes
NIA
11. RESULTS AND DISCUSSION:
A. MORTALITY:
On Day 5, hatching success averaged 98 and 100% in the negative and solvent control groups, respectively, compared to 98, 99, 95, 96, and 10% in the'mean-measured 48, 101, 195, 393, and 750 yg total residyesll levels, respectively. The difference at the 750 pg total residuesk level was statistically-reduced compared to the pooled control (p50.05). The NOAEC for hatching success was 393 pg total residues&,.
On Day 33 (28 days post-hatch), larvae survival averaged 94% in the negative control group, compar$d to 88, 95, 97, and 72% in the solvent control and mean-measured 48, 10 1, and 195 pg total residuesk groups, respectively. The difference at the 195 pg total residuesk level was statistically-reduced compared to the pooled control (~50.05). No larvae survived at the 393 and 750 pg total residuesk levels. The NOAEC for post-hatch survival was 10 1 pg total residuesll.
Page 10 of 32

\
Data Evaluation Report on the Toxicity of Ziram to Fathead Minnow (Primephales promelas), Early Life Cycle PMRA Submission Number {... ...} EPA MRID Number 46893 1-04
Treatment Measured, I Egg hatchedlembryo viability
pg total residues& (and nominal,
Pg afi) at study viability concentrations
- -
Control (dilution 80 78 98 water only)
Solvent control 80 80 100
' Time to hatch1 No. hatched - Juvenile-survival on
day 33
I Yo
Day 3 Day 4 Day 5 No. dead mortality
0 26 76 2 1 28"
0 65 77 77 1 00*
NOAEC 393 pg total residues1L 750 pg total residuesk
EGO NR NR
Positive control, if used NIA N/A
mortality: EC5o: NOAEC
NR - Not reported * Statistically-significant difference fiom pooled control using Fisher's Exact test (~10.05).
-
10 1 pg total residuesk
NR
Page 11 of 32
Data Evaluation Report on the Toxicity of Ziram to Fathead Minnow (Primephales promelas), Early Life Cycle PMRA Submission Number (......I EPA MRID Number 46893 1-04
B. SUB-LETHAL TOXICITY AND OTHER CHRONIC EFFECTS:
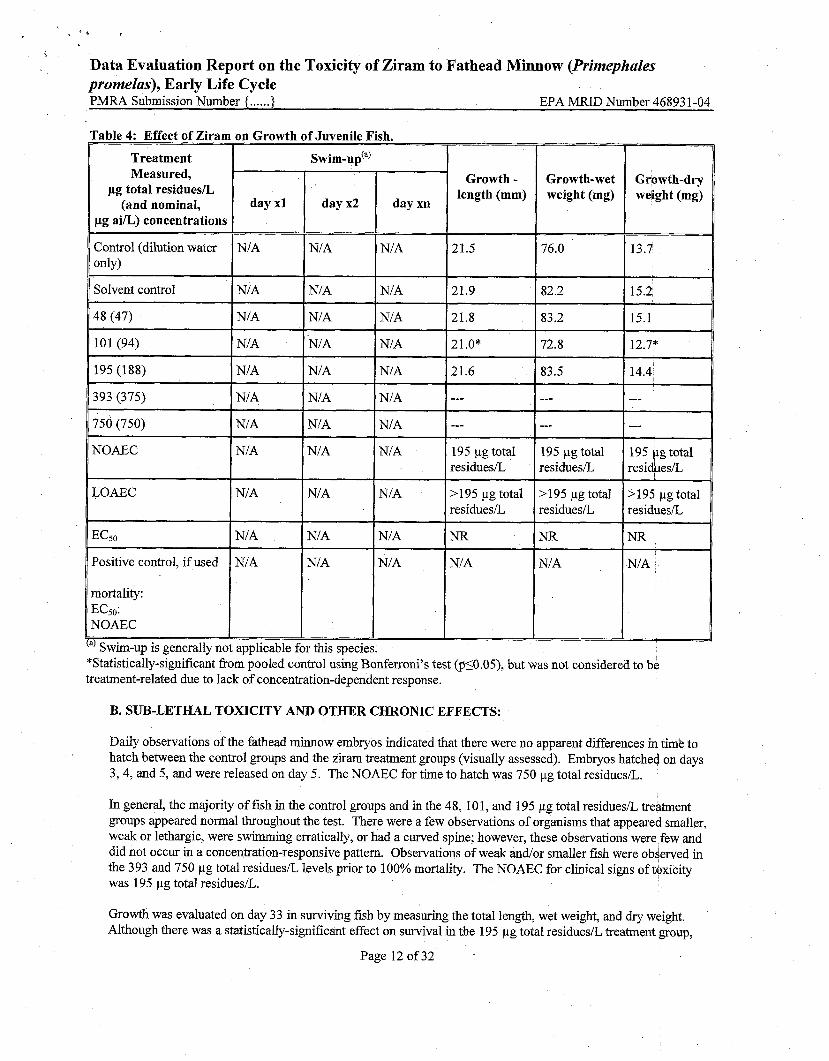
Table 4: Effect of Ziram -
Treatment Measured,
pg total residuesb (and nominal,
pg ai/L) concentrations
Control (dilution water only)
Solvent control
48 (47)
101 (94)
195 (188)
393 (375)
750 (750)
NOAEC
LOAEC
Daily observations of the fathead minnow embryos indicated that there were no apparent differences ~IY timb to hatch between the control groups and the ziram treatment groups (visually assessed). Embryos hatched on days 3,4, and 5, and were released on day 5. The NOAEC for time to hatch was 750 pg total residuesk.
In general, the majority of fish in the control groups and in the 48, 10 1, and 195 pg total residuesk treatment groups appeared normal throughout the test. There were a few observations of organisms that appeared smaller, weak or lethargic, were swimming erratically, or had a curved spine; however, these observations were few and did not occur in a concentration-responsive pattern. Observations of weak andlor smaller fish were observed in the 393 and 750 pg total residuesk levels prior to 100% mortality. The NOAEC for clinical signs of toxicity was 195 pg total residuesk.
Growth was evaluated on day 33 in surviving fish by measuring the total length, wet weight, and dry weight. Although there was a statistically-significant effect on survival in the 195 pg total residuesL treatment group,
Page 12 of 32
on Growth of Juvenile Fish.
Growth - length (rnm)
21.5
21.9
21.8
21.0"
21.6
--- ---
195pgtotal residuesk
>I95 1-18 total residuesk ------
day x l
NIA
NIA
NIA
NIA
NIA
Nl A
NIA
NIA
N/A
*Statistically-significant fi-om pooled control using Bonferroni's test @50.05), but was not considered to be treatment-related due to lack of concentration-dependent response.
NR
NIA
ECso
Positive control, if used
mortality: ECS0: NOAEC
Growth-wet weight (rng)
76.0
82.2
83.2
72.8
83.5
---
---
195pgtotal residuesk
>I95 pg total residuesk
~ w i m - u ~ ( ~ )
dayx2
NIA
NIA
NIA
NIA
NIA
N/A
NIA
NIA
NIA
Nl A
NIA
this species.
N/A
N/A
Growth-dry weight (mg)
13.7
15.2
15.1
12.7*
14.4
---
---
195ygtotal residhesk
>I95 pg total residbesk
NR
NIA
dayxn
NIA
NIA
NIA
NIA
NIA
NIA
N/ A
NIA
NIA
NIA
NIA
Swim-up is generally not applicable for
NR
NIA

'1
Data Evaluation Report on the Toxicity of Ziram to Fathead Minnow (Primephales promelas), Early Life Cycle PMRA Submission Number ( . . . . . . ) EPA MRID Number 46893 1-04
the study authors reported that there was a sufficient number of fish that survived to make valid statistical analyses of growth. Both total length and dry weight were statistically-reduced compared to the pooled control (p50.05) at the 101 pg total residuesh, level; however, a similar reduction was not observed at the 195 pg total residuedl level. Therefore, the small difference observed at the 10 1 pgL level was not considered to be biologically meaningfbl, and the NOAEC was considered to be 195 pg total residuesh,.
11 NOAEC 1 195 pg total residuesk 1
Table 5: Sub-lethal Effects of Ziram on Fathead inno ow(^).
Measured, pg total residuesL
(and nominal, pg a i k ) '
concentrations
Control (dilution water 3 only)
Solvent control
48 (47)
101 (94)
195 (188)
393 (375)
750 (750)
Page 13 of 32
LOAEC
Positive control, if used % sublethal effect: NOAEC:
10
4
1
1
38
100
(") The maximum percentage of surviving fish exhibiting effect (reviewer-calculated).
-
393 pg total residues&
1
1
0
1
0
0
NJA
3
1
1
2
38
0
NIA
1
1
0
0
0
0
NIA
1
1
0
0
0
0
NJA NJA

*
>
Data Evaluation Report on the Toxicity of Ziram to Fathead Minnow (Primephales promelas), Early Life Cycle PMRA Submission Number {......I EPA MRID Number 46893 1-04
C. REPORTED STATISTICS:
Data that were statistically analyzed included 1) hatching success, 2) larval survival, 3) the mean total length of surviving fish at study termination, 4) the mean wet weight of surviving fish at study termination, and 5) the mean dry weight of surviving fish at study termination. The time to hatch was visually evaluated.
For all endpoints, responses from the negative and solvent control groups were compared using a t-test. No significant differences were observed, and the controls were pooled for all subsequent analyses. Hatshing success and larval survival data were analyzed using Chi-square and Fisher's Exact test to identify trdatment groups that showed a statistical1,y significant difference from pooled controls (~50.05). Growth data were checked for normality using Chi-square, and for homogeneity of variance using Levene's test. The dhta passed these assumptions, and were subsequently analyzed using analysis of variance (ANOVA) and Bonferroni's t-test to identify treatments that were significantly different from the pooled control (p 5 0.05).
The NOAEC and LOAEC were based on significance data. All analyses were performed using TOXSTAT or SAS software programs and mean-measured concentrations.
D. VERIFICATION OF STATISTICAL RESULTS:
Statistical Method: Hatching success, post-hatch survival, length, wet and dry weight were statistically analyzed. Data were analyzed using the Chi-square and Shapiro-Wilks tests for normality and the Hartley and Bartlett's tests for homogeneity of variances. Data satisfied these assumptions and NOAEC values ware determined using ANOVA, followed by Dunnett's test. For all endpoints, the negative control was compared to the solvent control using a Student's t-test; no differences were detected and the negative control group was used for all comparisons to the treatment data. These analyses were conducted using TOXSTAT statistical software. The ECso value for post-hatch survival was determined using the Probit method via Toxanal statistical software, while the ECS0 value for hatching success was determined using the Probit method via Nuthatch.
EC50: 218 pg total residues& 95% C.I.: Not determinable Probit Slope: 4.44 95% C.I.: -4.37-13.3 NOAEC: 10 1 pg total residuesL LOAEC: 195 pg total residuesll
E. STUDY DEFICIENCIES:
This study is scientifically sound and provides useful data on the early life-stage toxicity of ziram to fathead minnow. However, as test samples were only analyzed for total radioactive residues, the stability of ziram under test conditions was not determined.
F. REVIEWER'S COMMENTS:
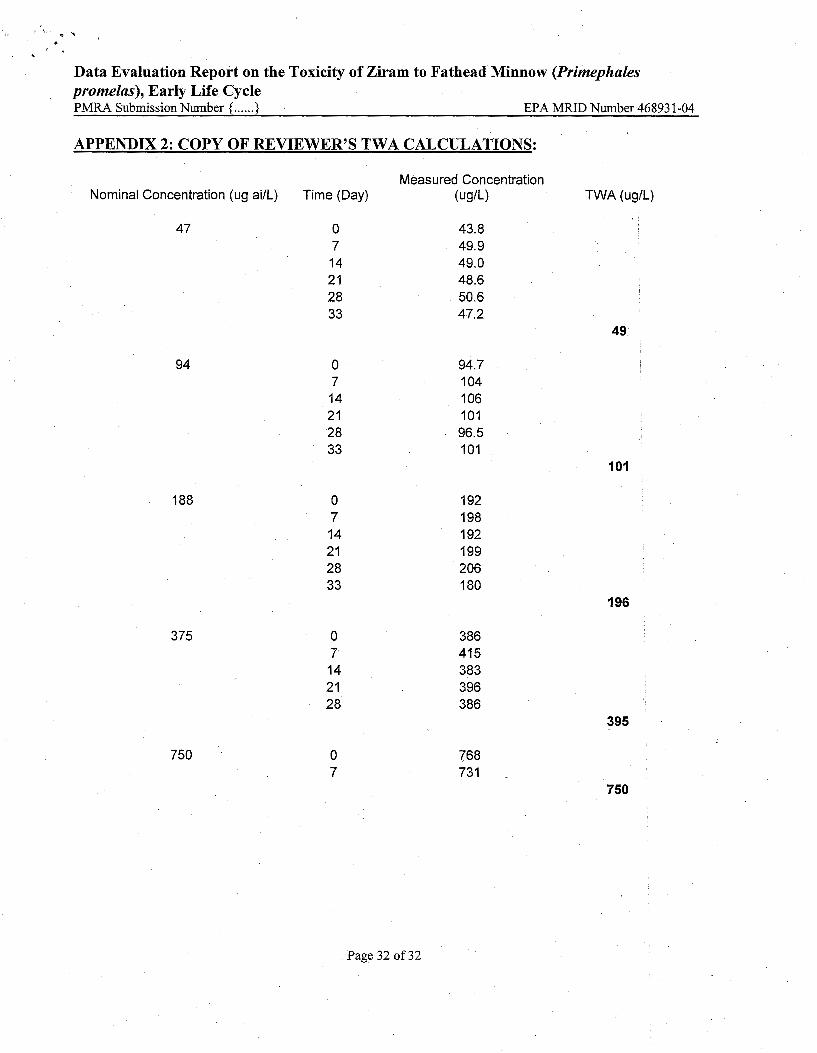
The reviewer's conclusions agreed with the study authors'. The reviewer additionally attempted to estimate the ECS0 for hatching success and survival. The estimate for survival was associated with an indefinable 95% confidence interval, so this result should be interpreted with caution if used quantitatively. Reviewer-calculated TWA concentrations are also provided (see Appendix 2 of this DER).
All test solutions appeared clear and colorless in the test chambers at test initiation and termination, A white precipitate was present in the diluter mixing chambers for the 375 and 750 pg/L nominal treatments durilhg the test.
Biomass loading at the end of the test was 0.021 g fisWL1day (instantaneous 0.22 g fishll), based on the negative control group.
Page 14 of 32
1
Data Evaluation Report on the Toxicity of Ziram to Fathead Minnow (Primephales promelas), Early Life Cycle PMRA Submission Number {......) EPA MRID Number 46893 1-04
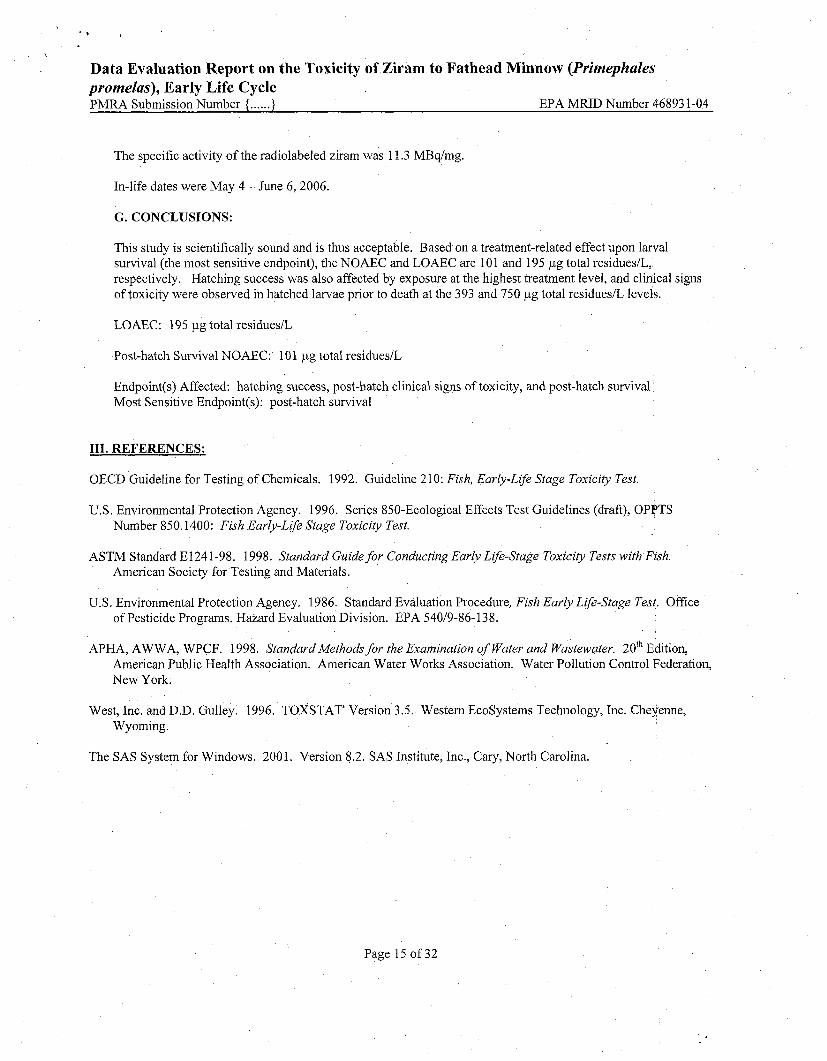
The specific activity of the radiolabeled ziram was 11.3 MBqImg.
In-life dates were May 4 -June 6, 2006.
G. CONCLUSIONS:
This study is scientifically sound and is thus acceptable. Based on a treatment-related effect upon larval survival (the most sensitive endpoint), the NOAEC and LOAEC are 10 1 and 195 pg total residuesll, respectively. Hatching success was also affected by exposure at the highest treatment level, and clinical signs of toxicity were observed in hatched larvae prior to death at the 393 and 750 pg total residuesll levels.
LOAEC: 195 pg total residuesll
Post-hatch Survival NOAEC: 101 pg total residuesll
Endpoint(s) Affected: hatching success, post-hatch clinical signs of toxicity, and post-hatch survival Most Sensitive Endpoint(s): post-hatch survival
111. REFERENCES:
OECD Guideline for Testing of Chemicals. 1992. Guideline 210: Fish, Early-Life Stage Toxicity Test.
U.S. Environmental Protection Agency. 1996. Series 850-Ecological Effects Test Guidelines (draft), OPPTS Number 850.1400: Fish Early-Life Stage Toxicity Test.
ASTM Standard E1241-98. 1998. Standard Guide for Conducting Early Life-Stage Toxicity Tests with Fish. American Society for Testing and Materials.
U.S. Environmental Protection Agency. 1986. Standard Evaluation Procedure, Fish Early Life-Stage Test. Office of Pesticide Programs. Hazard Evaluation Division. EPA 54019-86-138.
APHA, AWWA, WPCF. 1998. Standard Methods for the Examination of Water and Wastewater. 2oth Edition, American Public Health Association. American Water Works Association. Water Pollution Control Federation, New York.
West, Inc. and D.D. Gulley. 1996. TOXSTA?" Version 3.5. Western Ecosystems Technology, Inc. Cheyenne, Wyoming.
The SAS System for Windows. 2001. Version 8.2. SAS Institute, Inc., Cary, North Carolina.
Page 15 of 32

r ' I
L .
3
Data Evaluation Report on the Toxicity of Ziram to Fathead Minnow (Primephales promelas), Early Life Cycle PMRA Submission Number (......I EPA MRID Number 46893 1-04
APPENDIX 1: OUTPUT OF REVIEWER'S STATISTICAL VERIFICATION: Survival EC50
RESULTS CALCULATED USING THE PROBIT METHOD ITERATIONS G .
6 3 . 9 3 9 8 1 H GOODNESS OF F I T PROBABILITY 3 9 . 0 7 0 9 1 0
A PROBABILITY OF 0 MEANS THAT I T I S LESS THAN 0 . 0 0 1
SINCE THE PROBABILITY I S LESS THAN 0 . 0 5 , RESULTS CALCULATED USING THE PROBIT METHOD PROBABLY SHOULD NOT BE USED.
SLOPE = 4 . 4 3 9 8 7 4 9 5 PERCENT CONFIDENCE LIMITS = - 4 . 3 7 2 8 1 2 AND 1 3 . 2 5 2 5 6
LC50 = 2 1 7 . 5 1 6 2 9 5 PERCENT CONFIDENCE LIMITS = 0 AND + I N F I N I T Y
L C 1 0 = 1 1 2 . 5 7 6 4 9 5 PERCENT CONFIDENCE LIMITS = 0 AND +INFINITY
survival ( % ) File: 3104sn Transform: NO TRANSFORM
t-test of Solvent and Blank Controls Ho:GRPl MEAN = GRP2 MEAN .............................................................................. - GRPl (SOLVENT CRTL) MEAN= 93.5000 CALCULATED t VALUE = 0.7735 GRP2 (BLANK CRTL) MEAN = 87.5000 DEGREES OF FREEDOM =
- 6
DIFFERENCE IN MEANS - 6.0000 ------------------_---------------------------------------------------4-------
- TABLE t VALUE (0.05 ( 2 ) , 6) = 2.447 NO significant difference at alpha=0.05 TABLE t VALUE (0.01 (2), 6) = 3.707 NO significant difference at alpha=0.01
survival ( % ) File: 3104sn Transform: NO TRANSFORMATION
Chi-square test for normality: actual and expected frequencies ..............................................................................
INTERVAL <-I. 5 -1.5 to <-0.5 -0.5 to 0.5 >0.5 to 1.5 $1.5
EXPECTED 1.072 '3.872 OBSERVED 0 5
Calculated Chi-square goodness of fit test statistic = 5.7294 Table Chi-Square value (alpha = 0.01) = 13.277
Data PASS normality test. Continue analysis.
survival ( % )
Page 16 of 32

>
s
5
Data Evaluation Report on the Toxicity of Ziram to Fathead Minnow (Primephales promelas), Early Life Cycle PMRA Submission Number (......I EPA MRID Number 46893 1-04
File: 3104sn Transform: NO TRANSFORMATION
Shapiro Wilks test for normality ..............................................................................
Critical W (P = 0.05) (n = 16) = 0.887 Critical W (P = 0.01) (n = 16) = 0.844 ---_------------------------------------------------------------------*-------
Data PASS ndrmality test at P=0.01 level. Continue analysis.
survival ( % ) File: 3104sn Transform: NO TRANSFORMATION
Hartley test for homogeneity of variance ..............................................................................
Calculated H statistic ( m a ~ Var/min Var) = 46.92 Closest, conservative, Table H statistic = 120.0 (alpha = 0.01)
Used for Table H ==> R ( # groups) = 4, df ( # reps-1) = --
3 Actual values --> R ( # groups) = 4, df ( # avg reps-1) = 3.00
Data PASS homogeneity test. Continue analysis.
NOTE: This test requires equal replicate sizes. If they are unequal but do not differ greatly, the Hartley test may still be used as an approximate test (average df are used).
survival ( % ) File: 3104sn Transform: NO TRANSFORMATION
Bartletts test for homogeneity of variance ..............................................................................
Calculated B statistic = 9.92 Table Chi-square value = 11.34 (alpha = 0.01) Table Chi-square value = 7.81 (alpha = 0.05)
Average df used in calculation ==> df ( a v g n - 1) = 3.00 Used for Chi-square table value ==> df (#groups-1) = 3 -----------------------------------------------------------------------+------
Data PASS homogeneity test at 0.01 level. Continue analysis.
NOTE: If groups have unequal replicate sizes the average replicate size is used to calculate the B statistic (see above).
Page 17 of 32

% - ,
Data Evaluation Report on the Toxicity of Ziram to Fathead Minnow (Primephales promelas), Early Life Cycle PMRA Submission Number { ...... ) EPA MFUD Number 46893 1-04
survival ( % ) File: 3104sn Transform: NO TRANSFORMATION
ANOVA TABLE ..............................................................................
SOURCE D F S S MS F .............................................................................. Between 3 1586.188 528.729 4.078
Within (Error) 12 1555.750 129.646 .............................................................................. Total 15 3141.938 ..............................................................................
Critical F value = 3.49 (0.05,3,12) Since F > Critical F REJECT Ho:A11 groups equal
survival ( % ) File: 3104sn Transform: NO TRANSFORMATION
DUNNETTS TEST - TABLE 1 OF 2 Ho:Control<Treatment ............................................................................
TRANSFORMED MEAN CALCULATED IN GROUP IDENTIFICATION MEAN ORIGINAL UNITS T STAT SIG ----- .................... ----------- ------------------ ------ --- 1 neg control 93.500 93.500 2 4 9 94.750 94.750 -0.155 3 101 97.500 97.500 -0.497 4 196 72.500 72.500 2.608 *
............................................................................ Dunnett table value = 2.29 (1 Tailed Value, P=0.05, df=12,3)
survival ( % ) File: 3104sn Transform: NO TRANSFORMATION
DUNNETTS TEST - TABLE 2 OF 2 Ho:Control<Treatment ............................................................................
NUM OF Minimum Sig Diff % of DIFFERENCE GROUP IDENTIFICATION REPS (IN ORIG. UNITS) CONTROL FROM CO~TROL
1 neg control 4 2 4 9 4 18.437 19.7 -1 2 5 0 3 10 1 4 18.437 19.7 -4.000 4 196 4 18.437 19.7 21.000
..............................................................................
survival ( % ) File: 3104sn Transform: NO TRANSFORMATION
Page 18 of 32
' L .
Data Evaluation Report on the Toxicity of Ziram to Fathead Minnow (Primephales promelas), Early Life Cycle PMRA Submission Number {..... .) EPA MRID Number 46893 1-04
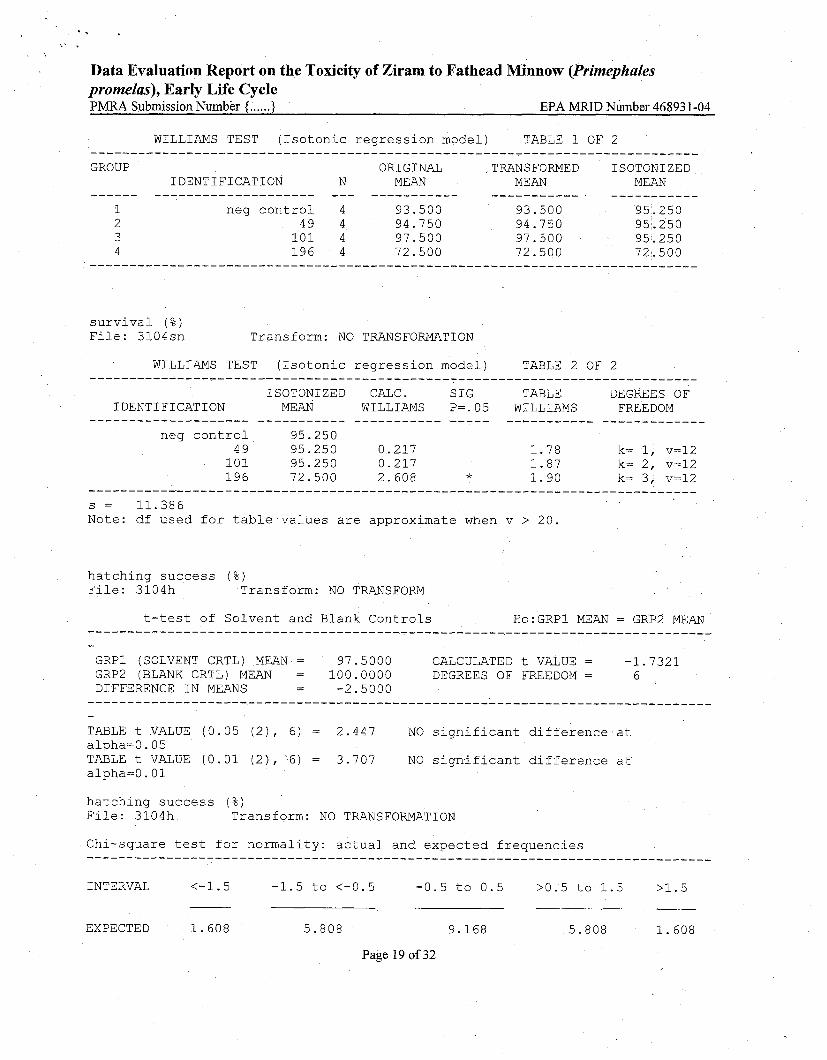
WILLIAMS TEST (Isotonic regression model) TABLE 1 OF 2 ............................................................................ GROUP ORIGINAL TRANS FORMED ISOTONIZED
IDENTIFICATION N MEAN MEAN MEAN ------ .................... --- ----------- ----------- -----------
1 neg control 4 93.500 93.500 95.250 2 49 4 94.750 94.750 95.250 3 101 4 97.500 97.500 95.250 4 196 4 72.500 72.500 72.500
............................................................................
survival ( % ) File: 3104sn Transform: NO TRANSFORMATION
WILLIAMS TEST (Isotonic regression model) TABLE 2 OF 2
ISOTONIZED CALC. SIG TABLE DEGREES OF IDENTIFICATION MEAN WILLIAMS P=.05 WILLIAMS FREEDOM
.................... ----------- ----------- ----- --------7-- ------------- neg control 95.250
4 9 95.250 0.217 1.78 k= 1, v=12 10 1 95.250 0.217 1.87 k= 2, v=12 196 72.500 2.608 * 1.90 k= 3, v=12
s = 11.386 Note: df used for table values are approximate when v > 20.
hatching success ( % ) File: 3104h Transform: NO TRANSFORM
t-test of Solvent and Blank Controls Ho:GRPl MEAN = GRP2 MEAN .............................................................................. - GRPl (SOLVENT CRTL) MEAN= 97.5000 CALCULATED t VALUE = -1.7321 GRP2 (BLANK CRTL) MEAN = 100.0000 DEGREES OF FREEDOM =
- 6
DIFFERENCE IN MEANS - -2.5000 .............................................................................. - TABLE t VALUE (0.05 (2) , 6) = 2.447 NO significant difference at alpha=0.05 TABLE t VALUE (0.01 (2), 6) = 3.707 NO significant difference at alpha=0.01
hatching success ( % ) File: 3104h Transform: NO TRANSFORMATION
Chi-square test for normality: actual and expected frequencies ______---_-------_------------------------------------------------------------
INTERVAL <-1.5 -1.5 to <-0.5 -0.5 to 0.5 >0.5 to 1.5 >1.5
EXPECTED 1.608 5.808 9.168 5.808 1.608
Page 19 of 32

Data Evaluation Report on the Toxicity of Ziram to Fathead Minnow (Primephales promelas), Early Life Cycle PMRA Submission Number ( ...... ) EPA MRID Number 46893 1-04
OBSERVED 0 9 6 9 0
Calculated Chi-square goodness of fit test statistic = 7.8193 Table Chi-Square value (alpha = 0.01) = 13.277
Data PASS normality test. Continue analysis.
hatching success ( % ) File: 3104h Transform: NO TRANSFORMATION
Shapiro Wilks test for normality ..............................................................................
Critical W (P = 0.05) (n = 24) = 0.916 Critical W (P = 0.01) (n = 24) = 0.884
Data PASS normality test at P=0.01 level. Continue analysis.
hatching success ( % ) File: 3104h Transform: NO TRANSFORMATION
Hartley test for homogeneity of variance ..............................................................................
I
Calculated H statistic (max Var/min Var) = ' 18.67 Closest, conservative, Table H statistic = 184.0 (alpha = 0.01)
Used for Table H ==> R ( # groups) = 6, df ( # reps-1) = 3 Actual values ==> R ( # groups) = 6, df ( # avg reps-1) = 3.00
..............................................................................
Data PASS homogeneity test. Continue analysis.
NOTE: This test requires equal replicate sizes. If they are unequal but do not differ greatly, the Hartley test may still be used as an approximate test (average df are used).
hatching success ( % ) File: 3104h Transform: NO TRANSFORMATION
Bartletts test for homogeneity of variance ..............................................................................
Calculated B statistic = 9.14
Page 20 of 32

Data Evaluation Report on the Toxicity of Ziram to Fathead Minnow (Primephales promelas), Early Life Cycle PMRA Submission Number ( . .. ... ) EPA MRID Number 46893 1-04
Table Chi-square value = 15.09 (alpha = 0.01) Table Chi-square value = 11.07 (alpha = 0.05)
Average df used in calculation ==> df ( a v g n - 1) = 3.00 Used for Chi-square table value ==> df (#groups-1) = 5 ..............................................................................
Data PASS homogeneity test at 0.01 level. Continue analysis.
NOTE: If groups have unequal replicate sizes the average replicate size is used to calculate the B statistic (see above).
hatching success ( % ) File: 3104h Transform: NO TRANSFORMATION
ANOVA TABLE ..............................................................................
SOURCE D F S S MS F .............................................................................. Between 5 25262.500 5052.500 154.799
Within (Error) 18 587.500 32.639 __---___------_--------------------------------------------------------------- Total 2 3 25850.000 ..............................................................................
Critical F value = 2.77 (0.05,5,18) Since F > Critical F REJECT Ho:A11 groups equal
hatching success ( % ) File: 3104h Transform: NO TRANSFORMATION
DUNNETTS TEST - TABLE 1 OF 2 Ho:Control<Treatment ............................................................................
TRANSFORMED MEAN CALCULATED IN GROUP IDENTIFICATION MEAN ORIGINAL UNITS T STAT SIG ----- .................... ----------- ------------------ ------ --- 1 neg control 97.500 97.500 2 4 9 97.500 97.500 0.000 3 101 98.750 98.750 -0.309 4 19 6 95.000 95.000 0.619 5 3 95 96.250 96.250 0.309 6 7 5 0 10.000 10.000 21.660 *
___-__^---------------------------------------------------------------------
Dunnett table value = 2.41 (1 Tailed Value, P=0.05, df=18,5)
hatching success ( % ) File: 3104h Transform: NO TRANSFORMATION
DUNNETTS TEST - TABLE 2 OF 2 Ho:Control<Treatment _____---_--------_----------------------------------------------------------
NUM OF Minimum Sig Diff % of DIFFERENCE
Page 2 1 of 32

Data Evaluation Report on the Toxicity of Ziram to Fathead Minnow (Primephales promelas), Early Life Cycle PMRA Submission Number ( . . . . . .) EPA MRID Number 46893 1-04
GROUP IDENTIFICATION REPS (IN ORIG. UNITS) CONTROL FROM CONTROL ----- ------- ---------------- ------- ------------ 1 neg control 4 2 4 9 4 9.736 10.0 0.000 3 10 1 4 9.736 10.0 -1.250 4 19 6 4 9.736 10.0 2.500 5 3 9 5 4 9.736 10.0 1.250 6 750 4 9.736 10.0 87.500
..............................................................................
hatching success ( % ) File: 3104h Transform: NO TRANSFORMATION
WILLIAMS TEST (Isotonic regression model) TABLE 1 OF 2
GROUP ORIGINAL TRANSFORMED ISOTONIZED IDENTIFICATION N MEAN MEAN MEAN
------ .................... --- ----------- ----------- ----------- 1 neg control 4 97.500 97.500 97.917 2 49 4 97.500 97.500 97,917 3 101 4 98.750 98.750 97.917 4 196 4 95.000 95.000 95.625 5 395 4 96.250 96.250 95.625 6 750 4 10.000 10.000 10,000
hatching success ( % ) File: 3104h Transform: NO TRANSFORMATION
WILLIAMS TEST (Isotonic regression model) TABLE 2 OF 2 ............................................................................
ISOTONIZED CALC. SIG TABLE DEGREGS OF IDENTIFICATION MEAN WILLIAMS P= .05 WILLIAMS FSEEDOM
__--____--__--_---_- ----------- ----------- ----- -------_--- _------_---__ neg control 97.917
4 9 97.917 0.103 1.73 k= 1, v=18 101 97.917 0.103 1.82 k= 2, v=18 196 95.625 0.4 64 1.85 k= 3, v=18 395 95.625 0.464 1.86 k= 4, v=18 750 10.000 21.660 * 1.87 k= 5, v=18
............................................................................ s = 5.713 Note: df used for table values are approximate when v > 20.
Estimates of EC% ........................................................................ Parameter Estimate 95% Bounds Std.Err. Lower Bound
Lower Upper /Estimate EC5 4.4E+02 2.53+02 7.7E+02 0.12 0.56 EClO 4.7E+02 2.8E+02 7.7E+02 0.11 0.60 EC2 5 5.2E+02 3.6E+02 7.7E-i-02 0.081 0.68 EC50 5.9E+02 4.63+02 7.63+02 0.053 0.78
Page 22 of 32

s - s
. Data Evaluation Report on the Toxicity of Ziram to Fathead Minnow (Primephales promelas), Early Life Cycle PMRA Submission Number (......I EPA MIUD Nuniber 46893 1-04
S l o p e = 1 2 . 3 S t d . E r r . = 6 . 2 8
G o o d n e s s o f f i t : p = 0 . 9 7 based o n DF= 3 . 0 2 2 . -----__--_--_---------------------------------------------------------*-
3104H : h a t c h i n g s u c c e s s ( % ) ........................................................................ O b s e r v e d vs . P r e d i c t e d T r e a t m e n t G r o u p Means ----------------------------------------------------------------------+-
D o s e # R e p s . O b s . P r e d . O b s . P r e d . % C h a n g e Mean Mean - P r e d . % C o n t r o l
f i s h l e n g t h F i l e : 3 1 0 4 1 T r a n s f o r m : NO TRANSFORM
t - t e s t o f S o l v e n t a n d B l a n k C o n t r o l s Ho:GRPl MEAN = GRP2 MEAN
GRPl (SOLVENT CRTL) MEAN = 2 1 . 4 7 5 0 CALCULATED t VALUE = - 1 . 2 1 9 1 GRP2 (BLANKCRTL) MEAN = 2 1 . 9 2 5 0 DEGREES OF FREEDOM =
- 6
DIFFERENCE I N MEANS - - 0 . 4 5 0 0
T A B L E t V A L U E ( 0 . 0 5 ( 2 ) , 6 ) = 2 . 4 4 7 N o s i g n i f i c a n t d i f f e r e n c e a t a l p h a = 0 . 0 5 TABLE t VALUE ( 0 . 0 1 ( 2 ) , 6 ) = 3 . 7 0 7 NO s i g n i f i c a n t d i f f e r e n c e a t a l p h a = 0 . 0 1
f i s h l e n g t h F i l e : 3 1 0 4 1 T r a n s f o r m : NO TRANSFORMATION
ANOVA TABLE ---------------------------------------------------L--------------------------
SOURCE DF S S MS F __--_---L--------------------------------------------------------------b------
B e t w e e n 3 1 . 5 5 5 0 . 5 1 8 2 . 1 8 6
W i t h i n ( E r r o r ) 1 2 2 . 8 4 5 0 . 2 3 7 .............................................................................. T o t a l 15 4 . 4 0 0 -------------------------------------------L---------------------------t------
C r i t i c a l F v a l u e = 3 . 4 9 ( 0 . 0 5 , 3 , 1 2 ) S i n c e F < C r i t i c a l F FAIL TO REJECT Ho:A11 g r o u p s e q u a l
Page 23 of 32

* - 6
*' . Data Evaluation Report on the Toxicity of Ziram to Fathead Minnow (Primephales promelas), Early Life Cycle PMRA Submission Number (.... ..) EPA MRID Number 46893 1-04
fish length File: 31041 Transform: NO TRANSFORMATION
DUNNETTS TEST - TABLE 1 OF 2
TRANSFORMED MEAN CALCULATED IN GROUP IDENTIFICATION MEAN ORIGINAL UNITS T STAT SIG ----- .................... ----------- ------------------ ------ --- 1 neg control 21.475 21.475 2 4 9 21.800 21.800 3 101 20.950 20.950 4 196 21.575 21.575
............................................................................ Dunnett table value = 2.29 (1 Tailed Value, P=0.05, df=12,3)
fish length File: 31041 Transform: NO TRANSFORMATION
DUNNETTS TEST - TABLE 2 OF 2 Ho:Control<Treatment\
NUM OF Minimum Sig Diff % of DIFFERENCE GROUP IDENTIFICATION REPS (IN ORIG. UNITS) CONTROL FROM CONTROL
neg control 4 4 9 4 101 4 196 4
fish length File: 31041 Transform: NO TRANSFORMATION
WILLIAMS TEST (Isotonic regression model) TABLE 1 OF 2
GROUP ORIGINAL TRANSFORMED ISOTONIZED I DENT I FI CAT ION N MEAN MEAN MEAN
------ .................... --- ----------- ----------- ----------- 1 neg control 4 21.475 21.475 21.408 2 49 4 21.800 21.800 21.408 3 101 4 20.950 20.950 21.408 4 196 4 21.575 21.575 21.575
fish length File: 31041 Transform: NO TRANSFORMATION
WILLIAMS TEST (Isotonic regression model) TABLE 2 OF 2 ............................................................................
ISOTONIZED CALC. SIG TABLE DEGREES OF IDENTIFICATION MEAN WILLIAMS P=.05 WILLIAMS FREEDOM
Page 24 of 32

Data Evaluation Report on the Toxicity of Ziram to Fathead Minnow (Primephales promelas), Early Life Cycle PMRA Submission Number ( . ..... ) EPA MRTD Number 46893 1-04
.................... ----------- ----------- ----- ---------_- -----_--_____ neg control 21.408
4 9 21.408 0.194 1.78 k= 1, v=12 101 21.408 0.194 1.87 k= 2, 'v=12 196 21.575 0.290 1.90 k= 3, v=12
............................................................................ s = 0.487 Note: df used for table values are approximate when v > 20.
wet weight File: 3104w Transform: NO TRANSFORM
t-test of Solvent and Blank Controls Ho:GRPl MEAN = GRP2 MEAN .............................................................................. - GRPl (SOLVENT CRTL) MEAN = 76.0000 CALCULATED t VALUE = -1.5036 GRP2 (BLANK CRTL) MEAN = 82.1500 DEGREES OF FREEDOM =
- 6
DIFFERENCE IN MEANS - -6.1500 .............................................................................. -
TABLE t VALUE (0.05 (2), 6) = 2.447 NO significant difference at alpha=0.05 TABLE t VALUE (0.01 ( 2 ) , 6) = 3.707 NO significant difference at alpha=0.01
wet weight File: 3104w Transform: NO TRANSFORMATION
Chi-square test for normality: actual and expected frequencies ..............................................................................
INTERVAL <-1.5 -1.5 to <-0.5 -0.5 to 0.5 >0.5 to 1.5 >1.5
EXPECTED 1.072 3.872 OBSERVED 0 5
_____-__-------_--_----------------------------------------------------------- Calculated Chi-square goodness of fit test statistic = 2.8033 Table Chi-Square value (alpha = 0.01) = 13.277
Data PASS normality test. Continue analysis.
wet weight File: 3104w Transform: NO TRANSFORMATION
Shapiro Wilks test for normality ___-____--____--_-------------------------------------------------------------
Critical W (P = 0.05) (n = 16) = 0.887
Page 25 of 32

Data Evaluation Report on the Toxicity of Ziram to Fathead Minnow (Primephales promelas), Early Life Cycle PMRA Submission Number (......I EPA MRID Number 46893 1-04
Critical W (P = 0.01) (n = 16) = 0.844 ..............................................................................
Data PASS normality test at P=0.01 level. Continue analysis.
wet weight File: 3104w Transform: NO TRANSEORMATION
Hartley test for homogeneity of variance ..............................................................................
Calculated H statistic (max Var/min Var) = 9.73 Closest, conservative, Table H statistic = 120.0 (alpha = 0.01)
Used for Table H ==> R ( # groups) = 4, df ( # reps-1) = 3 Actual values ==> R ( # groups) = 4, df ( # avg reps-1) = 3.00
Data PASS homogeneity test. Continue analysis.
NOTE: This test requires equal replicate sizes. If they are unequal but do not differ greatly, the Hartley test may still be used as an approximate test (average df are used).
wet weight File: 3104w Transform: NO TRANSFORMATION
Bartletts test for homogeneity of variance ..............................................................................
Calculated B statistic = 3.12 Table Chi-square value = 11.34 . (alpha = 0.01) Table Chi-square value = 7.81 (alpha = 0.05)
Average df used in calculation ==> df (avg n - 1) = 3.00 Used for Chi-square table value ==> df (#groups-1) = 3 ..............................................................................
Data PASS homogeneity test at 0.01 level. Continue analysis.
NOTE: If groups have unequal replicate sizes the average replicate size is used to calculate the B statistic (see above).
wet weight File: 3104w Transform: NO TRANSFORMATION
ANOVA TABLE ..............................................................................
SOURCE D F S S MS F .............................................................................. Between 3 341.015 113.672 4.767
Page 26 of 32

I . , i
, Data Evaluation Report on the Toxicity of Ziram to Fathead Minnow (Primephales promelas), Early Life Cycle PMRA Submission Number (.. ....) EPA MRID Number 46893 1-04
Within (Error) 12 286.135 23.845 .............................................................................. Total 15 627.150 ..............................................................................
Critical F value = 3.49 (0.05,3,12) Since F > Critical F REJECT Ho:A11 groups equal
wet weight File: 3104w Transform: NO TRANSFORMATION
DUNNETTS TEST - TABLE 1 OF 2 Ho:Control<Treatment ............................................................................
TRANSFORMED MEAN CALCULATED IN GROUP IDENTIFICATION MEAN ORIGINAL UNITS T STAT SIG
1 neg control 76.000 76.000 2 4 9 83.225 83.225 -2.092 3 10 1 72.800 72.800 0.927 4 196 83.475 83.475 -2.165
............................................................................ Dunnett table value = 2.29 (1 Tailed Value, P=0.05, df=12,3)
wet weight File: 3104w Transform: NO TRANSFORMATION
DUNNETTS TEST - TABLE 2 OF 2 Ho:Control<Treatment ............................................................................
NUM OF Minimum Sig Diff % of DIFFERENCE GROUP IDENTIFICATION REPS (IN ORIG. UNITS) CONTROL FROM CONTROL ----- .................... ------- ---------------- ------- --------_---
1 neg control 4 2 4 9 4 7.907 10.4 -7.225 3 10 1 4 7.907 10.4 3.200 4 19 6 4 7.907 10.4 -7.475
.............................................................................
wet weight File: 3104w Transform: NO TRANSFORMATION
WILLIAMS TEST (Isotonic regression model) TABLE 1 OF 2 ............................................................................ GROUP ORIGINAL TRANSFORMED ISOTONIZED
IDENTIFICATION N MEAN MEAN MEAN ------ .................... --- ----------- ----------- -----------
1 neg control 4 76.000 76.000 76.000 2 49 4 83.225 83.225 78.013 3 101 4 72.800 72.800 78.013 4 196 4 83.475 83.475 83.475
............................................................................
Page 27 of 32

< a . \ '
k % .
Data Evaluation Report on the Toxicity of Ziram to Fathead Minnow (Primephales promelas), Early Life Cycle PMRA Submission Number (.. . . . .) EPA MRID Number 46893 1-04
wet weight File: 3104w Transform: NO TRANSFORMATION
WILLIAMS TEST (Isotonic regression model) TABLE 2 OF 2 ...................................................................... t-----
ISOTONIZED CALC. SIG TABLE DEGRE~S OF I DENT I FI CAT ION MEAN WILLIAMS Pz.05 WILLIAMS FREE~OM
.................... ----------- ----------- ----- ----------- ------I------ neg control 76.000
4 9 78.013 0.583 1.78 k= 1, v=12 101 78.013 0.583 1.87 k= 2, v=12 196 83.475 2.165 * 1.90 k= 3, v=12
s = 4.883 Note: df used for table values are approximate when v > 20.
dry weight File: 3104d Transform: NO TRANSFORM
t-test of Solvent and Blank Controls Ho:GRPl MEAN = GRPl2 MEAN .............................................................................. -
GRPl (SOLVENT CRTL) MEAN = 13.7250 CALCULATED t VALUE = -1.7989 GRP2 (BLANK CRTL) MEAN = 15.2000 DEGREES OF FREEDOM =
DIFFERENCE IN MEANS - - -1.4750 I I
.............................................................................. - TABLE t VALUE (0.05 (2), 6) = 2.447 NO significant difference at alpha=0.05 TABLE t VALUE (0.01 ( 2 ) , 6) = 3.707 NO significant difference at alpha=0.01
dry weight File: 3104d Transform: NO TRANSFORMATION
Chi-square test for normality: actual and expected frequencies -----------------------------------------------------------------------*------
INTERVAL <-I. 5 -1.5 to <-0.5 -0.5 to 0.5 >0.5 to 1.5 *I. 5 -
EXPECTED 1.340 4.840 OBSERVED 0 8
-----------------------------------------------------------------------*------ Calculated Chi-square goodness of fit test statistic = 4.8020 Table Chi-Square value (alpha = 0.01) = 13.277
Data PASS normality test. Continue analysis.
dry weight
Page 28 of 32

r . \ ,
L '
Data Evaluation Report on the Toxicity of Ziram to Fathead Minnow (Primephales promelas), Early Life Cycle PMRA Submission Number { ..... .) EPA MRID Number 46893 1-04
File: 3104d Transform: NO TRANSFORMATION
Shapiro Wilks test for normality ..............................................................................
D = 15.235
Critical W (P = 0.05) (n = 20) = 0.905 Critical W (P = 0.01) (n = 20) = 0.868 ..............................................................................
Data PASS normality test at P=0.01 level. Continue analysis.
dry weight File: 3104d Transform: NO TRANSFORMATION
Hartley test for homogeneity of variance ..............................................................................
Calculated H statistic ( m a ~ Var/min Var) = 16.02 Closest, conservativk, Table H statistic = 151.0 (alpha = 0.01)
Used for Table H ==> R ( # groups) = 5, df ( # reps-1) = 3 Actual values ==> R ( # groups) = 5, df ( # avg reps-1) = 3.00
Data PASS homogeneity test. Continue analysis.
NOTE: This test requires equal replicate sizes. If they are unequal but do not differ greatly, the Hartley test may still be used as an approximate test (average df are used).
dry weight File: 3104d Transform: NO TRANSFORMaTION
Bartletts test for homogeneity of variance
Calculated B statistic = 5.14 Table Chi-square value = 13.28 (alpha = 0.01) Table Chi-square value = 9.49 (alpha = 0.05)
Average df used in calculation ==> df (avg n - 1) = 3.00 Used for Chi-square table value ==> df (#groups-1) = 4 ..............................................................................
Data PASS homogeneity test at 0.01 level. Continue analysis.
NOTE: If groups have unequal replicate sizes the average replicate size is used to calculate the B statistic (see above).
Page 29 of 32

Data Evaluation Report on the Toxicity of Ziram to Fathead Minnow (Pvimephales promelas), Early Life Cycle PMRA Submission Number (.. ... .) EPA MRID Number 46893 1-04
dry weight File: 3104d Transform: NO TRANSFORMATION
ANOVA TABLE _--_----_-------_-----------------------------------------------------*-------
SOURCE DF SS MS F ----------------------------------------------------------------------+-------
Between 3 12.665 4.222 4.798
Within (Error) 12 10.555 0.880 .............................................................................. Total 15 23.220 ---------_------------------------------------------------------------4-------
Critical Fvalue = 3.49 (0.05,3,12) Since F > Critical F REJECT Ho:A11 groups equal
dry weight File: 3104d Transform: NO TRANSFORMATION
DUNNETTS TEST - TABLE 1 OF 2 Ho:Control<Treatment -----------------------------------------------------------------------+----
TRANSFORMED MEAN CALCULATED IN GROUP I DENT I FI CAT I ON MEAN ORIGINAL UNITS T STAT SIG ----- .................... ----------- ------------------ ------ --- 1 neg control 13.725 13.725 2 4 9 15.075 15.075 -2.035 3 10 1 12.650 12.650 1.621 4 19 6 14.350 14.350 -0.942
-----------------------------------------------------------------------*---- Dunnett table value = 2.29 (1 Tailed Value, P=0.05, df=12,3)
dry weight File: 3104d Transform: NO TRANSFORMATION
DUNNETTS TEST - TABLE 2 OF 2 Ho:Control<Treatment ............................................................................
NUM OF Minimum Sig Diff % of DI FFEREHCE GROUP IDENTIFICATION REPS (IN ORIG. UNITS) CONTROL FROM CO~TROL ----- .................... ------- ------------_--- ------- ------------ 1 neg control 4 2 4 9 4 1.519 11.1 -1.350 3 101 4 1.519 11.1 1.075 4 196 4 1.519 11.1 -0.625
..............................................................................
dry weight File: 3104d Transform: NO TRANSFORMATION
Page 30 of 32

' \
i. IL
4
Data Evaluation Report on the Toxicity of Ziram to Fathead Minnow (Primephales promelas), Early Life Cycle PMRA Submission Number {......I EPA MRID Number 46893 1-04
WILLIAMS TEST (Isotonic regression model) TABLE 1 OF 2 ............................................................................ GROUP ORIGINAL TRANSFORMED ISOTONIZED
IDENTIFICATION N MEAN MEAN MEAN ------ .................... --- ----------- ----------- -----+-----
1 neg control 4 13.725 13.725 13.725 2 49 4 15.075 15.075 13.863 3 101 4 12.650 12.650 13.863 4 196 4 14.350 14.350 14.350
............................................................................
dry weight File: 3104d Transform: NO TRANSFORMATION
WILLIAMS TEST (Isotonic regression model) TABLE 2 OF 2 -----___-__-----_-----------------------------------------------------------
ISOTONIZED CALC. SIG TABLE DEGREES OF IDENTIFICATION MEAN WILLIAMS P=.05 WILLIAMS FREEDOM
neg control 13.725 4 9 13.863 0.207 1.78 k= 1, v=12
101 13.863 0.207 1.87 k= 2, v=12 196 14.350 0.942 1.90 k= 3, v=12
............................................................................ s = 0.938 Note: df used for table values are approximate when v > 20.
Page 3 1 of 32
Data Evaluation Report on the Toxicity of Ziram to Fathead Minnow (Primephales promelas), Early Life Cycle PMRA Submission Number (......I EPA MlUD Number 46893 1-04
APPENDIX 2: COPY OF REVIEWER'S TWA CALCULATIONS:
Measured Concentration Nominal Concentration (ug ai/L) Time (Day) (ug/L) TWA (ug/L)
Page 32 of 32