Texas MAP Users Conference - Plano Independent … · Texas MAP Users Conference ... Participants...
12
Ninth Annual Thursday, February 11, 2016 The Sockwell Center Plano ISD, Plano, TX 8:15 am to 3:30 pm Texas MAP Users Conference Plano Independent School District Assessment and Accountability Plano, Texas
Transcript of Texas MAP Users Conference - Plano Independent … · Texas MAP Users Conference ... Participants...

Ninth Annual
Thursday, February 11, 2016
The Sockwell Center
Plano ISD, Plano, TX
8:15 am to 3:30 pm
Texas MAP Users Conference
Plano Independent School District Assessment and Accountability
Plano, Texas
“Save the Date”… for next years
10th Annual Texas MAP Users Conference
Thursday, February 9, 2017
Make sure to check back often to the conference website for additional
information.
www.PISD.edu/TXMAPConference
**Wi-Fi access is available to PISD guests.
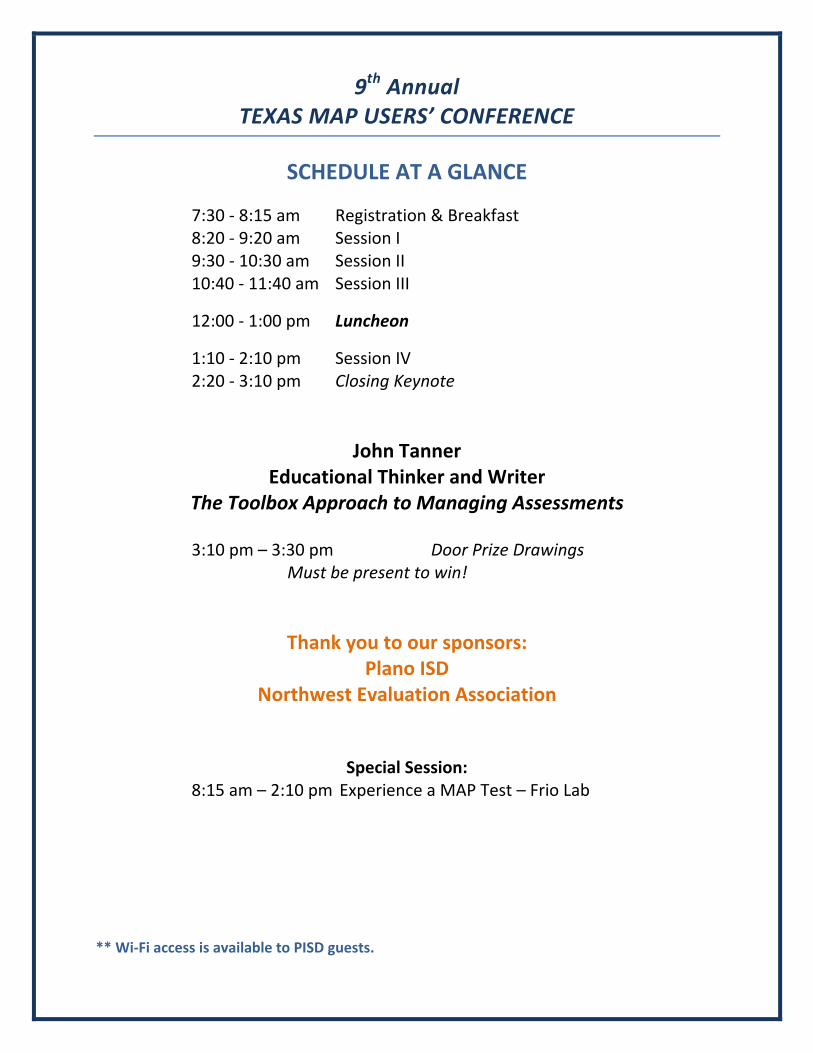
9th Annual TEXAS MAP USERS’ CONFERENCE
SCHEDULE AT A GLANCE
7:30 - 8:15 am Registration & Breakfast 8:20 - 9:20 am Session I 9:30 - 10:30 am Session II 10:40 - 11:40 am Session III
12:00 - 1:00 pm Luncheon
1:10 - 2:10 pm Session IV 2:20 - 3:10 pm Closing Keynote
John Tanner Educational Thinker and Writer
The Toolbox Approach to Managing Assessments 3:10 pm – 3:30 pm Door Prize Drawings Must be present to win!
Thank you to our sponsors: Plano ISD
Northwest Evaluation Association
Special Session:
8:15 am – 2:10 pm Experience a MAP Test – Frio Lab ** Wi-Fi access is available to PISD guests.
Presenters
Vicky Billings – Account Manager, NWEA
Dr. John Cronin – Director, Kingsbury Center for Research on
Academic Growth, NWEA
Dr. Paul Dabbs – Assistant Director, Research and Campus Data
Support, Plano ISD
Kristina Faraday – Texas Educator/K-12 Solutions Consultant,
Edmentum
Ebony Forte – District Support Manager, Garland ISD
Mike Harris – Web based MAP Product Manager, NWEA
Thomas Hay – Director of Data Strategy, Uplift Education
Dave Irby – Senior Account Executive, NWEA
Lydia Li - Data Management Coordinator, Plano ISD
Susan Klassen – Senior Account Executive, NWEA
Jennifer Ruth –Elementary Achievement Specialist, Plano ISD
Joseph Selvog-Durand – Educational Consultant, Edmentum
Kathy Schadt - Assessment Technical Assistant, Plano ISD
John Tedford – Secondary Achievement Specialist, Plano ISD

Vendor Exhibits 8:15 am – 2:10 pm
Study Island©-edmentum, Inc. See how Study Island and NWEA partner to Drive Student Success. Facilitators: Kristina Faraday and Lauren Noblett
NWEA Have your questions answered about MAP informational session. Facilitators: Dave Irby, Pete Gonzales, Misty Kainer, and Mark Kessler Compass Learning When NWEA data is coupled with Compass Learning Pathblazer students are able to receive instruction in their zone of proximal development and exceed learning expectations. Facilitators: Amanda Aberle and Cassidy Macias Mach B Technologies - Edugence Comprehensive web based Student, Learning and Instruction Management platform enables teachers to provide individualized instruction based on a defined continuous improvement process. It provides the tools to develop curriculum, lesson plans and assessments aligned to the Texas Essential Knowledge and Skills. Facilitator: Alf Nizam Odysseyware Empower students to build proficiency and content mastery, capture accomplishments, and engage with rich and challenging real-world concepts in the classroom or at home. Facilitator: Chris Breit We would like to thank all our vendors for their generosity in providing the door prizes for the drawing at the end of the day.
You must be present to win! **Wi-Fi access is available to PISD guests

The ABC’s of MAP Dallas Room
Dave Irby, NWEA If you are new to Measures of Academic Progress (MAP) and want to know what all the fuss is about, this breakout is for you. The session will provide an introduction to MAP including a discussion of the RIT scale, normative and comparative data, and typical ways that districts and schools use MAP, and sample reports.
MAP and Student Learning Objectives (SLO) Austin/San Antonio Room
Paul Dabbs, Plano ISD The Student Learning Objective (SLO) Model in Texas provides a framework for continuous dialogue between students, teachers and principals to support teacher development and student growth throughout the year. This presentation describes how the MAP progress monitoring measures developed in Plano ISD are aligned to the Guiding Principles and Design Attributes of the SLO Process. These monitoring and reporting methods are ideally suited to development of Student Learning Objectives for all MAP user districts.
Children’s Progress Academic Assessment
Rio Grande/Colorado Room Jennifer Ruth, Plano ISD What we have learned after a full year of implementation. Plano ISD has now been using CPAA (Children’s Progress Academic Assessment) for a full year. Now that we have a complete year of data from our pre-kindergarten students, we are able to understand the results in a much deeper way. In this process we have learned how capable our youngest learners actually are. We will present some background on this assessment and how we managed our first year of testing with CPAA. We will also share district level data from our first year of this assessment and how this data has inspired curriculum adjustments. Participants will leave with an understanding of how this assessment could benefit your students from a district that has learned by doing.
An Open Source Method of Building MAP Reports (Data File and Tableau)
Pecos Lab Thomas Hay, Uplift Education In this session, attendees will see a demonstration of how they can use the MAP Comprehensive Data File (CDF), along with the dashboarding tool Tableau Public to build interactive visualizations to illuminate trends and insights from your MAP data. Uplift Education will be sharing out their MAP Dashboards as part of this presentation, allowing users the chance to use or build upon them to customize for their own district use. Users who can download their CDF and Tableau Public on their laptops prior to the session are encouraged to follow along. *Repeated at Session III
Creating College Success – How better information helps students succeed
Brazos Lab John Cronin – NWEA College and Career Readiness are one of education’s latest hot topics. In this session, learn how NWEA MAP tests can support predictions of ACT success as part of assessing a student’s academic readiness for college. Learn how to have conversations with students and parents to get them excited about the possibilities for their education post-high school. We will also review other important factors research has shown to significantly enhance the likelihood of success in college, such as Academic Tenacity and College Knowledge.
Experience a MAP Test
Frio Lab Lydia Li, Data Management Coordinator, and Kathy Schadt, Assessment Technical Assistant, Plano ISD
Take a sample MAP Test just like your students.
*Repeated at Session II, III, & IV
Session I 8:20 am to 9:20 am

Growth & Proficiency Reports: What’s New? Dallas Room
Vicky Billings, NWEA NWEA continues to improve data and reporting options for campus and district instructional leaders and administrators. During this session, we will review 2015-16 changes and how these may positively impact the way you utilize MAP data at the campus and district level. Sample reports we will review: Achievement Status and Growth (ASG) class quadrant chart and school spreadsheet reports; Student Growth Summary with discussion of fall to spring and (new) winter to spring growth projections; Class Breakdown by Projected Proficiency; and Projected Proficiency Summary. This session is most appropriate for campus and district level MAP leaders. *Repeated at Session III
MAP Update - What's New and coming to MAP! Austin/San Antonio Room
Michael Harris – NWEA NWEA MAP Product Manager Michael Harris will cover recent changes to MAP, speak about what is coming to MAP in the near future, and ask for participants' feedback to help guide upcoming improvements in the platform.
MAP 101- Surviving the First Year Rio Grande/Colorado Room
Eboney Forte - Garland ISD Is your district considering using NWEA MAP as an assessment piece? MAP is a wonderful tool, but you may be asking yourself “Where do I start, and what can I expect on the implementation side?” Just thinking about adopting MAP, and getting it set up can be daunting; not to mention training faculty and staff on its various components. However, it can also be rewarding. Garland ISD implemented MAP and MPG for the first time during the 2014-15 school year. This session is an overview of our experiences during that first year. We will discuss the process from inception through execution: the good, the bad and the (not so) ugly. We encourage you to join in on our discussion and to bring any questions that you may have about MAP implementation.
*Repeated at Session IV
Using MAP in Conjunction with other Data to Identify TIER II and III Students
Pecos Lab Jennifer Ruth - Plano ISD There are many different ways of looking at MAP data to identify students who may be at risk. We have examined the relationship between MAP and STAAR scores of students in our district to identify students who may have a lower likelihood of success on STAAR. Our data analysis in this area allows us to have internal conversations about a student’s level of need and effectively communicate that level of need to parents. Because we advocate looking at several data points before making instructional decisions, we will also share other ways that we connect MAP to other data sources in order to get a more complete picture of what our students know and are able to do. *Repeated at Session III
Study Island Partners with NWEA to Enhance Instruction and Raise Student Achievement
Brazos Lab Kristina Faraday – Edmentum/Study Island Joseph Selvog-Durand - Edmentum/Study Island Study Island has partnered with the Northwest Evaluation Association (NWEA) to offer a fully integrated solution that uses a student's Measure of Academic Progress (MAP) assessment results to create an individualized learning path delivered through the Study Island program. Study Island and NWEA customers can easily pinpoint academic strengths and weaknesses through their NWEA MAP test results, and then automatically target those areas with Study Island's rigorous, standards-based content. Each student will receive a unique learning path within Study Island based on their individual MAP Rasch unit (RIT) scores. This hands-on session will allow participants to experience individualized learning from the student perspective; and develop ideas to support instructional technology integration within blended learning environments.
*Repeated at Session III
Experience a MAP Test Frio Lab
Lydia Li, Data Management Coordinator, and Kathy Schadt, Assessment Technical Assistant, Plano ISD
Take a sample MAP Test just like your students.
*Repeated at Session I, III, & IV
Session II 9:30 am to 10:30 am

Growth & Proficiency Reports: What’s New?
Dallas Room Vicky Billings, NWEA NWEA continues to improve data and reporting options for campus and district instructional leaders and administrators. During this session, we will review 2015-16 changes and how these may positively impact the way you utilize MAP data at the campus and district level. Sample reports we will review: Achievement Status and Growth (ASG) class quadrant chart and school spreadsheet reports; Student Growth Summary with discussion of fall to spring and (new) winter to spring growth projections; Class Breakdown by Projected Proficiency; and Projected Proficiency Summary. This session is most appropriate for campus and district level MAP leaders. *Repeated at Session II
Basic Teacher Reports
Austin/San Antonio Room Susan Klassen, NWEA Learn how to navigate through NWEA's online reports to find the top five reports all teachers should be accessing. These include the Individual Student Report, Class Report, Student Goal Setting Worksheet, Achievement Status and Growth Report, and Projected Proficiency Summary Report. We will review how to read these reports and use the data to inform instruction *Repeated at Session IV
Using MAP in Conjunction with other Data to Identify TIER II and III Students
Rio Grande/Colorado Room Jennifer Ruth - Plano ISD There are many different ways of looking at MAP data to identify students who may be at risk. We have examined the relationship between MAP and STAAR scores of students in our district to identify students who may have a lower likelihood of success on STAAR. Our data analysis in this area allows us to have internal conversations about a student’s level of need and effectively communicate that level of need to parents. Because we advocate looking at several data points before making instructional decisions, we will also share other ways that we connect MAP to other data sources in order to get a more complete picture of what our students know and are able to do. *Repeated at Session II
An Open Source Method of Building MAP Reports (Data File and Tableau)
Pecos Lab Thomas Hay, Uplift Education In this session, attendees will see a demonstration of how they can use the MAP Comprehensive Data File (CDF), along with the dashboarding tool Tableau Public to build interactive visualizations to illuminate trends and insights from your MAP data. Uplift Education will be sharing out their MAP Dashboards as part of this presentation, allowing users the chance to use or build upon them to customize for their own district use. Users who can download their CDF and Tableau Public on their laptops prior to the session are encouraged to follow along. *Repeated at Session I
Study Island Partners with NWEA to Enhance Instruction and Raise Student Achievement
Brazos Lab Kristina Faraday – Edmentum/Study Island Joseph Selvog-Durand - Edmentum/Study Island Study Island has partnered with the Northwest Evaluation Association (NWEA) to offer a fully integrated solution that uses a student's Measure of Academic Progress (MAP) assessment results to create an individualized learning path delivered through the Study Island program. Study Island and NWEA customers can easily pinpoint academic strengths and weaknesses through their NWEA MAP test results, and then automatically target those areas with Study Island's rigorous, standards-based content. Each student will receive a unique learning path within Study Island based on their individual MAP Rasch unit (RIT) scores. This hands-on session will allow participants to experience individualized learning from the student perspective; and develop ideas to support instructional technology integration within blended learning environments.
*Repeated at Session II
Experience a MAP Test Frio Lab
Lydia Li, Data Management Coordinator, and Kathy Schadt, Assessment Technical Assistant, Plano ISD
Take a sample MAP Test just like your students.
*Repeated at Session I, II, & IV
Session III 10:40 am to 11:40 am

How Plano Uses MAP for Instructional Decisions Dallas Room
John Tedford, Plano ISD Plano ISD utilizes MAP assessment to help guide instructional decisions at all levels of students. We will walk through the process that we use in the district to help identify underachieving students, direct instructional interventions and to re-evaluate progress. The basis for the process is our “Probability Range”, “Ability-Performance Charts”, and the “MAP Learning Statements- TEKS Alignment Project” which helps to identify individual learning statements that students are ready to work on. Using this tool and other assessments, such as STAAR and CogAT, we are able to help guide our teachers through an improvement cycle
Basic Teacher Reports Austin/San Antonio Room
Susan Klassen, NWEA Learn how to navigate through NWEA's online reports to find the top five reports all teachers should be accessing. These include the Individual Student Report, Class Report, Student Goal Setting Worksheet, Achievement Status and Growth Report and Projected Proficiency Summary Report. We will review how to read these reports and use the data to inform instruction. *Repeated at Session III
MAP 101- Surviving the First Year Rio Grande/Colorado Room
Eboney Forte - Garland ISD Is your district considering using NWEA MAP as an assessment piece? MAP is a wonderful tool, but you may be asking yourself “Where do I start, and what can I expect on the implementation side?” Just thinking about adopting MAP, and getting it set up can be daunting; not to mention training faculty and staff on its various components. However, it can also be rewarding. Garland ISD implemented MAP and MPG for the first time during the 2014-15 school year. This session is an overview of our experiences during that first year. We will discuss the process from inception through execution: the good, the bad and the (not so) ugly. We encourage you to join in on our discussion and to bring any questions that you may have about MAP implementation.
*Repeated at Session II
Objectives Level Reporting Pecos Lab
John Cronin, NWEA How does one get more granular information from MAP results that can be used by a school or district to guide instruction? This session will introduce a prototype report, still in development, that shows how we might approach this question and offer information to schools that provides laser focus on curricular strengths and weaknesses within the curriculum.
Experience a MAP Test Frio Lab
Lydia Li, Data Management Coordinator, and Kathy Schadt, Assessment Technical Assistant, Plano ISD
Take a sample MAP Test just like your students.
*Repeated at Session I, II, & III
Session IV 1:10 pm to 2:10 pm
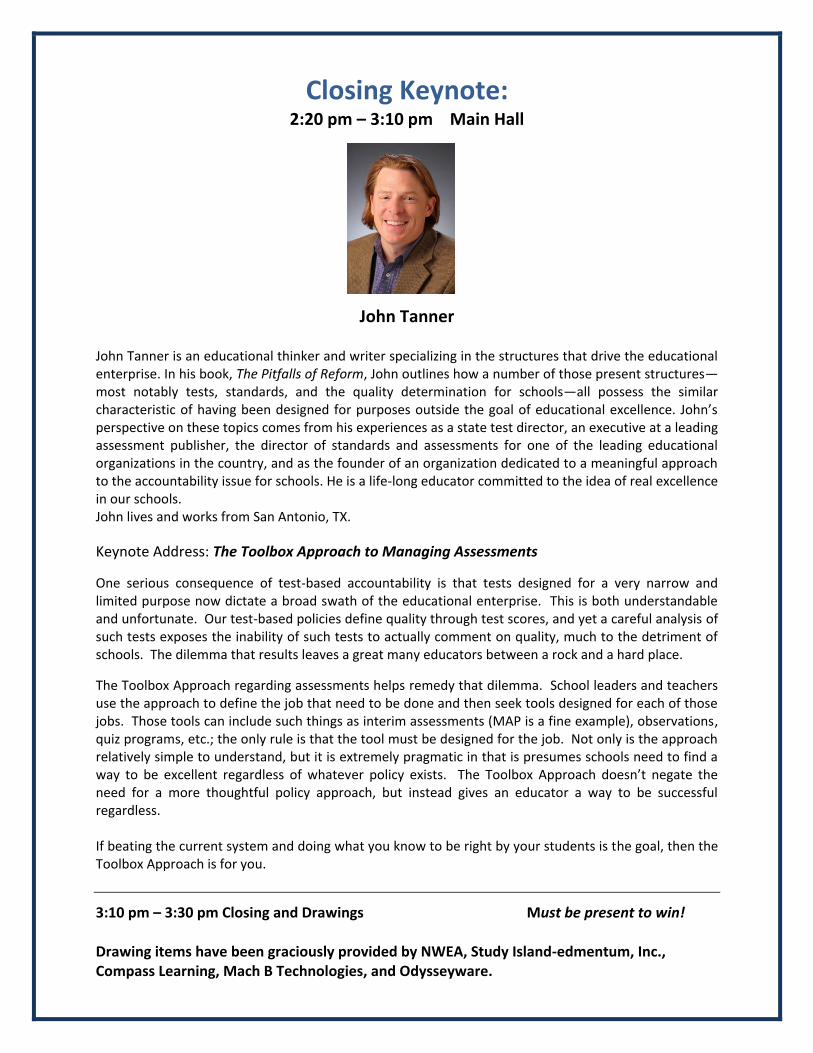
Closing Keynote: 2:20 pm – 3:10 pm Main Hall
John Tanner
John Tanner is an educational thinker and writer specializing in the structures that drive the educational enterprise. In his book, The Pitfalls of Reform, John outlines how a number of those present structures—most notably tests, standards, and the quality determination for schools—all possess the similar characteristic of having been designed for purposes outside the goal of educational excellence. John’s perspective on these topics comes from his experiences as a state test director, an executive at a leading assessment publisher, the director of standards and assessments for one of the leading educational organizations in the country, and as the founder of an organization dedicated to a meaningful approach to the accountability issue for schools. He is a life-long educator committed to the idea of real excellence in our schools. John lives and works from San Antonio, TX.
Keynote Address: The Toolbox Approach to Managing Assessments
One serious consequence of test-based accountability is that tests designed for a very narrow and limited purpose now dictate a broad swath of the educational enterprise. This is both understandable and unfortunate. Our test-based policies define quality through test scores, and yet a careful analysis of such tests exposes the inability of such tests to actually comment on quality, much to the detriment of schools. The dilemma that results leaves a great many educators between a rock and a hard place.
The Toolbox Approach regarding assessments helps remedy that dilemma. School leaders and teachers use the approach to define the job that need to be done and then seek tools designed for each of those jobs. Those tools can include such things as interim assessments (MAP is a fine example), observations, quiz programs, etc.; the only rule is that the tool must be designed for the job. Not only is the approach relatively simple to understand, but it is extremely pragmatic in that is presumes schools need to find a way to be excellent regardless of whatever policy exists. The Toolbox Approach doesn’t negate the need for a more thoughtful policy approach, but instead gives an educator a way to be successful regardless. If beating the current system and doing what you know to be right by your students is the goal, then the Toolbox Approach is for you.
3:10 pm – 3:30 pm Closing and Drawings Must be present to win! Drawing items have been graciously provided by NWEA, Study Island-edmentum, Inc., Compass Learning, Mach B Technologies, and Odysseyware.

My Conference Schedule 9th Annual Texas MAP Users’ Conference - February 11, 2016 - Plano, Texas
Check each session in which you participated. Turn into your principal or administrator for Professional
Development hours.
NAME__________________________________ CAMPUS/DEPARTMENT____________________
Time Session Title Presenter(s) Check
Box
8:20 – 9:20 am MAP and Student Learning Objectives (SLO) Paul Dabbs
8:20 – 9:20 am The ABC’s of MAP Dave Irby
8:20 – 9:20 am Children’s Progress Academic Assessment Jennifer Ruth
8:20 – 9:20 am An Open Source Method of Building MAP Reports Thomas Hay
8:20 – 9:20 am Creating College Success – How better information helps students succeed
John Cronin
8:20 – 9:20 am Experience a MAP Test Lydia Li Kathy Schadt
9:30 – 10:30 am MAP Update – What’s New and Coming to MAP Michael Harris
9:30 – 10:30 am Growth & Proficiency Reports: What’s New Vicky Billings
9:30 – 10:30 am MAP 101 – Surviving the First Year Ebony Forte
9:30 – 10:30 am Using MAP in Conjunction with other Data to Identify Tier II and III Students
Jennifer Ruth
9:30 – 10:30 am Study Island Partners with NWEA to Enhance Instruction and Raise Student Achievement
Kristina Faraday Joseph Selvog-Durand
9:30 – 10:30 am Experience a MAP Test Lydia Li Kathy Schadt
10:40 – 11:40 am Basic Teacher Reports Susan Klassen
10:40 – 11:40 am Growth & Proficiency Reports: What’s New Vicky Billings
10:40 – 11:40 am Using MAP in Conjunction with other Data to Identify Tier II and III Students
Jennifer Ruth
10:40 – 11:40 am An Open Source Method of Building MAP Reports Thomas Hay
10:40 – 11:40 am Study Island Partners with NWEA to Enhance Instruction and Raise Student Achievement
Kristina Faraday Joseph Selvog-Durand
10:40 – 11:40 am Experience a MAP Test Lydia Li Kathy Schadt
1:10 – 2:10 pm Basic Teacher Reports Susan Klassen
1:10 – 2:10 pm How Plano Uses MAP for Instructional Decisions John Tedford
1:10 – 2:10 pm MAP 101 – Surviving the First Year Ebony Forte
1:10 – 2:10 pm Objectives Level Reporting John Cronin
1:10 – 2:10 pm Experience a MAP Test Lydia Li Kathy Schadt
** Wi-Fi access is available to PISD guests.

Sockwell Center Layout
Registration
Check-in
ch
Food & Drink
Service
Plano Independent School District Assessment and Accountability
Plano, Texas