TEXAS HURRICANE EVACUATION STUDY-storm tides might reach 4 feet. If 4-foot tides occur with high...
57
... ·.: . :: ... . ' . . . . •' ' .. ·.': I\tiiY'.·'; ·' •. '··· ••. ·' :' .. . . . · . . . ' '. . . . . : .,. : > : . : ::. : : ::::i · .. :: . . . · .. :': . : .. · .. : .. . :: ... : . ·' ,• .. ' ... : ,•. . . . . . . : . ; .. :0 • . .. . . . :. .... . . . ... . : : . : . ' . : .. ·: . . . : : .. : .; : : : : . ! ::;:: : : ; ':.' . . . . ' . . . . ·. ,:·;:::: . . ::: ·: ' ... · '• ' .. : .. .. : ,• . . '' '. ·,.'. '::' . '': :, : ·l:;:. . . . · ' . . ' ...... . .. · : . . : : : ::,:-:: :?( . . . . . . . . . . '. ''. •. . . : . . . :· . : ·::.:: :,:,:, :' A working paper TEXAS HURRICANE EVACUATION STUDY- Prepared for THE TEXAS COASTAL AND MARINE COUNCIL by TEXAS TRANSPORTATION INSTITUTE TEXAS A&M UNIVERSITY COLLEGE STATION, TEXAS Thomas Urbanik, II Prinaipa'l Investigator September 1978
Transcript of TEXAS HURRICANE EVACUATION STUDY-storm tides might reach 4 feet. If 4-foot tides occur with high...
... ·.: . :: ... . ' . . . . •'
' .. ·.': I\tiiY'.·'; ·' •. '··· ••. ·' :' .. . . . · . . . ' '.
. . . . : .,. : > : . : ::. : : ::::i · .. :: .
. .
· .. :':
. : ..
· .. : ..
. :: ... : . ·' ,• .. '
... : ,•. . . . . . . : . ;
..
:0 • . .. . . . :.
....
. . . ... . : ~ : . : . ' . :
.. ·:
. . . : : .. : . ; : : : : . -~ ! ::;:: : : ; ':.' . . . . ' . . . . ·. ,:·;:::: .
. ::: ·: ' ... · '• ' .. : .. .. : ,• . . ''
'. ·,.'. '::' .
'': :, : ·l:;:. . . . ·
' . . ' ...... . .. ·
: . . : : : ::,:-:: :?( . . . . . . . . . .
'. ''. •. . . : . . :::·:~:
. :· . : ·::.:: :,:,:, :'
A working paper
TEXAS
HURRICANE
EVACUATION STUDY-
Prepared for
THE TEXAS COASTAL AND MARINE COUNCIL
by
TEXAS TRANSPORTATION INSTITUTE TEXAS A&M UNIVERSITY COLLEGE STATION, TEXAS
Thomas Urbanik, II Prinaipa'l Investigator
September 1978
ACKNOWLEDGEMENTS
The Texas Transportation Institute wishes to express its appreciation to
the following individuals and organizations: Messrs. Joe Moseley and Howard ·-
Lee and Ms. Sally Oavenport,:Texas Coastal and MarineCouncil; and Or. Neil
Frank and Staff, National Hurricane Center.
ii
'.
EXECUTIVE SUMMARY
This report evaluates the ability of the existing highway system to
accommodate the evacuation of people from the Texas Gulf Coast barrier
islands prior to landfall of· a hurricane. Unfortunately, the state of the art
in predicting characteristics of storms netessary to evaluate the transpor
tation system capacity is not sufficiently definitive to make categorical
statements concerning hurricane evacuation. Neverthelesss there is sufficient
evidence to indicate that an evacuation problem may exist on all the Texas
barrier islands because roads may flood before people are aware of a potential
storm. The probability of occurrence of this problem, however, is unknown.
The available data base is sufficiently definitive to provide a reason
able estimate of the number of permanent residents and the maximum number of
vehicles that permanent residents have available for evacuation. It is also
possible to estimate the minimum time it would take to evacuate those permanent
residents and their vehicles. This information is summarized in Table ES-1.
The study did not include consideration of tourists because no data
existed to indicate when they might leave, or whether they might come during
the threat of a hurricane. It was, therefore, assumed that tourists would
leave in advance of the critical time period. If tourists need to be evacu
ated, evacuation times would increase.
The study indicated that winds of 50 mph and gusting to 75 mph can exist
10 to 20 hours prior to landfall of a hurricane. Since, winds of this mag
nitude can overturn trucks, motor homes and vehicles with trailers, consid
eration should be given to prohibiting these vehicles on the highways upon
issuance of a hurricane warning. This would undoubtedly require special
legislation.
Further data and study are needed in several areas. As a result of
iii
subsidence, precise elevations along IH-45 are unknown. The study shows that
evacuation may be possible if the elevation at which the roadway was con
structed still exists. The barrier islands, other than Galvestion Island~
all have critical roadway elevations in the range of four feet. Better data
are needed to determine when, with what probability, and with what types of
storm tides might reach 4 feet.
If 4-foot tides occur with high probability.18 to 36 or more hours prior
to a storm, as suggested by the National Weather Service, total evacuation of
the. barrier islands is not possible, given existing roadway conditions storms
and forecasting techniques. The resulting al ternati·ves are: 1) improve
storm fore·casting procedures; 2) change the roadway elevation; and 3) protect
people on the island during the storms rather than attempt evacuation. Each
of these alternatives warrants further consideration.
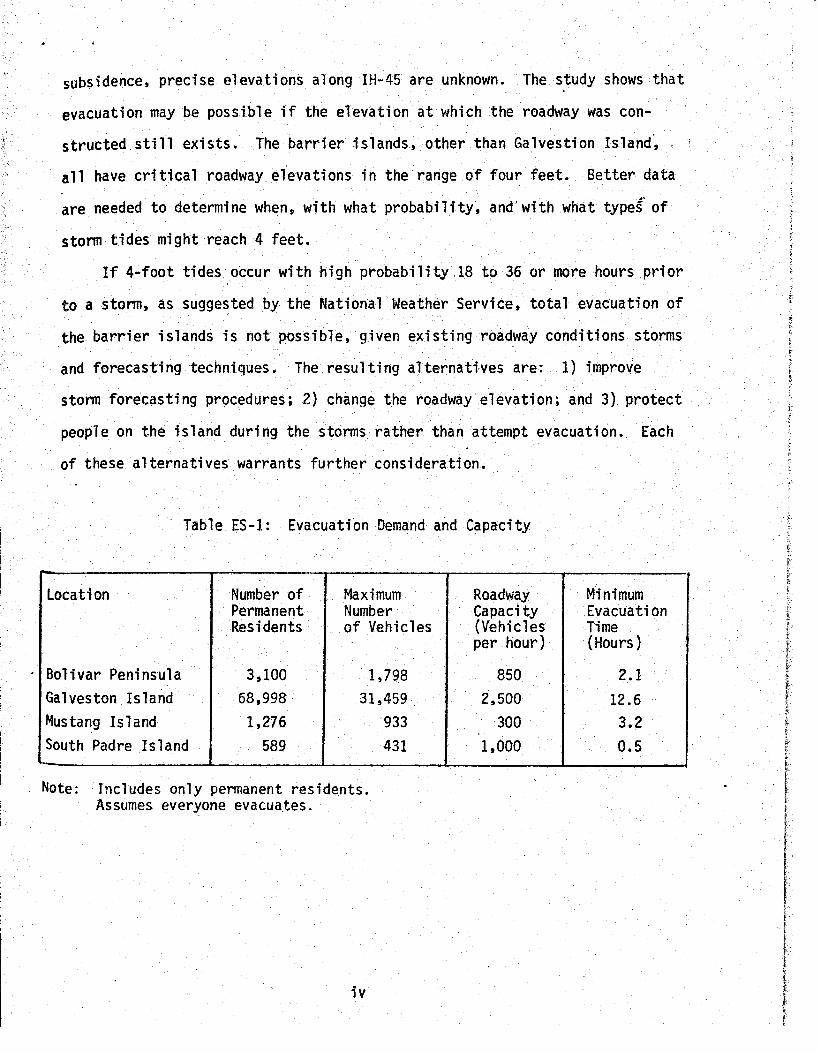
Table ES-1: Evacuation Demand and Capacity
Location Number of Maximum Roadway Minimum Permanent Number Capacity Evacuation Residents of Vehicles (Vehicles Time
per hour) (Hours)
Bolivar Peninsula 3,100 1,798 850 2.1 Galveston Island 68,998 31,459 2,500 12.6 Mus tang Is 1 and 1,276 933 300 3.2 South Padre Island 589 431 1,000 0.5
Note: Includes only permanent residents. Assumes everyone evacuates.
iv
TABLE OF CONTENTS
Acknowledgements • 0 ii
Executive Summary. • . iii .::
I. INTRODUCTION • • 1
II. DEMAND RELATIONSHIPS • 3
Demographic Factors • 3
Vehicle Factors 4
Response Factors. 5
Generalized Demand. 6
III. CAPACITY RELATIONSHIPS • 7
Definition. 7
Prevailing Conditions • 8
Generalized Capacity. 10
IV. EVALUATION OF TEXAS BARRIER ISLANDS. 11
Bolivar Peninsula • 11
Galveston Island. 12
Mustang Island. 15
South Padre Island. 17
v. SUMMARY AND CONCLUSIONS. 20
Appendix A • . . 22
Appendix B 39
Appendix C . 41
Appendix D • 48
Appendix E 50
References . 51
v
I. INTRODUCTION
The Texas Gulf Coast is subject to a diversity of natural hazards. This
study is only concerned with one of those hazards, hurricanes. The study is
further 1 imited primarily to consideration of the barrier islands along the
Texas Gulf Coast • .The scope of analysis i-s limited to a consideration of the
capac~ty of the existing highway system to accommodate the-evacuation of bar
rier island residents.
The study is concerned with both hurricanes and hurricane evacuation.
These storms produce striking changes in the sea; huge waves and storm tides
are generated. Hurricanes also trigger heavy rainfall, create high-velocity
winds, and spawn tornadoes. These conditions make staying on a barrier island
during landfall of a hurricane dangerous. They also make evacuation difficult,
and in some cases, impossible.
This study has two objectives concerning evacuation of the Texas Gulf . .,.
Coast barrier islands.
1) To ascertain if total evacuation is possible, given present populations and possible warning times, and if possible, how long it would take.
2) To determine what actions can improve the ability to evacuate barrier island residents.
An extensive search of the literature relative to hurricanes and hurricane
evacuation was made. Little information specifically about hurricane evacuation
capacity was found. Any attempts that were made utilized many assumptions,
some of questionable validity, in order to estimate demand/capacity relation
ships. The literature did contain information concerning response rates, but
response varied from 30 to nearly 100 percent. This report will hopefully
extend the state of the art in evaluating demand versus capacity.
1

During the .early stages of the study, an attempt was ma.de to develop a
model of tlle demand/capacity relationship. The thought was to break the
,problem into discrete components, such as environmental factors, physical
factors, and demographic factors. As work progressed, it became clear _Jhat
the process could not be easily broken into discrete components because
many factors were int~rrelated. This discrete component idea was subsequent
ly dropped; however, the process is sufficiently modular that different com
pOnents can be replaced as the state-of-the"'\art improves.
Instead of a model showing all the interactions, the analysis process has
been divided into two parts. A procedure will be developed to estimate the
demand in total vehicles that could reasonably be expected to evacuate d'uri ng
an approaching hurricane. Also, a procedure will ·be developed to estimate
the vehicle capacity of a street system under the environmental conditions
that precede landfall of a hurricane.
Finally, the analysis methodology will be applied to the barrier islands
along the Texas Gulf Coast that have significant populations. These areas
would include (from North to South) Bolivar Peninsula, Galvestion Island,
Mustang Island, and Padre Island.
2
I I. OEt-tAND RELATIONSHIPS
The vehicular demand for evacuation during a hurricane can be estimated
1n a three-step process. First, it is necessary to know how many people reside .. in the area under evaluation. Second, an estimate of how many vehicle~ and what
types of vehicles will be used in the evacuation. Third, it is· necessary .to
estimate the percentage of the residents that will leave. These factors are.
called demographic factors, vehicle factors, and response factors, respectively.
Although a fourth parameter, when will they leave, would be desirable,
the lack of data makes an alternative approach necessary. The approach to be
used is--given available capacity, when must evacuation begin to be sure that
an opportunity exists for everyone to evacuate. Far the purpose of this study,
two levels of demand will be analyzed. One level will be everyone residing in
the area; the second will be everyone likely to evacuate.
Demographic Factors
The starting place for population estimates is the 1970 Census of Popu
lation. Where reliable data of a mare current nature are availabll'.!, they are
used. The census data will also be used for estimating the number of automo
biles available for evacuation.
Although the summer population in coastal areas increases, there is no
evidence to indicate that tourists stay during the threat of a hurricane. In
fact, the threat of a hurricane appears to have an adverse effect on the tour
ist business. Pending evidence to the contrary, no consideration will be given
to tourist~ populations, although a fast moving storm my cut off some low-lying
areas with little or no warning.
3
There is, however, some likelihood of an increase in the number of .part
tfme residents who are interested in protecting their property (e.g., beach
houses) or possibly in removing valuables such as boats. Again, there are no
data available to quantify these relationships.
Vehicle Factors
Two vehicle factors are of importance in the demand estimate;..-how many
vehicles and what types will be used. The number of vehicles used is deter
mined by how many people will leave and how many people will be in each vehicle.
The types of vehicles used will depend on the types available, the number to
be used, and the pri.ority for using each type of vehicle, if a surplus of
vehicles exists.
There are some potentially conflicting desires in determining how many
vehicles will be used. For example, it may be desired to remove all, or as
many as possible, of a family's vehicles. This may or may not be possible
depending on the number of vehicles and the number of drivers. A conflicting
desire may be that a family does not want to separate during evacuation.
Nevertheless. the number of evacuees will be based on the number of
a~ailable vehicles. This is not unreasonable if we compare the number of
licensed drivers with the number of available vehicles on March 31, ~977. The
number of licensed drivers in Texas, according to the Department of Public
Safety, was 8,159,265 on March 31, 1977 wbich is the last day of the 1976 motor
vehicle registration year, and the most current available data. The number
of registered passenger vehicles was 6,534,582 according to the Texas State
Department of Highways and Public Transportation, Motor Vehicle Division.
Based on previous TTl research (1), approximately 30 percent of all trucks are
4
pickups used primarily as personal use vehicles. There were 2,265,785 trucks
of all types registered on March 31, 1977; therefore, approximately 679,736
pickups are used as personal vehicles. Together these b-Jo classes of vehicles
comprise a total of 7,214,318 vehicles.· The vehicle availability will be used
as the controlling factor on the total number of vehicles used during an
evacuation.
Response Factors
A difficult factor to estimate is what portion of the population will evac
uatee There may, h~Iever, be an obligation to provide an opportunity for every
one to evacuate. For this reason, one estimate of required evacuation time will
be made based on all residents evacuating. A second estimate of evacuation time
will b~ made pased o~ those most likely to leave.
Studies (2-.§.) of reaction to the threat of a hurricane indicate a \•tide
variation in response. The most significant influence on whether people evac-
uate or stay is the action of local public officials. This has been shown (5) - -
to be the case in an analysis of response to Carla. When the official position·
was a firm, uncompromising and unanimous request to evacuate, action followed.
The case on Galveston Island during Hurricane Carla was to allow citizens to
make the decisions to evacuate or take shelter. Several factors can be attri-
buted to the lack of an order to evacuate. Such a decision would be unpopular.
Also, the sea \'sall gives residents a feeling of security. Finally, the tradi
tion in Galveston has been to fight it out (i).
The evacuation percentage for various coastal communities has been shown
(2-~) to vary from 30 percent to 100 percent. Given a firm order to evacuate,
at least two-thirds of the population of larger urban areas could reasonably be
5
. ·tAd to leave. In smaller coastal communities, it may not be unreasonable c ·•"< <;
fJI to expect nearly 100 percent evacuation.
Generalized Demand
The following procedure is recoiTITiended to provide a planning estimate of
~~,~. First, estimate population (either presen~ or future as appropriate to
ti>ctt .analysis) using U.S. Census data or other reliable projection. Second,
·t•t~rmine the most current per capita vehicle rates for study area (or next
t.lt'9CSt geographical area for which both registered vehicles and population data
"'" .tvailable). The per capita rate is simply total registered autos and pick·
-.~;; .,_,ned as personal vehicles (use 30 percent of total trucks as an estimate
or rtckups if necessary) divided by total population for the same area. Third,
~~..-t(\nntne the maximum number of vehicles to be evacuated by multipling the pop
<,d.ttton by the per capita rate. The demand is then reduced by the appropriate
•t'\~~oflse factor (0.30 to 1.00).
6
III. CAPACITY RELATIONSHIPS
The ability to accommodate vehicular traffic is a primary consideration
tn the hurricane evacuation problem. Highway capacity is a measure of the
effectiveness of various highways in accommodating traffic. Traffic engineers
are familiar with methods of computing capacity under normal conditions. This
study will provide additional factors to adjust for environmental conditions
experienced prior to the landfall of hurricanes. These factors are necessary
because traffic engineers generally ignore the effects of rain, wind and acci
dents on capacity, since they occur relatively infrequently. During a hurricane
evacuation, they can be expected with reasonable certainty. In addition,
simplified techniques for determining capacity will ~e developed as a planning
tool for those not familiar with techniques for determining capacity.
Definition
Capacity is the maximum number of vehicles which has a reasonable expecta
tion of passing over a given section of a lane or roadway during a given time
period under prevailing roadway, traffic, and ambient conditions. In expressing
capacity, it is essential to state the prevailing roadway~ traffia and ambient
aonditions under Which the capacity is applicable.
The number of vehicles passing a given point on a roadway during periods
of heavy demand will be governed by one of the following:
1. The demand being placed upon the section of roadway by
vehicles desiring to use it at the particular time, or
2. .The capacity of the roadway at:
{a) The point of observation
7
(b) A point upstream; or
(c) A point downstream.
There are two points to be made relative to hurricane evacuation. First,
if the demand is less than the capacity, as in Item 1 above, a portion of .... the
possible capacity over a period of time is. lost and ,cannot be used. An example
will illustrate the point. If the capacity of a section of roadway is 1,000
vehicles per hour., the capacity is 10,000 vehicles for a 10-hour period. How
ever, if only 500 vehicles use the roadway in the first hour, the capacity in
the remaining nine hours is still 9,000 vehicles. After the first hour, the
maximum poss1ble utilization is only 9,500 vehicles for the 10-hour period.
The 500 vehicle capacity not used in the first hour 'is lost.
The second point. is that the capacity of an evacuation route is the
capacity of that section of roadway w.ith the least capacity. For example, if
an upstream section of roadway has a capacity of 500 vehicles per hour, a
downstream section having a capacity of 1,000 vehicles is of little signifi
cance. The previous statement is conditional upon the. fact that if an
incident (e.g., traffic accident) occurs on the section with the higher
capacity, the effect of the incident may be lessened or eliminated by the
effect of excess capacity.
Prevailing Conditions
The capacity of a section of roadway depends on a number of traffic con
ditions. Composition of traffic, roadway alignment, and number and width of
lanes are a few of those conditions which may be referred to collectively as
the prevailing conditions.
8
The prevailing conditions may be divided into three general groups: (1)
those that are established by the physical features of the roadway; (2) those
dep~ndent on the nature of traffic on the roadway; and (3) those dependent on
the environmental situation. Those in the first group, none of which can be
changed unless some construction or reconstruction takes place, are referred
to as prevailing roadzvay aonclitions • . Those in the second group, any of which
can be changed from hour to hour, are referred to as prevaiting traffia condi
tions.
The third type of prevailing condi.tions are usually ignored because they
occur during limited periods. This group of prevailing conditions is called
the ambient conditions. They are, however, a veryimportant consideration in
hurricane evacuation since they are very likely to occur and reduce capacity.
These conditions primarily relate to weather and include rain, wind, and high
tides. Ambient factors are developed in Appendix A, and are herein sunmarized.
Rain is shown to reduce capacity by a factor 0.84. Wind is shown to be a po
tenially serious problem for trucks, motor homes, and vehicles with trailers.
Prohibition of these vehicles during a hurricane warning, which would require
special legislation, is suggested as the appropriate remedy. Tides are con
sidered to reduce capacity to zero once a lane is half covered with water.
One note concerning number of lanes available for evacuation is appropri
ate. First, it is considered necessary by Civil Defense officials that one
lane be maintained for emergency and other authorized vehicles to enter the
evacuation area. If this assumption is accepted, it would be difficult to use
lanes other than those for traffic flow in the normal direction for evacuation.
The reason for this conclusion is that special traffic control such as traffic
cones and/or police officers would be necessary to designate which lanes could
or could not be used.
For this study only normal traffic lanes were considered for evacuation.
9

lhf~ is not to say, however, that if a traffic accident occurred, that reverse
rtow lanes would not be used for a short distance to bypass an accident.
Generalized Capacity
Generalized capacity figures are developed in Appendix A for several types
of highways--freeways and expressways, urban streets, 2-lane rural highways
and multilane rural highways. The various capacities are shown in Table 111-1.
Appendix A can also be used to determine the capacity of a specific roadway.
Table III-1: Generalized Capacities
Type of Facility Capacity Vehicles per Lane per hour
Freeways and Expressways 1150 Urban Streets 500 Two-lane rural highways 850 Multilane rural highways 1150
Note: Capacities include ambient condition adjustment for hurricanes, and an adjustment for poor roadway conditions (See Appendix A).
Evacuation Time
The minimum time required for evacuation is the total number of vehicles
divided by the total capacity at the critical point in the roadway network.
The critical point is that which has the lowest product of-number of lanes in
direction of evacuation times the appropriate capacity in Table 111-1.
10
~ .
IV. EVALUATION OF TEXAS BARRIER ISLANDS
A demand and capacity estimate is made for each of four Texas Barrier
Islands with significant populations. The four islands to be evaluated are
Bolivar Peninsula, Galveston Island, Mustang Island, and South Padre !slana.
Bolivar Peninsula
Bolivar Peninsula includes the communities of Port Bolivar, Crystal Beach,
Caplen and High Island. The most direct access to the mainland is via·state
Highway 124 (SH-124) at High Island.
Population
The 1970 U.S. Census (~) gives the population of the above mentioned
communities as 2424. A more recent study (I) estimates the 1978 population
to be 3100 and this figure will be used as the basis for projecting vehicles
available for evacuation.
Vehicles Available
The 1970 U.S. Census (~) indicates more than 1124 autos on the peninsula.
The exact number is not known since the Census Bureau uses only one category
for those having three or more autos. This per capita auto availability of
0.464 agrees well with the 1970 statewide per capita rate of 0.455 (See Appendix
E). Since the 1976 statewide per capita rate increased to 0.523, and since the
statewide per capita pickup truck rate for those used as personal vehicles was
11
0.054 • a per capita vehicle availability rate 0.58 will be used to estimate
v~hfcles available. This translates into 1798 vehicles for evacuation.
The elevations along SH-87 are generally less. than five feet. The high
way is subject to flooding for a distance of about 20 miles under less than
hurricane conditions, According to the National Hurricane Center, the onset
of tides two to four feet above normal can frequently occur along the Texas
Coast 36 hours before landfall with a large, slow-moving· hurricane and 18-24
hours before landfall for a large, faster moving hurricane.
Residents of Port Bolivar, Crystal Beach, Gilchrist and Caplen, must'take
action before the issuance of a hurricane warning. These residents must follow
storms carefully and be prepared to evacuate almost instantaneously. Using a
2-lane rural capacity of 850 vehicles per hour, evacuation would require 2.1
hours. It is possible that many residents could be stranded due to a rapid
tide buildup.
Galveston Island
Access to Galveston Island includes the Interstate Highway 45 {IH-45)
causeway bridge, the ferry to Bolivar and the county owned bridge at San Luis
Pass. Pelican Island, which is connected to Galveston Island by bridge, is
also part of the study area. It should be noted that the city limits of the ... City of Galveston changed significantly during the 1970's due to annexation.
All future references to Galveston Island are without regard to city limits
and include Pelican Island.
12
The 1970 Census (6) placed the Galveston Island population at 62,897.
The estimated population increase for the Galveston SMSA through July 1, 1976 is
9,7 percent. Using this percentage yields a population estimate of 68,998 which
wHl be used to project the number of vehi-cles available for evacuation.
Vehicles Available
The 1970 U.S. Census (6) indicated somewhat more than 21,910 autos (the
census has a single category for households with 3 or more autos, making
exact projections impossible} on Galveston Island. This number of vehicles
represents a o:348 per capita auto ownership. The census data for Galveston
County indicates a per capita auto rate of 0.404 based on a 1970 census pop
ulation of 169,812 and mbre than 68,653 autos.
The Census Bureau estimates the 1976 Galveston County population at
186,300. Galveston County registered autos numbered 91,524, or a per capita
rate of 0.491. The number of registered trucks in Galveston County in 1976
was 26,960 and yields a per capita rate of pickups used as persona1 vehicles
of 0.043. This is again based on the 30 percent rate (1) previously mentioned.
For the purpose of this study, the 1976 Galveston County rates based on
actual registrations will be factored by the ratio of the 1970 census autos
per capita on Galveston Island to the per capita rate for Galveston County.
{0.348 divided by 0.404yields a factor of 0.853). The result is a per capita
auto availability of 0.419 and a per capita pickup used as a personal vehicle
of 0.037, or a total vehicle availability of 0.456 for Galveston Island. Total
vehicles for evacuation therefore, is estimated as 68,988 times 0.456, or 31,459.
13
There are three means of roadway access to and from Galveston Island:
1) The JH-45 causeway, 2) the San Luis Pass {Toll) Bridge, and 3) the ferry to
Bolivar. Because of the low elevation of roadways, the long distances required,
and the exposed nature of the highways along the coast, the IH-45 causeway is
the most viable means of evacuation for Galvesto~ Island. The other two routes
will not be considered as evacuation routes.
The critical point for evacuation capacity is the intersection of 61st
and Broadway that feeds onto the causeway. Virtually all traffic leaving the
island has to use one of these five lanes. Using the previously developed 500
. vehicles per Jane per hour yields an ·hourly cap~city of 2,500 vehicles.
Time Required
In order to evacuated 31,459 vehicles at 2,500 vehicles per hour would
require a minimum of 12.6 hours assuming 2,500 vehicles were continuously avail
able during the 12.6 hours. However, if only 38 percent of the population
evacuates as indicated in a recent study (5}, only 4.8 hours would t:>e required
for evacuation.
Time Available
The available evacuation time is partially determined by when the evacu
ation route will become flooded. This can occur either due to rainfall or due
to stonn surge (tides). As indicated previously, prediction of rainfall is
difficult. No prediction of rainfall closure will be made, however, it is quite
14
pJtJaible that roadways 'Will be impassable due to rainfaU before they are
flooded due to storm BUX'fle.
The lowest construction elevation of IH-45 from 59th street to SH-6 is
7 .B feet. However, subsidence may have reduced some elvations to five fee.t or
tess. As indicated earlier, tides of four feet can occur 18 to 36 hours ~~fore
· landfall of a hurricane.
The National Weather Service•s goal is to issue a hurricane WARNING 18 ... 24
hours before landfall. If a minimum elevation of 7.8 feet exists, the neces
sary evacuation time is possible as shown in the surge profiles in Appendix C.
However, if the minimum elevation is 4 feet or less, evacuation may be possible.
It would also be equally 'likely :not to be possible, regardless of the n~ber
desiring to leave.
Mustang Island
The principal population center on Mustang Island is Port Aransas. There
are two means of access to Port Aransas. The first, via Park Road 53 and the
Kennedy Causeway is 22 miles of mostly two-lane highway subject to blowing sand
and flooding due to the low elevation (five feet or less) and close proximity
to the Gulf. The second access, Via SH-361, is 6 miles of equally poor condi
tions and a short ferry ride. The .second alternative appears to offer less
exposure and should be open as long as the causeway alternative because the
ferry operates until 4-foot tides and/or hurricane force winds arrive.
Population
The 1970 census placed the Port Aransas population at 1218. The estimated
population increase for the Corpus Christi SMSA through July 1, 1976 was 4.8
15
percent. Using this percentage yields a population estimate of 1276 which will
be used to project vehicles available for evacuation.
Vehicles Available ·
The 1970 U.S. Census {£) indicated somewhat more than 652 autos available
in Port Aransas. Thi~ is a per capita auto availability of 0.535. The 1970
per capita rate for Nueces County based on census data is 94,208 autos divided
by 237,544 persons, or 0.396.
The 1976 registered auto count was 125,481 and the population estimate
was 247,600. The per capita auto rate was therefore 0.507 for Nueces County.
The number of registered trucks was 35,305. This results in a 0.043 per capita
pickups used as"personal vehicles based on the 30 percent factor (l) explained
earlier.
Again, for the purposes of the study, the Port Aransas p·er capita vehicle
rate will be estimated based on actual 1976 Nueces County registrations. The
Nueces County rate will be factored by the ratio of the 1970 census autos per
capita for Port Aransas divided by the 1970 census autos per capita for Nueces
County (0.532 divided by 0.396'yields a factor 1.36). The result is a per capita
auto availability of 0.690 and a per capita pickup used as a personal vehicle
availability of 0.041, or a total vehicle availability of 0.731 for Port Aransas.
Total vehicles available for evacuation i.s, therefore, estimated as 1276 times
0.731, or 933.
Capacity
The ferries from Port Aransas to Aransas Pass have 3 slips at each end and
a maximum capacity of six ferries making a round trip every ten minutes. A
16
ferry's capacity averages 9· cars, yielding a capacity of 9 cars times six ferries
times six trips per hour, or a total 324 cars per hour. For planning purposes,
a capacity of 300 vehi c1 es per hour wi 11 be used •
.Ijme Required
To evacuate 933 vehicles at 300 vehicles per hour would require 3.2 hours.
eased on survey responses (g_), it is assumed that all residents will desire
to evacuate.
Time Available
As previous stated, 4 foot tides can occur 18 to 36 hours prior to land
fall of a hurricane. Under these circumstances, evacuation would have to begin
prior to issuance of a hurricane warning. This would require action as soon
as a tide buildup become apparent and would result in evacuation in many causes
when landfall in the area did not become a reality. Again it is obvious that
being trapped on the island is a definite possibility and appropriate plans
should be made in advance.
South Padre Island
South Padre Island is the southmost barrier island along the Texas Gulf
Coast. Access is provided by the Queen Isabella Causeway, a modern 4-lane
divided facility. The majority of the island roadway system is two lane, except
in the area approaching the causeway.
17
•
f9pulation
The 1970 census included South Padre Island as a portion of a larger .
census tract including Port Isabel and Bayview. However, in September 1977 a
special census was conducted by the U.S. Census Bureau for the island.and.:
fndicated a population of 589 permanent residents.
Vehicles Available
For estimating purposes, the number of vehicles available will be assumed
to be the same as for Port Aransas, or 0.731 per capita. An assumption is nec
essary since the 1970 census data can not be broken down for South Padre Island.
This translates into 431 vehicles available for evacuation.
Capacity
The critical point in the system is the intersection of Park Road 100 and
the causeway. However, it is questionable whether the 2-lane road system on the
rest of the island can provide enough vehicles to reach the capacity of the
bridge approaches. The distribution of the residents on the island is also
not known. It will, therefore, be assumed that effectively the two lanes operate
under urban flow conditions with an effective capacity of 500 vehicles per
lane per hour, or 1000 vehicles per hour.
Time Required
The time required to evacuate 431 vehicles atlOOO vehicles per hour is
18
•
about 26 minutes. Since the Town of South Padre Island has an ordinance (8)
providing for mandatory evacuation, there is no reason to presume less than
tOO percent evacuation.
Time Available -the approach to Queen Isabella causeway has a low point of 4 feet. As
previously stated~ tides of four feet can exist 18 to 36 hours before landfall.
This may require action prior to issuance of an hurricane warning if evacuatuion
is to be assured, otherwise it is very possible that residents would be stranded.
19
V. SUMMARY AND CONCLUSIONS
The report has evaluated, given present. conditions, the first objective
of the study--Is total evacuation of the four barrier islands possible? The
answer to the question is: total evacuation may not be possible on any of' the
tslands for some storms; it may not be possible during the time frame of a
hurricane warning, nor during the time frame of a hurricane watch.
The second objective of the study was to determine what actions can improve
the ability of residents to evacuate. An alternative is to improve forecasting
procedures in those areas most critical to evacuation. For the Texas Gulf Coast
barrier islands, the time of occurrence of four-tides, the probability of occur
rence of four-foot tides and the severity of storms that can follow 18 to 36
hours behind a four-foot tide is information necessary for evaluation.
Another possible answer is to raise the elevation of the roadway. For
this to be effective on a barrier island, the technique used on Galveston fol
lowing the 1900 hurricane would be required. The technique was construction of
a seawall and a literal raising of the island. It is not known whether this
could be done today, given the present state of environmental awareness, nor
if it is financially feasible.
If, after refining the analysis with better hurricane forecasting data,
and if increasing roadway elevation is not possible, the remaining alternative
is to protect residents at or near their homes. This would require structures
of sufficient height and strength to weather a major hurricane, and the capac
ity to house the appropriate number of people.
It is necessary to look at Galveston as a special case. A large number
of people live behind a seawall on a raised island. Because the seawall is
not higher than some potential storm surges (tides) and because the seawall
20
dOCS not ring the island, evacuation is still a necessary consideration. In
the case of Galveston, evacuation is contingent upon determination of the effect
of subsidence on IH-45. If necessary, it may be possible to raise some roads,
thereby providing a means of escape.
The study indicated that winds of about 50 mph and gusting to 75 mph ~an
exist 10 to 20 hours before landfall of a hurricane. Since winds of the ·magni
tude can overturn trucks; motor homes, and vehicles, with trailers, consideration
should be given to prohibiting these vehicles on the highways upon issuance of
4 hurricane warning. This would undoubtedly require special legislation.
One udditional area that requires further study is tourists. This study
as-sumed ·they would _leave before the critical evacuation time period. The first
question to be answered is how long will they stay? If they stay past the time
critical to evacu·atf on, then it is necessary to estimate their numbers.
21
APPENDIX A-CAPACITY
Capacity Under Interrupted and Uninterrupted Flow
This appendix is intended to serve two purposes. First, it documents
the procedure used to arrive at the capacity figures used in Chapter III. .. Second, this appendix will provide the basic tools to further refine the capac-
tty figures for spectfic locations if so desired. The analysis uses two dif
ferent techniques J . one for uninterrupted flow (_2_} and another for interrupted
. flow (lO,ll).
Uninterrupted Flow
Although fe!" highways actually operate under the "ideal 11 conditions
associated with uninterrupted flow, modern freeways, expressways, and rural
highways may approach the 11 idear• conditions required for uninterrupted flow
conditions. Where there is at least two lanes for the exclusive movement of
traffic in one direction, the capacity of a multilane highway under ideal condi
tions is considered to be 2000 passengel' vehicles per lane per hour. The capa
city of a two-lane~ two-way roadway under ideal conditions is 2000 passengel'
vehicles per hour, total of both direations.
Interrupted Flow
Interrupted flow is generally associated with urban highways. Unlike uninter
rupted flow, few broad criteria can be described for interrupted flow. It is
not feasible to define capacities under ideal conditions, because too many
variables are involved. Interrupted flow requires a detailed study of the
elements producing the interruptions.
22
Generally speaking, a line of vehicles stopped by an interruption such
as a traffic signal, will only rarely move away from an interruption at :r>ate
greater than 1750 passenger cars per lane .per hour; during those periods when
the interruption (e.g., red signal} is not in effect. It is essential. to note
that these values a:r>e rates, not voZumes. For traffic signals,. the values
must be multiplied by the percent of total time the signal is green for the
lane under consideration.
Factors Affecting Capacity
It is seldom that all roadway and traffic conditions that affect capacity
are ideal. Therefore~ adjustment factors must be applied to determine capacity
for most highways. Factors affecting capacity can be classified in three
categories-..;roadway factors, traffic factors, and ambient factors, although
in some cases they are interrelated.
Roadway Factors
Restrictive physical features in a roadway that reduce the capacity and
level of service generally are called 11 roadway factors 11 and include lane width,
lateral clearance to roadside obstacles, grades, shoulders, auxiliary lanes,
and surface conditions.
{1) lime Width. Twelve-foot wide lanes are considered to represent an 11 ideal 11 lane width. lane widths less than 12-ft. reduce roadway
capacity. Narrow lanes adversely affect the ability to pass on two
lane highways. On multilane roadways, vehicle enroachment on ad
jacent lanes increases as the travel lanes narrow. Lane width re
duction factors for lanes as narrow as 9 ft. have been established
23
as a percentage factor of the 12-ft. lane width considered ideal
(100 percent). These factors are applicable for uninterrupted
flow conditons.
(2) lateral Clearance. Obstructions adjacent to the roadway (such as
retaining walls, bridge abutments. sign posts, parked cars, etj:.)
located closer than 6 ft •. from the edge of the travel lane reduce
its .effective width, and therefore, reduce capacity. Even one re
striction will reduce the capacity of the entire section. Factors
have been developed for appH·cation on uninterrupted flow conditions
for obstructions closer ·than 6 ft. ~ ·
{3} Grades. Grades affect capacity in several ways. On two-lane
facilities, passing sight distance may be restricted and if the per
centage of trucks in the traffic stream is appreciable, the capacity
or service volume is considerably reduced, particularly when grades
are long. To take into effect the reduction due to grades, degrading
factors have been established for uninterrupted flowconditions.
The factors are applied by considering the percentage of trucks,
the general type·of terrain (level, rolling, or mountainous) and
on two-lane highways, considering the percentage of passing sight
distance less than 1500 ft. along the highway section.
(4) Shoulders. To prevent short-duration lane blockage, shoulders
are essential since one stalled vehicle can effectively b·lock a
travel lane. Shoulders, in addition to providing refuge for dis
abled vehicles, in some cases increase the effective width of the
travel lanes. For lanes less than 12 ft. wide, surfaced shoulders
4 ft. wide or more increase the effective width of the adjacent
travel lane by 1 ft.
24
..
(S) Auxiliary lanes. Speed change, weaving, turn-bays, and climbing
lanes improve the qua 1i ty of service on the thrQugh lanes. Although
not specifically quantified in capacity analysis,- the presence of
these lanes can improve capacity.
(6) Surface Conditions. Adjustment factors· are not available to r~flect
the effect of surface conditions at particular levels of service.
However, it may be assuMed that where surface conditi(ons (H\e very ~
poor, operating speeds are somewhat lowered for any given volume
as compared to those attained where the surface is good.
Traffic Factors
Capacity and level of service on two geometrically similar highways may
be aporeciably different due to the composition and behavior of the traffic
stream. Factors which take these considerations into account are called "traffic
~ctors" and include trucks, buses, and traffic interruptions in particular.
(1) Trucks. Trucks and buses reduce the capacity of a highway in terms
of the total vehicles carried per hour. Each truck displaces several
passenger cars in the traffic stream. Also, trucks exhibit unique
operating characteristics and slow the traffic stream on grades or
due to passing sight distance problems, particularly on two-lane
highways. Correction factors are based on truck volume percentages
within the traffic stream for both uninterrupted and interrupted
flow level of service analysis.
(2) Right and left Turns. Right and left turning vehicles produce an
adverse effect on capacity. Generally, turning factors become more
important in interrupted flow·ana1ysis. The inclusion of turn=bays
and separate signal phasing helps to reduce the turn conflicts.
25
Adjustment factors for left and right turns to and from both one
way and two-way streets have been established for interrupted flow
level of service analysis.
Ambient Factors
11 • d • ff" ( Ambient conditions as previously stated are genera y 1gnore 1n tra. 1~
capacity due to their infrequent occurrence. In Houston wet conditions {rain
fall greater than 0.01") occur about 53 times a year during morning and evening
peak periods. However, the likelihood of bad weather during a hurricane
evacuation is high, and it is necessary to adjust capacity for rain, wind and
high tides.
The development of factors for ambient conditions is difficult because,
unfortunately, available data is often limited or widely variable. Nevertheless,
what, hopefully, are conservative factors will be developed for hurricane evacu
ation analysis.
Rain. During the hurricane evacuation time frame (6-18 hours before arriv
al of the c.enter), hourly rainfall varies from zero to .20 inches. The rain
fall rate, however, is likely to be two to four times the total observed rain
fall as the most intense part of a squall lasts only 10 to 15 minutes.
Studies (£) of rainfall records and extensive traffic flow data on the
Gulf Freeway in Houston were used to define the effect of rain on capacity. Rain
was found to reduce freeway capacity to between 81 and 86 percent of dry weather
capacity with 95 percent confidence. These studies included hourly rainfalls
that varied from as little as 0.01" to more than 1.0".
It, therefore, appears reasonable to reduce capacity because of rainfall,
to 84 percent of dry weather capacity fo~ hurricane evacuation purposes.
26
Although the data is for uninterrupted flow conditions, it will also be used as
the best estimate of the effect on interrupted flow.
Rain has been shown (11) to increase accident rates, however, as shown in
Appendix 0, the overall effect of accidents in general is very small. For the
purpose of this study, the effect of accidents in general will not be consjdered •.
Wind. The problem associated with wind is the increased potential of an
accident due to high winds, especially gusting winds. With the inception of
the interstate highway system came the concern for vehicle handling under high
speed driving conditions, where the normal disturbance of the vehicle arises from
aerodynamic inputs. Considerable work (14-16) has been done ;.n the u.s., Germany
and Japan in the area of modeling vehicle performance under crosswind gusts.
In reality, a constant crosswind wi 11 not occur. Due to natural gusts
and obstacles in the vicinity of the road (e.g. bridges and other vehicles) both
velocity and direction of the wind acting on the vehicle are changing with time
and distance. The driver must, therefore~ compensate for directional deviations
of his vehicle. Beyond a limit that is difficult to calcuate, these tedious
directional adjustments will become a risk for driver and vehicle.
Desi~ably we would like to know at what wind speed or gust condition vari
ous vehicles become unstable. Although the state of the art does not appear to
be able to give us a direct answer, it does give an indication of what causes
the problem. Futhermore, empirical evidence also gives an estimate of when a
problem does occur.
Winds that ranged from 0 to 47 moh and qusti ng to 75 mph {based on 1. 6
gust factor) caused a serious accident problem for trucks and motor homes on I-8
mountain bridge (ll.)• Since winds of this magnitude can exist lQ to 20 hours
before the arrival of the eye (see Appendix B), prohibition of truckst motor
homes, and vehicles with trailers should ·be considered upon issuance of a hurri
cane warning. This would undoubtedly require special legislation. The reason
27
for considering such drastic action is that it is difficult to remove a large
vehicle from the roadway. It should also be noted that the Governor of Texas
authorized the movement of mobile homes without permits during Hurricane Anita
in ~977. The appropriate action wo~ld have been to cancel any existing permits
effective upon issuance of a hurricane warning. -
Since it is not possible to estimate the effects of ~ind on large vehicles
at this time, the analysis must presume appropriate action to eliminate the
accidents and associated capacity reduction caused by such vehicles. The most
effective measure would be the. prohibition previously stated.
Tide. Rising tides perhaps have greatest effect on capacity. Once the ·
roadway is flooded, the capacity is reduced to zero. For the purposes of
analysis, it will be assumed that once half a lane width of pavement is covered,
the.Jane no longer has any capacity. What additional capacity does exist will
be required to clear vehicles already on the highway, but no additional vehicles
should be allowed to begin evacuation.
The prediction of tides is difficult. The National Weather Service has
developed two computer models to predict tides aLong the open coast. Nineteen
computer runs using the Splash II model were made along tracks as shown in
Appendix C. The differences in tide heights are primarily the result of
differences in water depth offshore.
Due to the limitations of the model, it is necessary to use the data with
caution. The data are certainly reasonable for roads along the islands. It
will also be used as an approximation of what may happen in the bays and on
the mainland immediately in from the bays. However3 tides can rise faster in
the bays due to the confined nature of the basins.
28
Uninterrupted Flow CapacityCalculations
For planning purposes. we need to determine the maximum volume that may
be accommodated. This maximum volume is computed by making a number of adjust
ments or corrections to the ideal capacity for various factors influencing cap-
acity. The general expression for including these factors is as follows:
Capacity = (Ideal Capacity) x
(Roadway Factors) x (Traffic Factors) x (Ambient Factors).
When we quantify the function~ the relationship becomes:
C = 2000 vph/lane x N x W x T x A.
where:
N = Number of lanes in one direction.
W = A fractional multiplier to account for the reduction
effects of lane width and lateral clearance of obstructions.
..
T = A fractional multiplier to account for the effects of the number
of trucks and the type of terrain.
A = A fractional multiplier to account for ambient conditions.
Computational Procedures for Two-Lane Highways
The general relationship developed above is applicable to two-lane highways,
except for the application of N, the number of lanes. For two-lane highways,
N = 1, because they are only able to ac(:omodate a total of2000 vph in both
directions. If vehicles have complete freedom to pass (opposing volume ap
proaches 0) the capacity in one direction approaches 2000.vph.
Thus, the relationship is:
Capacity = 2000 vph x W x T x A
29
Roadway Factors. For two-lane highways, roadway factors consist of lane
widths and lateral clearances, sight distance restrictions, and average high
way speed. Adjustment factors for the combined effect of lane width and lat
eral clearances are give in Table A-1.
Traffic Factor. The adjustment factors for the effect of trucks on ca-.. pacity are found in Table A-2.
Ambient Factor. The adjustment factor for the effect of rain is 0.84.
Computational Procedures for Multilane Highways and Freeways
The main difference in dealing with multilane highways and freeways·
compared to two-lane highways is that capacity is based on the number of lanes,
whether or not the facility is divided or undivided and whether access is
controlled. The general capacity relationship developed earlier applies:
Capacity = 2000 x N x W x T x A
Roadway Factors. Lane width and lateral clearance effects are combined
into one adjustment factor given in Tables A-3 and A-4. Table A-3 applies to
divided highways and freeways.
Traffic Factors. The adjustment factors for trucks related to type of
terrain are given in Table A-5 and Table A-6. These factors apply to free
ways as well as multilane highways. Either table may be used.
Ambient Factor. The adjustment factor for the effect of rain is 0.84.
Generalized Capacity
For planning purposes, a single generalized capacity for uninterrupted
flow would be useful. Several assumptions will be made concerning prevailing
conditions such that a generalized capacity can be computed. The assumed
30
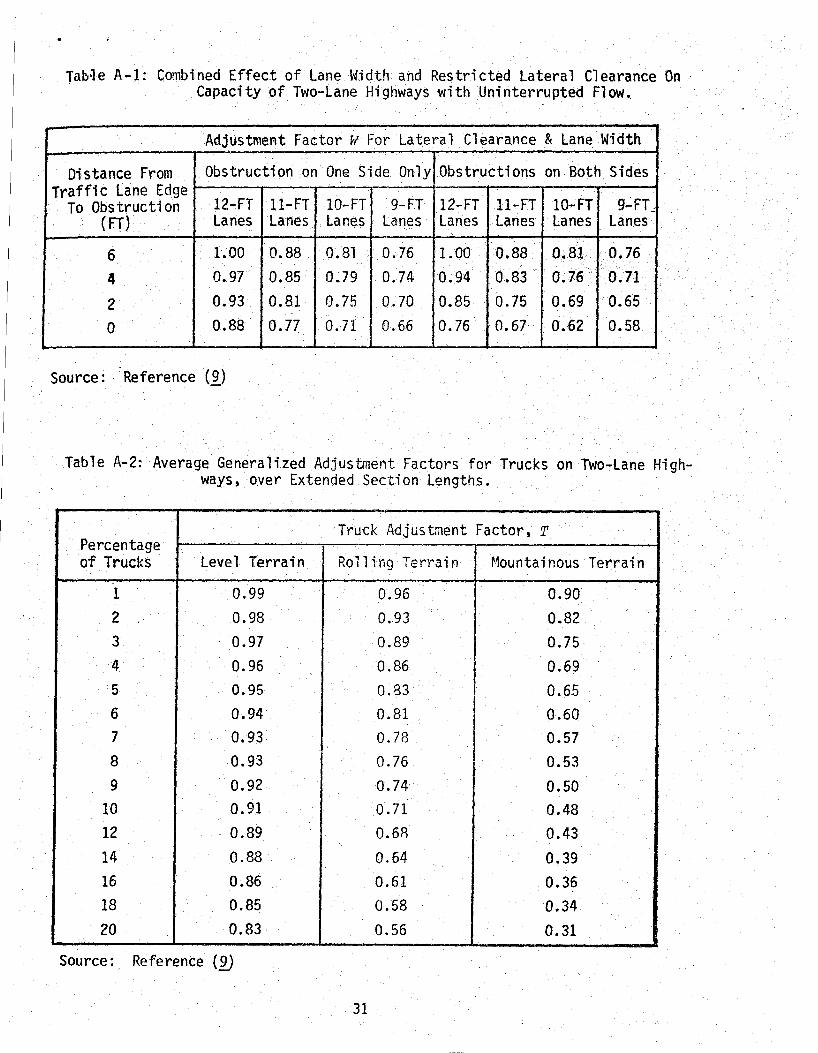
Tab~e A-1: Combined Effect of lane Width and Restricted Lateral Clearance On Capacity of Two-Lane Highways with Uninterrupted Flow.
Adjustment Factor WFor Lateral Clearance.& Lane Width
Distance From Obstruction on One Side Only Obstructions on Both Sides Traffic lane Edge
12-FT 10-FT To ObstructiOn 11-FT 9-FT 12-FT 11-FT 10-FT 9-FL (FT} lanes Lanes Lanes Lanes lanes Lanes Lanes lanes
6 1.00 0.88 o. 81 0.76 1.00 0.88 0.81 0.76
4 0.97 0.85 0.79 0.74 0.94 0.83 0.76 0.71
2 0.93 0.81 0.75 0.70 0.85 0.75 0.69 0.65
0 0.88 0.77 0. 71 0.66 0.76 0.67 0.62 0.58
Source: Reference (~)
Table A-2: Average Generalized Adjustment Factors for Trucks on Two-Lane Highways, over Extended Section lengths.
Truck Adjustment Factor, T Percentage of Trucks Level Terrain Rolling Terrain r1ountainous Terrain
1 . 0.99 0.96 0.90 2 0.98 0.93 0.82 3 0.97 0.89 0.75 4 0.96 0.86 0.69 5 0.95 0.83 0.65 6 0.94 0.81 0.60 7 0.93 0. 78 0.57 8 0.93 0.76 0.53 9 0.92 0.74 0.50
10 0.91 0.71 0.48 12 0.89 0.6R 0.43 14 0.88 0.64 0.39 16 0.86 0.61 0.36 18 0.85 0.58 0.34 20 0.83 0.56 0.31
Source: Reference (2)
31
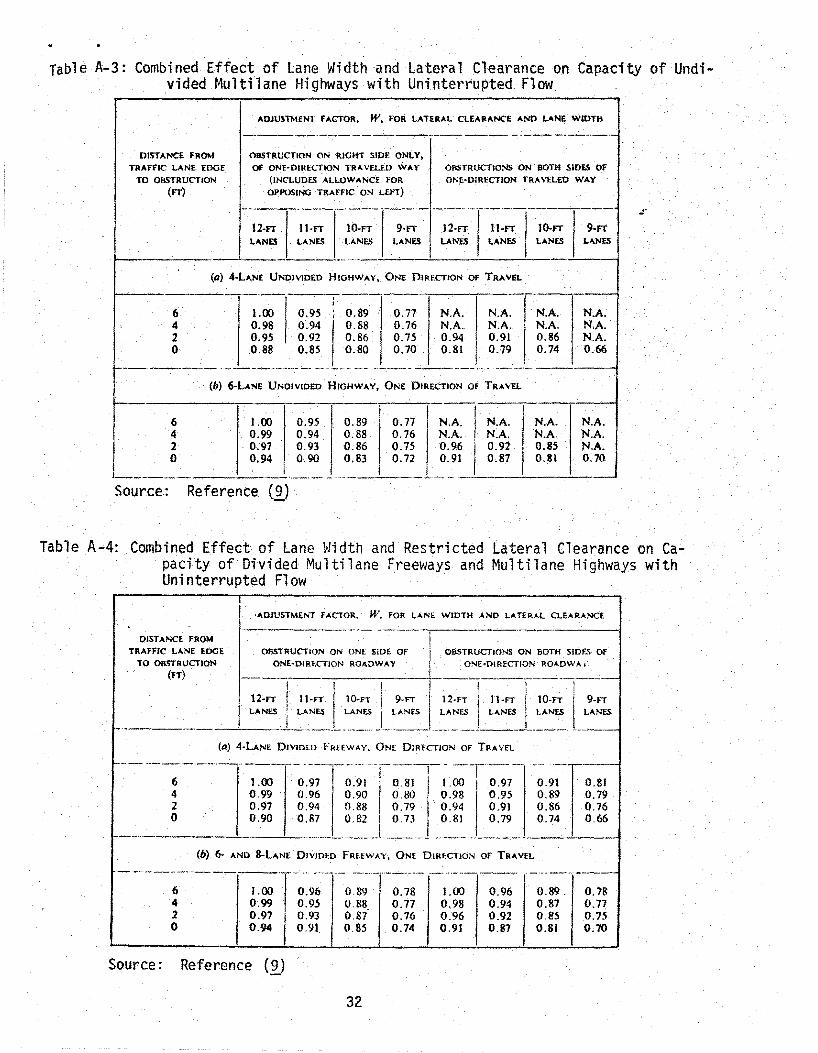
Table A-3: Combined Effect of lane Width and lateral Clearance on Capacity of Undivided Multilane Highways with Uninterrupted Flow
ADJUSTMENT FACTOR, W, FOR LATERAL CLEARANCE AND LANE WIDTH
-----.,..._·--------------·---- --- --------DISTANCE FROM OBSTRUCTION ON RIGHT SIDf. ONLY,
TRAFFIC LANE EDGE OF ONE-DIRECTION TRAVELED WAY OBSTRUCTIONS ON BOTH SIDES Of TO OBSTRUCTION (INCLUDES ALLOWANCE fOR ONE-DIRECTION TRAVELED WAY
(FT) OPPOSING TRAFFIC ON LEI'T)
---------·--- ------ ----~· ~------
12-FT 11-FT 10-FT 9-FT 12·FT 11-FT 10-FT 9-FT
LANES LANES lANES LANES LANES LANES LANES LANES
--·-
(a) 4-LANE UNDIVIDED HIGHWAY, ONE DIRECTION OF TRAVEL
6 1.00 0.95 !
0.89 0.77 N.A. N.A. N.A. N.A. ' 4 0.98 0.94 0.88 0.76 NA NA N.A. N.A. 2 0.95 0.92 0.86 0.15
I 0.94 0.91 0.86 N.A.
0 _0.88 0.85 0.80 0.70 0,81 0.79 0.74 0.66
~-- ----, ------ ---------------- -------·· ---- ------- ---------·. ------(b) 6-LANE UNDIVIDED HIGHWAY, ONE DIRECTION OF TRAVEL
6 1.00 0.95 0.89 0.77 NA N.A. N.A. N.A. 4 0.99 0.94 0.88 0.76 N.A. N.A. N.A. N.A. 2 0.97 0.93 0.86 0.75 0.96 0.92 0.85 N.A. 0 0.94 0.90 0.83 0.72 0.91 0.87 0.81 0.70
•---------------·- ... ---~- -·
Source: Reference (2)-
Table A-4: Combined Effect of Lane Width and Restricted Lateral Clearance on ca.,. pacity of Divided Multilane Freeways and Multilane Highways with Uninterrupted Flow
·40JUSTMENT FACTOR.' W, FOR LANE WIDTH AND LATERAL CLEARANCE
DISTANCE FROM TRAFFIC LANE EDGE OBSTRUCTION ON ONE SlOE OF OBSTRUCTIONS ON BOTH SIDf.S OF
TO OBSTRUCTION Ol'<"£•DIR£C710N ROADWAY ONE·PlRECTION ROADWA< (FT)
12·FT 11-FT 10-FT 9-FT 12-FT 11-FT 10-FT 9-FT LANES LANES LANES LANES LANES LANES LANES LANES
(a) 4-LANE DtVIDUJ fREEWAY, ONE DIRECTION OF TRAVEL
f----- ··---'- ------···------- .
~.if 6 1.00 0.97 0.91 0.81 t.OO 0.97 4 0.99 0.96 0.90 0.80 0.98 0.95 0.89 0.79 2 0.97 0.94 0.88 0.79 0.94 0.91 0.86 0.76 0 0.90 0.87 0.82 0.73 0.81 0.79 0.74 0.66
--·-- ·--- ------- ..
(b) 6- AND S-LANE DIVIDED fRF.E\VAY, ONE DIRECTION OF TRAVEL
---·----H·-------·--·-<- -·--• --------·~-z- ·----------- -·-····----~
6 1.00 0.96 0.89 0.78 1.00 0.96 0.89. 0.78 4 0.99 0.95 0.88. 0.77 0.98 0.94 0.87 0.77 2 0.97 0.93 0.87 0.76 0.96 0.92 0.85 0.75 0 0.94 0.91 0.85 0.74 0.91 0.87 0.81 0.10
Source: Reference (2) ·
32
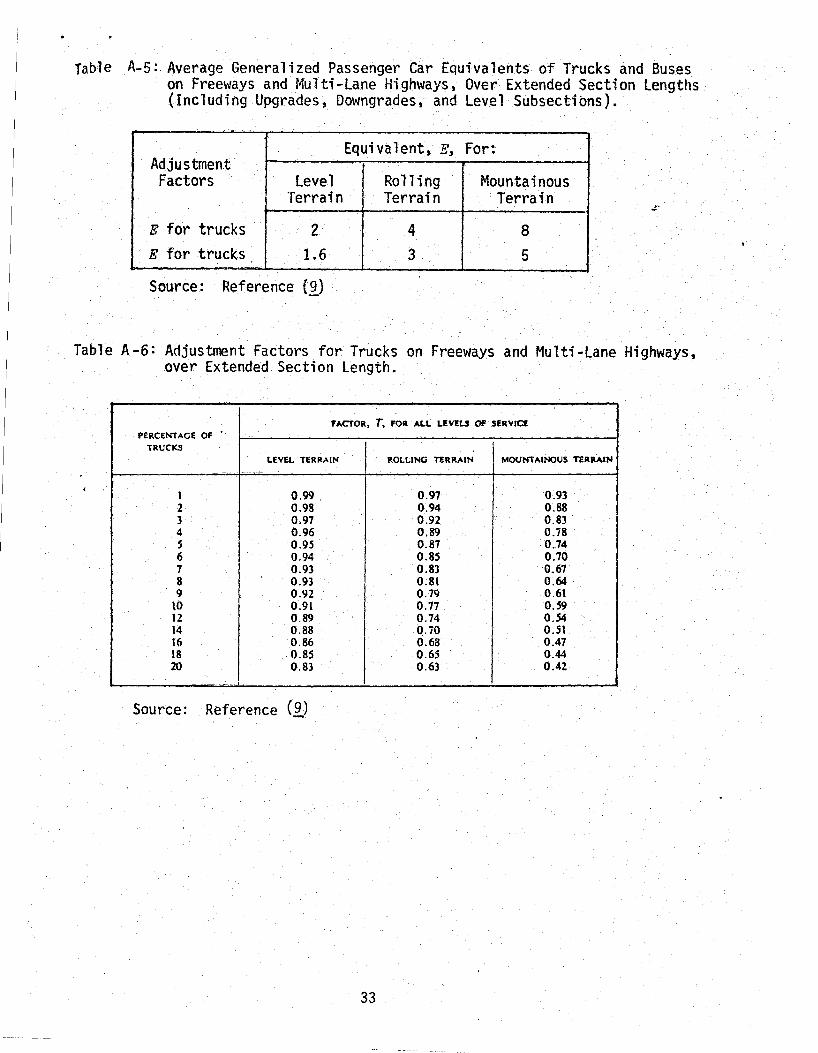
Table A-5: Average Generalized Passenger Car Equivalents of Trucks and Buses on Freeways and Nul ti -Lane Hi gh\'lays, Over Extended Section Lengths (Including Upgrades, Downgrades, and Level Subsections).
--- -
Equivalent, E, For: Adjustment Factors level Rolling Mountainous
Terrain Terrain ·Terrain
E for trucks 2 4 8 E for trucks 1.6 3 5
. -
Source: Reference {2)
Table A.-6: Adjustment Factors for Trucks on Freeways and Multi-Lane Highways, over Extended Section Length.
FACfOR, T, FOR ALL LEV!U Of' SERVICE PERCENtAGE OF '
TRUCKS LEVEL TERRAIN ROLLINO TERRAIN MOUNtAINOUS TERRAIN
---- ·--- ·--
l 0.99. 0.97 0.93 2 0.98 0.94 0.88 3 0.97 0.92 0.83 4 0.96 0.89 0.78 s 0.95 0.87 0.74 6 0.94 0.85 0.70 7 0.93 0.83 0.67 8 0.93 0.8\ 0.64 9 0.92 0.79 0.6\
lO 0.91 0.77 0.59 12 0.89 0.74 0 . .54 14 0.88 Q.iO 0.51 16 0.86 0.68 0.47 18 0.85 0.6S 0.44 20 0.83 0.63 0.42
-·-··-I
Source: Reference (2)
33

conditions are a two-lane roadway, ten-foot lanes, obstructions on both sides
within 0-feet, and five percent trucks over rolling terrain.
- As previously stated:
Capacity = 2000 vph x W x T x A
Thus: Capacity = 2000 vph x .62, x .83 x .84
or 864.5 vehicles per hour. A figure of 850 vehicles per hour on a two-lane
rural roadway is suggested for planning purposes.
For multilane highways and freeways, the assumed conditions are a four
lane undivided highway, 10-foot lanes, and 5 percent trucks over rolling terrain.
As previously stated:
Capacity = 2000 vph x N x ~~ x T x A
Thus: Capacity = 2000 x 1.0 x 0.80 x 0.87 x 0.84
or 1169 vehicles per lane per hour. A planning figure of 1150 vehicles per
lane per hour is suggested for multilane highways both divided and undivided,
even though a divided highway would have a higher capacity. The difference is
sma 11 and does not warrant spec i a 1 cons i dera ti on.
Interrupted Flow Computational Procedures for Capacity
Capacity and level-of-service on urban streets where interrupted flow
exists are predominantly related to the intersection. The reason, of course, is
because time sharing of the area common to both approach roadways significantly
reduces the capability of a street to handle traffic flow. Further, the capacity
for interrupted flow is built almost entirely around signalized intersections.
34
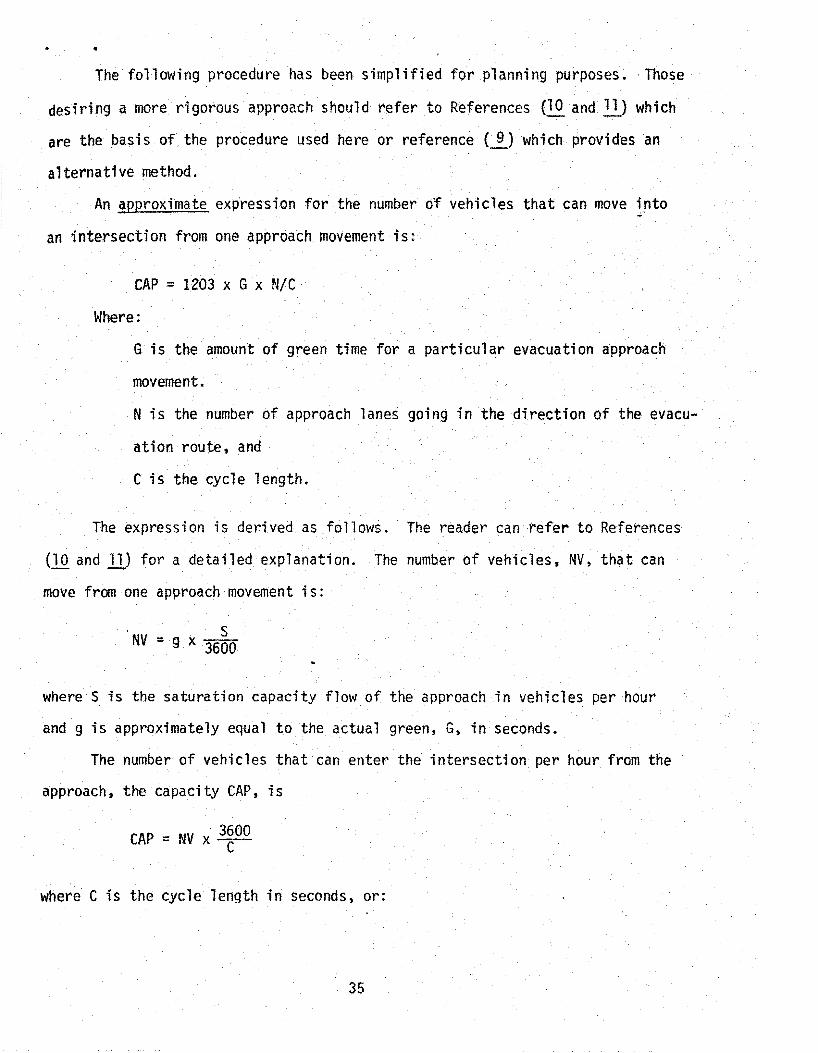
The following procedure has been simplified for planning purposes. ·Those
desiring a more rigorous approach should refer to References (.:!.Q. and .!.:!_} which
are the basis of the procedure used here or reference (~_) which provides an
alternative method.
An arproximate.expression for the number o;f vehicles that can move into
an intersection from one approach movement is:
CAP = 1203 x G x N/C ·
Where:
G is the amount of green time for a particular evacuation approach
movement.
N is the number of approach lanes going in the direction of the evacu-
ation route, and
C is the cycle length.
The expression is derived as fallows. The reader can refer to References
{10 and llJ for a detailed explanation. The number of vehicles, NV, that can
move from one approach movement is:
. . s NV = g x 3600
where S is the saturation capacity flow of the approach in vehicles per hour
and g is approximately equal to the actual green, G, in seconds.
The number of vehicles that can enter the intersection per hour from the
approach, the capacity CAP, is
CAP = NV x 3600 c
where C is the cycle length in seconds, or:
35
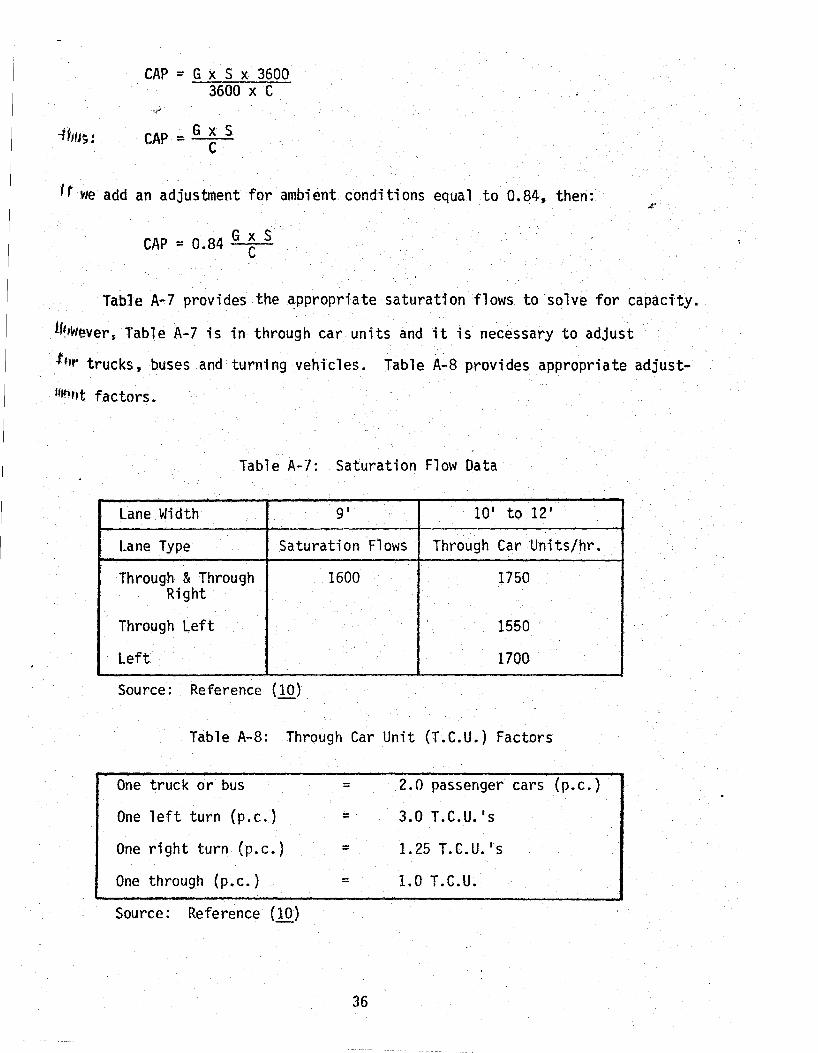
CAP = G x S x 3600 3600 X C
CAP = G x S c
lr we add an adjustment for ambient conditions equal to 0.84, then:
CAP = 0.84 G ~ S
Table A-7 provides the appropriate saturation flows to solve for capaci'ty.
H~IW~ver, Table A-7 is in through car units and it is necessary to adjust
~~r trucks, buses and turning vehicles. Table A-8 provides appropriate adjust-
11lflrtt factors.
Table A-7: Saturation Flow Data
Lane Width g• 10' to 12'
Lane Type Saturation Flows Through Car Units/hr.
Through & Through 1600 1750 Right
Through Left 1550
Left 1700
Source: Reference (10)
Table A-8: Through Car Unit (T.C.U.) Factors
One truck or bus = 2.0 passenger cars (p.c.)
One left turn (p.c.) = 3.0 T.C.U. 's
One right turn (p.c.) = 1. 25 T. c. u. I s
One through (p.c.) = 1.0 T.C.U.
Source: Reference (10)
36
To simplify the expression for planning purposes, we wilJ assume a two
lane approach, no special turning lanes, 5 percent trucks, 5 percent left turns,
5 percent right turns, and 10-foot lanes.
The appropriate left lane saturation flow is 1550 T.c.u.•s per hour.
Therefore 1550 equals the number of through cars, 0.95V, plus the adjustS!d
number of left-turning cars, 0.05V· x 3.00, plus the adjusted number of trucks,
0.05V x2.00. The number of vehicles, V, is 1292.
Similarly for the right lane, the saturation flow of 1750 equals 0.95V +
(0.05V x 2.00) + (0.05V x 1.25). The number of vehicles, V is 1573. Therefore,
the average for the two lanes is 1432 vehicles per hour. Substituting in the
capacity formula yields:
CAP = 0.84 ~ x 1432
or: CAP = 1203 ~
The critical intersection is that intersection having the lowest N, times G,
divided by C value. Several additional factors must be considered. Has a spe
cial hurricane evacuation timing plan been developed? Will the traffic signal
be operated during an evacuation? Will the police override the signal timing
or manually direct traffic?
If the signal is turned off, the green time effectively becomes 100 percent.
If the signal timing is changed, so is the green time for any approach and pos
sibly the cycle length. However, the green time cannot exceed 100 percent and is
less than 100 percent when time is allocated to two or more approaches due to loss
time (the yellow interval) when changing from one approach to another.
If we further assume that two two-way streets intersect, there are no spe
cial turning phases {e.g. left turn green arrow), a 60-second cycle length, and
time is equally apportioned between the two streets, the capacity would be:
37

CAP = 1203 x 25 x N/60
or 501.2 vehicles per lane per hour. A figure of 500 vehicles per lane
per hour would not be unreasonable in an urban area.
38
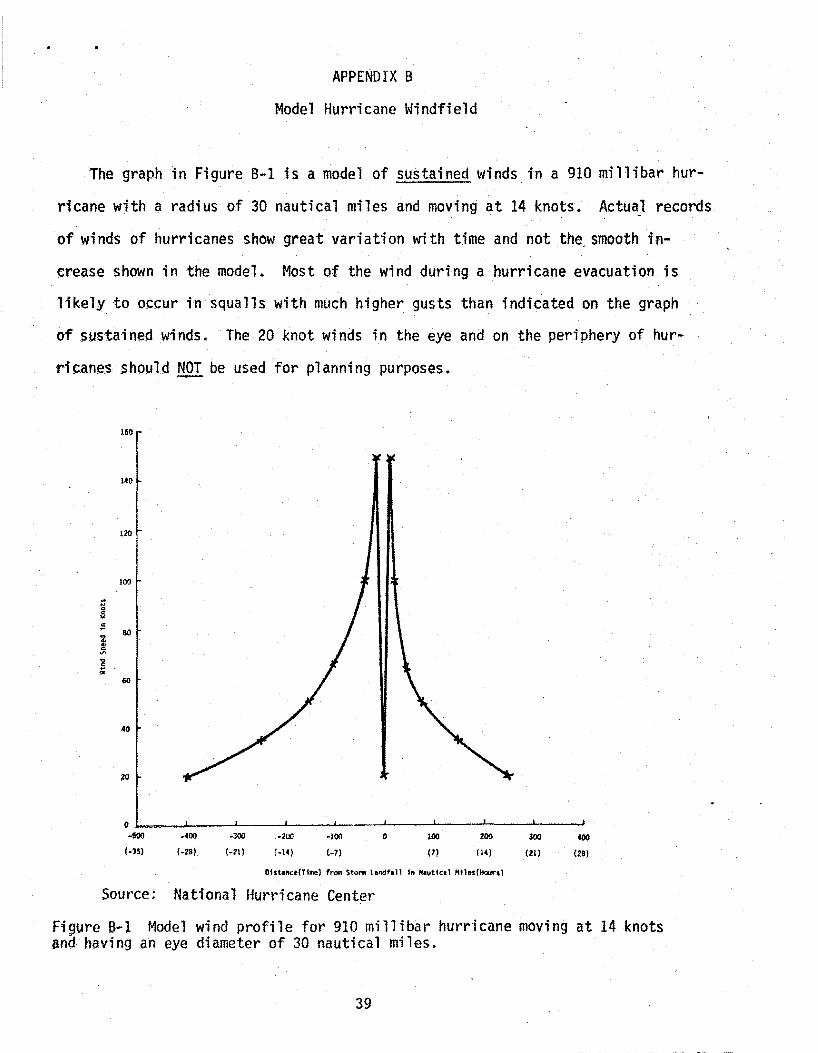
APPENDIX B
Model Hurricane Windfield
ihe graph in Figure B-1 is a model of sustained winds. in a 910 millibar hur
ricane with a radius of 30 nautical miles and moving at 14 knots. Actua) records
of winds of hurricanes show great variation with time and not the. smooth in
crease shown in the model. Most of the wind during a hurricane evacuation is
likely to occur in squalls with much higher gusts than indicated on the graph
of susta·i ned winds. · The 20 knot winds in the eye and on the periphery of hur
rican.es should NOT be used for planning purposes.
" .. 0
" "' "' ... ~ "' .. .... 1! ;;
IAil
1.20
100
80
Q)
AO
0 ~--~----J-----~--~----~--~~--~----~--~ ·100
(-35)
.400
1-28)
-300
(-21)
-200
(-14)
·100
t-7)
0 100
{7)
200
(14)
llhta~~ee(TI""') frtllll Stoi'WI landftll In HA!vtlco1 Hlles(Hours)
300
{21)
400
(28)
Source: National Hurricane Center
Figure B~l Model wind profile for 910 millibar hurricane moving at 14 knots and having an eye diameter of 30 nautical miles.
39
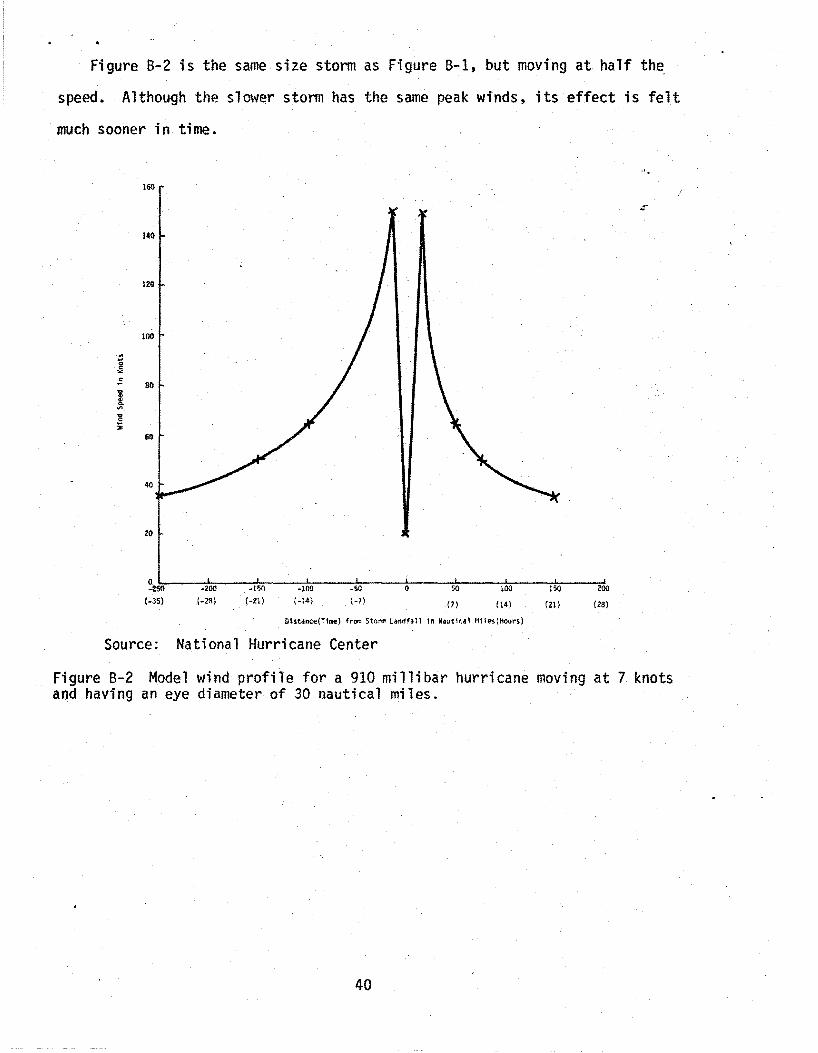
Figure B..;2 is the same size storm as Figure B-1, but moving at half the_
speed. Although the slower storm has the same peak winds, its effect is felt
much sooner in time.
.. .. ~ ~
"i !. "' ... " ;;;
160
141)
100
60
60
40
~~~-----~zoo=-----*rw~---~-l=oo----~-s~o----~Q----~s~o----~~o~o----~~~~--~200 (-35) (-ZR) (-21) (-14) (-7) (7) (14) (21) (28)
Dhtance(Time) from Storm Landfall 1n Nautical Miles(Hours)
Source: National Hurricane Center
. . .
-
Figure B-2 Model wind profile for a 910 millibar hurricane moving at 7 knots and having an eye diameter of 30 nautical miles.
40
j

APPENDIX C
Storm Surge Model
The National Hurricane Center uses two computer models--SPLASH I and SPLASH
II-- to predict storm surge (hurricane tides). SPLASH I is generally used for
hurricanes making landfall, while SPLASH II was designed for hurricanes parallel
ing the coast. However, only SPLASH II provides the tide versus time output
required for thi~ study. Therefore, SPLASH II was used for all hurricane tracks
in this study.
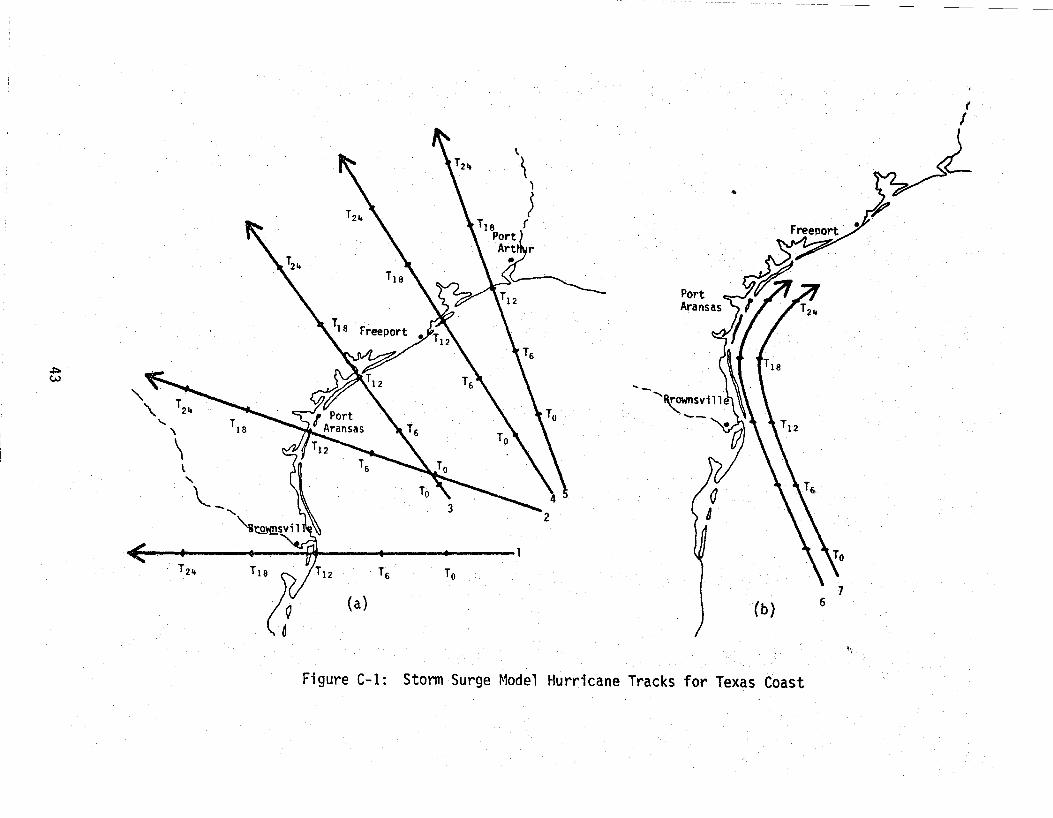
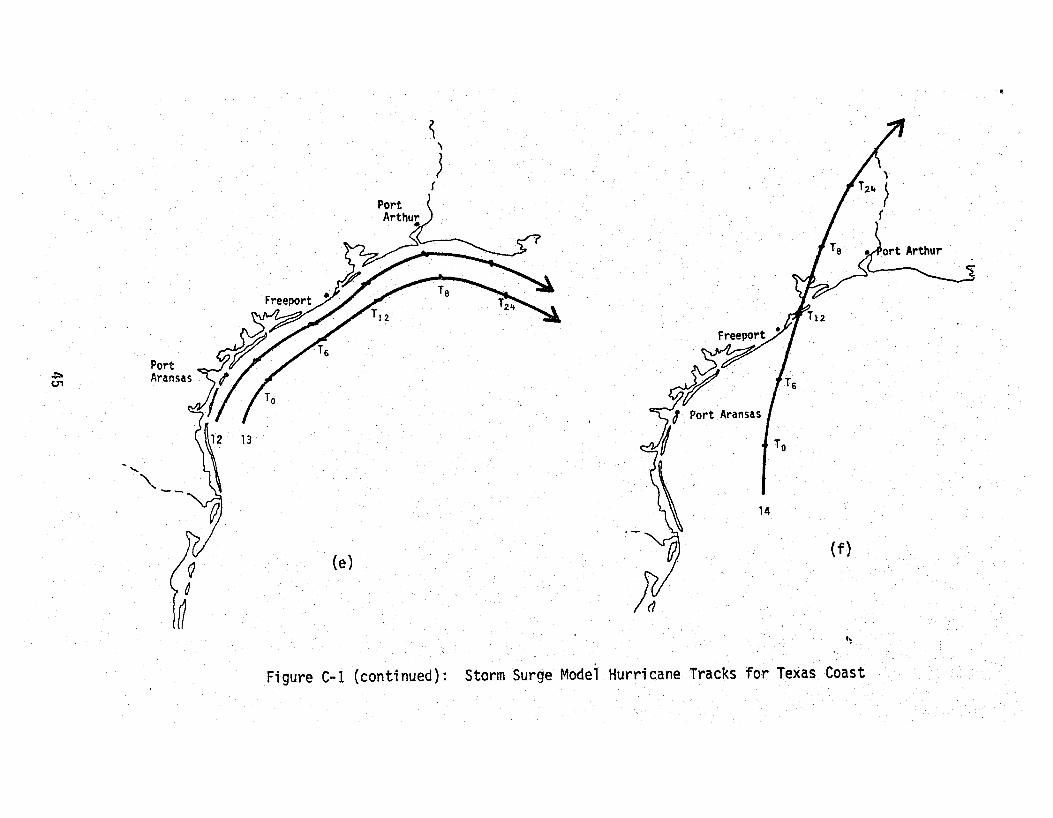
Nineteen computer runs were made along 14 tracks as incicated in the maps
in Figure C-1. Storms with central pressures of 910 and 950 millibars were
simulated. Ten runs moved the hurricane onshore perpendicular to the coastline
at 5 different. locations indicated as tracks 1 to 5 in Figure C-1. Two different
storm intensities where used along each of the five tracks and given the suffix
A for 910 millibar storms and the suffix B for 950 millibar storms.
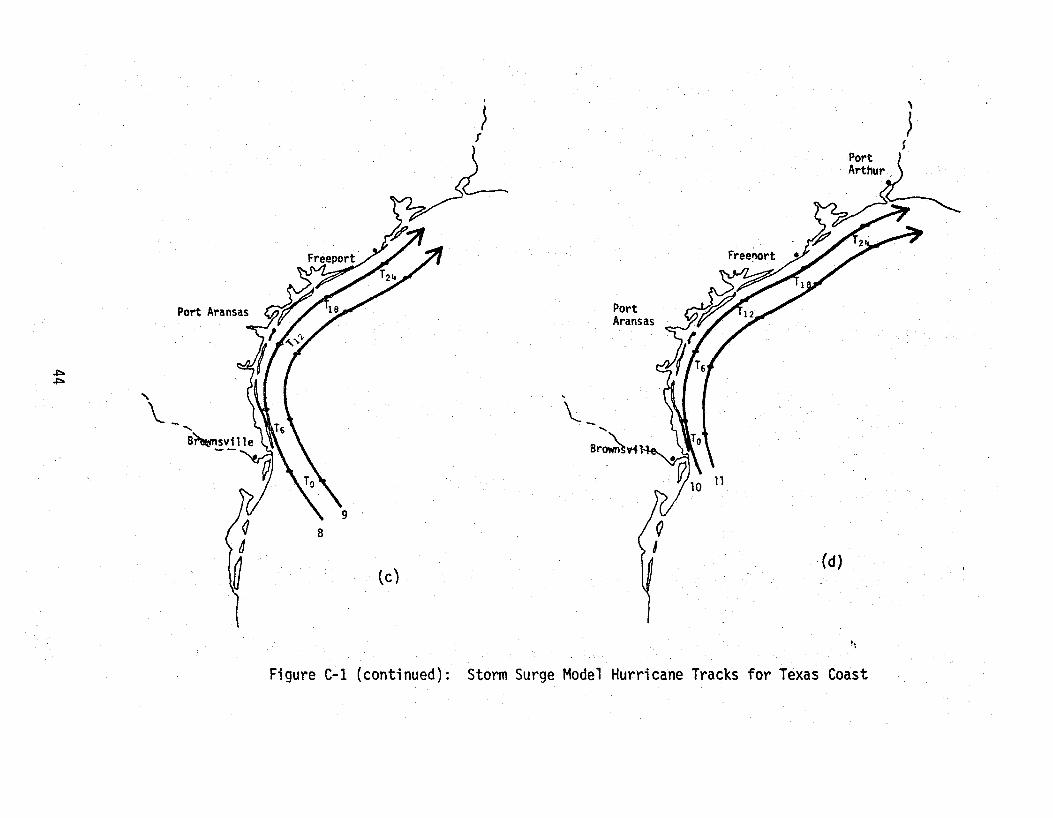
Eight runs (numbered 6-13 in Figure C-1) moved the hurricane paralleling
the coast, the point nearest the coastline. Tracks 6 and 7 represent a storm
having a 930 millibar central pressure at lOwhich increases to 950 millibars
at T24• Tracks 8 through 13 have a 940 millibar central pressure at T0 and
a 960 millibar central pressure at T24 .•
The final track, number 14 on Figure C-1 moves a storm with a central
pressure of 940 millibars across Galveston Island from the south. The eye of
all 14 storms have a radius of 15 nautical miles. A 950 millibar hurricane is
a category 3 hurricane and a 910 millibar hurricane is a category 5 hurricane.
Categories 3, 4, and 5 are all considered to be major hurricanes.
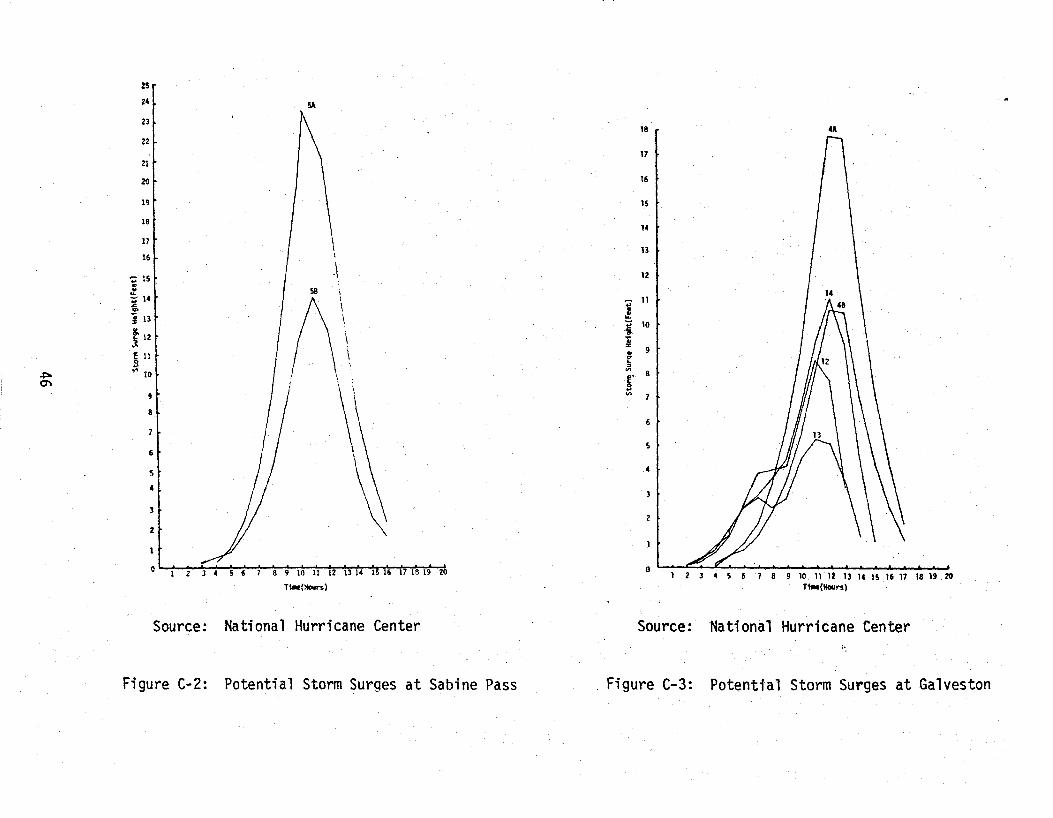
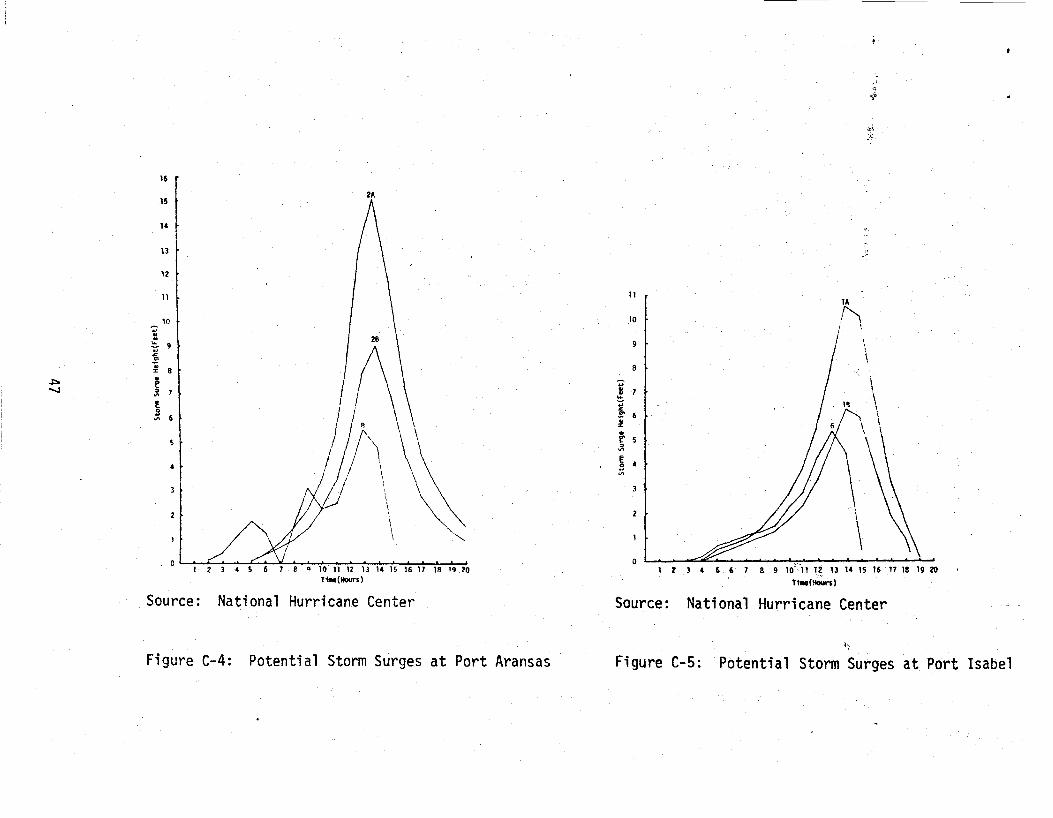
The results of the computer simulation is shown for selected location
along the Texas Gulf Coast in Figure C-2 through C-5. Several qualifications
must be noted. The projections are for a single point along the coast. The
41
.. computations are valid estimates on the open coast only. Broken features (bays,
es tua ri es, intra coasta 1 waterways , etc. ) are NOT incorporated in the model.
The onset of tides 2 to 4 feet above normal,. which can cut off some evacu
ation routes, can frequently occur along the Texas Coast 36 hours or more before . .
landfall with large, slow moving .hurricanes, and 18-24 hours before landfall
with large, faster moving hurricanes.
The purpose of the projections selected is not to pick peak surge values,
but to estimate the time versus surge relationship for several storms. Due
to the severe limitations of the estimates_, they must be used with extreme
caution. In all cases, they are only a indication of what might happen, not
necessarily what will happen.
42
..;:.. w
· T21t
..
2
T6 To
(a) (b)
Figure C-1: Stonn Surge ~1odel Hurricane Tracks for Texas Coast
(
I
7 6
1·,
~ ~
' \__ ......
B~..!v_!lle
. )
r
'
~
8
(c)
.......
Port Aransas
Br~ril 11
(d)
,,
Figure C-1 (continued): Storm Surge Model Hurricane Tracks for Texas Coast
' ~
r
_;:,. (J'I
' "-
~
~ 'I
} f
~
To
14
(e) (f)
·~
Figure C-1 (continued): Storm Surge Model Hurricane Tracks for Texas Coast
~ ~
25
24
23
22
21
20
19
18
17
16
-;:; 15 ., ~ ";:;' 14
"' "' j 13
r 12 " "' §11 "' to
9
8
7
' !i
4
3
2
1
0
SA
\ I
-\ 58
/\. \
\ I
~ 8 9 10 11 12 T1 tl "TI 16 ·11 T8 19 20
Tw(Hours)
Source: National Hurricane Center
Figure C-2: Potential Storm Surges at Sabine Pass
18 r 4A
17
16
15
14
13
12
-;:; 11 .. .. .. ";:;' 10 .c !;! .. "' .. 9
" ,_ " "' 8 1:" 0 .. "' ,
6
.4
0 I ,.:::::-;, y I I ·,'' ' t t t ' I , I t I • I
1 2 3 4 5 6 7 8 9 10 11 12 13 14 15 16 17 18 19 20 Titie(Hou")
Source: National Hurricane Center ,_
Figure C-3: Potential Storm Surges at Galveston
~ ......,
16
15 I u
13
12
11 l 10
~
:: ~ 9
" "' ;; " 8
~ .;: 7
f g ... 6
2A
I \
I ,. /If\ ""-...
Q 11) 11 12 13 14 15 16 11 18 19 20 n .... (Mours J
Source: National Hurricane Center
Figure C-4: Potential Storm Surges at Port Aransas
·' "t}
·~·
~~~ .:-~
11 1A
·: r
i~ I '.
I '
I \ ,.
-;; ~ 7 ';;' "" "' i I .. I !I \
' E' 5 Jl
~ 4
"'
0 ! I ~ I I I 111 I 1 ),
1 z J 4 & 6 1 8 9 1o'c:·11 12. u u ~~ 16 u 1s 19 zo
TIM(~rs)
Source: National Hurricane Center
l\
Figure C-5: Potential Storm Surges at Port Isabel
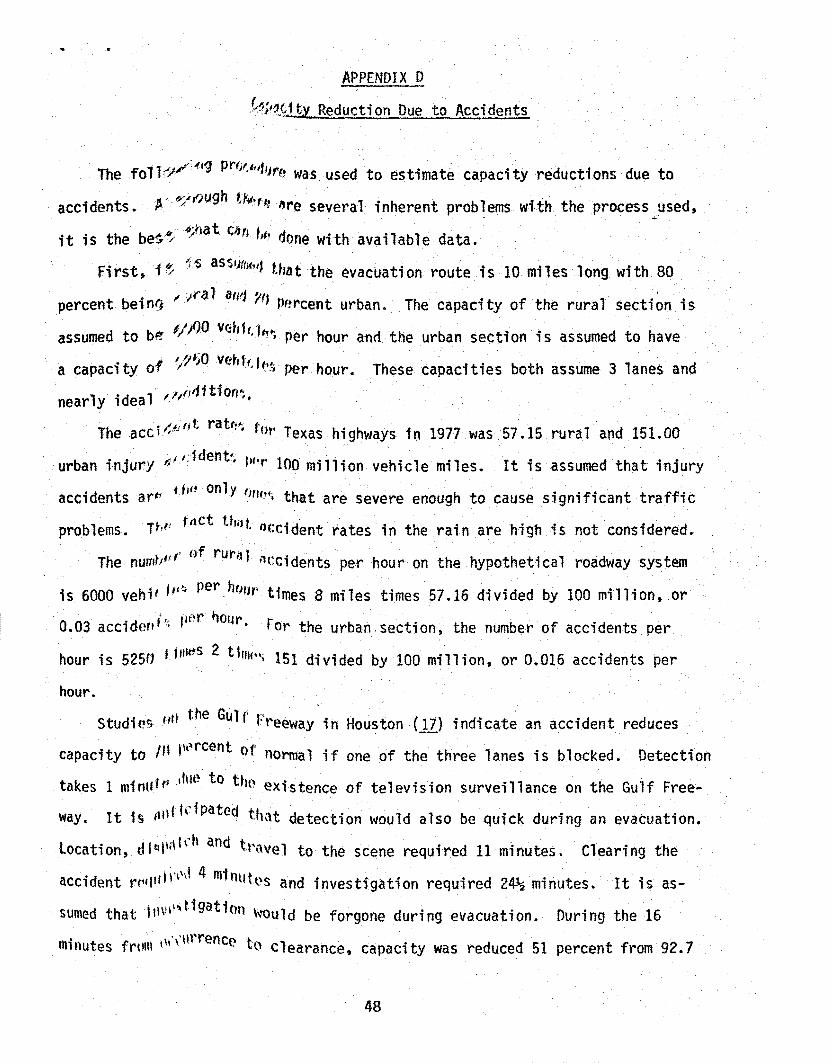
APPENDIX D
.~1j/_~rt.1ty Reduction Due to Accidents
The foll·"l/:.,..,9 prt),1 lY/fiJt'J was used to estimate capacity reductions due to
J(- 1;o7~1ugh HJt·rt, 1 ~ i · th accidents. ""'·. · ' · nre severa. 1nherent prob~ems w th e process .. ~sed,
it is the bes.~- 4;tlat Clim t,~y done with available data.
First, it. "i'S ass•Jr:~&,t1 that the evacuation route is 10 miles long with 80
percent being ";ral awl ?0 rmrcent urban. The capacity of the rural secti~n is
assumed to bf! lj/)O vet,fr,fl!tt per hour anrl the urban section is assumed to have
•t o6 .~~:;'~0 veh1rt,.~ per·. hour. a capac1 y -r , ·'·
1 .d 1 ,,,fld1tion~. near y 1 ea ·
These capacities both assume 3 lanes and
The acci.{t:nt ratr:-. ~'~•r Texas highways in 1977 was 57.15 rural and 151.00
urban injury ~~'''; 1 dent·~ IJ~·r 100 million vehicle miles. It is assumed that injury
accidents ar" tflt! only tm, .. , that are severe enough to cause significant traffic
problems. Tb1' rnct thllt occident rates in the rain are high is not considered.
f' of rur~.~1 The numt1'1 nccidents per hour on the hypothetical roadway system
is 6000 vehit fut< pertumr· times 8 miles times 57.16 divided by 100 million, or
0.03 accident\ pHr t}our. For the urban.section, the number of accidents per
hour is 5250 t ftttes 2 tl 1111 "> 151 divided by 100 million, or 0.016 accidents per
hour. ,''' the Gul r ,~ ,, . { ) d d Studie<; ' ·reeway 1n Houston lZ. indicate an acci ent re uces
capacity to /H pt~rcent of norma 1 if one of the three 1 anes is b 1 ocked. Detection
takes 1 minttfft due to thn existence of television surveillance on the Gulf Free
way. It is ,ud ldpat<!d that detection would also be quick during an evacuation.
Location, dl!:il 1111 d1 and h·\wel to the scene required 11 m1nutes. Clearing the
accident rtilfllll'l'd 4 minutt~s and investigation required 24l:! minutes. It is as
sumed that lnv•~'tigation \vould be forgone during evacuation. During the 16
minutes frnlll ' 11\·nrrenc£:1 to clearancet capacity was reduced 51 percent from 92.7
48
vehicles/minute to 45.3 vehicles/min.
Given the above data and assumptfon, the capacity reduction due to accidents
on the rural portion is 0.03 accj dents/hour times 16 mi m.ites/accidents times
1 hour/60 minutes times 51 percent reduction in capacity, or 0.41 percent.
For the urban portion., the capacity reduction is 0.016 times 16.times 51 divided
by 60, or 0.22 percent.
To indicate the sensitivity of the result to the assumption, the reduction
was recomputed with the accident rate doubled. The result is a doubling of the
reduction in capacity to 0.82 percent.in the rural section and 0.44 percent in
the urban section. It is therefore suggested that accidents of a routine nature
be ignored in the analysis.
49
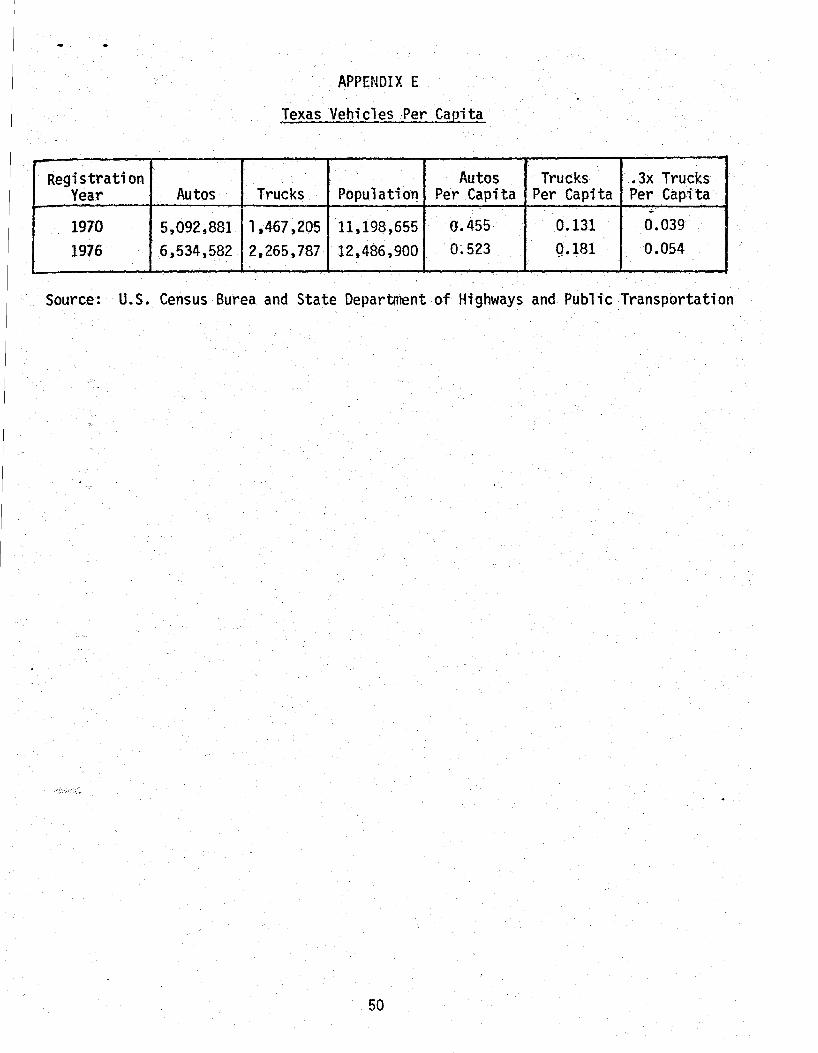
APPENDIX E
Texas Vehicles Per Capita
Registration Autos Trucks .3x Trucks Year Autos Trucks Population Per Capita Per Capita Per Capita
"" 1970 5,092,881 1,467,205 11,198,655 0.455 0.131 0.039
1976 6,534,582. 2,265,787 12,486,900 0~523 Q.181 0.054
Source: U.S. Census Burea and State Department of Highways and Public Transportation
50
lo
2.
3.
4.
5 ..
7.
B.
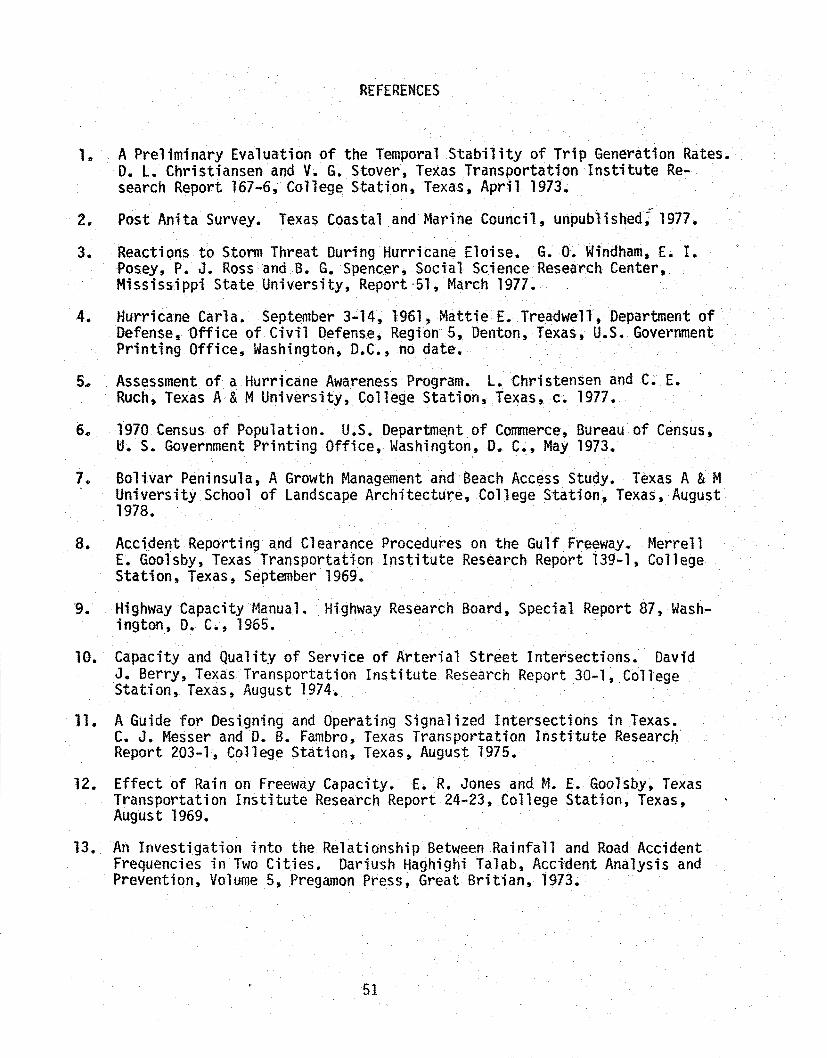
REFERENCES
A Preliminary Evaluation of the Temporal Stability of Trip Generation Rates. D. L. Christiansen and V. G. Stover, Texas Transportation Institute Research Report 167-6, College Station, Texas, April 1973.
Post Anita Survey. Texas Coastal and Marine Council, unpublished:- 1977.
Reactions to Storm Threat During Hurricane Eloise. G. 0. Windham, E. I. Posey, P. J. Ross and B. G. Spencer, Social Science Research Center, Mississippi State University, Report 51, March 1977.
Hurricane Carla. September 3-14, 1961, Mattie E. Treadwell, Department of Defense, Office of Civil Defense, Region 5, Denton, Texas, U.S. Government Printing Office, Washington, D.C., no date.. ·
Assessment of a Hurricane Awareness Program. L. Christensen and C. E. Ruch, Texas A & M University, College Station, Texas, c. 1977.
1970 Census of Population. u.s. Departrne.nt of Commerce, Bureau of Census, 1:.1. S. Government Printing Office, Washington_, D. C., May 1973.
Bolivar Peninsula, A Growth Management and Beach Access Study. Texas A & M University School of Landscape Architecture, College Station, Texas, August 1978.
Accident Reporting and Clearance Procedures on the Gulf Freeway. t~errell E. Goolsby, Texas Transportation Institute Research Report 139-1, College Station, Texas, September 1969.
Highway Capacityt4anual. Highway Research Board, Special Report 87, Washington, D. C., 1965.
10. Capacity and Quality of Service of Arterial Street Intersections. David J. Berry, Texas Transportation Institute Research Report 30-l,.College Station, Texas, August 1974.
· 11. A Guide for Designing and Operating Signalized Intersections in Texas. C. J. Messer and D. B. Fambro, Texas Transportation Institute Research Report 203-1, College Station, Texas, August 1975.
12. Effect of Rain on Freeway Capacity. E. R. Jones andM. E. Goolsby, Texas Transportation Institute Research Report 24-23, College Station, Texas, August 1969.
13. An Investigation into the Relationship Between Rainfall and Road Accident Frequencies in Two Cities. Dariush Haghighi Talab, Accident Analysis and Prevention, Volume 5, Pregamon Press, Great Britian, 1973.
51
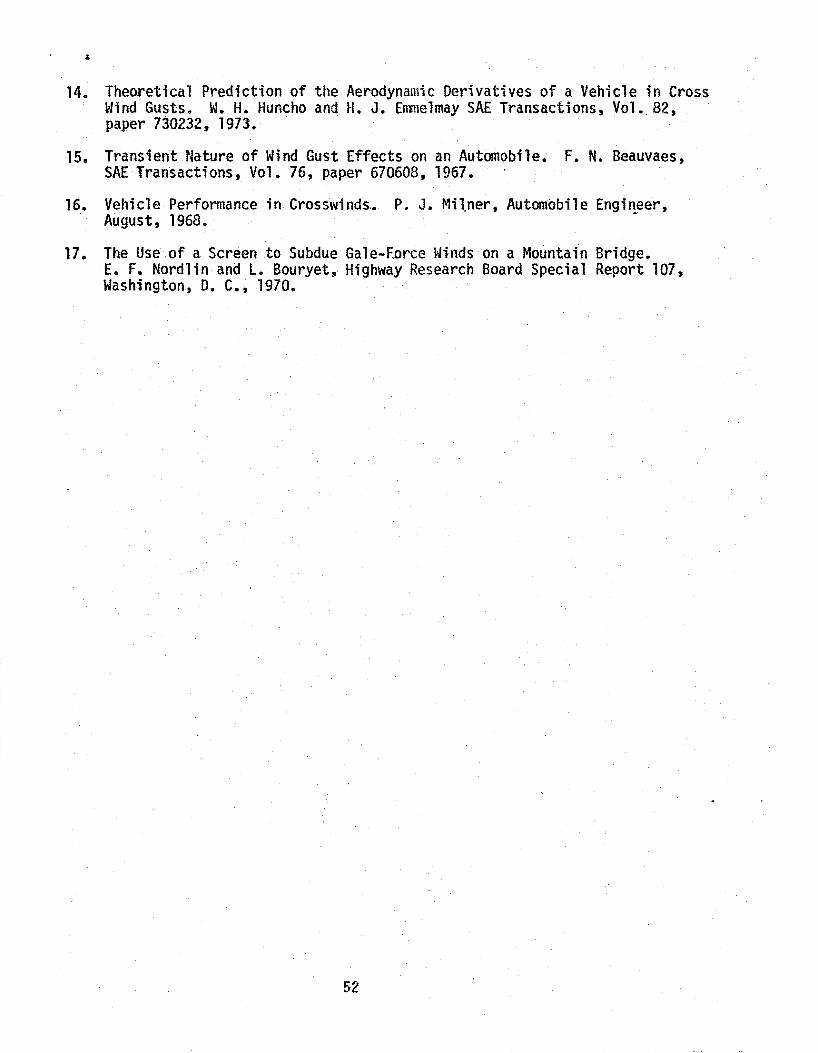
14~ Theoretical Prediction of the Aerodynamic Derivatives of a Vehicle in Cross Wind Gusts. W. H. Huncho and. H. J. Enmelmay SAE Transactions, Vol. 82, paper 730232, 1973.
15. Transient Nature of Wind Gust Effects on an Automobile. F. N. Beauvaes, SAE Transactions, Vol. 76, paper 670608, 1967.
16. Vehicle Performance in Crosswinds.. P. J. Milner, AutOITiobile Engineer, August, 1968. -
17. The Use of a Screen to Subdue Gale-F.orce Winds on a Mountain Bridge. E. F. Nordlin and L. Bouryet, Highway Research Board Special Report 107, Washington, D. c., 1970.
52