Texas Emissionsand Power Markets Webinar 1 11 12(Cs)
23
Texas emissions and power markets Carrie Sisto David Givens January 2012 London, Houston, Washington, New York, Portland, Calgary, Santiago, Singapore, Beijing, Tokyo, Sydney, Dubai, Moscow, Astana, Kiev, Hamburg and Johannesburg
-
Upload
carriesisto -
Category
Documents
-
view
261 -
download
1
Transcript of Texas Emissionsand Power Markets Webinar 1 11 12(Cs)

Texas emissions and power markets
Carrie SistoDavid GivensJanuary 2012
London, Houston, Washington, New York, Portland, Calgary, Santiago, Singapore, Beijing, Tokyo, Sydney, Dubai, Moscow, Astana, Kiev, Hamburg and Johannesburg

Argus Media
• Staff of 400 worldwide• Cover all global energy
markets and extensively used in indexation of physical and financial
• Electricity, emissions, natural gas, coal, crude, refined products, biofuels,, LPG, fertilizer, biomass, freight…
Takeaways
• Regulatory uncertainty plagues Texas generators
• Reversion to CAIR eases 2012 compliance
• Forward power curves up on capacity scarcity
• Forward spark spreads reflect weaker gas prices
• Seasonality of spark spread should dictate dispatch
Regulatory uncertainty
• Cross-State Air Pollution Rule on hold– Pending review of 45 challenges
• Clean Air Interstate Rule to be enforced– At least through 2012
• Other regulations– Mercury and Air Toxics Standards– Cooling intake structures– Coal combustion residuals
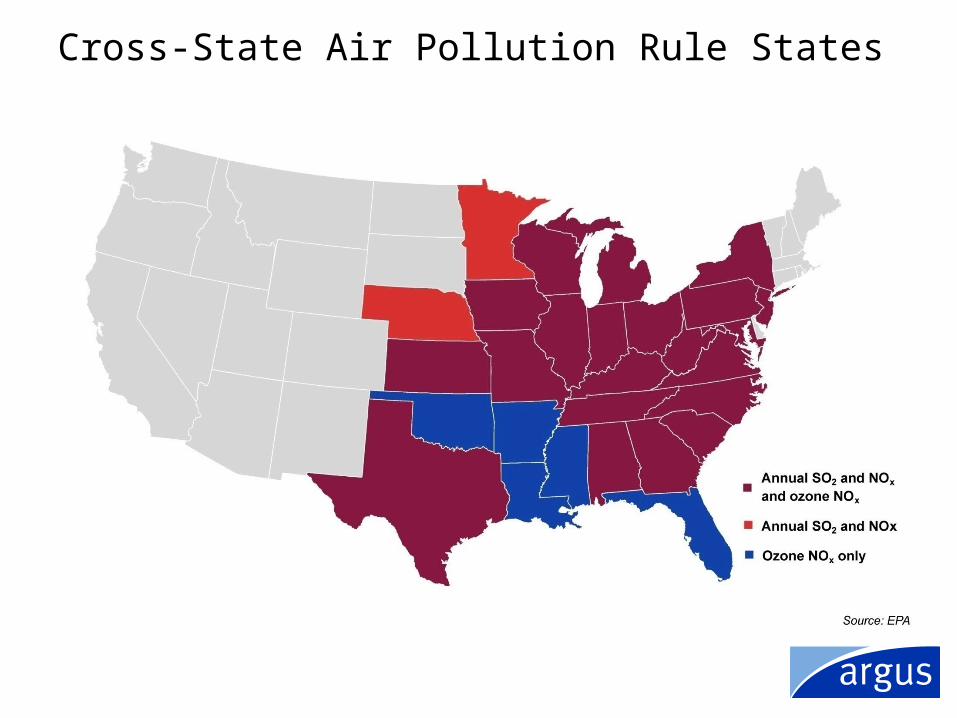
Cross-State Air Pollution Rule States
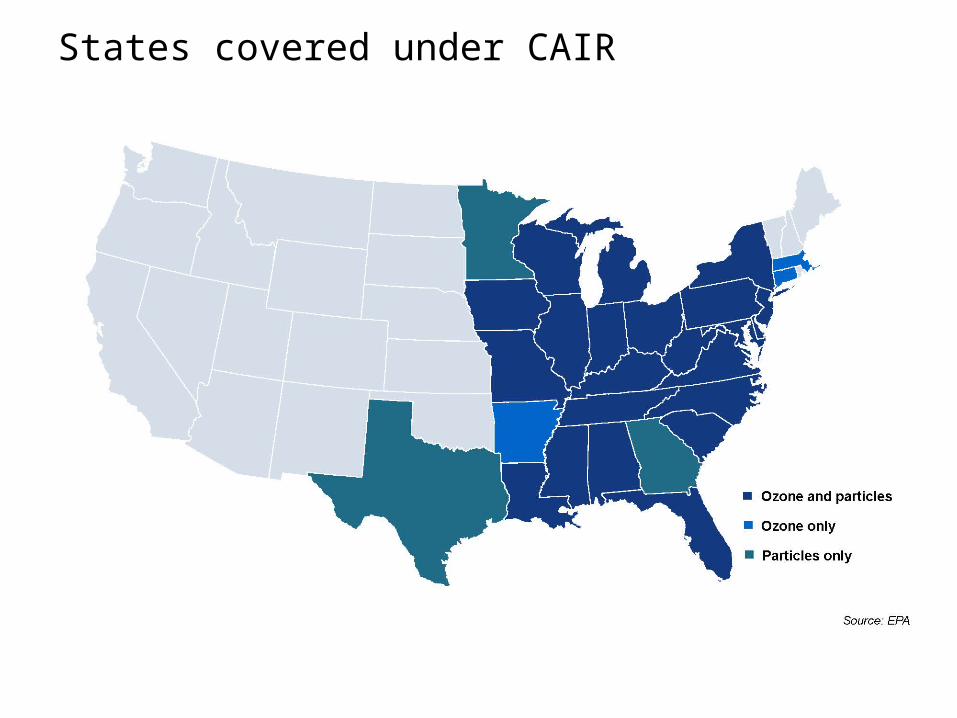
States covered under CAIR
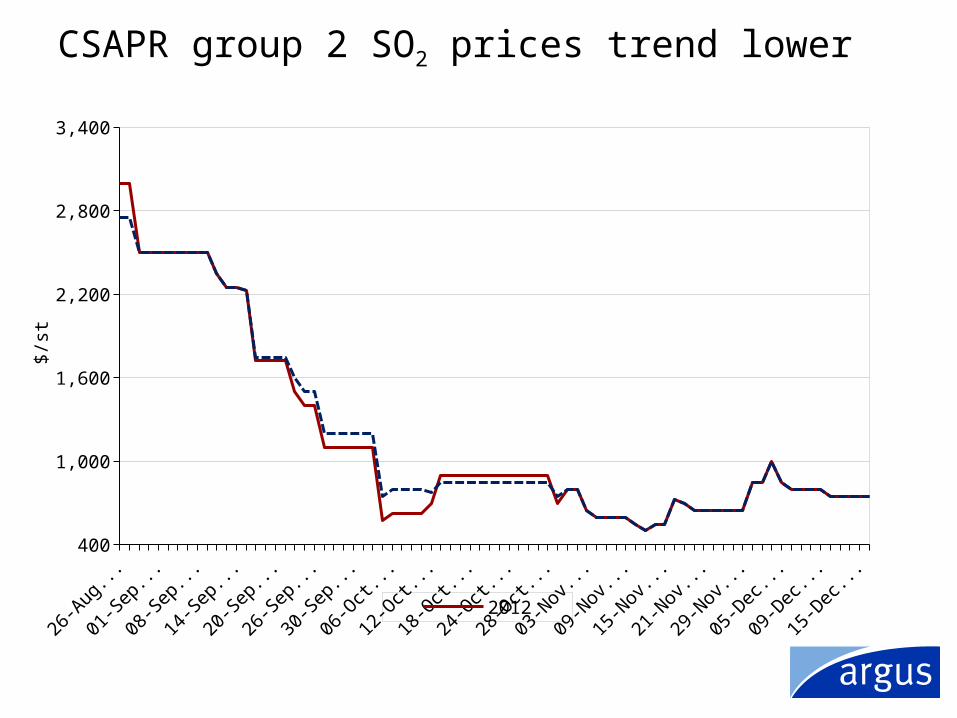
CSAPR group 2 SO2 prices trend lower
Aug-11 Sep-11 Oct-11 Nov-11 Nov-11 Dec-11400
1,000
1,600
2,200
2,800
3,400
2012
$/s
t
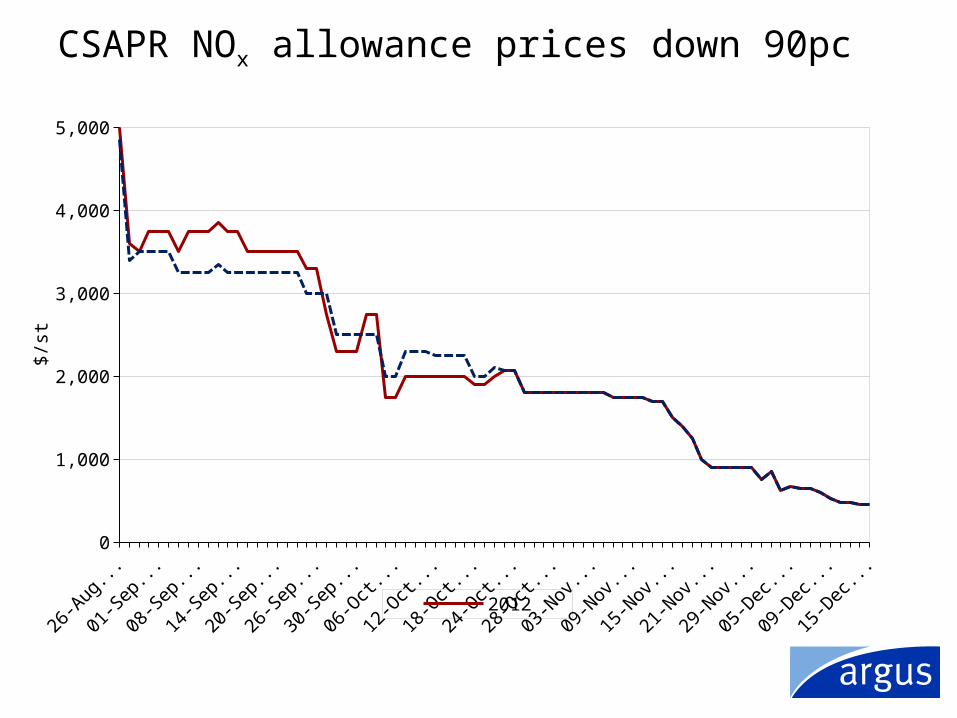
CSAPR NOx allowance prices down 90pc
Aug-11 Sep-11 Oct-11 Nov-11 Nov-11 Dec-110
1,000
2,000
3,000
4,000
5,000
2012
$/s
t
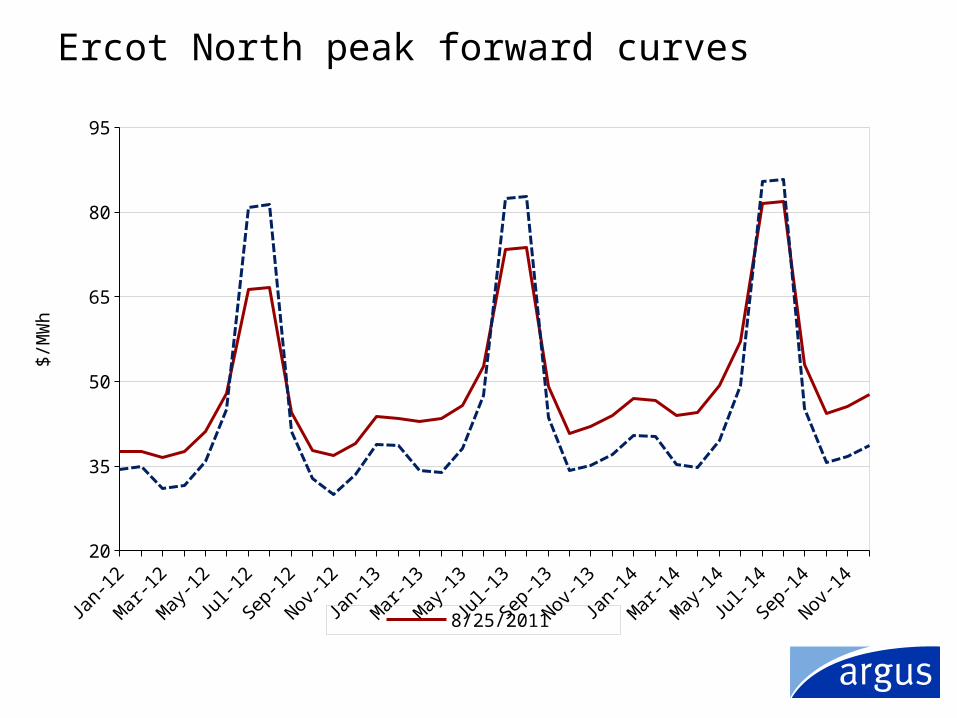
Ercot North peak forward curves
Jan-1220
35
50
65
80
95
8/25/2011
$/M
Wh
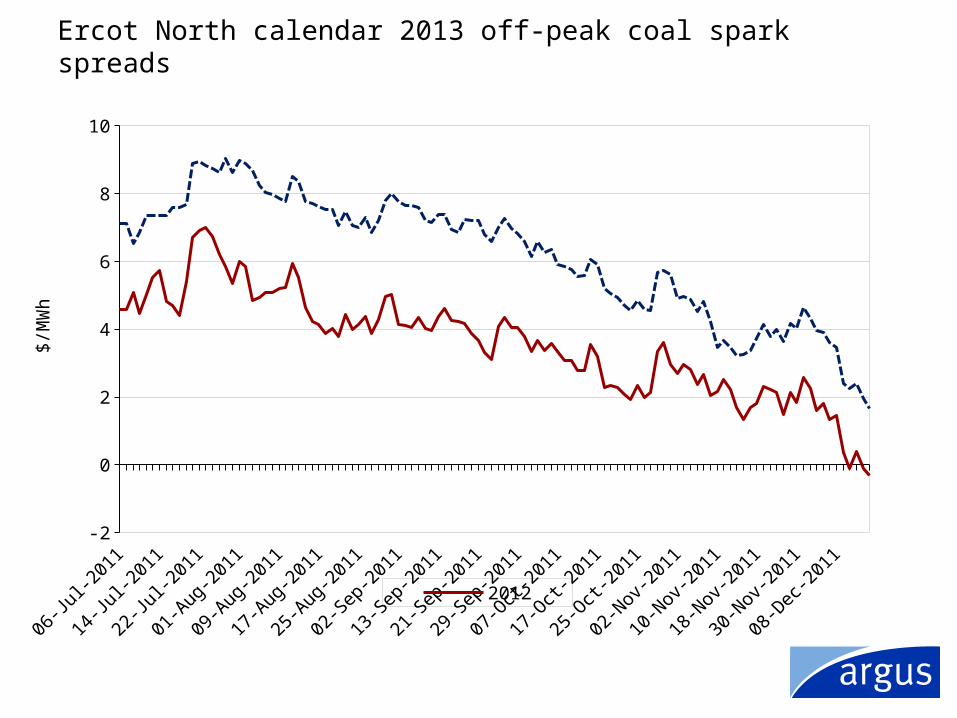
Ercot North calendar 2013 off-peak coal spark spreads
Jul-11 Aug-11 Sep-11 Oct-11 Nov-11 Dec-11-2
0
2
4
6
8
10
2012
$/M
Wh

Ercot North ATC forward curves
Jan-1225
35
45
55
65
12/15/2011 8/25/2011
$/M
Wh
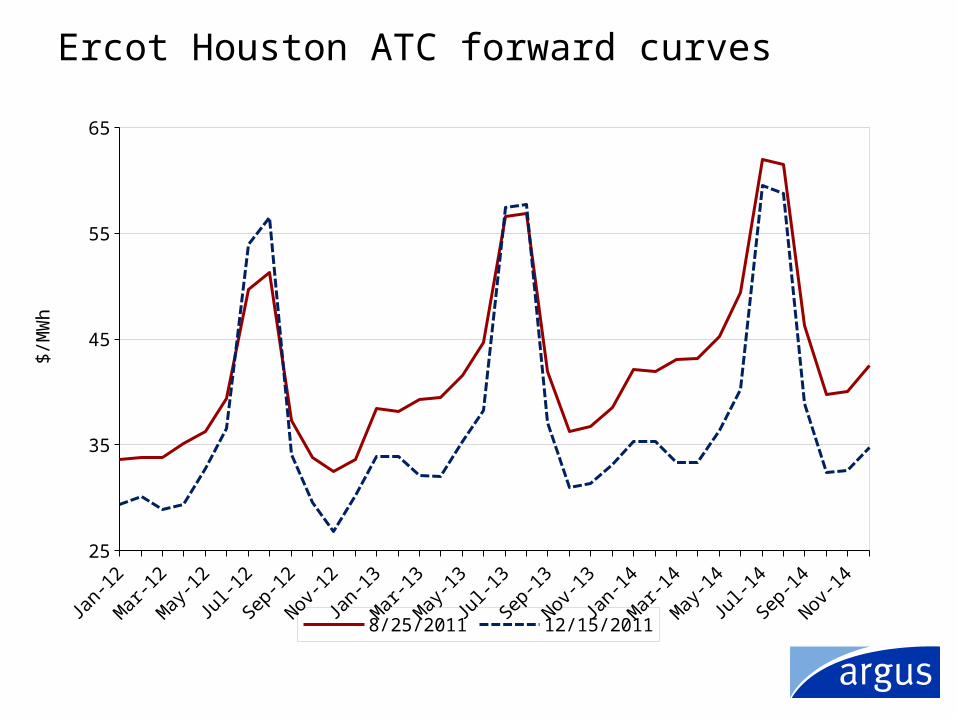
Ercot Houston ATC forward curves
Jan-1225
35
45
55
65
8/25/2011 12/15/2011
$/M
Wh
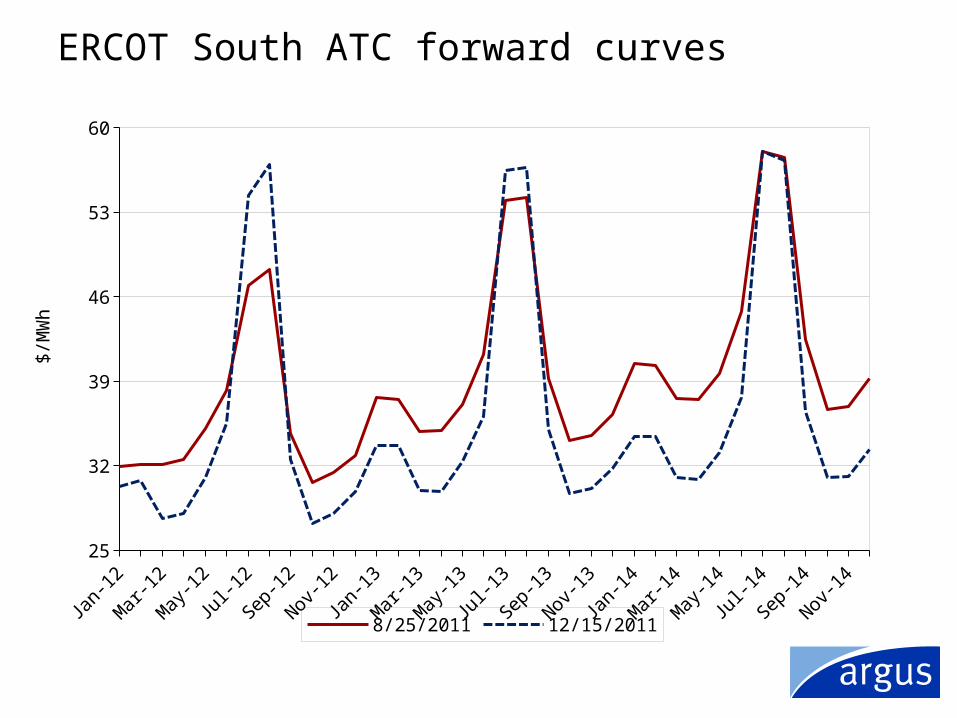
ERCOT South ATC forward curves
Jan-1225
32
39
46
53
60
8/25/2011 12/15/2011
$/M
Wh

Ercot West ATC forward curves
Jan-1215
25
35
45
55
65
8/25/2011 12/15/2011
$/M
Wh
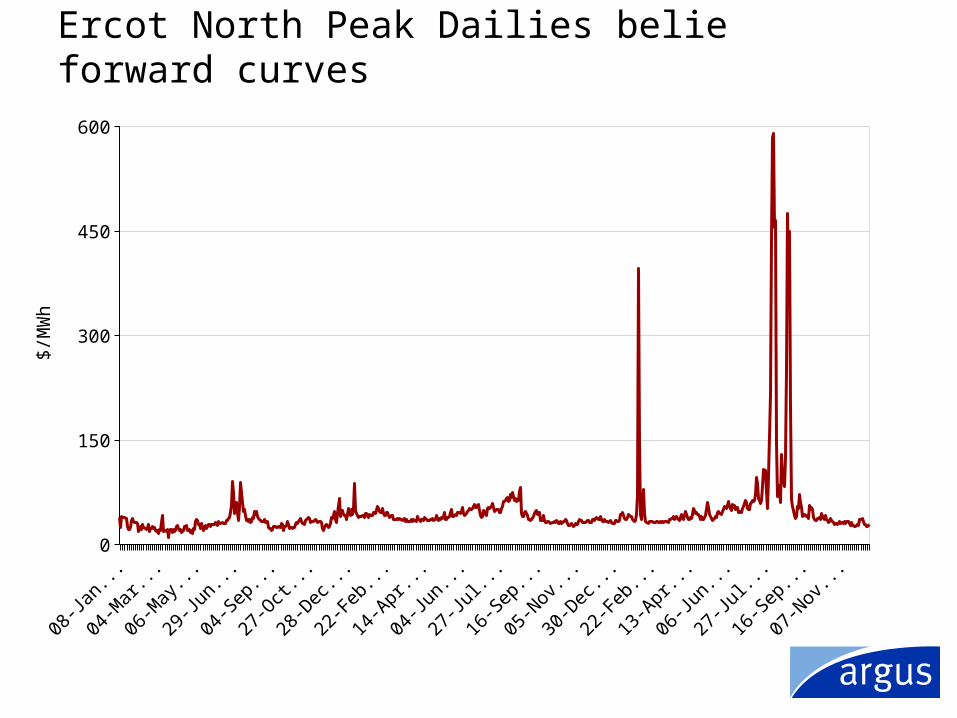
Ercot North Peak Dailies belie forward curves
Jan-09 Aug-09 Mar-10 Oct-10 May-11 Dec-110
150
300
450
600
$/M
Wh
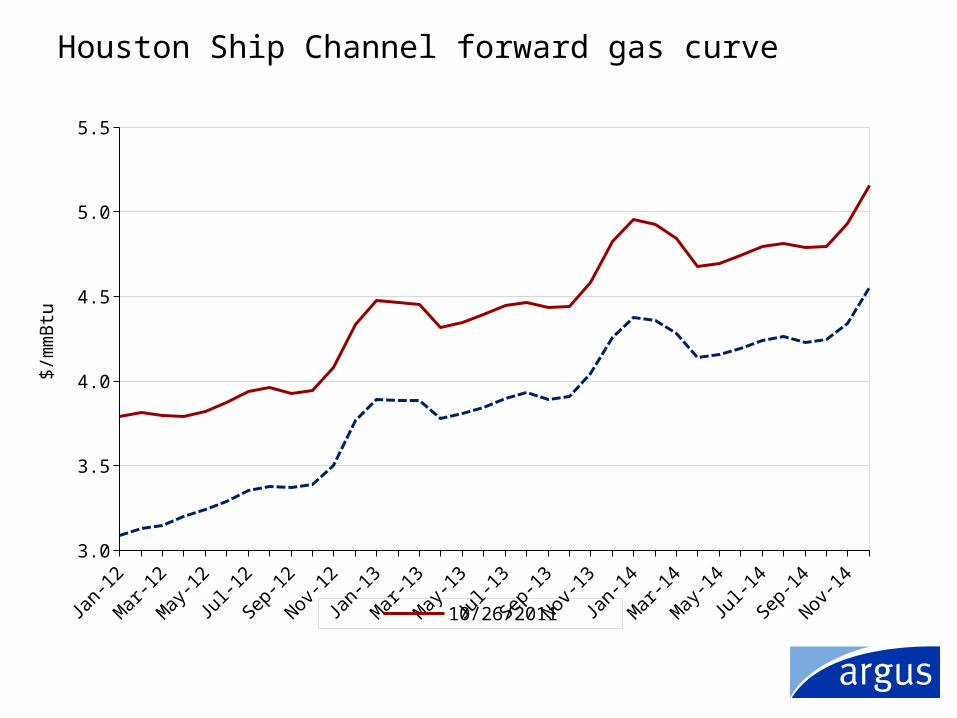
Houston Ship Channel forward gas curve
Jan-123.0
3.5
4.0
4.5
5.0
5.5
10/26/2011
$/m
mB
tu
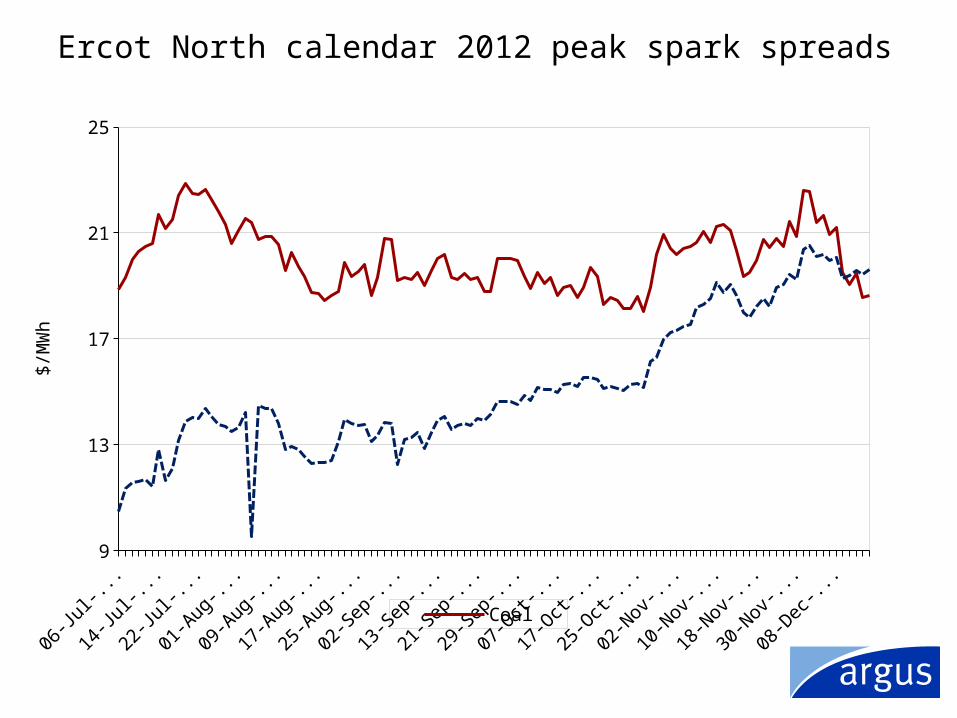
Ercot North calendar 2012 peak spark spreads
Jul-11 Aug-11 Sep-11 Oct-11 Nov-11 Dec-119
13
17
21
25
Coal
$/M
Wh

Ercot North calendar 2013 peak spark spreads
Jul-11 Aug-11 Sep-11 Oct-11 Nov-11 Dec-1112
16
20
24
28
Coal
$/M
Wh
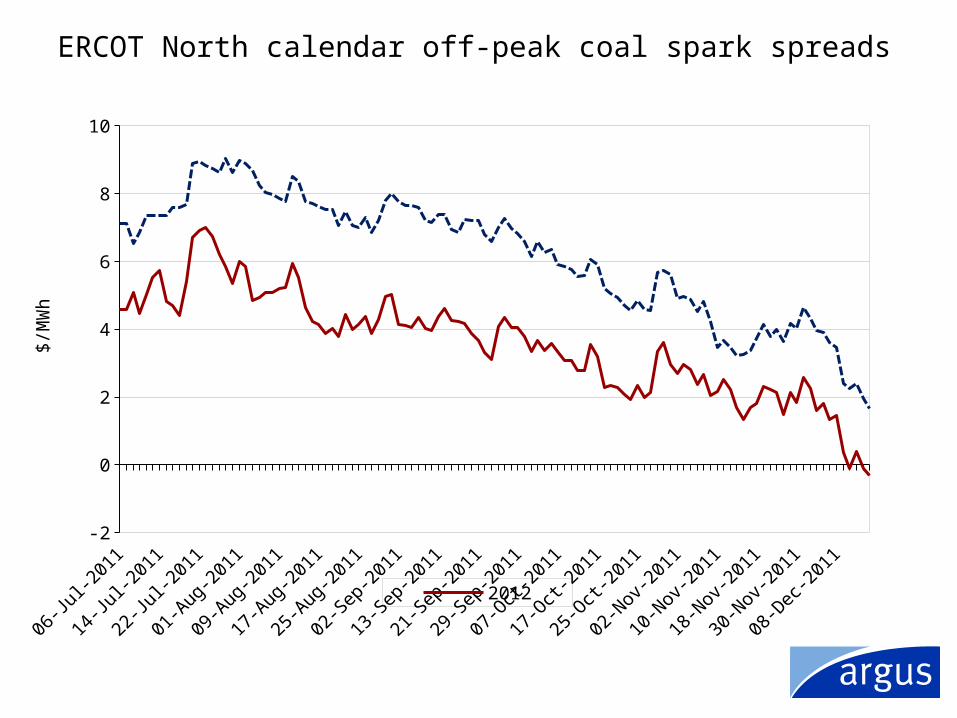
ERCOT North calendar off-peak coal spark spreads
Jul-11 Aug-11 Sep-11 Oct-11 Nov-11 Dec-11-2
0
2
4
6
8
10
2012
$/M
Wh
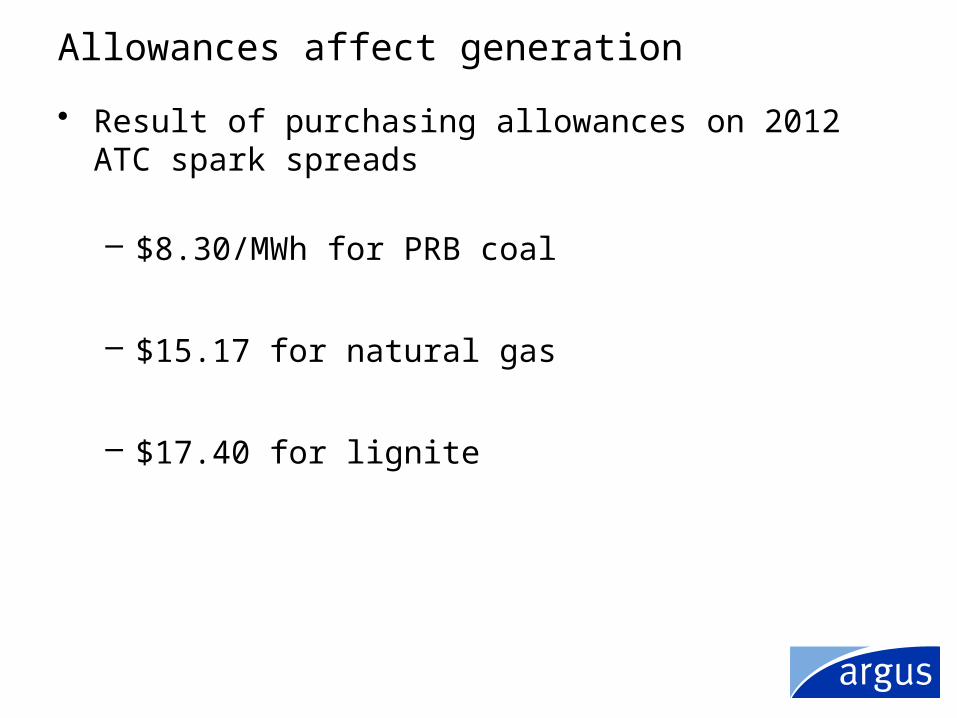
Allowances affect generation
• Result of purchasing allowances on 2012 ATC spark spreads
– $8.30/MWh for PRB coal
– $15.17 for natural gas
– $17.40 for lignite
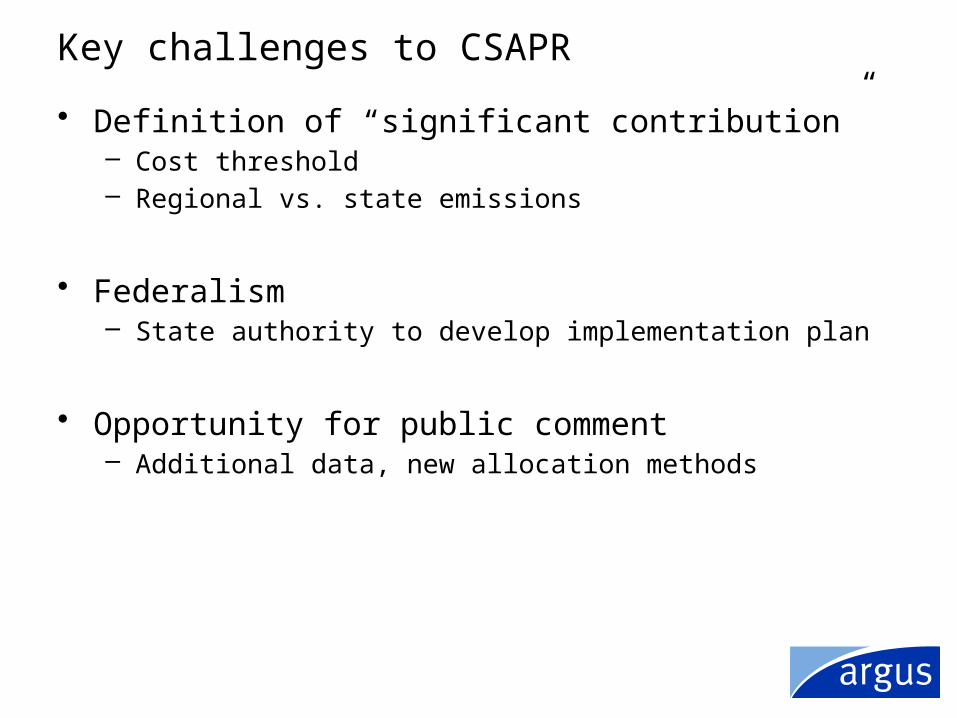
Key challenges to CSAPR
• Definition of “significant contribution”– Cost threshold– Regional vs. state emissions
• Federalism– State authority to develop implementation plan
• Opportunity for public comment– Additional data, new allocation methods
Takeaways
• Forward power curves account for:– Capacity scarcity– Marginal fuel price changes
• Forward gas curve – Continued weakening in second half 2011– Spark spreads more favorable
• Stay on CSAPR leaves everything up in the air
• Compliance much less daunting in 2012 under CAIR

Thank you.
David GivensHead of gas and power services, North [email protected]+ 1 202 349 2891
London, Houston, Washington, New York, Portland, Calgary, Santiago, Singapore, Beijing, Tokyo, Sydney, Dubai, Moscow, Astana, Kiev, Hamburg and Johannesburg