Tetragonal to Orthorhombic Transform^tfoti in Mg-PSZ
20
AU9715883 UMP-96/3&3 Tetragonal to Orthorhombic Transform^tfoti in Mg-PSZ Z.W. Liu a , A.E.C. Spargo a , R.HJ.Hannink b , J. Drennan M °School of Physics, The University of Melbourne, Victoria 8052, Australia 4 Division of Materials Science, CSIRO, Clayton, Victoria 3168, Australia Abstract The phase transformation from tetragonal to orthorhombic in MgO-partially-stabilized zirconia has been investigated by using high resolution transmission electron microscopy (HRTEM). Evidences are given to show that orthorhombic ZrC>2 frequently observed in transmission electron microscopy (TEM) thin foil studies was induced by dimpling and polishing during the specimen preparation. It was also found that the orthorhombic to monoclinic transformation was less sensitive to stress than the tetragonal to monoclinic transformation. 1. Introduction Partially stabilized zirconia (PSZ) ceramics are generally produced by the addition of high temperature soluble oxide stabilizers such as MgO and CaO to zirconia. These zirconia-toughened ceramics usually comprise metastable precipitateds of tetragonal (t) zirconia and (in minor amounts) the monoclinic (m) polymorph of zirconia, in a matrix of cubic (c) stabilized zirconia. The martensitic transformation from tetragonal to monoclinic, which is accompanied by a volume increase of about 4%, makes an 1 Present address: Center for Microscopy and Microanalysis, University of Queensland, St. Lucia, Qld 4072, Australia
Transcript of Tetragonal to Orthorhombic Transform^tfoti in Mg-PSZ
AU9715883
UMP-96/3&3
Tetragonal to Orthorhombic Transform^tfoti in Mg-PSZ
Z.W. Liu a, A.E.C. Spargo a, R.HJ.Hannink b, J. Drennan M
°School of Physics, The University of Melbourne, Victoria 8052, Australia
4Division of Materials Science, CSIRO, Clayton, Victoria 3168, Australia
Abstract
The phase transformation from tetragonal to orthorhombic in MgO-partially-stabilized
zirconia has been investigated by using high resolution transmission electron microscopy
(HRTEM). Evidences are given to show that orthorhombic ZrC>2 frequently observed in
transmission electron microscopy (TEM) thin foil studies was induced by dimpling and
polishing during the specimen preparation. It was also found that the orthorhombic to
monoclinic transformation was less sensitive to stress than the tetragonal to monoclinic
transformation.
1. Introduction
Partially stabilized zirconia (PSZ) ceramics are generally produced by the addition
of high temperature soluble oxide stabilizers such as MgO and CaO to zirconia. These
zirconia-toughened ceramics usually comprise metastable precipitateds of tetragonal
(t) zirconia and (in minor amounts) the monoclinic (m) polymorph of zirconia, in a
matrix of cubic (c) stabilized zirconia. The martensitic transformation from tetragonal
to monoclinic, which is accompanied by a volume increase of about 4%, makes an
1 Present address: Center for Microscopy and Microanalysis, University of Queensland, St. Lucia, Qld 4072, Australia
important contribution to the toughening [1]. One of the toughest ceramics can be
obtained by subjecting the sintered and control-cooled Mg-PSZ material to a final sub-
eutectoid aging treatment at 1100°C. It has been confirmed [2] that significant quantity
of 6-phase and a small quantity of orthorhombic (o) phase exist in Mg-PSZ samples
which had been aged at sub-eutectoid temperature. The £-phase, with the composition
Mg2ZrsOi2 [3], has an cubic-related structure with ordered anion vacancies, and we will
discuss it elsewhere.
The occurrence of orthorhombic phase in zirconia-toughened ceramics was first re-
ported by Schoenlein and Heuer [4] in surface regions of "optimally-aged" Mg-PSZ.
Heuer and co-workers also observed tetragonal to orthorhombic transformation either
on fracture surfaces [5] or in thermally-shocked Mg-PSZ materials [6]. Orthorhombic
ZrO2 was also found in Ca-PSZ [7], and in Y2O3-ZrO2 alloys [8].
The first evidence that o-phase occurred in substantial quantities was provided by
Marshall et al [9] from X-ray diffraction examination of Mg-PSZ samples which had
been cooled below about 170K. Marshall et al concluded that the tetragonal to or-
thorhombic transformation occurred throughout the bulk with most of the i-phase
transformed to o-phase. By using neutron power diffraction analyses, Howard et al
reported [10] that, upon cooling, an o-phase was produced in considerable quantities
at the expense of the <-phase, and at 20K the sample contained about 38% by weight
o-phase. The o-phase content increased to 45%, when the sample was warmed just
about room temperature, (307K). Although the orthorhombic to tetragonal reversion
transformation occurred at 500K, small amount of the o-phase retained at 664K.
Marshall et al reported [9] that the formation of o-TxOi in Mg-PSZ will lead to
dramatic changes in mechanical properties of this high-toughness material. Its fracture
toughness was reduced, and i2-curve behavior was lost.
In this paper we report that most of the content of the o-phase in TEM thin foils
was produced by dimpling and polishing during the specimen preparation.
2. Experimental Procedure
Mg-PSZ containing 9.4mol% MgO was prepared from mixed powders of the com-
ponent oxides. The powder was sintered and solution-treated at 1700°C, cooled at
275°C/h to 1000°C, and then at 70°C/h to room temperature. The sample was re-
heated to 1100°C in air, aged for two hours, and then furnace-cooled.
Thin foils for electron microscopy were prepared from the sample. A disc of thickness
about lmm was cut and polished, and at this stage the thickness of the disc is about
200/zm. Then the disc was cut into small discs with diameter about 3.5mm. Two discs
were chosen. One was dimpled until the thickness of the center reaches about 30/zm
and then ion thinned. We named this one as specimen Ni. The other was ion thinned
directly and we named it as specimen N2.
A JEOL 4000EX high resolution transmission electron microscopy was used to ex-
amine the specimens at 400kV.
3. Experimental Results
S.I. Results from specimen Ni
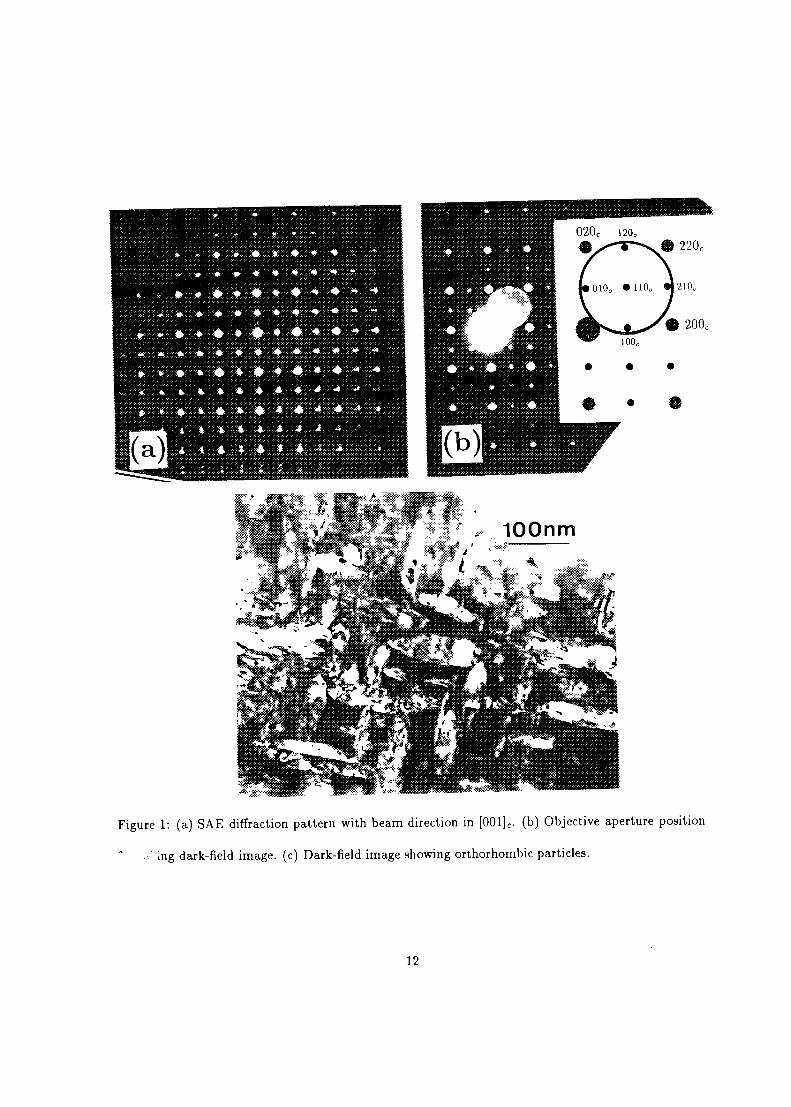
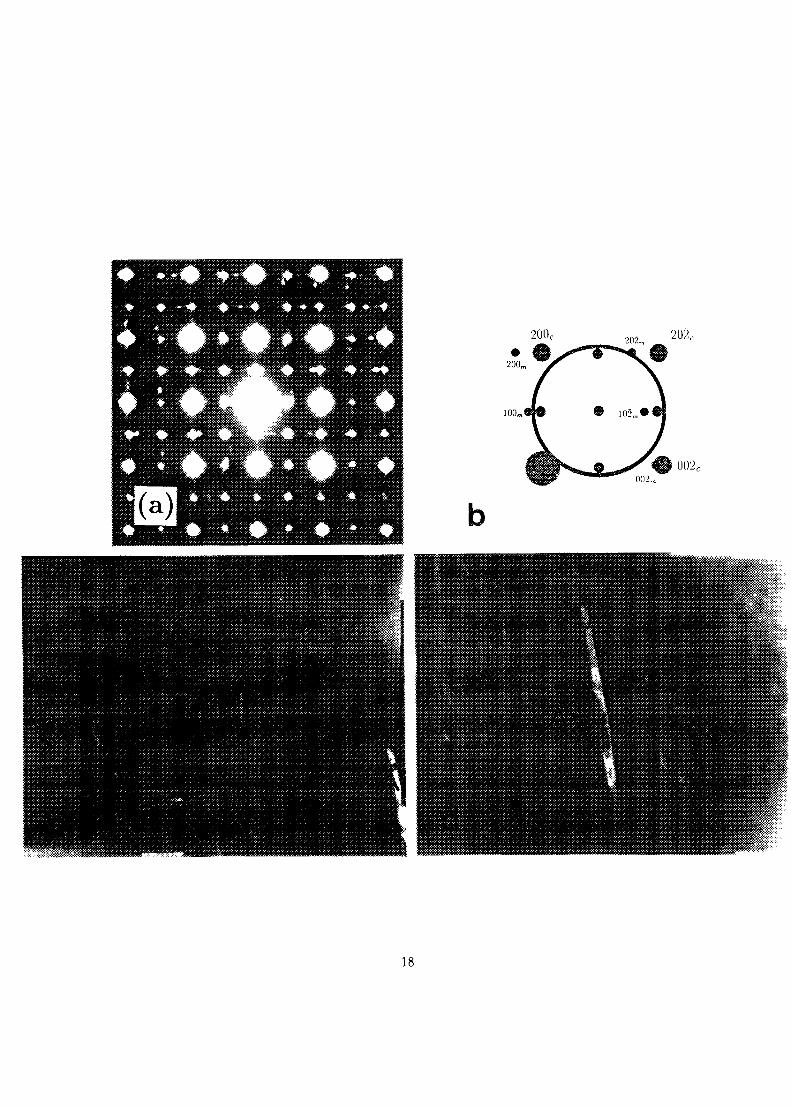
Figure l(a) is » r n n l ] c zone axis selected area electron (SAE) diffraction pattern in
which the extra reflections (weak points) appeared without characters of monoclinic
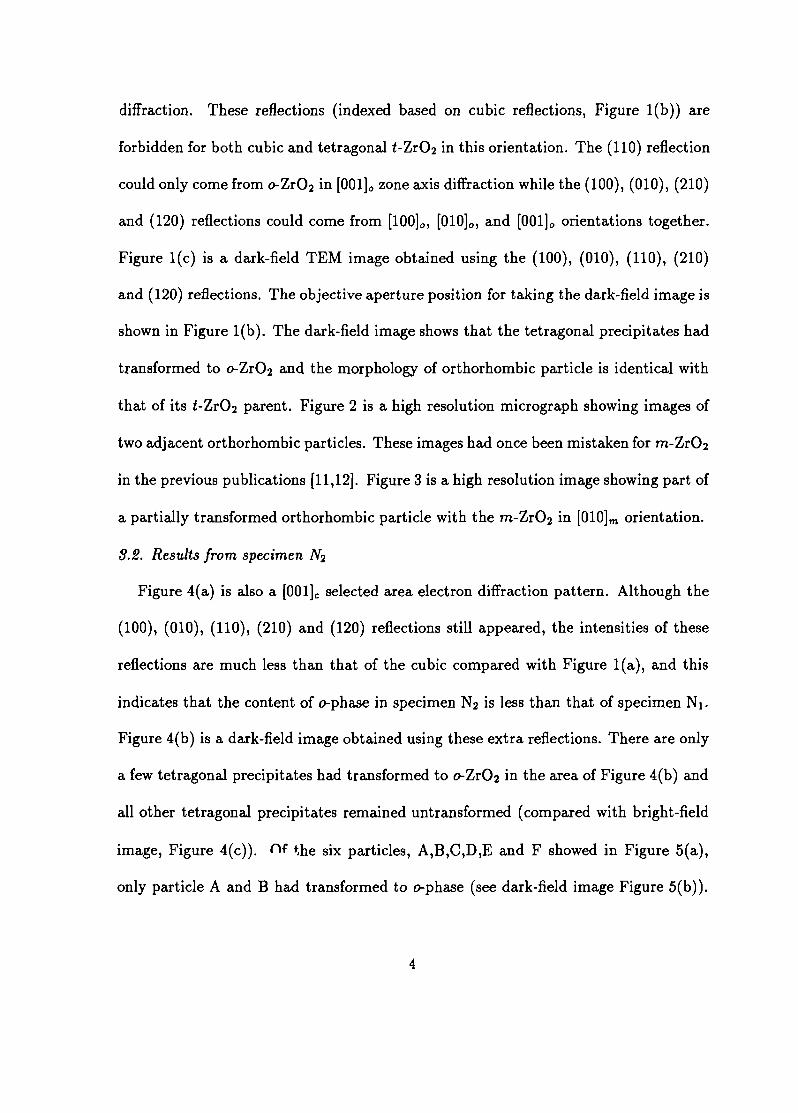
diffraction. These reflections (indexed based on cubic reflections, Figure l(b)) are
forbidden for both cubic and tetragonal £-ZrO2 in this orientation. The (110) reflection
could only come from o-Zr02 in [001]o zone axis diffraction while the (100), (010), (210)
and (120) reflections could come from [100]o, [010]o, and [001]o orientations together.
Figure l(c) is a dark-field TEM image obtained using the (100), (010), (110), (210)
and (120) reflections. The objective aperture position for taking the dark-field image is
shown in Figure l(b). The dark-field image shows that the tetragonal precipitates had
transformed to o-ZrO2 and the morphology of orthorhombic particle is identical with
that of its i-ZrO2 parent. Figure 2 is a high resolution micrograph showing images of
two adjacent orthorhombic particles. These images had once been mistaken for m-ZrO2
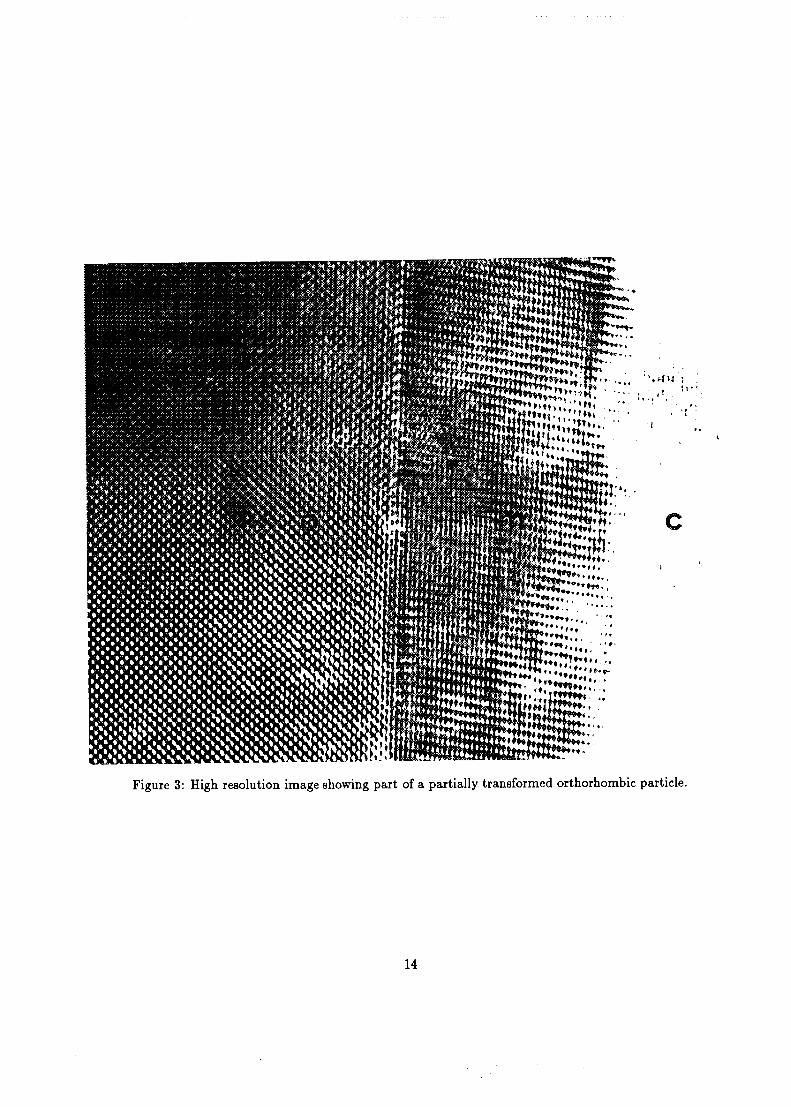
in the previous publications [11,12]. Figure 3 is a high resolution image showing part of
a partially transformed orthorhombic particle with the m-ZrC>2 in [010]m orientation.
3.2. Results from specimen AT2
Figure 4(a) is also a [001]c selected area electron diffraction pattern. Although the
(100), (010), (110), (210) and (120) reflections still appeared, the intensities of these
reflections are much less than that of the cubic compared with Figure l(a), and this
indicates that the content of o-phase in specimen N2 is less than that of specimen Ni.
Figure 4(b) is a dark-field image obtained using these extra reflections. There are only
a few tetragonal precipitates had transformed to o-ZrO2 in the area of Figure 4(b) and
all other tetragonal precipitates remained untransformed (compared with bright-field
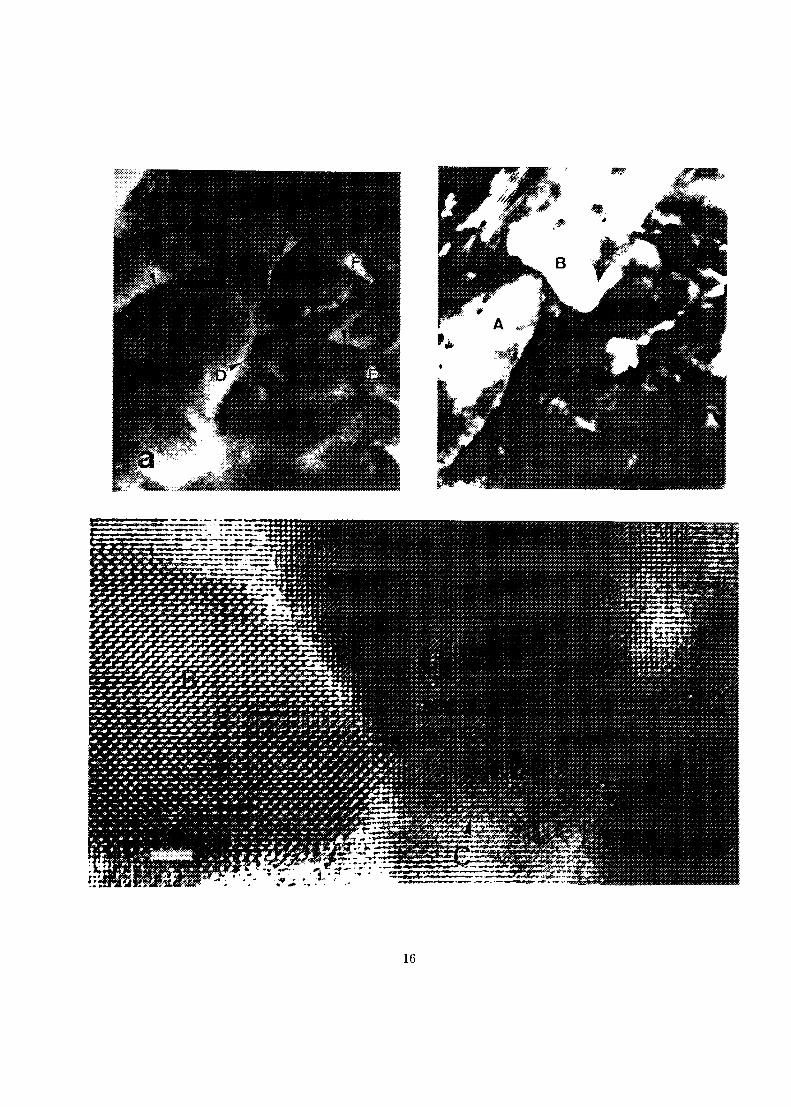
image, Figure 4(c)). <~lf the six particles, A,B,C,D,E and F showed in Figure 5(a),
only particle A and B had transformed to o-phase (see dark-field image Figure 5(b)).
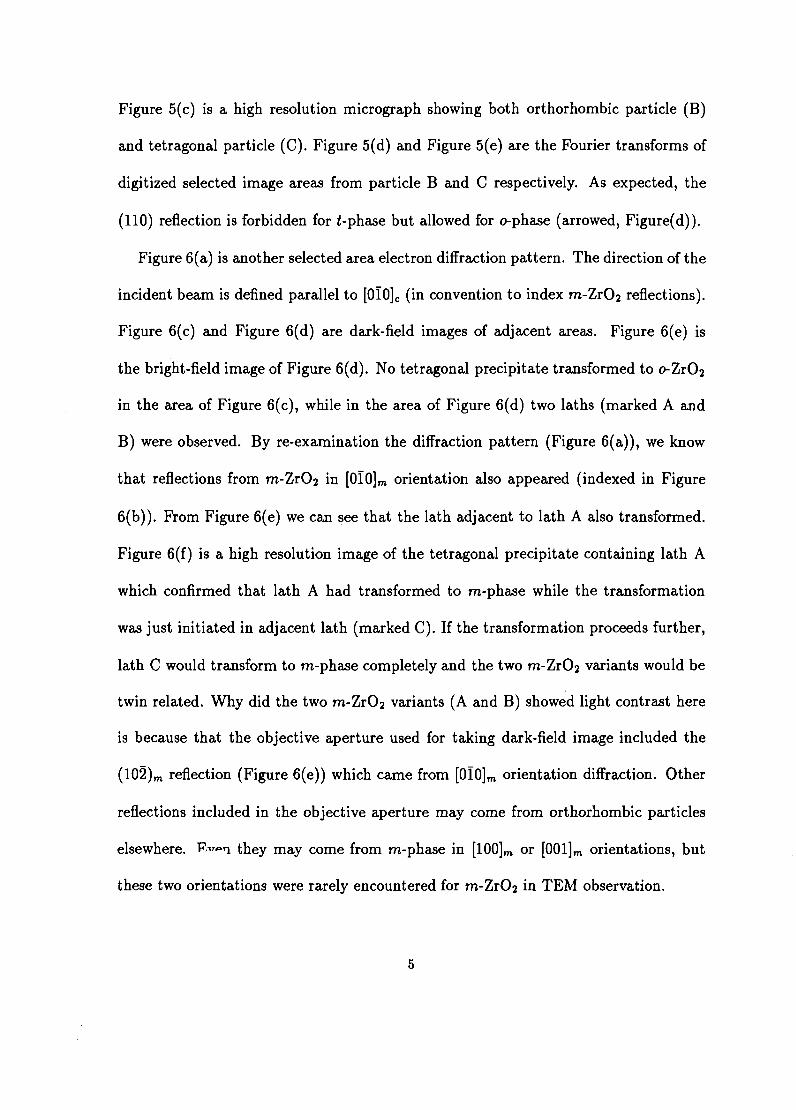
Figure 5(c) is a high resolution micrograph showing both orthorhombic particle (B)
and tetragonal particle (C). Figure 5(d) and Figure 5(e) are the Fourier transforms of
digitized selected image areas from particle B and C respectively. As expected, the
(110) reflection is forbidden for f-phase but allowed for o-phase (arrowed, Figure(d)).
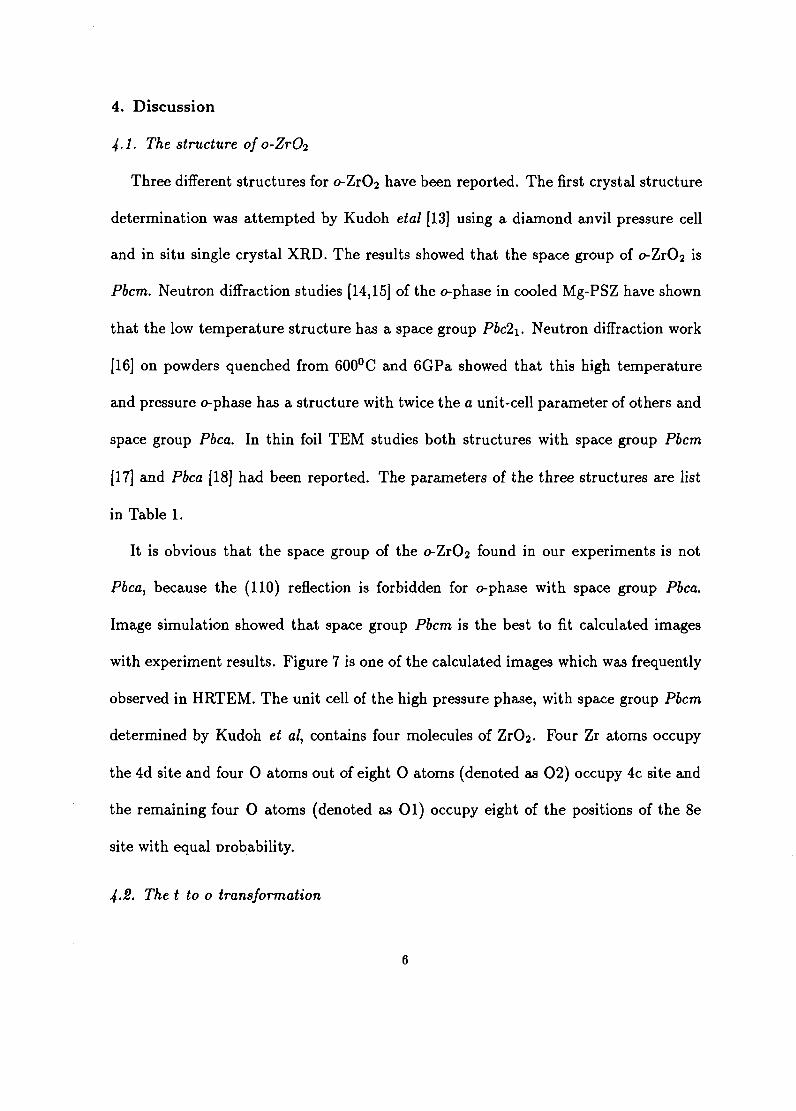
Figure 6(a) is another selected area electron diffraction pattern. The direction of the
incident beam is defined parallel to [010]c (in convention to index m-ZrO2 reflections).
Figure 6(c) and Figure 6(d) are dark-field images of adjacent areas. Figure 6(e) is
the bright-field image of Figure 6(d). No tetragonal precipitate transformed to o-ZrC>2
in the area of Figure 6(c), while in the area of Figure 6(d) two laths (marked A and
B) were observed. By re-examination the diffraction pattern (Figure 6(a)), we know
that reflections from m-ZrO2 in [0l0]m orientation also appeared (indexed in Figure
6(b)). From Figure 6(e) we can see that the lath adjacent to lath A also transformed.
Figure 6(f) is a high resolution image of the tetragonal precipitate containing lath A
which confirmed that lath A had transformed to m-phase while the transformation
was just initiated in adjacent lath (marked C). If the transformation proceeds further,
lath C would transform to m-phase completely and the two m-ZrO2 variants would be
twin related. Why did the two m-ZrO2 variants (A and B) showed light contrast here
is because that the objective aperture used for taking dark-field image included the
(102)m reflection (Figure 6(e)) which came from [010]m orientation diffraction. Other
reflections included in the objective aperture may come from orthorhombic particles
elsewhere. R'""i they may come from m-phase in [100]m or [001]m orientations, but
these two orientations were rarely encountered for m-ZrC>2 in TEM observation.
4. Discussion
4-1. The structure of o-
Three different structures for o-ZrC>2 have been reported. The first crystal structure
determination was attempted by Kudoh etal [13] using a diamond anvil pressure cell
and in situ single crystal XRD. The results showed that the space group of o-Zr02 is
Pbcm. Neutron diffraction studies [14,15] of the o-phase in cooled Mg-PSZ have shown
that the low temperature structure has a space group Pbc2\. Neutron diffraction work
[16] on powders quenched from 600°C and 6GPa showed that this high temperature
and pressure o-phase has a structure with twice the a unit-cell parameter of others and
space group Pbca. In thin foil TEM studies both structures with space group Pbcm
[17] and Pbca [18] had been reported. The parameters of the three structures are list
in Table 1.
It is obvious that the space group of the o-Zr02 found in our experiments is not
Pbca, because the (110) reflection is forbidden for o-phase with space group Pbca.
Image simulation showed that space group Pbcm is the best to fit calculated images
with experiment results. Figure 7 is one of the calculated images which was frequently
observed in HRTEM. The unit cell of the high pressure phase, with space group Pbcm
determined by Kudoh et al, contains four molecules of ZrO2- Four Zr atoms occupy
the 4d site and four 0 atoms out of eight 0 atoms (denoted as 02) occupy 4c site and
the remaining four O atoms (denoted as 01) occupy eight of the positions of the 8e
site with equal probability.
4-2. The t to o transformation
The as-fired (not subjected to a sub-eutectoid aging treatment) Mg-PSZ sample
contains no o-phase, but o-Zr02 was frequently observed in TEM thin foils, so it had
once been suggested [7,17] that the formation of the o-phase from metastable tetragonal
particles in TEM thin foils was an artifact. Muddle and Hannink [19] once showed that
ion beam thinning can induce the tetragonal to orthorhombic transformation, and R.
Suyama et al [20] found that grinding also can produce o-ZrO2.
In our experiments we believe that most of the o-phase was induced by dimpling and
polishing. The experiment results above show that most of the tetragonal precipitates
had transformed to o-Zr02 in specimen Ni, while in specimen N2 most tetragonal
precipitates remained untransformed. Although the bulk sample contains 54.2% t-
phase and only 2% o-phase [2], indeed we never detected tf-ZrO2 and frequently observed
o-ZrO2 in specimen Ni. Ion beam thinning moved off about 30/zm of dimpled-surface
of specimen Ni and 200/zm polished-surface of specimen N2. No tetragonal precipitate
was observed in the center observation area of specimen Ni, and this indicates that
the transformation zone depth must be more than 30/zm. Whereas in specimen N2,
t-ZrOi was abundant, while o-ZrC>2 was rarely encountered, therefore most of the
transformation zone had been removed by ion beam thinning.
Polishing and dimpling transformed most of the tetragonal precipitates to o-phase
other than m-phase. This may indicate that the tetragonal to orthorhombic transfor-
mation can be more easily induced than the tetragonal to monoclinic transformation.
But ™° f^>und that the o-ZrO2 was not readily transformable by stress and this is con-
sistent with what Marshall et al [9] noticed in cooled Mg-PSZ samples. Figure 8 is
a dark-field image showing a crack tip area found in specimen Ni. No orthorhombic
particle transformed to m-ZrO2 near the crack tip. Whereas, if the tetragonal precipi-
tates had not been transformed to o-phase, cracking would lead to the transformation
of tetragonal precipitates to m-phase. However, the orthorhombic to monoclinic trans-
formation may be induced at high stresses, because m-ZrO2 transformed from o-ZrC>2
can be observed like that shown in Figure 3.
5. Conclusions
(1) Polishing and dimpling are the two most important factors responsible for the
tetragonal to orthorhombic transformation observed in TEM thin foil studies.
(2) The space group of orthorhombic ZrC>2 is Pbcm with its b axis parallel to the
short dimension of the particle.
(3) The tetragonal to orthorhombic transformation can be more easily induced than
the tetragonal to monoclinic transformation, while the o-ZrC>2 was not readily trans-
formable by tensile stress.
Acknowledgements
The authors wish to thank Tom Bonin and David Dryden for assistance in specimen
preparation.
REFERENCES
[1]. R. GARVIE, R. H. HANNINK, and R. T. PASCOE, Nature, 258(1975)703-704.
[2]. R. H. J. HANNINK, C. J. HOWARD, E. H. KISI, and M. V. SWAIN, /. Am. Ceram. Soc,
77[2](1994)571-79.
[3]. H. J. ROSSELL and R. H. HANNINK, p.139, in Advances in Ceramics, Vol. 12, Science and Technology
of Zirconia II
[4]. L. H. SCHOENLEIN and A. H. HEUER, Fracture Mechanics of Ceramics, Vol. 6, edited by R. C.
Bradt, A. G. Evans, D. P. H. Hasselman, and F. F. Lange, Plenum, New York, (1982)309-323.
[5]. L. LENZ and A. H. HEUER, J. Amer. Ceram. Soc., 65(11)(1982)C192-194.
[6]. A. H. HEUER and L. H. SCHOENLEIN, /. Mater. Set., 20(1985)3421-27.
[7]. R. M. DICKERSON, M. SWAIN and A. H. HEUER, /. Amer. Ceram. Soc., 70(4)(1987)214.
[8]. A. H. HEUER, R. CHAIM and V. LANTERI in proceedings of "ZrO2 '86", in Advances in Ceramics,
Vol. 24, edited by S. Somiya, N. Yamamoto and H. Yanagida, American Ceramic Society, Columbus, Ohio,
1988.
[9]. D. B. MARSHALL, M. R. JAMES, and J. R. PORTER, /. Amer. Ceram. Soc., 72(1989)218-27.
[10]. C. J. HOWARD, E. H. KISI, R. B. ROBERTS, and R. J. HILL, J. Amer. Ceram. Soc, 73(1990)2828-
33.
[11]. A. H. HEUER, V. LANTERI and R. CHAIM, Ultramicroscopy, 22(1987)27-34.
[12]. A. H. HEUER, J. Am. Ceram. Soc., 7O(10)(1987)689-98.
[13]. Y. KUDOH, H. TAKEDA, and H. ARASHI, Phys. Chem. Miner., 13(1987)233-37.
[14]. E. H. KISI, C. J. HOWARD, and R. J. HILL, J. Am. Ceram. Soc., 72[9](1989)1757-60.
[15]. C. J. HOWARD, E. H. KISI, and O. OHTAKA, J. Am. Ceram. Soc., 74[9](1991)2321-23.
[16]. O. OHTAKA, T. YAMANOKA, S. KUME, N. HARA, H. ASANO, and F. IZUMI, Proc. Jpn. Acad.
Ser. B, 66(1990)193-96.
[17]. A. H. HEUER, V. LANTERI, S. C. FARMER, R. CHAIM, R. -R. LEE, B. W. KIBBLE, and R. M.
DICKERSON, J. Mater. Sci., 24(1989)124-32.
[18]. A. H. HEUER, L. H. SCHOENLEIN, and S. FARMER, pp. 257-66, in Science of Ceramics, Vol. 12,
edited by P. Vincenzini, Ceramurgica, Faenza, Italy, 1984.

[19]. B. C. MUDDLE and R. H. J. HANNINK, pp. 89-102 in Science and Technology of Zircinia III. Edited
by S. Somiya, N. Yamamoto, and H. Yanagida, American Ceramic Society, Westerville, OH, 1988.
[20]. R. SUYAMA, T. ASHIDA, and S. KUME, J. Am. Ceram. Soc, 68[12](1985)C-314-C-315.
10
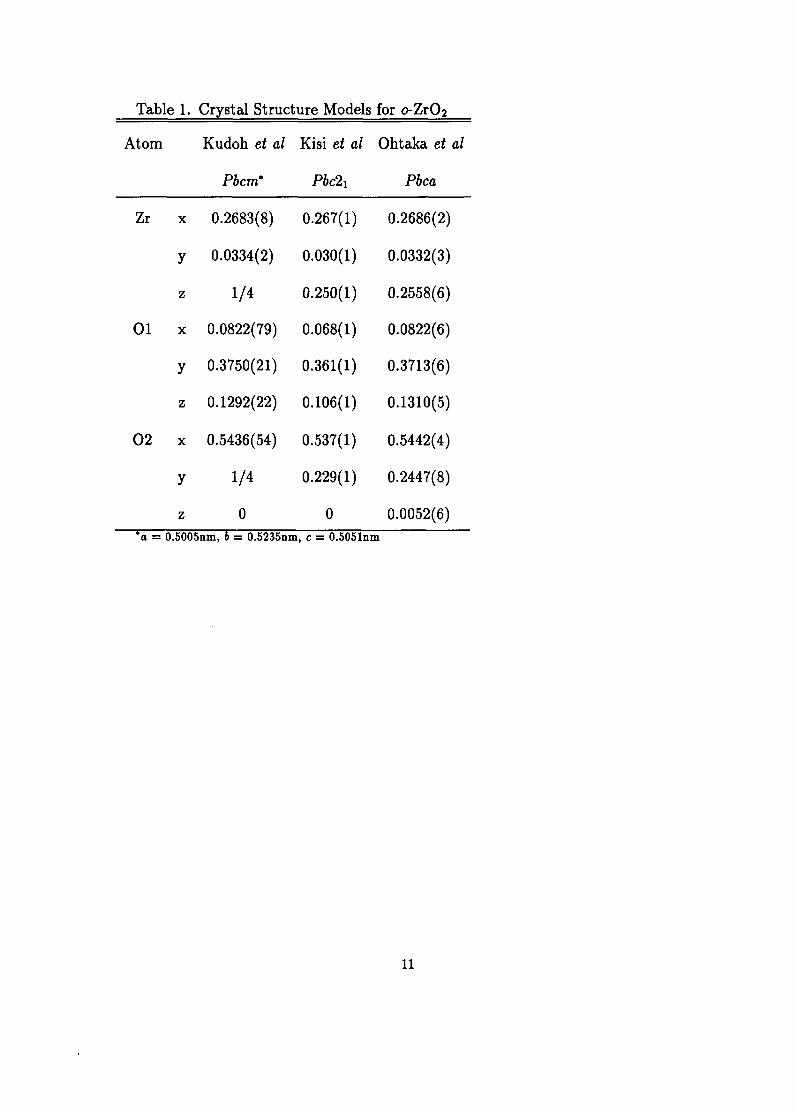
Table 1. Crystal Structure Models for o-ZrQ2
Atom Kudoh et al Kisi et al Ohtaka et al
Pbcm* Pbc2x Pbca
Zr
01
02
x 0.2683(8)
y 0.0334(2)
z 1/4
x 0.0822(79)
y 0.3750(21)
z 0.1292(22)
x 0.5436(54)
y 1/4
z 0
0.267(1)
0.030(1)
0.250(1)
0.068(1)
0.361(1)
0.106(1)
0.537(1)
0.229(1)
0
0.2686(2)
0.0332(3)
0.2558(6)
0.0822(6)
0.3713(6)
0.1310(5)
0.5442(4)
0.2447(8)
0.0052(6)a = 0.5005nm, 6 = 0.5235nm, c = 0.5051nm
11
200f
Figure 1: (a) SAE diffraction pattern with beam direction in [001]c. (b) Objective aperture position
•" Ing dark-field image, (c) Dark-field image showing orthorhombic particles.
12
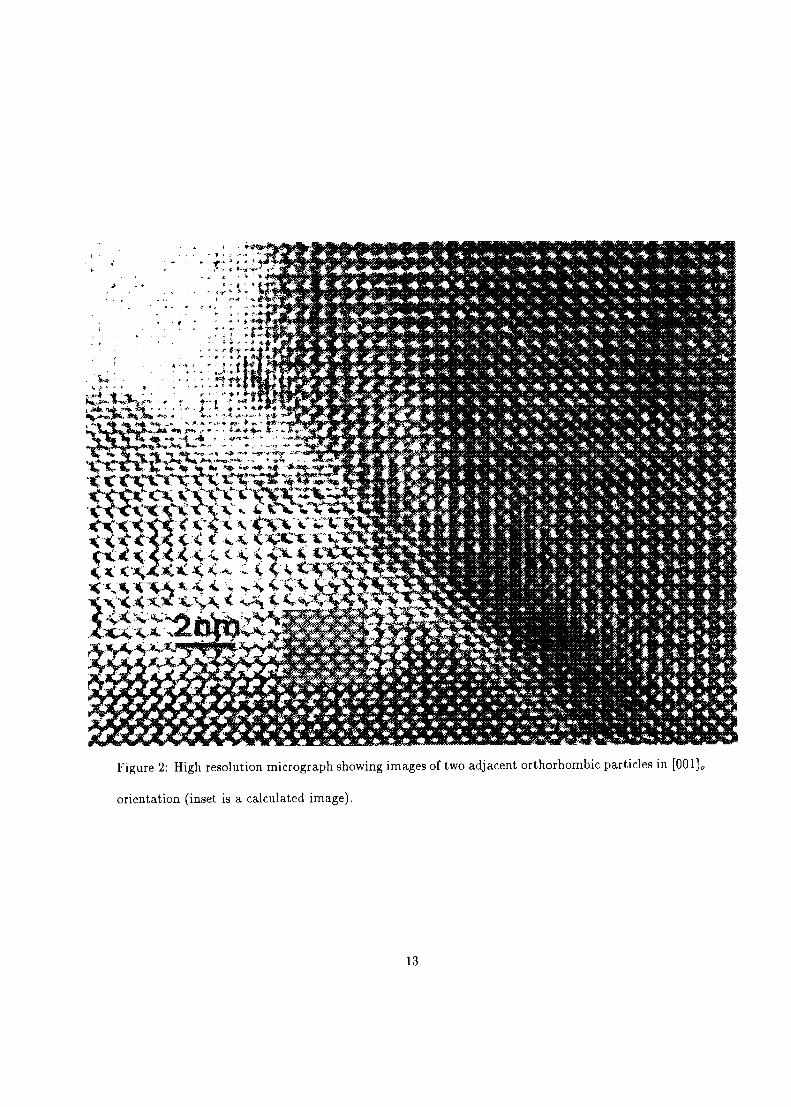
Figure 2: High resolution micrograph showing images of two adjacent orthorhombic particles in [001]o
orientation (inset is a calculated image).
13
. ! I!
Figure 3: High resolution image showing part of a partially transformed orthorhombic particle.
14
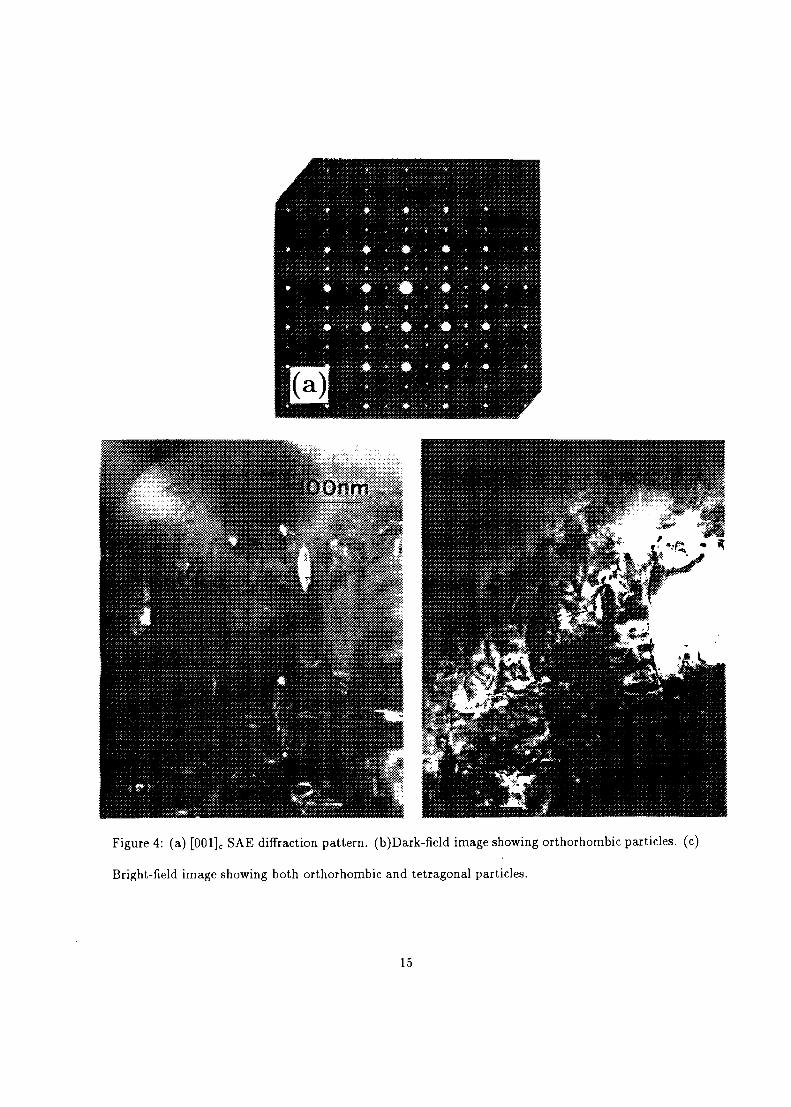
Figure 4: (a) [001],; SAE diffraction pattern. (b)Dark-field image showing orthorhombic particles, (c)
Bright-field image showing both orthorhombic and tetragonal particles.
15
16
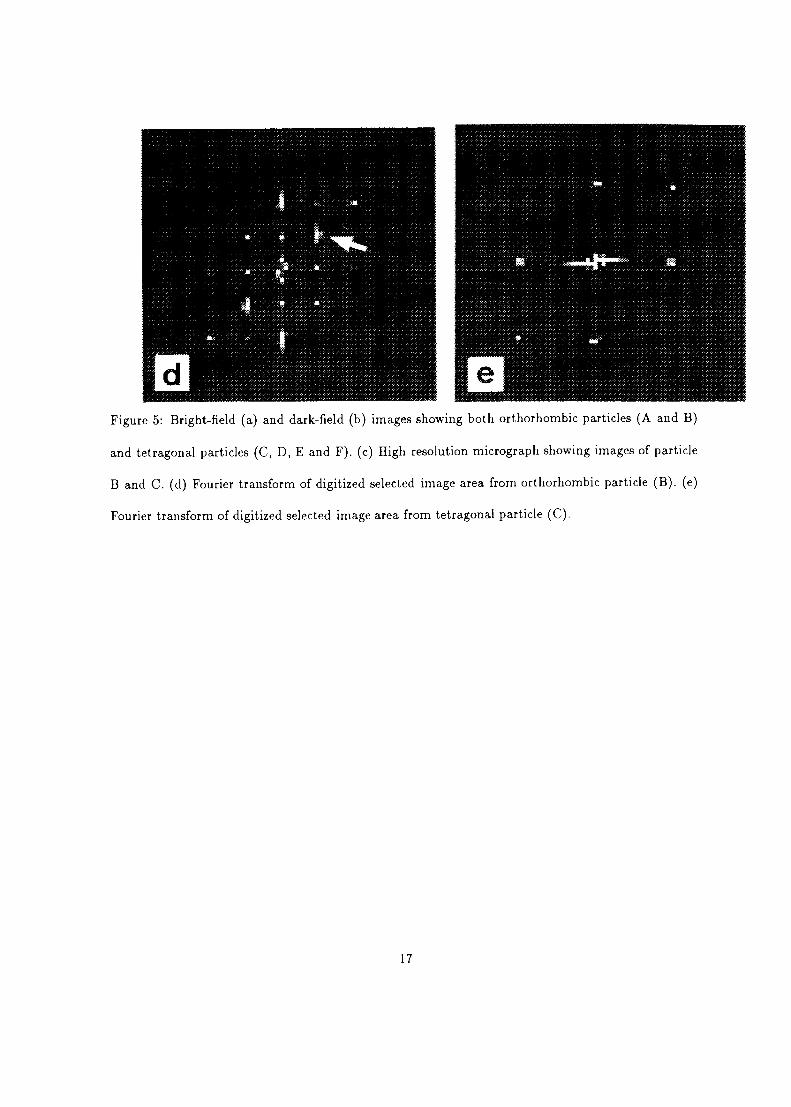
Figure 5: Bright-field (a) and dark-field (b) images showing both orthorhombic particles (A and B)
and tetragonal particles (C, D, E and F). (c) High resolution micrograph showing images of particle
B and C. (d) Fourier transform of digitized selected image area from orthorhombic particle (B). (e)
Fourier transform of digitized selected image area from tetragonal particle (C).
17
202f
18
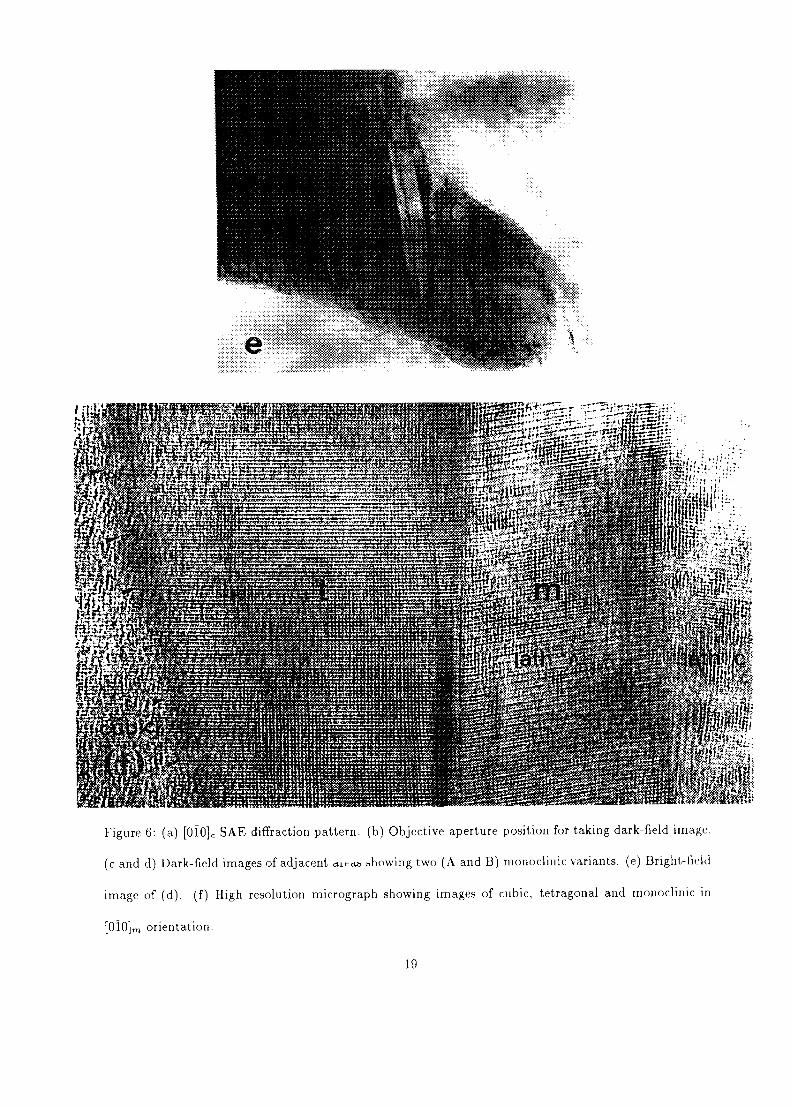
Figure 6: (a) [010]c SAE diffraction pattern, (b) Objective aperture position for taking dark-field image.
(c and d) Dark-field images of adjacent cucas showing two (A and B) monoclinic variants, (e) Bright-field
image of (d). (f) High resolution micrograph showing images of cubic, tetragonal and monoclinic in
[010]m orientation.
19
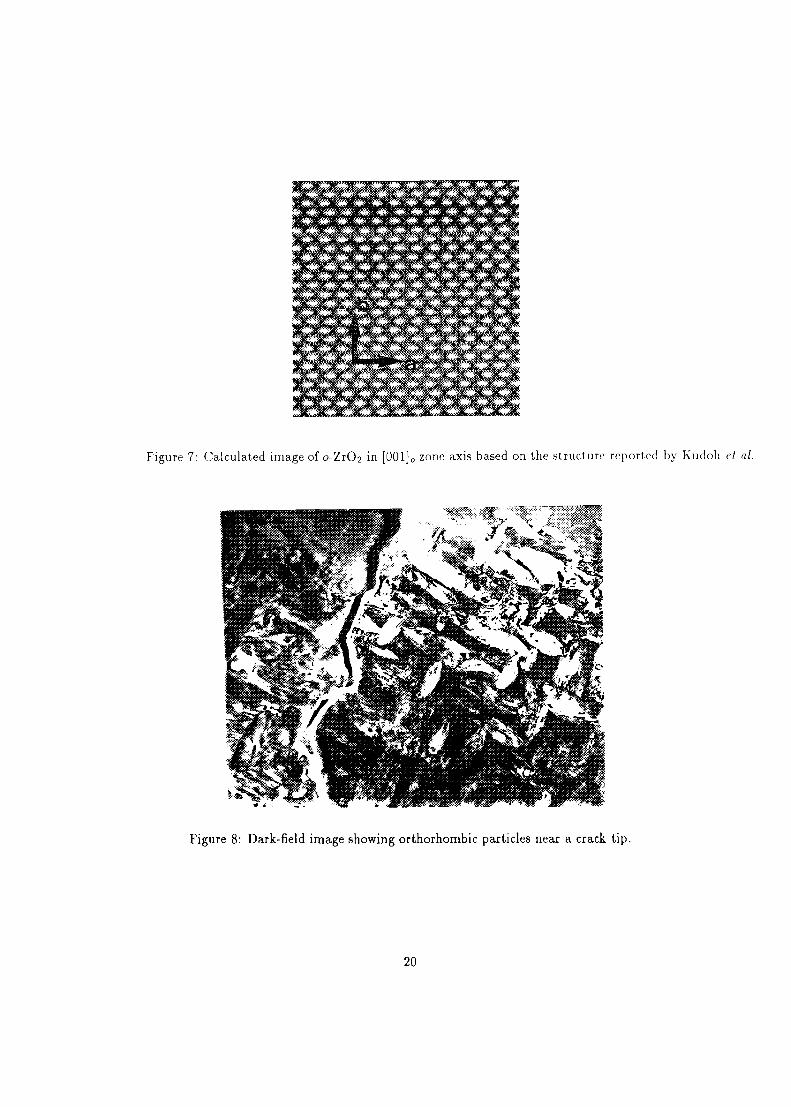
Figure 7: Calculated image of o-ZrO? in [001]o zone axis based on the structure reported by Kudoh et al.
Figure 8: Dark-field image showing orthorhombic particles near a crack tip.
20


![PHYSICAL REVIEW B102, 184431 (2020) - Miamicohn/ZnCr2Se4_PRB_merged.pdfdistortion to either tetragonal [11,12,14–16] or orthorhombic [7,8] structure with (a −c)/a ≈ 6 ×10−4](https://static.fdocuments.in/doc/165x107/6142791bd9e4dc11f47f12cc/physical-review-b102-184431-2020-cohnzncr2se4prbmergedpdf-distortion-to.jpg)