Tetra Acquisition Presentation March 2005. Forward Looking Statements This presentation includes...
12
Tetra Acquisitio Presentation March 2005
-
Upload
reynard-tyler -
Category
Documents
-
view
215 -
download
1
Transcript of Tetra Acquisition Presentation March 2005. Forward Looking Statements This presentation includes...

Tetra Acquisition Presentation
March 2005

Forward Looking StatementsForward Looking Statements
This presentation includes forward-looking statements, which are based in part on management’s estimates, assumptions and projections as of today. These statements are subject to risks and uncertainties that could cause results to differ materially from what we currently expect. Actual results may differ due to changes in external competitive market factors, changes in our industry or the economy in general, our ability to successfully implement manufacturing and distribution cost efficiencies and improvements, as well as various other factors, including those we discuss today and those discussed in our securities filings, including Rayovac’s and United Industries’ most recent Annual Reports on Form 10K and 10Q. We assume no obligation to update these statements.
This presentation contains a number of non-GAAP financial measures, also referred to as pro forma numbers. Please visit our website at www.rayovaccorp.com to view a reconciliation of these non-GAAP financial measures to GAAP results. The reconciliation is also included in the appendix to this presentation.

Transaction OverviewTransaction Overview
• Rayovac has entered into an agreement to acquire Tetra for €415 million, or 10.5x Tetra 2004E pro forma adjusted EBITDA of €38.5 million, net of €8 million cash tax savings
• Combined Rayovac and Tetra pro forma LTM 12/31/04 sales and adjusted EBITDA was $2.6 billion and $430 million, respectively (includes $5.0 million in Tetra year one synergies)
• Rayovac intends to draw down an existing $500 million add-on to its US$ and Euro denominated term loans to finance the transaction.
• Closing is expected by June 30, 2005 Note: Unless otherwise noted, Tetra financials are converted from € to $ using an exchange rate of $/€: 1.20 for FY01 – FY03 and FY05 – FY09 and an exchange rate of $/€: 1.24 for FY04. Rayovac results assume a fiscal year ended 9/30; Tetra results assume a fiscal year ended 12/31.

Tetra OverviewTetra Overview
• Tetra is a premier global fish food and aquatics company
• Leading global player in the home aquarium / pond market
• Tetra offers fish foods, remedies, aquatic equipment and accessories with products available in over 90 countries
• Leading global manufacturer of food for ornamental fish and aquarium equipment
• Market leader in US, Japan, France and Germany
• Leading supplier to mass merchandisers, pet superstores and independent pet stores
• Headquartered in Melle, Germany and Blacksburg, Virginia

Strategic RationaleStrategic Rationale
• Rayovac becomes a global leader in the attractive pet supplies market
• Superior brand equity
• Well positioned in high growth retail channels
• Strong platform for continued growth of global pet supplies business
• Further diversifies Rayovac’s sales and cash flow
• Strong cash flow generation with moderate capex allows for significant deleveraging

Tetra Investment MeritsTetra Investment Merits
• Leading global aquatics company
• Strong global market shares in the highly profitable aquatics food category
• Provides UPG with branded entry into fast growing pond (+10%) and reptile (+10%) categories
• Gives UPG a European, Japanese and Latin American pet products rollup platform
• High gross margins and EBITDA margins
• Offers significant integration synergies (+$15 million per annum)
• Accretive to earnings in year one without synergies and significantly accretive thereafter

Pet Supplies OverviewPet Supplies Overview
• U.S. pet market is growing at 6-8%• Pet supplies sector is highly fragmented• Rayovac / United Pet Group has emerged as a leading player in the
still fragmented industry
U.S. Pet Supplies Industry
Total: $8 billion
Tetra - 3%
Hartz - 5%
Spectrum - 4%
Doskocil - 3%
Other77%
Central Garden - 8%
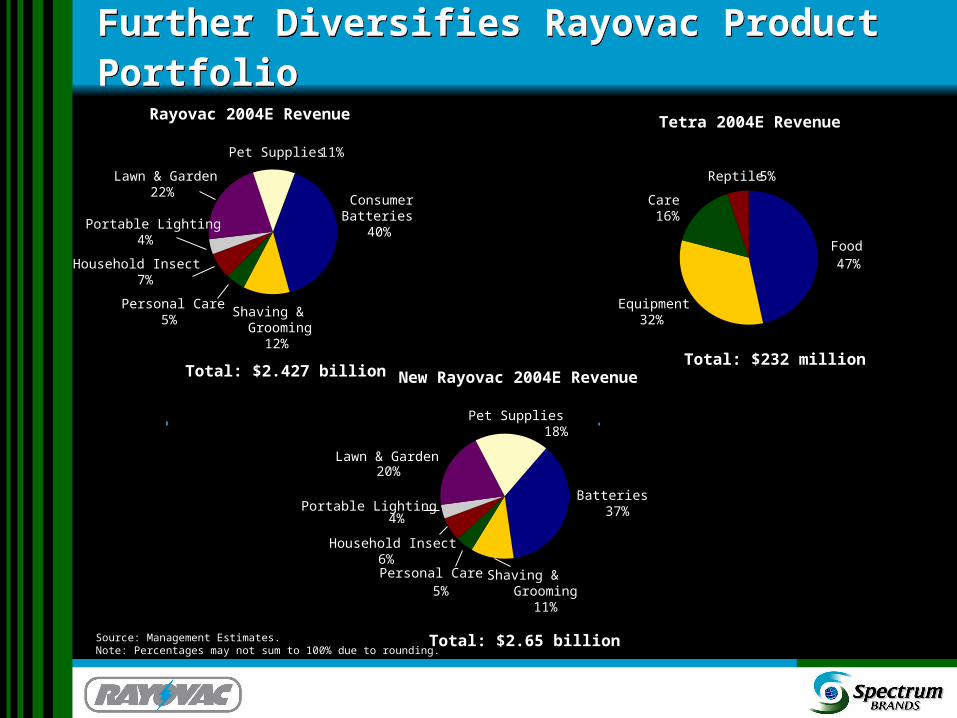
Further Diversifies Rayovac Product Portfolio Further Diversifies Rayovac Product Portfolio
Source: Management Estimates.Note: Percentages may not sum to 100% due to rounding.
Tetra 2004E Revenue
Total: $232 million
Food47%
Equipment32%
Care16%
Reptile 5%
Total: $2.65 billion
Rayovac 2004E Revenue
Total: $2.427 billion
Personal Care5%
Household Insect Control7%
Portable Lighting4%
Lawn & Garden22%
ConsumerBatteries
40%
Shaving & Grooming
12%
Pet Supplies 11%
New Rayovac 2004E Revenue
Pet Supplies18%
Portable Lighting4%
Household Insect 6%
Personal Care
5%
Lawn & Garden 20%
Shaving & Grooming
11%
Batteries37%

Strengthens Rayovac’s Position in the Fast Growing Pet Category Strengthens Rayovac’s Position in the Fast Growing Pet Category
($ in Millions)
Improvement in Rayovac's Pet Business - LTM 12/31/2004
$277
$509
0
90
180
270
360
450
$540
Rayovac Pet Revenue Combined Rayovac/Tetra Pet Revenue

Sources and Uses of Cash and CapitalizationSources and Uses of Cash and Capitalization
(1) Of the $300 million revolver, €25 million is denominated as Euros and £10 million in Pound Sterling.(2) Based on a pro forma LTM 6/30/2005 EBITDA of $437.2 million with leverage multiples calculated net of cash.(3) Based on Rayovac market capitalization as of March 16, 2005.
Sources&
Uses
($ in Millions)Projected as of June 30, 2005
Sources Uses
Cash on Hand $66.0 Purchase of Equity $300.4Revolver - $300
(1)0.0 Refinance Existing Tetra Debt 255.6
U.S. Term Loan B Add-On 200.0 Transaction Costs 10.0European Term Loan B Add-On 300.0
Total Sources $566.0 Total Uses $566.0
Pro FormaCapitalization
($ in Millions)Projected as of June 30, 2005
Existing Pro Forma Pro Forma % of Total
Capitalization Capitalization EBITDA Multiple (2)
Capitalization
Cash $78.0 $12.0
Revolver - $300 (1)
$0.0 $0.0U.S. Term Loan B 540.0 740.0European Term Loan B 152.8 452.8Canadian Term Loan B 50.0 50.0Capital Leases & Other 50.0 50.0 Total Senior Debt $792.8 $1,292.8 2.93x
8.500% Senior Subordinated Notes 350.0 350.07.375% Senior Subordinated Notes 700.0 700.0
Total Debt $1,842.8 $2,342.8 5.33x 51.9%
Equity (3) $2,169.0 $2,169.0 4.96x 48.1%
Total Capitalization $4,011.8 $4,511.8 10.32x 100.0%


Reconciliation of Operating Income to Adjusted EBITDAFor the Year Ended 12/31/04($ in millions)
Rayovac United Tetra Pro Forma Total
Operating Income $177.4 $66.8 $33.4 $277.6Depreciation and amortization 35.8 45.6 14.3 95.7
EBITDA 213.2$ 112.4$ 47.7$ 373.3$
Restructuring, Transaction-Related and Other One-Time Adjustments 6.6 33.0 - 39.6 Synrgies 15.6 1.2 - 16.8
Adjusted EBITDA 235.4$ 146.6$ 47.7$ 429.7$
Note: At an average dollar to Euro exchange rate of 1.24:1, Tetra 2004 EBITDA of $47.7 equates to € 38.5.