Tests of Audio Amplifiers in Accordance with … Amplifier Test with R&S Audio Analyzers...
24
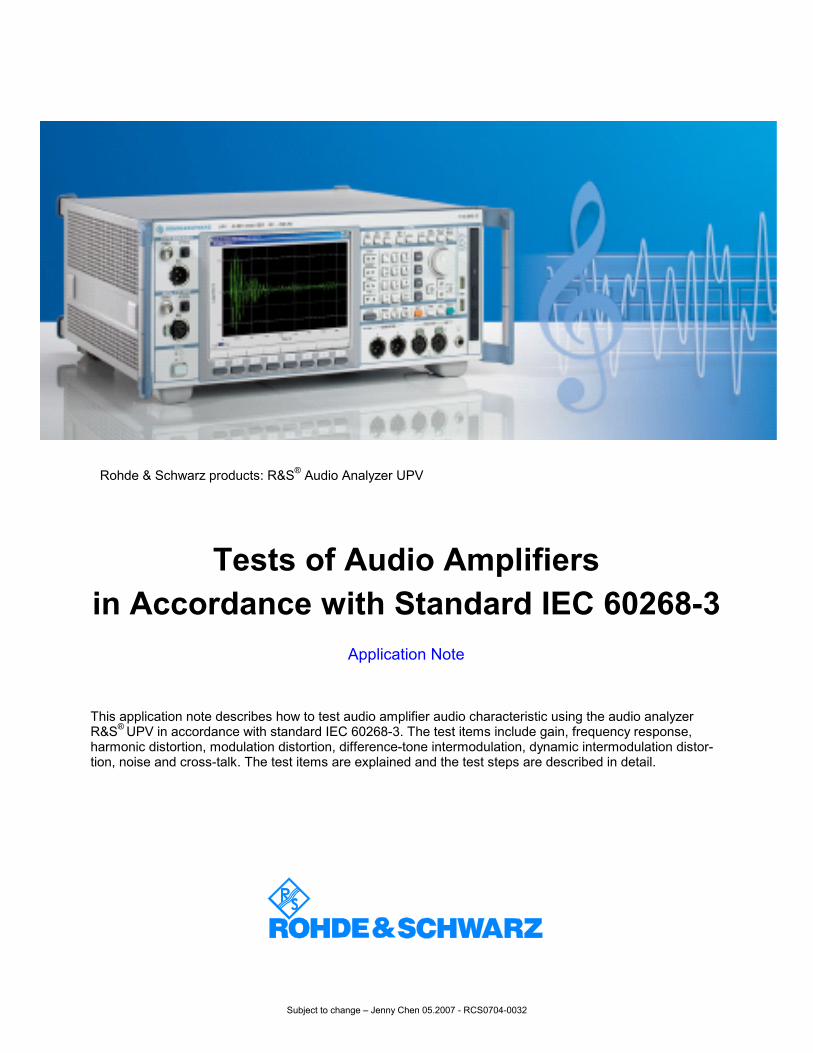
Subject to change – Jenny Chen 05.2007 - RCS0704-0032 Rohde & Schwarz products: R&S ® Audio Analyzer UPV Tests of Audio Amplifiers in Accordance with Standard IEC 60268-3 Application Note This application note describes how to test audio amplifier audio characteristic using the audio analyzer R&S ® UPV in accordance with standard IEC 60268-3. The test items include gain, frequency response, harmonic distortion, modulation distortion, difference-tone intermodulation, dynamic intermodulation distor- tion, noise and cross-talk. The test items are explained and the test steps are described in detail.
Transcript of Tests of Audio Amplifiers in Accordance with … Amplifier Test with R&S Audio Analyzers...
Subject to change – Jenny Chen 05.2007 - RCS0704-0032
Rohde & Schwarz products: R&S® Audio Analyzer UPV
Tests of Audio Amplifiers in Accordance with Standard IEC 60268-3
Application Note
This application note describes how to test audio amplifier audio characteristic using the audio analyzer R&S® UPV in accordance with standard IEC 60268-3. The test items include gain, frequency response, harmonic distortion, modulation distortion, difference-tone intermodulation, dynamic intermodulation distor-tion, noise and cross-talk. The test items are explained and the test steps are described in detail.

Audio Amplifier Test with R&S Audio Analyzers
RCS0704-0032 2 Rohde & Schwarz
Contents Overview....................................................................................................... 3 1 Audio Amplifier Test ................................................................................ 4 2 Test Setup............................................................................................... 6 3 Test Items ............................................................................................... 7
General Setting .................................................................................. 7 14.5.4 Minimum source e.m.f. ........................................................... 8 14.6.3 Output voltage and power (distortion limited).......................... 9 14.7.1 Overload source e.m.f............................................................. 9 14.7.2 Short-term maximum output voltage and power................... 10 14.10.1 e.m.f. gain ........................................................................... 11 14.10.2 Maximum e.m.f. gain........................................................... 11 14.10.3 Attenuation characteristic of the volume control ................. 12 14.11.1Gain-frequency response..................................................... 12 14.11.2 Gain-limited effective frequency range ............................... 13 14.11.4 Phase-frequency response ................................................. 13 14.12.3 & 14.12.4 Total Harmonic distortion.................................... 14 14.12.5 Harmonic distortion of the nth order.................................... 16 14.12.7 Modulation distortion of the nth order.................................. 16 14.12.8 Difference-frequency distortion (DFD) of nth order............. 18 14.12.9 Dynamic Intermodulation distortion (DIM)........................... 20 14.13 Noise ...................................................................................... 21 14.16 Cross-talk and separation in multi-channel amplifers ............ 22
4 Launch the example setting files........................................................... 23 5 Summary............................................................................................... 23 6 Literature ............................................................................................... 23 7 Ordering Numbers................................................................................. 24
Audio Amplifier Test with R&S Audio Analyzers
RCS0704-0032 3 Rohde & Schwarz
Overview This application note describes how to test analog audio amplifiers using an audio analyzer R&S® UPV in accordance with standard IEC 60268-3 [1]. The test items include:
• 14.5.4 Minimum source e.m.f. for rated distortion-limited output voltage
• 14.6.3 Output voltage and power
• 14.7.1 Overload source e.m.f.
• 14.7.2 Short-term maximum output voltage and power
• 14.10 Gain, including
o 14.10.1 e.m.f. gain
o 14.10.2 Maximum e.m.f. gain
o 14.10.3 Attenuation characteristic of the volume control
• 14.11 Response, including
o 14.11.1 Gain-frequency response
o 14.11.2 Gain-limited effective frequency range
o 14.11.4 Phase-frequency response
• 14.12 Amplitude non-linearity, including
o 14.12.3 Total harmonic distortion vs. frequency
o 14.12.4 Total harmonic distortion vs. output voltage
o 14.12.5 Harmonic distortion of the nth order
o 14.12.7 Modulation distortion of the nth order o 14.12.8 Difference-frequency distortion (DFD) of nth order o 14.12.9 Dynamic Intermodulation distortion (DIM)
• 14.13 Noise • 14.16 Cross-talk and separation in multi-channel amplifiers
The set-up and step-by-step procedures will be presented.
This application note covers only tests of the audio characteristics of audio amplifiers; tests of power supply characteristics, limiting characteristics, characteristics of protection circuits, sustaining time and input/output im-pedance measurements defined in the standard are not included.
A set of example setting files and a RC filter definition file for Class D ampli-fier measurement are attached. The user can directly launch the setting file and change some of the parameters according to the designing specifica-tion of the amplifier.

Audio Amplifier Test with R&S Audio Analyzers
RCS0704-0032 4 Rohde & Schwarz
1 Audio Amplifier Test An electronic amplifier is a device for increasing the power and/or amplitude of a signal. It does this by taking power from a power supply and controlling the output to match the input signal shape but with larger amplitude.
There are four types of audio amplifiers, class A, class B, class AB and class D amplifiers:
Class A: in which the current in each active device supplying the load cur-rent is greater than zero throughout each cycle of the signal for all values of load current. Class A amplifying devices operate over the whole of the input cycle such that the output signal is an exact scaled-up replica of the input with no clipping.
Class B: in which the current in each active device supplying the load cur-rent is equal to zero for exactly one-half of each cycle of load current. Class B amplifiers only amplify half of the input wave cycle. As such they create a large amount of distortion, but their efficiency is greatly improved and is much better than Class A. Class B has a maximum theoretical efficiency of 78.5%. This is because the amplifying element is switched off altogether half of the time, and so cannot dissipate power
Class AB: in which the current in at least one of the active devices supply-ing the load current is zero for some part of each cycle of load current for some range of values of load current not exceeding the value defined by the rated output power or voltage and the rated load impedance. A practical circuit using Class B elements is the complementary pair or "push-pull" arrangement. The complementary or quasi-complementary devices are used to each amplify the opposite halves of the input signal, which is then recombined at the output. This arrangement gives excellent efficiency, but can suffer from the drawback that there is a small mismatch at the "joins" between the two halves of the signal. This is called crossover distortion. So, rather than completely off when they're not in use, Class AB amplifier will bias the devices to be just on to overcome the crossover distortion.
Class D: in which the current in each active device supplying the load is switched from zero to a maximum value by a carrier signal, modulation of which conveys the useful signal. Class-D amplifiers use MOSFETs (Metal Oxide Semiconductor Field Effect Transistors) and they generate a pulse width modulated waveform which is filtered at the output stage with a low pass filter to remove the high frequencies. The input signal is converted to a sequence of pulses whose average value is directly proportional to the amplitude of the signal at that time. The frequency of the pulses is typically ten or more times the highest frequency of interest in the input signal. The final switching output consists of a train of pulses whose width is a function of the amplitude & frequency of the signal being amplified. The output contains, in addition to the required amplified signal, unwanted spectral components (i.e. the pulse frequency and its harmonics) that must be removed by a passive filter. The filter is usually made with (theoretically) lossless components like inductors and capacitors in order to maintain efficiency. This means that the load presented to the amplifier is not purely resistive and changes with the frequency of the audio signal that the amplifier outputs, thereby causing

Audio Amplifier Test with R&S Audio Analyzers
RCS0704-0032 5 Rohde & Schwarz
anomalies in the final frequency response. (including peaking, oscillation and distortion). Hence many high-end class-D amplifiers employ negative feedback to correct for phase/frequency anomalies due to speaker impedance and the crossover. This makes the design of a class-D amplifier even more complex.
Class A is commonly used in high quality sound systems, but it is least ef-fective.
Class D is the most economical type as it saves the energy and produces less heat, but the quality is a big issue due to the nature of the switching. If the amplifier has no integrated low pass filter, a simple RC filter can be in-serted between amplifier output and UPV input to suppress the spectral components of the switching. A digital filter with the inverse frequency re-sponse of the RC filter in the passband can be loaded to the prepared set-ups and activated in R&S UPV to compensate for the passband attenuation of the RC filter. This provides a cost effective solution for measuring class-D amplifiers as opposed to most other audio analyzers which require ex-pensive external LC filters connected between the amplifier and the ana-lyzer to filter out the undesired spectral components. An example of the fil-ter definition file is attached.
Figure 1: RC filter at UPV analyzer input for class D measurements.
Regardless of the class for all type of amplifiers it is necessary to measure the gain, frequency response, total harmonic distortion (THD), modulation distortion of the nth order, difference-frequency distortion of the nth order, dynamic intermodulation distortion (DIM) and noise characteristic. These parameters and measuring procedures will be explained in the following sections in detail.
All the measurements should be carried out in rated conditions, i.e. the specified value according to the design of the amplifier [1]:
a) the amplifier is connected to its rated power supply;
b) the source e.m.f. is connected in series with the rated source impedance to the input terminals;
c) the output terminals are terminated with the rated load impedance;
d) the terminals which are not used during the measurement are termi-nated, if necessary, as specified by the manufacturer;
e) the source e.m.f. is a sinusoidal voltage equal to the rated source e.m.f. at the standard reference frequency of 1 000 Hz according to IEC 60268-1.
f) the volume control, if any, is set to such a position that the rated distor-tion-limited output voltage appears at the output terminals;
g) the tone controls, if any, are set to a specified position to give the speci-fied frequency response, generally the flat frequency response;

Audio Amplifier Test with R&S Audio Analyzers
RCS0704-0032 6 Rohde & Schwarz
h) the balance control(s), if any, is (are) set to the mechanical central posi-tion;
i) the rated mechanical and climatic conditions according to IEC 60268-1 are complied with.
Unless especially specified, the input voltage should be -10 dB referred to the rated source e.m.f. U1 is used to represent this value.
2 Test Setup Figure 2 is the test diagram required in the standard. V1 is the source e.m.f., which can be understood as the audio signal generator output voltage. V2 is a voltmeter, which is the UPV analyzer.
Figure 2: Test Diagram for Audio Amplifier.
So, the test setup is shown as in Figure 3. The diagram of the amplifier is for illustration purpose. The connectors may not be the same as shown in the diagram. If the amplifier inputs are connected unbalanced, in parallel the speaker output terminals are connected with pins 2 and 3 of the ana-lyzer input, or use the UPL-Z1 adapters and BNC-to-RCA cables. The gen-erator Output Type in the Generator Config panel should be set to ‘Bal’.

Audio Amplifier Test with R&S Audio Analyzers
RCS0704-0032 7 Rohde & Schwarz
Figure 3: Test Setup for Audio Amplifier Test
3 Test Items This section describes the test items and how they can be measured with R&S UPV. Diagrams, showing how to configure the test for one channel, are also shown for illustration. The two channels can be tested together if Generator Config Channel is set to be ‘2=1’ with UPV-B3, and the Analyzer Config Channel is set to ‘1&2’.
It is recommended to preset the UPV before the configuration.
General Setting As the unit of some test should be ‘W’, the rated load of the audio amplifier should be entered as reference impedance in the analyzer configuration panel, shown as in Figure 4.

Audio Amplifier Test with R&S Audio Analyzers
RCS0704-0032 8 Rohde & Schwarz
Figure 4: Ref Imped setting and ground setting
The ground of UPV needs to be connected to the ground of the Amplifier. In newer UPVs there is a banana socket on the front panel. With older ver-sions it would be required to connect to the outer terminal of the headset jack or to the case of one of the XLR connectors.
Both the ground setting for generator and analyzer in UPV needs to be set as ‘float’.
14.5.4 Minimum source e.m.f. This test measures the e.m.f. that gives rated distortion-limited output volt-age with the volume control, if any, set for maximum gain.
Measurement Procedure
1. The amplifier is brought under rated conditions. The detail of the rated conditions can be found in Section 1.
2. The UPV output voltage is set to 0 or to a small initial value.
3. The volume control on amplifier is adjusted to maximum gain
4. The UPV setting is the same as 14.6.3
5. Readjust the generator output voltage with the rotary knob until the rated output voltage is obtained. For the operation of the rotary knob, please refer to the section about rotary-knob entries in direct mode in the operating manual.
6. Read the generator output voltage, which is the minimum source e.m.f.

Audio Amplifier Test with R&S Audio Analyzers
RCS0704-0032 9 Rohde & Schwarz
14.6.3 Output voltage and power (distortion lim-ited) This test is to specify the distortion limited output voltage across the rated/specified load-impedance, at which the rated total harmonic distortion is produced. It verifies the rated output voltage and power generated within the distortion limit.
The input frequency should be 1 kHz.
Measurement Procedure 1. Set the Analyzer Function to be ‘THD’ and Level Monitor to be ‘RMS’
2. Adjust the generator output voltage (10’s of mV to 100’s of mV), so that rated THD is produced.
3. Keep a record of the UPV generator output voltage Uratedsource
4. Get the amplifier output voltage RMS (Ch1 / Ch2 Lev RMS reading), Uratedoutput. Keep a record of this value for future usage.
5. In Level Mon Config panel, configure the Unit to be ‘W’ to get the power value. Note that the rated load impedance of the amplifier must be en-tered as “Ref Imped” in the Analyzer Config panel.
6. Click on the waveform to enable the scope mode if necessary.
7. Repeat step 4 to 6 for other channels if needed. If the UPV is equipped with option UPV-B3 (Second analog generator), The function ‘Stereo Sine’ can be used to drive all other channels simultaneously from the second generator output at the nominal output power during this test.
Figure 5: Test Configuration for item 14.6.3, 14.5.1 and 14.7.1
14.7.1 Overload source e.m.f. This test verifies the maximum source e.m.f. that can deliver an output volt-age 10 dB below the rated distortion-limited output voltage (tested as item 14.6.3) without exceeding the rated total harmonic distortion.

Audio Amplifier Test with R&S Audio Analyzers
RCS0704-0032 10 Rohde & Schwarz
Measurement Procedure 1. Continue the test with setup 14.6.3.
2. In Level Mon Config panel, set the unit to be ‘dBr’ and the reference value to be Uratedsource. Adjust the volume control to obtain an output voltage of -10 dB referred to the rated output voltage, shown as in Figure 6.
3. Adjust the volume control step by step to lower gain, increasing the generator output to maintain the initial amplifier output voltage, until the rated total harmonic distortion is obtained.
4. Get the generator output voltage, which is the overload source e.m.f.
Figure 6: Set the unit of the level measurement to be ‘dBr’.
14.7.2 Short-term maximum output voltage and power This test measures the maximum voltage and power, which the amplifier is capable of producing, across the rated load resistance (regardless of non-linearity) 1s after the application of a specified short tone-burst signal.
Measurement Procedure 1. The amplifier is brought under rated conditions
2. Set the generator function – ‘sin burst’, burst duration – ‘1 s’. burst in-terval – > 60 s
3. Set both the Analyzer function and Level Monitor to be “RMS’. Config-ure the unit for Level Monitor to be ‘W’.
4. Do a generator voltage sweep to get the maximum output voltage. In Generator Function panel, set the Sweep Ctrl to be ‘Auto Sweep’ and X Axis to be ‘Voltage’, and set the Start and Stop voltage. The stop volt-age should be large enough to drive the amplifier into clipping status.

Audio Amplifier Test with R&S Audio Analyzers
RCS0704-0032 11 Rohde & Schwarz
5. Get the Max reading of the output voltage from the analyzer, which is the short-term maximum output voltage. The maximum output power is displayed as ‘Max’ in Level monitor.
Figure 7: Test configuration for item 14.7.2
14.10.1 e.m.f. gain This test is to verify the rated e.m.f. gain. It is the ratio of the output voltage U2 to the source e.m.f Uratedsource under the standard measuring conditions.
14.10.2 Maximum e.m.f. gain The e.m.f. gain is measured with the volume control set at the position for maximum gain and the source e.m.f. being set, so as to restore the output voltage for standard measuring conditions.
Measurement Procedure 1. The amplifier is brought under standard measuring conditions
2. Set the Analyzer Function to be ‘RMS’. In the Function Config panel, set the Unit to be ‘dBr’ and the Reference to be ‘Gen Track’. So that the e.m.f. gain can be read directly from the measurement result.
3. Set the Level Monitor to be ‘RMS’. In the Level Mon Config panel, set the Unit to be ‘dBr’ and the Reference to be ‘Value’ and the value should be Uratedoutput.
4. Adjust the volume control to the position for maximum gain. Decrease the generator output voltage till the 0 dBr appears in Level RMS panel.
5. The gain is shown in the Function RMS panel in dB.

Audio Amplifier Test with R&S Audio Analyzers
RCS0704-0032 12 Rohde & Schwarz
Figure 8: Test configuration for item 14.10
14.10.3 Attenuation characteristic of the volume control This test measures the attenuation of the volume control as a function of the mechanical position of the control. The setup is referred to Figure 8.
Measurement Procedure 1. The amplifier is brought under standard measuring conditions
2. Set the volume control to be at the maximum position.
3. The amplifier output gain is shown RMS panel.
4. Adjust the volume control in successive steps, after each step, the posi-tion of the volume control is noted and the amplifier output gain is measured.
5. These gains are presented as a function of the position of the volume control.
14.11.1Gain-frequency response This test measures the variation of the e.m.f. gain as a function of fre-quency. It should be expressed in decibels.
Measurement Procedure 1. The amplifier is brought under standard measuring conditions.
2. Set Sweep Ctrl in Generator Function panel to be ‘Auto Sweep’
3. Set X Axis to be ‘Frequency’
4. Set the generator output voltage to be U1
5. Set the Spacing, Start frequency, Stop frequency and Points in Genera-tor Function panel.
6. Set the Analyzer function to be ‘RMS’. The Reference can be set to ‘Gen Track’ if gain is to be displayed.
Audio Amplifier Test with R&S Audio Analyzers
RCS0704-0032 13 Rohde & Schwarz
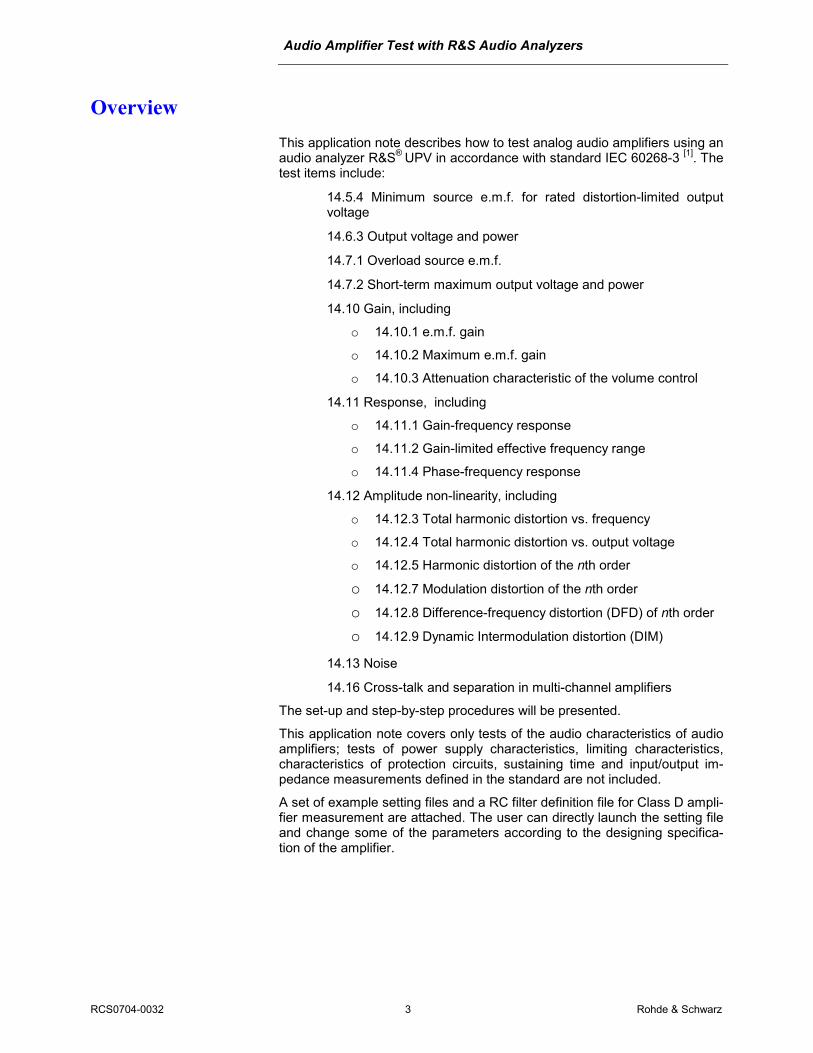
7. In the Sweep Graph Config panel, configure Reference to ‘Gen Track’ so that the gain can be obtained directly.
8. Press ‘START’ button, followed by ‘SINGLE’ button.
9. The gain is presented graphically as a function of frequency.
10. To save the trace, click on button “…..” besides “Store Trace to” in the Sweep Graph Config panel and specify a file name.
Figure 9: Test Configuration for item 14.11
14.11.2 Gain-limited effective frequency range The gain-limited effective frequency range is the range within which the de-viations from the required frequency response under standard measuring conditions do not exceed stated limits. It can be obtained from the Curve created from test 14.11.1. In Sweep Graph1 Config panel, activate check-box ‘Limit Lower’ and enter a desired lower limit for the gain. The frequency limits can be determined with the cursor on the graph or from the data list.
To display the cursor, put the focus on the sweep graph and press softkey ‘Cursor’, then ‘O-Cursor’ and ‘O Vert A’ or ‘O Vert B’, resp. Move the cursor with the rotary knob to the intersection between curve and limit and read the frequency from the lower label of the cursor.
To display the data list, click ‘Show’ button beside label ‘Data List’ in the Sweep Graph Config panel. The table view of the test result including both the frequency point and corresponding gain will be displayed. Violating gain values are displayed in red colour.
14.11.4 Phase-frequency response This test is to measure the phase difference between the output voltage and the source e.m.f. as a function of frequency under the standard meas-urement condition.
The setting of 14.11.1 can be used with additional sweep graph configured.

Audio Amplifier Test with R&S Audio Analyzers
RCS0704-0032 14 Rohde & Schwarz
1. Click Displays at the Menu bar, and select Sweep Graph2
2. Right click on Sweep Graph2 and select Config to display the Sweep Graph2 Config panel
3. Select Y-Source to be ‘Phase’ and Reference to be ‘Gen Track’.
4. Configure the Top and Bottom display range.
Now the phase-frequency response can be measured together with gain-frequency response.
14.12.3 & 14.12.4 Total Harmonic distortion This characteristic is a good measure of the distortion performance of the amplifier. To determine the THD, the amplitudes of the individual harmonics are measured; their true RMS values added up and referred to the total sig-nal. The result is indicated in % or dB.
Figure 10: Definition of Harmonics Distortion
Total harmonic distortion:
Harmonic distortion of the nth order is measured as already described above with the only difference that the RMS value is not determined for all harmonics but only individual harmonics or a combination of certain har-monics are used for computing the distortion.
With R&S Audio Analyzer no external calculation is needed as the THD value can be read from the analyzer directly.
Measurement Procedure
1. The amplifier is brought under standard measuring conditions
2. Set the Generator Bandwidth to be ’80 kHz’ and the Analyzer Band-width to be ‘250 kHz’.
3. Set the Analyzer function to be ‘THD’.
4. Set Sweep Ctrl in Generator Function panel to be ‘Auto Sweep’
5. Set X Axis to be ‘Frequency’ and Z Axis to be ‘Voltage’
6. Set the Spacing, Start frequency, Stop frequency and Points in Genera-tor Function panel. The stop frequency should be the the upper limit of the gain-limited frequency divided by the highest significant harmonic order.

Audio Amplifier Test with R&S Audio Analyzers
RCS0704-0032 15 Rohde & Schwarz
7. Set the Spacing, Start voltage, Stop voltage and Points in Generator Function panel. The stop voltage should not exceed the rated input.
8. In the Sweep Graph1 Config panel, set the Scan to be ‘Multi’ and His-tory to be the points of swept voltage.
9. Press ‘START’ button.
10. The diagram shown is the THD as a function of frequency. The different trace with different color is to show the different voltage. To save the trace, click on button “…..” besides “Store Trace to” in the Sweep Graph Config panel and specify a file name.
Figure 11: Test configuration for item 14.12.3, THD vs. frequency

Audio Amplifier Test with R&S Audio Analyzers
RCS0704-0032 16 Rohde & Schwarz
Figure 12: Test result for item 14.12.3 & 14.12.4 THD vs. frequency at different input voltage
11. In Generator Function panel, set X Axis to be ‘Voltage’ and and Z Axis to be ‘Frequency’.
12. Set Level Monitor to be ‘RMS’ in Analyzer Function panel.
13. Open Sweep Graph Config panel. Set X-Source to be ‘LevMon RMS’.
14. Press ‘START’ button.
15. The diagram shown is the THD as a function of output Amplitude and the different color shows different swept frequency. The trace file re-cords all the data measured.
To check the noise floor of this measurement, the sweep can be repeated with “OUTPUT OFF”.
14.12.5 Harmonic distortion of the nth order This test is defined to test the component of the output signal of harmonic order n. Harmonic distortion of the nth order is measured as already de-scribed above with the only difference that the RMS value is not determined for all harmonics but only individual harmonics or a combination of certain harmonics are used for computing the distortion.
Measurement Procedure 1. The amplifier is brought under standard measuring conditions
2. The UPV settings for 14.12.4 can be reused here.
3. Set the Meas Mode in Analyzer Function panel to be ‘ Select di’
4. Choose the component needs to be measured (usually from 2 to 5 at least) and record the THD_n____ value measured by the analyzer
14.12.7 Modulation distortion of the nth order A signal composed of two frequencies, f1 and f2, is used, which yields not only the harmonics mf1and nf2 but also combination signals with the fre-quencies (mf1 ± nf2). The occurrence of these signals is referred to as in-termodulation. The level ratio of f1 to f2 is 4:1. The lower frequency f1 is to simulate the noise signal.
To calculate modulation distortion, the squares of the four mixture products formed by the 2nd-order intermodulation distortion (f2 + f1 and f2 - f1) and the 3rdorder intermodulation distortion (f2 + 2f1 and f2 - 2f1) are added up and the result referred to the level of signal f2 with the higher frequency. The re-sult is indicated in % or in dB.
f1 and f2 should be chosen as follows: f2 – 2f1 should preferably be higher in frequency than the highest significant harmonic of f1 (i.e. 3f1); if the highest significant harmonic is the fifth, then f1 should not exceed f2/8. In R&S UPV, the default setting for f1 is 60 Hz, and for f2 is 7 kHz.

Audio Amplifier Test with R&S Audio Analyzers
RCS0704-0032
Figure 13: M
The modula
The modula
Thus, the m
The value a
Measure1. The am
2. Set the
3. Set the
4. Set Sw
5. Set X A
6. Set theage tha
7. Set thetor Fun
8. Open S
9. Press ‘
10. The diaquency
17 Rohde & Schwarz
odulation Distortion: output spectrum
tion distortion of the second order is determined by formula:
tion distortion of the third order is determined by formula:
odulation distortion is determined by formula:
lso can be read from R&S analyzer directly.
ment Procedure plifier is brought under standard measuring conditions
Generator function to be ‘Mod Dist’
Analyzer Function to be ‘Mod Dist’
eep Ctrl in Generator Function panel to be ‘Auto Sweep’
xis to be ‘Frequency’
Total Voltage in Generator Function panel to be U1 or any volt-t the manufacture wants to test
Spacing, Start frequency, Stop frequency and Points in Genera-ction panel.
weep Graph Config panel. Set X-Source to be ‘sweep’.
START’ button, followed by ‘SINGLE’ button.
gram shown is the Modulation Distortion as a function of fre-. The trace file records all the data measured.
f2 – 2f1 f2 – f1 f2+f1 f2+2f1
Audio Amplifier Test with R&S Audio Analyzers
RCS0704-0032 18 Rohde & Schwarz
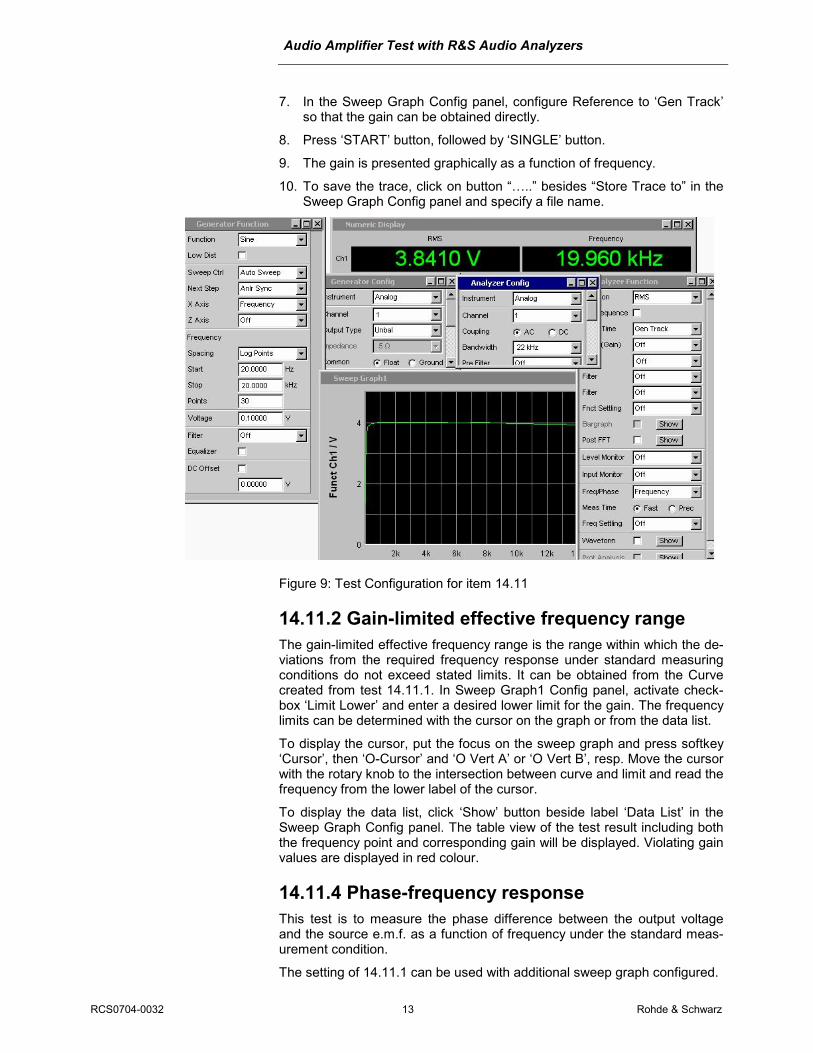
11. In Generator Function panel, set X Axis to be ‘Voltage’ and change the Upper Frequency to ‘7 kHz’ (it is changed after the frequency sweep).
12. Set the Spacing, Start voltage, Stop voltage and Points in Generator Function panel. The stop voltage should not exceed the rated input.
13. Set Level Monitor to be ‘RMS’ in Analyzer Function panel.
14. Open Sweep Graph Config panel. Set X-Source to be ‘LevMon RMS’.
15. Press ‘START’ button, followed by ‘SINGLE’ button.
16. The diagram shown is the Modulation Distortion as a function of output Amplitude. The trace file records all the data measured.
Figure 14: Test Configuration for item 14.12.7, Mod Dist vs. output voltage
14.12.8 Difference-frequency distortion (DFD) of nth order The difference frequency distortion is determined in a similar way as modu-lation distortion but using a test signal composed of two sinusoidal frequen-cies f1 and f2 of equal amplitude. The difference between the two frequen-cies is 80 Hz. The voltage of the difference frequency f2 - f1 is measured whose position in the spectrum does not change as long as the frequency difference remains constant (2nd-order DFD). The 3rd order DFD is deter-mined from mixture products 2f1 - f2 and 2f2 - f1. Because of the small fre-quency differences used here, great demands are made on the selectivity of the instrument regarding the measurement of 3rd-order DFD, especially when bandpass filters are used.
The sweep function in this test is used to sweep the center frequency of the two signals.

Audio Amplifier Test with R&S Audio Analyzers
RCS0704-0032 19 Rohde & Schwarz
Figure 15: Difference Frequency Distortion
This value also can be measured by the audio analyzer directly.
1. The amplifier is brought under standard measuring condition
2. Set the Generator function to be ‘DFD’
3. Set the Analyzer function to be ‘DFD’
4. Set the the Meas Mode in Analyzer Function panel to be ‘d2(IEC 268)’
5. Set the Level Monitor in Analyzer Function panel to be ‘RMS’
6. Use the Sweep function in Generator Function panel to get DFD-d2 as a function of frequency and as a function of output voltage (detail set-ting is same as 14.12.7.
7. Change the Meas Mode in Analyzer Function panel to be ‘d3(IEC 268)’
8. Use the Sweep function in Generator Function panel to get DFD-d3 as a function of frequency and as a function of output voltage (detail set-ting is same as 14.12.7.
Figure 16: Test Configuration for item 14.12.8, DFD vs. frequency

Audio Amplifier Test with R&S Audio Analyzers
RCS0704-0032 20 Rohde & Schwarz
14.12.9 Dynamic Intermodulation distortion (DIM) To measure this characteristic, the input signal consists of a rectangular and a sinusoidal signal. The rectangular signal has a fundamental fre-quency of 3.15 kHz and is band-limited to 30 kHz / 100 kHz by means of a single-pole lowpass filter. The sinusoidal signal has a frequency of 15 kHz and a level 12 dB below that of the rectangular signal.
There are nine intermodulation products in the audible range. The sum of the squares of the products is formed, referred to the RMS value of the si-nusoidal signal, and indicated in % or dB.
The nine intermodulation products are shown as Figure 17.
Figure 17: Dynamic Intermodulation Distortion
Measurement Procedure 1. The amplifier is brought under standard measuring conditions.
2. Set the Generator Function to be ‘DIM’
3. Set the Analyzer Function to be ‘DIM’
4. Set the Level Monitor in Analyzer Function panel to be ‘RMS’
5. The DIM value shown in the numeric display is the measurement result.
6. Use the Sweep function in Generator Function panel to get DIM as a function of output voltage. X-Axis in Generator Function panel should be set as ‘voltage’. X-source in Sweep Configure panel should be set as ‘LevMon RMS’

Audio Amplifier Test with R&S Audio Analyzers
RCS0704-0032 21 Rohde & Schwarz
Figure 18: Test configuration for item 14.12.9
14.13 Noise Signal to Noise ratio (S/N) is required for all audio equipment. The S/N ratio is the ratio in dB of the nominal output voltage to the total broadband or weighted measured output voltage with the source EMF set to zero. Rohde & Schwarz Audio Analyzers provide S/N ratio measurements as automatic test sequences.
There are different standards and methods for measuring noise voltages or S/N ratios. The main differences are:
· Use of different weighting curves which simulate the frequency depend-ency of the ear's sensitivity
· Use of different detectors which exhibit a different meter response for the noise under examination.
The noise measurement has to be either done with a band pass filter ac-cording to CCIR 468-3 (UPV filter “CCIR unwtd”) or with A-weighting filter. With different filter, the measurement result will be different due to the dif-ferent characteristic of the filter. The bandwidth of the filter also impacts the measurement result. The wider the bandwidth of the filter, the higher is the noise and the lower the S/N ratio. Thus it is important to write down the type of filter used for the measurement and its bandwidth.
Measurement Procedure
1. The amplifier is brought under rated conditions
2. Set the Generator Function to be ‘Sine’ and the Voltage should be lower than the rated source e.m.f.
3. Set the Analyzer Function to be ‘S/N’
4. Set one of the “Filter” in the analyzer function panel to “CCIR unwtd” or “A weighting”. For “CCIR unwtd”, “Bandwidth” in the Analyzer Config panel has to be set to “40 kHz”.

Audio Amplifier Test with R&S Audio Analyzers
RCS0704-0032 22 Rohde & Schwarz
5. Get the S/N
Figure 19: Test configuration for item 14.13
When you start the test, you will see that S/N test is carried out in two steps. In the first step, the UPV will generate a sinewave and measure the output voltage. In the second step, the UPV will stop transmitting signal and measure the output voltage. The S/N is calculated and displayed.
14.16 Cross-talk and separation in multi-channel amplifiers This characteristic is important for multi-channel amplifiers.
Cross-talk attenuation is expressed in decibels as 20 lg (UA,A /UB,A ), where UA,A is the rated output voltage of channel A, and UB,A is the output voltage of channel B due to the rated input voltage applied to channel A.
Separation is expressed in decibels as 20 lg (UA,A /UA,B ), where UA,A is the rated output voltage of channel A, and UA,B is the output voltage of channel A due to the rated input voltage applied to channel B. This parameter is only used in the case of pairs of channels carrying related signals for stereo-phony.
Measurement Procedure 1. Two channels A and B are brought under rated conditions
2. Set the Channel in Generator Config panel to be ‘1’.
3. Generator Function is set to be ‘Sine’ and the Voltage should not ex-ceed the rated source e.m.f.
4. Set the Sweep Ctrl to ‘AutoSweep’ And the X Axis to ‘Frequency’.
5. Set the Analyzer Function to be ‘RMS’
6. In the Sweep Graph1 Config Panel, set Y-Source of Trace A to ‘Funct Ch2’ and Trace B to ‘Off’, Reference to ‘Meas Ch1’ and Unit to ‘dBr’.
7. Press ‘Start’ followed by ‘Single’. The frequency-dependent crosstalk from channel 1 to channel to is displayed over frequency.

Audio Amplifier Test with R&S Audio Analyzers
RCS0704-0032 23 Rohde & Schwarz
8. For measuring the crosstalk from channel 2 to channel 1, change Channel in the Generator Config panel to ‘2’. In the Sweep Graph1 Config panel, change Y-Source to ‘Funct Ch1’ and Reference to ‘Meas Ch2’ and restart the measurement.
9. For measurement of channel separation instead of crosstalk, the set-tings for Y-Source and Reference in the Sweep Graph1 Config panel have to be swapped.
4 Launch the example setting files Section 3 gives the basic steps of settings for the required test items. A set of example setting files are attached. Copy the setup files to the directory D:\UPV\Setups on the harddisk of the UPV. You can load the setups by clicking File > Load Setup to select the desired setup. The files are num-bered according to the test items.
In UPV, totally five screens can be defined. With different screens you can display different configuration panels and different result windows, so that it would be easy for the user to do the configuration. All the examples are us-ing this feature so the user can go from screen to screen to view different panels and display windows. The screens can be selected either with the numbered buttons on the tool bar or with the ‘Screen’ buttons on the front panel.
There are a few parameters which need to be changed according to the rated condition of the amplifier, e.g. Ref Imped setting in Analyzer Config Panel, generator Voltage, sweep Voltage range, and Reference value if the Unit is ‘dBr’ .
5 Summary R&S UPV provides fast and accurate measurements for audio devices. This application note focuses on the test of audio amplifiers according to standard IEC 60268-3. R&S UPV can test harmonic distortion over fre-quency and amplitude in one multi-sweep measurement. Thus it is easy to operate and time saving for the customers to test their audio devices. The detailed descriptions of the test steps in this application note assure accu-rate repeatability of the tests.
For comments and suggestions regarding this application note, please con-tact
6 Literature
[1] IEC 60268-3:2001 Sound system equipment – Part 3: Amplifiers
[2] IEC 60268-1:1988 Sound system equipment. Part 1: General
[3] CCIR 468-3 (ITU-R BS.468-4) Measurement of audio-frequency noise voltage level in sound broadcasting
Audio Amplifier Test with R&S Audio Analyzers
RCS0704-0032 24 Rohde & Schwarz
7 Ordering Numbers
Type of instrument R&S® UPV Audio analyzer DC - 250 kHz
analog analyzer/generator; PC built-in
1146.2003.02
R&S® UPV-B3 Option: Second analog gen-erator DC - 80 kHz (second output stage)
1146.4806.02
http://www.rohde-schwarz.com
This Application Note and the supplied programs may be used only in accordance with the conditions of use set forth in the download area of the Rohde & Schwarz website.


![[ FREE ] 0032 - Cinema Heritage Group CINEMA JOBS & REVIEWS SECTIONS [ FREE ] #0032 JJUUNNEE 22000099 KOLLYWOOD COMES TO MALTA](https://static.fdocuments.in/doc/165x107/5ad176cc7f8b9a482c8b6fb5/-free-0032-cinema-heritage-cinema-jobs-reviews-sections-free-0032-jjuunnee.jpg)