TESTS F A PRECAST P S1-TENSI NED C MP S-ITE BRIDGE …
186
(U UllU .. ENG-77 -2007 #"439CIVll ENGINEERING STUDIES STRUCTURAL RESEARCH SERIES NO. 439 Illinois Cooperative Highway and Transportation Research Program S·eries No. 167 C () py a:l. TESTS F A PRECAST P S1-TENSI NED C MP S-ITE BRIDGE GIRDER HAVING T 0 SPANS F 124 FEET Mstz Reference Roem Givil Engineering Department BI06 C. E. Build.ing University of Illinois Urbana., Illinois 61801 By A. I. FADl W.l. GAMBLE B. MOHRAZ Issued as a Documentation Repo'rt on an Investigation of Field-Made Joints in Prestressed Reinfo,rced Concrete Highway Bridge Girders Pro'ject IHR-303 Pha:se 2 IIlino,is Cooperative Highway and Transportation Research Program Conducted by THE STRUCTURAL RESEARCH LABORATORY DEPARTMENT OF CIVIL ENGINEERING ENGINEERING EXPERIMENT STATION UNIVERSITY OF ILLINOIS AT URBANA-CHAMPAIGN in cooperation with the STATE OF ILLINOIS DEPARTMENT OF TRANSPORTATION and the U.S. DEPARTMENT OF TRANSPORTATION FEDERAL HIGHWAY ADMINISTRATION UNIVERSITY OF ILLINOIS AT URBANA-CHAMPAIGN URBANA, ILLINOIS APRIL 1977
Transcript of TESTS F A PRECAST P S1-TENSI NED C MP S-ITE BRIDGE …

(U I~qA
UllU .. ENG-77 -2007
#"439CIVll ENGINEERING STUDIES STRUCTURAL RESEARCH SERIES NO. 439 Illinois Cooperative Highway and Transportation Research Program S·eries No. 167
C () py a:l.
TESTS F A PRECAST P S1-TENSI NED C MP S-ITE BRIDGE GIRDER HAVING T 0 SPANS F 124 FEET
Mstz Reference Roem Givil Engineering Department BI06 C. E. Build.ing University of Illinois Urbana., Illinois 61801 By
A. I. FADl
W.l. GAMBLE
B. MOHRAZ
Issued as a Documentation Repo'rt on an
Investigation of Field-Made Joints in Prestressed Reinfo,rced Concrete
Highway Bridge Girders
Pro'ject IHR-303 Pha:se 2
IIlino,is Cooperative Highway and Transportation Research Program
Conducted by THE STRUCTURAL RESEARCH LABORATORY
DEPARTMENT OF CIVIL ENGINEERING ENGINEERING EXPERIMENT STATION
UNIVERSITY OF ILLINOIS AT URBANA-CHAMPAIGN
in cooperation with the STATE OF ILLINOIS
DEPARTMENT OF TRANSPORTATION
and the U.S. DEPARTMENT OF TRANSPORTATION
FEDERAL HIGHWAY ADMINISTRATION
UNIVERSITY OF ILLINOIS
AT URBANA-CHAMPAIGN
URBANA, ILLINOIS
APRIL 1977


1. Report No. 't Governm,,", Acceulon No.
FHWA- I L-UI -167
4. Titl. and Sub",I.
Tests of a Precast Post-Tensioned Composite Bridge Girder Having Two Spans of 124 Feet
7. Author{ 5)
A. I. Fadl, W. L. Gamble, and B. Mohraz
9. Performing Organi zation Name and Address
Department of Civil Engineering University of Illinois at Urbana-Champaign Urbana, IL. 61801
12. Sponsoring Agency Nom. and Addr .... --------"1\ Illinois Department of Transportation Bureau of Materials & Physical Research 126 East Ash Street Springfield, IL. 62706
15. Supplementary Not ••
TECHNICAL REPORT STANDARD TITLE PAGE
3. Recipient'. Catalog No.
Apri'l 1977 6. P.rformlng Orgoni lotion Cod.
8. Performing Organization Report No.
UILU-ENG-77-2007 10. Worle Unit No.
11. Contract or Grant No.
IHR-303 13. Type 0 f Report and P ed od Covered
Interim: Apri 1 1972 -Sept. 1976
14. SponllOring Agency Code
Prepared in Cooperation with the U. S. Department of Transportation, Federal Highway Administration. Project Ti'tle IIFie1d Made Joints i'n Prestressed Reinforced Concrete Hiqhwav Bridqe Girders. II
~~~~~~~~~~~~~~~~~~~~--~~~~~~---------------------~ 16. Abstract
A prototype bridge girder was designed, built, and tested. The 250 ft long twospan girder was made of 3 precast segments about 88, 74, and 88 ft in length. The segments were supported on 3 final and 2 temporary supports. The joints were of cast-in-place concrete, as was the composite deck. After the site~cast concrete was cured, the structure was post-tensioned to establish continuity and the temporary supports were removed. The two longer segments were pretensioned to resist the girder and deck dead loads, while the shorter segment was reinforced with deformed bars for the same loads.
The structure was subjected to a series of loadings, during which deflections, reactions, and concrete strains were measured. The loads approximated AASHTO HS-20 vehicles. The first 4 tests ,were to service loads, with total applied loads of 73.6 kips. The structure remained elastic and crack free during these tests. Two tests were to the design ultimate load, 198.7 kips. A load of 328.2 kips was applied in the final test without causing failure. The final loading was applied to produce maximum shear in one splice, and a shear failure, complicated by large flexural deformations, appeared to be developing when the test ended. The final test produced a maximum deflection of 10.8 in., and a residual of about 1.0 in.
The joint details used in the prototype structure were'adequate, and the presence of the, joint had no influence on the behavior of the structure until extremely large overloads were reached.
17. K,yWord. 1I.0lIBtrlhutlonStCltlilment
Prestressed concrete, Post-tensioned No restrictions. This document is concrete, Highway Bridges, Analysis, available to the public through the Structural testing, Cracking, Deflection c , National Technical Information Servi~e, Reactions, Precast Concrete Springfield, Virginia 22161
19. Security CICluif. (of this rlilpoft) 20. Security Cloulf. (of thl& JUII;e) 21. No. of Pog.. 22. Price
Unclassified Unclassified 180
Form DOT F 1100~1 (S-U)


TABLE OF CONTENTS
1. INTRODUCTION.
1. 1 Introductory Remarks
1.2 Brief Description of Construction Procedure.
1.3 Acknowledgements.
"2. DESIGN OF TEST SPECIMEN
2.1 Design Criteria . 2.2 Dimensions and Section P.roperti es
2.3 Material Properties
2.4 Eccentricity and Cable Profile
2.5 Sign Convention
2.6 Loads
2.7 Design Procedure.
2.8 Summary of Design.for Working Stress
2.9 Flexural Strength Analysis
2.10 Shear Strength Analysis
2.11 Reinforcement Lay-Out .
2.12 Additional Notes .
3. FABRICATION AND ERECTION, AS-BUILT
3. 1 Gener~l Remarks
3.2 End Girders
3.3 Middle Girder.
3.4 Erection of the Girders
3.5 Splices and Deck.
3.6 Post-tenstoning
. .
iii.
. . ..
..
Page
2
3
4
4
4
5
8
8
8
10
11
12
13
14
14
17
17
17
17
18
18
. 19

4.
5.
3.7 Bearing Devices
3.8 Concrete Properties.
3.9 Effects of Concrete Properties
INSTRUMENTATION .
4 ~ 1 General Remarks
4.2 Mechanical Strain Gage Measurement .
4.3 Deflection Measurements
4.4 Load and Reaction Measurements
LOADINGS AND TEST PROCEDURE .
5.1 General.
5.2 Service Load Tests
5.3 Design Ultimate Loads
5.4 Testing Procedure
6. RESULTS OF TESTS
6. 1 Introducti on
6.2 Deformations and Reactions at Post-tensioning
6.3 Service Load Tests
6.4 Design Ultimate Load Tests
6.5 South Span Overload Test .
7. DISCUSSION OF TEST RESULTS
7.1 General Remarks
7.2 Predicted and Observed Cracking Moments
Do
7.3 Redistribution of Moments During the Final Test
7.4 Evaluation of the Strength of the Test Structure.
7.5 Recommendations for Changes in Future Structures
;y
Page
19
20
21
23
23
23
24
24
26
26
27
28
29
32
32
32
35
37
42
50
50
52
56
58
67

8. SUMMARY AND CONCLUSIONS .
9. REFERENCES .
TABLES .
FIGURES
v
Page
68
70
71
84


LIST OF TABLES
TABLE Page
2.1 SUMMARY OF PRETENSIONING AND POST-TENSIONING STRESSES, FORCES, AND MOMENTS 71
2.2 SUMMARY OF STRESS COMPUTATION FOR THE MAXIMUM POSITIVE MOMENT SECTION . . . 72
2.3 SUMMARY OF STRESS COMPUTATIONS FOR THE SECTION AT THE SPLICE . . . . 73
2.4 SUMMARY OF STRESS COMPUTATIONS FOR THE SECTION AT CENTER SUPPORT . . . 74
2.5 SUMMARY OF DESIGN ULTIMATE MOMENTS AND SECTION CAPACITI ES . ......... 75
2.6 DESIGN DEAD LOAD MOMENTS INCLUDING SECONDARY MOMENTS. 76
3.1
3.2
3.3
6.1
6 .. 2
CONCRETE MIXES, PER CUBIC YARD . ..
STRENGTH OF CONCRETE TEST SPECIMENS, LB/IN.2
INITIAL YOUNG'S MODULUS VALUES FOR CONCRETE TESTS OF 28 AUGUST 1973 . .. ....
APPLIED LOADS, SERVICE LOAD TEST, NORTH SPAN POSITIVE MOMENT LOADING, LBS. ...
APPLIED LOADS, SERVICE LOAD TEST, NORTH SPAN SPLICE SHEAR LOADING, LBS. . . .
6.3 APPLIED LOADS, SERVICE LOAD TEST, SOUTH SPAN POSITIVE MOMENT LOADING, LBS. . . .
6.4 APPLIED LOADS, SERVICE LOAD TEST, SOUTH SPAN SPLICE SHEAR LOADING, LBS.
6.5 APPLIED LOADS, DESIGN ULTIMATE LOAD TEST, NORTH SPAN SPLICE SHEAR LOADING, LBS. . . . . .
6.6 APPLIED LOADS, DESIGN ULTIMATE LOAD TEST, NORTH SPAN POSITIVE MOMENT LOADING, LBS.
6.7 APPLIED LOADS, OVERLOAD TEST, SOUTH SPAN SPLICE SHEAR LOADING, LBS ..
vi
77
78
79
80
80
81
81
82
82
83


LIST OF FIGURES
FIGURE Page
1.1 NEW TWO-SPAN CONTINUOUS GRADE SEPARATION STRUCTURE. 84
1.2 SEGMENTAL GIRDERS PLACED ON TEMPORARY AND FINAL SUPPORTS. . . . 85
1.3 DECK AND JOINTS CAST AT SAME TIME 86
1.4 ENTIRE STRUCTURE POST-TENSIONED TO ESTABLISH CONTINUITY . . . . . . 87
1.5 TEMPORARY SUPPORTS REMOVED TO· COMPLETE TWO-SPAN STRUCTURE 88
2.1 CROSS-SECTION OF GIRDER AND DECK. ~. 89
2.2 IDEALIZED STRESS-STRAIN RELATIONSHIP FOR CONCRETE . 90
2.3 ASSUMED STRESS-STRAIN RELATIONSHIP FOR PRESTRESSING STEEL. . . . . . . . . . . 90
2.4 ASSUMED- STRESS-STRAIN RELATIONSHIP FOR NONPRESTRESSED DECK REINFORCEMENT 91
2.5 PROFILE OF THE CENTROID OF THE POST-TENSIONING STEEL .. . 92
2.6 LOADINGS DURING VARIOUS STAGES OF CONSTRUCTION 93
2.7 MOMENT DIAGRAMS DUE TO DIFFERENT COMPONENTS OF DEAD LOAD 94
2.8 DEAD LOAD MOMENT DIAGRAMS WITHOUT EFFECTS OF SECONDARY MOMENTS . 95 .
2.9 LIVE LOAD MOMENT ENVELOPES, HS20, 7 FT BEAM SPACING, NO IMPACT . . . . . . . . . 96
2.10 LIVE LOAD SHEAR ENVELOPES, HS20, 7 FT BEAM SPACING,~ NO IMPACT . . . . . . . .. ...... 97
2.11 DESIGN ULTIMATE SHEAR ENVELOPE AND SHEAR CAPACITY OF CONCRETE CROSS-SECTION . . . . .. . 98
2.12 REINFORCEMENT ARRANGEMENT ALONG HALF-LENGTH OF STRUCTURE . 99
2.13 ARRANGEMENT OF REINFORCEMENT IN DECK 100
vi i.

FIGURE
2.14
2.15
2.16
2.17
2.1B
3.1
3.2
3.3
3.4
3.5
3.6
3.7
3.B
4.1
4.2
4.3
5.1
5.2
5.3
5.4
5.5
ARRANGEMENT OF REINFORCEMENT IN END SEGMENT AT SECTION 50 FT FROM ABUTMENT. ...
REINFORCE~1ENT AT SECtION AlCENTRAL PIER . .
ELEVATION OF REINFORCEMENT DETAILS AT SOUTH SPLICE.. . .
SECTIONS SHOWING REINFORCEMENT ARRANGEMENT AT SOUTH SPLICE' . . . . . o' • •
LOCATIONS OF CADWELD SPLICES IN BARS IN NORTH SPLICE . .
PHOTOGRAPH SHOWING REINFORCEMENT,AND CADWELD SPLICES AT NORTH SP"L I CE ...... . . .
AS-BUILT MEMBER LENGTHS .AND LOCATIONS IN TEST STRUCTURE .
PHOTOGRAPH OF END OF BEAM SHOWING POST-TENSIONING ANCHORAGES'. . . . . . . . . . . . .
PHOTOGRAPH OF POST-TENSIONING ANCHORAGE HEADS
PHOTOGRAPH ,OF POST:-TENSIONING JACK AND STRESSING HEAD ... , '. . I
PHbTOGRAPH OF POST-TENSIONING JACK PULLING CENTER TENDON .
DETAILS OF BEARING DEVICES IN TEST STRUCTURE. . . . . : ,', .
COMPOSITE CROSS SECTION PROPERTIES WITH Egirder = Edeck . .' . .
LOCATIONS 'OF MECHANICAL STRAIN GAGES LINES ALONG LENGTH OF STRUCTURE . . . . . . . . . . . . .
DISTRIBUTION OF MECHANICAL STRAI~ G~GE LINES ACROSS SECTION . . . . . . . . . . . .
LOCATIONS OF MEASUREMENTS OF VERTICAL DEFLECTIONS . .
LOCATIONS ·OFHOLES IN DECK FOR LOADING RODS .
LOADING SYSTEM USED FOR SERVICE LOAD TESTS
LOADING SYSTEM USED FOR OVERLOAD TESTS. . . .
LOCATIONS OF LOADS FOR MAXIMUM,POSITIVE MOMENT, NORTH SPAN SERVICE LOAD TEST . . . .
. LOCATIONS OF LOADS FOR MAXIMUM SPLICE SHEAR, NORTH SPAN SERVICE LOAD TEST . . . . . .
viii
Page
101
102
103
104
105
106
107
lOB
lOB
109
109
110
112
113
114
115
116
117
118
119
119

FIGURE Page
5.6 LOCATIONS OF LOADS FOR MAXIMUM POSITIVE MOMENT, SOUTH SPAN SERVI CE LOAD TEST ., .... 120
5.7 LOCATIONS OF LOADS FOR MAXIMUM SPLICE SHEAR, . SOUTH SPAN SERVICE LOAD TEST . 120
5.8 LOCATIONS OF LOADS FOR MAXIMUM SPLICE SHEAR, NORTH SPAN DESIGN ULTIMATE LOAD TEST 121
5.9 LOCATIONS OF LOADS FOR MAXIMUM POSITIVE MOMENT, NORTH SPAN DESIGN ULTIMATE LOAD TEST . . . 121
5.10 LOCATIONS OF LOADS FOR SOUTH SPAN OVER LOAD TESTS .. 122
6.1 LOAD-DEFLECTION CURVES FOR NORTH SPAN POSITIVE MOMENT LOADING, SERVICE LOAD TEST . . . . 123
6.2 LOAD-DEFLECTION CURVES FOR NORTH SPAN SPLICE SHEAR LOADING, SERVICE LOAD TEST. 124
6.3 LoAD-DEFLECTION CURVES FOR SOUTH SPAN POSITIVE MOMENT LOADING, SERVICE LOAD TEST 125
6.4 LOAD-DEFLECTION CURVES FOR SOUTH SPAN SPLICE SHEAR LOADING, SERVICE LOAD TEST . .... 126
6.5 LOAD-REACTION CURVES FOR NORTH SPAN SERVICE LOAD TESTS 127
6.6 LOAD-REACTION CURVES FOR SOUTH SPAN SERVICE LOAD TESTS 128
6.7
6.8
6.9
LOAD-DEFLECTION CURVES FOR NORTH SPAN SPLICE SHEAR LOADING, DESIGN ULTIMATE TEST. .
LOAD-DEFLECTION CURVES FOR NORTH SPAN POSITIVE MOMENT LOADING, DESIGN ULTIMATE TEST. . . . . ·
LOAD-REACTION CURVES FOR NORTH SPAN DESIGN ULTIMATE LOAD TESTS . . . .
129
130
131
6.10 CRACKING IN NORTH SPAN AFTER COMPLETION OF TESTING. 132
6.11 MOMENT-CONCRETE STRAIN CURVES FOR. SECTIONS NEAR SPLICE, NORTH SPAN DESIGN ULTIMATE LOAD TESTS . . 133
6.12 MOMENT-CONCRETE STRAIN CURVES, NORTH SPAN DESIGN ULTIMATE LOAD TESTS . . . . . . 134
6.13 LOAD-DEFLECTION CURVE FOR POINT AT 70 FT SOUTH, SOUTH SPAN OVERLOAD TEST 135
ix

FIGURE
6.14 LOAD-DEFLECTION CURVE FOR POINT AT 35 FT SOUTH, SOUTH SPAN OVERLOAD TEST '
6.15 LOAD-DEFLECTION CURVES FOR NORTH SPAN POINTS, SOUTH SPAN OVERLOAD TEST . .. ...
6.16 PHOTOGRAPH OF TEST STRUCTURE NEAR END OF SOUTH SPAN OVERLOAD TEST
6.17 LOAD-REACTION CURVES FOR SOUTH SpAN OVERLOAD TEST
Page
136
137
138
139
6.18 CRACK PATTERN IN SOUTH SPAN AFTER_COMPLETION OF TESTING . 140
6.19 PHOTOGRAPH OF CRACKING SOUTH OF SOUTH SPLICE, LOAD 69, SOUTH SPAN OVERLOAD TEST . .. ....... 141
6.20 LOAD-CONCRETE STRAIN CURVES FOR BOTTOM GAGE LINES NEAR SOUTH SPLICE, SO:UTH SPAN OVE'RLOAD TEST '. . . 142
6.21 LOAD-CONCRETE STRAIN CURVES FOR MIDDLE GAGE LINES NEAR SOUTH SPLICE, 'SOUTH SPAN OVERLOAD TEST. . _. . 143
6.22 LOAD-CONCRETE STRAIN CURVES FOR SOUTH SPAN -GAGE LINES, SOUTH SPAN OVERLOAD TEST . . . . 144
6.23 LOAD~CONCRETE STRAIN CURVES FOR TOP OF,DECK IN NORTH ---- ------- ------SPAN -;--se UfH--S-P-AN-eV~RtOAD-~-Tt:-ST-------:---~------~----:----~--------:;----:------:-----r45- ----
6.24 LOAD-CONCRETE STRAIN CURVES FOR SOUTH SPAN DECK AND BOTTOM -OF GIRDER AT CENTRAL PIER,SOUTH SPAN OVERLOAD TEST . . . . .' . -- . -. -... 146
6.25 LOAD-CONCRETE STRAIN CURVES FOR BOTTOM OF NORTH SPAN GIRDER, -SOUTH SPAN OVERLOAD TEST.~ .. '.. . - 147
6.26 LOAD-CONCRETE STRAIN CURVES .FOR TOP OF NORTH SPAN GIRDER, SOUTH SPAN OVERLOAD TEST '.. ... 148
6.27 STRAIN DISTRIBUTIONS ACROSS DE~TH OF MEMBER, SECTION NORTH OF SOUTH SPLICE . . . . ...- . 149
6.28 STRAIN DISTRIBUTIONS ACROSS DEPTH OF MEMBER, SECTION INSOUTH __ SPL ICE .._. . 150
- -
6.29 STRAIN DISTRIBUTIONS ACROSS DEPTH 'oF -MEMBER, SECTION--SOUTH OF SOUTH SPLICE ... 151
6.30 STRAIN DISTRIBUTIONS ACROSS DEPTH OF MEMBER, SECTION 70 FT SOUTH OF CENTRAL PIER 152
x

FIGURE Page
701 DEAD LOAD MOMENT DIAGRAMS FOR DESIGN AND AS-BUILT CONDITIONS, INCLUDING SECONDARY MOMENTS 153
702 DISTRIBUTIONS OF STRESS ALONG TOP OF DECK AND BOTTOM OF BEAM IMMEDIATE AFTER POST-TENSIONING, AS DESIGNED. 154
7.3 DISTRIBUTIONS OF STRESSES ALONG TOP OF DECK AND BOTTOM OF GIRDER IMMEDIATELY AFTER POST-TENSIONING, AS-BUILT. 155
7.4 ELASTIC BENDING MOMENT DIAGRAM FOR 5-AXLE VEHICLE POSITIONED FOR MAXIMUM POSITIVE MOMENT. 0'. 156
705 ELASTIC BENDING MOMENT DIAGRAM FOR 5-AXLE VEHICLE POSITIONED FOR MAXIMUM SPLICE SHEAR. . . 157
7.6 MEASURED AND COMPUTED POSITIVE CRACKING MOMENTS, NORTH SPAN . .0 • • • • • • 158
7.7 MEASURED AND COMPUTED POSITIVE CRACKING MOMENTS, SOUTH SPAN . . . 159
7.8 LIVE LOAD NEGATIVE MOMENTS AND COMPUTED CRACKING MOMENTS IN NORTH SPAN, SOUTH SPAN OVERLOAD TEST. . 160
7.9 LOAD-IDEALIZED ABUTMENT REACTION CURVES, SOUTH SPAN OVERLOAD TEST 161
·7···~····lU-·----[OAD-=-NEGATrVE-MaMENT-CURVE--FRUM·-IUEACI-ZED-REAGTI-ONS;
SOUTH SPAN OVERLOAD TEST . . .. .... 162
7.11 LOAD-NEGATIVE MOMENT COEFFICIENT FROM IDEALIZED REACTIONS, SOUTH SPAN OVERLOAD TEST. 163
7.12 SOUTH SPAN LIVE LOAD MOMENT DIAGRAMS FOR FINAL TEST 164
7.13 APPLIED MOMENT AND MOMENT CAPACITY DIAGRAMS FOR SOUTH SPAN, LOAD 71 . 165
7.14 VARIATION OF APPLIED MOMENT AND NEGATIVE MOMENT CAPACITY IN NORTH SPAN, LOAD 71 . . 166
7.15 VARIATION IN APPLIED SHEAR AND CONCRETE SHEAR CAPACITY IN SOUTH SPAN, LOAD 71 . . . 167
7.16 SCHEMATIC REPRESENTATION OF AREAS CONSIDERED IN FIRST MOMENT COMPUTATIONS . . 168
7.17 VARIATION IN APPLIED SHEAR AND SHEAR STRENGTH NEAR SOUTH SPL ICE . . . . 169
7.18 SUGGESTED CHANGE IN BAR ARRANGEMENT AT LAP-SPLICED JOINT. 170
xi

1. INTRODUCTION
1.1 Introductory Remarks
Many of the existing interstate-highway grade separation structures consist of four span I-beam girders with cast-in-place decks .. The girders·are si~ply supported on two end abutments and are continuous across a central pi~r and two intermediate shoulder piers. Each interior span is approximately 70 to 80 feet, while the exterior spans are each 40 to 50 feet, for cases with two 2-lane roadway? and a small skew angle.
Recently however, due to more stringent safety requirements, piers are n6 longer permitted so close to the edge of pavement. These requirements "result inan increase in the "two interior spans from 70 to 80 feet to at least 90 feet. To meet these requirements, the two shoulder piers have either to be moved out toward the end abutments, resulting spans of at least 90 ft, or they have to be eliminated, resulting in spans of 100 up to 125 ft. The moving of the two shoulder piers toward the end abutments results in an inefficient structure with two long interior and two very short exterior spans. The small dead load of the two ~xterior spans may not be sufficient to prevent the uplift of the girder at the end abutments. In addition such a structure is not aesthetically appealing.
If the two shoulder piers were to be eliminated, the resulting two span structures will have spans of 90 to 125 feet. Such span lengths
"prohibit the transportation of precast concrete members. The cost and the lower quality of cast-in-place girders prohibits the use of such girders, at least within the cost structure currently existing.
One possible solution to the problem is to construct a two span girder in three segments and "join them end to end by means of field splicing. The behavior and performance of the splices under various loading conditions is an important consideration in the design and construction of such a structure.
-1-

-2-
A cooperative research program between the State of Illinois Department of Transportation and the Department of Civil. Engineering at the University of Illinois at 'Urbana-Champaign is currently being carried out to study the feasibility of various types of field splicing and the performance of fi e 1 d sp l'i ces. The i nves ti gatj on cons i ~ts of the des i gn of', ,a number of p'rototype structures w,i th fi e 1 d spl'i ces, the fabric~tion and testing of one prototype test structure,and' the de~ign, fabric~tion, and testing of a series of small scale spe~imens approximately one-third in size.
As one phase of the project, a prototype test structure consi~ting of one two-span girder plus deck has already been built and has been subjected to a series of loadings. This report'describes the de-
o " • • .,' .'_,
sign J fabrication, and testing, and the results obtain~d from the tests of the prototype structure.
... ...
1.2 Brief Description of Construction Procedure
A schemat1c drawing of a two-span continuous grade separation str~ctures is shown in Fig. l.l~ :The structure consists of a girder arid a bridge deck supported on two end abutments and a center pier. Such a
. . .' -
s~ruci~re may be constructed using three preca~t segments for each girder~ The precast girders are placed on, three permanent and two tempor~ry,supports as shown in Fig. 1.2 .. Th.e steel reinforcement in the joints is spliced and the joints and the deck ar~ cast, Fig. 1.3. After the joints and'the deck are cured, the'entire structure is post-tensioned,
, ,
Fig. 1.4, and the temporary supports ar~ removed,. Fig. 1.5. This pro-cedure was employed in the design and construction of the prototype test structure. The end segments were pretensioned, and the central segment was precast reinforced concrete. .
The feasibility of other construction procedures such as one similar to the above, but without post-tensioning, is being investigated.
-3-
1.3 Acknowledgements
This work was conducted as part of the Illinois Cooperative Highway Research Program,.Project IHR-303, fiField-Made Joints in Prestressed Reinforced Concrete Highway Bridge Girders,u by the Department of Civil Engineering, in the Engineering Experiment Station, University of Illinois at Urbana-Champaign, in cooperation with the Illinois Department of Transportation and the U. S. Department of Transportation, Federal Highway Administration.
The prototype girder test specimen, the testing site, and the rock anchors which provided the means of applying the loads were provided by Midwest Prestressed Concrete Co., now B1akslee-Midwest, of Rochelle, Illinois. The many contributions by Mr. J. O. Whitlock and Mr. E. L. Peck to the program are acknowledged.
The contents of this report reflsct the views of the authors who are responsible for the facts and the accuracy of the data presented herein. The contents do not necessarily reflect the official views qr policies of the Illinois Department of Transportation or,of the Federal Highway Administration. This report does not constitute a standard, specification or regulation.

*
2. DESIGN OF TEST SPECIMEN
2.1 D~~ign Criteria
* The design was prepared i~ accordance with t~e 1969 AASHO (1)
Standard Specifications for Highway Bridges ~" Prel iminary designs for a typical inte'rior beam was' carried out to determine the following:
(1) Suitable locations of the splices, (2) An acceptable precast girder size (a modified Illinois
Department, of Transportation 54 in. deep girder) .(3) The cable-profile, the areas of pre-tensioned and.
pbst-tensionedsteel, and the possibility of using partial post-tensioning to help-carry the weight of the deck slab.
The design ·was controlled by service load stress conditions; the 'ultimate capacity was checked at several critical sections ..
Because of symmetry of the structure, all computa ti ons, except for effects of loadings were carried out for one span only.
The 1973AASHO Specifications. (2) reduced the load factors slightly, but this would have had no effect on this structure.
2.2 Dimensions and Section Properties
design: The following dimensions and section properties were used in the
Span lengths = 125 ft center to center of bearings Cross-section -- Modified Illinois Department of Transportation
54 in. girder; the dimensions are shown in Fig. 2.1.
Girder spacing = 7 ft, center to center Deck thickness = 7.5·in. Depth to span ratio = 0.0423 (girder plus deck height)
-4-
Number in parentheses refers to entry in List of References.

-5-
The net transforme'd concrete section properties given below, rather than the gross section properties, were used in the design stress computations.
Precast non-composite girder section
depth = 56.0 in. cross-sectional area = 695 in. 2
moment of inertia = 258,185 in.4 distance from centroid of the girder to bottom of the
girder = 27.0 in. distance from centroid of the girder to top of the
girder = 29.0 in. weight = 0.725 kips/ft.
Composite section (Transformed, section, Edeck/Egirder = 0.764)
depth = 63.5 in. cross-sectional area = 1176 in. 2
moment of inertia = 565,440 ;n. 4
distance from centroid of the composite section to bottom of the girder = 40.5 in.
distanc~from centroid of the composite section to top of the precast girder = 15.5 in.
distance from centroid of the composite section to top of the deck = 23.0 in.
weight of composite section = 1.381 kips/ft.
2.3 Material Properties
The following material properties were used for concrete and
steel. The allowable stresses are also listed.

-6-
Concrete "
Twe'nty e'i ght day compressive strength, f I C
Concrete, compressive strength at release of pretension, f~i
Concrete, compressive strength at post-tensioning, fl.
Cl
Allowable temporary stresses before long-term': losses"have occu'rred'
'. . -. .,
compress i v'e s tres s irl' pre-'
tensioned segments, 0.60 f~i compressive stress in posttensioned beam, 0.55 f~i max i'mum tens; 1 e 'stress, 7 .5/f ~'i '
Allowable stresses at service load after all losses have occurred:
, ,
Precast Girder (ps i )
'6,000
5,000
5,000
3~000
2,750 530
:' Compr'ession,' 0.40 f~ , '2,400
Tension, 6/f~ '465 '., ", c ",_,', ,
Principal tensilestres's, f t =. ~/f~ , 310' Modulus of rupture, f = 6/f" 465 , r ,c , 6 Modulus 'of elasticity = 60,'000/f~ , , 4.7xlO
'Ratio of moduli ofela~ticit,y, Edeck/Egird~r = 0.764 Unit weight of concrete including r~inforcement =150 pef
, " Dec.k , (ps i )
3,500
3,500
1 ,925 443
1 ,400 355 236 355
3.59xl06
The stress-strain relationships used in ultimate strength calculations are shown in Fig. 2.2.
Prestressing steel
The prestressing steel used in both the pretensioning and posttensioning was 1/2 in. diameter 270 ksi 7-wire stress-relieved strands with the following design properties:

-7-
Ultimate strength, f~ = 270 ksi Yield strength, fSY = 230 ksi = 0.85 f~
Modulus of elasticity, Es = 28xl03 ksi Cross-sectional'area of strand, As = 0.153 1n.2
The ~tress-strain relationship used in ultimate strength calculations is shown in Fig. 2.3. Strand and other steel samples were obtained, but apparently were lost during transportation to the laboratory.
Pretensioned steel
Initial stress before release, fsi = 0.70 f~ = 189 ksi ,Total long-term losses = 35 ksi (does not include loss due to subsequent post-tensioning) Maximum effective working stress after all losses have occurred, 0.60 f~ = 162 ksi ' Steel area, As = 14 (0.153) = 2.14 in. 2
Post-tensioned steel
Maximum allowable jacking stress, 0.8 f~= 216 ksi Maximum allowable initial stress (immediately after transfer),
0.7 f~ = 189 ksi < fSY Maximum allowable effective working stress after all losses have occurred, 0.60 f~ = 162 ksi Jacking stress assumed in design, f . = 189 ksi SJ Total long-term losses = 30 ksi
. ')
Tendon area, Asp = 42(0.153) = 6.43 in.~
Curvature friction coefficient, for 7-wire strands in steel conduits, ~ = 0.15 Wobble coefficient, K = 0.0005 per ft.
The initial effective stress at transfer was computed using
f . = f . e-(kx + ~a) = Sf . sxo SJ SJ

-8-
where K and ~ are as defined above; a is the absolute total angular change of slope of the tendon profile in radians from the jacking end to any point x, in feet.
Non-p.restressed, s tee 1
Thareinforcing bars in both the p~ecast girder: and the d~ck were ASTM A6l5 grade 40 deformed bars with the assumed stress~strain relationship shown in Fig. 2.4, except that grade 60 deformed ba'rs" were used for stirrups.
2.4 Eccentricity .and Cable Profile
'A c'ons tant eccentri ci ty of 24 ~ 14 in. was used for the' pretensioned steel in the two end segmental girders. The 14 strand~ Were located as shown in Fig~ 2.14.;
The cable profile for the post-tensioned steel, symmetric about the central support, consists of two fourth-degree curves 'AB andBC as shown in Fig. 2.5. Forty-two strands, divided between three ducts, were used for post-ten~ioning.
2.5 Sign Convention
A positive eccentricity indicates that· the center of gravity of the prestressing ~tee1 is located above·,thecentroid of the crosssection. The designer's sign conveniion{pdsitive-mom~nt causin~ tension in the bottom fiber) is used·fdr moments~ A positive stress denotes tension ...
2.6 Loads
The following loading conditions, shown in Fig. 2.6, correspond to the different stages in the construction 'sequence. At the 'end,of each

-9-
loading stage, all forces, moments, and stresses are summed to obtain the total values at that stage. The moment diagrams for the various stages are shown in Fig. 2.7 to 2.9.
1. Non-composite girder section under pretensioning and its own weight, before and after the long-term losses in pretensioning are included.
2. Non-composite girder section under the weight of the deck with the temporary supports 'S'till in position.
3. Composite section under post-tensioning with the temporary supports removed, before and after the long-term losses in post-tensioned steel are assumed to have taken place.
4. Composite section under the weight of an asphalt topping on the slab; at 50 lb/ft2 or 350 1b/ft.
5. Live load corresponding to HS20-44 plus impact.
The temporary supports shown in Figs. 2.6 and 2.7 have been idealized as single supports while each actually was two supports separated by the length of the splice plus the approximately 12 in. distances from the ends of the members to the temporary reactions. Likewise, the equivalent support forces applied to the beam in one stage of the dead load analysis were idealized as single loads while they were actually two concentrated loads plus a distributed load corresponding to the weight of the splice plus the deck directly above it.
This simplification substantially reduces the arithmetic in the analysis without altering the results except in the immediate vicinity of the loads.
Load Factors for Strength Calculations
Dead load
Load factor for dead load = 1.5

-10-
Live load
Load factor for live load for one beam = 2.5 ad (Live Load per loaded lane +. I) where ad and I are the distribution factor and the impact coeffi c i ents·, respect; ve ly ..
in which The distribution factor ad = S/2C
S = girder spacing in feet C = a coefficient which is a function of type of deck and
girder. The impact factor
50 I = L + 125
where L is the length in feet of that part of the span which, when loaded, produces the maximum.stress in ·the member~
Using S = 7 ft and C = 5.5 (1), a value of 7/11 is obtained for ad" ~ The impact coefficient for negative moment and shear at the central support is 0.133, since both spans are loaded to'obtain the· maximum moment. The impact coefficient is 0.20 for maximum positive moment, positive and negative.moments at the splice,and for shear at points where truck loadings govern since maximums ~re obtained with only one span loaded in each of these cases.
The total live load factor for a single beam thus becomes 1 .80 standard loads for negative moment and shear at the. central pier and 1.91 for'the other moments and shear at-most other sections.
The secondary moments are not included during the determination of the design ultimate moments.
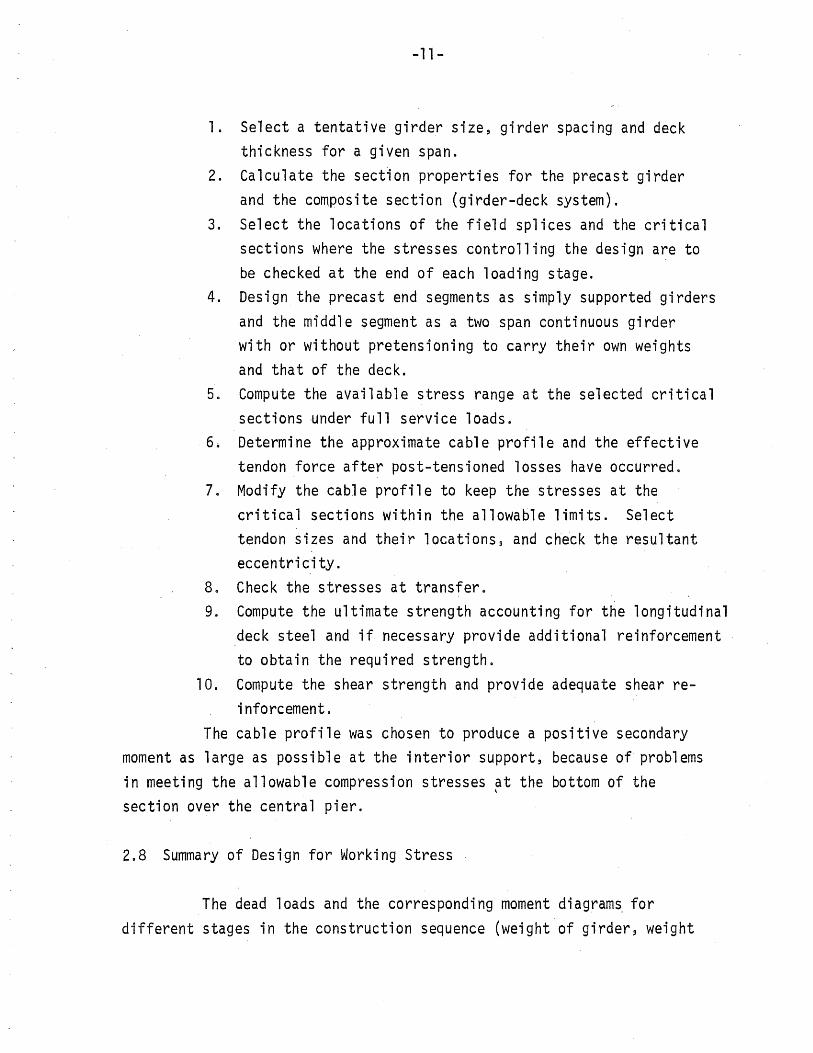
2.7 Design Procedure
The following steps were used in the design of a typical interior beam in the girder-deck system.
-11-
1. Select a tentative girder size, girder spacing and deck thickness for a given span.
2. Calculate the sect10n properties for the precast girder and the composite section (girder-deck system).
3. Select the locations of the field splices and the critical sections where the stresses controlling the design are to be checked at the end of each loading stage.
4. Design the precast end segments as simply supported girders and the middle segment as a two span continuous girder with or without pretensioning to carry their own weights and that of the deck.
5. Compute the available stress range at the selected critical sections ~nder full service loads.
6. Determine the approximate cable profile and the effective tendon force after post-tensioned losses have occurred.
7. Modify the cable profile to keep the stresses at the critical sections within the allowable limits. Select tendon sizes and their locations, and check the resultant eccentricity.
8. Check the stresses at transfer. 9. Compute the ultimate strength accounting for the longitudinal
,deck steel and if necessary provide additional reinforcement to obtain the required strength.
10. Compute the shear strength and provide adequate shear rei nforcement.
The cable profile was chosen to produce a positive secondary moment as large as possible at the interior support, because of problems in meeting the allowable compression stresses ~t the bottom of the section over the central pier.
2.8 Summary of Design for Working Stress
The dead loads and the corresponding moment diagram~ for different stages in the construction sequence (weight of girder, weight

-12 ...
of deck, temporary support removal, and weight of asphalt) are shown in Fig. 2.7. In Fig. 2.8 are shown three dead load moment diagrams; one corresponding to the we~ght bf the girde~ and the deck acting on the, non-composite section, one' correspond~ng to the effect of removal of the temporary supports and the weight of asphalt acting on the composite section, and the third is the su~ of the two. The envelope of live load mbments is presented in Fig. 2.9.
With the curvature friction coefficient, ~, ~nd the wobble coeffici~nt, k, defined in Section 2.3, and the fourth-degree Gable prof; 1 e as ment i oned in Sec t ion 2.4, a computer'; program wa sus ed to obta in (a) the eccentricity of post-tensioned steel along the span, (b) the '. - ~ ,
effective post-ten~ioning stress at transfer, (c) the slope of the centroid of the post-te'nsionedsteel, and (d) the' secondary moment
, ,
(caused by the restrain~ ofpost~tensioning camber at the center support) with 'r'espe~tto the c~ntr6ids of the non-~~;mposi.te, and the composite trans~orm~d 'sections. The program is described in Ref. 3.
A summary of stresses, forces, and moments resulting from pretensioning and post-tensioning is presented ,in Table 2.1. A summary of the stresses at three sections (midspan, splice, and the center support) at different loadin~ stages is given in Tables 2.2 through 2.4.
2.9 Flexural Strength Analysis
Using the load factors given in Section 2.5, 'the moments corresponding to the des1'gn ultimate load at various sections (mid-span, splice, and the center support) were tomputed and'are sLimmarfzed in Table 2.5. A sUl1111ary of the flexural strength capacities at \the same sections is also presented in Table 2.'5. As can be noted, the ultimate design moments are smaller than the flexural strength capacities at the corresponding sections.
Dead load moments including the effects of the very large
secondary moments are shown in Table 2.6, ~nd may be compared ,with the moments 1 i sted in Tabl e 2.5,.

-13-
2.10 Shear Strength Analysis
The design ultimate shear was computed from the dead load shear and the live load shear envelope, Fig. 2.10, at service load conditions using the appropriate load factor (see Section 2.6). The web-shear capacity and the flexural-shear capacity were computed (4, 5) and compared with the design ultimate shear, Fig. 2.11, and sufficient shear reinforcement (stirrups) was provided. Only nominal stirrups were needed over most of the length of the structure. The stirrups extended out of the top of the precast beam to provide the ties with the deck which are necessary to insure composite action. The stirrups are shown in Figs. 2.13 to 2.15, and the spacings are shown in Figs. 2.12 and 2.16.
The web-shear cracking forces were computed using a principle stress analysis with a limiting.tensile stress in the concrete of 4~ = 310 lb/in. 2 for the f~ = 6,000 lb/in,2 concrete used. There· is a discontinuity in the curve, Fig. 2.11 at the splice,since the end segments contain pretensioned reinforcement while the pier segment does not. The discontinuity. in the shear di~gram while the structure is on the temporary supports also contributes to this. The very large webshear strength indicated in the region 100 ft from the abutment is the result of a large vertical component of the post-tensioning force in this area.
Shears due to secondary moments were included when analyzing the shear cracking loads, in Sec. 7.4, but not when constructing the applied load envelopes,
The discontinuity in the flexural-shear capacity curve at the splice is entirely due to the provision of pretensioned steel in the end segments but none in the pier segment. The discontinuity at 107 ft from the abutment is due to a point-of-contraflexure of sorts, in that ne";ther positive nor negative moments cracks can be caused by flexure, considering the design ultimate loads, in this region.

-14-
2.11 Reinforcement Lay-Out
The final lay-out of trye pretensioned, post-tensioned, and non-prestressed steel in the longitudinal and several transverse sections in one span of th~ girder-deck system are shown in Figs. 2.12 through 2.15. The reinforcement details for the two splice~ are shown in Figs. 2.16 through 2.18.
The pier module was designed so that it could be lifted and supported either at its ends or its midlength. The additional moment accompanying casting of the deck concrete was assumed to be the same as in a two~span dontinuousbeam, and while the moment due to ihe dead'
. .
load of the girder was assumed to'· have the 'same' distribution in the analysis, it was reco~nized that it could be substantially different than this idealized distribution if the temporary supports were not placed arid maintained at exactly the correct elevati6ns.
The three ducts for ten-dons, ;each 3 in. diameter, were separated vertically by 3-1/2 in. through most of the length of the beam. This was done to insure that the radial forces from tendon curvature coul d not cause a tendon to break through from one duct to the' next .-
2.12 Additional Notes
It was found, after the load tests were completed, that incorrect live load moment and shear enve10pes had been considered during part of the design of the beam. The service load fl~xural stresses wer~ computed using momehts which were too high, by varying amounts. The ultimate moments considered were'correct for the negative moment at the ceritr~l pier and slightly low for the maximum positive and splice moments~ The ultimate shears were also sli~htly lbwer~han the correct values~' e~pecially in the region near the central pier.

-15-
The service load positive moment used during the design corresponded approximately to that of an HS-23 truck. The negative moment corresponded approximately to an HS-28 lane loading rather than the desired HS-20 loading.
This apparently arose as a consequence of several people working independently and successively on the design, with amisinterpretation of the meaning of moment envelopes for several beam spacings, and confusion over" whether impact factors had been included in the total or not.
It is clear from comparisons of the stresses listed in Tables 2.2 to 2.4 with allowable values, and comparisons of required and suppl.iedultimate moment capacities shown in Table 2.5, that the beam should have contained slightly less post-tensioned reinforcement. Reducing the number of post-tensioned strands to 39 instead of 42 would have reduced the negative moment capacity to about 81,700 k-in., two percent more than required. (With the Stressteel post-tensioning system, multiples of three strands are required because of the anchorage details.) A correctly done design would be controlled by stresses at the positive moment sections and strength at the negative moment sections.
With the original live load moment envelope, the limiting compression stresses were approached very closely at the bottom of the girder at the central pier and at the top of the precast, pretensioned girder at the maximum positive moment section. In no cases were the tensions limiting factors.
The number of post-tensioned strands could have been reduced to perhaps 33 before the allowable stresses governed at the bottom face of the maximum positive moment section. This would have required additional mild steel reinforcement in the deck near the central pier to provide adequate moment capacity. This redesign has not been pursued to completion so it cannot be fully evaluated.

-16-
The ultimate live load shear en~elope was slightly too low, and in addition the original shear design was done using the dead load shear computed considering the effects of the secondary moment. Inclusion of the secondary moment when computing the dead load shear offset the live load error at the outer support, but compounded the situation near the central pier. The region between the splice and a section 105 ft from the abutment had somewhat less web reinforcement than required, and the five ft length of beam adjacent to the central pier needed slightly more web reinforcement. As shown 'in Fig. 2.11, the section located 100 ft from the abutment needed web reinforcement with 93 kips capacity, while the steel supplied was capable of only 79 kips~ The critic~lsection located d/2 from the central pier needed 169 kips capacity, while about 157 kips was supplied.
While thes~ errors are unfortunate and tend tb complicate the comparisons between the applied loads and the loads required by the AASHTO provisions, t,heydo not invalidate the work~ The basic aim was, ,and remains, to compare behaVior of the 'structure, as built, with the predicted behavior of the same structure.

3. FABRICATION AND ERECTION, AS-BUILT
3.1 General Remarks
The three segmental girders, the splices, and the deck were cast at the Midwest Prestressed Concrete Company, Rochelle, Illinois. A brief description of the fabrication of various components of the girder-deck system is given in the following sections.
Some of the dimensions noted in this chapter are slightly different than those given in Chapter 2. The actual structure had two different kinds of joints, and hence the member lengths were not the same and also varied from the idealizations of the structure analyzed.
As an additional difference, the structure was fabricated 250 ft in total length, while the structure analyzed was 250 ft between centers of end bearings. The actual spans were 124.0 ft each, center to center of bearings.
The actual final dimensions are used in all comparisons of applied loads and their observed and theoretical effects.
3.2 End Girders
Because of different type of splices used, the two end girders did not have the same dimensions. The north and the south girders had lengths of 87 ft 6 in. and 85 ft 3 in., respectively. Each girder was pretensioned with 14-1/2 in. diameter 270 ksi strands. The north and the south girders were cast on June 1, 1973 and June 5, 1973, respectively. Both girders were designed for a concrete strength of 6,000 psi at 28 days, 4,000 psi at the release of the prestress, and 5,000 psi at the time of post-tensioning.
3.3 Middle Girder
The middle girder was 73 ft ° in. long. The girder. was designed for a concrete strength of 6,000 psi at 28 days and 5,000 psi at the time
-17-

-18-
of post-tensioning. No pretensioning was used for the girder. The girder was cast on May 29, 1973.
3.4 Erection of the Girders
The three girders were placed on three permanent and two temporary supports as shown in Fig. 1.2, on July 3, 1973, in the pre~ stressing pl~ntls yard directly south of the main building. The three girders were ,placed in the north~south direction. The south end of the north girder and the north, end of the middle girder were placed 18 in. from each other 'on the north temporary support, which consisted of wood blocks set on concrete slabs. The eight #9 reinforcing bars, four each at the top and the bottom, projecting from the ends of the two girders were:aligned .and spliced to each other with Caldweld splices as shown in Fig. 3.1.
The north splice had originally been planned to be 12 in. long. However, after getting the final dimensions on the equipment required for the Cadwe1d splices, this was increased to 18 in. by shifting the north end segment 6 in. north of its original position. Adequate ba~ extensions had been provided$ and these were trimmed to fit with an acetylene torch prior to maki ng the sp 1 ices. Thi s 1 engthened the. enti re structure by 6 in., and resulted in a small overhang at the north abutment.
The south end of the middle girder and the north end of the south girder were placed 39 in. from each other, on the south temporary
'support. The eight #9 reinforcing bars, four each,at the top and the bottom",which projected, from the ends of t~e two girders overlapped for a distance of approximately 38 in.
The spacings of the girder segments and approximate locations of the temporary supports are shown in Fig. 3.2.
3.5 Splices and Deck
Before the joints were cast, post-~ensioning conduits connecting the conduits at the ends of the girders were provided in the joints.

-19-
Stirrups were provided in each joint. The ends of the rebars in each stirrup were bent to form a shear key for the casting of the deck similar to those in the individual segments.
The two splices were cast on July 20, 1973, using a mix identical to that used for the three segmental girders. The deck, 250 ft long, 7 ft wide, and 7-1/2 in. thick was cast on the same day, using a different concrete mix, with a specified strength of 3500 psi at 28 days.
3.6 Post-tensioning
The entire structure was post-tensioned on July 30, 1973. Forty-two 1/2 in. diameler 270 ksi strands, twelve in the top conduit and fifteen in each of the lower two conduits, were each tensioned to 29.3 kips (189 ksi nominal stress) using a 400 ton capacity jack. All strands in one conduit were stressed at one time, and all were tensioned from both ends of the structure. Figures 3.3 to 3.6 show the posttensioning conduits, the prestressing anchor heads, and the prestressing jack. The anchorage system was supplied by the Stressteel Corporation, and the jack was a Pine center-hole ram with accessories to adapt it to the Stressteel hardware.
The 'post-tensioning operation caused the girder to lift off of and free of the two temporary supports. The vertical movement was 0.63 in. at the ~outh splice and 0.33 at the north splice. After the post-tensioning operation was completed, the temporary supports were removed, leaving the bridge supported on the center pier and the two end abutments.
3.7 Bearing Devices
The final bearing at the central pier was a 3-in. thick laminated elastomeric bearing pad. This was flexible enough to accommodate the slope changes imposed on the beam without undue restraint. The pad was grossly overloaded (D. L. reaction = 174 kips) compared to its normal

-20-
working load (about 125 kips maximum), but it behaved satisfactorily during the short term tests. The bearing was arranged as shown in Fig. 3.7a.
The ends of the beams were supported on 4-in. diam. steel rollers set between 2-in. thick plates, and on load cells. These items were arranged as shown in Fig. 3.7b.
3.8 Concrete Properties
The properties of the two concrete mixes used are listed in Table 3.1. One mix, containing 7-1/2 sacks of cement per cubic yard, was used in the girder segments and the splice. A second mix, containing 6-1/2 sacks of cement per cubic yard, was used in the deck.
All concrete was ~ixed in a horizontal pan mixer in the pre-. stressing plant and transported in buckets to the prestressing bed or to the location of the test specimen.
Compressive strengths of the concrete used in the various components, as determi ned from tests .. of 6 by 12 in. cyl; nders, are 1 isted in Table 3.2. Each individual test result is listed. There is a great deal of scatter, and the discrepancies between specimens tested 15 August and 28 August is particularly marked.
The 15 August tests were done at the prestressing plant, and the later tests in the Civil Engineering Department laboratories. with strain measurements being made. The later cylinders appeared to be sound and without obvious defects, and the testing rates were not greatly lower than the earlier tests. No reasonable explanation of the differences has been found.
The few cylinders remaining after the tests of 28 August were tested 8 September 1973, as spot checks, and the strengths were quite low as shown in Table 3.2.
It seems reasonable to assume that the concrete strengths at the time of the final test on 7 August were about 7,000 lb/in. 2 for the girder elements and deck, and about 6,500 lb/in. 2 for the splice conc~ete.

-21-
Young1s modulus values were determined from the strain measurements made 28 August 1973. These are listed in Ta.ble 3.3. These are initial tangent,modulus values. 'Secant modulus values at 2,000 lb/in. 2
stress would have been about the same, as the ,curves were nearly linear in that stress range.
There is considerably less scatter among the modulus values than in the strength data, although in general the weaker cylinders had the lower stiffnesses. The deck concrete had the highest average modulus, and for purposes of studying the results of the applied load tests on the beam it will be assumed that all concrete has the same modulus.
3.9 Effects of Concrete Properties
The original design work was based on the deck concrete having a modulus considerably lower than the girders, as noted in Sec. 2.3. Consequently the properties of the transformed composite structure described in Sec. 2.2 and Fig. 2.1 are not valid for the test structure.
New composite section properties were computed assuming the same Young1s modulus in girder and deck, and are shown in Fig. 3.8. The moment of inertia is 9 percent larger than was used in the design, and. the center of gravity of the composite section is almost 2.1 in. higher. The section modulus for the bottom of the girder is increased 3.5 percent; values for the top of the girder and top of the slab are increased more than 20 percent. These changes have various effects on the computed service load stresses, but have no significant influence on the strength of the structure.
The shift in the position of the center of gravity of the composite section has a direct influence on the secondary moments, since the eccentricity of the post-tensioning steel is changed. The eccentricity is downward for most of the length of the beam, and this is increased. The upward eccentricities are limited to a region near the central pier and are, on the average, considerably smaller than the downward eccentricities.

-22-
A 2.1 in. upward shift in the composite center of gravity would be expected to significantly increase the positive secondary moment induced at the central pier as a result of post-tensioning. The structure was reanalyzed with the new eccentricities, and the computed secondary moment at the central pier was +31 ,630 k-in. immediately after post-tensioning rather than +27,325 k-in~ as shown in Table 2.1. The overall influence of this change, wh1ch is appreciable when viewed in isolation from the other changes, is not large. The service load positive moment at the maximum positive moment section is increased slightly, but the section modulus for compression stresses is increased enormously. Increasing the secondary moment can only help the negative moment section of the ~entra1 pier, since compression at the bottom of the section was most nearly critical.

4. INSTRUMENTATION
4.1 General Remarks
This chapter describes the instrumentation used for measuring the loads, reactions, strains, and deflection of the girder-deck system during the test. The locations of the mechanical strain gages and the locations at which vertical deflection measurements were made are described in this section.
4.2 Mechanical Strain Gage Measurement
A total of 84 mechanical strain gage lines were installed on the girder and the deck. Each gage line, ten in. long, was made by attaching to the beam two 1/2 by 1/2 by 3/16 in. stainless steel plates. A conical hole was countersunk with No.1 center drill at the center of each plate. The plates were attached to the girder by first cleaning the concrete surface by sanding and then with acetone and then applying a contact cement to the concrete and an accelerator to the plates. The plates were attached to the top of the deck with a quick-setting epoxy material.
The-strains were measured with a 10 in. gage length Whittemore gage. _ The Whittemore gage is a direct reading mechanical gage with no multiplication of movement. The minimum reading is 0.0001 in., for a minimum strain of lxlO-5. The device is equipped with spherical tips (0.089 in. diameter) which fit into the conical holes drilled into the small plates. The locations and designations of the strain gage lines are shown in Fig. 4.1 and 4.2. Identical patterns were used on each side of the girder for the north and south spans. Each number was preceeded ~y two letters indicating span and side of beam.
Temperature compensation and standard gage readings were provided by the use of a 2 in. x 2 in. steel bar with a thermometer inserted
-23-

-24-
longitudinally in the center of the bar. The standard bar was kept on one of the piers, always in the shad~. It must be noted that completely adequate temperature compensation is probably not possible in the case of a structure where some parts are in the shade and others in the direct sunlight. Nevertheless, the temperature readings were taken during the strain measurements in each load increment.
4.3 Deflection Measurements
Deflections were measured by means of a Wild N-3 precise level and a level rod. Measurements were obtained at the north abutment, 70 ft north of the center pier, 35 ft north of the center pier (north splice), north and south sides of the center pier, 35 ft from the center pier (south splice), 70 ft south of the central pier, and at the south abutment, Fig. 4.3. The deflections were measured by placing the level rod in contact with points premarked below the deck. The level rod had a small circular level attached to it for monitoring the vertical position of the level rod. The two measurements at the north and south sides of the central pier were made because two level setups were used to reduce sight distances, with one instrument station halfway between the north abutment and the center pier, and the other halfway between the center pier and the south. abutment.
Level readings were made directly to 0.001 ft and estimated to 0.0001 ft.
4.4 Load and Reaction Measurements
The applied loads were measured by a series of six or ten load cells, for the design service load and the design ultimate load tests, respectively. The load cells are thick walled cylinders machined from 606l-T65l aluminum rods. Each load cell is 6 in. long with an outside diameter of 2 in. and an inside diameter of 1-1/8 in., and fit over the loading rods, between the jacks and the nuts on the rods .. The four strain gages mounted on the external surface of each load cell

-2S-
were wired to form a four-arm bridge measuring circuit. Each load cell has a ~apacity of S7 kips and was calibrated to a maximum load of SO kips. The load cell sensitiviti~s were about 80 lb/10-S strain.
A 400 kip and a lSO kip capacity loa~ cell were used for measuring the reactions at the north and south abutments. Both were thick-walled cylinders machined from steel tubing, and were instrumented with electrical resistance strain gages wired as 4-arm bridge circuits. The 400 kip load cell had a sensitivity of 781 lb/10-S strain, while the value for the 150 kip. cell was 300 lb/10-S.
Since only the 400 kip load cell had enough capacity to measure the reaction in the loaded span during the design ultimate and overload tests, the two cells were switched from end to end of the structure as needed .0
5. LOADINGS AND TEST PROCEDURE
5.1 General
Loads simulating the tractor and the trailer of an HS vehicle were applied by a series of jacks pulling on bars anchored to the ground. A total of 28 l-in. diameter high strength steel rods, each connected to a 2-3/4 in. diameter steel plate washer, were grouted into holes drilled in the bedrock. The bedrock is approximately 15 to 20 ft. below the ground surface.
The bars were placed on both sides of the beam at a transverse spacing of 4 ft., to the north and south of the center pler at distances of 40 ft, 44 ft, 54 ft, 58 ft, 68 ft, 72, ft, and 84 ft from the pier, as shown in Fig. 5.1.
These hole spacings were selected to allow application of loading combinations approximately the AASHTO HS vehicle'axle spacings of 14 ft, without requiring excessive numbers of anchor bars to be grouted into the rock.
The bars projected about 4 ft above the ground. The ends of the bars projecting above the ground level were threaded and connected to other bars with the use of a sleeve nut .. A seri~s of 1-1/2 in. diameter holes were provided in the deck at locations directly above the embedded rods. Loads were applied by center-hole jacks placed on the deck, with l-;nch high strength steel rods passing through the jacks and deck and fastened to the sleeves connected.to the bars below the deck, as shown in Figs. 5.2 and 5.3.
The rods which were anchored into the bedrock were Stressteel post-tensioning bars. The loading rods which were coupled to them were AISI 4142 heat-treated steel (similar to ASTM-A193, Grade B7 bolt material), and the 2.0 in. diameter by 4.5 in. sleeve nuts were of the same material. The sleeve nuts also provided transitions from the 14 threads/in. used on the Stressteel bars to the 8 threads/in. used on
-26-

-27-
the upper rods. The upper rods were part of the general stock of testing equipment from the University of Illinois Structural Research Laboratory, and were used with ASTM Al94 Grade 2H nuts and hardened washers.
5.2 Service Load Tests
The first four loading conditions correspond to design service load for an HS20-44 truck on the bridge. The loading positions were as follows:
1. Load causing the maximum positive moment in the north span, Fig. 5.4
2. Load' causing the maximum shear at the north splice, Fig. 5.5'
3. Load causing the maximum positive moment in the south span, Fig. 5.6
4. Load causing the maximum shear at the south splice, Fig. 5.7
Loadings No.2 and No.4, in addition to causing the maximum shear at the two splices, give approximately the maximum positive moment at these two locations. According to AASHO specifications, when the girder spacing is 7 feet, the total service live load for one typical interior girder is 45.8 kips without impact, and the additional load due to impact was also applied through the jacks. Additional forces were also applied to account for the weight of the asphalt deck topping; the forces used reproduced the shear acting at the splice but the same force was used with all loading positions. Accounting for the impact and the weight of the asphalt, the total service test load is 73.6 kips. The load was applied through .. six 30 ton jacks, two accounting for the front axle loads and the remaining four accounting for the rear axle loads of the truck. The loads were applied in such a manner that each jack corresponding to a front wheel carried one-eighteenth (1/18) and that each jack corresponding to a rear wheel carried four-eighteenths (4/18) of the total load. The total load was applied in five equal increments.

-28-
To avoid excessive stress concentrations at the points of application of the loads, front axle jacks were placed on 8 by 8 in. by 1/2 in. steel plates, and the rear axle jacks were placed on a 9 by 15 channel sections, 3.5 ft long, as shown in Fig. 5.2.
The load applied through each jack was measured with a load cell placed directly above the jack. The pressure for the two front axle jacks was applied with a manual hydraulic pump, whereas the pressure for the four rear axle jacks was applied with an electrical pump. The force required to produce the loading in the system was monitored by two strain indicators, one connected to one of the front axle jacks and the other connected to one of the rear axle jacks. An attempt was made to coordinate the application of the pressure in the front and rear axle jacks.
5.3 Design Ultimate Loads
The remaining three loading conditions correspond to design ultimate load of 1.5 times the dead load and 2.5 times the live load plus impact. The loadings were as follows:
1. Load causing the maximum shear at the north splice, Fig. 5.8
2. Load causing the maximum positive moment in the north span, Fig. 5.9
3. Load causing the maximum shear at the south splice, Fig. 5.10
For the last loading condition the total load was eventually increased to 1.65 times the design ultimate load. The equivalent weight of the asphalt and the additional 50 percent of the dead load, as well as the 2.5 times the live load plus impact were applied through a series of ten jacks. The total load corresponding to the design ultimate load was 198.7 kips. To avoid concentration of the load on the deck and to remain within the capacity of the rock anchors, the load was applied through two jacks for the front axle loads and eight instead of four jacks for the rear axle loads of the truck. The loads were applied such that each front

-29-
axle jack carried one-eighteenth (1/18) and each rear axle jack carried two-eighteenths (2/18) of the tot~l load. The total load was applied in six increments. The design service load was applied in the first two increments and the difference between the design ultimate and the design service loads was applied in four additional equal increments. In the last loading condition (load causing the maximum shear and moment at the south splice), the load was increased in equal. increments until a total load of ·1.65 times design ultimate load was reached at which the test had to be terminated mainly due to reaching the end of the threads in the loading bars, and limitations on available time. It was thought that the threaded lengths of the pull rods were more than adequate, but some of the rock anchors slipped considerably before resisting their share of the load.
, A procedure similar to that used for applying, measuring, and monitoring the pressure for the design service load tests was used for the design ultimate load tests. To avoid stress concentrations at the points of application of the loads, front axle jacks were placed on the 9 in. 15 lb. double channel sections parallel to the girder, whereas the rear axle·jacks were placed on 12· in. x 25 lb. double channel sections placed perpendicular to the girder, as shown in Fig. 5.3.
5.4 Testing Procedure
For each loading condition described above, before the application of the load, initial readings were obtained on all load and reaction cells, the strain gages, and the level rod for the vertical deflection measurements. To insure that no load was applied through the jacks, approximately 1/2 inch slack was provided in the jack by loosening the nut directly above the load cell. A standard bar strain reading was also taken with the Whittemore strain gage and the temperature recorded for possible temperature correction.
For the four design service load tests, the design service load of 73,600 lbs was applied in five equal increments of 820 lbs .in each of the two front axle jack and of 3280 lbs in each of the four rear axle

-30-
jacks (See Tables 6.1 to 6.4). After each load increment was applied, strain indicator readings were obtained for each load and reaction cell. Concrete strains at the various locations were recorded and the level readings were taken. When the loads were removed after each loading condition, zero readings were again taken on all load cells, strains, and the level rod. The time for each complete test varied between 2-1/2 to 5 hours, depending on difficulties with the hydraulic system. The average time for the completion of each loading increment including the reading of load cells, strains, and level rod was approximately 30 minutes. For some loading increments, if no·difficulty was encountered, the time was reduced to 15 minutes. A slack or slip of 1 to 1.5 in. in most of the loading rods was taken up during the application of design service loads. During the application of the third loading increment of the third test, the loading rod ~n the east side of the bridge 54 feet south of the center pier came loose and it was pulled up approximately one foot before it finally reseated itself and resisted additional load.
For the three design ultimate loads, the design ultimate load of 198,700 lbs was applied in six increments. For the first two loading increments, a load of 2050 pounds was applied to each of the two front axle jacks and a load of 4100 lbs was applied to each of the eight rear axle jacks. The second increment corresponded. to the design service load. For the next four loading increments, additional loads of approximately 1,740 pounds were applied to each of the two front axle jacks and loads of approximately 3470 pounds were applied to each of the eight rear axle jacks. The magnitudes of the total loads for each increment are given in Tables 6.5 to 6.7.
In the last loading test, (load causing maximum shear at· south splice), the load was increased in additional equal increments beyond the design ultimate load. A total load of 328,000 lbs, equivalent to 1.65 the design ultimate load, was reached at which time the test had to be terminated because the end of the threads in a loading rod had been reached, as had the end of the daylight needed for illumination.

-31-
The time for the completion of the loading increments for the design ultimate load tests was l~nger than that for the design service load tests) mainly due to the inspection and marking of the cracks in the girder.
At the end of each loading increment of the design ultimate load tests, the girder and the deck wasexaminated for cracks. The cracks were marked and identified by the load number before the next load increment was applied.

6. RESULTS OF TESTS
6.1 Introduction
The results of the tests, in terms of load-deflection, load~
strain, load-reaction, and cracking response wi"ll be described in this chapter. Most of the discussion of the results will occur in Chapter 7.
The data for the successive sets of tests to service load, design ultimate, and the final overload test will be presented in successive sections. The post-tension operation was actually the first test loading, and the. deformations produced will be discussed first, in Sec. 6.2.
6.2 Deformations and Reactions at Post-tensioning
The vertical deformations at post-tensioning are important, since if the structure lifts enough, it will come free of the temporary supports, facilitating their removal. The test structure deflections were not very symmetrical, but both spans came free of the supports. The upward deflections, relative to the central pier, were as shown below (inches):
S. Abutment 0.09
S.70'
1 .39
S35' 0.63
Pier o
N35' 0.33
N70'
1 .01
N. Abutment 0.10
The apparent upward movement at the ends of the bridge is probably actually a downward movement at the central pier due to compression of the elastomeric bearing pad.
The south span was more flexible than the north. The Young's modulus values from Table 3.3 are lower for the south span than in the north, but the differences were not great enough the explain the differences in camber ..
Reaction load cell readings were taken at each stage of posttensioning. The measured reactions are compared with theoretical values below, immediately before post-tensioning:
-32-

-33-
S. Abutment N. Abutment Measured 57.8 kips 57.3 kips Theory, 150 1 b/ft3 58.9 kips 60.4 ki ps· Theory, 145 1 b/ft3 56.9 kips 58.4 kips
The agreement between measured and computed values is well within reasonable ranges of variation of the unit weight of an airentrained concrete. The theoretical reactions for the two ends of the structure are different because of the different lengths of the ~nd segments, as shown in Fig. 3.2.
Differences between theory and measurement can ocCur because the uni"t weight of the concrete is not known exactly and may vary along the length of the structure, and because of cross-·sectional area variations. Measuring errors may also o~cur, especially since the minimum reading on the south load cell was about 0.8 kips.
After all tendons were stressed from both ends, the measured and computed reactions were:
.Measured Theory ,150 1 b/ft3 and
s. Abutment 84.0 kips
design eccentricities 88.5 kips Theory, 145 lb/ft3 and
design eccentriciti"es 86.2 kips
N. Abutment 83.4 kips
88.5 ki.ps
86.2 kips
The final reactions are slightly smaller than anticipated. In addition to the reasons previously discussed for such differences, the secondarY'moments play an appreciable role in this case, with 18.2 kips of these reactions being attributed to secondary moments. Any error in the secondary moment calculation, such as may occur if friction is greater than assumed or the actual centroid of the section being slightly different than assumed will lead to proportionate changes in that component of
the reaction.

-34-
The final reactions are nearly the same, and the changes accompanying post-tens'ion;-ng and lifting off the temporary supports are also nearly equal, at 26.2 and 26.1 kips, !or north and south, respectively. This tends to support the validity of the reaction measurements.
The concrete probably weighed about 145 +2 lb/ft3, and the secondary moment was apparently slightly lower than expected. The average measured reaction, w;-th 145 lb/ft3 concrete, leads to a net positive moment at the central support of about l25k-ft, and 'maximum positive dead load ~oment of about 2620 k-ft.
Tendon elongations were measured during post-tensioning, but the measurements were relatively imprecise, and tendon friction infor-· mation cannot be reliably extracted from the values. Instressi.ng, a preload force of 88.7 kips (750 lb/in. 2 hydraulic pressure in jack) was applied, and elongations were measured from that point. The elongations from the fi'rst end stressed exceeded the jack extension capacity, so the tendons had to be anchored, the jack retracted, and ~ new pull made to reach the required force. This resetting greatly reduced the precision of the elongation measurement.
The tendons were all stressed from both ends. Pulling the secondend.produced .. relattveJylittle .. addi ti ana '._el onga.ti on.
Measured and calculated elongations~ in inches, are listed below, with the calculation being for zero friction, for forces in excess
of the preload force, and for Es = 28 x 106 1b/in. 2.
Tendon Force Measured, N ~~easured , S Total Theory
Top 347 kips 119/16 2 3/4 15 5/16 15. 1
Middle 434 kips 14 3/4* 1 3/4 16 1/2 16. 1
Bottom 434 kips 13 1/8 1 15/16 15 13/16 16. 1
* Best estimates at time of post-tensioning, known to be in error.
.,...35-
The top duct had been partially blocked 21 ft from the north end of the beam. The obstruction was found while pulling a 2.4 in. diameter steel "ball l
' through the duct with a steel cable, although the cable had been inserted with out serious problems. The obstruction was eventually cleared, but this duct must have had somewhat higher friction than the oth.er two. The extra elongation at the south end seems to suggest that the high friction area was concentrated near the north end of the structure.
The measured elongations were all greater than the computed ones, which may be a result of measurement problems, or of Es being lower than assumed, or both.
6 ,., . .;) Service Load Tests'
Four tests to service load levels were conducted with the loading positions shown in Figs. 5.4 to 5.7. The nominal applied load was 73.6 kips. Of this, 54.9 kips was from the design HS-20 vehi-c1e load, including impact, proportioned for a 7 ft beam spacing. The rematning 18.7 kips was to compensate for the additional design dead load from
--- -- - - .. - ---- .
the asphalt topping which was not pres~nt .on the test structure. This, load was specifically the additional load to cause the correct sh.ear force at the splice when the vehicle was positioned for the maximum splice shear loading.
The 73.6 kips load was attained in 5 equal increments. The values of each of the lI ax l e ll loads at each increment are listed in Tables 6.1 to 6.4. There are no major deviations from the desired axle loading ratios during these tests. Differences between the two rear axle loads, which were applied by four jacks connected to a common pump, can result from different friction in the jacks.
Although there are small differences between the actual and desired load distributi'ons, the data will be presented in terms of total applied loads, and interpreted as if the distributions were exactly as shown in Figs. 5.4 to 5.7, where the rear two axle loads are 4.0 times the front axle load.

-36-
The service load tests produced no crac.king in the structu·re. The general behavior was elastic with respect to both deflections and reactions. The service load deformations were small, with maximum deflections of about 1.0 in. downward in the loaded span and about 0.4 in. upward in the other span. Superposed on these deflections were unde~ termined deflections caused by temperature gradient effects caused as the sun shown on the east side of the girder, then only on the top of the deck, and later on the west side of the girder. Buildings adjacent to the west side of the girder limited ·the late afternoon sun.
Load-deflection curves for the first four tests are shown i'n Figs. 6.1 to 6.4. Al~o shown in the same graphs are theoretical elastic load-deflection curves, computed using 1 ::: 615,570 in.4, as shown in Fig. 3.8, and with Ec ::: 5.5 i 106 lb/in. 2.
The 'measured curves are generally linear in nature, and there were only small residuals on unloading. The residuals. are shown only when they exceed 0..02 in.
The deflections were relatively ins~nsitive to the loading lo~
cations, as the deflections due to the splice shear loading were about the same as those due to the maximum positive moment loading. The'maximum deflection in the loaded span was approximately· the same as the deflection at the 70 ft point. The 'maximum upward deflection in the unloading span was somewhat greater than at either the 35 or 70 ft point. The structure was nearly symmetrical, with comparable loadings causing nearly identical deflections in the two spans.
Deflections were computed using Ec ::: 5.5 x 10⁶ 1b/in. 2 rather than a value between 4.8 and 5.3 x 10⁶ k/in.2 as determined from cylinder tests. This was done to match the measured deflections. The beam deflection measurements represent a very large Young's modulus test, and more accurately represent the beam concrete quality than do the cyltnder tests listed in Table 3.3.
Measured and computed elastic reactions at the two ends of the structure are plotted versus applied load in Figs. 6.5 and 6.6. The general trends of measurements and theory agree reasonably well, but there are some marked deviations. The loaded~span reactions are considerably

-37-
smaller than those computed for a simply supported beam for all cases except the second increment of ~he fourth test.
The causes of the deviations are not completely known, but it is believed that the difficulties were more likely to be in the precision of the measurements than in the actual forces~ There were some large and unexplained zero shifts during the tests, which may be due to moisture accumulating in at least the 150 kip load cell.
The load cells were four-arm bridge measuring circuits which are relatively well self--compensated for temperature changes as long as the entire load cell changes temperature uniformly. In the bridge test the temperatures were undoubtedly nonuniform at 1 east part of the time -since the sun could shine directly on the cells early and late in the day. The extent of any reading changes produced by this effect cannot be readily assessed~ but could have been significant.
Because of the uncertainties introduced into the load-ciell readings, it does not appear that the reactions can safely be used in determining moment and shear distributions in the service load tests. The reaction measurements must be viewed as only indi.cators of trends.
As was noted earlier, no cracks ~ere fo~nd during th~ serVice load tests. The measured strains also indicated that no cracking was likely to have occurred. The maximum strain measured was 0.000,25
tension, at the bottom gage line 70 ft north-of the central pier. The precompression at that section was about 2,100 lb/in. 2. A strain of
; at least 0.000,47 would be expected at initiation of cracking,if Ec = 5.5 x 10⁶ Ib/in. 2. The maximum tensile strains in the deck were about 0.000,10, at the central pier, about one-third the expected cracking strain, considering the different precompression at this section.
6.4 Design Ultimate Load Tests
Design ultimate loads of about 197 kips were applied in two differentposittons in the north span. The loads were positioned to give maximum s'hear at the splice and maximum positive moment,. respectively, in the two tests.

-38-
The nominal load of 198.7 kips was determined using the 1969 AASHO load factors of 2.5 1 i ve load 'plus impact and 1 e.5 dead. load. The live load component was 137.5 kips, and the remaining load was applied to reproduce the correct. shear at the splice resulting from 1.5 dead loads, including the asphalt topping. The e~tra 61.2 kips was;re-'
.quired with the ·splice shear loading position, and the same load was then applied in the positive moment loading position.
Because of the high total load· required, it was ,appl ied with five Ilaxlesli rather thqn three. The nominal loads on the four rear loads were eachtwi ce that on the front axl e. The ax1 e loads are li sted for each of the six intrements of each test in Tables 6.5 and 6.6. The re 1 a ti ve loads were in reasonap 1 e bal ance ·except on the fi rst . two ·,i ncrements ~f Test 5 and the la~t increment of both tests~ Th~ load positions are shown in Figs. 5.8 and 5.9. The low load at 68 ft north at increment 56 may be a result of slip.of one of the anchor rods.
These two tests caused flexural and shear cracking and caused deflections in e~cess of. three in. in the loaded span~ However, there was not much damage appar.ent after unloading. The flexural cracks were all all tightly closed and generally not visible. The ·residual deflections were. extremely sma 11 '>
Load-deflection curves for the two tests are -shown in Figs .. 6.7 and 6.8, as are elastic ·deflections. In 'Test 5 there is a slight deviation from the initial linear response at loads above 100 kips, and a more marked deviation aboye 165 kips. The residual deflections in each case are ~utt~ small.
Load-reaction curves are given in Fig. 6.9. The reactions from the splice shear loading are in reasonable agreement:;,.with the theoretical elastic reactions. The south reaction was considerably too small during most of the positive moment loading test, but this is apparently the result of a measurement problem rather than a low reaction, since the north. reaction was not significantly higher than the elasti~ value. The deviations of the abutment reactions from the elastic. va;lues must be equal. If, for· example, the south reaction were 8.0·kips lower. than expected, the north abutment reaction must be 8.0 kips higher ~han expected, from simp 1 e equi 1 i bri urn.

-39-
Apparently there was some error made in determining the applied loads in the second increment of. the sixth test, as neither the deflections nor the reaction curves go smoothly through that point. The curves would all be smooth if the load were plotted as 75 kips rather than th~ 86.7 kips shown in Table 6.6. The test records have been carefully examined without finding any evidence of the trouble. It would have been relatively easy, to have applied 86.7 kips rather than the intended 74 kips, but the deflections should have corresponded to the higher load.
The first cracks we~e found at the fourth increment, 135.7
kips, in the splice shear test. One vertical crack occurred at each edge of the north,splice, at the j6int-beam interfaces. These cracks extended through the lower flange and about 5 in. into the web. Two horizont~l cracks at midheight of the splice web were also found. These cracks were approximately along the paths' of the post-tensioning ducts, and may 'have existed 'earlier.
The fifth load increment, 165.3 kips, caused a number of web~ shear cracks just north of the central pier. Two cracks crossed most of the depth of the web, and the rest were short cracks near the junction of the beam web and the top flange. Norte penetrated into either flange. All cracks were very small.
The final increment, to 197.2 kips, caused considerable additional cracking. Eleven flexural cracks were found in the area between 48 and 68
ft north of the central pier. Six of these cracks extended about half way up the web, the others were confined to the lower flange. Additional shear ~racking occ~rred, with most of these cracks inclined about 30° above the horizontal. One inclined crack crossed the splice.
No cracks were found in the deck, nor were any flexural cracks found in the negative moment region of th~ girder.
A number of negative moment and shrinkage related cracks occurred in the pier module before post-tensioning. None of these cracks reopened during this test, and shear cracks crossed them with little change in direction.
-40-
Several crack widths were measured. The flexural cracks were 0.008 to 0.010 in. wide at the lower flange. A shear crack in the north precast element, 4 in. from the splice and near the top of the beam web, was 0.014 in. wide, and was the widest crack found. Most of the shear cracks were much smaller, with 0.006 in. bei~g a good representative width.
The maximum positive moment loading in the north span, the sixth test, was initially plagued by slipping of two of the lo~ding rods at different stages of the test.
The structure was carefully exami ned to determi ne \'ihen cracks reopened. The fourth load increment, to 136.9 ki ps ~ produ~~d the fi rst reopening of flexural cracks. They were extremely small at thi,s stage, with the gr~~test~easured 'width being 0.003 in.; most widths were too small to measure.
The fifth increment, to 168 kips, caused ~ne new flexural crack, under one of the center axles. The maximum crack widths were 0.006 to 0.007 in.
The last load increment, to 194.5 kips, ca~sed consider~blY more f1 exura 1: cracks, with the 1 ast cracking 80 ft north of the centra 1
pier. At least 11 new cracks opened at this load. The widths remained small, with maximum measured widths again in ~he range of .0.006 to 0.007 in.
Figure 6.10 shows the locations, lengths, and locations of all cracks in the north span. The dr'awingwas prepared 'from photographs taken
"after the tests were completed. The cracks are not marked in the drawing to distinguish which test caused them~ However, all cracks more than 68 ft no~th of th~ central pier occurred during the 6th test. All tracks near the central pier and those near the north splice occurred during the 5th test, which was the loading fo~ maxim~m shear at the
splice. The cracks marked on the deck occurred during the loading in
the south span. These cracks were not carefully marked on the sides of

-41-
the slab, and there were 'many more than shown here, but the northern limit of deck cracking is about right., No negative moment cracks were found during either north span test.
The loading positions are marked on the drawing. The interpretation of the cracking loads, and discussion of
tensile stresses at cracking, will be deferred until Chapter 7. Strains are plotted versus live load moment in Figs. 6.11 and
6.12, for a number of gage lines. Moments are used rather than loads in order to facilitate comparisons between the effects of the two different loadings. In each case the strain is the average of the measurements on the two sides of the' beam. Before cracking, the values were always very close to being the same. After cracking, the differences were occasionally 1 a rge',: eXceeding 50 percent in some cases.
The moments plotted are those from an elastic analysis of the structure, using the,ideal distributions of forces. Figure 6.11 has been plotted assuming the 1lJoment computed at 37.5 ft north exists at
'gages' 1 ines 23, 33, 'and 43, even though the 'moments are sl ightly different at these sections.
Cracks crossed all three gage lines near the north splice dur. ing Test 5, and the graphs are marked to ,indicate when the cracks were
seen. There 'is no strong indication that these cracks reopened during Test 6, except at gage N33, located at the middle of the splice.
There is a discontinuity in most of the moment-strai'n curves between the second and third increment of Test 6. This is a reading error apparently caused by some accidental damage to the 'mechanical strain gage either while the second increment readings were being taken Or between readings. There is a large change in the standard bar gage readings at this time, and the normal correction procedure followed has not removed quite all 'of the error.
Test 5 caused no cracks at the se~tion 70 ft n6rth of the central piEfr, as is confirmed by the strain plot for line N53 Fig. 6.12.
- . .
There was a crack at 68 ft north, and this may have disturbed the trend of the graph slightly at the last load increment. Test 6 caused numerous cracks in this area, at the last increment, and this shows up clearly in the graph.

-42-
Strains are: plotted in Fig. 6.12 for gages N63, located 90 ft north of the centra 1 pi er and 10' ft .beyond the. 1 ast crac k, and gage Nl 0,
located just north of the central pier. Gage N10 shows some decrease in slope a fter the fourth increment of Test 5. No cracks were found in the' deck, but web-shear cracks were occurring in the beam web near this section duri'ng the final two load in~rements.
6.5 South Span Overload Test
Th~ final test lo~ding produced ~axtmu~ shear at the south splice. A maximum load of 328.2 kips was reached,' in the 1.1 increments listed in Table ~.7. This load did not ca~s~ failure of the structure even though the maximum deflection was nearly 11 i.n. Extensive cracking occurred throughout the loaded span and over much of the length of ~he unloaded span. There was considerable distress in the precast ,beam just south of the splice, but the structure apparently would have carried more load before fa i1ure.
The extent of cracking at th.e beginning of the test was des-·
.fTJQ~~t_jn._s.J~~!..-Q_._4L-._.lher.e.-_w-er-e_nD_cr-acks--tn--tbe--sou-th--span .. ---T-he---resi-d ual----defl~ctions at the be~inntng of the final te~t were small, and,are listed .
..
below~ The values are relative to the position of the structure at the beginning of testing~
Point S70 S35 N35 N70 Deflection 0.~6 in. up 0.05 in. up 0.09 in. down 0.10 in. down
Load-deflection curves for the four points are given in Figs .. 6.13 to 6.l5~ The fin~l deflection was 10.8 in. ,.at the point 70 ft south of the centra 1 pi er, and was approxima te·1y the maximum in the span. In spite of the Jact that the curve started leaving theorig-inal straight
-~. . ; ..'
line at only ohe-third'6f the final load, the residual deflection of
1.02 in. at the end of the test was relattvely small.

-43-
The other curves are similar, in that quite large deflections under the maximum load have resulted in relatively small residual deflections. The upward deflections in the unloaded (north) span were always larger than the elastic deflections, and the residuals were' relatively larger than in the loaded span.
The initial low stiffness in the north span may be due to cracking during Tests 5 and 6. The higher residual m'ay be a result of very extensive cracking in' the deck during this test. The precompression in 'the deck was lower than in the beams, and cracks would have less tendency to close completely. In addition, the steel in the deck was not prestressed so would not be very effective in closing cracks.
The deflected shape of the structure shows up clearly in Fig. 6.16. The photograph was taken from the southwest late in the test, but slightly before the final load was applied since it was too dark for normal photography by the end of the test.
The live-load reactions are plotted versus applied load in Fig. '6.17, along with theoretical values for continuous and simply supported beams. The numerical values are not entirely consistent, but, there are some indi'cations of the ch().nges which took place in the structure.
. '
.. . ..... . ...... ------.-------If--th e---no rt h-a-bu-tmen t--re a·cti-o n-is-·v-i:ewed-··-a-s---a--di--rec-t--meas u·r-e·-of-- '
the negative moment at the central pier, it appears that this moment was lower than the theor~tical elastic moment in the early parts of the test. Since'the measured deviations of the reactions from the theoretical values are not equal, the extent of the deviation cannot be fully evaluated.
At loads above 200 kips, the reaction values both indicate that the negative moment increased faster than the positive moment with increasing load, and the increase in negative moment at the central pier appears to be appreciable. There are probably two effects causing this redistribution of moments. As th~ loads increase, different sections loose stiffne'ss at di fferent ra tes. For thi s 1 oadi n9 pos i tion, the maximum elastic live load positive moments are about 1.71 times the support negative moment. The dead load moments, including secondary moments, are entirely positive.

-44-
Thus, the ratio of applied positive to negative.moments was much higher than the ratio of either. design ultimate moments or the ultimate moment capacities provided, which are shown in Table 2.5. The redistribution which occurred was tending to bring the ratio of positive to negative moments toward the ratio of the section strengths.
The positive sections were most heavily loaded, and might be expected to loose stiffness at a greater rate than .the negative moment sections. As the beam becomes more extensively cracked with increased load, the 1nfluence of'th~ secondary 'moments must be gradually.eliminated, as the moments approach the capacities of,the varioussections~ Both effects are operating in this case, and the secondary moment is very large and consequently represents a large redistribution. potential.
The changes in the moment distribution with load will be more extensively discussed in Chapter 7~
Thi s test caused extensive cracki ng in both spans. The south span cr~cks are shown in Fig. 6.18. The first cr~ck, a horizontal crack parallel, to a duct, was· found near th.e,south.splice.at·the third lo.ad, 106 kips . .The first flex,ural crack was found at the. south edge of the spl~ce at load 4, to l36ktps. After Joad 6, 197.1 kips, was applied
• . I' •
the crackpa ttern was about the same as in the north span a t the .end of Test 5, thoug.h there were fewer cracks . There was one long incl i ned .. ," . "
crack at the ce,ntral pier, and 10 short shear cracks at ·the junction of the • : " '. I
web and theupp~r· fl ange ,all wi thin. about 10ft of the central pi er.. Three cracks were found. in the .precast beam just north o.f the spljce,;and four just south of the splice, plus cracks at the interfaces between the
splice.and the precast beams. Four vertical cracks were foun.d i'n the region between 56 and 64.5 ft south of the centra~ pier .. .This load was
left in. place f9r about two hours, and three new short shear cracks. developed near the central pier, and other cracks grew slightly in· 1 ength.
Load 7, to 227.5 kips, pro9uced add.itional cr,acking ,especial Jy
inclined cracks located 40 to 44 ft south of the pier, near the rear axle loads. A second inclined crack developed in the splice. Two of the flexural cracks were 0.007 and 0.008 in. wide.

-45-
Load 8, to 261 kips, caused cracks as far as 74 ft south of the pier, slightly beyond the frpnt axle load. Negative moment cracking also occurred in the deck, with cracks from 1 ft to 74 ft north of the pier. These cracks were 'either near the central pier or beyond the splice, but not between the pier and splice. These cracks were small and not well developed. Some crossed the width of the deck, and some extended through the deck'thickness, but others did not. One crack was at the south edge of the north splice, and several other cracks were in the same area.
After load 9, to 290.6 kips, was applied~ web-shear cracks occurred nearly continuously from the central pier for 28 ft south, as shown in Fig. 6.18. Flexure or flexure.,.shear cracks existed from about 30 ft to 80 ft south, ~ith cracks at 12 in. or smaller intervals for the entire 1 ength. Some cracks from the 'sp 1 ice to 75 ft south reached as high as the top of th.e beam web, but none ever penetrated the top flange.
More serious cracking occurred during application of load 10. The load step was applied in two half-steps because it was necessary to retract some jacks to gain deflection capacity. While the jacks were betng retracted, a liS-tn. wide crack was, found in the lower flange, ' starting at 41 ft south and sloping upward to the south at about 306
above horizontal, as shown in Fig. 6.19. This width was maintained for only a foot, but a large crack continued across the sloping part of the lower flange. On the basis of the widths of cracks in the web at 43 ft south, it appears that some stirrups may have yielded at this load. The width of one of the shear cracks was about 0.02 in., near the middepth of the web.
This large crack was one of several which occurred earlier in the same part of the end precast segment, and there was one similar crack in the splice concrete, as also shows up in the photograph. There was quite a visible offset on the lower surface of the beam at the end of the one large crack. The crack was almost under the rear axle of the test load, at the point of maximum shear. It was·c1ose

-46-
enough to the end of the precast segment to be within the region of development of the prestressing force from the pretensioned strands, but there should not have been large anchorage bond stresses'in the re~ inforci ng bars extending into the spl ice.
The half step of load beyond increment 9, to about 305 kips, caused flexure-'shear cracking as far as 83 ft south, and a crack at 80 ft south was 0.016 in. wide, on the lower flange.
Thecomp 1 eti on of the tenth load increment, to 320.7 kips " caused few new cracks but many extensions of old cracks .and·obvious growth of widths. The crack at 85 ft south was the last one found. The inc 1 i ned crac k in the lower fl ange grew in l'eng'th 'and wi dth .
The eleventh load, to 328.2 kips, was ~eached when more jacks reache~ the end of their travel. This small additional l'oad produced little new' cracking, or at least veri few c~acks were fo~nd inth~ . .
fad i n g day 1 i 9 h t ~
It was then 7:30 p.m. and rapidly growing dark. The stt~cture
was thenynloaded, a process that took an ~our since the deflection recovered almost 10 in. and the jacks had to be retr~cted and re-extended under load because of their 5-in. maximum stroke. The final readings were tak~n in dark~ess with flashlights and car headlights, which is not ideal, especially for the level readings.
The structure,did not fail, although it ~eems ~easonable to assume that a faiiure would have occurred just south of the south splice
, . • r
if the loading had continued. The c~ack at that location wis quite wide at the end of the test, and did not close very well upon unloading.
The test results will be discussed in the next chapter, with attention to initiation of cracking, changes in moment distribution, and the predicted ?trength of the structure.
Even though the test structure was not heavily instrumented for strain mea~urements, a large volume of data ~as g~thered during the final test. Part rif this data will be presented using lo~d-strain curves. A few d~;tribution~ of sirains across the depth of:the structu~e at p~rfi~ cular cross-sections will also be preserited.

-47-
The cracking near the south spl tce was the most important in the structure, and the concrete ,strains in this area are consequently of interest. The strains measured at gages lines S23, S33, and S43 are
plotted versus load in Fig. 6.20. Line S23 was on the lower flange of the central segment just north of the splice. The strain response was much as expected, in that the strain increased continuously with applied load, and at a generally increasing rate. Line S33, at the center of the splice,and S43, in the south pretensioned segment show a somewhat different behavior in that th'e initial response was as expected but the rate of increase of strain then became much smaller and stopped or reversed as the maximum load was approached. The first cracks near the splice were found at the third load, 135.9 kips, but no cracks crossed the strain gage lines until later.
These reversals of trends are probably due to the shear damage which was occurring just south of the splice. The fi,rsti,ncl ined crack crossed gage line SE43 at load 6, 197 kips, and this is reflected in the curve for S43, the average of the strain on the two sides of the beam. At load 7, 227.5 kips, a shear crack passed outside of the end of the gag~line; this 'crack was to become the largest in the structure after more load was applied. Another crack passed near the gage line' at the next increment. These cracks show up in Fig. 6.19. The strain gage line designation is not legible~ but the two 1/2 in. sq. plates forming the reference points for the gage line are visible, and line SE42 is clearly marked above this point.
Once these two shear cracks passed near gage line SE43, they tended to relieve the stress in the concrete in the area. The eventual opening of the crack outside of the gage line rather than a crack through the line may be chance, but it is more likely related to the exact position of some piece of the reinforcement, and especially to the locations of the confinement reinforcement in the bottom flange of the beam which is
shown in Fig. 2.17. The reversals may also be indications of loss of bond between
the reinforcing bars in the splice and the concrete, although'the cracking

-48- .
that developed appeared to be related more directly to the shear forces than due to bond distress in the lap .spli~e.
Strains measured at the three gage lines at mid-depth of the web are plotted in Fig. 6.21. The strains were generally low until high loads were reached. Line S42 was especially affected by cracking in the beam-splice interface adjacent to .it, until a crack finally crossed the line.
Additional load-strain curves are plotted in Figs. 6.22 to 6.26. Line S53, Fig. 6.22, was located 70 ft south of the central pier. The discontinuity between 198 and 227 kips load is the direct result of tensile cracking about 12 in. outside the gage line d~ring application of that load increment, and an additional crack formed nearby at the next load. The large increase in strain at 290 kips, load step 9, occurred when a crack crossed the gage line. Line S63, 90 ft south, was about 5 ft from the nearest crack.
A series of curves of load versus deck tension strain are in Figs. 6.22 and 6.23. The south span had only a few negative moment cracks tn the deck, and line SlO clearly shows the occurrance of one of the cracks. There were many cracks in the deck in the north span, and line NlO was crossed by a crack. Several .cracks occurred in the deck near the north splice, but apparently none crossed the deck strain gage lines on the top surface of the deck even though there was at least one ~rack directly below line N20 on the bottom of the deck. A crack obviously passed near gage line N50, and cracks were found as far north as 74 feet at load 8, 291 kips. A crack apparently formed at N60, 90 ft north of the central pier, but it was never seen.
Compression strains in the top of the deck in the south span and in the lower flange from the central pier north are plotted versus load in Figs. 6.24 and 6.25. The south span deck strains remained small and recovered virtually to the original readings on unloading. Line S40 was inaccessible, as it was under a loading beam. The strains were far short of those required for a compression failure.

-49-
The 1 a rgest compress·i on stra ins were those near the centra 1 pi er, 1 ine S 13 and N13, on the bottom. fl ange. Aga in, th.ese were re 1 atively low s·trains· which were much smaller than the expected failure s tra in, even when the s tra ins due to pres tress and dead load are i n~· cluded. The remainder of the lower flange strains in the north span were smaller. However, the residuals rema,ining after unloading were ]arger than in the deck in the south span, indicating some locked~in stresses and moments exi'sted after unloading
The strains in the. top flange of the girder were predictably small since the gage lines were not far from the neutral axis. After
.cracking, the neutral axis rose toward the deck i.n the positiyemoment regions of the south span, and the strains remained extremely small throughout the test.
The top flange s~rains in the region subjected to negative line load moments are plotted versus load in Fig. 6.26. Cracks obviously crossed gage lines 511 and N2l, though the latter was not found on the structure. Cracks were found on both sides of line Nll . Only three cracks penetrated from the deck to the top flange in the south central pier, and another three formed on the north side. Two of these were reopening of cracks found before post~tensioning.
Strain distributions across the depth of the section for the gage lines at and on both sides of the south splice are shown in Figs. 6.27 to 6.29. In all three cases, the strain distributions are reasonably linear until the sixth load was reached, Beyond that load, the strain distributions from the middle of the web to the. top of the beam remained relatively linear, but the strains in the lower flange became extremely erratic as the shear cracking developed .
. Figure 6.30 shows strain distributions at the section 70 ft south of the central pier, at several load increments. The distributions were nearly 1 i near up to the sixth increment. Beyond tha t 1 cad, the distribution were erratic in the lower part of the beam. There were shear cracks at this section, though there was no obvious distress by
the end of the test.

7. DISCUSSION OF TEST RESULTS
7.1 General Remarks
Figures 7.1 to 7.5 contain information that may aid in the interpretation of the results of the tests. Figure 7.1 contains three different moment diagrams for one span of the test structure. The two lower curves are the best estimates of the dead load moments existing in the test structure as it was built. These diagrams are based on the average measured reactions at the end of the structure, a span of 124 ft, and on concrete having a unit weight of 145 lb/ft3, as was discussed in Sec. 6.2. One curve is for the conditions immediately after post-tensioning, and the other is for conditions at the beginning of testing a few days later. The third curve is that implied in the original design calculations,· assuming concrete at 150 lb/ft3, spans
of 125 ft, and conditions immediately after post-tensioning and removal of the temporary supports. This curve was used for part of calculations sum
marized in Chapter 2. These are not final dead load moment diagrams, as there are
expected to be decreases in the secondary moment with time as the prestressing force changes. In addition, the in-service structure would have additional dead load from curbs, handrails·, possibly span diaphragms, and an asphalt overlay over a waterproofing membrane, so that there would be a significant negative moment at the central support rather than the small positive moment existing immediately after post-tensioning.
Figure 7.2 gives the approximate distribution of stress along the length of one span, for the bottom of the deck and the top of the deck, as determined from the original design calculations, some of which are reflected in Tables 2.2 to 2.4. The stresses are those existing immediately after'
post-tensioning. Figure 7.3 gives the same information for the test structure.
Stresses were recalculated using the 124 ft span, the measured reactions~ concrete at 145 lb/ft3, and with the Young's modulus values of the-girder
-50-

-51-
and deck equal. The change in the Young's modulus of the deck is a significant change,as it increases the, effective area resisting the post-tensioning force, and increases the section modulus, resulting in lower stresses from the moment effects of the' post-tens i ani ng force and from the secondary moment and support removal forces. In addition, the change in the location of the center of gravity of the section (compare Figs. 2.1 and 3.8) by 2.1 in. results in a considerable change in the forces applied by the determinate part of the post-tensioning moment, and also changes the magnitude of the calculated secondary moment.
In view of the differences between the stresses shown in Figs. 7~2"and 7~3~ it should be clear that there are reasonable uncertainties about the actual stresses in the structure, and that the exact stresses will
"never be known. The stresses at any section are the sum of sev~ral components, and the components are 'often of comparable magnitude but with different signs, as can be seen, for example, in the summary of stresses at the bottom of the beam over the central support, as shown in Table 2.4. The stress immediately after post-tensioning is -57 lb/in. 2. A 3 percent increase"in the secondary moment caused by post-tensioning results in a small net tension at the" section, and a 3 p'ercent decrease in the secondary moment increases the stress to -116 lb/in. 2. While the actual stress increase is
insignificant, the percentage change is very large and serves to, i'llu?trate the sensitivity of the final answer to the collective precisions and uncertaintiesof the various force components contributing to the to'tal stress.
The areas of tensile stress in the bottom fiber near the central support are basically 'the result of greatly different rates of change with distance from the central support of the external dead load moment as compared to the determinate and indeterminate components of the post-tensioning moments. These tensions would be greatly diminished by the time-depe'ndent losses and th~ additional dead load existing in a completed structure. The tension stresses are of no basic concern in any event, since they occurred in an area which was adequately reinforced with deformed reinforcing bars.
Figures 7.4 and 7.5 are elastic bending moment diagrams for the live load configurations used in the final three tests. Both ,are for total
loads of 90 kips distributed to five axles, and may be scaled directly to other loads as long as the moment distributions are elastic.

-52-
Section 7.2 is concerned with the stresses at initiation of flexural cracking. The redistribution of moments that was occurring in the final test is discussed in Sec. 7.3. The strength of the structures is examined in Sec. 7.4. Sec. 7.5 contains a few recommendations for changes of details and procedures which would make construction of such a structure somewhat easier or its behavior better.
7.2 Predicted and Observed Cracking Moments
Tensile stresses at cracking can be determined only within fairly broad limits, because of both the size of load increments used and uncer
tainties about the precompression existing at any particular time. Instead, the emphasis in this sectiori is on the moments causing cracking rather than the tensile stresses, which in effect compares the computed and observed
\
values of the sum of precompression plus tensile strength rather than tensile strength alone.
Data from the two overload tests on the north span are shown in, Fig~ 7.6. The gross cracking moment is plotted versus position along the span, for two different assumptions about the t~nsile strength of the concrete. These curves were ob~ained by taking the precompression values shown in Fig. 7.3, adding the modulus of rupture, and multiplying the sum by the section modulus to' obtain the net cracking moment in excess of dead load. The dead load moment at the time of testi ng, from Fi g. 7.1, was, then added to obtain the gross cracking moment. The dead load moment is plotted in the same graph simply to give some perspective to the drawing.
The next step was to evaluate the total moments acting at various sections when cracks occurred. Since the load steps were fairly large, the load at the beginning of cracking was not precisely known. As a consequence, the moments were evaluated for the load at which a crack was found, and for the previous load step when the crack had not been discovered, to establish
bounds. These two points, for a number of cracks, have been plotted in Fig. 7.6, and connected by short vertical lines. The live load moments
were taken as elastic moments for these two tests.

-53-
The fi~st cracks were found at 16ad 44, at the junction of the splice and-' the- precast girders. ·The moments for loads 43 and 44 are plotted at 37 ft'fr6mth~ tentral pier, and show that the moment at this section corresponded to approximately 6 ~ tension at initiation of cracking .
. At most other locations, the two'moments tend to bracket the predicted cracking moments quite satisfactorily, and in no case does the maximum possible cracking moment fall below the moment computed using 6 ~ , and in many cases it appears that 7. 5 ~ is ei ther appropri a te or low.
Some of the particu'-ar cracks deserve comment. The crack'at 34 ft was the closest to the central support. ,The one at 48 ft was the closest to the central s~pport that occurred in the pretensioned end element and away from the splice. -The crack at 68 ft was the farthest from the central pier in th~ splice shear loading, and the one ,at 80 ft was the farthest fro~ the pier in the maximum positive moment loading. Each of these cracks thus represents a relatively isolated condition in which there could have been influence from other cracks only on one side, and inmost cases the adjacent cracks -were not too close.
The crack at c 51 ft was by cont~ast one that formed between cracks that'had-dccurred in th~ previous test, and while the moment is of the right magnitude', it perhaps should not be'included as the stress cbndi'tions were somewhat disturbed by the earlier cracking.
The 'moments at cracking during the loading of the south span are harder to determine, because 'there was sQme redistribution of moments going
on during the progress of the test, with the negative moment at the central pier initially lower than the elastic value and later higher, as was noted in Sec. 6.5.
The redistribution of moments in the final test is discussed in Sec. 7.3, and there are some uncertainties-which cannot be fully resolved. However, the,moments based oh the idealized reactions discussed in Sec. 7.3 were used,in evaluating the cracking'in the south span, and predicted and observed cracking moments are plotted versus position in the span in Fig. 7.7, as was done for the north span.

-54-
The agreement between computed and observed cracking moments is not as good as it was for the. north span, but it is still reasonable. The first crack at the splice was predicted well enough. The moments at first cracking in the region just south of the splice, from 40 to 75 ft south of the central pier, were all somewhat higher than predicted, and those north 0f the:splicewere slightly high.
In view of the900d agreement found in the north span, it is likely that the errors are largely in the determination of the applied moments:·' rather than in the predicted cracking moment. If-the negative moments existing in the structure were larger than assumed here, the applied positive moments would have been less than shown in Fig. 7.7,and the agreement between observations and computations would have been improved. If the north reaction alone (Fig. 6~17)had been taken as the only indicator of ' the, negative moments, they would have been slightly larger throughout the test.
The north span slab had numerous cracks due to negative moments by ,the end of the test. Figure 7.8 contains two plots of, computed cracking moment versus position in the north span. In this~case, the net cracking moment in excess of the dead ·load moment is considered. This was obtained by taking'the precompression for the top of the deck as shown in Fig. 7.3, adding the estimated modulus of rupture of the concrete, and multiplying the sum by the section modulus for stresses at the top of. the deck.
The negative live load moment diagram for this span is straight line from the maximum at the central pier to zero at the abutment. Two such lines are plotted in the figure. One is for load 68, 261 kips~ corresponding to the load which caused the first extensive cracking in the sTab. -The second is for load 71, 328 kips, the maximum load on the structure.
Load 68 caused cracking as far ,as 74 ft north of the'central pier. No cracks were predicted, but the applied moment closely appro~ched the
minimum predicted cracking moment in the area 70 to 80 ft 'north of the pier. While the numerical values were not accurately predicted, the trends were in that most of the observed cracks were either near the central pier or more than about 35 ft from the pier.

-55-
Load 71 clearly should have caused cracking nearly everywhere from the central pier to about 95 ft horth, except for an area from 5 to 30 ft north. Cracks were foun~ all the way from the pier to a point about 100 ft north of the pier.
Although the computed cracking moments were higher than the observed moments, the correlation is not too unacceptable. There are a number of possible reasons for the differences. The first is that the negative moments may have been somewhat larger than those considered in Sec. 7.3. A second factor is found in the concrete jtself. ,The section modulus for the top of the deck is extremely sensitive to the ratio of Young's modulus of deck and girder concretes. ,Small err~rs in evaluating the d~ck modulus can lead to large errors in stresses. This would affect the result twice, as the section modulus was used in evaluating the precompression due to dead load and posttensioning as shown in Fig. 7.3, and also in computing the predicted cracking moment, but at least these errors tend to compensate rather than ,add.
A third source of'~rror is in the effects of creep and ,shrinkage of the two concretes. One effect of differential creep of the older girder concrete and the much younger deck concrete is a transfer with time of some
of the initial compression from the deck to the girder, as is discussed extensively in Ref. 3. ,While this structure is slightly outsi~e the capa-bi 1 i ty of the ana 1 ys is gi ven i.n ,that reference, i t appears that as much as 200 lb/in. 2 p~ecompression could ~e lost in the few days between posttensioning and testing. This would have a large influence on the predicted cracking moment, and has not been taken into account. A 200 lb/in. 2 reduction in effect~ve stress at cracking corresponds to a change in predicted cracki ng moment almost twi ce as great as that caused by the di,fference between 6 ~ and 7. 5.~ modul us of rupture, and consequently is a very 1 arge source of potential error.
The same analysis also indicates that~the deck compression over the central support may eventually drop to about 1/3 of the initial precompression, and this aspect of the time-dependent behavior of the structure
was not taken into account in the design of the structure. As a result of this indicated change in precompression, the expected negative moment at

-56-
cracking would be considerably less in a two-year old structure than in the test specimen.
The positive moment precompression is not strongly influenced by the differential creep and shrinkage effects, and there should be no drastic change in the positive cracking moments with time.
In spite of the problems with the prediction of the negative cracking moments, the predicted and observed cracking moments were in relatively good agreement in the test structure. The use of a modulus of rupture
of 7.5 ~ gave a good indication of the positive moment cracking potential, and 6 ~ worked well for the negative moment cracking and cracking at the junctions between the precast girders and the cast-in-place splice concrete.
7.3 Redistribution of Moments During the Final Test
As was noted in Sec. 6.5, there appeared to be an appreciable change in the distribution of the live load moments during the overload test on the south span. It was also noted there that the exact magnitude of this redistribution could not be readily determined because of inconsistencies in the reaction measurements.
In order to obtain some additional information on this, the m~asured reactions were adjusted slightly to make them consistent, that is to make the deviations from the elastic reactions equal at the two abutments. This was done by simply averaging the deviations, and the results are plotted in Fig. 7.9, which may be compared with the actual measure values plotted in Fig. 6.17. The adjustments were not large, although the implications are magnifi~d by the long lever arm effective for moment at the central support. Using these reactions, live load negative moments were then computed for the section at the central pier. These moments are plotted versus live load in Fig. 7.10, along with the
straight line representing the theoretical elastic loading line. Coefficients of the negative moment, M/P where P is the total
live load, are plotted in Fig. 7.11, and the relatively steady increase in the negative moment coefficient from the beginning of the test up to

... 57-
an ~pplied load of about 260 kips is quite apparent. Above that load there were only small changes.
It must be remembered that this is only one possible interpretation of the changes in moment that occurred in the final test. Either of the measured reactions could have been correct, with all of the error in the other, and both circumstances would have led to slightly different
negativemo~ents and indications of redistribution.· However, the trends would not be different, as the me~sured reaGtions were consistent to the point of both indicating the~ame directions of deviations.
The initial low values of the negative moment are probably due to the cracking which had occurred in the north span in the previous tests. If there were positive cracks still slightly open in that span, the span would not have been as stiff as it originally had been, and it would have been. lBss able to restrain the section at the central pier. As the load increased, the additional negative moments were imposed on the north span, which would tend to close the positive moments cracks, making ·the span stiffer.and resulting in larger negative moments with increased load.
By the time 200 kips load had been applied, the south span had cracked extensively, and the two spans were then in some senses of equal stiffness again. As the load was increas~d, there was a tremendous iricrease
in the positive moment cracking in the south span, which would have lead to a considerabl~ decrease in stiffness, and a consequent increase in the negative moment, assuming that the negative moment stiffness did not degrade at the same rate at the same time.
Extensive negative moment cracking started occurring at about 260 kips load and above, and it appears that little additional redistribution of moment occurred after that load was reached. This would be the expected behavior when all sections were extensively cracked. The absolute stiffnesses of the cracked sections were much lower than the original stiffnesses,
. as indicated by the·low slope on the load-deflection curves~ but the rel~tive stiffnesses apparently were approximately the same as before cracking occurred.
The small increase in negative moment coefficient at' the final load increment may either be an accident of the deviations in the readings,

-58-
or it may be a true reflection of the damage and loss of positive moment stiffness accompanying the extensive. cracking which was occurring near the south splice.
A moment diagram is plotted in Fig. 7.12 to aid in the interpretation of the information on the observed redistribution. The static moment diagram, that is the moment diagram for a simply supported span subjected to the splice shear loading configuration, is plotted as the upper polygonal diagram. The negative moments are then superposed as the sloping straight line from the peak value'at the left to zero at the right. The positive moment for a particular negative moment is then read off as the distance from the polygon to the sloping line. Three negative moment lines are plotted; the elastic moment, the minimum moment from the initial load, and the maximum negative moment from the final load. The moments are plotted in terms of M/P, where P is the total live load applied on the five axles, and M/P has units uf inches.
There is no strong evidence of changes in the distribution of the dead load moments in the structure. The end reactions after unloading after the final test were only slightly different than at the beginning of the
tests, although there were uncertainties because of problems with zero shifts in one of the load cells that tend to mask small changes in actual reactions.
7.4 Evaluation of the Strength of the Test Structure
The structure did not fail during the loading tests, and the evaluation of the possible strength becomes crucial to understanding the behavior of the structure. Since both flexure and shear were possible modes of failure, the expected strengths in both modes must be carefully compared with the applied moments and shear forces.
Figure 7.13 contains a moment diagram for the south sp~n at maximum load, 328 kips at load 71. Both dead and applied loads are included, and the
negative moment was determined from the idealized reactions discussed in Sec. 7.3. The variation of the positive moment capacity along the span is also plotted.

-59-
The moment capacity varies along the span because of the variation in the depth of the post-tensioned reinforcement and because the remainder of the steel is not continuous for the full length of the span. The end segment contains 14 pretensioned and 42 post-tensioned 1/2-in. strands. The center module contains the 42 post-tensioned strands, which get very high in the cross section and consequently contribute little to the moment capacity as the central pier is approached,and at least 4-#9 bars.
The splice contains 4-#9 bars plus the post-tensioned strands.· The variation in the moment capacity in the region just south of the splice is complex because of the development length of the 14 pretensioned strands
and the 4-#9 bars which were terminated 6 ft 10 in. ~outh of the splice~ The exact variation of ~he moment capacity in this region cannot be determiried, but the variation shown as a broken lin~ appears to be a reasonable estimate.'
The development length of a pretensioned strand is highly variable, and is strongly influenced by the surface condition of the strand. However, a recent reinterpretation of some old test results (6) indicates the development length may be as much as 12 ft for a 1/2-in. strand stressed to: 260 k/in.2 at ultimate mo~ent.
The moment capacity for several feet just south of the splice is influenced by the bond capacity of the strand. However, the available capacity at the south edge of the splice is not affected, and that is the point where the strength and applied moment curves are closest. Ashorter development length would not have increased the capacity of the structure to resist loads applied in the test positions, although it would resul·t in somewhat smaller crack widths.
The crack patterns and widths indicated that the prestressing st~el was generally in the inelastic portion of the stress-strain curve from the splice to perhaps 65 to 70 ft south of the central pier. The stress at flexural failure at the splice was expected to be about ·260 k/in.2, and the ratio of app1i~d to ultimate momerits at the south edge of the splice
. . ? implies that the stress was about 248 k/in.~. The minimum yield stress for the steel is ab~ut 230 k/in.2, but it may reasonably be expected to be
somewhat larger (7).

-60-
The ratio of applied to ultimate moments at the point of maximum moment, 58 ft south of the central pier, implies a stress of about 234 k/in~2. This may not be larger than the actual yield stress but since it is about 80 k/in.2 above the prestress level at the beginning of the test it would account for relatively large crack widths.
At the end of the test the negative moment at the central pier was only 60 percent of the ultimate value, so the redistribution of moment from positive to negative sections which was discussed in Sec. 7.3 was clearly reasonable.
The moment diagram for the north span, which was subjected to only its dead load plus the moment at the central pier, is shown in Fig. 7.14 for the final load. Th~ negative moment capacity is also plotted for part of the span, and the shape is basically that of the post-tensioning cable profile. There were clearly no problems with the negative moment capacity during this test.
The applied negative moment is closest to the capacity in the vicinity of the north splice, and it appears that if the negative moment at the pier were increased, the section at 34 ft north, near the splice, would reach ultimate when the pier moment was about 80,800 k-tn. Consequently, a fully developed flexural failure mechanism f6r this structure would include a positive moment hinge under one of the applied loads in the south s~an and a negatlve moment hinge near the splice in the north span rather than at the central pier.
Any additional loads in the north span would reduce the negative moment at the splice, and relatively small loads would cause the critical section to be at the central pier.
Considering only flexure and ignoring possible problems with moment-rotation capacity, the failure load under the distribution of loads used in the final test was computed to be 405 kips. A positive moment hinge would form 40 ft south of the pier, under the rear-most axle load, and a negative moment hinge would form about 34 ft north of the pier.
At the end of the test, the positive moment hinge was forming, as the applied moment was about 95 percent of the ultimate moment. Considering flexure alone, the section had considerable rotation capacity remaining

-61-
since the deck strains were small and the neutral axis was still near the top of the beam web rather than about 5.5 in. from the top of the deck as would be expected at flexural failure of the section.
The expected coilapse loads for other positions of the applied loads were also investigated, considering the applied load to be a moveable vehicle with the axle spacing used in the last test, and again considering
'only flexure. The computed collapse load of 405 kips with the loads in the test position was a local minimum. Moving the vehicle small distances north or south resulted in higher co"mputed loads, because of the nature of the
variation in the positive moment capacity near the splice. The lowest collapse load, 383 kips, was found when the rear axle
load was 54 ft south of th~ central pier. The collapse mechanism included a positive moment hinge under the load located 68 ft south of the pier, and the same negative moment hinge 34 ft north of the pier.
The shear diagram for the south span in the final loading is shown in Fig. 7.15. In addition, the computed shear forces to cause shear cracking are also plotted.
There are two different initiation processes for shear cracking, and ~ach limits the sh~ar sttength i~'different parts of the beam. The iiWeb-Shear ii cracking, force, Vcw ' is cracking due to principal tension' stresses in the beam web in areas remote from any flexural cracks. The IIFlexure-Shear ll cracking force, Vci ' is closely related to flexural cracking in that the shear cracks are either extensions of or directly initiated by flexural cracks. At any section of a member, either initiation process may govern, and once a shear crack begins, the other process becomes irrelevant. Shear reinforcement is then provided for the shear force in excess of the cracking force, without consideration of which process actually started the
cracking . . Both shear concepts are included in the 1971 ACI Code (4) and are
extensively explained and documented by Olesen, Sozen and Siess (5). These concepts are not included in the 1973 AASHO Specifications (2), but their use is recognized in a footnote to Sec. 1.6.13. In this analysis, the under-strength factor, ¢, was taken as 1.0.

\ -62-
The web-shear calculation assumes sheaf cracks occur when the
principal tensile stress reaches 4 If~ at the centroidal axis of the cross section, or at the top of the beam web if the centroid is in the upper flange. Starting from a Mohr's circle analysis, the following equation can be derived, following the logic of Ref. 5:
where Ic = bw = Qc =
v = cw
Moment of inertia of composite (transformed) section, Thickness of beam web,
First moment of area of portion of composite section lying
above composite centroidal axis about that axis (see Fig. 7.16),
fh = Horizontal stress at centroid of composite section caused by prestressing force and all forces acting on noncomposite
section,
f t = 4 ~ = Tensile strength of concrete (both f~ and f t are in lb/in. 2 units in this expression, that is if
f~ = 6000 lb/in. 2 , then f t = 416000 = 310lb/in. 2),
Vd = Dead load shear force,
Ig =
Qg =
Vp =
Moment of inertia of noncomposite girder, First moment of girder area as defined in Fig. 7.16, and
Vertical component of prestressing force.
The terms within the brackets represent the total shear stress
available at cracking, ,less the dead load shear stress which is resisted
by the girder section alone. The horizontal stress, f h, varies substantially
along the length of the member as a result of the variation in dead load
stresses in the girder. It also varies in this particular structure because
of friction between the post-tensioned tendons and the ducts, and because of
the presence of the pretensioned strands only in the end segments.
The vertical component of the prestressing force is important in
part of the region between the splice and the central pier, but is' not large at other sections.

-63-
The calculations leading to Fig. 7.15 were done assuming the' deck and girder had the same values of Young's Modulus, and the as-built span and dead loads were consi~ered. The applied shear diagram was computed using the idealized negative moment at the .central pier and the actual axle loads as listed in-Table 6.7.
Reference 5 recommended that f t = 5 ~ , but·the lower value' of 4 ~ . was used as required by the ACI Code. The higher value is essentially an average, while the lower i$ a lower bound which is suitable for design.
The calculations predict web-shear cracking only in the 12 ft 1ength.of beam just south of the central pier, as can be seen in Fig~ 7.15. The .shear force exceeded the calculated cracking force by about 120 kips at the.pier, but adequate shear reinforcement was present. As shown in Fig. 6.18, there were numerous inclined cracks in the area from 1 to 10 ft. south of the pier. In the area from 10 to 20 ft south there were also numerous short cracks near the top of the beam web. These cracks were not predicted,. but seem to have caused no problems as they remained short and narrow after they formed.
where
The flexure-shear cracking force was calculated using the equation:
=
d =
Net Mer =
Effective depth than 0.8 of the
to tension reinforcement, but not less total member height,
Live load moment to cause flexural cracking, or cracking moment in excess of dead load, for a tensile stress of
6 ~, M = Live load moment at ihe section considered, and V = L ;\I"e load shear at sect; on cons i dered.
The net cracking moment varies along the span, and was computed in the process of preparing Figs. 7.2, 7.6, 7.7, and 7.8. The ratio of M/V was taken from the elastic moment and shear diagrams, since the moment distribution was essentially elastic at the time most of the shear cracking
-64-
started.· M/V is taken as positive in all cases, and has a complex variation along the span because of the abrupt changes in shear from one side to the other of each axle load.
The central term in the equation is the live load shear accompanying flexural cracking at a section d/2 away, in the direction of decreasing
moment, from the section being considered. The first term then represents the additional shear force required to cause the flexural crack to bend over and become a shear crack.
The 1971 ACI version of this equation lacks the d/2 term in the denominator of the middle term, but this is a "s implification"from the original equation, and is present in the Ref. 5 derivation. Reference 5 used 1.0'inplace of the O.~ in the first term, but again this was an average value rather than a lower bound.
Figure 7.15 shows that the calculated flexure-shear cracking force was smaller than the applied shear from 22 to 80 ft south of the central pier, except for the area between 54 and 58 ft south. In the remainder of the area between 44 and 68 ft south, the applied shear exceeds the predicted shear cracking load by onlj small amounts.
The cracking pattern shown in Fig. 6.18 is in substantial agreement with the predictions of Fig. 7.15. The last shear crack to cross the· centroidal axis is about 80 ft south. There is an inclined crack at 22 ft south, but it could not be traced across the lower flange and it is hence hard to label as a flexure-shear rather than a web-shear crack.
The failure shear force is the sum of the shear cracking force plus the contribution of the stirrups. In the regions of flexure-shear cracking, it may also be reasonably argued that the vertical component of the prestressing force can also be added to the resistance. In the webshear cracking evaluations, this component was considered in determining the shear cracking load.
The nominal contribution of the stirrups can be expressed as

where Av fy s
= = =
-65-
Area of one stirrup (two legs), Yield stress of stirrups, and Sti rrup: spaci ng.
This equation has been experimentally confirmed as a lower bound to the contribution of the web reinforcement (5). It can be derived on the
basis of assuming a shear crack with an average slope of about 45° above the beam axis. If the cracks have a lower slope, they will intersect additional stirrups, a~d the force VI will be larger than inqicated by the equatjon.
In the region near the central pier, #5 stirrups were. spaced at 12 in., as shown in Fig. 2.12. With the minimum d = 0.8h = 50~8 in., VI ~ l57,kips. Thereq~ired shear force at the critical section d/2 away from the central support was 100 kips, so the shear reinforcement was, con-, siderably'in excess of the requirement for this loa~ing. In addition, the cracks in this area had slopes,considerably 10wer.than45°,and the real
. ' . ~ . . . "
stirrup contribution would be more than the nominal calculated value.
In the region near the splice, there .is a maximllm requirement of aboui 115 k~ps from web r~inforcement~ The shear steel contribution in
, '
this ~e~ion is complex because of the extra stirrups which were added at the ends of the precast beams and in the splice, as shown in Fig. 2.16. These stirr~ps, add a great deal of capacity locally, and were ideally located to aid the beam for this particular loading posit~on.
Part,of the shear diagram, in the region from 20: to ,45 ft south of th;e central pier, is shown in Fig. 7.17 .. In addition, ,the flexure-shear cracking force and the contribution of the web steel, are shown. The actual variation in the contribution of the web steel cannot be as abrupt as it is
drawn, but 'this is a reasonable picture. The applied shear exceeds t,he computed resistance only in a very short area at 30 ft south, and the vertical component of the prestress could be credited with carrying the excess, as it amounts to over 100 kips at 30 ft, but only about 40 kips at j7.5 ft.
The app 1 i ed shear and the computed capaci ty were nea,rly the same for a short di stance 'at 43 ft south. In thi s case, evi dence of very hi gh

-60-
stirrup stresses was found, as a crack at 43 ft at mid-depth of the girder web was 0.02 in. wide at load 70, as noted in Sec. 6.5.
From the above discussion of the basic shear strength, it appears that the damage that was occurring at about 42 ft south at the end of the test, shown in Fig. 6.19, was not a consequence of general yielding of the stirrups. The damage must be related instead to local detail problems.
The state of stress in the lower part of the end segment is complex. The 4-#9 bars which extend into the splice are anchored in this region since they extend only 6 ft 10 in. into the member. The 14 pretensioned strands terminate at the end of the segment, and they are consequently anchored by bond throughout this region. The applied moment was about 95 percent of the calculated ultimate value, so the strains in all of the tension steel would have been large. Since the shear force was also high, the cracking in the lower flange can perhaps be best described as being due to large fle~ural deformations, but extensi~ely modified by shear
forces and deformations. One problem with the stirrups'u~ed in precast I-girders, as shown
in Fig. 2.13, is that they do not enclose the tension steel in the way that a U-stirrup used in a rectangular or T-girder encloses the ~teel. AU-stirrup is able to provide definite, and important, support to the steel, so that 1t can either develop doweling forces or at least not let cracks form and easily propogate approximately parallel to the tension steel. The #3 bars which were placed in the lower flange as shown in Fig. 2.17 are able to do this to some extent, but their area was inadequate and there are serious problems in anchoring them firmly enough into the upper part of the beam to be fully effective. This anchorage problem is especially severe in this case, because of interference with the ducts for the post-tensioned tendons.

-67-
7.5 Recommendations for Changes in Future Structures
From the discu~sion in the last section, it is obvious that some different details in the non-prestressed auxiliary reinforcement near the ends of the precast segments could improve the behavior of the structure unrler extremely high overloads.
Some .form of closed stirrups would have supported the bottom steel, and would have probably delayed the nearly-horizontal cracking that was developing at the end of the test. This is a difficult detailing problem, because the obvious closed stirrup forms 'would greatly interfere with the easy construction of the girders, and limit the amount of pre- , fabrication of the reinforcement cage that could be done.
The. arrangement of the lap spl iced bars in the south splice was awkward in terms of construction. The bar placement is sho~n schematically in Fig. 7.l8(a), and this effectively ,forced the end segment to be lowered
to almost exactly its correct final elevation and then be shifted sideways into the correct longitudinal alignment. A more convenient arrangement is shown in Fig. 7.l8(b), assuming that ~he central segment will be placed first, followed by the end segment. This arrangement allows the beam to be positioned laterally some distance above its final position, and then lowered directly to its temporary bearings. This is a more convenient sequence for most cranes, and the difference in bar placement has no
structural significance.
The #9 reinforcing bars which were joined by Cadweld'splices in the north joint were too close together. The equipment used for making the splices includes end-alignment fitti,ngs which are considerably larger in diameter than are the splice sleeves. At the bar spacings used (see Fig. 2.18), these fittings were installed only with great difficulty, and this added greatly to the time required for the splicing operation. This was a detailing error, and the bars should have been spaced 3.'5 in. or
further apart. Again, this is a detailing problem which would have had no influence on the behavior of the structure.
8. SUMMARY AND CONCLUSIONS
Chapters 2 and 3 of this report describe the design and construction of a prototype scale test structure of a specialized form of segmental precast concrete girders suitable for highway bridges with two spans of up to about 125 ft each. Three segments, 88, 74, and 88 ft long, were supported on three final and two temporary supports, and then joined end to end to form a continuous two span structure.
The two end segments were precast, pretensioned concrete and the central segment, which rests across the central pier of the tompleted structure, was precast, reinforced concrete. Concrete was ·cast in place to form the splices, and to form.the composite deck. ·After the composite concrete was cured, the entire structure was post-tensioned to establish the required continuity. The precast segments were designed to support their own dead loads plus the additional weight of the deck doncrete, while resting on the final pl us temporary supports. The temporary suppo-rts are removed after post-tensioning. The basic sequence is described in Chapter 1 and illustrated in Figs. 1.1 to 1.5.
The test structure, with two spans of 124 ft each, was subjected to a series of loadings simulating truck loadings. In each test, reactions,· deflections, and strains were measured at each load increment. The instrumentation, loading equipment, and test procedures are described in Chapters 4 and 5. There we~e four tests to service load levels, with an applied load of 73.6 kips in each test. These were followed by two tests to design ultimate load, 198.7 kips, and a final test in which a maximum load of
328.2 kips was reached without causing the structure to collapse. The extremely high capacity is primarily a result of the design process used,
in that the allowable stresses controlled the proportioning of all cross sections, and the accompanying ultimate moments were considerably higher
than requi red. The structure was essentially elastic during the service load
tests. The deflections were linear functions of load~ with maximum values
-68-

... 69-
of 1.05 in., and the residuals were extremely small. No cracks were found during these tests. The measured reactions also indicated elastic response.
The design ultimate load tests caused extensive flexural and shear cracking, as shown in Fig. 6.10. The flexural cracks reclosed tightly when the load was removed, while the shear cracks generally remained visible but very small. The maximum deflections were 3.5 to 3.7. in., and the residuals remaining after unloading were 0.1 to 0.25 in. Design ultimate loads were applied in positions to produce maximum shear at the north splice and maximum positive moment in the north span~
The final test was a loading to produce m~ximum shear at the south splice, and a total load of 328.2 kips, about.l .65 time~ the required design ultimate load, was reached. The maximum deflection was about 10.8 in., and the residual produced by the test was slightly over 1 in. The structure was extehsively cracked by thi~ loading, as shown in Fig. 6.18. There was some load capacity remaining when the test was ended. The remaining flexural capacity was significant, but from the appearance of the girder in the vicinity of the south splice, it appeared that a shear failure was developing. The applied moment was about 95 percent of the computed ultimate moment at the same section, and the combination of flexural ~nd
shear deformation~ pr6duced severe cracking in this region. The .test demonstrated that this structural system was a practical
alternate for the construction of highway bridge spans up to at least 125 ft. With the proper attention given to joint details, such a segmental structure can be expected to develop at least its required ultimate load capacity, and to behave as if there were no joints throughout the load
range of interest.

9. REFERENCES
1. "Standard Speci fi cati ons for Hi ghway Bri dges ," Ameri can Associ ati on of State Highway Officials, Washington, D. C., Tenth Ed., 1969, 384 p.
2. IIStandard Specifications for Highway Bridges," American Association of State Highway Officials, Washington, D. C., Eleventh Ed., 1973,469 p.
3. Fadl, A. I., and W. L. Gamble, IITime-Dependent Behavior of Noncomposite and Composite Post-Tensioned Concrete Girder Bridges,·· Civil Engineering Studies, Structural Research Series No. 430, University of Illinois at Urbana-Champaign, Oct. 1976, 377 p.
4. "Building Code Requirements for Reinforced Concrete (ACI318-7l),11 American Concrete Institute, Detroit, 1971, 78 p.
5. Olesen, S.~., M. A. Sozen, and C. P. Siess, IIInvestigation of Prestressed Reinforced Concrete for Highway Bridges, Part IV: Strength in Shear of Beams with Web Reinforcement," Univer.sity of Illinois at Urbana-Champaign, Engineering Experiment Station BUlletin No. 493, 1967, 46 p. plus illustrations and tables.
6. Martin, L. D.and N. L. Scott, IIDevelopment of Prestressing Strand in Pretensioned Members"· Proc. ACI, Vol. 73, No. 8, Aug. 1976, pp. 453-456.
7. Gamble, W. L. and A. I. Fadl, Discussion of "Recommendations for Estimating Prestress Losses"· Journal PCI, Vol. 21, No.2, March/April 1976, pp. 108-110.
-70-

TABLE 2.1 Sm~MARY OF PRETENSIONING AND POST-TENSIONING STRESSES, FORCES, AND MOMENTS
Type of Item Max. + r~om. At Splice At Central Pier Pre- Dist. from Pier 75 ft 37 ft 0
stressing II II 'Abutment 50 ft 88 ft 125 ft. before after before after before after losses losses losses losses losses losses
Pre- Eccentricity from centroid -24.14 -24.14 tensioning of non-composite section
(i n. ) Effective stress (ksi) 179 144 179 144 Effective force (kips) 387 311 387" 311
Pretensioning moment (k-in.) -9,342 -7,508 -9,342 -7,508
Post- Friction reduction factor 0·9638 0.9407 0.8952 tensioning Eccenticity from centroid -30.50 -24.00 9.45 I
of composite section (in.) -.....,J ...... I
Effective stress (ksi) 182 152 178 148 169 139 Effective force (kips) 1 ,186 991 1 ,157 962 1 ,101 906 Post-tensioning moment -36,170 -30,220 -.27,770 -23,090 10,400 8,560 (k-in. ) Secondary moment with re-spect to centroid of com-posite section (k-in.) 10,930 9,200 19,237 16, 190 27,325 23,000
Note:"before losses" refers to stresses immediately after transfer

-72-
TABLE 2.2 SUMMARY OF STRESS COMPUTATION FOR THE MAXIMUM POSITIVE MOMENT SECTION
(75 ft from central pier, 50 ft from abutment)
Stresses in girder Stresses in deck bottom top bottom top
Stresses caused by: (ksi) (ks i )
Pretensioning force -0~557 -0.557 Pretensioning moment -0.977 1 .050 Weight of girder . 0.865 -0.962
SUb-tota 1 -0.672 -0.433
Pretensioning losses 0.302 -0.097 Sub-tota 1 -0.370 -0.530
Weight of deck 0.783 -0.84D Sub-total 0.413 -1.370 0 0
Net post-tensioning force -1 .008 -1.008 -0.770 -0.770 Post-tensioning moment -2.591 0.992 0.758 1 . 122 Secondary moment 0.783 -0.300 -0.229 -0.340 Removal of temporary supports 0.407 -0. 156 -0.119 -0. 177
Sub-tota 1 -1.996 -1 .842 -0.360 -0.165
Post-tensioning losses 0.469 0.050 0.038 -0.006
Sub-tota 1 -1.527 -1.792 -0.322 -0. 171
Weight of asphalt 0.329 -0.126 -0.096 -0.143 Sub-tota 1 -1 . 198 -1 .918 -0.418 -0.314
Live load moment + impact +1.049 =0.401 =0.307 =0.455 Total -0.149 -2.319 -0.725 -0.769

TABLE 2.3 SUMMARY OF STRESS COMPUTATIONS FOR THE SECTION AT THE SPLICE (88 ft from abutment, 37 ft from central pier)
Stresses in girder (with pretensioning). (without pretensioning) bottom top bottom top
Stresses caused by: (ksi) (ksi)
Prestressing force -0.557 -0.557 Pretensioning moment -0.977 1 .050
Sub-total -1.534 0.493
Pretensioning losses 0.302 -0.097
Sub-total -1 .232 0.396 0 0
Net post-tensioning force -0.984 -0.984 -0.984 -0.984 Post-tensioning moment -0.990 0.762 -0.990 0.762 Secondary moment 1.378 -0.528 1.378 -0.528 Removal of temporary supports 0.716 -0.274 0.716 -0.274
Sub-tota 1 -2.112 -0.628 -0.880 -1.024
Post-tensioning losses 0.283 0.129 0.283 0.129
Sub-total -1.829 -0.499 -0.597 -0.895
Weight of asphalt 0.076 -0.029 0.076 -0.029 Sub-total -1.753 -0.528 -0.521 -0.924
Live load moment Positive 0.682 -0.261 0.682 -0.261 Negative -0.365 0.140 -0.365 0.140
Total (Positive) -1 .071 -0.789 0.161 -1 .185 Total (Negative) -2.118 -0.388 -0.886 -0.784
Stresses in deck
bottom top (ks i )
0 0
-0.751 -0.751 I
0.582 0.863 ~ w I
-0.404 -0.598
-0.209 -0.310
-0.782 -0.796
0.099 0.077
-0.683 -0.719
-0.022 -0.033 -0.705 -0.752
-0.199 -0.296
0.107 0.158
-0.904 -1.048
-0.598 -0.594

-74-
TABLE 2.4 SUMMARY OF STRESS COMPUTATIONS FOR THE SECTION AT CENTER SUPPORT
Stresses in girder Stresses in, deck bottom top bottom top
Stressed caused by (ks; ) (ks i )
W,eight of girder -0,'156 0.167 Weight of deck -0. 141 0.152
Sub-total -0.297 0.319 0 0
Net post-tensioning force -0.937 -0.937 -0.716 -0.716 Post-tensioning moment 0.744 -0.285 -0~218 -0.324 Secondary moment 1 .957 -0.750 -0.573 -0.850 Removal of temporary supports -1.524 0.583 0.445 0.661
Sub-total -0.057 -1.070 -1.062 '-1 .229
Post-tensioning losses -0.276 0~335 0.256 0.319
Sub-total -0.333 -0.735 -0.806 -0.910 Weight of Asphalt -0.588 0.225 0.172 0.255
Sub-.tota 1 -0.921 -0.510 -0.634 -0.655
Live Load moment -0.909 0.348 0.266 0.394
Total -1.830 -0.162 -0.368 -0.261

TABLE 2.5 SUMMARY OF DESIGN ULTIMATE MOMENTS AND SECTION CAPACITIES
Section Location Max. +M
(50 ft from abutment)
Splice Central Pier
Moments (kip-in.) caused by: Weight of precast element 8,270 0 - 1 ,490 Weight of deck 7,480 0 - 1 ,350 Removal of temporary support 5,680 10,000 -21,300 Weight of asphalt 4,560 1,060 - 8,200
Total dead load moments 25,990 11,060 -32,340 Ultimate dead load (1.5 dead load) 39,000 16,600 -48,500
Service live load moment for Full Standard Truck or Lane Loading, without impact
Postive Negative
19,250 13,000 -7,110 -17,600
Ultimate live load moments, including impact, for 7 ft beam spacing
Positive 36,770 24,830 Negative -13,580 -31 ,680
Design Ultimate Moments Positive 75,770 41 ,430
* Negative -4,580 -80,180 Ultimate Flexural Capacity (with Design material strengths) Positive 116,000 75,000 Negative -21 ,900 -86,500
*For no asphalt, 0.9 of dead load moment, live load and impact.
u '-J 01 I
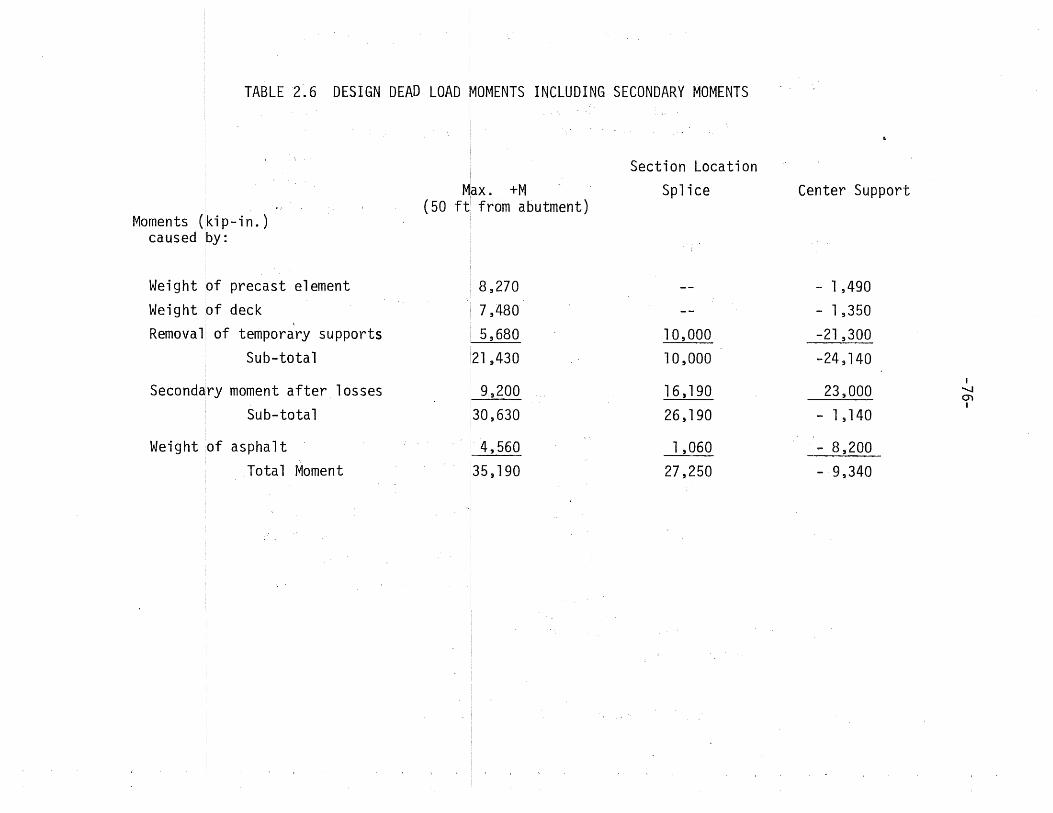
TABLE 2.6 DESIGN DEAD LOAD MOMENTS INCLUDING SECONDARY MOMENTS
Section Location Max. +M Splice Center Support
Moments (kip-in.) (50 ft from abutment)
caused by:
Weight of precast element 8,270 - 1 ,490 Weight of deck 7,480 - 1 ,350
\
Removal of temporary supports 5,680 10,000 -21,300 Sub-total 21,430 10,000 -24,140
I
Secondary moment after losses 9,200 16, 190 23,000 ......... CJ) I
Sub-total 30,630 26,190 - 1,140
Weight of asphalt 4,560 1,060 .- 8,200 Total Moment 35, 190 27,250 - 9,340

-77-
Tabl e 3.1 CONCRETE MIXES, PER CUBIC YARD
Girder and Splice .Concrete
Cement
Sand
3/4 in. crushed limestone
Added water*
Air Entraining Agent
Specified ~ir
Specified Slump
Deck Concrete
Cement
Sand
3/4 in. crushed limestone
Added water*
Air Entraining Agent
Specified Air
Specified Slump
705 1 bs
965 1 bs
1,9751bs
250 1bs
12 oz.
4 to 7 %
2 1/2 to 3 1/2 in.
611 1 bs
11201bs
2040 lbs
240 1bs
10 oz
4 to 7 %
1 1/2 to 2 1/2 in.
* Aggregates were wet, estimated w/c ratios in the range of 0.4 to 0.5.
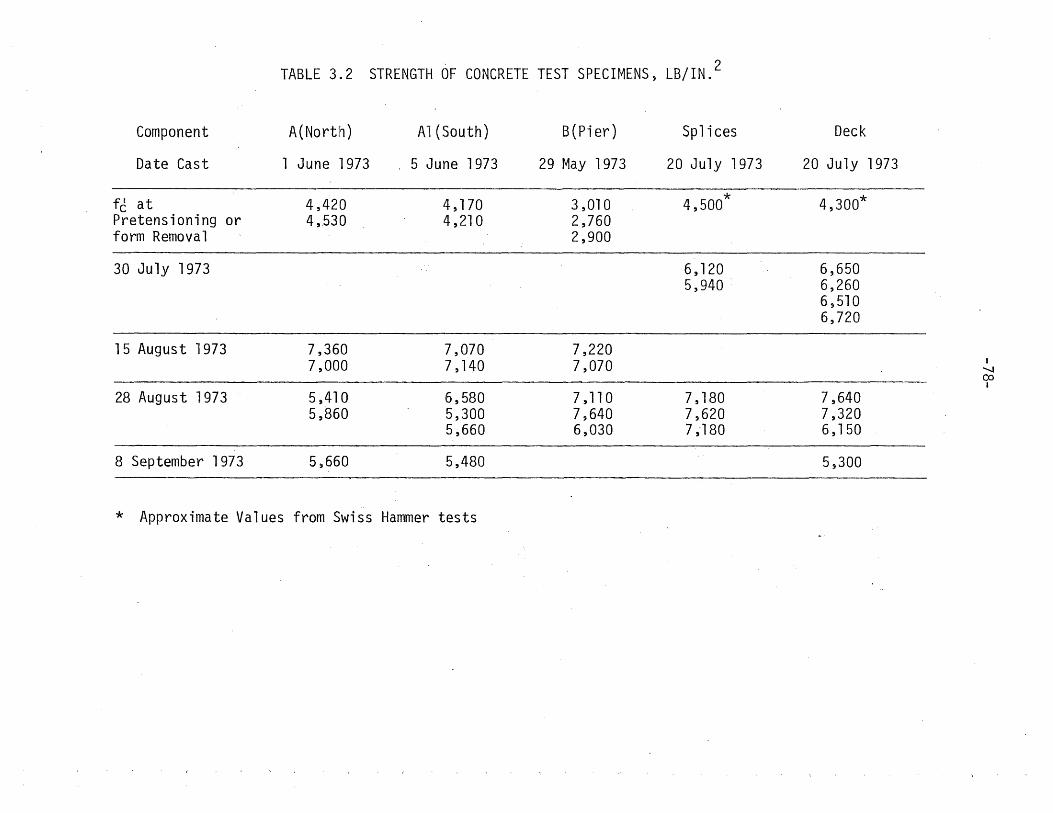
TABLE 3.2 STRENGTH OF CONCRETE TEST SPECIMENS, LB/IN.2
Component A(Nortlh) Al(South) B(Pier) Splices Deck
Date Cast 1 June 1973 5 June 1973 29 May 1973 20 July 1973 20 July 1973
fc at 4,420 4,170 3,010 4,500* 4,300* Pretensioning or 4,530 4,210 2,760 form Removal 2,900
30 July 1973 6,120 6,650 5,940 6,260
6,510 6,720
15 August 1973 7,360 7,070 7,220 7,000 7,140 7,070 I
-.......,J co I
28 August 1973 5,410 6,580 7 ,110 7,180 7,640 5,860 5,300 7,640 7,620 7,320
5,660 6,030 7,-180 6,150
8 September 1973 5,660 5,480 5,300
* Approximate Values from Swiss Hammer tests

-79-
TABLE 3.3 INITIAL YOUNG'S MODULUS VALUES FOR CONCRETE TESTS OF 28 AUGUST 1973
Component A(North) A1(South) B(Pier) Splices Deck
5.16 5.01 5.07 4.86 5.52 5.02 4.78 5.04 5.15 5.14
4.65 4.90 5.02
Average 5.09 4.81 5.00 5.01 5.33

-80-
TABLE 6.1 APPLIED LOADS, SERVICE LOAD TEST, NORTH SPAN POSITIVE MOMENT LOADING, LBS.
Rear Axle Center Axle Front Axle Total Load No. 54 ft N 68 ft N 84 ft N
1 6,260 6,550 1 ,470 14,280 2 12,930 13, 180 2,890 29,000 3 18,790 19,580 4,630 43,000 4 26,090 26,210 6,850 59,150 5 32,200 32,600 8,350 73,150
TABLE 6.2 APPLIED LOADS SERVICE LOAD TEST, NORTH SPAN SPLICE SHEAR LOADING, LBS.
Rear Axle Center Axle Front Axle Total Load No. 40 ft N 54 ft N 68 ft. N
11 6,550 6,340 1 ,660 14,550 12 13,100 12,770 3,330 29,200 13 21,070 20,220 4,910 46,200 14 26,520 25,850 6,410 58,780 15 32,520 32,120 8,310 72,950

-81-
TABLE 6.3 APPLIED LOADS, SERVICE LOAD TEST, SOUTH SPAN POSITIVE MOMENT LOADING, LBS.
Rear Axl e Center Axle Front Axle Total Load No. 54 ft S 68 ft S 84 ft S
21 6,980 5,760 1 ,660 14,400 22 12,770 12,240 3,320 28,330 23 19,350 1 9, 180 4,750 43,280 24 25,930 26,210 7,120 59,260 25 32,120 32,520 . 9,020 73,660
TABLE 6.4 APPLIED LOADS, SERVICE LOAD TEST, SOUTH SPAN-SPLICE SHEAR LOADING, LBS.
Rear Axle Center Axle Front Axle Total Load No. 40 ft S 54 ft S 68 ft S
31 6,950 6,980 1,820 15,750 32 13, 180 13,400 3,170 29,750 33 19,730 19,900 4,910 44,540 34 26,210 26,490 7,040 59,740 35 32,520 32,360 9,340 74,220

-82-
TABLE 6.5 APPLIED LOADS, DESIGN ULTIMATE LOAD TEST, NORTH SPAN SPLICE SHEAR LOADING, LBS.
Rear Axles Center Axles Front Axle Tota 1 Load No. 40 ft 44 ft 54 ft 58 ft 68 ft N
41 6030 4990 5440 5090 4480 26030 42 16270 14870 14860 14410 12370 72780 43 23450 22810 22740 22300 11950 103250 44 31620 30070 29780 29170 15020 135660 45 38720 37170 35810 35450 18180 165330 46 47150 44860 42940 44440 17770 197160
TABLE 6.6 APPLIED LOADS, DESIGN ULTIMATE LOAD TEST, NORTH SPAN POSITIVE MOMENT LOADING, LBS.
Rear Axles Center Axles Front Axle Tota 1 Load No. 54 ft 58 ft 68 ft 72 ft 84 ft N
51 11700 11700 12470 11240 3900 51010 52 19150 18990 20400 19760 8390 86690 53- 24690 24170 24850 24410 11460 109760 54 31800 31290 32620 26200 15020 136930
·55 . 37920 37140 38470 35820 18600 167950 56 47290 47480 30400 45450 23830 194450

-83-
TABLE 6.7 APPLIED LOADS~ ... OVERLOAD TEST, SOUTH SPAN SPLICE SHEAR LOAGING, LBS.
Rear Axles Center Axles Front Axle Total Load No. 40 ft 44 ft 54 ft .c 58 ft 68 ft S
61 8670 8190 8230 8310 4230 37630 62 17250 16390 16290 16370 8710 75010 63 24350 23320 22970 23240 12120 106000 64 31290 29740 29440 29860 15600 135930 65 38390 36500 36320 36640 19090 166940 66 45490 43250 42350 43260 22740 197090 67 53000 50600 47790 50210 25900 227500 68 60600 58040 55020 57160- 30130 260950 69 66700 64710 62090 64460 32620 290580 70 75460 72150 64940 71490 36610 320650 71 76370 73160 68050 72510 38100 328190

~ () w o
0:: W o a:: (!)
-.84-
w c::: :::> Iu :::> 0:::: lV)
z: o t-I
Ic:r: c::: c:r: c... w V)
w o ~ <.!'
V)
:::> o :::> z t-I
Iz o u z c:r: c... V')
I o ~ :3: w z
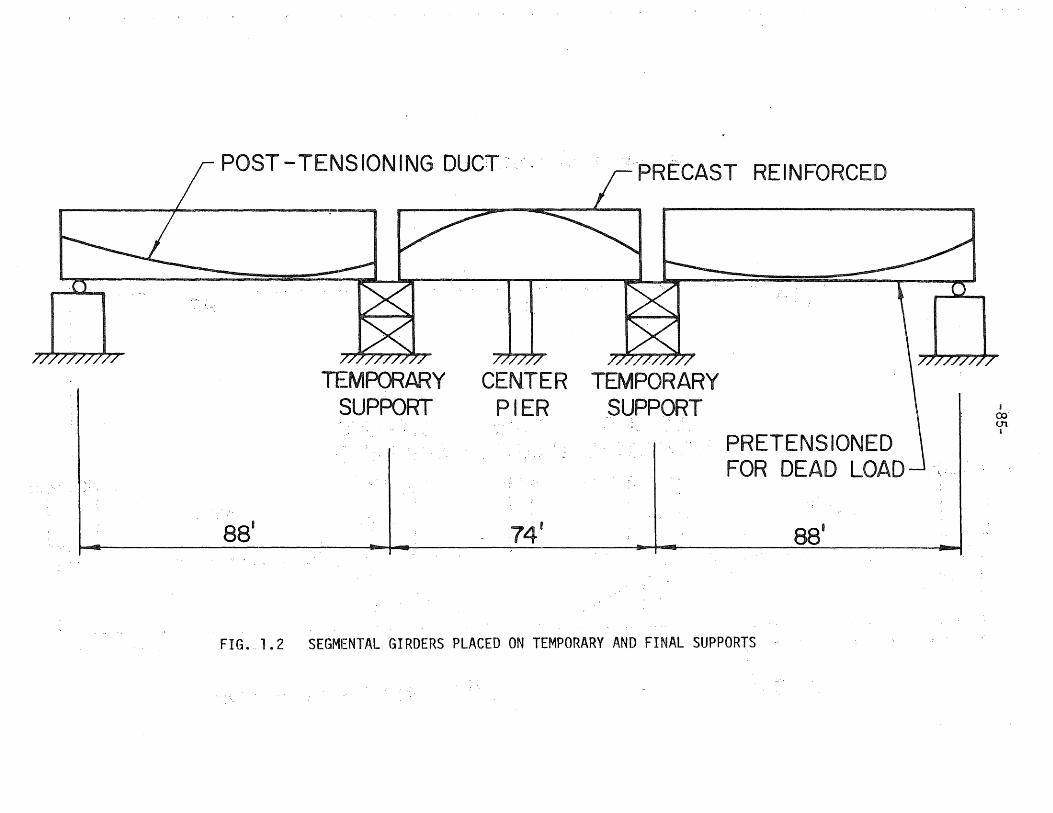
r POST-TE~JSIONING DUCT:'.
881
n::MPORARY SUPPORT
CEN.TER TEMPORARY P I ERSUPPQRT
74 1
REINFORCED
PRETENSIONED FOR DEAD LOAD
888
FIG. 1.2 SEGMENTAL GIRDERS PLACED ON TEMPORARY AND FINAL SUPPORTS
I ex)" U'1 I
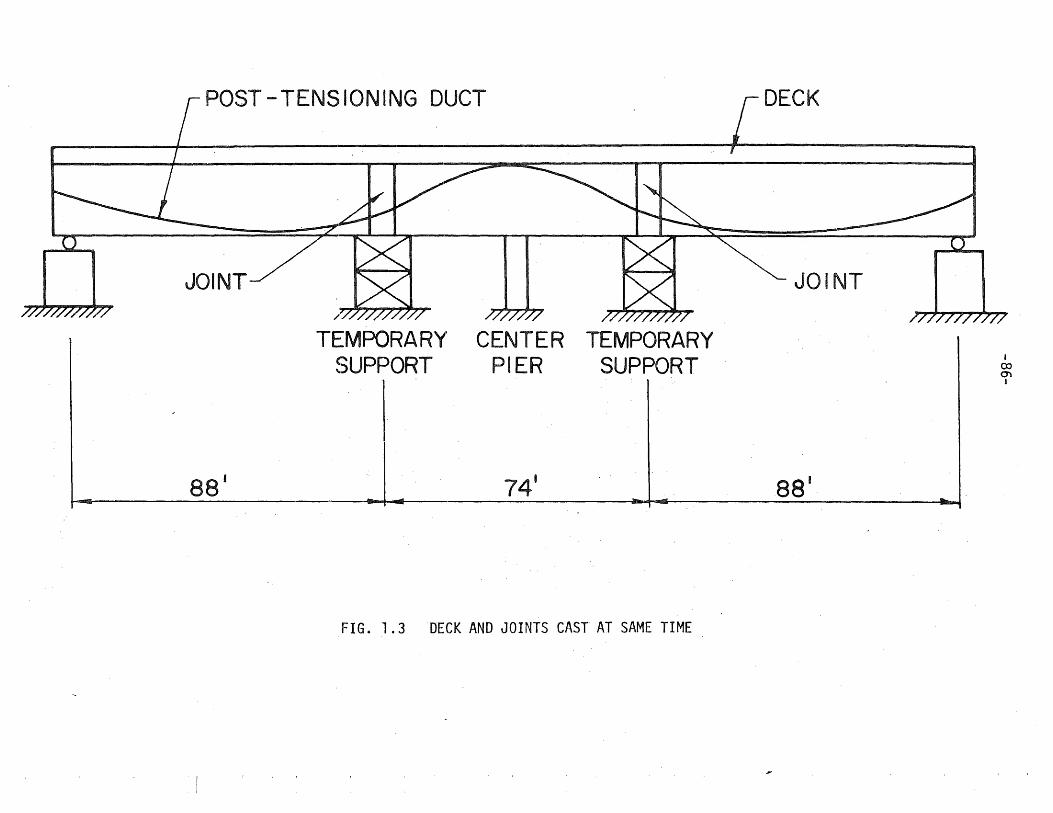
POST-TENSIONING DUCT
JOINT
TE:MPORAR'(' CENTER TEMPORARY SUPPORT PIER SUPPORT
8S' 74' -- ~
FIG. 1.3 DECK AND JOINTS CAST AT SAME TIME
DECK
JOINT
88 1
...
I ()) 0) I

ANCHORAGE
POST~:TENSION ING: TENDONS-
1251
CENTER PI-ER
DECK
1251
FIG. 1.4 ENTIRE STRUCTURE POST-TENSIONED TO ESTABLISH CONTINUITY
I 00 ""-.J I

ANCHORAGE
POST-TENSIONING TENDONS
125'
CENTER PIER
DECK
125 1
FIG. 1.5. TEMPORARY SUPPORTS REMOVED TO COMPLETE TWO-SPAN STRUCTURE
I OJ OJ I

- I Lf)
-N ..........
I
,f'-,
~ I
rj I' ;1 <D :'lC)
I
" I
I
-~
I~ r
en (\J
1
= co
-1'01
~ I
7' ,0" l I ~ 21" ,.1
/ = I ~
l()
l()
= I'f} (\J
o I c. G., of Composite Section t t
-~ tf)
I
~
= I'-
7 -l()
rO
------f--0 I C.G. of Non - Composite Precas; Girder Section '
I
I. 23" .. I
Gitder Section
A = 695 in~ , 4 I = 258, 185 in.
Composite'Sect ion E = 0 764 E deck '. girder A = 1176 in.2· I = 565,440 in.4
FIG. 2.1 CROSS-SECTION OF GIRDER AND DECK
-l()
d '¢
I (X) \.0 D.:

-90-
f' C
feu =0.85 f~
o~--~--~--~--~--~ ~ =.003 in/in
CU
FIG. 2.2 IDEALIZED STRESS-STRAIN RELATIONSHIP FOR CONCRETE
300----------------~----~--------~------~
CJ) (/) Q) ... -en
0.01 0.02
Strain
3 E s = 28 x 10 ksi
0.03 0.04 ·0.05
FIG. 2.3 ASSUMED STRESS-STRAIN RELATIONSHIP FOR PRESTRESSING STEEL
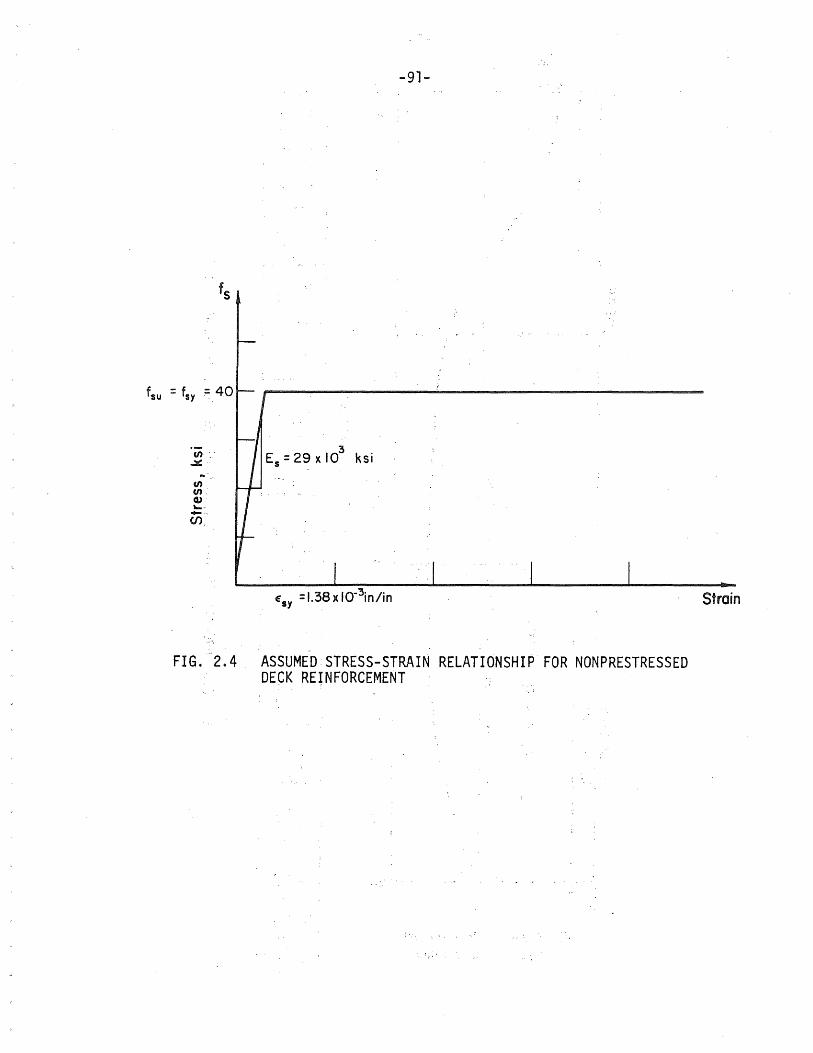
en " ,.:.::"
... en en' Q) "'---(f)
'3 Es=29x10 ksi
, f:sy = 1.38 x 10·3in/in
-91-
FIG. -2.4 ASSUMED STRESS-STRAIN RELATIONSHIP FOR NONPRESTRESSED DECK REINFORCEMENT
Strain

Splice
.... OJ
'"0
ct. Top of Deck ::::L _____ Top_ of !~der ____ ~ ___________________ ~ _______________ ~ ....
we> OJ
.s:::. .... u 0 c
E o c -.- (5 _al .s:::. O'OJ .- > OJ 0 :e.e
<{
epost. - in.
C.G.S. To . Bottom- in.
o
-13.5
27.0
___ f.~ ~omposite _Section
.-
- ---- -
I I I
C.G. of Non - C21mposite _Precast rirder Section -30.5
11 24.0"
~ 10.0"T
10 20 30 40 50 60 70 80 90
Ft From Abutment
-2 J. 2 -26.0 -28.7 -30.1 -30.5 -30. I -29.0 -26.8· -22.8 -10.5
19.3 14.5 II. 8 10.4 10.0 10.4 II. 5 13.7 17.7 30.0
--- ----
J 100 110 120 125
+2.5 . +8.9 +9.43
43.0 49.4 49.93 !
FIG. 2.5 PROFILE OF THE CENTROID OF THE POST-TENSIONING STEEL
I \D N I

Cast- in - Place Deck
Composite Beam
, Truck Load'" 111"
32 k 32 k
8k
-93:"
Temporary Supports
37'· ,~,3z' .1. Loadin Stage I
Cast-in- Place Spike Temporary Supports
I Loading Stage II
I ~
, --, /- -- ,
Temporary Support Reactions
I , Centroid of Post-Tensioning Steel
Loading Stage m I
. h "'Aspha"= 0.35 k/fl .
Composite Beam
LoadinJ Stage TIl:
Lane Load
W = 18 k for Moment = 26 k for Shear
'CJJ = 0,64 k/ft
Length and
Position as Needed
Loading Stage 1L (Live Load)
FIG~ 2.6 LOADINGS DURING VARIOUS STAGES OF CONSTRUCTION

1.381 k/ft
50'
t 9.4S"
-94-
~
I
Composit Beam
Cost-in - Place Splice
8S'
. K Temporary Support Reaction = 79.9
FIG. 2.7 MOMENT DIAGRAMS DUE TO DIFFERENT COMPONENTS OF DEAD LOAD

c I ~
0
8 ...... c Q)
E 0 :E
I - - -- _____ . ____ . . __ . ___ .____ _ __ . _____ .-l
AT --l<L JJ, A-88' 37' .1 3i 88'
~
_1 '"'"l
-35. F
-30 - ... - Non - Composite - Girders And Deck - - - .:.. - Composite - Te.mporary Support Remova I
-20
-10
+10
+20
And Asphalt Total
See Table 2.5 For Numerical Values
fIIIP /
.", dP'
.". ...... .,pi> , "'-"
. "" ----- ,/ ----~'-." " : ' ..... ,~
+30·-------------------------------------.----------------------~----.--------~~------------------.----------~
FIG. 2.8 DEAD LOAD MOMENT DiAGRAMS WITHOUT EFFECTS OF SECONDARY MOMENTS
I \.0 (J1 I

- 12,000
A Lone Loading ~I
/ -1-8,000
/ Q)
/~ .~ -c C' Q)
-4,000 Z c I ~
Centrol Pier __ i I -C Q)
o E o ~
C' c:
"'0 g C ~
4,000 Q) 'r' m
\. ~ Lone Loading / // i g ~ - jI Q) ~
8,000 .~ := cu en :> o .
Il.. -I
~--------~--------~--------~--------~--------~--------~~. 14000 o 20 40 60 80 100 125 I
Ft From Abutment
FIG. 2.9 LIVE LOAD MOMENT ENVELOPES, HS20, 7 FT BEAM SPACING, NO IMPACT

50r--,------~-----~~--------,_------~--------~------_,_,
en
" 0. - , ..311:
• ,
"'" 30 , 0 CI.) " .L:.
" U)
"'C 20~" ,. " "0f/"" i
I
0 1..0
0 ........
.J I
CI.)
::> .J
10 I
Lane
oL- '. o 20 40 60 80 100 125
Abutmenlt Central Pier
Ft From Abutment
FIG. 2. 10 LIVE LOAD SHEJ\R ENVELOPES, HS20, 7 FT BEAM SPACING, NO IMPACT
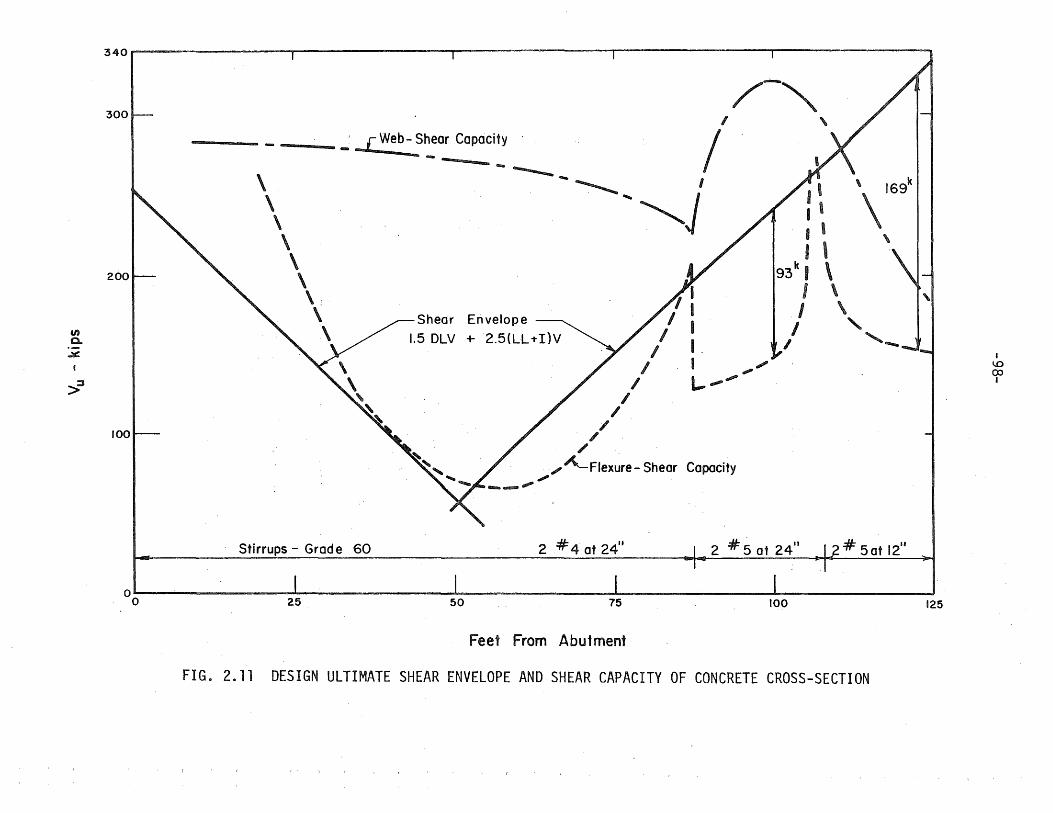
en a.
.:tI!
~
340~i--------------------r-------------------~--------------------r-------------------'--------------------,
300
200
100
/"'" I
_ [Web- S~O~COPOCitY /
-~ \ \ \ \ \ \ \' \ \
Stirrups - Grad e 60
Shear
1.5 DLV
--"". ".
- I
--- .. '-.....J
/ /
I I
/
1 I I I
I I / I .
I I ,,"-I L.. ................
/~Flexure- Shear Capacity
I ' I ' I , I ,
93k I \ I \
\ \169k
\
I \ I ,
I , .......
2#4 at 24/1 2 :/1= 5 a1 24" # 5at 12"
0' , o 25 50 75 100 125
Feet From Abufment
FIG. 2.11 DESIGN ULTIMATE SHEAR ENVELOPE AND SHEAR CAPACITY OF CONCRETE CROSS-SECTION
I 1...0 0::> I

;::
'\""' End Segment A I • I I at Middle Segment B "» .....
63.5. Top of Deck . I A fS
561 Top of Precast Girder (5611
) .. J <r 2 ~9 Bars 2 # 9 Bars Full Lenath U
4 #9 Full Lenath
. ·SpliCe
Stirrups =11= 4 at 2 ft
(54 Stirrups From II to 1071.)
4 #9 (i=60)
I
, I r .,23 ! . ~
. . . ..• . I
4 =11= 9 (Q=241) I 6 1-10"
27
20
10
C;G. of Pretensioned Steel
00 10 20 30 . 90 100 110 125
4#9 ~B
FIG. 2.12 REINFORCEMENT ARRANGEMENT~ ALONG HALF-LENGTH OF STRUCTURE
I '-0 '-0 I

~ I 7 # II f------- 7' -0" r - 5 at 12 Continuous ,
-.--_~_I ____ t ,i'Clear r-- 2
1
1" -I / r#6at9<6'-;;;-1
LO
r<)
ill
('-I
" j r--
-ill I.()
~ ... , 0
'"Clear
2-'/211
o
-(l)
-r<)
-~
r<)
~
-"Ij"
" I
r--
r--
o 1010
7
o
8- =#= 5 at gil Continuous
4 - #9 (Over Pier)
Note: Locate Deck Steel Splices so That no Longitudinal Bars Are Spliced Within 15
1
-0" of Central Pier nor Within 51-0" of Beam Splices.
=#=4 or #5 Stirrups, III Clear Cover 1
Lower End of Stirrups Bent Parallel To Beam Axis.
I.. 2311
pi
Deck Reinforcement
FIG. 2.13 ARRANGEMENT OF REINFORCEMENT IN DECK
o a I

~~I
-N
" I r--
-= lD L()
1-
I .. '
"'r.
-CD
-t(')
-~ t(')
I
0 t(')
~~l
-=r--\
; .~ ::
/
~
7' ;0" I
2111
~I
~I
-- -I o
o 0
Straiight Over End-Segments AI and A2
9 at the Splice
#4 Stirrup
rr ;]11
'l / 12 - 112" Diom. Stronds , '
I,
112" Diam. StrClnds (Each)
~ C\J
" leU/" ... \" 'lD
, . V.," -C\J
" " I
'. e' el\1 )1_ - - 1~lt lD
-v
23"'
FIG. 2.14 ARRANGEMENT OF REINFORCEMENT IN END SEGMENT AT SECTION 50 FT FROM ABUTMENT
I --' 0

L()
t<)
to
N
f'-.
= to L()
I u a
Q 0
C\JI
-v v
= C\J .........
I
to -(\j
.........
I to
en
-rrj
-~ t<) , ~
-¢ ........
I
I'-
I'- • •••
~ I
7' -;-0" 1
21
7
"I
4 - No.9 Straight Over Central Segment B
12 - 1/2" Diam. Strand
15 - I/il Diam. Strands (Each)
=#= 5 Stirrup
8~ =#= 9-L = 601
(Overlap Over Central 46')
2-lli' I-4-J ~-4-2_1/2'1
,,{,I 8 # 9 at ~-1/2" GlC,I'i" 2- 3/4 2311 ' 2-3/4
FIG. 2.15 REINFORCEMENT AT SECTION AT CENTRAL PIER
~I ~I
I
a N I

211
24" 6" #1,5 # 5 Stirru~s at 8'~ 1 24"
"#4 5 ~--------~--------~~
f
I ...
1.1.1·111 ! 1 ~ 4 :# 91 1 1 ! I I I I -I I I -'L4:#= 9
; : II I I I I I I ~ ) .
I
I I .
. ~ I· ' I' '
- I I I I I I -) I ' ....
: I 4# 9 x 10'-0" I I "
(1)'-10, Embedmen,1l \ I I I I ~ I I· (4#9 l·~ I 3811
Bar Ext. • I I I I
I I ~ I D
. I
Pretensioned End Segment ~I" ............ \l®. Precast Pier Module Beam A ' 39 Cast- in-Place Splice
Sec. I-I and 2-2 In Fig 2.'rr'
Beam B
Same) Extra Stirrup Spacing at North Splice
FIG. 2.16 ELEVATION OF REINFORCEMENT DETAILS AT SOUTH SPLICE
I --' 0 W I

21"
"01.-.1< .~~~ -,---~--
-001 0 0 i 0 ~::r
<.0 10
-r<')I........... r
-v ......... rt)
I
o rt)
-~
I I'-
-r--o 0
\L =#= 9 Bars M K 902 Extended 38" from End of Segment
-(\j
~ I
(!)
(!)
V
4-1/2" 52
2-3/4" {'7>1 23" ~2-3/4" 2-1/2" Section I-I t;j12"
End of Bea m A-I
:#= 9 Bars Extended 3811
from End of Segment
O. 0
21"
911
00
00
~ 2-1/2"
T
12- :#= 1/2" Dia. Strands
15- :#= 1/211
Dia. Strands
15- =#= 1/2" Dia. Strands
=#= 3 -12 at Each End of Each Segment at 12"Spacing
+ 2-1/2
11
2-314"-1:'1]"1 23" 1'~i-I:4" 2-1/2" Section 2-2' 2-1/2 11
End of Beam B
FIG. 2.17 SECTIONS SHOWING REINFORCEMENT ARRANGEMENT AT SOUTH SPLICE
o ~
D

-105-
C d Id SI 2 flS" 00 a we eeve, ong x - ''\ -
# 9 Bar 3"
• I
I I -3
11
I I -
21" l 8-3/4
11
I ) N l __ a" .... ,
I I 3" ,
I I 3"
Pier Module
I
ls" I . : End Segment A
~·~------'7---'/-2-'~'-----~
(a) Locations' of Cadweld Splices In Top of North Splice, Bars In Plane 5 in. Below Top of Precast Section
'\ 3"
Cadweld Sleeve , .. "'1
I
J L -2-1/2" ,
I
L # 9 Bar 5-1/2"
23 !! )in
L.5- 3/4"
I I -2- 112"
I I 3"
" -Pier Module I~ 7 1/2 :1 End Segment A
IS"
(b) Locations of Cadweld Splices In Bottom of North Splice Bars In Plane 2- 3/4 in. Above Bottom of Precast Section
FIG. 2.18 LOCATIONS OF CADWELD SpLICES IN BARS IN NORTH SPLICE
N

-106-
(a) Steel at Top of Beam
(b) Steel at Bottom of Beam
FIG. 3.1 PHOTOGRAPH SHOWING REINFORCEMENT AND CADWELD SPLICES AT NORTH SPLICE

South North 125
1
- a.. 1251-611
...--___________ S_P_I_ic_e =:J. . r-SPlice
~ ~ I Final Support \4 \.... Temporary Prop. Rnal Support ... \
. 851
-311
31-3' 361
-6" 361-6" 11-6" 87'-6"
Segment A I Segment B Segment A
124'-0" 124'-0"
Vertical Scale = 2)( Horizontal Scale
FIG. 3.2 AS-BUILT MEMBER LENGTHS AND LOCATIONS IN TEST STRUCTURE
........ a ""'-J I

-108-
FIG. 3.3 PHOTOGRAPH OF END OF BEAM SHOWING POST-TENSIONING ANCHORAGES
FIG. 3.4 PHOTOGRAPH OF POST-TENSIONING ANCHORAGE HEADS

-109-
·FiG~ 3.5 :. PHOTOGRAPH OF POST-TENSIONING JACK AND STRESSING HEAD
FIG. 3.6 PHOTOGRAPH OF POST-TENSIONING JACK PULLING CENTER TENDON

-110-
Precast Beam~
3" Thick X 9" x IS" Elastomeric Bearing Pad
Pier
~I. 124'- a" To 124' -0" To
<t Abutment <t Abutment
(a) Bearing At Central Pier Of Test Structure
FIG. 3.7 DETAILS OF BEARING DEVICES IN TEST STRUCTURE

-111-
12" or 18"
Precast Beam
Plate 2"
Roller 4"
Plate 2" 16/1
Load Cell
Plate 2"
~ 8" )pI
Abutment
-c:: QJ
E -::J ..c <!
<.:rl
to i Pier
(b) Reaction Arrangement at Abutmenfs of Test Structure
FIG. 3.7 Cont.

I~
7 -1/2" I I
5611
84"
Girder
A = 695 in~ 1 = 258,185 in.4 C. G. Composite
Composite A = 1,325 in.
2
I = 615,569 in.4 E = E
deck girder ---...,.----,-- C. G. Girder
27"
FIG. 3.8 COMPOSITE CROSS SECTION PROPERTIES WITH E . d = Ed k glr er ec
·1
42.57"
...... ...... N I

I~ 124' .\
60. '50 ' .. 40 '30'-20 ..
10 31
61 ...... 5' ... ... 41 .... ..J.. ..... .....21 II .....
62" ... 52"'; ...s 42 ...... ll. ...... 22: 12 .... J
33 ..
~ .•
63 .. i.e 53 ... f-o 43-.. ..... ... 23 13 ..... ,,4
South Abutment ~~6 Cen f ral Pier . ~ ~5"
70·
90·
f , I II( 124 ~ I 1,0 20 30 40 50 60
31
.... " 21 ..... ..,. ...... 41 -fe51' -1--61 .l.
-, ..
" . 32., · ..... 42 ~52 .... '2'- 22~ .... - ... 1-462
.' . I 33
... /3 23 ....... .e-fe ...... 43 .: .... 1«153 ... f-e63 ~, ~
Central Pier rCenter of Splice North Abutment I
70' 90·
FIG. 4.1 LOCATIONS OF MECHANICAL STRAIN GAGES LINES ALONG LENGTH OF STRUCTURE
--..I --..I
W I

I~ r !
IT~ 0 0
! 0 0 u
Q Q 0
= L.[)
r<)
lD lD I.{)
Nu of
SW 51 I
mbers for Section 70' South Centrol Pier, Looking North
SW 53 •.
SW 521
~ I
7' -;- 0" ~_ ~_ ~-----I
5 i?O ~I lUll
(] 0 u
0 () 0 Q
SE 51 -~
I !alii 15
I
I 7" .
SE52
• = N lO
I
-ru :::::: ,
(J) C\J
SE 53 I11III
~=vl
i
t
FIG. 4.2 DISTRIBUTION OF MECHANICAL STRAIN GAGE LINES ACROSS SECTION .j
~ I

i·
)/I N
t ......;> x ". M """. 11 .: x J !.
I I I I I
L 54 _ 1_ 3 5 ~J ~ 35 i ~ L 35 ~ L 351
-.L 54' ..J --'. --'
I~----'~'--~ -------, T T T -1- ~ . 01 I
FIG. 4.3 LOCATIONS OFiMEASUREMENTS OF VERTICAL DEFLECTIONS

--~]i .... N
"'--"--'--r---T--r-r--r--- 1- 1/2" Di am. Hoi es
Deck~
o 00 00 00
o 00 00 o
1_ 41' '1,I2"14~4'~~4~ "400
40' 4 10' 4' 10' 4' 12' I 41' !pI oS ~I M M I.. ~. Aol
(al Plan View Of Loading Points On Deck
----IIIla- N
[ Ii . "~~lice~! p" II II -IT 36'6": GS:lice" Jl.L7.511
• I 16 56" ,.Q,
I~ ;, oE >11'1( asl 84' 3" I~
(b) Elevation Of Beam Showing Loading Positions
FIG. 5.1 LOCATIONS OF HOLES IN DECK FOR LOADING RODS
m I

Load eel I
2 C 9 x 15
II
Nut
Washer
Piston
Bearing Plate 8 x 8 x 1/2
Rod to Jack
I... Anchor to Rock .. I
FIG. 5.2 LOADING SYSTEM USED FOR SERVICE LOAD TESTS
~
--a ........
D

Rod
Load Cell
Jack II II
- I, 'I II 'I Bearing Plate
II :' El x 8 x 1/2 II a II
" 'I II II II !I II
ti II II
II
] II I [ I ......
():) I
Loading System
FIG. 5.3 LOADING SYStEM USED FOR OVERLOAD TESTS

I , rPr.,
l_ I~
I sf Loading", System:,-
• N rp rp
I P ,~- - ---.-:- - ---, ___ ~~~- .~ 1_ _I _ ---j
86' 'I I ~ --- " I I ----797
" , _ 1_ 38 , _ 1_ 37 ,_I _ 17, _1. 14 i. 16 _L 40 _I '.
Load No. I - 5 --r- --r ~ " "'r T T - '\
FIG. 5.4 LOCATION'S OF LOADS FOR MAXIMUM POSITIVE MOMENT, NORTH SPAN SERVICE LOAD TEST
2 ~d Loading System
-----iillP'"""N 4P 4P
P
rYr I A ,,3" I ,
I 0( , : 86 ~ I_ 3 B • I • 3 7 ",~ II- .1:4 '~~ I 4 ,.,1 Co 56 _I LOCJd No. II - 15
tIG. 5.5 LOCATIONS OF LOADS FOR ~AXIMUM SPLICE SHEAR, NORTH SPAN SERVICE LOAD TEST
--'
\..0 I

4P
P
4P
3 rd Loading System
lPN
I I I I 1 7"r'T' 1
L 40 _L 16 .L 14 .J_ 16 _ L 3 8 ~ 1_ 37 ~! _ I-~--'~---I 1- ~I I ~r I
Load No. 21- 25
871
FIG. 5.6 LOCATlPNS OF LOADS FOR MAXIMUM POSITIVE MOMENT, SOUTH SPAN SERVICE LOAD TEST
L~ r~
56"
4P 14P
P
._ ............ 1._14' -I- 14' .11', Load No. 31 -35
4th Loading System
-----~JIS-N
381
+ 37' ~. 87'
FIG. 5.7 LOCATIONS OF LOADS FOR MAXIMUM SPLICE SHEAR, SOUTH SPAN SERVICE LOAD TEST
_I I
---1
N C> I

5 th Loading System
----~)D-N P I IP PI aP
l P/2
[ -- I . -~J rl-1r :-----~-.-. ,A, 3 1 1 1 1 1 I -r-;, ~ 86 .. I.. 38 lo~~ 37 ~IJiI410.141410.1' 56 -4
Load No. 41 -46
FIG. 5.8 LOCATIONS OF LOADS FOR MAXIMUM SPLICE SHEAR, NORTH SPAN DESIGN ULTIMATE LOAD TEST
--I
N
. 6th: L;oading Syst.em
-----lI ... _. N P I IP PI IP
, J t P/2.
: 1 - I -~-. .-_._-- i . , I '. J 86
1 I A I •. • 1 I 1 1 I :
t---~··-:'.I... 38 III.. 37~1 11 ~1~1 .. IO"I~I"!~"14 ···.40 .' :.1 Load No. 51-56
FIG. 5.9 LOCATIONS OF LOADS FOR MAXIMUM POSITIVE MOMENT, NORTH SPAN DESIGN ULTIMATE LOAD TEST

E CLl -V"J >.
(j)
01 .~ '"0 a o . ...1
..r::. -
z
-122-
o
l!l
!
j L() I·
I
1

80. Ii ., • li i
60
rJ)
a. ~
I \\ \~ "'0 a a
40 ...J -Theoretical
"0 tJ
a. a. <!
o~ ~\
" . -.
:: '; 1st Test
U ~)Oin. I p~ ~ Down
O' !!l .,
Deflection, in.'
FIG .. 6.1 LOAD-DEFLECTION CURVES FOR NORTH SPAN POSITIVE\MOMENT LOADING,~SERVICE LOAD TEST I .
--I
'N W I

80. r. I ! I I ! ~~T
/1
! I \\ \ J I
60
en c. ~
... "'0 0 0
40 ...J
"0 Q) r , \ ! I i
I - --.8
C. N a. ...,:::.. <r .1
20 I 11 IIIf II'
2nd Test
U I O.50Yo p oCI - own
I I ~\ , \ ,/l ; III, , I , I , I I , I , ;1 I L I I I I I I I I 0
Deflection, in.
FIG~ 6.2 LOAD-DEFLECTION CURVES FOR NORTH: SPAN SPLICE SHEAR LOADING, SERVICE LOAD TEST

rJ)
c. ~
'"'C 0 0
....J
"'0 Q) -a. 0-«
80." .:, i' Ii '" i i·
~
60
40r 5-70' / //5-35' N-35'
~oL
! 0.50 in., ~~ Down. Up I ~ i ~.
3rd Test
O. !'If .. II .. »
Defl\ection , in. i
FIG. 6.3 LOAD-DEFLECTION CURVES FOR SOUTH I SPAN POSITIVE~MOMENT LOADING, SERVICE LOAD TEST
--' N U1 I

(/)
0-
~
"0 0 0 ...J
1:) Q.) .-n a.
<l:
BOr . i i» . i til
60--
40
2°1 I l Up 4th Test
VI , II, 0
Deflection, in.
FIG •. 6.4 LOAD-DEFLECTION CURVES FOR SOUTH SPAN SPLICE SHEAR LOADING, SERVICE LOAD TEST
-.dI
N m a

-127-
60
V').
0.
..x:
"0 C 40 0 -.J
"0 Q)
0. 0. '.
<t 20
,ii Test
o~--~--~----~--~--~----~--~--~----~--~ ·,-10· o 10, 20 . 30 40
(a) Positive Mom~n.t Loading 80~--~--~----~--~--~----~~~--~----~---
60
V')
0-
..x:
"0 c 0 40 -.J
"0 Q)
0. 0. <t
20
200 Test
O~--~--~----~--~--~----~--~--~----~--~ .' .. - 10 0 ' . 10 .20 30 40
South North Abutment Reaction
(b) Sp\ ice Shear Loading . ,_.: ~ .
FIG. 6.5 LOAD-REACTION CURVES FOR NORTH SPAN SERVICE LOAD TESTS

-128-80
\ \
60 \ CJ) \ Elastic 0.. \ ~
'0 '\ 0 40 0 \ ..J
"C \ Q)
0.. 0-«
20
3rd Test
0 -10 0 10 20 30 40
(a ) Positive Moment .Loading 80
\ \
60 \ CJ) \ 0..
~ \ '"0 \ 0 0 40 \ .....I
1
"C \ Q)
0.. \ 0.. <t \
20
\ th
4- Test
o~----~--~----~--~---~-----~--~--~--~--~ -10 0 10 20 30 40
North South Abutment Reaction
( b) Spi ice Shear Loading
FIG. 6.6 LOAD-REACTION CURVES FOR SOUTH SPAN SERVICE LOAD TESTS

.." a.
..l!I::
-0 o o
. --.J
-0 .... ~
a. 0...
.<1:
200. ., i i
IElO
120
80
40
\ \ \ \ \ \ ..
\' .\
S-7O' \. \
\ \ \ ~
~
Up I_ 1.0 in. '1 5!hTeSI
• Down
O. J l!! , J If r 'f r
Deflection 1 in. FIG. 6.7 LOAD-DEFLECTION CURVES FOR NORTH SPAN SPLICE SHEAR LOADING, DESIGN ULTIMATE TEST
N \0 I

en 0-
..li!::
"8 0 -.I
"'C QJ
a. a. «
-I II I of I f~· i « I 200, I. i / /J
: / 160
120t- 5-"70'
80
40
: / /
/ ° • I
N-35 t
f 1.0 in I Up 04 'III Down 6th. Test
o B III 11 , , ! I '{ , -L---'----~_-..!. __ _..I.. __ ..J
1
Deflection, inf FIG. 6.8 LOAD-DEFLECTION CURVES FOR NORTH SPAN P~SITIVE MOMENT LOADING,DESIGN ULTIMATE TEST
w o I

-131-
150
II> 0-
..':1lt.
"0 0 100 0 -.J
"0 (L)
a. a.
c::r 50
th 5- Test
o~--~--~--~----~--~--~----~--~--~--~ -20 o 20 40 60 80
(0) Splice Shear Loading 200~---~------~----~--~--~-----~---~--~----
\ 150 \ If)
0- \ .-..::t:.
-0 \ 0 0 100 \ -.J
-0 \ (L)
a. \ ./J .0-
c::r 50 \ ./:
/
J V th J 6- Test
I -20 0 20 40 60 80
South North Abutment Reaction
( b) Positive Moment Loading
FIG. 6.9 LOAD-REACTION CURVES FOR NORTH SPAN DESIGN ULTIMATE LOAD TESTS

"...,
20
!P I P/2
25
lP
5th Test Loads
30 35
\ \-,~- ---- .. »- ) i ___ o~ _.
I I \ \ \ ~ I ( I ( 1\ 1 \ \ l \ \\ \ \ \ \ r--~ r~ .~ { y rl .. - r-lr\~J-TJ_r (T_l\f [-1 \~~_-1-:\1--J---1~~\
lP
l!!d 40
,- \"SPlice
~ P/2
lP
45
r---' 45
T- --~ - ---TO.... --.--•. - T -- I I J --I
50 55 60 65- 70- 75 80 85 90
I·····-~ T
90 95 T
110 -. 115 100
I
105
Feet North of Centrol Pier
FIG. 6.10 CRACKING IN NORTH SPAN AFTER COMPLETION OF TESTING
I
120 ~ 124
W N a

c 'I ~
..c. -'-o :z ..,; ..... LO r--.: r() -o -c w E o ~
"0 o o
...J
w :> ...J
35pOOr.----~--~----~----~--~----~----~--_T----~--~~--_r----~--~----~----~--~----~
Cracked
N-23
30,000 Test 5
25,000
20,000
15,000
f,0004091
o 0
Live Load Concrete Strain, Tension
FIG. 6.11 MOMENT-CONCRETE STRAIN CURVES FOR SECTIONS NEAR SPLICE, NORTH SPAN DESIGN ULTIMATE LOAD TESTS
...... w W I

c
~
-c Q)
E 0 ~
-0 0 0 -l
Q)
> -l
60,ooor-------~----~---r----~--ir--_,--~~---r----r---lr--~----~---r--~r---,---~----~--l
50,000
NI-53 -I
40,000
30,000r- 1/
20'OOO~ 1 ,0,00oL /I
Crack Noted
I
Test 51' Test
II ,
o Live Load Concrete Strain, Tension
N-IO
1 (Negative Moment)
FIG. 6.12 MOMENT-CONCRETE STRAIN CURVES, NORTH SPAN DESIGN ULTIMATE LOAD TESTS
I --' w ~ I

350ri--------~--------~·--------~------~--------~--------~--------~--------r--------r--------~--------~
300
250
en 200 0-
~
"'0 0 0 -1 15T ! 1
I ....., "'0 #
w U1 ,(1) I
- A
0-0-«
7th Test
2 3 4 5 6 . 7 8 9 10 II
Deflection, in.
FIG. 6.13 LOAD-DEFLECTION CURVE FOR POINT AT 70 FT SOUTH, SOUTH SPAN OVERLOAD TEST
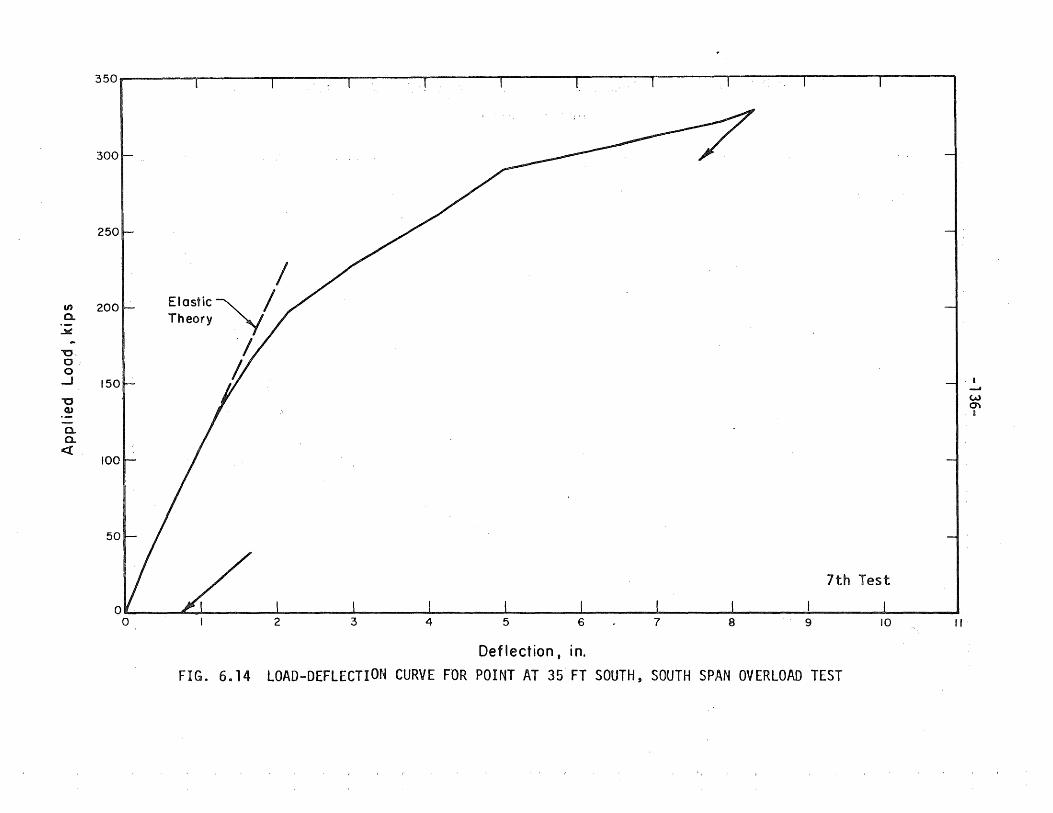
350r'------~----~--~~-r------,-------r-----~------,-------r-~---r~----~------
300
250
en 200 0-
..Jill:!
"0 o· 0
....J 15T I l~ "'0 Q,)
0-a.
<{ 100
50
7th Test
2 3 4 5 6 7 8 9 10 II·
Deflection. in.
FIG. 6.14 LOAD-DEFLECTION CURVE FOR POINT AT 35 FT SOUTH, SOUTH SPAN OVERLOAD TEST

350ri------r---~~------~~----~----_r------~~---r------.-------r-----~-------
300
250
Theory
en 200 a. .-
..:.: . "'C 0 0 -.J 15l ~. \\ 1 $ "'C Q) --a. a.
<{ 100
50
N 35 N70
7th Test 0·, I 'J I 1 J
5 4 3 2 0 5 4 3 2 o
Upward Deflection 1 In.
FIG. 6.15 LOAD-DEFLECTION CURVES FOR NORTH SPAN POINTS, SOUTH SPAN OVERLOAD TEST

-138-
lV')
w l-
e c:c o -' e:::: w > o z c:c 0.. V')
:c I::> o V')
, lL.. o Cl z: w e:::: c:c w z: w e:::: ::> Iu ::> e:::: lV')
lV')
w l-
lL.. o :c 0.. c:::r: e:::: o o lo ::c 0..

U)
a. ..lI::
"0 o o -1
"'0 Q.)
c.. a. . «
350. . I iii
Measured
150
100
50
0, , !!If" , !! I I. I
·-40 -20 0 ?O 40 60 80 100 120
North South Abutment Reaction, kips
FIG. 6.17 LOAD-REACTION CURVES FOR SOUTH SPAN OVERLOAD TEST
--' W 1..0 I

45
90
~P ~P
41 39" I 1SpIfce1
85
35
~ 124
30
I 120
25
P/2 ~
70
I
115
20
65
I 110
Feet South of Central Pier
15
I 105
~P
10 5
~p
50
-
o tPier
45
I I - - ~------.
100 95 90
FIG. 6.18 CRACK PATTERN IN SOUTH SPAN AFTER COMPLETION OF TESTING
--' ~ o I

-141-
0)
1..0
Q c:( 0 .-J
W U ...... .-J 0-(/')
:c r-:::> 0 (/')
L.L.. 0
:c r-:::> 0 (/') r-
(/') C!:I L1J Z r-...... ~ Q U c:r: c:r: 0 0::: .-J U 0:::
L1J L.L.. ::::-0 0
:c z 0- c:r: c:r: 0-0::: (/') C!:I 0 :c r- r-0 :::> :c 0 0- (/')
0)
r--
1..0
C!:I ...... L.L..

35011 T'
300
250-
U)
.9-
.x .. 200
~ ..J
~
! IOO~ 100
S 23 I S 33 II S 43
/ "-Crack Noted
! / I 1
7th Test
0.001 0.002
Concrete :Strain - Tension
FIGJ 6.20 LOAD-CONCRETE STRAIN CURV~S FOR BOTTOM GAGE LINES NEAR SOUTH SPICE, SOUTH SPAN OVERLOAD TEST
I --a
~ N B

350.---~~--~~--'--'~II~~-r~r--r--~~~~~--'-~--II--r--r~
300
250
en· LI Arock Noted .9-oX
.. ·200 -g S 22 S 32 S 42 0 ...J
"0 Q) ,soH I \ ~
I --I
0. +:t-o. w « I
100
7th Test
Concre~e Strain - Tension I •
FIG. 6.21 LOAD-CONCRETE STRAIN CURVES FOR MIDDLE GAGE LINES NEAR SOUTH SPLICE, SOUTH SPAN OVERLOAD TEST

35°1
Crack Noted 300
250 S 53· S 63
I(J)
.9-
...:IS::
.. 200
~ -..I
-0 .~ c.. 0..
<{
7th Test
or 1.1 "i o noOi n 0.901 0.002
Concrete Stra in - Tension
FIG. 6.22 LOAD-CONCRETE STRAIN CURVIES FOR SOUTH SPAN GAGE ~INES, SOUTH SPAN OVERLOAD TESTS
~ -+::a
D

350~i--------~~~--~--~T---~--~----~---r--~----T---~--~----~--~--~----~--~--~----~--~
300 1 250
(/)
.9-oX
.. 200,-
g I N 10 N 20 I N 30 I N 40 IN 50 , N 60
....J
"'0
150~ I , I I I i I
(1) ~
- ~ 0.. (J'1 0... I
<!
100
50 7th Test
0' C !II ! I , , II! " o 0.001 0 0 0 0 0
Concrete Strain - Tension
FIG. 6.23 LOAD-CONCRETE STRAIN CURVES FOR TOP OF DECK IN NORTH SPAN, SOUTH SPAN OVERLOAD TEST

350~.--~~--~~~~--~--~----~--~----~--~----~--~----~--~----~--~----~--~----~--~--~~--~
300
250 en S 60 S 50 S 20 S 13 .~ -liS:
... "§ -.J
"0 .~. Q. ISO"' a.: <{.
:.:,J.
50
7th 'Test
9~
0.001 o
Concrete Strain '- Compression
FIG. 6.24 LOAD-CONCRETE STRAIN CURVES FOR SOUTH SPAN DECK AND BOTTOM OF GIRDER AT CENTRAL PIER, SOUTH SPAN OVERLOAD TEST
--' +:a . m' I

350.~--~----r---~--~---~----~--~--·-?--~F---~--~---T--~~--~--~---T----~--~--~--~--~
300
250
en .9-oX
.. 200
~ ..J
"'0
15Q~ N 23.\ N33 \ N43\ N 53 \ N63\ 1 .~ I
- ...... Q.. ,,&::10.
a. -....;J
« I
100
50--
7th Test II I "" I' J , , , a' 0
Concre'te Strain - Compression FIG. 6 .. 25 LOAD~CONCRETE STRAIN CURVES FO'RBOTTO~1 OF NORTH SPAN GIRDER, SOUTH SPAN OVERLOAD TEST

3501~--~--~----~--~--~--~--~~--~--~--~--~--~----r---~--~--~--~----r---~--~---'
300 i • I 8 11 III
250
(f)
.9-...lII::
"'§ 200 r f S II r N I I N 21 r N 31 'N 41 N 511 N 6 I
--I
1'~H: I' I I I i ~ «
100
50
7th Test
00 0.001
Concrete Strain - Tension
FIG. 6.26 LOAD-tONCRETE STRAIN CURVES FOR TOP OF NORTH SPAN GIRDER, SOUTH SPAN OVERLOAD TEST

0 Z
Q) c:
...J
Q)
0' C
(!)
S 20 d «<1\\' , , Ii Ii
S211 ~\I
S22
Increment
Section 351-7" S. of Central Pier
North of Splice
S 231 I I \ '. '. . \ '-, "oc ..... ..... - .... ~ ...........
-800 -400 o Compress ion
400 800
Tension -6
Concrete Strain 1 10
1600
FIG. 6.27 STRAIN DISTRIBUTIONS ACROSS DEPTH OF ~~EMBER9 SECTION NORTH OF SOUTH SPLICE
2400
~
+:a 1..0 I

0 Z
Q)
c _J
(]) Q')
a t9
--,. 1'---, S 30 r-- -., <J < Ii( < (I , (( i r- ! -~ - t f. _) e r 'l ' l t '- -~ I
S31
S32
\ \,\~'" \ \ \\\~
Incrernent No. 61 234 65 66
Section 381-1-1/2
11 S. of Pier
Center of Splice
/ 70:f'/71
r~ //
s33.1 I 1 \ \ '1 h \ \ \ \ \ "\ \ 'PI
-- B(")
: _ _ 1 -400
Compression
CJ 400
Concrete
800 1200 1600 2C)OO
Tension
Strain; 10- 6
FIG. 6.28 STRAIN DISTRIBUTIONS ACROSS DEPTH OF MEMBER, SECTION IN SOUTH SPLICE
2400
--' 01 o I
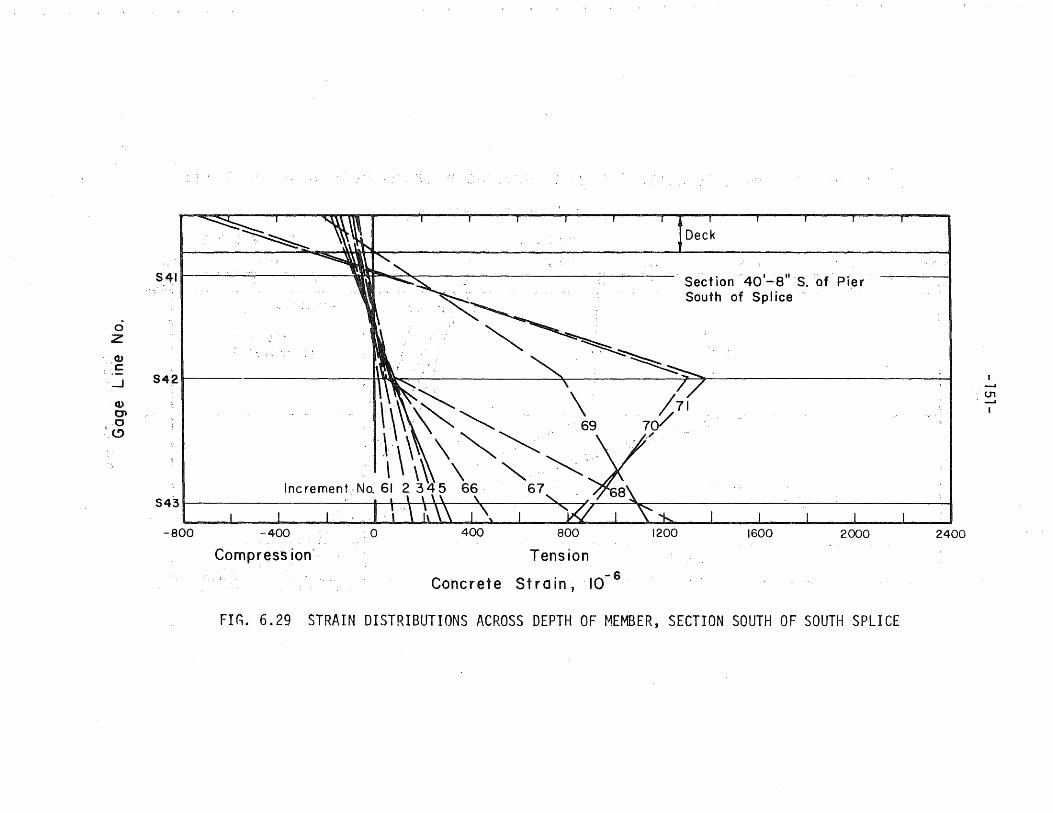
o Z
QJ c
...-I
QJ
0'1 a
(!)
S 4: 1 • l&.l'.\~' ...... Section· 401-8" ·S.of Pier
'South of Spl ice
S 431 8 \ \ ',\ '\: '...... /)'-r-----" ....... K:.:---------------'--"'----------I
-800 2400
Compress ion', Tension :-6
Concrete Strain, 10 '
FIG. 6.29 STRAIN DISTRIBUTIONS ACROSS DEPTH OF MEMBER, SECTION SOUTH OF SOUTH SPLICE
...... 01

o Z
Q) c::
-.J
Q)
Ol o
(!)
550. <<:t '" ,-, ,-, I -,- ,I i
5511 ~w...:
of
Increment
~
, ---~~ ~~:---:---
~~----,
Section 701-0" S. of
Central Pier
-.......;~----~ :::;:...,-..,
I I I I I /
70 71 I I I '
I I I
5531 \ I \ \ ~ , I t 1: \ \ I
-800 -400 o Compression
400 800
Tension -6
Concrete Strain,' 10
1200 1600 2000
FIG. 6.30 STRAIN DISTRIBUTIONS ACROSS DEPTH OF MEMBER, SECTION 70 FT SOUTH OF CENTRAL PIER
2400
U1 N I
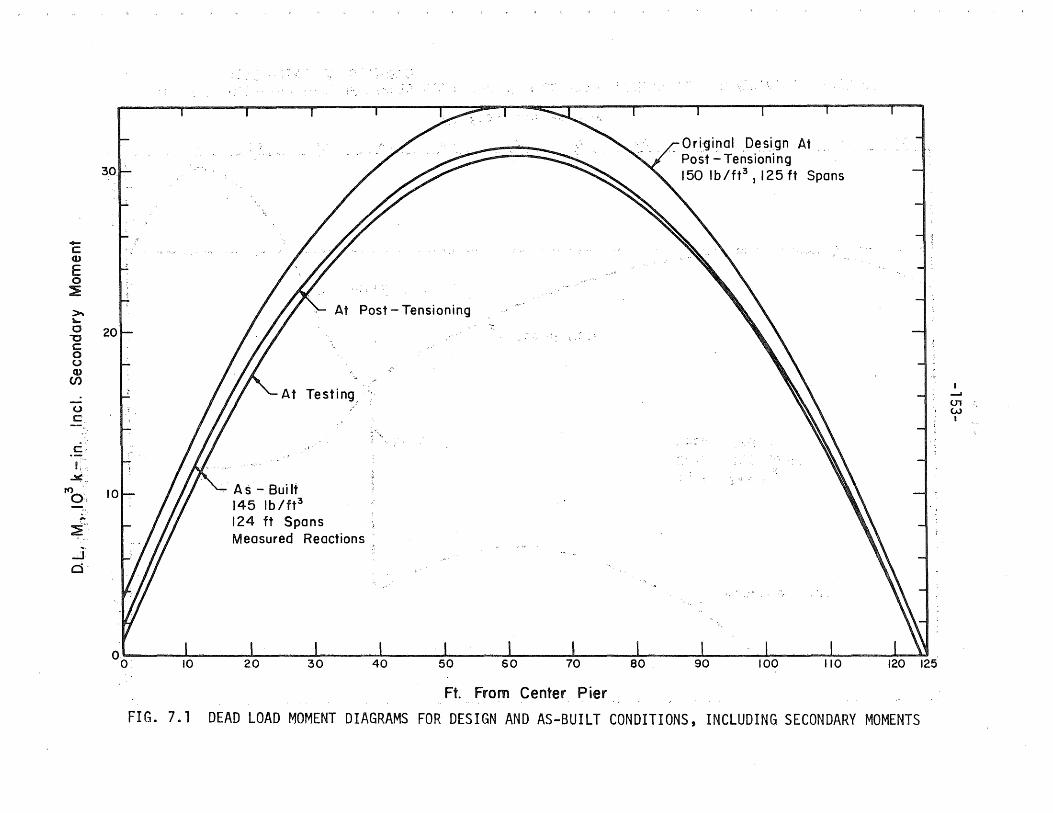
-c Q.)
E o ::E ,>" "o "0 C o o QJ en
o c
c I·
.:si.'.
rt>o:,
~ .... J O·
°0 10
At Post - Tensioning
Testing ..
•. lO
. As;... Built 145 Ib/ft! 124 ft Spans Measured Reactions
20 30 40
Ft. From Center Pier
Ori;ginal ,Desi,gn At .. Post - Tensioni ng 150 Ib/ft!, 125 ft Spans
FIG. 7.1 DEAD LOAD MOMENT DIAGRAMS FOR DESIGN AND AS-BUILT CONDITIONS, INCLUDING SECONDARY MOMENTS
~
U1 W I

N. ·C
'= ~
... C o
~c;;
en ~ a. E o o Q) ~
a..
c o
en C
~
. Top of Deck
i. I JIi
Top of Deck
!,- Bottom of Girder
Ed = 0.746 E g
Conc. = 150 Ib/ft3
Span =.125 ft
0.6 1 ~I - -L ' o 10 20 30 40 5060 70 80 90 ---. "--_---......... ---""---..11
Ft. From Center Pier
FIG. 7.2 DISTRIBUTIONS OF STRESS ALONG TOP OF DECK AND BOTTOM OF BEAM IMMEDIATELY AFTER POSTTENSIONING, AS DESIGNED
--' 01 ~
B

c .g en en f a.
2.0
. E; ,'0 'U
l'J. . ,,'C 1.0 ;', r
...liC:
'c: "0 'iii . en ".
.;"~ ·E o o
'cu "J..,.
0..
c . . g., ; en
Bottom of Girder
qf Deck
Dec.k
Eg· = Ed
Conc. = 145 Ib/ft3
Measured Reactions Spans = 124 ft
C cu.
~ 0.4~ 1'0 2'0 3~' 4'0 5'0 6~ 7~ 8~ 90 I~O 110
Ft. From Center Pier
FIG. 7.3 DISTRIBUTIONS OF STRESSES ALONG TOP OF DECK AND BOTTOM OF GIRDER IMMEDIATELY AFTER POST-TENSIONING, AS-BUILT
--' 01 01 I
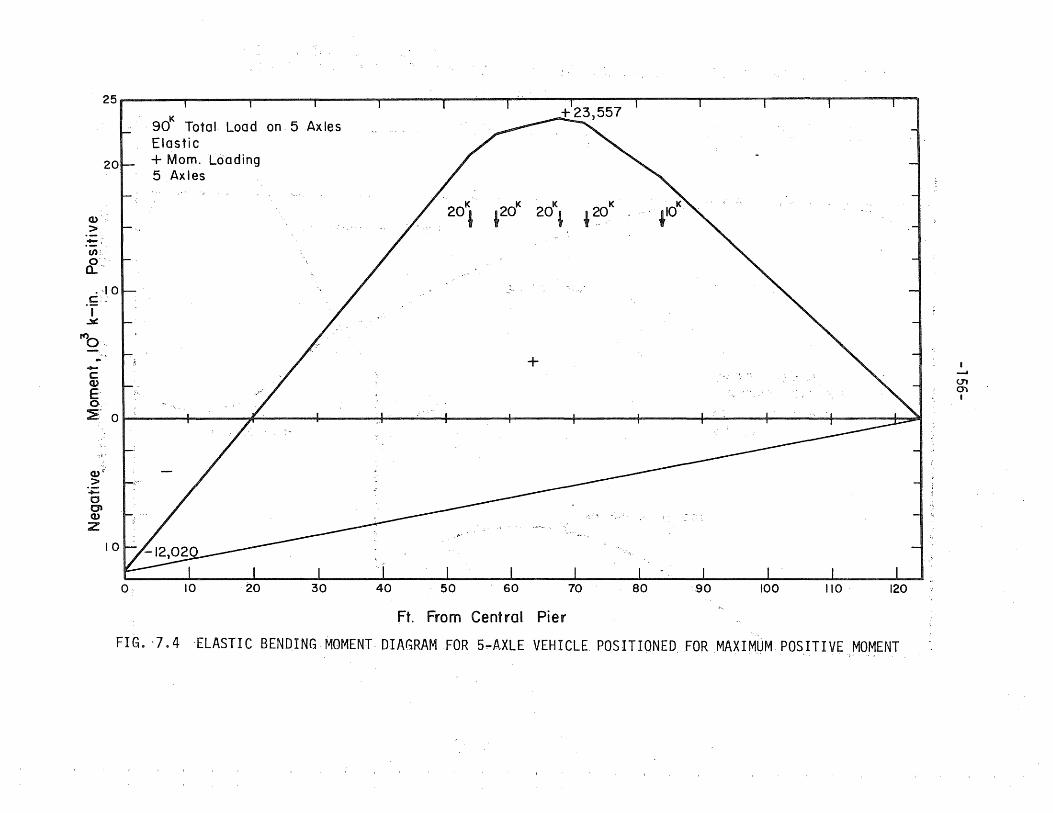
251-----~F_----~----~~----~----~------~----~~----~----_r------~----~----_,__,
(I)
> -;'
U'L
&."
20
.10 .S:,' I
..3IJ!
1'1)0
K '90 Total. Load on, 5 Axles Elastic + Mom. Loading 5 Axles
20K'20K 20K 20K
" ~ I .. ,
+
~. -4J~~~----~----~----~-----4-:~~~=====-0,. 7-(--::E' 0 I .
(I)';'
> += o en (I)
Z
10
Ft. From Central Pier
~
FIG. '7.4 ,ELASTIC BENDING MOMENT DIAGRAM FOR 5 .... AXLE VEHICLE. POSITIQNEDFORMAXIMUM POSITIVE MOMENT
0'1 Q) I

c: I ~
:,0
20
(U :> +-
en o· a..
10
; ..• - .. '
K 90 Total Load on 5 Axles
Elastic
Spli c'e Shear Loading
20K 20K I ~ ~2cf 10K
J
+
5i 1="'1 i--E .0 I
-::E 0] j
QJ. :> -a
. C7.':" '(u
Z
15.. I I , , I I I .,. .• I
o I 0 20 30 40 50 . 60· 70 ~ - - -
Ft. 'From Central Pier
FIG. 7.5 ELASTIC BENDING MOMENT DIAGRAM .FOR 5-AXLE VEHICLE POSITIONED FOR MAXIMUM SPLICE SHEAR
--' 01 '-l I

80. 46 I
46 46 ... 55 fro = 7.5,;t;
70
45 a 54
60
l 46 c: 50 I ~
If)O
-:. 40 0
! [ !l j • --.I
U1
en'· 30 ex> ----- I
V) 0 ~
(!).
20
10
00 . 20 30
Ft. North of Central Pier
FIG. 7.6 MEASURED AND COMPUTED POSITIVE CRACKING MOMENTS, NORTH SPAN

80
~ I
70 - .69
69 ...
·fr = 6~ ~. 1-
c I ~
tt)o
::; 40 ~
+ en .... ~ '\ ] I
~ (/) c:n 0 "- 30 ~
\.0
(!) I
20
Load Moment 10
o K I I , I , I , I I , I I ]I
120 110 100 90 80 70 60 50 40 30 20 10 0
Ft. South of Center Pier FIG. 7.7 MEASURED AND COMPUTED POSITIVE CRACKING MO~~ENTS, SOUTH SPAN

C
I ..ls::
rt)
o ... o ~
70. ~
60
Moment) Load 71
20
10
00 10 . ··20 30 40 50 60 I 70
'. I' . " Ft. North of Central Pier'
FIG. 7.8 LIVE LOAD NEGATIVE MOMENTS AND COMPUTED CRACkING MOMENTS IN NORTH SPAN, SOUTH SPAN OVERLOAD TEST I .
..... m o I

... "0 CD
j
-161-
-Idealized 300
Idealized
100 Support Beam
50 .
o~--~--~~~--&---~--~--~--~--~--~~~--~~~~~~--~ -40 -20 0 20 40 60 80 100 120
North. - . South
... \
FIG. 7.9 LOAD~IDEALIZED AI3UTMENT:REACTION ;CURV:E?; SOUTH SPAN OVERLOAD TEST

fI) 0-
.JII:
... "'C 0 0 -I
Q)
> :.J
0 -~
-162-
Elastic ----.I 300
250
200
150
100
50
oL-----~------~------~------~----~-------d o 10 20 30 40 50 60
3 Negative Moment At Central Pier, 10 k - in.
FIG. 7.' 0 LOAD-NEGATIVEt~OMENT CURVE FROM IDEALIZED REACTIONS, SOUTH SPAN OVERLOAD TEST

,.. a.. .......
~ I
-163-
160
Elastic
120
100
80
200 250 300
Total Live Load, kips
FIG. 7.11 LOAD-NEGATIVE MOMENT COEFFICIENT FROM IDEALIZED REACTIONS, SOUTH SPAN OVERLOAD TEST
350

C
-0 0 0
...J
0 -~ II
a.. Q) '-Q)
.s:::. ~
a.. "'-~
350. i. I I I
2P/9~ ~~2P/9-1 ~2P/9 + P/9
300
Static Moment Diagram
200
. ~_~_~_ ~1 10 20 30 40 50 60 70 80 90
Ft. From Central Pi e r
FIG" 7.12 SOUTH SPAN LIVE LOAD· MOMENT DIAGRAMS FOR FINAL TEST
--' m .,J:::Io 8

120. I~
56 Strands
100
80
+
~ Final Moment Diagram, Load 71
0 0 0 20
B , '\. I
-..I
c 1/ I r- Splice \ (j)
CJl .- J I
..liC
~
60' , I 120 110 100 90 80 70 60 50 40 30 20 10 0
Ft Sout h Of Centra I Pi e r
FIG. 7.13 APPLIED MOMENT AND MOMENT CAPACITY DIAGRAMS FOR SOUTH SPAN, LOAD 71

+
o o o
c:
...3IC
... ~
10
01 :::::iiiiiiD''''''''-- 7""MI
20 M, Load
«.,. Mu
80
Splice
100C; "0 2b ~o' '4~ 5~ 60 ;0 a'o 90 100 110 120
Ft North Of Central Pier
FIG. 7.14 VARIATION OF APPLIED MOMENT AND NEGATIVE MOMENT CAPACITY IN NORTH SPAN, LOAD 71
....... 0'1 0'1 I

«J)
a. ~
I
>
300
200
Shear Diagram At Load 71 J V
-I~- ----1
~Vci {Flexure-Shear}
01 I I
Vcw~_
30Q
L 124 120 110 100 90 80 70 60 50 40
Ft South Of Central Pier
Splic.~
,30 20 10
FIG. 7.15 VARIATION IN APPLIED SHEAR AND CONCRETE SHEAR CAPACITY IN SOLITH SPAN, LOAD 71
o
--I
en '-J I

-168-
Effective Width = Actual Width (Ed / E9 )
Cas t - In - Place Deck, Ed
....... ~-- C. G. Composite
-+-- C.G. Girder
. I
Precos( Girder, Eg
Qg = ,st Moment Of Shaded Area About C.G. Girder '. st
Qc =. J Moment Of Shaded Area Plus Deck' Area About C. G. Composite
FIG. 7.16 S'CHEMATrC REPRESENTATION OF AREAS CONSIDERED IN FIRST ~MENT COMPUTATIONS

en Co
~
I >
..... ..... ..... ......
200
300
400
Splice
45 40
-169-
35 .30 25
Ft South Of Central Pier
Applied V At Load 71
.;0 .
20 15
FI.G. 7.17 VARIATION IN APPLIED SHEAR AND SHEAR STRENGTH NEAR SOUTH SPLICE

-170-
--.......... - ..................... --~ ...... ----------_ ....... - - - .......... -----_ ...................
End Segment
# 9 Bars
- -- -- - - - - ..................................... --_ ........... _--~. 39" Splice _I
(0) . As-Built Lap Splice
- - - -- - --- - -t--............ ----.......... -
Central Segment
- ........ - ................... _ .......... - ......... - -- --- -_ ...... - - --
End Segment
:#: 9 Bars
Central Segment
- .................... ----......... ........a.- - -- ------
(b) Suggested Lap Splice Detail
FIG. 7.18 SUGGESTED CHAN,GE IN BAR ARRANGEMENT AT LAP-SPLICED JOINT