Test–retest reliability of electromyographic variables of masseter and temporal muscles in...
7
Test–retest reliability of electromyographic variables of masseter and temporal muscles in patients with cerebral palsy Lilian Chrystiane Giannasi a,b, * , Miriam Yumi Matsui a , Fabiano Politti b , Sandra Regina F Batista a , Bruna F. Caldas a , Jose ´ Benedito O. Amorim a , Luis Vicente Franco de Oliveira b , Claudia Santos Oliveira b , Monica Fernandes Gomes a a Bioscience, Sa ˜o Paulo State University ‘‘Julio de Mesquita Filho’’ – UNESP, SJC – Sa ˜o Jose ´ dos Campos, Brazil b Master’s Program in Rehabilitation Sciences, Nove de Julho University – UNINOVE, Sa ˜o Paulo, Brazil a r c h i v e s o f o r a l b i o l o g y 5 9 ( 2 0 1 4 ) 1 3 5 2 – 1 3 5 8 a r t i c l e i n f o Article history: Accepted 18 August 2014 Keywords: Cerebral palsy Electromyography Masticatory muscles Reliability a b s t r a c t Introduction: The aim of this study was to evaluate the reliability of surface electromyogra- phy of the masticatory muscles in patients with cerebral palsy. Methods: Surface electromyography was performed over the masseter and temporal mus- cles in 15 patients with cerebral palsy with the mandible at rest and during maximum clenching effort in two sessions. The data were analyzed using the root mean square amplitude, mean frequency, median frequency, zero crossings and approximate entropy. Results: In the within-day evaluations, intraclass correlation coefficients were higher (0.80– 0.98) for the all electromyography variables and muscles during maximum clenching effort. In the resting position, the coefficients revealed good to excellent reliability (0.61–0.95) for root mean square, mean frequency, median frequency and zero crossings and fair to good reliability (0.53–0.74) for approximate entropy. In the between-day evaluations, the coeffi- cients revealed good to excellent reliability (0.60–0.86) for mean frequency, median frequen- cy, zero crossings and approximate entropy. In the resting position, the coefficients revealed poor to fair reliability (0.23–0.57) for all electromyography variables studied. The root mean square had the highest standard errors during maximum clenching effort (2.37–5.91) and at rest (1.47–6.86). Conclusion: Mean frequency, median frequency and approximate entropy are the most reliable variables of surface electromyography signals of the masseter and temporal mus- cles during maximum clenching effort in individuals with cerebral palsy. These measures can be used to evaluate the function and behaviour of the masticatory muscles in this population following oral rehabilitation and surgical oral procedures as well as for the study the physiology of these muscles. # 2014 Elsevier Ltd. All rights reserved. * Corresponding author at: R Esperanc ¸a, 265, Sa ˜o Jose dos Campos, Sa ˜o Paulo 12243-700, Brazil. Tel.: +55 12 3951 0800; fax: +55 12 3951 0800. E-mail address: [email protected] (L.C. Giannasi). Available online at www.sciencedirect.com ScienceDirect journal homepage: http://www.elsevier.com/locate/aob http://dx.doi.org/10.1016/j.archoralbio.2014.08.011 0003–9969/# 2014 Elsevier Ltd. All rights reserved.
-
Upload
monica-fernandes -
Category
Documents
-
view
214 -
download
1
Transcript of Test–retest reliability of electromyographic variables of masseter and temporal muscles in...

Test–retest reliability of electromyographicvariables of masseter and temporal muscles inpatients with cerebral palsy
Lilian Chrystiane Giannasi a,b,*, Miriam Yumi Matsui a, Fabiano Politti b,Sandra Regina F Batista a, Bruna F. Caldas a, Jose Benedito O. Amorim a,Luis Vicente Franco de Oliveira b, Claudia Santos Oliveira b,Monica Fernandes Gomes a
aBioscience, Sao Paulo State University ‘‘Julio de Mesquita Filho’’ – UNESP, SJC – Sao Jose dos Campos, BrazilbMaster’s Program in Rehabilitation Sciences, Nove de Julho University – UNINOVE, Sao Paulo, Brazil
a r c h i v e s o f o r a l b i o l o g y 5 9 ( 2 0 1 4 ) 1 3 5 2 – 1 3 5 8
a r t i c l e i n f o
Article history:
Accepted 18 August 2014
Keywords:
Cerebral palsy
Electromyography
Masticatory muscles
Reliability
a b s t r a c t
Introduction: The aim of this study was to evaluate the reliability of surface electromyogra-
phy of the masticatory muscles in patients with cerebral palsy.
Methods: Surface electromyography was performed over the masseter and temporal mus-
cles in 15 patients with cerebral palsy with the mandible at rest and during maximum
clenching effort in two sessions. The data were analyzed using the root mean square
amplitude, mean frequency, median frequency, zero crossings and approximate entropy.
Results: In the within-day evaluations, intraclass correlation coefficients were higher (0.80–
0.98) for the all electromyography variables and muscles during maximum clenching effort.
In the resting position, the coefficients revealed good to excellent reliability (0.61–0.95) for
root mean square, mean frequency, median frequency and zero crossings and fair to good
reliability (0.53–0.74) for approximate entropy. In the between-day evaluations, the coeffi-
cients revealed good to excellent reliability (0.60–0.86) for mean frequency, median frequen-
cy, zero crossings and approximate entropy. In the resting position, the coefficients revealed
poor to fair reliability (0.23–0.57) for all electromyography variables studied. The root mean
square had the highest standard errors during maximum clenching effort (2.37–5.91) and at
rest (1.47–6.86).
Conclusion: Mean frequency, median frequency and approximate entropy are the most
reliable variables of surface electromyography signals of the masseter and temporal mus-
cles during maximum clenching effort in individuals with cerebral palsy. These measures
can be used to evaluate the function and behaviour of the masticatory muscles in this
population following oral rehabilitation and surgical oral procedures as well as for the study
the physiology of these muscles.
# 2014 Elsevier Ltd. All rights reserved.
* Corresponding author at: R Esperanca, 265, Sao Jose dos Campos, Sao Paulo 12243-700, Brazil. Tel.: +55 12 3951 0800; fax: +55 12 3951 0800.E-mail address: [email protected] (L.C. Giannasi).
Available online at www.sciencedirect.com
ScienceDirect
journal homepage: http://www.elsevier.com/locate/aob
http://dx.doi.org/10.1016/j.archoralbio.2014.08.0110003–9969/# 2014 Elsevier Ltd. All rights reserved.

a r c h i v e s o f o r a l b i o l o g y 5 9 ( 2 0 1 4 ) 1 3 5 2 – 1 3 5 8 1353
1. Introduction
The masticatory muscles participate in complex physiological
actions, such as chewing, swallowing, speech and other
movements that depend on a precise balance between force,
velocity and amplitude. Each muscle has a specific form and
function for effective interaction with other muscles of the
stomatognathic system.1 However, these functions are com-
promised in individuals with cerebral palsy (CP).
CP is a neuromotor disability stemming from damage to a
specific region of the brain during the prenatal, perinatal or
postnatal period and is associated with sensory and motor
dysfunctions of the orofacial region, such as dysphagia,
dysarthria, drooling and difficulty chewing.2 This irreversible
condition ranges from mild to severe. Spasticity is the most
frequent manifestation of CP and impairment can extend to
oromotor function in the form of difficulty chewing, swallow-
ing and speaking. Moreover, CP is often accompanied by
involuntary movements that compromise the bite and jaw-
opening reflexes, resulting in weakness of the masticatory
muscles and difficulty coordinating these muscles.2,3 Due the
lack of motor control, individuals with CP are more likely to
exhibit temporomandibular disorder (TMD) and parafunc-
tional oral habits, such as finger/thumb sucking and bruxism
(grinding/clenching one’s teeth).4–6 Previous studies report
that the prevalence rate of signs and symptoms of TMD ranges
from 13.3% to 67.6% in individuals with CP.5,6
Surface electromyography (EMG) has been extensively and
safely used to evaluate chewing function7–9 and assess the
efficacy of different therapies, such as global postural re-
education, fixed implant support rehabilitation and the use of
botulinum toxin-A.10–13 However, intrinsic and extrinsic factors
can influence the interpretation of EMG signals. Intrinsic
neurophysiological and anatomic factors include the pH level
in muscle fibres, blood flow, number of active motor units
during muscle contraction, shape of the intracellular action
potential, distribution of motor unit discharge rates, motor unit
synchronization and muscle fibre geometry. 14 Extrinsic factors
include the size and shape of the electrodes and placement on
the skin overlying the muscle (inter-electrode distance, location
and the orientation of detection surfaces relative to the muscle
fibres).14 Thus, in clinical studies assessing changes within the
same subject over time (inter-session evaluations), small
changes in electrode placement in relation to previous positions
may lead to measurement errors, since different electrode
locations over the same muscle provide signals with signifi-
cantly different features.15,16
Different EMG variables are used to quantify muscle
activity. The time and frequency domains have been
employed with linear methods for the evaluation of EMG
signals of the masticatory muscles. However, EMG signals are
highly complex and the mechanisms underlying the genera-
tion of such signals seem to be nonlinear or even chaotic in
nature.17–19 Indeed, a number of papers have found that
nonlinear methods of EMG analysis are more sensitive to
changes in myoelectrical signals in comparison to the linear
methods.20,21 In clinical practice, nonlinear time-series anal-
yses reveal the inherent complexity of normal variability,
indicating features of motor control that are important for
physiotherapists to measure.22 Information entropy has been
proposed as a measure of irregularity (nonlinear behaviour) in
biological signals.23–25 The measurement of entropy is
reported to be a reliable method for characterizing neuromus-
cular alterations26 and approximate entropy (ApEn) provides a
general understanding of the complexity of EMG data.26–29
In statistics, ApEn is used to establish the uncertainty or
variability of a system. ApEn calculated from EMG signals is
dependent on the variability of both amplitude and frequency
and better represents this aspect than the amplitude or
frequency alone.26 Thus, ApEn can be used to quantify the
irregularity or complexity of EMG signals of the masseter and
temporal muscles in patients with CP. The combination of
linear and nonlinear measures for the characterization and
classification of EMG signals of the masticatory muscles in
such individuals may be important to the quantification and
understanding of the neurophysiological conditions of these
muscles.
The selection of a measure for research or clinical use is
motivated by several factors, including reliability. A number of
studies have substantiated the reliability and reproducibility
of EMG in the evaluation of the masticatory muscles in healthy
individuals.30–32 However, as EMG signals are influenced by
anatomic and neurophysiological factors,14 it is not possible to
state whether the reproducibility found in healthy individuals
holds true for patients with CP due to the oromotor
abnormalities in these patients.2–6 Thus, reliability studies
are particularly important for the masticatory muscles in this
population due to the potential variation in measurements
(intrinsic factors) that can to affect the interpretation of the
findings. To the best of our knowledge, no studies have
addressed the reliability of surface EMG of the mascticatory
muscles in adults with CP or the reproducibility of nonlinear
EMG variables of the masticatory muscles. It is therefore
important to determine the variation in EMG measurements
(within-day and between-day reliability) before proposing the
use of EMG as a tool for evaluating the efficacy of therapies
administered to improve the function of the masticatory
muscles in this population.
The aim of the present study was to evaluate within-day
and between-day reliability of EMG variables of the masseter
and temporal muscles in patients with CP.
2. Methods
2.1. Subjects
Twenty-three adult patients with CP were evaluated at the
Oral Special Care Clinic of the Institute of Science and
Technology – Campus Sao Jose dos Campos/UNESP (Brazil).
Only 15 individuals with spastic diparetic CP (8 males and 7
females) met the eligibility criteria. The sample was classified
using the Gross Motor Functional Classification Scale (GMFCS):
two individuals were classified on level I; two were classified
on level II; four were classified on level III; and seven were
classified on level IV. The inclusion criteria were spastic
diparetic CP, partially preserved cognitive function (ability to
respond to verbal commands, such as ‘‘open your mouth’’,
‘‘close your mouth’’ and ‘‘clench your teeth’’) and a statement

Fig. 1 – EMG signal of the right masseter (RM), right
temporal (RT), left masseter (LM) and left temporal (LT)
muscled during maximum clenching effort. The grey band
shows three-second period selected after visual inspection
(Patient with cerebral palsy – age: 23 years; body mass:
51.4 kg). Three-second period selected through a visual
inspection of the raw data.
a r c h i v e s o f o r a l b i o l o g y 5 9 ( 2 0 1 4 ) 1 3 5 2 – 1 3 5 81354
of informed consent signed by the participant or legal guardian
agreeing to voluntary participation in the study. The exclusion
criteria were having undergone orthodontic or orthopaedic
treatment of the jaws or therapies to reduce spasticity (e.g.,
botulin toxin) in the 6 months prior to the study.
This study received approval from the local ethics
committee (process number: 25000.058696/2010-74) and the
Brazilian National Human Research Ethics Committee (CONEP
number: 007/2011). All participants/guardians were properly
informed regarding the objectives and procedures and signed
a statement of informed consent prior to testing.
2.2. Electromyography
The EMG signals were captured using an eight-channel
module (EMG System do Brasil Ltda1) consisting of a
conditioner with a band pass filter with cutoff frequencies
at 20–500 Hz, an amplifier gain of 1000 and a common mode
rejection ratio >120 dB. All data were acquired and processed
using a 16-bit analogue-to-digital converter (EMG System do
Brasil Ltda1), with a sampling frequency 2 kHz per channel.
Active bipolar electrodes with a pre-amplification gain of 20
times were used.
2.3. Procedure
The subjects visited the laboratory on two different occasions,
with a 1-week interval between visits. During the sessions, the
participants were instructed to remain seated in a chair, feet
apart, shoulders relaxed and hands resting on thighs. The
subjects were seated in a well-illuminated, silent recording
room in a comfortable upright position with eyes open and
without head support. A short training period was conducted
prior to beginning the tests to prepare the subjects for the
activities. Explanations concerning the procedures and elec-
trode placement were given and the subjects were trained to
bite as hard as possible (maximum clenching effort [MCE]).
Pre-gelled, self-adhesive, bipolar, silver–silver chloride
electrodes (MediTrace1) were positioned over the right masse-
ter (RM), left masseter (LM), right temporal (RT) and left
temporal (LT) muscles, with an inter-electrode distance of
20 mm. The sites for the electrodes were cleaned with a cotton
ball soaked in 70% alcohol to diminish impedance. Surface
electrodes were bilaterally placed according to anatomical
references and the procedures were guided by the direction of
muscle fibres at two points: anterior temporal muscle – 2 to 3 cm
superoposterior distant to the lateral corner of the eyes in the
region of greatest evidence of muscle mass, no hair, parallel to
the muscle fibres, but with the sensing surface perpendicularly
oriented; the superficial portion of masseter – 1 to 2 cm above
the gonial angle of the mandible in the region of greatest
evidence of muscle mass, with muscle fibres parallel to the
surface. A rectangular metallic electrode measuring 3 cm by
2 cm coated with Lectron II conductive gel (Pharmaceutical
Innovations1) to increase the conduction capacity and avoid
interference from external noise was attached to the left wrist of
the volunteers for reference. The evaluations were carried out at
rest and during MCE. In session 1 (test), three readings were
performed in the resting position with a 2-min interval between
readings. After an additional 3 min, three readings were
performed during MCE, with a 5-min interval between readings.
The signals were recorded for 10 s each under each condition.
The same procedures (resting position and MCE) were repeated
after a 1-week interval in session 2 (retest).
2.4. Data processing
The EMG signals were processed using specific routines
carried out in the Matlab program, version 7.1 (The Math-
Works Inc., Natick, MA, USA). For MCE, a three-second period
was selected through a visual inspection of the raw data
(Fig. 1). A moving window was used to select the EMG signals of
the RT, RM, LT and LM muscles based on the greatest
amplitude and regularity of the four muscles simultaneously.
For the resting position, the entire 10-s period of the EMG
signal was used in the analysis.
The EMG signals were analyzed using traditional linear
analyses (amplitude and frequency domain). The complexity of
the EMG signal was analyzed using approximate entropy (ApEn)
(nonlinear analysis). The amplitude of the raw EMG signal was
defined as the root mean square (RMSraw) calculated using a 200-
msmoving window. The mean amplitudeduring the 3-s and10-s
trials recorded during MCE and the resting position, respectively,
was used for analysis. The amplitude of the EMG signal during
MCE (RMSraw � MCE) was normalized by the mean amplitude of
the three EMG signals recorded during 10 s in the resting position
(RMSraw � rest) as follows: RMSMCE = RMSraw � MCE/RMSraw � rest.
This normalization procedure is an alternative for patients with
neurological disorders.33 The amplitude of the signal in the
resting position was expressed as the percentage of the mean
RMSraw � MCE recorded in the three readings, as follows:
RMSrest = (RMSraw � rest/RMSraw � MCE) � 100.
In the analysis of the frequency domain, the power spectral
density of the EMG signal was calculated using Welch’s
averaged periodogram with a Hamming window length of
2048 points. Overlap was 50% of the window length. Mean
frequency (MNF) and median frequency (MDF) of the power
a r c h i v e s o f o r a l b i o l o g y 5 9 ( 2 0 1 4 ) 1 3 5 2 – 1 3 5 8 1355
spectrum were calculated. The number of zero crossings (ZCs)
was also analyzed. The ZC rate of the signals is defined as half
the number of ZCs per second.34
ApEn was calculated to quantify the irregularity or com-
plexity of the EMG signals. This analysis returns a value
between 0 and 2, with higher values reflecting greater
irregularity within the time series.34–36 Given N points and
tolerance r, ApEn (m,r,N) is approximately equal to the negative
mean natural logarithm of the conditional probability that two
sequences similar for m points within the tolerance remain
similar at the next point. The embedding dimension (m) and
tolerance distance (r) were set to m = 2 and r = 0.20 of the
standard deviation (�SD) of the data sequence, as suggested by
Pincus (1991).
For a better understanding of the use of this index in the
analysis of the EMG signal, a number of studies have compared
entropy values between subjects with and without illness/
dysfunction37–39 and higher entropy values have been found
among in nondisabled subjects. These findings suggest that
the absence of physiological complexity is related to patholo-
gy. In other words, values near 0 indicate the presence of
illness or dysfunction and values near 2 indicate the absence
of illness or dysfunction.
2.5. Data analysis
The Shapiro–Wilk test demonstrated that the data were
normally distributed. Data on the EMG readings obtained
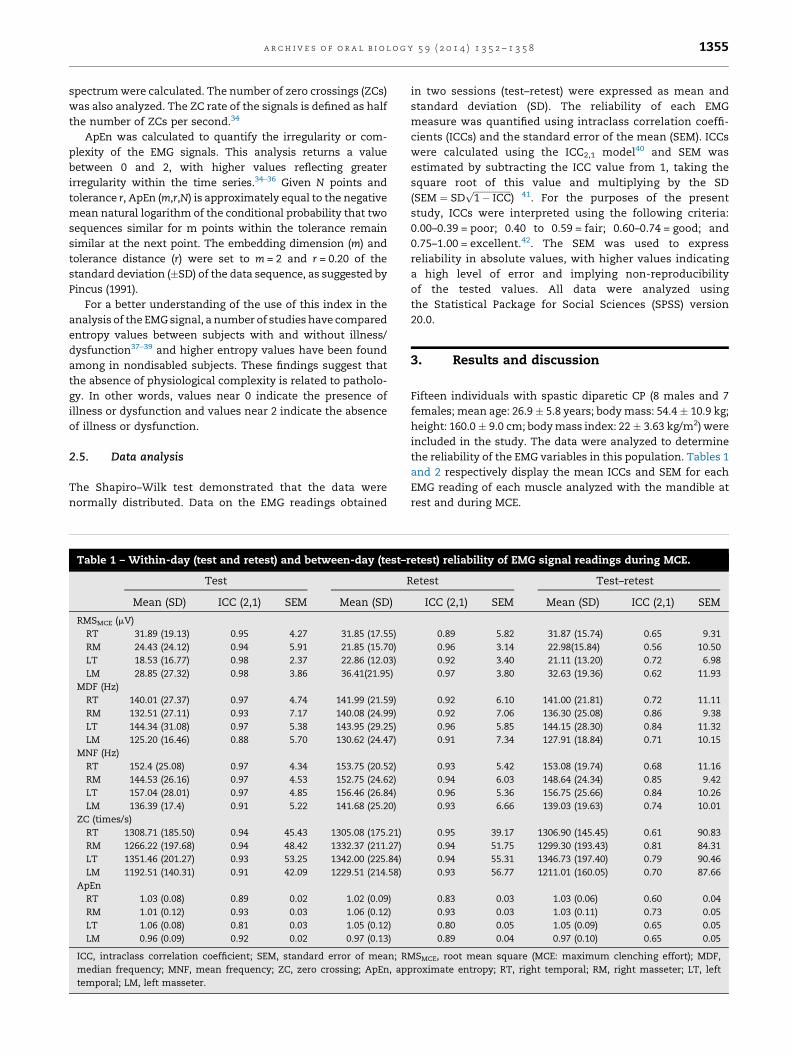
Table 1 – Within-day (test and retest) and between-day (test–r
Test R
Mean (SD) ICC (2,1) SEM Mean (SD)
RMSMCE (mV)
RT 31.89 (19.13) 0.95 4.27 31.85 (17.55)
RM 24.43 (24.12) 0.94 5.91 21.85 (15.70)
LT 18.53 (16.77) 0.98 2.37 22.86 (12.03)
LM 28.85 (27.32) 0.98 3.86 36.41(21.95)
MDF (Hz)
RT 140.01 (27.37) 0.97 4.74 141.99 (21.59)
RM 132.51 (27.11) 0.93 7.17 140.08 (24.99)
LT 144.34 (31.08) 0.97 5.38 143.95 (29.25)
LM 125.20 (16.46) 0.88 5.70 130.62 (24.47)
MNF (Hz)
RT 152.4 (25.08) 0.97 4.34 153.75 (20.52)
RM 144.53 (26.16) 0.97 4.53 152.75 (24.62)
LT 157.04 (28.01) 0.97 4.85 156.46 (26.84)
LM 136.39 (17.4) 0.91 5.22 141.68 (25.20)
ZC (times/s)
RT 1308.71 (185.50) 0.94 45.43 1305.08 (175.21)
RM 1266.22 (197.68) 0.94 48.42 1332.37 (211.27)
LT 1351.46 (201.27) 0.93 53.25 1342.00 (225.84)
LM 1192.51 (140.31) 0.91 42.09 1229.51 (214.58)
ApEn
RT 1.03 (0.08) 0.89 0.02 1.02 (0.09)
RM 1.01 (0.12) 0.93 0.03 1.06 (0.12)
LT 1.06 (0.08) 0.81 0.03 1.05 (0.12)
LM 0.96 (0.09) 0.92 0.02 0.97 (0.13)
ICC, intraclass correlation coefficient; SEM, standard error of mean; R
median frequency; MNF, mean frequency; ZC, zero crossing; ApEn, app
temporal; LM, left masseter.
in two sessions (test–retest) were expressed as mean and
standard deviation (SD). The reliability of each EMG
measure was quantified using intraclass correlation coeffi-
cients (ICCs) and the standard error of the mean (SEM). ICCs
were calculated using the ICC2,1 model40 and SEM was
estimated by subtracting the ICC value from 1, taking the
square root of this value and multiplying by the SD
(SEM ¼ SDffiffiffiffiffiffiffiffiffiffiffiffiffiffiffiffiffi
1 � ICCp
) 41. For the purposes of the present
study, ICCs were interpreted using the following criteria:
0.00–0.39 = poor; 0.40 to 0.59 = fair; 0.60–0.74 = good; and
0.75–1.00 = excellent.42. The SEM was used to express
reliability in absolute values, with higher values indicating
a high level of error and implying non-reproducibility
of the tested values. All data were analyzed using
the Statistical Package for Social Sciences (SPSS) version
20.0.
3. Results and discussion
Fifteen individuals with spastic diparetic CP (8 males and 7
females; mean age: 26.9 � 5.8 years; body mass: 54.4 � 10.9 kg;
height: 160.0 � 9.0 cm; body mass index: 22 � 3.63 kg/m2) were
included in the study. The data were analyzed to determine
the reliability of the EMG variables in this population. Tables 1
and 2 respectively display the mean ICCs and SEM for each
EMG reading of each muscle analyzed with the mandible at
rest and during MCE.
etest) reliability of EMG signal readings during MCE.
etest Test–retest
ICC (2,1) SEM Mean (SD) ICC (2,1) SEM
0.89 5.82 31.87 (15.74) 0.65 9.31
0.96 3.14 22.98(15.84) 0.56 10.50
0.92 3.40 21.11 (13.20) 0.72 6.98
0.97 3.80 32.63 (19.36) 0.62 11.93
0.92 6.10 141.00 (21.81) 0.72 11.11
0.92 7.06 136.30 (25.08) 0.86 9.38
0.96 5.85 144.15 (28.30) 0.84 11.32
0.91 7.34 127.91 (18.84) 0.71 10.15
0.93 5.42 153.08 (19.74) 0.68 11.16
0.94 6.03 148.64 (24.34) 0.85 9.42
0.96 5.36 156.75 (25.66) 0.84 10.26
0.93 6.66 139.03 (19.63) 0.74 10.01
0.95 39.17 1306.90 (145.45) 0.61 90.83
0.94 51.75 1299.30 (193.43) 0.81 84.31
0.94 55.31 1346.73 (197.40) 0.79 90.46
0.93 56.77 1211.01 (160.05) 0.70 87.66
0.83 0.03 1.03 (0.06) 0.60 0.04
0.93 0.03 1.03 (0.11) 0.73 0.05
0.80 0.05 1.05 (0.09) 0.65 0.05
0.89 0.04 0.97 (0.10) 0.65 0.05
MSMCE, root mean square (MCE: maximum clenching effort); MDF,
roximate entropy; RT, right temporal; RM, right masseter; LT, left

Table 2 – Within-day (test and retest) and between-day (test–retest) reliability of EMG signal readings in resting position.
Test Retest Test–retest
Mean (SD) ICC (2,1) SEM Mean (SD) ICC (2,1) SEM Mean (SD) ICC (2,1) SEM
RMSRest (%MCE)
RT 17.21 (18.98) 0.81 8.27 8.44 (6.59) 0.95 1.47 12.83 (10.44) 0.35 8.41
RM 11.18 (10.77) 0.69 5.99 6.15 (4.97) 0.73 2.58 8.66 (6.41) 0.34 5.19
LT 13.59 (11.00) 0.61 6.86 7.42 (5.23) 0.94 1.28 10.50 (7.32) 0.43 5.52
LM 9.36 (7.74) 0.73 4.02 5.57 (4.82) 0.75 2.41 7.47 (5.38) 0.46 3.95
MDF (Hz)
RT 98.17 (32.04) 0.81 13.96 99.64 (27.86) 0.80 12.45 98.91 (24.68) 0.52 17.09
RM 126.09 (31.22) 0.63 18.99 118.38 (33.22) 0.80 14.85 122.23 (28.54) 0.56 18.93
LT 109.89 (35.34) 0.81 15.40 96.67 (28.8) 0.90 9.10 103.28 (27.47) 0.57 18.01
LM 108.50 (21.89) 0.65 12.95 115.89 (26.92) 0.77 12.91 112.20 (19.04) 0.39 14.87
MNF (Hz)
RT 121.32 (29.20) 0.62 18.00 120.66 (32.13) 0.84 12.85 120.99 (22.96) 0.36 18.36
RM 156.38 (35.56) 0.76 17.42 141.08 (25.59) 0.77 12.27 148.73 (25.81) 0.27 22.05
LT 137.99 (34.12) 0.70 18.68 117.81 (31.81) 0.93 8.41 127.90 (26.91) 0.45 19.95
LM 133.39 (24.81) 0.69 13.81 138.10 (23.36) 0.73 12.13 135.75 (18.18) 0.35 14.65
ZC (times/s)
RT 2663.06 (707.81) 0.69 394.09 2586.35 (456.45) 0.80 204.13 2624.71 (424.22) 0.30 354.92
RM 3454.15 (700.57) 0.71 377.26 3260.06 (397.32) 0.74 202.59 3357.11 (447.29) 0.44 334.72
LT 3006.77 (693.14) 0.66 404.16 2677.84 (565.17) 0.93 149.52 2842.31 (449.45) 0.29 378.71
LM 2892.35 (502.87) 0.69 279.98 2998.60 (442.51) 0.80 197.89 2945.47 (379,96) 0.44 284.33
ApEn
RT 1.16 (0.34) 0.68 0.19 1.22 (0.23) 0.53 0.15 1.19 (0.21) 0.29 0.17
RM 1.17 (0.26) 0.68 0.14 1.29 (0.27) 0.74 0.13 1.23 (0.18) 0.23 0.15
LT 1.09 (0.27) 0.72 0.14 1.23 (0.23) 0.67 0.13 1.16 (0.17) 0.25 0.14
LM 1.17 (0.25) 0.61 0.15 1.35 (0.14) 0.50 0.09 1.26 (0.17) 0.35 0.13
ICC, intraclass correlation coefficient; SEM, standard error of mean; RMSRest, root mean square en rest position; MDF, median frequency; MNF,
mean frequency; ZC, zero crossing; ApEn, approximate entropy; RT, right temporal; RM, right masseter; LT, left temporal; LM, left masseter.
a r c h i v e s o f o r a l b i o l o g y 5 9 ( 2 0 1 4 ) 1 3 5 2 – 1 3 5 81356
3.1. Intra-session reliability
During MCE, the ICCs for the three trials recorded in the two
sessions (test and retest) revealed excellent intra-session
reliability (range: 0.80–0.98) for all EMG variables in all muscles
(Table 1). The RMSMCE was the variable with the highest SEM
(range: 2.37–5.91). In the resting position (Table 2), the ICCs
revealed good to excellent reliability (range: 0.61–0.95) for
RMSrest, mean and median frequencies (MNF, MDF) and zero
crossings (ZC). However, the approximate entropy (ApEn)
analysis revealed fair to good reliability (range: 53–74). The
SEM was highest for RMSrest (range: 1.47–6.86).
3.2. Inter-session reliability
Inter-session reliability was calculated between the test and
retest sessions with three readings under each condition.
During MCE, the ICCs revealed good to excellent reliability
(range: 0.60–0.86) mean and median frequencies (MNF, MDF)
and zero crossings (ZC) and approximate entropy (ApEn). ICCs
values for RMSMCE were fair to good (range: 0.56–0.72) and the
SEM was the highest for this variable (range: 6.98–11.93). In the
resting position, the ICCs revealed poor to fair reliability
(range: 0.23–0.57) for all EMG variables studied. The aim of the
present study was to determine the reliability of linear and
nonlinear measures of EMG activity in the masticatory
muscles of individuals with CP during intra-session and
inter-session analyses. The findings reveal that several
variables are reliable and precise in the reading of EMG
signals during MCE.
Regarding the intra-session analysis, all EMG variables
exhibited good to excellent reliability at rest and during
MCE. However, lesser reliability was found regarding the
RMS, especially when the muscles were at rest. This lower
degree of reliability may be related to the manner by which
the amplitude of the EMG signal was normalized. In
individuals without cognitive impairment, the indication
is to normalize the amplitude of the signal by MCE.43
However, considerable variability was found in the EMG
readings during MCE in the present study, indicating that
the subjects had difficulty in maintaining MCE in a constant
fashion (Fig. 1) and the decision was made to normalize the
EMG signal based on the rest position, as suggested by
Soderberg and Knutson (2000).33 Therefore, the amplitude
values of the EMG signals should be interpreted with
caution. With regard to the signal captured with the
muscles at rest, the normalization process was not
responsible for the low degree of inter-session reliability
(test–retest), since low reliability was found for all EMG
variables (MDF, MNF, ZC and ApEn).
Approximate entropy (ApEn) exhibited good to excellent
intra-session and inter-session reliability during MCE. More-
over, the standard error of the mean (SEM) was low in both
analyses. In the intra-session analysis with the muscles at
rest, good reliability was found in the ApEn in the first session
(test), but weak reliability was found for the right temporalis
(RT) and left masseter (LM) muscles in the second session
(retest). Nonetheless, the SEM was low. In the inter-session
analysis, poor reliability was found for ApEn with the muscles
at rest.

a r c h i v e s o f o r a l b i o l o g y 5 9 ( 2 0 1 4 ) 1 3 5 2 – 1 3 5 8 1357
The variables extracted from the analysis of the frequency
of the EMG signal exhibited better inter-session reliability
(good to excellent) during MCE. The ICCs and SEM were similar
for mean and median frequencies (MNF, MDF). Zero crossings
(ZC) exhibited lower ICCs than those found for MDF and MNF,
but the values remained within the same range of reliability
and the SEM was low. The ZC rate has properties close to MDF
and MNF,44 but is highly dependent on the signal-to-noise
ratio in EMG signals and is also very sensitive to deviations in
the amplitude of the signal. Thus, the use of this variable in the
analysis of EMG signals in individuals with CP could be
unnecessary when MDF and MNF are employed.
The better reliability of the frequency domain in relation-
ship to amplitude domain during MCE may be related to the
weakness of the masticatory muscles and difficulty coordi-
nating these muscles in this group of patients.2,3 These
problems are reflected in the fluctuation of the amplitude of
the EMG signal, as demonstrated in Fig. 1. The amplitude of the
signal is related to the recruitment and the discharge rates of
active motor units.14 The results of computer simulation
studies45,46 suggest that motor unit synchronization can alter
the amplitude of the EMG signal due to the summation of
motor unit potentials at the surface of the muscle. As motor
unit synchronization reflects connections within the central
nervous system, the fluctuation in the amplitude do EMG
signal in the present sample may stem from abnormalities in
the synchronization, recruitment and discharge rates of the
active motor units caused by CP. Thus, the variation in the
amplitude of the EMG signal stemming from these abnormali-
ties and the method employed for the normalization of the
amplitude of the signal may explain the lower degree of
reliability regarding the RMS.
In relation to the mean and median frequencies (MNF,
MDF), it has been suggested that shifts in these indices reflect
the recruitment of progressively larger and faster motor
units.47,48 Thus, the 3-s range used to analyze the EMG signal
in MCE may not have been sufficient for possible alterations in
the order of motor unit recruitment to be directly reflected in
the MDF and MNF, which may explain the greater reliability of
these variables.
Studies involving healthy individuals report that the
masseter and temporal muscles exhibit a high degree of
reliability (determined by the intraclass correlation coeffi-
cient),32,49 as found in the present study for individuals with
CP. However, the studies cited did not determine reproduc-
ibility with the muscles at rest, which hinders comparisons
with the present findings under this condition.
4. Conclusions
The present findings demonstrate that mean frequency,
median frequency and approximate entropy are the most
reliable variables of surface electromyography signals of the
masseter and temporal muscles during maximum clenching
effort in individuals with cerebral palsy. These measures can
be used to evaluate the function and behaviour of the
masticatory muscles in this population following oral reha-
bilitation and surgical oral procedures as well as for the study
the physiology of these muscles. However, the ICCs of the EMG
data recorded in the resting position demonstrate poor
reliability in the inter-session analysis of the following EMG
variables: RMS, MDF, MNF, ZC and ApEn.
Funding
None.
Competing interests
The authors declare that there are no conflicts of interest.
Ethical approval
Not required.
Acknowledgement
This project was supported by the Brazilian Coordination
for the Improvement of Higher Education Personnel/Postdoc-
toral National Program (CAPES/PNPD) – grant number 02495/
09-0.
r e f e r e n c e s
1. Vitti M, Basmajian JV. Integrated actions of masticatorymuscles: simultaneous EMG from eight intramuscularelectrodes. Anat Rec 1977;187:173–89.
2. Briesemeister M, Schmidt KC, Ries LG. Changes inmasticatory muscle activity in children with cerebral palsy. JElectromyogr Kinesiol 2013;23:260–6.
3. Dos Santos MT, Nogueira Ml. Infantile reflexes and theireffects on dental caries and oral hygiene in cerebral palsyindividuals. J Oral Rehabil 2005;32:880–5.
4. Bhowate R, Dubey A. Dentofacial changes and oral healthstatus in mentally challenged children. J Indian Soc PedodPrev Dent 2005;23:71–3.
5. Ortega AO, Guimaraes AS, Ciamponi AL, Marie SK.Frequency of parafunctional oral habits in patients withcerebral palsy. J Oral Rehabil 2008;35:191–5.
6. Miamoto CB, Pereira LJ, Paiva SM, Pordeus IA, Ramos-JorgeML, Marques LS. Prevalence and risk indicators oftemporomandibular disorder signs and symptoms in apediatric population with spastic cerebral palsy. J Clin PediatrDent 2011;35:259–63.
7. Giannasi LC, Batista SRF, Matsui MY, Hardt CT, Gomes CP,Amorim JBO, et al. Effect of a hyperbolide masticationapparatus for the treatment of severe sleep bruxism in achild with cerebral palsy: long-term follow-up. J Bodyw MovTher 2014;18:62–7.
8. Castroflorio T, Falla D, Tartaglia GM, Sforza C, Deregibus A.Myoelectric manifestations of jaw elevator muscle fatigueand recovery in healthy and TMD subjects. J Oral Rehabil2012;39:648–58.
9. Piancino MG, Isola G, Merlo A, Dalessandri D, Debernardi C,Bracco P. Chewing pattern and muscular activation in openbite patients. J Electromyogr Kinesiol 2012;22:273–9.
10. Sochaniwskyj AE, Koheil RM, Bablich K, Milner M, KennyDJ. Oral motor functioning, frequency of swallowing and

a r c h i v e s o f o r a l b i o l o g y 5 9 ( 2 0 1 4 ) 1 3 5 2 – 1 3 5 81358
drooling in normal children and in children with cerebralpalsy. Arch Phys Med Rehabil 1986;67:866–74.
11. Monteiro W, Francisco de Oliveira Dantas da Gama T, dosSantos RM, Collange Grecco LA, Pasini Neto H, Oliveira CS.Effectiveness of global postural reeducation in thetreatment of temporomandibular disorder: case report. JBodyw Mov Ther 2013;17:53–8.
12. De Rossi M, Santos CM, Miglioranca R, Regalo SC. All onfour1 fixed implant support rehabilitation: a masticatoryfunction study. Clin Implant Dent Relat Res 2013. http://dx.doi.org/10.1111/cid.12031.
13. Bar-On L, Aertbelien E, Molenaers G, Van Campenhout A,Vandendoorent B, Nieuwenhuys A, et al. Instrumentedassessment of the effect of botulinum toxin-A in the medialhamstrings in children with cerebral palsy. Gait Posture 2013.pii:S0966-6362(13)00252-X.
14. Farina D, Merletti R, Enoka RM. The extraction of neuralstrategies from the surface EMG. J Appl Physiol 2004;96:1486–95.
15. Roy SH, De Luca CJ, Schneider J. Effects of electrode locationon myoelectric conduction velocity and median frequencyestimates. J Appl Physiol 1986;61:1510–7.
16. Jensen C, Vasseljen O, Westgaard RH. The influence ofelectrode position on bipolar surface electromyogramrecordings of the upper trapezius muscle. Eur J Appl Physiol1993;67:266–73.
17. Lei M, Wang ZZ, Feng ZJ. Detection nonlinearity of actionsurface EMG signal. Phys Lett A 2001;290:297–303.
18. Rodrick D, Karwowski W. Nonlinear dynamical behavior ofsurface electromyographical signals of biceps muscle undertwo simulated static work postures. Nonlinear DynamicsPsychol Life Sci 2006;10:21–35.
19. Swie YW, Sakamoto K, Shimizu Y. Chaotic analysis ofelectromyography signal at low back and lower limbmuscles during forward bending posture. Electromyogr ClinNeurophysiol 2000;545:329–42.
20. Felici F, Rosponi A, Sbriccoli P, Filligoi GC, Fattorini L,Marchetti M. Linear and non-linear analysis of surfaceelectromyograms in weight-lifters. Eur J Appl Physiol2001;84:337–42.
21. Fattorini L, Felici F, Filligoi GC, Traballesi M, Farina D.Influence of high motor unit synchronization levels on non-linear and spectral variables of the surface EMG. J NeurosciMethods 2005;143:133–9.
22. Harbourne RT, Stergiou N. Movement variability and the useof nonlinear tools: principles to guide physical therapistpractice. Phys Ther 2009;89:267–82. http://dx.doi.org/10.2522/ptj.20080130. [review].
23. Costa M, Goldberger AL, Peng CK. Multiscale entropy todistinguish physiologic and synthetic RR time series. ComputCardiol 2000;29:137–40.
24. Costa M, Goldberger AL, Peng CK. Multiscale entropyanalysis: a new measure of complexity loss in heart failure. JElectrocardiol 2003;36(Suppl.):39–40.
25. Goldberger AL, Peng CK, Lipsitz LA. What is physiologiccomplexity and how does it change with aging and disease?Neurobiol Aging 2002;23:23–6.
26. Sung PS, Zurcher U, Kaufman M. Reliability differencebetween spectral and entropic measures of erector spinaemuscle fatigability. J Electromyogr Kinesiol 2010;20:25–30.
27. Chen W, Wang Z, Ren X. Characterization of surface EMGsignals using improved approximate entropy. J Zhejiang UnivSci 2006;B 7:844–8.
28. Mansur PH, Cury LK, Leite JO, Pereira AA, Penha-Silva N,Andrade AO. The approximate entropy of theelectromyographic signals of tremor correlates with theosmotic fragility of human erythrocytes. Biomed Eng Online2010;22:9–29.
29. Smith BA, Teulier C, Sansom J, Stergiou N, Ulrich BD.Approximate entropy values demonstrate impaired
neuromotor control of spontaneous leg activity in infantswith myelomeningocele. Pediatr Phys Ther 2011;23:241–7.
30. Buxbaum J, Mylinski N, Parente FR. Surface EMG reliabilityusing spectral analysis. J Oral Rehabil 1996;23:77I–5I.
31. Castroflorio T, Icardi K, Torsello F, Deregibus A, DebernardiC, Bracco P. Reproducibility of surface EMG in the humanmasseter and anterior temporalis muscle areas. J CranioPract 2005;23:130–7.
32. De Felıcio CM, Sidequersky FV, Tartaglia GM, Sforza C.Electromyographic standardized indices in healthyBrazilian young adults and data reproducibility. J OralRehabil 2009;36:558–77.
33. Soderberg GL, Knutson LM. A guide for use andinterpretation on kinesiologic electromyographic data. PhysTher 2000;80:485–98.
34. Inbar GF, Allin J, Paiss O, Kranz H. Monitoring surface EMGspectral changes by the zero crossing rate. Med Biol EngComput 1986;24:10–8.
35. Pincus SM. Approximate entropy as a measure of systemcomplexity. Proc Natl Acad Sci USA 1991;88:2297–301.
36. Pincus SM, Goldberger AL. Physiological time-seriesanalysis: what does regularity quantify? Am J Physiol1994;266:H1643–56.
37. Vaillancourt DE, Newell KM. The dynamics of resting andpostural tremor in Parkinson’s disease. Clin Neurophysiol2000:1112046–0.
38. Dragomir A, Akay Y, Curran AK, Akay M. Investigating thecomplexity of respiratory patterns during the laryngealchemoreflex. J NeuroEng Rehabil 2008;20:5–17.
39. Sethi A, Davis S, McGuirk T, Patterson TS, Richards LG.Effect of intense functional task training upon temporalstructure of variability of upper extremity post stroke. J HandTher 2013;26:132–7.
40. Weir JP. Quantifying test–retest reliability using theintraclass correlation coefficient and the SEM. J StrengthCond Res 2005;19:231–40.
41. Bruton A, Conway JH, Holgate ST. Reliability: what is it andhow is it measured? Physiotherapy 2000;86:94–9.
42. Cicchetti DV, Sparrow SS. Developing criteria forestablishing inter-rater reliability of specific items:application to assessment of adaptive behavior. Am J MentDefic 1981;86:127–37.
43. Burden A. How should we normalize electromyogramsobtained from healthy participants? What we have learnedfrom over 25 years of research. J Electromyogr Kinesiol2010;20:1023–35.
44. Hagg GM, Suurkula J. Zero crossing rate of electromyogramsduring occupational work and endurance tests as predictorsfor work related myalgia in the shoulder/neck region. Eur JAppl Physiol Occup Physiol 1991;62:436–44.
45. Yao W, Fuglevand RJ, Enoka RM. Motor-unitsynchronization increases emg amplitude and decreasesforce steadiness of simulated contractions. J Neurophysiol2000;83:441–52.
46. Zhou P, Rymer WZ. Factors governing the form of therelation between muscle force and the EMG: a simulationstudy. J Neurophysiol 2004;92:2878–86.
47. Bernardi M, Felici F, Marchetti M, Montellanico F, PiacentiniMF, Solomonow M. Force generation performance andmotor unit recruitment strategy in muscles of contralaterallimbs. J Electromyogr Kinesiol 1999;9:121–30.
48. Bernardi M, Solomonow M, Nguyen G, Smith A, Baratta R.Motor unit recruitment strategies changes with skillacquisition. Eur J Appl Physiol 1996;74:52–9.
49. Gonzalez Y, Iwasaki LR, McCall Jr WD, Ohrbach R, Lozier E,Nickel JC. Reliability of electromyographic activity vs. bite-force from human masticatory muscles. Eur J Oral Sci2011;119:219–24.