Testing Water Quality and Building Buoys
13
Compiled in 2013 by education staff at the Chesapeake Bay National Estuarine Research Reserve in Virginia for use in the B-WET Chesapeake Studies in the Classroom program Testing Water Quality and Building Buoys Materials: For each group you will need (designed for 4 groups): Map of the York River (included, hard and electronic form) One pH tube of test paper, pH instructions on the tube One Refractometer, pipet, and instruction sheet One Turbidity Test kit, pipet, and instruction sheet, included in the box One water sample with salinity (give different water samples to the various groups) You will also need: Extra water for each sample in case there are spills PVC pipes for the buoys Frisbees Golf Balls Cable ties Scissors Kiddie pool Grade Level: 7 Subject Area: Life Science Virginia Standards of Learning: LS. 1, LS. 4, LS. 7 Objectives: Students will: Gain a basic understanding of water quality, why it is important, and how abiotic factors can influence aquatic life Test water samples for different factors Collect data, organize it into a data table, and make inferences Learn about the nature of science by investigating the quality of water in the Chesapeake Bay Sketch and design a buoy that is able to float and hold weight Explore Real-time date using the NOAA Chesapeake Bay Interpretive Buoy System Summary: Students will test water samples collected from the Chesapeake Bay for a variety of factors. They will record their data and use it to figure out where each sample was taken from along the estuarine salinity gradient. Students will then learn about the use of buoys and then design test their own. Vocabulary: water quality, estuary, salinity, pH, turbidity, buoy, buoyancy
Transcript of Testing Water Quality and Building Buoys
Compiled in 2013 by education staff at the Chesapeake Bay National Estuarine Research Reserve in Virginia
for use in the B-WET Chesapeake Studies in the Classroom program
Testing Water Quality and Building Buoys
Materials:
For each group you will need (designed for 4 groups):
Map of the York River (included, hard and electronic form)
One pH tube of test paper, pH instructions on the tube
One Refractometer, pipet, and instruction sheet
One Turbidity Test kit, pipet, and instruction sheet, included in the box
One water sample with salinity (give different water samples to the various groups)
You will also need:
Extra water for each sample in case there are spills
PVC pipes for the buoys
Frisbees
Golf Balls
Cable ties
Scissors
Kiddie pool
Grade Level: 7
Subject Area: Life Science
Virginia Standards of Learning: LS. 1, LS. 4, LS. 7
Objectives:
Students will:
Gain a basic understanding of water quality, why it is important, and how abiotic
factors can influence aquatic life
Test water samples for different factors
Collect data, organize it into a data table, and make inferences
Learn about the nature of science by investigating the quality of water in the
Chesapeake Bay
Sketch and design a buoy that is able to float and hold weight
Explore Real-time date using the NOAA Chesapeake Bay Interpretive Buoy System
Summary: Students will test water samples collected from the Chesapeake Bay for a variety of factors.
They will record their data and use it to figure out where each sample was taken from along
the estuarine salinity gradient. Students will then learn about the use of buoys and then design
test their own.
Vocabulary: water quality, estuary, salinity, pH, turbidity, buoy, buoyancy
Compiled in 2013 by education staff at the Chesapeake Bay National Estuarine Research Reserve in Virginia
for use in the B-WET Chesapeake Studies in the Classroom program
Procedure:
Introduction
1. Give the students some basic background information about estuaries. The Chesapeake
Bay and the York River (which they are studying in this lesson) are both estuaries.
* An estuary is a partially enclosed body of water where salt water and freshwater mix.
Salt water enters an estuary from the ocean and freshwater enters an estuary from rivers
and streams. The water inside of an estuary is thus a mixture of salt and freshwater and
is called brackish water (it is not as salty as ocean water, but not as fresh as river water).
Estuaries are characterized by constantly changing conditions. The temperature, salinity
(amount of salt), turbidity (amount of sediment or particles in the water), etc. of the water
change with the tidal cycle, storms, waves, the amount of rainfall, etc. Plants and animals
that live within an estuary are well adapted to deal with these changing conditions. They
can often tolerate wide ranges of factors such as temperature and salinity.
2. Discuss water quality with the students.
a. What is water quality? Ask the students what “good” water looks like, tastes like,
smells like. How about “bad” water? Usually the students will say that “bad”
water is brown and dirty. But ask them if they can tell just by looking at water if it
has chemicals in it. (No.)
b. Discuss the different parameters you might measure if you were testing water
quality, what each parameter is, why it is important, and how you measure it (see
background information). Let the students try to think of the parameters as you
list them on the board.
c. Ask the students why water quality is important (see background information).
Ask the students where their drinking water at home comes from. If they have
well water, it comes from ground water, which is water on its way to the Bay. If
their water comes from the city it comes from a reservoir, but is still susceptible to
contaminants. Healthy river/bay water means clean, healthy water for cooking,
cleaning, and drinking.
d. Ask the students why we should measure water quality (see background
information).
3. Discuss safety issues with students. Be careful not to spill jars of water, the jars are made
of glass.
Activity1. Water Quality Testing -20 minutes
1. Demonstrate (in general) how to complete the pH, Salinity and Turbidity tests. pH is will
be tested with test strips, Salinity with a refractometer, and Turbidity with a test tube. A
big part of being a scientist is following instructions and paying attention to details.
Compiled in 2013 by education staff at the Chesapeake Bay National Estuarine Research Reserve in Virginia
for use in the B-WET Chesapeake Studies in the Classroom program
2. Pass out the test instruments and one water sample to each group of students. Groups
should have different water samples, for more than 4 groups there will be some groups
with the same water sample.
3. Students will complete the pH, Salinity and Turbidity tests on their one sample and will
record the results on a sheet of paper.
4. Once all students have completed their three tests, go over these results as a class.
Compare the measurements from the samples to predict where each water sample was
taken from along the York River. It might be useful to have a data table drawn on the
board and write in each group’s measurement while looking at the Map of the York River.
Describe to students that they need to use the data they collected to figure out where each
sample came from in the York River – each sample had to come from one of the sites
marked in red. The students should write the letter of the sample next to the site they
think it came from. You can walk around and help the groups by giving them hints – for
which factors do they have measurements for all four samples, what factor will definitely
vary over space in an estuary, etc. Try to get them to figure out that salinity is their best
indicator of where the samples are from.
Wrap Up
Use the York River map to go over the sample locations with the students. Ask them
what they used to determine where each sample came from. They should have used salinity
measurements. Ask them why they used that measurement or how they knew to use that one. At
this time you can make it a point to talk about or remind students how salinity varies in an
estuary – higher salinity near the mouth of the estuary, lower salinity near the head – and why it
varies. Review the other measurements and discuss the ranges of the data and what range the
students should expect to see for pH and Salinity.
Activity 2: Build a Buoy – 50 minutes
1. Discuss with students the pros and cons of the methods they previously used to test water
quality. What is another way scientists could access water quality data without going into
the field? For example CBNERR scientists record water quality data from different
locations every 15 minutes, 24 hours a day, 365 days a year, how could they do that?
(With buoys and computers)
2. Ask the students what they already know about buoys. What can buoys observe and
where are they located? What kind of buoys are there? Refer to the background
information.
3. Explain to students that today you are going to focus on observational buoys that can give
both weather and water quality information. Show a picture
(http://buoybay.noaa.gov/about/about-buoy-technology) of an observational buoy and
explain the technology used with the system.
Compiled in 2013 by education staff at the Chesapeake Bay National Estuarine Research Reserve in Virginia
for use in the B-WET Chesapeake Studies in the Classroom program
4. Once students have an understanding of the use of the observational buoy review what
buoys must be able to do.
a. Float (review the concept of buoyancy)
b. Collect Data and be able to send back to a certain location
c. Carry a weight
Building the buoy
1. Divide students into 5 – 6 groups and explain that they are scientists working together to
develop the most efficient buoy that is able to float and can hold weight. Explain that the
buoy will be made with PVC pipes and connectors while the platform will be a Frisbee
that the students will need to attach to the buoy. The buoy should be able to hold weight,
and while no actual instruments will be attached, the golf balls will represent instruments
being attached to the buoy. Review the concept of buoyancy and remind students that
there should be no open holes in their PVC structure.
2. In their group, students must draw a design for how they would like to assemble their
buoy. Once they have their design finalized, they can then gather the supplies they need
to build their buoy. This exercise should be very open to many different designs, allowing
for creativity in the engineering process.
3. Once students have created their PVC structure hand out Frisbees to be attached to the
structure, in a position that can hold weight (i.e. golf balls). Frisbees are to be attached
with the provided cable ties; students may need instruction on how to properly attach
cable ties o the PVC. Each group should be given approximately 4 cable ties which go
through the holes in the Frisbee to then wrap about a PVC pipe and be tightened. For the
best results all Frisbees should balanced when attached.
4. Have the students bring their finalized buoy to the tub or pool filled with water, this is
best done outside. With one group going at a time, have them place their buoy in the
water and first see if it can float. It if passes the floating test, have the members of the
group add golf balls onto the Frisbee platform. Students should continue adding golf balls
to the Frisbee until the buoy structure begins to sink or becomes unbalanced and the golf
balls begin to fall off. Group members should remember the number of golf balls their
buoy was able to hold. You may want to make it a class competition to see which group
has the buoy which can hold the most weight, this seems to get the students very excited
and involved. Rotate through each group doing the same procedure. Once everybody has
gone, discuss which buoy was able to hold the most golf balls, and why that may be.
5. If time allows students make may adjustments to their PVC structure and repeat step
number 4.
6. Have the students take their buoys apart outside and shake out any water that remains
in the pipes. Have the students return their pipes and Frisbees back to the proper bin.
After the class completes the activity it should be returned so that it is ready to go for the
next class.

Compiled in 2013 by education staff at the Chesapeake Bay National Estuarine Research Reserve in Virginia
for use in the B-WET Chesapeake Studies in the Classroom program
Wrap Up
Have students discuss with their group the pros and cons of their buoy design. Review the
uses of an observational buoy and show an example of the real-time buoy data from the website
(http://buoybay.noaa.gov/observations/data-snapshot.html). As a conclusion to the class activity
students should understand different water quality parameters that can be measured and the uses
of buoys.
Compiled in 2013 by education staff at the Chesapeake Bay National Estuarine Research Reserve in Virginia
for use in the B-WET Chesapeake Studies in the Classroom program
Background Information on Water Quality
The term water quality refers to the quality and the properties of water. When discussing water
quality, one is usually referring to how much pollution or dirt is in the water, the salinity of the
water, the temperature of the water, and so on. Water quality is important because we drink
water, we recreate in the water (swim, eat fish that accumulate pollutants, etc.), and plants and
animals need specific water parameters in which to live. Changes in water quality can have
significant effects on plants and animals. Measuring water quality is important so we know what
is in our water, when it is in the water, where it is coming from, and how we can treat it.
Estuaries are dynamic environments by their very nature. Water quality parameters such as
salinity, water temperature, turbidity (or water clarity), pH, and dissolved oxygen can change on
a tidal, daily, weekly, monthly, or yearly basis as changes in tides, weather, and rainfall occur.
The high degree of variation in water quality in an estuary makes them difficult environments to
live in. Aquatic plants and animals that live within an estuary are well adapted to deal with a
constantly changing environment.
There are several parameters that should be included when discussing water quality. A few of
them are listed below.
Salinity
Salinity is the measurement for the amount of salt in water. The units for salinity are parts per
thousand (ppt), which means that for every thousand molecules/parts of water, there are 35
molecules/parts of salt. Ocean water has a salinity of approximately 35 ppt. Freshwater has a
salinity of 0 ppt – there is no salt in freshwater. Water that is a mixture between salt and
freshwater is called brackish water. Brackish water is the type of water that is found in an
estuary. The water in estuaries follows a salinity gradient, with waters closer to the ocean having
higher salinities (30-35 ppt) and waters further from the ocean or closer to freshwater streams
and rivers having lower salinities (0-5 ppt). Salinity within an estuary can change with the tides,
currents, or amount of rainfall. Salinity is important because plants and animals have a certain
range of salinities they can survive within. Salinity is a factor that influences where different
types of organisms live. Scientists use a data sonde, buoy, or hand held refractometer to measure
salinity.
Temperature
Water temperature refers to how hot or cold water is. Temperature can be measured in either
degrees Fahrenheit or degrees Celsius. Temperature is an important factor because it can
influence where different types of organisms live because organisms have specific ranges of
temperature they can tolerate. Temperature is measured using either a data sonde or buoy or a
hand held thermometer.
Compiled in 2013 by education staff at the Chesapeake Bay National Estuarine Research Reserve in Virginia
for use in the B-WET Chesapeake Studies in the Classroom program
pH
pH measures the amount of hydrogen ions in water. This is the measurement for whether
something is an acid or a base. pH ranges from 0-14, with values of 0-6.9 indicating an acid, 7
being neutral, and 7.1-14 indicating a base. There are no units for pH. The pH of water is
important because organisms have a certain range of pH they can survive within. pH values
outside of this range can be detrimental to the organisms. pH levels higher or lower than
“normal” may indicate that there is a pollutant in the water. Scientists use a data sonde or buoy
or tablet test to measure pH.
As a loose rule, the pH of water is usually between 6.5 and 8.5. The Virginia Water Quality
standard for pH is 6.0-9.0. The following guidelines can be followed when referring to pH
measurements and water quality:
6.5-7.5 = excellent
6.0-6.4 and 7.6-8.0 = Good
5.5–5.9 and 8.1–8.5 = Fair
<5.5 and >8.6 = Poor
The guidelines above are for freshwater environments and are from Mitchell, M.K. and W.B.
Stapp. 2008. Field Manual for Water Quality Monitoring. Kendall/Hunt Publishing Company,
Dubuque, Iowa.
Dissolved Oxygen (DO)
Dissolved oxygen (DO) refers to the amount of oxygen dissolved in the water. DO can be
measured in two units. Parts per million (ppm) means that for every million molecules/parts of
water there are a certain number of oxygen molecules (for example 4 ppm would mean there
were 4 molecules/parts of oxygen per million molecules/parts of water). Percent Saturation (%
saturation) is the amount of oxygen dissolved in the water sample compared to the maximum
amount that could be present at the same temperature. For example, water is said to be 100%
saturated if it contains the maximum amount of oxygen at that temperature. A water sample that
is 50% saturated only has half the amount of oxygen that it could potentially hold at that
temperature. Sometimes water can become supersaturated with oxygen because of rapidly
tumbling water. This usually lasts for a short period of time but can be harmful to fish and other
aquatic organisms.
Aquatic organisms need DO to survive just as humans and terrestrial animals need atmospheric
oxygen to survive. Low DO in water can result from several things, including eutrophication and
high water temperatures. Cold water can hold more oxygen than warm water, so when water
warms up in summer months it loses its ability to contain high levels of DO. Eutrophication is
the condition in which excess nutrients in the water lead to the overgrowth of phytoplankton.
When phytoplankton blooms occur as a result of eutrophication, the massive amounts of
phytoplankton that die of natural causes sink to the bottom and undergo decomposition. The
process of decomposition uses up oxygen from the water, thus depleting DO and causing
conditions known as hypoxia (oxygen depleted water) and dead zones (areas where there is not
Compiled in 2013 by education staff at the Chesapeake Bay National Estuarine Research Reserve in Virginia
for use in the B-WET Chesapeake Studies in the Classroom program
enough oxygen in the water to support life). DO can be measured using a data sonde or buoy or a
tablet test.
Aquatic organisms generally cannot survive in waters with DO values lower than 4 ppm. DO
percent saturation values of 80-120% are considered to be excellent and values less than 60% or
over 125% are considered to be poor. Below are some general guidelines to follow when
measuring DO:
DO in ppm:
0-4 = poor (animals generally cannot survive in water with DO less than 4 ppm)
4.1-7.9 = fair
8.0-12.0 = good
DO in % saturation:
This information is from Mitchell, M.K. and W.B. Stapp. 2008. Field Manual for Water Quality
Monitoring. Kendall/Hunt Publishing Company, Dubuque, Iowa, and is for freshwater habitats.
91-110 = Excellent
71-90 = Good
51-70 = Fair
<50 = Poor
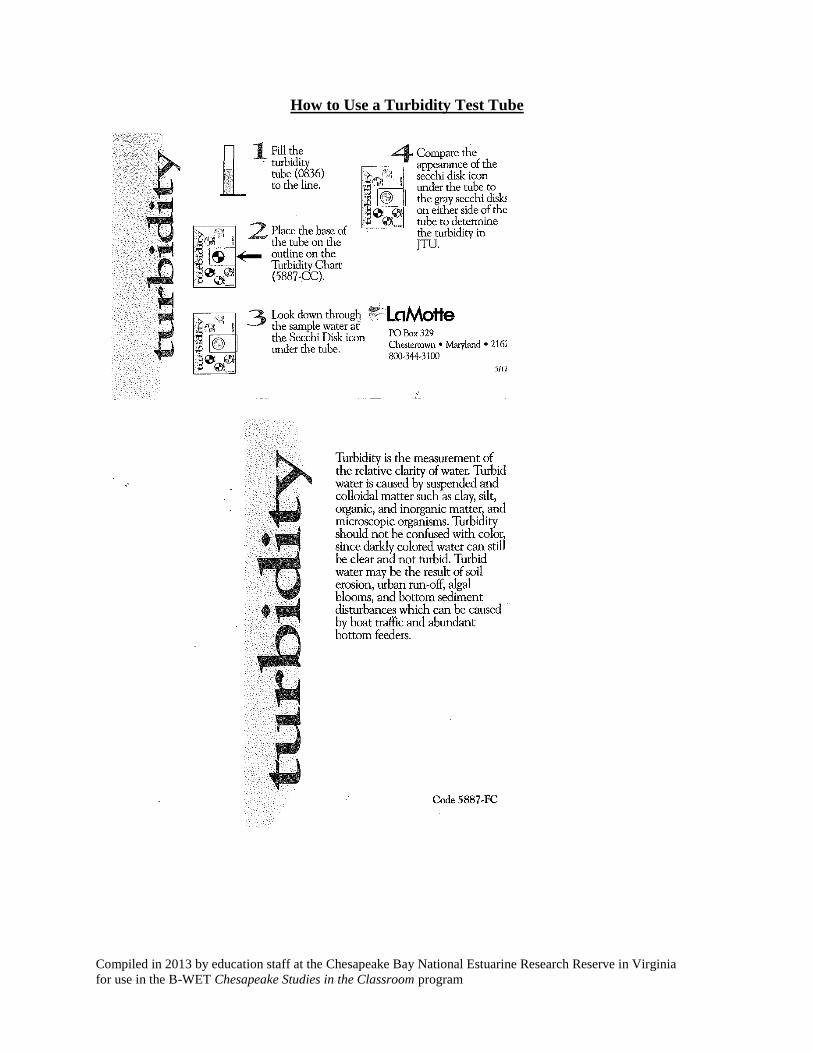
Turbidity
Turbidity is the measurement for the amount of particles (sediment or algae/phytoplankton) in
the water or how clear the water is. High turbidity values mean the water is very turbid, has lots
of particles in it, or is not very clear. Low turbidity values mean the water is clear and does not
have many particles in it. Turbid water is caused when sediments enter the water or become
suspended in the water. This is often the result of erosion, run off, phytoplankton blooms, or
disturbance of the bottom (such as dredging, wave action, walking on the bottom, etc.). Turbidity
is an important parameter of water because underwater plants require clear water so sunlight can
reach them and animals need clear water to see in. High amounts of sediment or phytoplankton
in the water can also clog the gills of filter feeders, such as oysters, and can suffocate the
organisms. Turbidity can be measured using a secci disk, a turbidity meter, a turbidity tube, or
data sonde or buoy. The units of turbidity vary depending on the method of measurement.
A turbidity reading of 0 NTU (on a turbidity meter) indicates completely clear water. Below are
some general guidelines to follow when measuring Turbidity with a turbidity meter (in NTU
units) (This information is from Mitchell, M.K. and W.B. Stapp. 2008. Field Manual for Water
Quality Monitoring. Kendall/Hunt Publishing Company, Dubuque, Iowa, and is for freshwater
habitats.):
0-10 NTU = Excellent
10.1-40 NTU = Good
40.1-150 NTU = Fair
>150 NTU = Poor
Compiled in 2013 by education staff at the Chesapeake Bay National Estuarine Research Reserve in Virginia
for use in the B-WET Chesapeake Studies in the Classroom program
Pollutants (nutrients, toxics):
There are many types of pollutants in our waters. The term pollutant can include chemicals,
litter, and nutrients. Our health and the health of aquatic and terrestrial organisms depend on
clean, pollution-free water. To test for pollutants, scientists usually use a niskan bottle to take a
water sample and then take the sample back to the lab to be analyzed with special equipment.
Some pollutants, such as nutrients can be tested for using a tablet test.
Nutrients are considered a pollutant when they are found in amounts in excess of what would
naturally occur in the water. Sources of excess nutrients include fertilizers, septic systems,
sewage treatment plants, animal waste, and industrial waste. Much of the nutrients from these
sources enter the water when rainwater causes it run off the land and into the water. Two
problematic nutrients in the Chesapeake Bay are Nitrogen and Phosphorus. Excess nutrients in
the Bay cause a condition known as eutrophication. Eutrophication is when excess nutrients in
the water cause the overgrowth of phytoplankton. Phytoplankton blooms make the water turbid,
they block out sunlight needed for underwater plants, and they can cause oxygen depletion in the
water. When the phytoplankton from a bloom dies they sink to the bottom and undergo
decomposition. The process of decomposition uses up oxygen from the water, thus depleting DO
and causing conditions known as hypoxia (oxygen depleted water) and dead zones (areas where
there is not enough oxygen in the water to support life). Phosphate and Nitrogen can be
measured either in ppm (parts per million) or mg/L.
As a general rule, Nitrate and Phosphate levels below 1 ppm are considered “good”. Nitrate
values >10 ppm in drinking water is considered unsafe. Phosphate and Nitrogen can be measured
either in ppm (parts per million) or mg/L. Below are some guidelines to follow when measuring
Phosphorus and Nitrogen in mg/L (from Mitchell, M.K. and W.B. Stapp. 2008. Field Manual for
Water Quality Monitoring. Kendall/Hunt Publishing Company, Dubuque, Iowa. – for freshwater
habitats):
Phosphate (mg/L)
0-1 = Excellent
1.1-4 = Good
4.1-9.9 = Fair
>10 = Poor
Nitrate (mg/L)
0-1 = Excellent
1.1-3 = Good
3.1-5 = Fair
>5 = Poor

Compiled in 2013 by education staff at the Chesapeake Bay National Estuarine Research Reserve in Virginia
for use in the B-WET Chesapeake Studies in the Classroom program
Background Information on Buoys
A buoy is a floating device that can have many purposes. It can be anchored (stationary) or
allowed to drift with the sea wave. There are several different types of buoys that your students
may be familiar with. Red and green channel marker buoys indicate the bounds of navigable
waterways so that ships bay pass safely. Others locate objects that pose a threat to boaters or
swimmers or otherwise mark areas where activities are prohibited. Students may recognize a
buoy as an object marking where a crab pot is or a life buoy which is thrown to a person
overboard to provide them with a flotation device. All of these buoys are floating, and have the
ability to carry some form of weight. Observation is another major role for buoys. Weather
stations are routinely installed on buoys to record conditions as well as instruments to monitor
water quality. Some of the information gathered by buoys is helpful for scientists to make
prediction models, and even track where storms could be headed. In this lesson, students will be
learning about The National Oceanic and Atmospheric Administration’s (NOAA) Chesapeake
Bay Interpretive Buoy System (CBIBS). It is a network of observing platforms (buoys) that
collect meteorological, oceanographic, and water-quality data and relay that information using
wireless technology to a variety of users. The buoys can deliver real-time data on weather, water
conditions, and water quality. Please refer to this website (http://buoybay.noaa.gov/about/about-
system) for more information referring to CBIBS.

Compiled in 2013 by education staff at the Chesapeake Bay National Estuarine Research Reserve in Virginia
for use in the B-WET Chesapeake Studies in the Classroom program
Map of the York River
Compiled in 2013 by education staff at the Chesapeake Bay National Estuarine Research Reserve in Virginia
for use in the B-WET Chesapeake Studies in the Classroom program
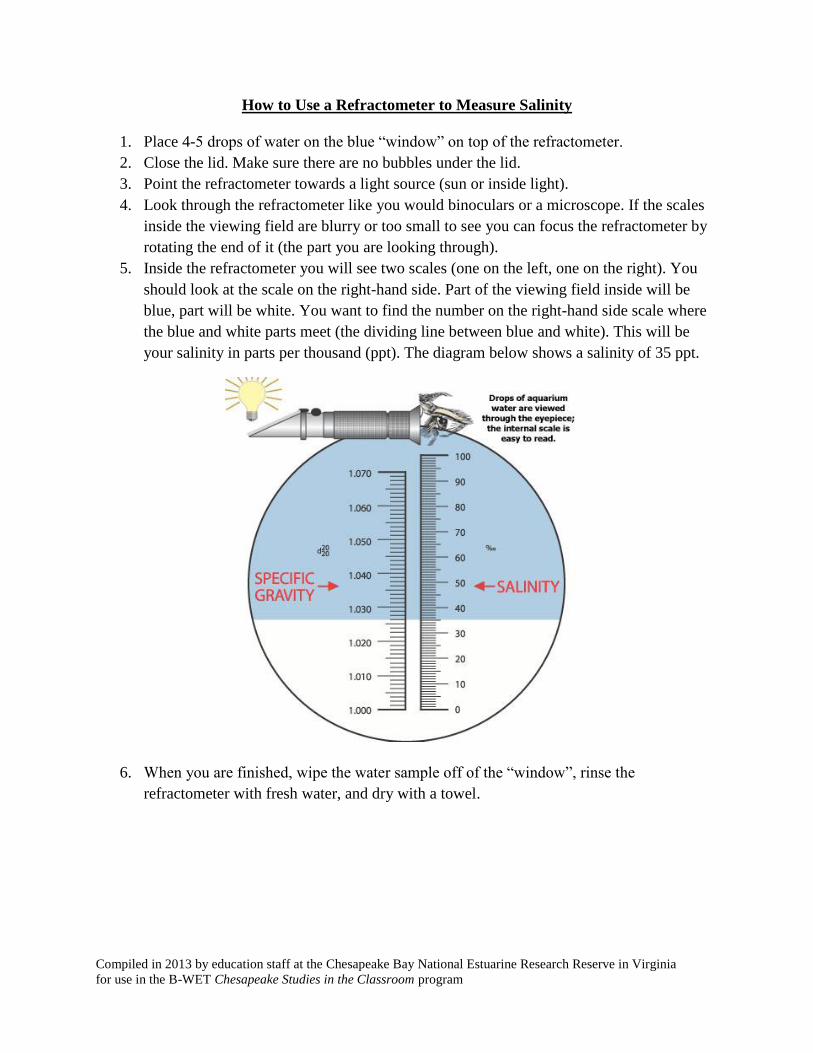
How to Use a Refractometer to Measure Salinity
1. Place 4-5 drops of water on the blue “window” on top of the refractometer.
2. Close the lid. Make sure there are no bubbles under the lid.
3. Point the refractometer towards a light source (sun or inside light).
4. Look through the refractometer like you would binoculars or a microscope. If the scales
inside the viewing field are blurry or too small to see you can focus the refractometer by
rotating the end of it (the part you are looking through).
5. Inside the refractometer you will see two scales (one on the left, one on the right). You
should look at the scale on the right-hand side. Part of the viewing field inside will be
blue, part will be white. You want to find the number on the right-hand side scale where
the blue and white parts meet (the dividing line between blue and white). This will be
your salinity in parts per thousand (ppt). The diagram below shows a salinity of 35 ppt.
6. When you are finished, wipe the water sample off of the “window”, rinse the
refractometer with fresh water, and dry with a towel.
Compiled in 2013 by education staff at the Chesapeake Bay National Estuarine Research Reserve in Virginia
for use in the B-WET Chesapeake Studies in the Classroom program
How to Use a Turbidity Test Tube