
Testing Semi-strong Form Efficiency of Stock Market · The Pakistan Development Review 40: 4 Part...
24
The Pakistan Development Review 40: 4 Part II (Winter 2001) pp. 651–674 Testing Semi-strong Form Efficiency of Stock Market SALMAN SYED ALI and KHALID MUSTAFA * 1. INTRODUCTION The efficient market hypothesis suggests that stock markets are “informationally efficient”. That is, any new information relevant to the market is spontaneously reflected in the stock prices. A consequence of this hypothesis is that past prices cannot have any predictive power for future prices once the current prices have been used as an explanatory variable. In other words the change in future prices depends only on arrival of new information that was unpredictable today hence it is based on surprise information. Another consequence of this hypothesis is that arbitrage opportunities are wiped out instantaneously. Empirical tests of the efficient market hypothesis actually test for these consequences in various ways. Some of them have been summarised in earlier chapters. These tests generally could not conclusively accept the random-walk hypothesis of stock returns even when GARCH effects were accounted for. Many studies have found empirical regularities that are contrary to the efficient market hypothesis. For example, the monthly, weekly and daily returns on stocks tend to exhibit discernable patterns, such as seasonal affects, month of the year affect, day of the week affect, hourly affect etc. In case of Pakistan’s stock markets too such affects are identified. Such as the Ramadan affect [see Hussain and Uppal (1999)], seasonal effects and day of the week affect. Further, the wide spread use of “technical analysis” among stock traders and their ability to predict to some extent the direction of movements in the prices of individual stocks over medium term testifies to the existence of patterns and seasonal trends. The existence of these systematic affects may imply informational inefficiency of the stock markets as markets take long time to adjust to new information. But there is another possible explanation too. That is that the markets are informationally efficient and adjust quickly and fully to any new piece of information but the information arrives in a systematic pattern, hence the observed systematic pattern in stock returns. Salman Syed Ali is Lecturer, International Islamic University, Islamabad. Khalid Mustafa is Assistant Professor in the University of Karachi.
-
Upload
truonghanh -
Category
Documents
-
view
213 -
download
0
Transcript of Testing Semi-strong Form Efficiency of Stock Market · The Pakistan Development Review 40: 4 Part...

The Pakistan Development Review 40: 4 Part II (Winter 2001) pp. 651–674
Testing Semi-strong Form Efficiency of Stock Market
SALMAN SYED ALI and KHALID MUSTAFA*
1. INTRODUCTION
The efficient market hypothesis suggests that stock markets are “informationally efficient”. That is, any new information relevant to the market is spontaneously reflected in the stock prices. A consequence of this hypothesis is that past prices cannot have any predictive power for future prices once the current prices have been used as an explanatory variable. In other words the change in future prices depends only on arrival of new information that was unpredictable today hence it is based on surprise information. Another consequence of this hypothesis is that arbitrage opportunities are wiped out instantaneously.
Empirical tests of the efficient market hypothesis actually test for these consequences in various ways. Some of them have been summarised in earlier chapters. These tests generally could not conclusively accept the random-walk hypothesis of stock returns even when GARCH effects were accounted for. Many studies have found empirical regularities that are contrary to the efficient market hypothesis. For example, the monthly, weekly and daily returns on stocks tend to exhibit discernable patterns, such as seasonal affects, month of the year affect, day of the week affect, hourly affect etc. In case of Pakistan’s stock markets too such affects are identified. Such as the Ramadan affect [see Hussain and Uppal (1999)], seasonal effects and day of the week affect. Further, the wide spread use of “technical analysis” among stock traders and their ability to predict to some extent the direction of movements in the prices of individual stocks over medium term testifies to the existence of patterns and seasonal trends.
The existence of these systematic affects may imply informational inefficiency of the stock markets as markets take long time to adjust to new information. But there is another possible explanation too. That is that the markets are informationally efficient and adjust quickly and fully to any new piece of information but the information arrives in a systematic pattern, hence the observed systematic pattern in stock returns.
Salman Syed Ali is Lecturer, International Islamic University, Islamabad. Khalid Mustafa is Assistant Professor in the University of Karachi.

Ali and Mustafa 652
A direct test of this possibility is to look for any association between pattern of information arrival and pattern of market activity variables. For this we will need some measure of information as well as measures for market activity. We also would have to decide whether to perform this analysis at firm level or at aggregate market level. In this paper we ask this direct and simple question of whether the amount of publicly available information affects daily stock returns and trading volume.
Such studies are not uncommon for stock markets of developed countries, although each such study is subject to its own limitations. Most recent and important study in this line of research is that of Mitchell and Mulhern (1994) that focused on market level aggregate variables of daily market returns and trading volume on one hand and on the other hand a broad based information variable of number of daily publicly announced news items. Another study with slightly different emphasis is that of Berry and Howe (1994) who looked for association in pattern of hourly public information arrival and aggregate measures of intraday market activity. An early seminal study was that of Rozeff and Kinney (1976) who conjectured a relationship between information flow and stock market activity stating that abnormal stock returns in the moth of January may be due to above-average flow of information generated by firms in that month. Other later studies include Penman (1987) who looked at distribution of corporate earnings news and aggregate stock returns, and Atkin and Basu (1991). Even the event study analysis in context of financial markets pioneered by Fama (1965) can also be counted towards this line of research.
One fundamental issue in all such studies is the definition that what constitutes information and its measurement. Researcher bias is bound to come into play in it. In order to minimise this bias we resorted to a broad measure of information that includes financial, macroeconomic, political, and other types of information. To collect data on “information” we have gathered news that made headlines in the national newspapers the daily “Business Recorder” and the daily “Dawn”. The details are given in later section. Another issue in such studies is how to know the relative importance of various kinds of information because not all news items are equally important in the consideration of market participants. Moreover, some news announcements may be expected news therefore these may not impact the market returns if the markets are efficient. To be precise, the affect of news depends upon change in market valuation times 1 minus probability of announcement. To the extent the announcement is already anticipated the probability of surprise tends to zero and hence the affect of news on the market tends to zero. This creates an attenuation bias in the test of market efficiency. To take into account this factor we have extracted deviations from average information. And to account for differences in relative importance of various kinds of information we have used two newspapers as proxies for relative importance of information.

Semi-strong Form Efficiency of Stock Market 653
Yet another issue is of the endogenity of information, that some news items may be generated due to abnormal behaviour of the market. Our methodology does not provide control on this but we explicitly checked for the size importance of such endogenity and found it to be very small.
The present study would be important from three perspectives. First, it would provide a direct test of semi-strong form of efficient market hypothesis in context of an emerging stock market that of Pakistan. Second, it can be used to check the importance of private information—i.e., both the insider information and the information that is generated during the process of trade—in Pakistan’s stock markets. Thus providing a base for future work on the microstructure of the market. Third, it will help discern the relative importance of different categories of information—a result that may be of interest to stock traders.
2. DATA DESCRIPTION
2.1. The Information Variable
The data on information is collected on daily basis from the headlines of front-page news of Daily Dawn and Business Recorder. The Business Recorder is more business and economic oriented newspaper whereas Dawn is a general newspaper. This difference in the nature of newspaper is expected to capture the relative importance of market relevant information. The length of data period is July 01, 1998 to December 31, 2000. Total 15772 news headlines are collected in which 10510 are taken from Business Recorder and 5262 from Dawn. During this sample period there are 619 days in which Karachi Stock exchange was open and trading took place.
This sample period is interesting in that diverse kinds of information were generated during this period. Three major events that took place during this period had implications for the stock market. First, the nuclear tests of May 28, 1998 by Pakistan; It created deep effect on the financial sector in two ways: (i) the imposition of economic sanctions by foreign countries, (ii) internal handling of affairs by declaration of emergency under article 232 and freezing of foreign currency accounts. Second, the controversy between IPP’s (Independent Power Producers) and government of Pakistan regarding the HUBCO project peaked during this time. The contribution of HUBCO in the total trading volume of KSE is large so is its importance in KSE-100 index. Therefore any factor that affects HUBCO can significantly affect the aggregate activity in stock market. Consequently, any news regarding HUBCO affects the activity of stock exchange. Third, Military regime came into Power. This resulted in uncertainty in domestic business environment accompanied by further economic sanctions by foreign governments. Furthermore, efforts to increase the tax base of the country by the government but which were opposed by the business also affected the stock market.

Ali and Mustafa 654
2.2. Why Use Daily Data?
Our purpose is to check for relationship between public arrival of information and excess returns. The short term and immediate effects of information can be easily observed in daily data. Some times information affects the stock on same day. But if the market is not informationally efficient then it may affect after one day, two days, and three days. This insight is not available with monthly or weekly data. Moreover, long horizon data create difficulties in measuring excess return. It may be undetectable when the two or three days of excess returns mix. Real effects might be missed when broad based or long horizon data is used. Monthly data get adjusted to the new information much easily as compared to the weekly and daily data on stock market activity and it may falsely portray efficient stock market. Jun and Uppal (1994) pointed that monthly data creates spurious conclusion about the efficiency of market due to adjustment of information. Khilji (1993) and Uppal (1993) have used monthly data and their results are limited by this fact. About his own study Khilji (1993) indicates the surprising result and suggest the same study on the basis of weekly data or daily data.
2.3. Summary of News Statistics
Summary statistics of news information is given in Table 1. The news, which is taken from Business Recorder and Daily Dawn , published on front page.
In our data the mean of total daily news is 25.48 and standard deviation is 3.43. The total minimum news items on any day are 16, that were published on October 17, 1998 and the maximum news on any day are 36, which were published on May 11, 2000. Analysing each newspaper separately the average of the total Business Recorder news is 16.98 and standard deviation is 3.06. The maximum news items are 25 published on March 25, 1999 and minimum news items are 08 published on February 6, 1999. The average of total Dawn news is 8.47 and standard deviation is 1.50. The maximum daily news items are 14 published on August 05, 1999 and minimum daily news items are 05 published on July 07, 1999. The standard deviation of total news is larger which shows that the arrival of news is quite variable on day-to-day basis. The standard deviation of Dawn news is 1.50, which shows the consistency in the arrival of news. Adjusting the variance for
Table 1
Summary Statistics for Daily News Announcement News Published by Newspaper
Number of News
Item
Mean Number of News
Standard Deviation
Coefficient of Variation
Maximum News
Minimum News
Total News 15772 25.48 3.43 0.135 34 16 Business Recorder 10510 16.98 3.06 0.180 25 08 Dawn 5262 8.497 1.50 0.177 14 05

Semi-strong Form Efficiency of Stock Market 655
differences in means by calculating the coefficient of variation, there is not much difference in the daily variability of news arrival between Dawn and Business Recorder. There is some common news in both newspapers. The nature of news of Dawn is general economic and political news whereas the nature of Business Recorder news is economics and business. Both Business Recorder and Dawn cover general economic news.
Table 2 shows the trend in news information by months. On the basis of selected sample data the largest means of total news is 26.93 per day reported in November and the lowest average of news is 24.92 per day reported in March. Regarding to Business Recorder the largest and smallest news information is in the same months of means total news. Pertaining to Dawn the largest mean news were published in January (9.26 per day) and lowest in May (7.93). Average daily number of news increased during the first six months of fiscal year and declined during the last six months. The pattern may be due to various news items explaining the budget, mini budgets, and company performance news (for most of the companies end year is June or September around it the companies release information on their business performance), income and sales tax news etc.
Furthermore, we also analyse the means of total information by the day of the week Table 3 shows the same. The mean of total news information rise from Monday to Thursday but slightly decrease on Friday, which show the number of news announcements is smaller on the days before holiday. Jain and Joh (1988) and Lakorishok and Maberly (1990) have examined the news information trends in stock market activity.
Table 2
Summary Statistics for Monthly News Announcement
Month Trading Days Average
Total News Average News of Business Recorder
Average News of Dawn
January 34 25.23 16.97 9.26
February 40 25.96 16.80 9.15 March 40 42.92 16.47 8.45
April 40 25.37 17.17 8.20
May 43 25.27 17.34 7.93 June 43 24.97 16.62 8.27
July 66 25.06 16.78 8.46
August 64 25.34 17.02 8.32 September 63 25.53 16.96 8.57
October 64 25.70 17.21 8.48
November 62 26.93 18.32 8.61 December 61 24.95 16.50 8.44

Ali and Mustafa 656
Table 3
Summary Statistics for Day of the Week News Announcement
Days Trading
Days
Means of Total News
Means of News Bus. Recorder
Means of News Dawn Max. Min.
Monday 123 23.40 14.95 8.43 33 16 Tuesday 123 25.52 16.83 8.68 33 19 Wednesday
124 26.06 17.65 8.41 34 20
Thursday 127 26.87 17.50 8.37 34 18 Friday 113 26.66 18.08 8.58 34 20 Saturday 10 24.10 15.40 8.7 30 19
Table 4
Summary Statistics of Descriptive News Types of News No. of News No. of News 15772 HUBCO and IPP 1085 IMF and World Bank 1507 Foreign Currency Account 312 CTBT and Nuclear Test 307 Aid from Other Countries 374 Violence and Strike 183 Devaluation and F.E. Reserve 207 Kashmir Issues 265 Kargil Issue 21 Paris Club 72 Political News 598 Stock Market News 113 World News 173 Miscellaneous 10755
The summary statistics in Tables 1, 2 and 3 showed that there is consistency
in daily variability of news across the two newspapers and that the daily average number of news/information exhibit some systematic pattern. This pattern will draw the spurious result if there is some common environment that is responsible for generating a pattern in information as well as in the measures of stock price or market activity. To avoid such spurious result a general econometric technique is to work with the differenced data.
But there is a bigger problem, as mentioned earlier, in using the raw data on number of daily news items as information variable. It is that some news items may

Semi-strong Form Efficiency of Stock Market 657
be only the publication of already anticipated news, which is not likely to impact market valuation of stocks on the day of publication. The raw data on number of daily news items does not differentiate between anticipated and unanticipated announcements. Moreover, news around a certain event may come in clusters and some times repeated for more than one day.
To account for all the three factors mentioned above we define information as difference between numbers of daily news items from its twenty-day moving average. The idea is that this method will capture innovations or unanticipated element in news. Figure-1 shows the raw data on number of daily news items and Figure-2 shows deviation in number of daily news from its twenty day moving average.
2.4. Measurement of Market Activity
For the purpose of this study we are interested in measuring aggregate level of market activity. We utilised two measures: (i) returns in stock market, (ii) abnormal trading volume. The market returns are obtained by taking first difference of natural logarithm of daily KSE-100 index.
Another measure of market activity i.e., the abnormal daily trading volume is obtained by first taking the natural logarithm of volume and then, subtracting it from its twenty day moving average.
3. EVIDENCE OF A SYSTEMATIC PATTERN IN
RETURNS AND VOLUME
3.1. Evidence of a Systematic Pattern in Return and Volume
Before we embark on our main task of relating information to market returns and volume it is important to check weak form efficiency of Pakistan’s stock market and to check for systematic patterns in returns, e.g. the day of the week, and month of the year effects in our data. Such patterns are wide spread in other stock markets and reported extensively in the literature. In context of Pakistan, Hussain (1999) and XYX (abcd) have shown existence of Ramadan effect, and month of the year effect using monthly data covering a different sample period than ours. For us it constitutes sufficient evidence for existence of pattern, but we want to know the existence of such patterns in the daily data as well that we are using. For this purpose we start with the test of random walk model.
According to random walk model hypothesis the successive returns in an individual stock returns are independent. To test this hypothesis we compute the differences of two successive prices in natural logarithms, which is the stock returns and then calculate the correlation with different lags. Table 5 shows the correlation between stock returns with different lags.

Summary of News Surprises By Day of the Week News Surprises taken as deviations from twenty-day moving average
Total Monday Tuesday Wednesday Thursday Friday Saturday Mean 0.032833 2.122689 –0.032535 –0.515254 –0.382520 –1.159722 1.522222 Median 0.100000 2.150000 0.250000 –0.625000 –0.400000 –1.600000 3.000000 Maximum 8.850000 8.150000 5.600000 5.350000 8.850000 6.000000 5.450000 Minimum –8.400000 –5.750000 –8.400000 –7.650000 –7.800000 –8.250000 –3.800000 Std. Dev. 3.217333 3.067909 2.981778 2.909229 3.199660 2.957720 3.331489 Skewneww –0.042352 –0.429102 –0.304555 –0.119470 0.059253 0.221685 –0.660075 Kurtosis 2.473674 2.846868 2.488605 2.220232 2.843365 2.462220 2.014762 Jarque-Bera 7.104850 3.768146 3.136348 3.270222 0.197712 2.186024 1.017560 Probability 0.028655 0.151970 0.208425 0.194931 0.905873 0.335205 0.601229 Observations 600 119 119 118 123 108 9

Semi-strong Form Efficiency of Stock Market 659
Table 5
Random Walk Model Test Correlation Coefficient of Successive Returns Lags 1 2 3 4 5 6 7 8 9 10
Rt 0.078 0.080* 0.014 –0.25 0.044 –0.02 –0.04 0.025 0.025 –0.05
The above table shows that there is serial dependence between two successive
returns but all coefficients of correlation are statistically insignificant except that with lag 2, it is positive and significant. This shows that two days old returns have predictive power for today’s stock returns. This runs against the weak form efficiency of the stock market, which predicts that past returns should not have any explanatory power for current returns once immediate past returns are taken into consideration.
Table 6 shows day-of-week trend in the market activity. We estimate the day-of-week dummy variables with trading volume and stock returns, which indicate the deviation of volume or returns on particular day from the mean value of the given variable. The trading volume exhibits a pattern that on Wednesdays it is 12.2 percent higher relative to the average daily volume and on Fridays it is 13.6 percent lower than an average daily volume. This result is statistically significant. The pattern in stock returns is such that the returns are 0.5 percent higher than average on Mondays and 0.5 percent lower than average daily returns on Fridays. The result is statistically significant. The consistently less than average daily trading volume and stock returns on Friday may be attributed to short trading hours due to Jumma prayers.
Table 6
Day of the Week Trends in Market Activity Day of the Week Trading Volume Stock Return Monday –0.0236
(–0.492) 0.005039*
(2.336)
Tuesday 0.00488 (0.142)
–0.00178 (–0.824)
Wednesday 0.122* (3.271)
0.000989 (0.458)
Thursday 0.03864 (1.138)
–0.00109 (–0.511)
Friday –0.136* (–3.896)
–0.00583* (–2.617)

Ali and Mustafa 660
4. ANALYSIS OF THE RELATION BETWEEN INFORMATION AND MARKET ACTIVITY
4.1. Correlation between News Information and Market Activity
Most of the statistical tests for the stock market efficiency with respect to information are based on correlation coefficients and their transformations. A standard process is to test the null hypothesis that coefficient of correlation between information and stock prices is zero. If new information immediately reflects in stock prices then, the correlation coefficient would be + 1 (or –1) indicating that the market is fully efficient. Additionally we have also used regression analysis to test for informational efficiency.
As discussed earlier we have focused only on the public information. Informational efficiency in this context means that public information is fairly rapidly incorporated in security prices. An implication of efficient market is that it is not easy to manipulate, hence small investors will also take interest in investment in stock market. Attempts to earn excess returns on the basis of public information in standard ways are unlikely to be successful. All techniques and all forms of public information have not been tested in this paper for excess returns. However, sufficient numbers have been tested to indicate that an investor should be cautious about selecting stocks simply on the basis of new publicly available information.
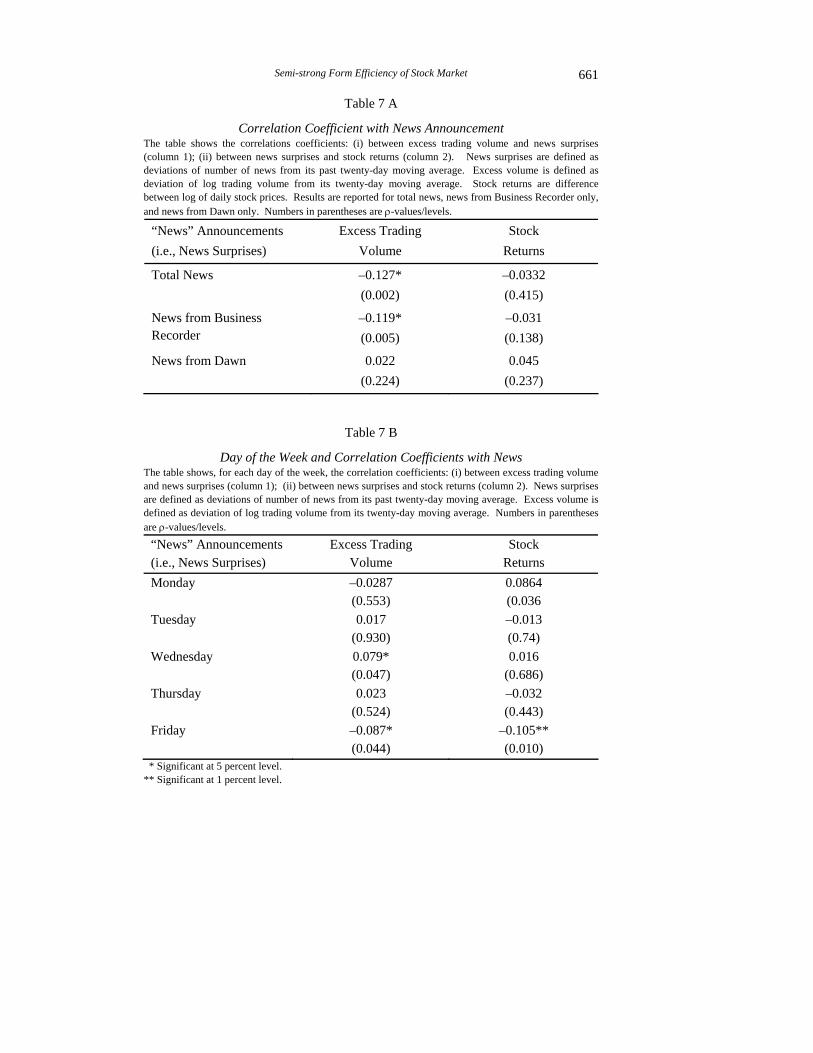
The news information, excess trading volume and return variables are computed as defined in the data section. The results on correlation coefficients are shows in Table 7-A. The coefficient of correlation for news information and trading volume is represented is column 1. For all news information the correlation coefficient is 0.127, which is negative and statistically significant. For separate news sources the coefficient of correlation between news in Business Recorder and volume is negative and statistically significant, while that between news in Dawn and volume is positive but statistically insignificant. It shows that information does impact on trading volume but this relation is weaker. To capture the day of the week effect on the correlations we calculated these correlation coefficients separately for each day of the week. The results are reported in first column of Table 7-B. For Wednesday and Friday the coefficient of correlation is significant. On Wednesday the correlation is positive and significant. On Friday the coefficient of correlation is negative but significant. It shows that the role information on Friday is negative.
When same analysis is carried out for stock returns (reported in column 2 of Table 7-A and 7-B), the association with all news information is negative and statistically insignificant. In day of the week effect for Monday the coefficient of correlation is positive and weak but statistically significant. For Friday the relation is negative and weak but significant.
Semi-strong Form Efficiency of Stock Market 661
Table 7 A
Correlation Coefficient with News Announcement The table shows the correlations coefficients: (i) between excess trading volume and news surprises (column 1); (ii) between news surprises and stock returns (column 2). News surprises are defined as deviations of number of news from its past twenty-day moving average. Excess volume is defined as deviation of log trading volume from its twenty-day moving average. Stock returns are difference between log of daily stock prices. Results are reported for total news, news from Business Recorder only, and news from Dawn only. Numbers in parentheses are ρ-values/levels.
“News” Announcements (i.e., News Surprises)
Excess Trading Volume
Stock Returns
Total News –0.127* (0.002)
–0.0332 (0.415)
News from Business Recorder
–0.119* (0.005)
–0.031 (0.138)
News from Dawn 0.022 (0.224)
0.045 (0.237)
Table 7 B
Day of the Week and Correlation Coefficients with News The table shows, for each day of the week, the correlation coefficients: (i) between excess trading volume and news surprises (column 1); (ii) between news surprises and stock returns (column 2). News surprises are defined as deviations of number of news from its past twenty-day moving average. Excess volume is defined as deviation of log trading volume from its twenty-day moving average. Numbers in parentheses are ρ-values/levels.
“News” Announcements (i.e., News Surprises)
Excess Trading Volume
Stock Returns
Monday –0.0287 (0.553)
0.0864 (0.036
Tuesday 0.017 (0.930)
–0.013 (0.74)
Wednesday 0.079* (0.047)
0.016 (0.686)
Thursday 0.023 (0.524)
–0.032 (0.443)
Friday –0.087* (0.044)
–0.105** (0.010)
* Significant at 5 percent level. ** Significant at 1 percent level.

Ali and Mustafa 662
It appears that a relative weak relation exists between news information and stock returns. There are various reasons for it. First, much of the news information may be firm specific and does not impact the aggregate stock price index. Second, Public Information news does not posses the importance of particular news information. Third, KSE does not link with foreign stock market, which is why impact of news information cannot be incorporated in KSE index. Fourth, KSE is the emerging market, which casts down on the validity of the model regarding to information. Fifth, the data on information is collected from Business Recorder and Dawn and the news therein are imperfect substitute for new information. That is, these news items are settled information hence could not convey sudden and abrupt reaction on trading activity.
4.2. Regression Analysis between News Information and Market Activity
Regression shows the casual relationship between dependent variable and independent variable. We regress the model on market activity i.e. trading volume and stock returns as dependent variable and news information as independent variable. The regression analysis focuses on the aggregate data for excess volume and returns and total number of news per day as public information. Regression analysis is given in Table 8.
Table 8
Regression of News Information and Market Activity Table shows the results of univariate regressions of stock returns on total news and excess trading volume on total news with multiplicative dummies for each day of the week and without dummies. Stock Returns = a + b1 (Total Number of News)* D1 + b2 (Total Number of News) *D2 + b3 (Total Number of News) *D3 + b4 (Total Number of News) *D4 + b5 (Total Number of News) *D5. Similarly, Ln (Excess Trading Volume = c + g1 (Total Number of News) *D1 + g2 (Total Number of News) *D2 + g3 (Total Number of News) *D3 + g4 (Total Number of News) *D4 + g5 (Total Number of News) *D5. Where D1 to D5 are dummy variables for each day of the week Monday to Friday. Numbers in parentheses are t-values.
Stock Returns Trading Volume Total No. of News Items –0.0038
(–0.62) –0.0441* (–2.84)
Monday 0.0014* (2.12)
–0.012 (–0.007)
Tuesday –0.0021 (–0.33)
0.007 (0.43)
Wednesday 0.0002 (0.40)
0.032* (1.94)
Thursday –0.0006 (–0.784)
0.009 (0.561)
Friday –0.0017* (–2.59)
–0.036* (–2.14)

Semi-strong Form Efficiency of Stock Market 663
The first column shows the univariate regression between stock returns and news information. The coefficient of news is negative and insignificant at 5 percent level. The second column shows the univariate regression between trading volume and news information. The news coefficient is negative and significant at 5 percent level. These suggest that if information increases by 100 percent, the trading volume decreased by 4.41 percent.
The day of the week shows regression of the news and market activity that include dummy variable for each day of the week. The univariate regression between stock return and information on Tuesday, Thursday and Friday is negative. The coefficient of information is insignificant but for Monday and Friday and significant. The coefficient of news information to trading volume on Wednesday is 0.032, which is positive and significant and for Friday, it is negative and significant. It means if 100 percent news information increase the stock return increased 3.2 percent on Wednesday and decreased by 3.6 percent on Friday.
From the above analysis of correlation coefficient and univariate regressions we have seen that there are some cases of direct relation and other cases of inverse relation. On a closure look we find that this relation explains the common day of the week trends of information, volume and return. For example compare the signs of coefficients for day of the week effect in Tables 6, 7-B, and 8 and note that they change in coherence. The most common day related to stock returns and trading volume is Friday in which stock activity is comparatively low. The investors do not sell equity on that day and expect that they will be able to earn more profit on Monday. That is why trading is slightly more on Mondays as compared to Fridays. But on the opening day of the week the investors are reluctant to purchase the stocks and they wait more. That is why Wednesday is more active as compare to all other days. The contrasting results between relationship of volume and returns with publicly available news are consistent with the French-Roll (1986) opinion that public information can be incorporated into prices without significant trading volume.
5. FURTHER CHECKS
So far we have shown that the relationship between broad-based definition of information and market activity exists but it is weak. As discussed earlier, the small magnitude of the coefficients may be due to reasons such as the following: The news used in this study as information could not capture the sudden and abrupt nature of information. We have selected simply the headlines on front pages published in the daily Dawn and Business Recorder. Unexpected or shocking news e.g., war, dispute between India and Pakistan about Kashmir matters, dispute between Pakistan and HUBCO authorities, IMF and World Bank news etc. may

Ali and Mustafa 664
have greater effect on trading activity of stock market as compared to the company news, dividend announcement etc.
For this purpose we narrowed the definition of information from its broad-based version. We, therefore, selected some particular news to see the reflection of information on stock activity. This method is expected to use a priori information about importance of news stories. For this purpose two dummy variables are introduced. First dummy takes the value of 1 for having at least one news item about IPP or IMF or World Bank related issues on a given day published in the newspapers and zero otherwise. This is done because news about IPPs is expected to affect the stocks of HUBCO, which constitutes about 36 percent of total stock market shares. Second dummy is associated with above average news. It takes a value of 1 when on a given day a total of 26 or more news are recorded and zero other wise. This approach is in line with method of Niederhoffer (1971) and Cutler, Poterba, and Summers (1989) to study the impact of particular news that researchers think important.
Table 9 shows the number of news involving IMF, IPP (including that of World Bank and HUBCO) by week of the day, Mondays and Tuesdays have less than average news as compared to other days. Much of news pertaining to the above topics was published on Saturday and Sunday when the stock markets were closed.
Table 9
Number of Combined News of IMF and IPP etc., By Day of the Week Days News of IMF and IPP Monday 220 Tuesday 214 Wednesday 238 Thursday 272 Friday 246 Standard Dev. 1.035
Table 10 shows the results of four separate regressions of excess trading
volume and stock returns on dummy variable for above average news and on dummy variable for IPP-HUBCO news.
Table 10
Regressions of Above-average News and Importance of News with Proxies Nature of News Items Excess Trading Volume Stock Returns Above-average News –0.084*
(–1.94) 0.00009 (0.057)
News of IMF and IPP 0.0205 (0.465)
–0.00085 (–0.488)

Semi-strong Form Efficiency of Stock Market 665
It shows that the above average news has negative significant effect on trading volume, while the combined news of IPPs IMF and World Bank has no significant effect on trading volume. Unlike the trading volume, neither the above average news nor the combined news have any significant effect on return. These results are in contrast to French-Roll (1986) who argued that the above average news and importance of news has significant effect on return rather than trading volume. The present study shows the trading volume is affected by the two news categories mentioned above.
We further investigated these relationships separately for each day of the week and found interesting result in day of the week pattern. These are reported in Tables 11 and 12.
Table 11
Regression of Combined News of IMF and IPP with Dummy Variable in Day of the Week
Days Trading Volume Stock Returns Monday –0.088
(–1.21) 0.0027 (0.96)
Tuesday 0.067 (0.97)
0.0014 (0.525)
Wednesday 0.121* (1.81)
0.7565 (0.443)
Thursday 0.037 (0.587)
–0.0023 (–0.92)
Friday –0.109* (1.64)
–0.0036* (–2.15)
Table 12
Regression of Above-average News with Dummy Variable in Day of the Week Days Trading Volume Stock Returns Monday –0.268*
(–2.47) 0.003 (0.63)
Tuesday –0.0012 (–0.97)
0.003 (1.21)
Wednesday 0.018 (0.26)
–0.0008 (–0.31)
Thursday 0.002 (0.02)
0.0003 (0.148)
Friday –0.180 (–0.06)
–0.004* (–1.62)

Ali and Mustafa 666
Regression of combined news has positive and significant effect on trading volume on Wednesday and has negative and significant impact on Friday. This has resemblance to the results with total number of news that were reported in Table 8. One the other hand, the above average news has negative and significant impact on trading volume on Monday and on return on Friday.
CONCLUSION
In this study we have examined the linkage of news published in daily Business Recorder and Dawn with aggregate stock market activity measured by market returns and trading volume. We have found that at aggregate level the news surprises and number of news both are negatively related to stock market activity in Pakistan. This relationship is statistically significant in case of trading volume but insignificant in case of stock returns.
We also found the day of the week patterns in these relationships. This relation (market activity and news) is also robust with news importance and above average news. The days having larger news have significantly negative impact on volume but have no impact on return. More narrow definition of news (i.e., combined news of IPP and IMF) has no significant impact on volume and return. Although in most of the cases our relation is significant, but this relation is weak.
The analysis points to the fact that in Karachi Stock Exchange public information does not play as important role in day to day variation in stock returns than the role played by private information (and non-informational reasons). Here the term private information is used to denote all non-public information such as insider information as well as the information generated by the process of trade itself.
The analysis points to the difficulties in finding observable relationship between public information and market activity and that this relationship may not be simple. There is a possibility that the news, which we have taken as informational variable, does not cover all important and surprising news. But we have tried to control for this as much as we could by broad-basing the definition of news as well as by focussing on a narrower definition of information.
We also note an interesting point regarding day of the week pattern in market activity. From trading volume point of view Wednesdays are most prominent as trading activity is very brisk on this day while it is very sluggish on Friday, which can be due to short span of market time and Jumma prayer. From return point of view Monday is the best day in which high returns are obtained but Friday it is worst, which show losses.
RECOMMENDATIONS AND SUGGESTIONS
The focus of the securities markets regulations and practices should be to enhance the role of public information and reduce the role of private information.

Semi-strong Form Efficiency of Stock Market 667
(1) There is a need to improve the quantity, quality and credibility of information that companies disclose to the investing public. This should be in the shape of establishment of an online information service, issuance, by the companies, of regular and detailed reports besides usual annual reports. Insisting on regular distribution of dividends in cash.
(2) Investors’ protection from sharp brokerage practices such as insiders trading and excessive speculation should be made possible by implementation of laws against such practices.
(3) At present credibility of many listed companies is low because their boards of directors consist of their own family members. This is likely to give greater weight to the interest of select groups. Securities and exchange committee is reportedly taking up this matter.
(4) Regulating the stock traders and improving the payment and settlement system of trade such that no one trades beyond his net wealth to reduce speculative trade and the liquidity motivated trade.
(5) Promotion of research and development in all brokerage firms could also help in informed investment and reduce the sharp fluctuations.
Appendix
SUMMARY OF NEWS HEADLINES AS INFORMATION VARIABLE
This study uses publicly available news as public information and relates it to stock market activity. Therefore the news covered belongs to international and domestic events, political and macroeconomic news, as well as company performance news and events. Following are some major categories of news along with some description that were published during our sample period.
During 1998–2000 the confidence of foreign and local investors remained subdued because of variety of reasons including: the impact of freezing of foreign currency accounts, the IPP issues, economic sanctions and slow down of economic activities. The confidence level stood up to 42 percent. On economic front all development led towards the uplifts of the economy i.e. the release of funds by IMF and World Bank and rescheduling of loans by Paris club but it would not evoke a strong response from investors. The much-awaited decisions by Lahore High Court on frozen currency accounts and immediate deferment of action by the Supreme Court of Pakistan also had deepening effect on investor’s confidence. Investors’ confidence that got a major blow after the post nuclear development could not be restored during the Fiscal Years 1998–2000. Consequently the confidence level remained in the lower categories.
IMF and World Bank related news had been importance news regarding to stock market activity. Usually the news regarding these two institutions has been
Ali and Mustafa 668
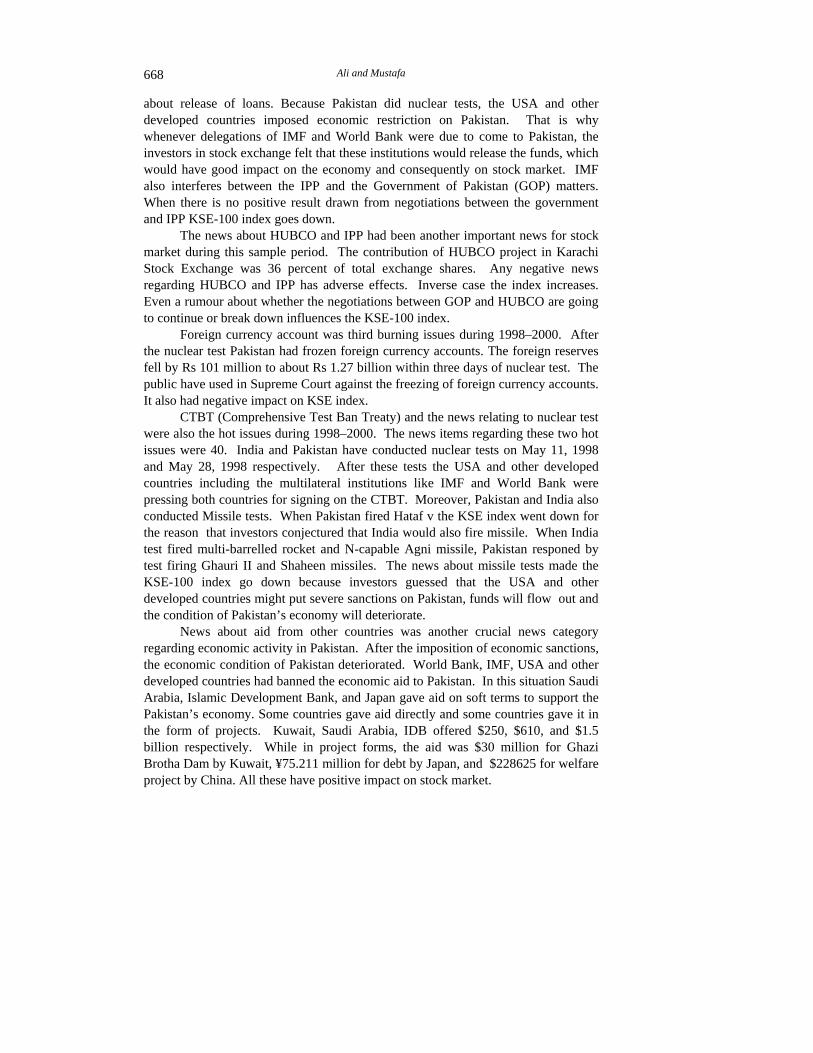
about release of loans. Because Pakistan did nuclear tests, the USA and other developed countries imposed economic restriction on Pakistan. That is why whenever delegations of IMF and World Bank were due to come to Pakistan, the investors in stock exchange felt that these institutions would release the funds, which would have good impact on the economy and consequently on stock market. IMF also interferes between the IPP and the Government of Pakistan (GOP) matters. When there is no positive result drawn from negotiations between the government and IPP KSE-100 index goes down.
The news about HUBCO and IPP had been another important news for stock market during this sample period. The contribution of HUBCO project in Karachi Stock Exchange was 36 percent of total exchange shares. Any negative news regarding HUBCO and IPP has adverse effects. Inverse case the index increases. Even a rumour about whether the negotiations between GOP and HUBCO are going to continue or break down influences the KSE-100 index.
Foreign currency account was third burning issues during 1998–2000. After the nuclear test Pakistan had frozen foreign currency accounts. The foreign reserves fell by Rs 101 million to about Rs 1.27 billion within three days of nuclear test. The public have used in Supreme Court against the freezing of foreign currency accounts. It also had negative impact on KSE index.
CTBT (Comprehensive Test Ban Treaty) and the news relating to nuclear test were also the hot issues during 1998–2000. The news items regarding these two hot issues were 40. India and Pakistan have conducted nuclear tests on May 11, 1998 and May 28, 1998 respectively. After these tests the USA and other developed countries including the multilateral institutions like IMF and World Bank were pressing both countries for signing on the CTBT. Moreover, Pakistan and India also conducted Missile tests. When Pakistan fired Hataf v the KSE index went down for the reason that investors conjectured that India would also fire missile. When India test fired multi-barrelled rocket and N-capable Agni missile, Pakistan responed by test firing Ghauri II and Shaheen missiles. The news about missile tests made the KSE-100 index go down because investors guessed that the USA and other developed countries might put severe sanctions on Pakistan, funds will flow out and the condition of Pakistan’s economy will deteriorate.
News about aid from other countries was another crucial news category regarding economic activity in Pakistan. After the imposition of economic sanctions, the economic condition of Pakistan deteriorated. World Bank, IMF, USA and other developed countries had banned the economic aid to Pakistan. In this situation Saudi Arabia, Islamic Development Bank, and Japan gave aid on soft terms to support the Pakistan’s economy. Some countries gave aid directly and some countries gave it in the form of projects. Kuwait, Saudi Arabia, IDB offered $250, $610, and $1.5 billion respectively. While in project forms, the aid was $30 million for Ghazi Brotha Dam by Kuwait, ¥75.211 million for debt by Japan, and $228625 for welfare project by China. All these have positive impact on stock market.

Semi-strong Form Efficiency of Stock Market 669
Law and order remained one of the major problems in Pakistan especially in Karachi during this sample period. When there was any disturbance in Karachi it had negative effect on the KSE index. In this situation the confidence of people weakens and they don’t take interest in investment in stock market. When the situation of law and order improves the confidence regain and KSE index goes up. News about law and order situation pertains to killing, violence and strikes were therefore considered.
Devaluation and foreign exchange reserve position are also the factors that influence on stock market. After the nuclear test, the foreign exchange reserve decreased. Government tried to increase the reserves by devaluation of currency. Devaluation increase the export and reduces the import, which can increase the foreign exchange reserve. But our exports and imports are price inelastic which have results in very small effect on foreign exchange reserves. Consequently, the government relies on foreign debt to make up the finance gap, our debt burden increases and overall effect on the economy is negative and thus on KSE-100 index. Government also purchases the foreign currency from foreign markets. Whenever the foreign exchange reserve situation improves the KSE-100 index goes up.
Kashmir and Kargil issues were most disputed and important issues between Pakistan and India. Due to disturbance in occupied Kashmir India attacked on Azad Kashmir of Pakistan . Whenever tension increases at the Line of Control in Kashmir, it also affects KSE-100 index. In May–June 1999 the Kargil issue aroused, which had adverse affect on KSE-100 index.
For the betterment of stock market the government of Pakistan took different measures during this sample period. For example, five major banks agreed to inject liquidity in share markets, which impacted positively on the stock market.
Political news is one of the major factors that influences stock market. Some important political developments during our sample period were: resignation of General Jehangir Karamat as Chief of Army Staff, quitting of MQM ministers from the Sindh Government, suspension of Sindh assembly, change of the Governor in Sindh, Supreme Court’s decision about arrest of Benazir Bhutto, dissolution of Muslim League’s government, military regime came into government, change of Governor of Sindh and NWFP are the major political news during 1998–2000. Some political steps had been taken for the betterment of situation of Sindh, which also have positive impact on KSE-100 index.
There was also some international news, which had influenced stock market. For example, recession of Japan which impact on its exports, US President Clinton’s message to the Prime Minister of Pakistan, about dialogue with India, shut down of US embassy, US strikes at targets in Afghanistan and Sudan, Clinton’s visit to Pakistan and India, dispute about presidential elections of USA between the two political parties. These were some news at international level, which influenced stock exchange.
Ali and Mustafa 670
REFERENCES
Ahmed, E., and J. B. Rosser (1995) Non Linear Speculative Bubbles in Pakistan Stock Market. The Pakistan Development Review 34:1, 5–42.
Cutler, David M., James M. Poterba, and Lawrence H. Summers (1989) What Moves Stock Prices? Journal of Portfolio Management 15, 4–12.
Damodaran, Aswath (1989) The Weekend Effect in Information Release: A Study of Earnings and Dividends Announcement. Review of Financial Studies 2, 607–623.
Ederington, Louis H., and Jae Ha Lee (1993) How Market Process Information: News Release and Velocity. Journal of Finance 48, 116–1191.
Fama, Eugene F., and Marshall F. Blume (1966) Filter Rules and Stock Market Trading. Journal of Business 39, Special Supplement, 226–241.
Fama, E., L. Fisher, M. Jenson, and R. Roll (1969) The Adjustment of Stock Prices to New Information. International Economic Review 10: 1, 1–21.
Farid, Aslam., and Ashraf Javed (1995) Volatility at Karachi Stock Exchange. The Pakistan Development Review 34:4, 651–657.
French, Kenneth, and Richard Roll (1986) Stock Return Variances: The Arrival of New Information and the Reaction of Traders. Journal of Financial Economics 17, 5–26.
Haugen, Robert A., Eli Talmor, and Walter N. Torous (1991) The Effect of Volatility on the Level of Stock Prices and Subsequent Expected Returns. Journal of Finance 46, 985–1007.
Husain, Fazal (1997) The Random Walk Model in the Pakistan Equity Market: An Examination. The Pakistan Development Review 36:3, 221–240.
Husain, Fazal (1998) A Seasonality in the Pakistan Equity Market: The Ramadhan Effect. The Pakistan Development Review 37:1.
Jaffe, Jeffrey F. (1974) Special Information and Insider Trading. Journal of Business 47, 410–428.
Jun, K., and Jamshed Uppal (1994) Portfolio Flows to Pakistan: Trends and Policies. A Paper presented at the Private Sector Development Conference, LUMS.
Khilji, N. (1993) The Behaviour of Stock Returns in an Emerging Market: A Case Study Pakistan. The Pakistan Development Review 32:4, 593–604.
Khilji, N. (1994) Non-linear Dynamics and Chaos: Application to Financial Market in Pakistan. The Pakistan Development Review 33: 4, 1417–1429.
Leland, Hayne, (1992) Insider Trading: Should it be Prohibited? Journal of Political Economy 100, 859-887.
Mitchell, Mark L., and J. Harrold Mulhern (1994) The Impact of Public Information on the Stock Market. Journal of Finance 49:3, 923–58.

Semi-strong Form Efficiency of Stock Market 671
Niederhoffer, V., and M. Osborn (1966) Market Making and Reversal on the Stock Exchange. Journal of the American Statistical Association 61, 897–916.
Niederhoffer, Victor (1971) The Analysis of World Events and Stock Prices. Journal of Business 44: 2, 193–219.
Penman, Stephen H. (1987) The Distribution of Earnings News Over Time and Seasonalities in Aggregate Stock Returns. Journal of Financial Economics 18, 199–228.
Rozeff, Michael S., and Jr. William R. Kinney (1976) Capital Market Seasonality: The Case of Stock Returns. Journal of Financial Economics 379–402.
Schwert, G. William (1981) The Adjustment of Stock Prices to Information about Information. Journal of Finance 36: 1, 15–30.
Ying, Charles C. (1996) Stock Market Prices and Volume of Sales. Economertrica. 34, 676–685.
Zakon, Alan J., and James C. Pennypacker (1968) An Analysis of the Advance-decline as a Stock Market Indicator. Journal of Financial and Quantitative Analysis 3, 299–314.

Comments
First, I would like to congratulate the authors for a competent and well-crafted work which investigates in a rigorous manner the extent to which publicly available news affects stock market prices. A large number of tests, replicating many which have been carried out for the US Stock Market, show that the Pakistani stock market appears to be more or less efficient in this respect. That is, publicly available information is sufficiently speedily incorporated into stock market prices that speculator would be well-advised not to speculate on this basis. It would be worthwhile comparing these results with those obtained for other emerging stock markets. In this respect, it is important to note that it is regional studies like these are not typically published in global international journals. However studies similar to these are being carried out in many different countries with emerging stock markets. For those of us researching issues related to LDCs, it would be very useful to directly cultivate research links with other LDCs. Currently the educational/research model in use is the center-periphery one, where all of us read the major international journals published in USA and Europe as well as our own local journals, but we do not typically read work published in local journals in Turkey, Iran, India etc. However, the most relevant and significant research for us may well be that available in other LDCs.
Specific comments related to technical aspects of the paper are as follows. The authors comments in the second paragraph that various empirical regularities violating the efficient markets hypothesis have been discovered on US data. In many cases, it has been discovered that these violations are due to a small number of outliers. Once these outliers are removed, the efficient market hypothesis does appear to work in developed markets. This is in contrast with the picture that emerges from research on emerging markets. Typically (though not in the present study) more violations of efficiency are found in emerging markets. This suggests the hypothesis that efficiency is created by a process of learning over time. As speculators learn to exploit inefficiencies in emerging markets these markets gradually become more efficient. A cross country study examing evidence over different emerging markets, indexed by the date at which stock markets became functional, would therefore be of great interest. In the present study, it would be of great interest to use recently developed outlier detection techniques to assess the extent to which the results obtained are influenced by the presence of outliers. Incidentally, the authors use the terms weak, semi-strong and strong efficiency without defining them or indicating where definitions are to be found.
Comments 673
The authors use the variable NS = “News Surprise” as the difference between the number of news items on a given day minus the average number of news items on the previous twenty days. While this is consistent with the literature, there are other plausible definitions which would be worth exploring. The graphs in Figure 1 show some unusual properties of NS which are not mentioned or explained. For example, NS is overwhelmingly large and positive on Mondays. If there was no news on Saturdays or Sundays, one would be able to explain this by saying that Monday news actually covers three days worth of news. But this is not really the case, since newspapers do cover news on Saturdays and Sundays. While Tuesdays, Wednesdays and Thursdays appear balance visually, Fridays display a preponderance of negative news surprises. It is not at all clear why this should be so and what will be effect of this pattern on the analysis of the paper.
The authors test the hypothesis that stock returns form a random walk in Section 3.1. They find that the correlation at lag 2 (with two day old returns) is significant and conclude that weak form efficiency does not hold. This is not a correct conclusion. When a lot of significance tests are carried out at the 95 percent level, then about one in twenty of the tests will conclude significance incorrectly. The way to correct for this problem is to raise the significance level to 99 percent or higher, depending on the number of tests being conducted. If this is done than the authors results do show weak efficiency of the stock market returns.
The excess returns on Monday and negative returns on Friday may be consistent with the hypothesis that there is fundamental underlying real growth rate in the economy. On the average, stock prices will also grow at this (small) rate. The return on Monday reflects the accumulation of three days worth of real growth and hence would be expected to be higher than the return on the other days. The short day on Friday would similarly reduce the returns relative to the average return. It would be worth examining the extent to which the results of the authors are compatible with this hypothesis and also the associated real rate of growth of the economy.
Finally, the authors have simply counted news items and used this as a basis for tests. In fact, most news can easily be classified (and indeed this is done by authors in some cases) as news which would have a positive or a negative effect on the stock market. Counting would aggregate over the positive and negative items and results in a substantial loss of power in the tests. If the news were classified into positive, neutral and negative items, this would substantially increase the power of the subsequent tests. In addition, the authors are testing for effects of aggregate news on the aggregate stock market return. It would probably be more appropriate to look for impact of HUBCO and IPP news on energy related stocks. This would substantially improve the ability of tests to detect effects.

Asad Zaman 674
To summarise, the authors have done an excellent job of initiating research on the efficiency of our stock market with respect to publicly available news. There are many directions for further research as well as ways to improve and refine existing results. We hope that other authors will take up the challenge and carry out the necessary research.
Asad Zaman Lahore University of Management Sciences, Lahore.


![Strong and auxiliary forms of the semi-Lagrangian method ... · details about different forms of strong and weak forms of semi-Lagrangian schemes can be found in [6] and references](https://static.fdocuments.in/doc/165x107/5e7bb2c0215a6434c943fd55/strong-and-auxiliary-forms-of-the-semi-lagrangian-method-details-about-different.jpg)


