Testing of SLA-561V in NASA-Ames’ Turbulent Flow Duct With ... · Testing of SLA-561V in...
10
American Institute of Aeronautics and Astronautics 1 Testing of SLA-561V in NASA-Ames’ Turbulent Flow Duct With Augmented Radiative Heating Extended Abstract 10th AIAA/ASME Joint Thermophysics and Heat Transfer Conferences June 2010 Steven A. Sepka * Robert S. Kornienko † Chris A. Radbourne ‡ As part of Mars Science Laboratory’s (MSL) heatshield development program, SLA-561 was tested in NASA Ames Turbulent Flow Duct (TFD) Facility. For these tests, the TFD facility was modified to include a ceramic plate located in the wall opposite to the test model. Normally the TFD wall opposite to the test model is water-cooled steel. Installing a non- cooled ceramic plate allows the ceramic to absorb convective heating and radiate the energy back to the test model as the plate heats up. This work was an effort to increase the severity of TFD test conditions. Presented here are the results from these tests. I. Introduction SL is scheduled for launch in the fall of 2011. The entry vehicle is designed to land the largest and heaviest payload of any Mars mission to date. As such, an unprecedented heatshield diameter of 4.5 meters is required to protect the vehicle during passage through the Martian atmosphere. The combination of large size and high ballistic coefficient (~140 kg/m 2 ) will subject the PICA ablative heatshield to extensive turbulent boundary layer heating. Testing was conducted in the NASA Ames Turbulent Flow Duct Facility (TFD) to study the effects of turbulent flow heating in a high shear environment. II. Facility Description and Test Conditions The TFD is a supersonic blow-down wind tunnel that uses an electric arc to heat the test gas, in this case air, and which can operate for several minutes. The test section is 22.9 cm wide and 5 cm high (see Fig. 1). The bulk enthalpy of the stream was ~8.8 MJ/kg for the present test. The arc-heated air is expanded into the test chamber through a two-dimensional nozzle and reached a stream Mach number of 2.5 and a static pressure of about 0.1 atm. The test chamber is a water-cooled rectangular structure. The test specimen is a flush-mounted flat panel that forms one wall of the test section; the opposite wall was modified to have a ceramic plate inserted into the wall. Normally this wall is water-cooled. As the ceramic plates heats up, it is able to radiate energy back to the test model since the gas is optically thin. Because the model is in a fixed position in the test section, it is exposed to the flow startup transient that lasts about 30-40% of the total run time, as will be shown subsequently. During steady-state conditions in the facility, the arc current was 2400 amps, and the reservoir chamber pressure was about 940 kPa. * Sr. Research Scientist, ELORET Corp., NASA Ames Research Center, MS-234-1, Moffett Field, CA, 94035, Member, AIAA. † NASA Ames Research Center, Moffett Field, CA, 94035 ‡ NASA Ames Research Center, Moffett Field, CA, 94035 M https://ntrs.nasa.gov/search.jsp?R=20100033684 2019-01-25T19:05:08+00:00Z
Transcript of Testing of SLA-561V in NASA-Ames’ Turbulent Flow Duct With ... · Testing of SLA-561V in...
American Institute of Aeronautics and Astronautics
1
Testing of SLA-561V in NASA-Ames’ Turbulent Flow
Duct With Augmented Radiative Heating
Extended Abstract
10th AIAA/ASME Joint Thermophysics and Heat Transfer Conferences
June 2010
Steven A. Sepka * Robert S. Kornienko
† Chris A. Radbourne
‡
As part of Mars Science Laboratory’s (MSL) heatshield development program, SLA-561
was tested in NASA Ames Turbulent Flow Duct (TFD) Facility. For these tests, the TFD
facility was modified to include a ceramic plate located in the wall opposite to the test model.
Normally the TFD wall opposite to the test model is water-cooled steel. Installing a non-
cooled ceramic plate allows the ceramic to absorb convective heating and radiate the energy
back to the test model as the plate heats up. This work was an effort to increase the severity
of TFD test conditions. Presented here are the results from these tests.
I. Introduction
SL is scheduled for launch in the fall of 2011. The entry vehicle is designed to land the largest and
heaviest payload of any Mars mission to date. As such, an unprecedented heatshield diameter of 4.5 meters
is required to protect the vehicle during passage through the Martian atmosphere. The combination of large size and
high ballistic coefficient (~140 kg/m2) will subject the PICA ablative heatshield to extensive turbulent boundary
layer heating. Testing was conducted in the NASA Ames Turbulent Flow Duct Facility (TFD) to study the effects of
turbulent flow heating in a high shear environment.
II. Facility Description and Test Conditions
The TFD is a supersonic blow-down wind tunnel that uses an electric arc to heat the test gas, in this case air, and
which can operate for several minutes. The test section is 22.9 cm wide and 5 cm high (see Fig. 1). The bulk
enthalpy of the stream was ~8.8 MJ/kg for the present test. The arc-heated air is expanded into the test chamber
through a two-dimensional nozzle and reached a stream Mach number of 2.5 and a static pressure of about 0.1 atm.
The test chamber is a water-cooled rectangular structure. The test specimen is a flush-mounted flat panel that forms
one wall of the test section; the opposite wall was modified to have a ceramic plate inserted into the wall. Normally
this wall is water-cooled. As the ceramic plates heats up, it is able to radiate energy back to the test model since the
gas is optically thin.
Because the model is in a fixed position in the test section, it is exposed to the flow startup transient that lasts
about 30-40% of the total run time, as will be shown subsequently. During steady-state conditions in the facility, the
arc current was 2400 amps, and the reservoir chamber pressure was about 940 kPa.
* Sr. Research Scientist, ELORET Corp., NASA Ames Research Center, MS-234-1, Moffett Field, CA, 94035,
Member, AIAA. † NASA Ames Research Center, Moffett Field, CA, 94035
‡ NASA Ames Research Center, Moffett Field, CA, 94035
M
https://ntrs.nasa.gov/search.jsp?R=20100033684 2019-01-25T19:05:08+00:00Z

American Institute of Aeronautics and Astronautics
2
Figure 1. TFD test model drawing
III. Model and Instrumentation
A. Test Model
The typical test model was fabricated with SLA-561V on the first half (left hand side) and Silfrax on the second
(right hand side). The flow direction is from left to right. The Silfrax portion of the model in Figure 2 contains two
ports. The one nearest the center of the model housed a Gardon gage calorimeter, while the one downstream and
below center housed a radiometer.
Figure 2. Pre-test photograph of a typical model. Flow direction is from left to right.
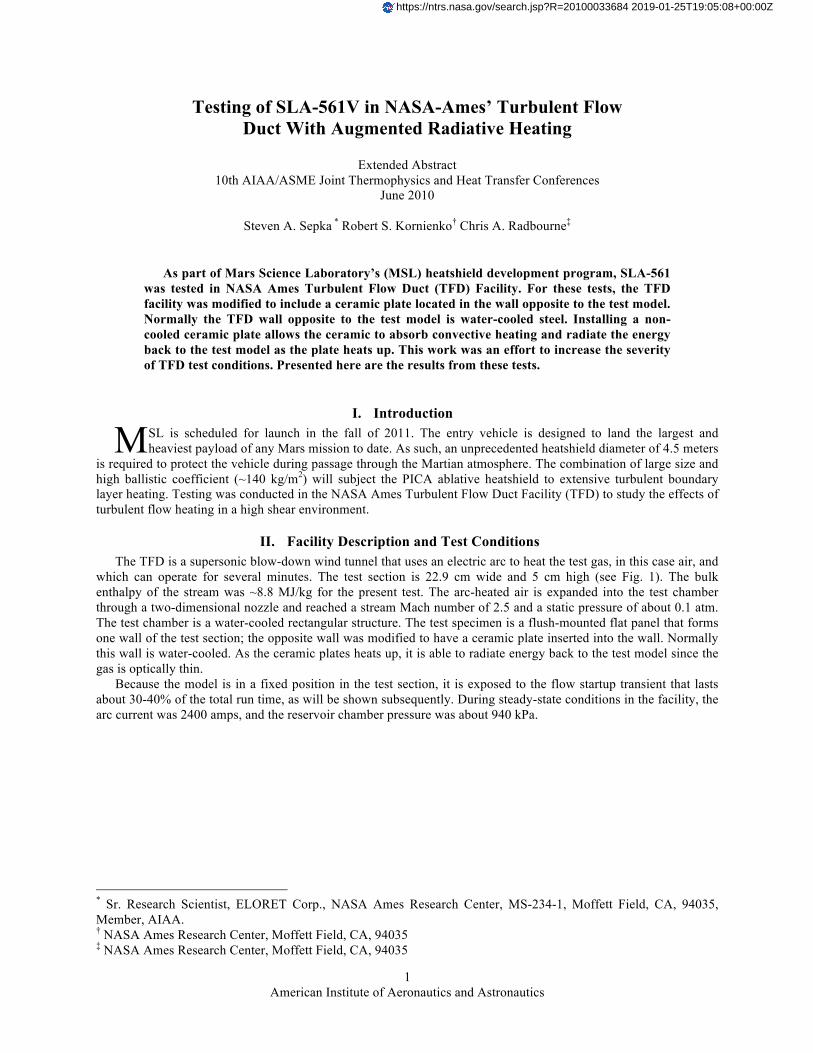
The typical material stackup of the SLA-561V portion of the model is given in Figure 3. The model was made up
of 2.54 cm (1 inch) thick SLA-561V and attached to a 1.3716 cm (0.54 inch) composite consisting of aluminum
honeycomb and faceplate with stiffener M55J. The model was then attached to a 0.635 cm (0.25 inch) block of LI-
2200 to act as non-conducting, adiabatic back wall. Finally this full assembly was then attached to the TFD wall by
means of a steel model plate and steel retainer plate (Figure 4).
American Institute of Aeronautics and Astronautics
3
Figure 3. Schematic diagram of typical material stackup that included SLA-561V
Figure 4. Typical model to TFD wall assembly
American Institute of Aeronautics and Astronautics
4
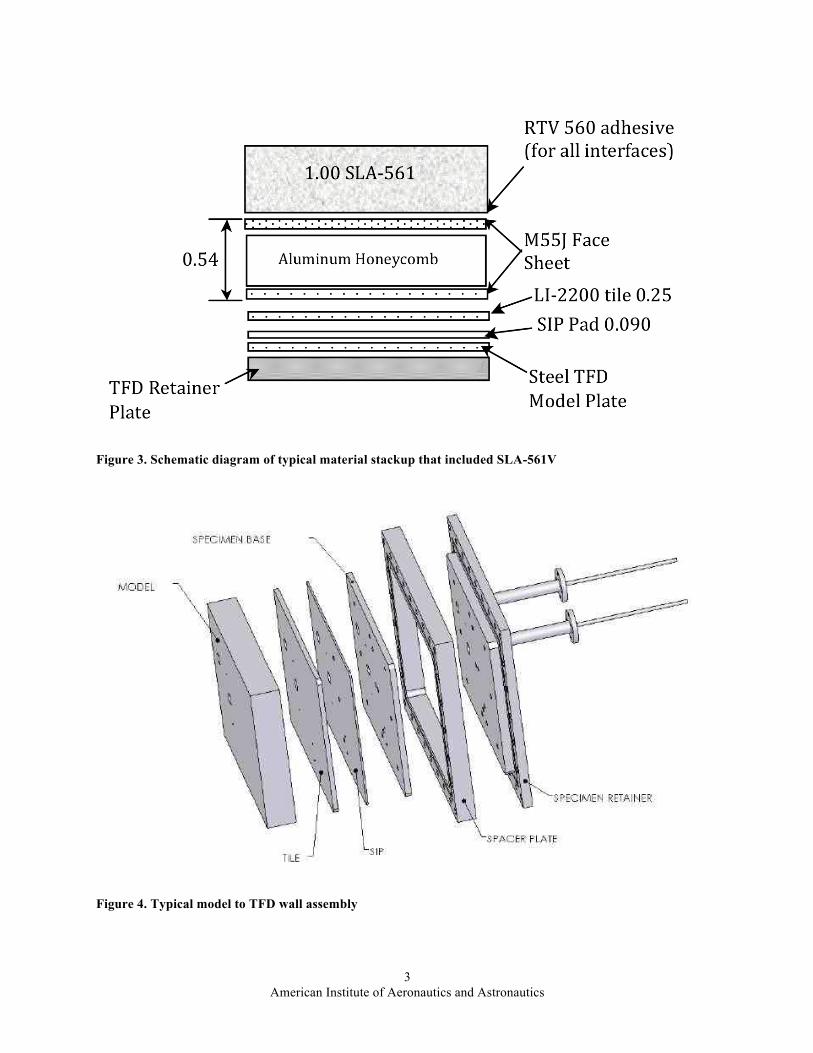
B. Radiation Plate
The radiation plate consisted of LI-2200 coated with TUFI. A photograph of the plate is given in Figure 5. The
flow direction is from left to right. Located 8.255 cm (3.25 inches) from the leading edge of the plate is a pyrometer
port, which was used to measure surface temperatures of the test model’s SLA-561V during a test run. The same
radiation plate was used for all test runs.
Figure 5. Radiation plate model
IV. Background Theory - Typical ablator response in TFD
Before proceeding into experimental results, it is best to review typical results when testing an ablating model in
the TFD. Shown in Figure 6 is a diagram of a typical pre-test and post-test ablating model. As noted in the figure,
the junction between the water-cooled TFD walls and the model provides localized cooling due to in-depth lateral
conduction at the edges of the model. This cooling reduces pyrolysis gas blowing, and blowing (or transpiration) is
important at the boundary layer because it acts to reduce the localized convective heat rate. Near the leading edge,
increases in localized heating due to reduced blowing leads to the formation of a steep concave surface. This
concave surface leads to the formation of Göertler vortices and shock waves. Finally, at the trailing edge wall
interface, ablation creates a forward-facing step. In this pocket is a localized vortex and recirculation zone.

American Institute of Aeronautics and Astronautics
5
Figure 6. Diagram illustrating typical ablator response in TFD
V. Results FromTest Runs
A. Photographs of the models
For tests at maximum TFD settings, only two models were tested. Shown in Figure 7 is a typical model prior to
testing. The flow direction is from right to left. As shown in the figure, the gardon gage calorimeter had been
cleaned prior to each run, but the radiometer had been damaged and was non-operational.

American Institute of Aeronautics and Astronautics
6
Figure 7. Typical test model prior to testing. Gardon gage calorimeter had been cleaned prior to testing.
Radiometer was damaged and non-operational prior to testing.
Shown in Figure 8 is a top view, post-test photograph of the first model tested. The flow direction is from right
to left. From this photograph it is evident that a great deal of glass melt flow from the SLA-561V had accumulated
at the SLA-561/Silfrax interface. Also of note are the formation of Göertler vortices running stream-wise along the
length of SLA.
Figure 8. Post-test photograph of first model to be tested.

American Institute of Aeronautics and Astronautics
7
Shown in Figure 9 is a side view, post-test photograph of the first model tested. The flow direction is from right
to left. From this photograph it is evident that the char layer in the SLA-561V was well-defined. Also visible are the
Göertler vortices and melt flow of glass.
Figure 9. Post-test side view photograph of first model.
B. Theory of TFD modifications
1. Radiative Heating Derived From Pyrometer Measurement
Radiative heating between two parallel plates (s1 and s2) where all of the radiation from one plate reaches the
other is given by:
!
qrad = "# Ts24$Ts1
4( ) (1)
where
qrad = radiative heat flux per unit area [W/cm2]
! = Stefan-Boltzmann constant [5.6703E-8 W/m2K
4]
Tx = surface temperature [K]
" = emissivity of the radiating surface
The assumption that all of the radiation from each plate reaches the other is justified for two reasons: the gas
between the plates is optically thin, and the plates (8” x 10”) are spaced only 5.08 cm (2 in) apart. There will be
some radiation lost to the water-cooled TFD walls, but this would be at highly oblique angles from the plate surface
and would become significant only near the edges of the plates.
The energy terms at one plate are shown in Figure 10. Both plates, s1 and s2, are not water-cooled. The
emissivity of each plate should be similar: the Silfrax portion of the model and LI-2200 radiation plate were each
TUFI coated, but the SLA-561V was not. Based on this, a first order approximation would be that each wall receives
identical convective heating and nearly identical radiative heating, and therefore should be nearly equal in surface
temperature. If both plates were equal in temperature, equation 1 indicates that neither surface will emit nor absorb
any radiant heating. What is lost, however, when comparing this arrangement to one where the opposite wall is
water cooled, is that the cooled wall will absorb radiant heat from the model. This “cooling” mechanism is lost with

American Institute of Aeronautics and Astronautics
8
the current TFD configuration. As a result, net incident heating rates are similar to convection-only heating, but
surface temperatures are allowed to rise significantly due to inability to radiantly “cool”. When testing SLA-561V
under such conditions, increased surface temperatures lead to glass formation and melt flow.
Figure 10. Energy balance of TFD walls
C. Pyrometer measurements of SLA surface temperature
The temperature of the water-cooled calorimeter surface will be much less than the SLA-561V surface, which
was ~1800°C during the testing, (see Figure 11). Making the approximation that the charred SLA surface has an
emissivity of one, leads to a simplified form of equation 1 to estimate the radiative heat flux emanating from the
SLA surface.
!
qrad ="TSLA surface
4 (2)
Applying equation 2 to the pyrometer surface temperature readings leads to the inferred heat flux readings also
given in Figure 11.

American Institute of Aeronautics and Astronautics
9
Figure 11. Pyrometer readings of the second model tested
Upstream of the TFD’s nozzle exit at 7.4676 cm (2.94 inches) is a Gardon gage calorimeter, Cal1 (see Figure 12).
Because of its location in the nozzle, this calorimeter is not exposed to radiative heat flux from the radiation plate,
and as a result will only read convective heating of the flow. Its readings indicate a steady-state heat flux of
approximately 80 W/cm2.
If the calorimeter in the model read the combined convective and incident radiation, then subtracting the pyrometer-
derived radiative heat flux its readings should give values comparable to those found from C1. The results agree and
are shown in Figure 12.
Figure 12. Calorimeter comparison using pyrometer-derived heat flux for second model tested

American Institute of Aeronautics and Astronautics
10
VI. Concluding Remarks
The test that was conducted in the turbulent flow duct facility accomplished several objectives, although it was
unable to simulate MSL peak conditions of heating rate and surface pressure. Most notably was the TFD facility
modification, which allowed the test model surface temperature to increase substantially over the previous
configuration. As such, the effects on SLA-561V were to see glass formation and melt flow. This was the first
appearance of such a large amount of glass melt flow2, and as a result of these tests, further investigations of SLA-
561V as a candidate heatshield material would be required. It should be emphasized, however, that the material did
not experience any failure and that the char layer was well behaved.
Acknowledgments
The authors gratefully acknowledge the support provided by the Thermal Protection Materials and Systems
Branch and the Reacting Flow Environments Branch of NASA Ames Research Center through NASA Contract No.
NNA 04-BC25C to the ELORET Corporation.
We acknowledge NASA-SCAP for their critical financial support of the arcjet operational capability at Ames.
We also thank our colleagues Dinesh Prabhu and James Brown for sharing their physical insights and providing
references about the flow characteristics in the TDF.
References