Testing of M7 propellant at different temperatures...
80
FFI-rapport 2009/01184 Testing of M7 propellant at different temperatures in closed vessel Gunnar Ove Nevstad Forsvarets forskningsinstitutt/Norwegian Defence Research Establishment (FFI) 2 July 2009
Transcript of Testing of M7 propellant at different temperatures...
FFI-rapport 2009/01184
Testing of M7 propellant at different temperatures in closed vessel
Gunnar Ove Nevstad
Forsvarets forskningsinstitutt/Norwegian Defence Research Establishment (FFI)
2 July 2009
2 FFI-rapport 2009/01184
FFI-rapport 2009/01184
339301
P: ISBN 978-82-464-1626-7 E: ISBN 978-82-464-1627-4
Keywords
M7
Krutt
Brennhastighet
Kruttkraft
Approved by
Jan Ivar Botnan Director
FFI-rapport 2009/01184 3
English summary Lot NARA 225A M7 propellant produced as tubes by Nammo Raufoss for use in M72 has been tested in a 700 cm3 closed vessel for determination of the burn rate and impetus. The propellant has been tested at three different temperatures -40 oC, room temperature and +60 oC for up to 4 different loading densities at each temperature. For M7 propellant lot NARA 225A the burn rate increases with increasing test temperature. For loading density 0.200 g/cm3 at 1400 bars the burn rate increases from 16.64 cm/s at -40 oC, 18.67 m/s at room temperature to 21.07 cm/s at 60oC. The impetus for M7 lot NARA 225A increases from 1001.5 J/g at -40 oC, 1019.6 J/g at room temperature and up to 1032.8 J/g at +60oC. These results are all as expected. For the closed vessel firings at -40 oC, the burn rate curves for the two firings of lowest loading densities 0.10 g/cm3 and 0.15 g/cm3, a breakpoint have been observed at approximately 1/3 of the maximum pressure, respectively, at 350 and 600 bars. A breakpoint that is not observed in the burn rate curves for the other firings. This phenomenon is strongest for the firing of lowest loading density. However, a breakpoint is observed at 90+20 bars for all burn rate curves. Burn rate equations have been fitted to all experimental burn rate curves at two pressure ranges from 30+10 to 90+30 bars and from 90+30 bars, to the maximum pressure for each single firing. For the firing with 0.10 g/cm3 at l -40 oC, we divided the pressure interval into three pressure ranges due to the second break point at 350 bars. Equations on three different forms; r = a + bP, r = bPn and r = a + bPn , have been fitted to the experimentally burn rate curves. However, at all pressure ranges best fit to the experimental burn rate curves is obtained for equations of the form r = a + bPn.
4 FFI-rapport 2009/01184
Sammendrag M7 krutt fremstilt i form av rørkrutt av Nammo Raufoss for bruk i M72 har vært testet i en 700 cm3 closed vessel for bestemmelse av brennhastighet og kruttkraft (impetus). Kruttet har vært testet ved tre ulike temperaturer, -40oC, romtemperatur og +60oC med opptil 4 ulike ladetettheter for hver temperatur. Brennhastigheten øker sterkt med økende test temperatur fra 16.64 cm/s ved -40oC, 18.67 cm/s ved romtemperatur til 21.07 cm/s ved +60oC ved et trykk på 1400 bar og en ladetetthet på 0.200 g/cm3. Impetus øker tilsvarende fra 1001.5 J/g ved -40oC, 1019.6 J/g ved romtemperatur til 1032.8 J/g ved + 60oC. Dette er alle resultater som forventet. For CV-fyringene ved -40oC har brennhastighetskurvene for de to laveste ladetettheten på 0.10 g/cm3 og 0.15 g/cm3 et knekkpunkt ved 1/3 av maksimum-trykket, henholdsvis ved 350 og 600 bar. Dette knekkpunktet i brennhastighetskurven er ikke observert for de resterende fyringer. Fenomenet er mest fremtredende ved den laveste ladetetthet (0.10 g/cm3). For alle brennhastighetskurvene er det et knekkpunkt ved 90+20 bar. Brennhastighetsligninger har vært tilpasset alle eksperimentelle brennhastighetskurver i to trykkområder, fra 30+10 til 90+30 bar og fra 90+30 bar til maksimal-trykket for den enkelte fyring. Som nevnt ovenfor, for en av fyringene ved -40 oC, var det nødvendig med en tredeling av trykkområdet. Likninger på tre ulike former: r = a + bP, r = bPn og r = a + bPn har vært tilpasset de eksperimenttelle glatta brennhastighetskurvene. For majoriteten av kurvene og trykkområdene er det ligningene på formen r = a +bPn som gir den beste tilpasningen til de eksperimentelle glatta brennhastighetskurvene.
FFI-rapport 2009/01184 5
Contents
1 Introduction 7
2 Experimentally 7 2.1 Content 7 2.2 Dimensions 7 2.3 Closed vessel 7
3 Results 9 3.1 Dimensions of tested tubes 9 3.2 Closed vessel firings 10 3.2.1 Firing at room temperature 11 3.2.2 Testing at +60oC 14 3.2.3 Testing at -40oC 18 3.3 Comparing firings tested at different temperatures 22 3.4 Burn rates 24 3.4.1 All temperatures and loading densities 24 3.4.2 Room temperature 25 3.4.3 At 60oC 28 3.5 Comparison of burn rate for different loading densities 36 3.5.1 -40oC 36 3.5.2 At room temperature 37 3.5.3 +60oC 39 3.6 Different temperature at same loading density 41 3.6.1 Load density 0.1 g/cm3 41 3.6.2 Load density 0.15 g/cm3 41 3.6.3 Load density 0.2 g/cm3 42 3.6.4 Load density 0.23 g/cm3 43
Appendix A Results forms from and calculations of burning rate equations 44
A.1 CV-901 44 A.1.1 Results form 44 A.1.2 Calculations of burn rate equations 45 A.2 CV-902 47 A.2.1 Results form 47 A.2.2 Calculations of burn rate equations 48 A.3 CV-903 50 A.3.1 Results form 50
6 FFI-rapport 2009/01184
A.3.2 Calculations of burn rate equations 51 A.4 CV-904 53 A.4.1 Results form 53 A.4.2 Calculations of burn rate equations 54 A.5 CV-905 56 A.5.1 Results form 56 A.5.2 Calculations of burn rate equations 57 A.6 CV-906 59 A.6.1 Results form 59 A.6.2 Calculations of burn rate equations 60 A.7 CV-907 62 A.7.1 Results form 62 A.7.2 Calculations of burn rate equations 63 A.8 CV-908 65 A.8.1 Results form 65 A.8.2 Calculations of burn rate equations 65 A.9 CV-909 69 A.9.1 Results form 69 A.9.2 Calculations of burn rate equations 70 A.10 CV-910 72 A.10.1 Results form 72 A.10.2 Calculations of burn rate equations 73 A.11 CV-911 74 A.11.1 Results form 74 A.11.2 Calculations of burn rate equations 75 A.12 CV-912 76 A.12.1 Results form 76 A.12.2 Calculations of burn rate equations 76
References 80
FFI-rapport 2009/01184 7
1 Introduction M7, a double base propellant, is used in M72-LAW (Light Antiarmour Weapon) and all its versions. M7 propellant is an old propellant composition that has been produced by different manufacturers all over the world for decades. In Norway it was produced by Dyno Nobel ASA Gullaug plant until the plant was closed down some years ago. To day, therefore, Nammo Raufoss AS buys a premix from a foreign supplier and extrudes the propellant tubes at Raufoss. We have received some tubes of M7 to characterize its properties with regard to burning properties and energy content in form of impetus at -40 oC, room temperature (12 oC) and +60oC. To determine experimentally the burn rate and impetus of the M7 propellant, some propellants tubes have been tested in closed vessel according to STANAG 4115 (1). The Impetus has been determined by performing firings at different loading densities. The burn rate has been calculated by use of a program developed at FFI (2).
2 Experimentally
2.1 Content
M7 propellant contains as main ingredients NC (Nitrocellulose) as binder and NG (Nitro-glycerine) as plasticizer. In addition it contains EC (Ethyl Centralite) as stabilizer and Potassium Perchlorate. The nominal content of M7 is: 59.15% NC (13.15 %N), 31.4 % NG, 1.0 % EC, 7.9 % Potassium Perchlorate and 0.58% Carbon Black.
2.2 Dimensions
We did receive approximately 1500 g of M7 propellant in form of tubes with outer diameter of 5.9 mm. The dimensions of the propellant grains are necessary to know if the burn rate shall be calculated. The length of the tubes was measured by use of a light microscope and the tubes outer diameter by use of slide caliper. The inner diameter was measured by use of measuring pins with 0.01 mm accuracy. All results are given in Table 3.1.
2.3 Closed vessel
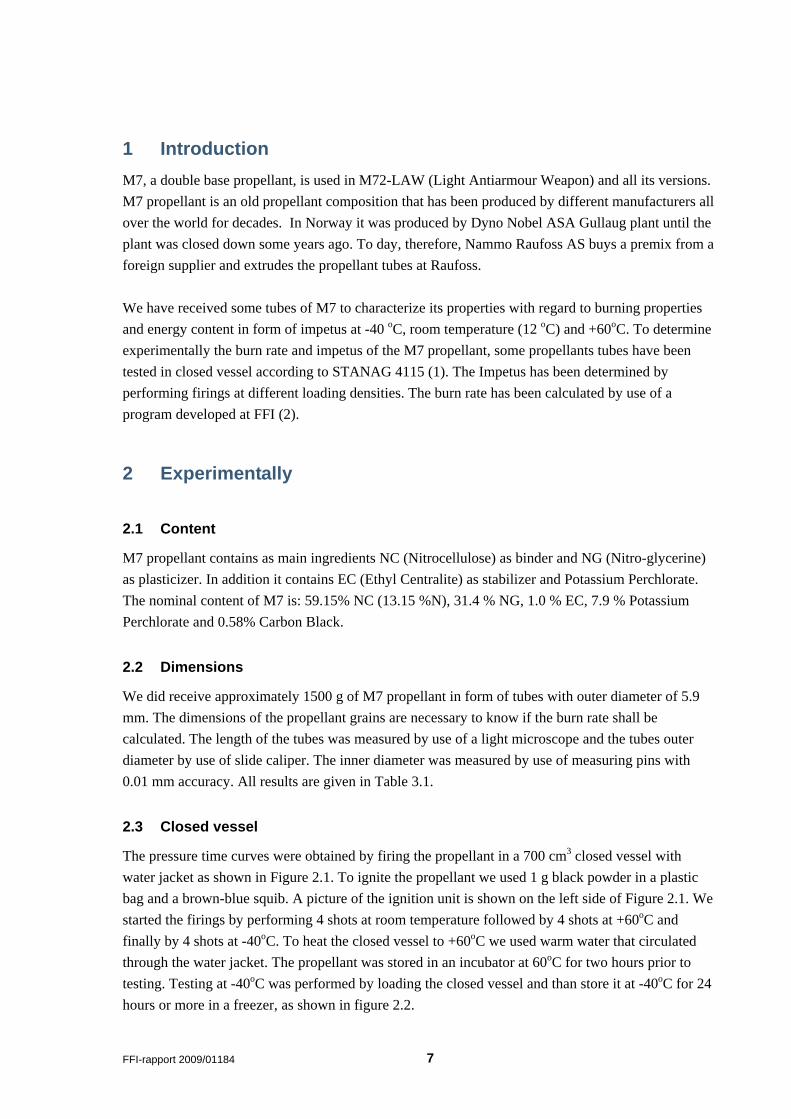
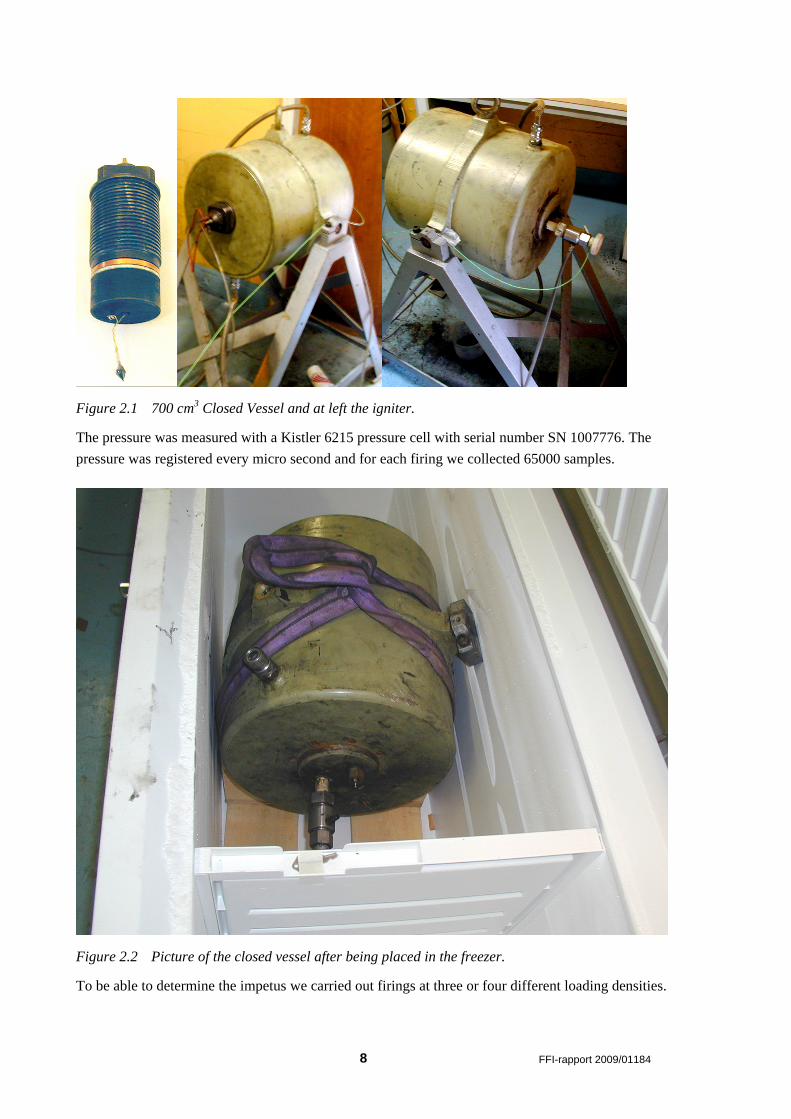
The pressure time curves were obtained by firing the propellant in a 700 cm3 closed vessel with water jacket as shown in Figure 2.1. To ignite the propellant we used 1 g black powder in a plastic bag and a brown-blue squib. A picture of the ignition unit is shown on the left side of Figure 2.1. We started the firings by performing 4 shots at room temperature followed by 4 shots at +60oC and finally by 4 shots at -40oC. To heat the closed vessel to +60oC we used warm water that circulated through the water jacket. The propellant was stored in an incubator at 60oC for two hours prior to testing. Testing at -40oC was performed by loading the closed vessel and than store it at -40oC for 24 hours or more in a freezer, as shown in figure 2.2.
8 FFI-rapport 2009/01184
Figure 2.1 700 cm3 Closed Vessel and at left the igniter.
The pressure was measured with a Kistler 6215 pressure cell with serial number SN 1007776. The pressure was registered every micro second and for each firing we collected 65000 samples.
Figure 2.2 Picture of the closed vessel after being placed in the freezer.
To be able to determine the impetus we carried out firings at three or four different loading densities.
FFI-rapport 2009/01184 9
3 Results
3.1 Dimensions of tested tubes
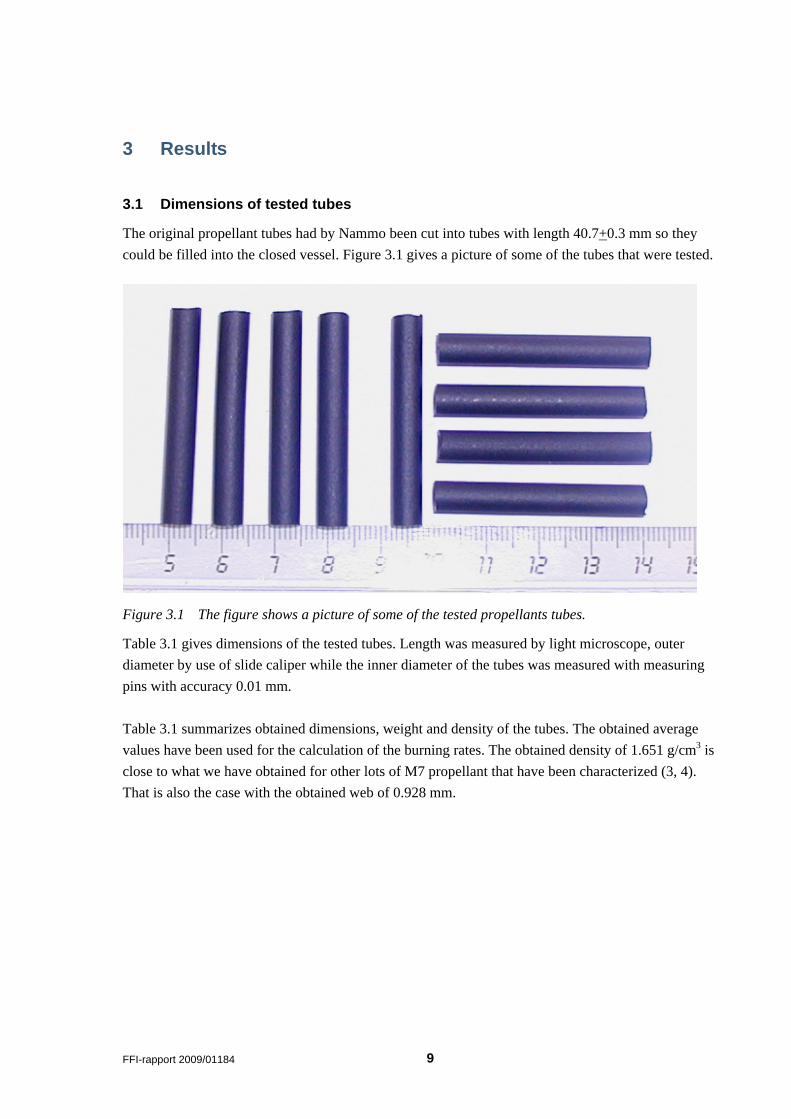
The original propellant tubes had by Nammo been cut into tubes with length 40.7+0.3 mm so they could be filled into the closed vessel. Figure 3.1 gives a picture of some of the tubes that were tested.
Figure 3.1 The figure shows a picture of some of the tested propellants tubes.
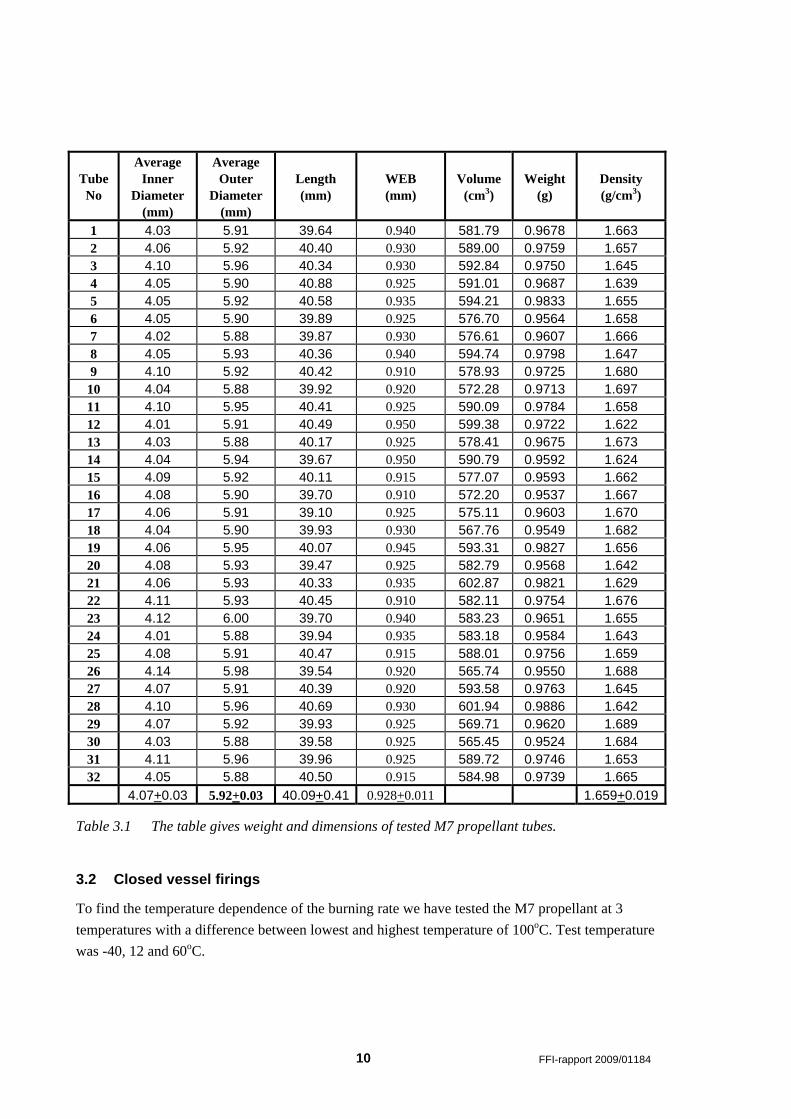
Table 3.1 gives dimensions of the tested tubes. Length was measured by light microscope, outer diameter by use of slide caliper while the inner diameter of the tubes was measured with measuring pins with accuracy 0.01 mm. Table 3.1 summarizes obtained dimensions, weight and density of the tubes. The obtained average values have been used for the calculation of the burning rates. The obtained density of 1.651 g/cm3 is close to what we have obtained for other lots of M7 propellant that have been characterized (3, 4). That is also the case with the obtained web of 0.928 mm.
10 FFI-rapport 2009/01184
Tube No
Average Inner
Diameter (mm)
Average Outer
Diameter (mm)
Length (mm)
WEB (mm)
Volume (cm3)
Weight (g)
Density (g/cm3)
1 4.03 5.91 39.64 0.940 581.79 0.9678 1.663 2 4.06 5.92 40.40 0.930 589.00 0.9759 1.657 3 4.10 5.96 40.34 0.930 592.84 0.9750 1.645 4 4.05 5.90 40.88 0.925 591.01 0.9687 1.639 5 4.05 5.92 40.58 0.935 594.21 0.9833 1.655 6 4.05 5.90 39.89 0.925 576.70 0.9564 1.658 7 4.02 5.88 39.87 0.930 576.61 0.9607 1.666 8 4.05 5.93 40.36 0.940 594.74 0.9798 1.647 9 4.10 5.92 40.42 0.910 578.93 0.9725 1.680
10 4.04 5.88 39.92 0.920 572.28 0.9713 1.697 11 4.10 5.95 40.41 0.925 590.09 0.9784 1.658 12 4.01 5.91 40.49 0.950 599.38 0.9722 1.622 13 4.03 5.88 40.17 0.925 578.41 0.9675 1.673 14 4.04 5.94 39.67 0.950 590.79 0.9592 1.624 15 4.09 5.92 40.11 0.915 577.07 0.9593 1.662 16 4.08 5.90 39.70 0.910 572.20 0.9537 1.667 17 4.06 5.91 39.10 0.925 575.11 0.9603 1.670 18 4.04 5.90 39.93 0.930 567.76 0.9549 1.682 19 4.06 5.95 40.07 0.945 593.31 0.9827 1.656 20 4.08 5.93 39.47 0.925 582.79 0.9568 1.642 21 4.06 5.93 40.33 0.935 602.87 0.9821 1.629 22 4.11 5.93 40.45 0.910 582.11 0.9754 1.676 23 4.12 6.00 39.70 0.940 583.23 0.9651 1.655 24 4.01 5.88 39.94 0.935 583.18 0.9584 1.643 25 4.08 5.91 40.47 0.915 588.01 0.9756 1.659 26 4.14 5.98 39.54 0.920 565.74 0.9550 1.688 27 4.07 5.91 40.39 0.920 593.58 0.9763 1.645 28 4.10 5.96 40.69 0.930 601.94 0.9886 1.642 29 4.07 5.92 39.93 0.925 569.71 0.9620 1.689 30 4.03 5.88 39.58 0.925 565.45 0.9524 1.684 31 4.11 5.96 39.96 0.925 589.72 0.9746 1.653 32 4.05 5.88 40.50 0.915 584.98 0.9739 1.665
4.07+0.03 5.92+0.03 40.09+0.41 0.928+0.011 1.659+0.019
Table 3.1 The table gives weight and dimensions of tested M7 propellant tubes.
3.2 Closed vessel firings
To find the temperature dependence of the burning rate we have tested the M7 propellant at 3 temperatures with a difference between lowest and highest temperature of 100oC. Test temperature was -40, 12 and 60oC.
FFI-rapport 2009/01184 11
3.2.1 Firing at room temperature
3.2.1.1 Pressure time curves
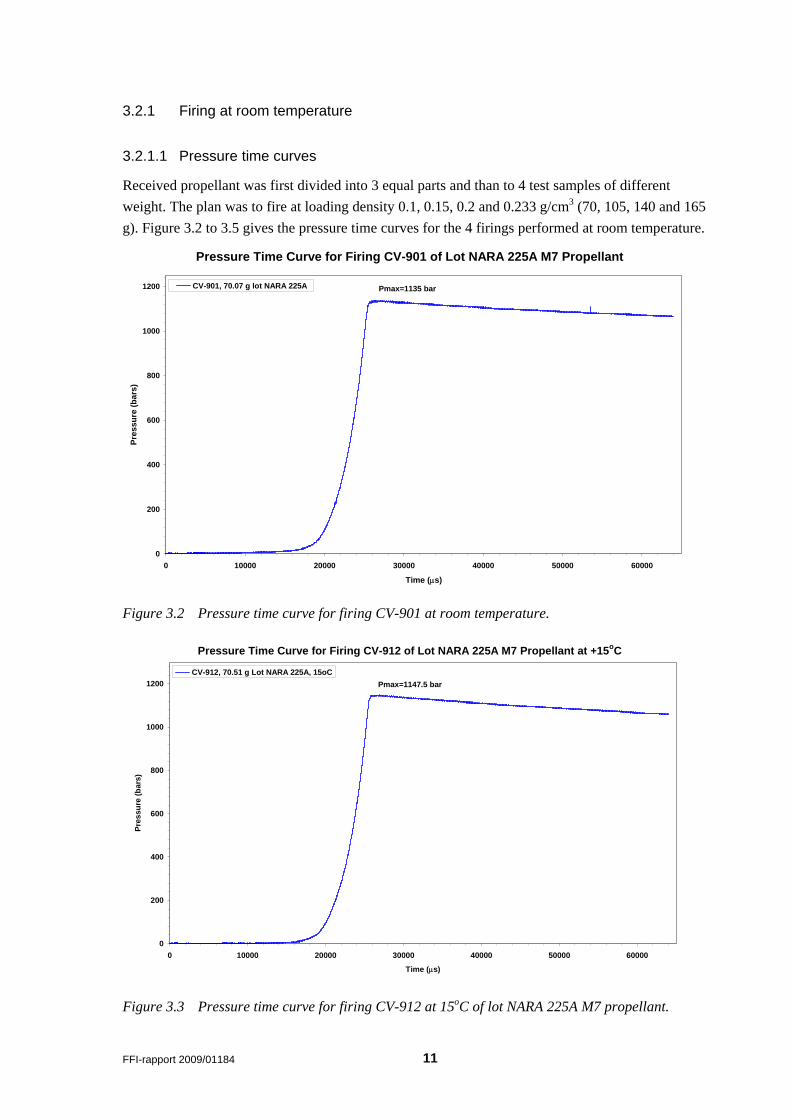
Received propellant was first divided into 3 equal parts and than to 4 test samples of different weight. The plan was to fire at loading density 0.1, 0.15, 0.2 and 0.233 g/cm3 (70, 105, 140 and 165 g). Figure 3.2 to 3.5 gives the pressure time curves for the 4 firings performed at room temperature.
Pressure Time Curve for Firing CV-901 of Lot NARA 225A M7 Propellant
0
200
400
600
800
1000
1200
0 10000 20000 30000 40000 50000 60000
Time (μs)
Pres
sure
(bar
s)
CV-901, 70.07 g lot NARA 225A Pmax=1135 bar
Figure 3.2 Pressure time curve for firing CV-901 at room temperature.
Pressure Time Curve for Firing CV-912 of Lot NARA 225A M7 Propellant at +15oC
0
200
400
600
800
1000
1200
0 10000 20000 30000 40000 50000 60000
Time (μs)
Pres
sure
(bar
s)
CV-912, 70.51 g Lot NARA 225A, 15oCPmax=1147.5 bar
Figure 3.3 Pressure time curve for firing CV-912 at 15oC of lot NARA 225A M7 propellant.
12 FFI-rapport 2009/01184
Pressure Time Curve for Firing CV-902 Lot NARA 225A with M7 Propellant
0
200
400
600
800
1000
1200
1400
1600
1800
2000
0 10000 20000 30000 40000 50000 60000
Time (μs)
Pres
sure
(bar
s)
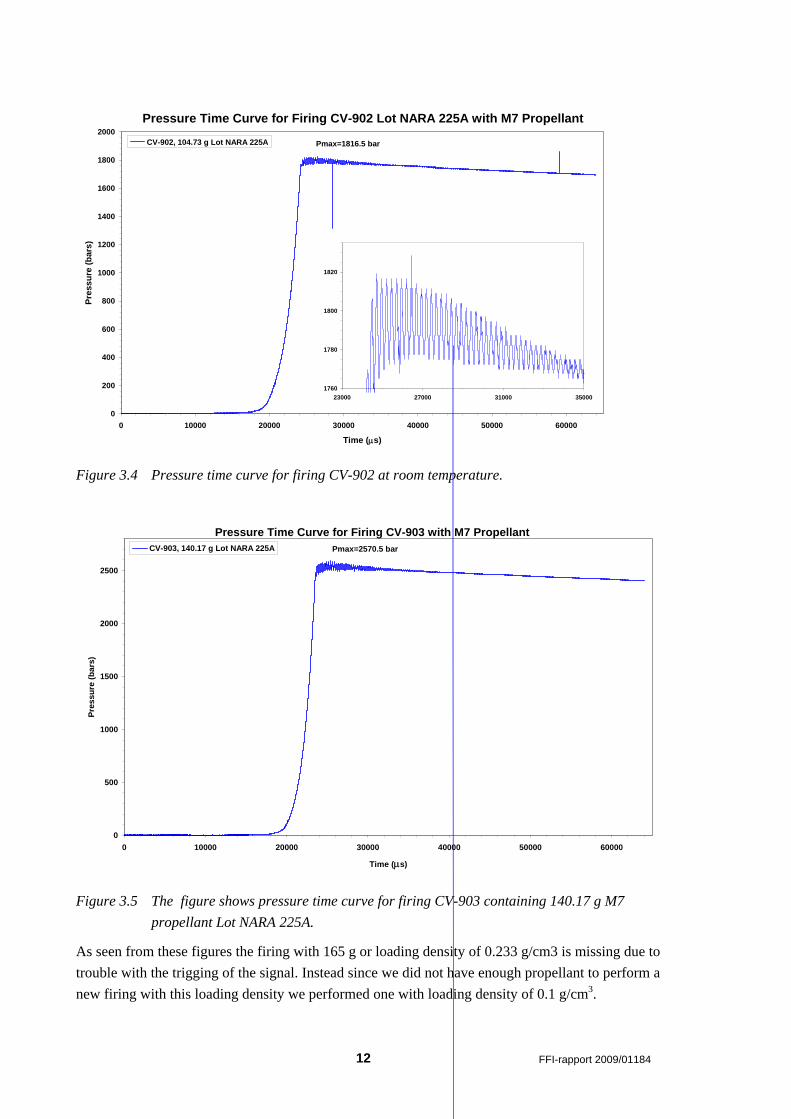
CV-902, 104.73 g Lot NARA 225A Pmax=1816.5 bar
Figure 3.4 Pressure time curve for firing CV-902 at room temperature.
Pressure Time Curve for Firing CV-903 with M7 Propellant
0
500
1000
1500
2000
2500
0 10000 20000 30000 40000 50000 60000
Time (μs)
Pres
sure
(bar
s)
CV-903, 140.17 g Lot NARA 225A Pmax=2570.5 bar
Figure 3.5 The figure shows pressure time curve for firing CV-903 containing 140.17 g M7 propellant Lot NARA 225A.
As seen from these figures the firing with 165 g or loading density of 0.233 g/cm3 is missing due to trouble with the trigging of the signal. Instead since we did not have enough propellant to perform a new firing with this loading density we performed one with loading density of 0.1 g/cm3.
1760
1780
1800
1820
23000 27000 31000 35000
FFI-rapport 2009/01184 13
Pressure Time Curves for Closed Vessel Firings at 12oC with Lot NARA 225A
0
500
1000
1500
2000
2500
0 10000 20000 30000 40000 50000 60000
Time (μs)
Pres
sure
(bar
s)CV-901, 70.07 g Lot NARA 225ACV-912, 70.51 g Lot NARA 225A, (15oC)CV-902, 104.73 g Lot NARA 225ACV-903, 140.17 g Lot NARA 225A
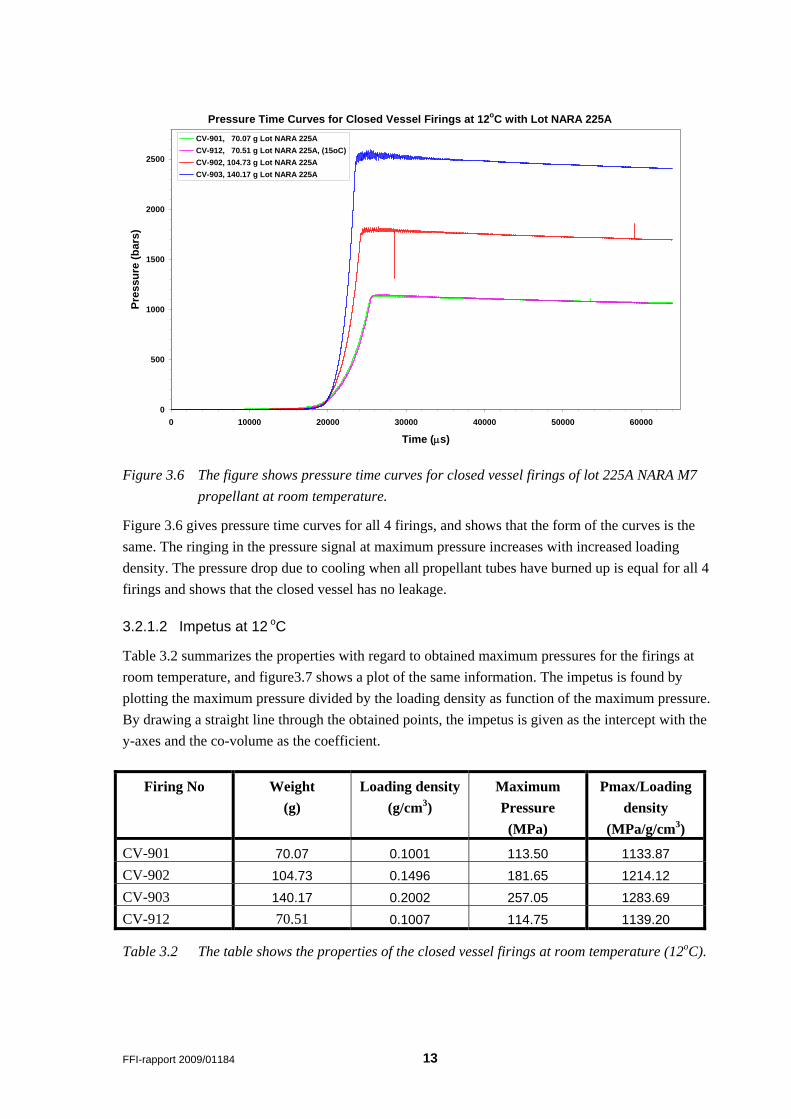
Figure 3.6 The figure shows pressure time curves for closed vessel firings of lot 225A NARA M7 propellant at room temperature.
Figure 3.6 gives pressure time curves for all 4 firings, and shows that the form of the curves is the same. The ringing in the pressure signal at maximum pressure increases with increased loading density. The pressure drop due to cooling when all propellant tubes have burned up is equal for all 4 firings and shows that the closed vessel has no leakage.
3.2.1.2 Impetus at 12 oC
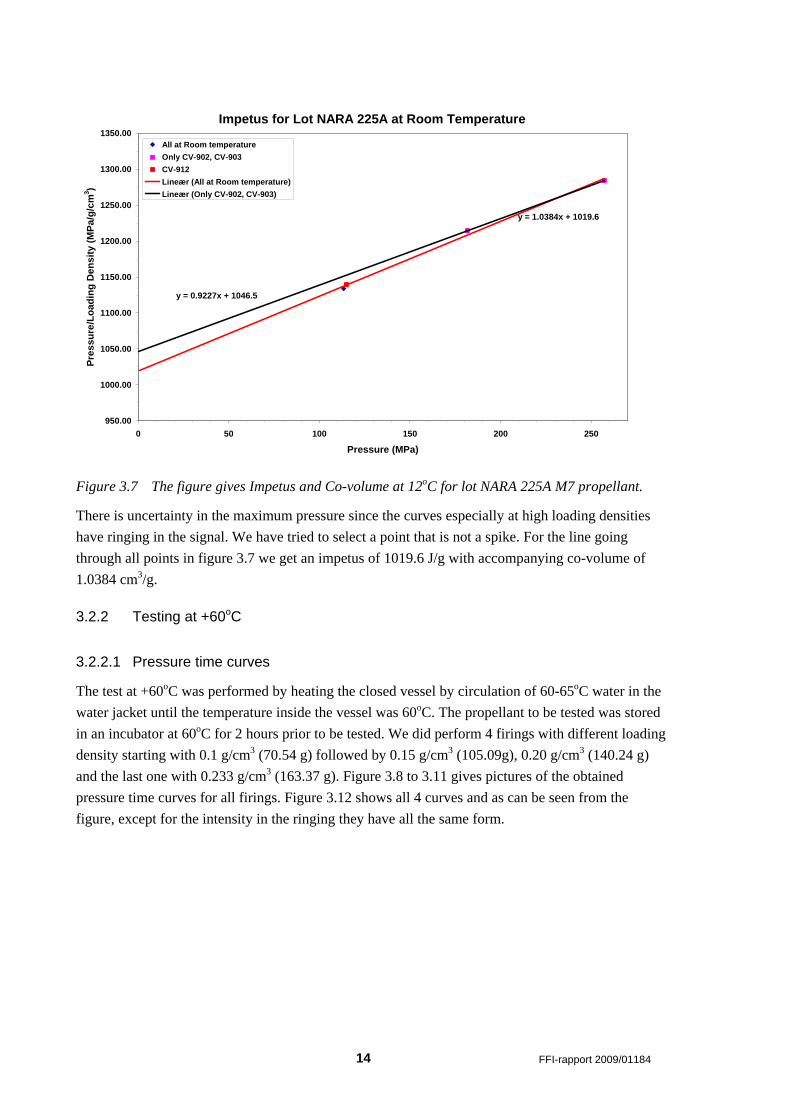
Table 3.2 summarizes the properties with regard to obtained maximum pressures for the firings at room temperature, and figure3.7 shows a plot of the same information. The impetus is found by plotting the maximum pressure divided by the loading density as function of the maximum pressure. By drawing a straight line through the obtained points, the impetus is given as the intercept with the y-axes and the co-volume as the coefficient.
Firing No Weight (g)
Loading density (g/cm3)
Maximum Pressure (MPa)
Pmax/Loading density
(MPa/g/cm3)
CV-901 70.07 0.1001 113.50 1133.87 CV-902 104.73 0.1496 181.65 1214.12 CV-903 140.17 0.2002 257.05 1283.69 CV-912 70.51 0.1007 114.75 1139.20
Table 3.2 The table shows the properties of the closed vessel firings at room temperature (12oC).
14 FFI-rapport 2009/01184
Impetus for Lot NARA 225A at Room Temperature
y = 1.0384x + 1019.6
y = 0.9227x + 1046.5
950.00
1000.00
1050.00
1100.00
1150.00
1200.00
1250.00
1300.00
1350.00
0 50 100 150 200 250
Pressure (MPa)
Pres
sure
/Loa
ding
Den
sity
(MPa
/g/c
m3 )
All at Room temperatureOnly CV-902, CV-903CV-912Lineær (All at Room temperature)Lineær (Only CV-902, CV-903)
Figure 3.7 The figure gives Impetus and Co-volume at 12oC for lot NARA 225A M7 propellant.
There is uncertainty in the maximum pressure since the curves especially at high loading densities have ringing in the signal. We have tried to select a point that is not a spike. For the line going through all points in figure 3.7 we get an impetus of 1019.6 J/g with accompanying co-volume of 1.0384 cm3/g.
3.2.2 Testing at +60oC
3.2.2.1 Pressure time curves
The test at +60oC was performed by heating the closed vessel by circulation of 60-65oC water in the water jacket until the temperature inside the vessel was 60oC. The propellant to be tested was stored in an incubator at 60oC for 2 hours prior to be tested. We did perform 4 firings with different loading density starting with 0.1 g/cm3 (70.54 g) followed by 0.15 g/cm3 (105.09g), 0.20 g/cm3 (140.24 g) and the last one with 0.233 g/cm3 (163.37 g). Figure 3.8 to 3.11 gives pictures of the obtained pressure time curves for all firings. Figure 3.12 shows all 4 curves and as can be seen from the figure, except for the intensity in the ringing they have all the same form.
FFI-rapport 2009/01184 15
Pressure Time Curve for Firing CV-904 Lot NARA 225A M7 Propellant +60oC
0
200
400
600
800
1000
1200
0 10000 20000 30000 40000 50000 60000
Time (μs)
Pres
sure
(bar
s)CV-904, 70.54 g Lot NARA 225A
Pmax=1164.5 bars
Figure 3.8 Pressure time curve for CV-904 containing lot NARA 225A M7 propellant at +60oC.
Pressure Time Curve for Firing CV-905 Lot NARA 225A M7 propellant +60oC
0
200
400
600
800
1000
1200
1400
1600
1800
2000
0 10000 20000 30000 40000 50000 60000
Time (μs)
Pres
sure
(bar
s)
CV-905, 105.09 g Lot NARA 225A Pmax=1882 bar
Figure 3.9 Pressure time curve for CV-905 containing lot NARA 225A M7 propellant at +60oC.
16 FFI-rapport 2009/01184
Pressure Time Curve for Firing CV-906 lot NARA 225A M7 Propellant +60oC
0
500
1000
1500
2000
2500
0 10000 20000 30000 40000 50000 60000
Time (μs)
Pres
sure
(bar
s)
CV-906, 140.24 g Lot NARA 225A Pmax=2632 bar
Figure 3.10 Pressure time curve for CV-906 containing lot NARA 225A M7 propellant at +60oC.
Pressure Time Curve for Firing CV-907 Lot NARA 225A M7 Propellant +60oC
0
500
1000
1500
2000
2500
3000
3500
0 10000 20000 30000 40000 50000 60000
Time (μs)
Pres
sure
(bar
s)
CV-907, 163.37 g Lot NARA 225A Pmax=3293.5 bar
Figure 3.11 Pressure time curve for CV-907 containing lot NARA 225A M7 propellant at +60oC.
FFI-rapport 2009/01184 17
Pressure Time Curves for Firings of Lot NARA 225A M7 Propellant +60oC
0
500
1000
1500
2000
2500
3000
0 10000 20000 30000 40000 50000 60000
Time (μs)
Pres
sure
(bar
s)CV-906, 140.24 g Lot NARA 225ACV-907, 163.37 g Lot NARA 225ACV-905, 105.09 g Lot NARA 225ACV-904, 70.54 g Lot NARA 225A
Figure 3.12 Pressure time curves for lot NARA 225A tested at +60oC.
3.2.2.2 Impetus +60oC
Table 3.3 summarizes the properties with regard to obtained maximum pressures for the firings at +60oC, and figure3.13 shows a plot of the same information.
Firing No Weight (g)
Loading density(g/cm3)
Maximum Pressure (MPa)
Pmax/Loading density
(MPa/g/cm3) CV-904 70.54 0.1008 116.40 1160.55CV-905 105.09 0.1501 188.20 1253.59CV-906 140.24 0.2003 263.20 1312.50CV-907 163.37 0.2334 329.35 1404.76
Table 3.3 The Table shows the properties of the closed vessel firings at room temperature (12oC).
As for the firings at room temperature there is uncertainty in the maximum pressure since the curves especially at high loading densities have unstable signal. We have tried to select a point that is not a spike as the maximum pressure. For the line going through all points in figure 3.13 we get an impetus of 1032.8 J/g with accompanying co-volume of 1.1163 cm3/g. Both values are significantly higher than what we obtained at room temperature.
18 FFI-rapport 2009/01184
Impetus for Lot NARA 225A M7 Propellant at +60oC
y = 1,1163x + 1032,8
0,00
200,00
400,00
600,00
800,00
1000,00
1200,00
1400,00
1600,00
0,00 50,00 100,00 150,00 200,00 250,00 300,00 350,00
Pressure (MPa)
Pres
sure
/Loa
ding
Den
sity
(MPa
/g/c
m3 )
AllLineær (All)
Figure 3.13 The figure shows Impetus and Co-volume for lot NARA 225A at 60oC.
3.2.3 Testing at -40oC
3.2.3.1 Pressure time curves
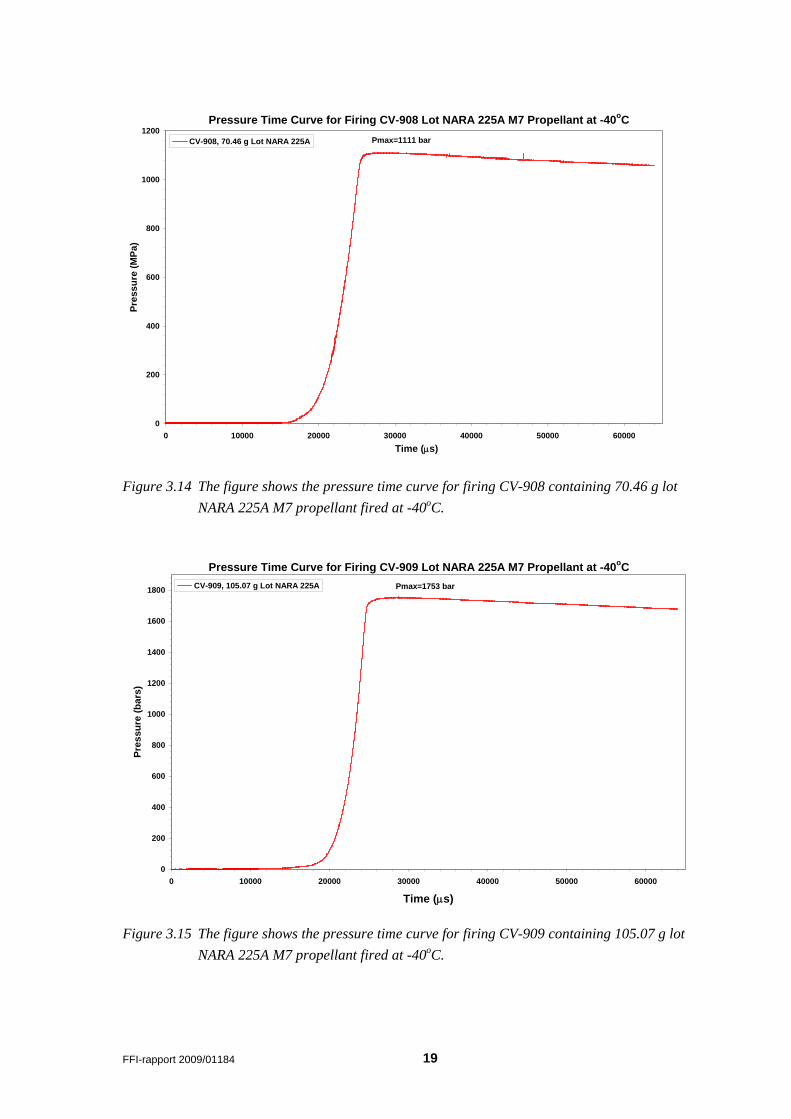
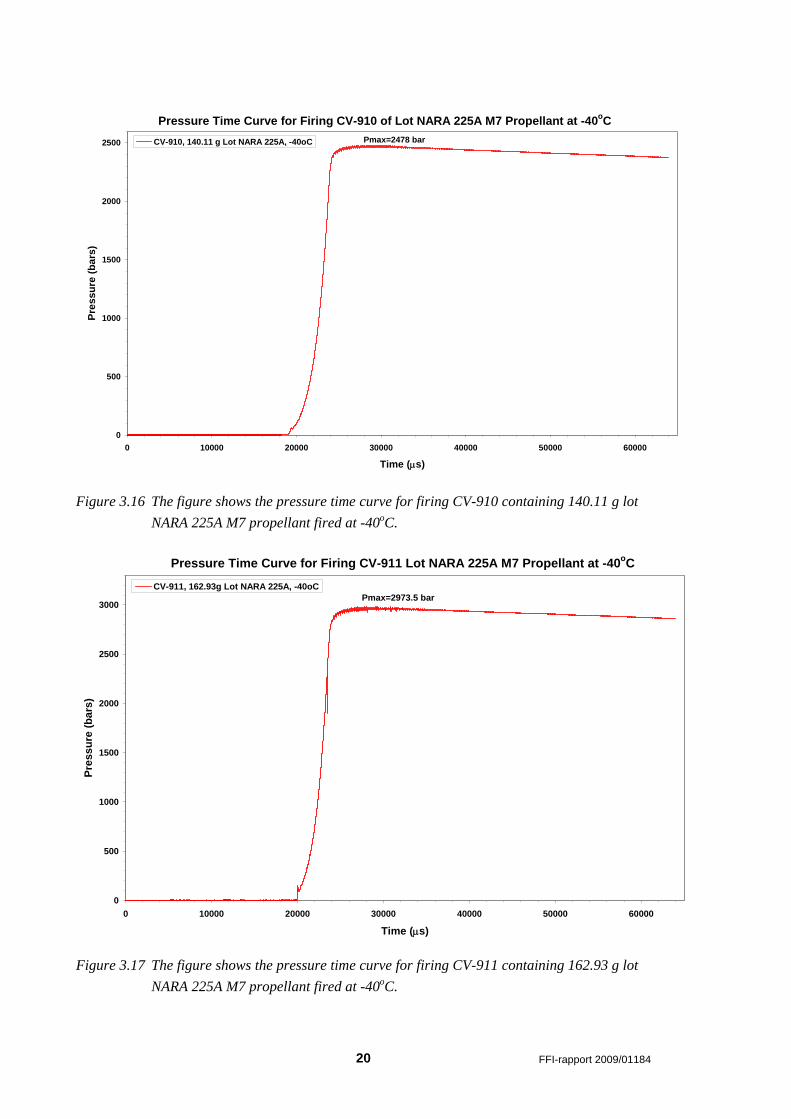
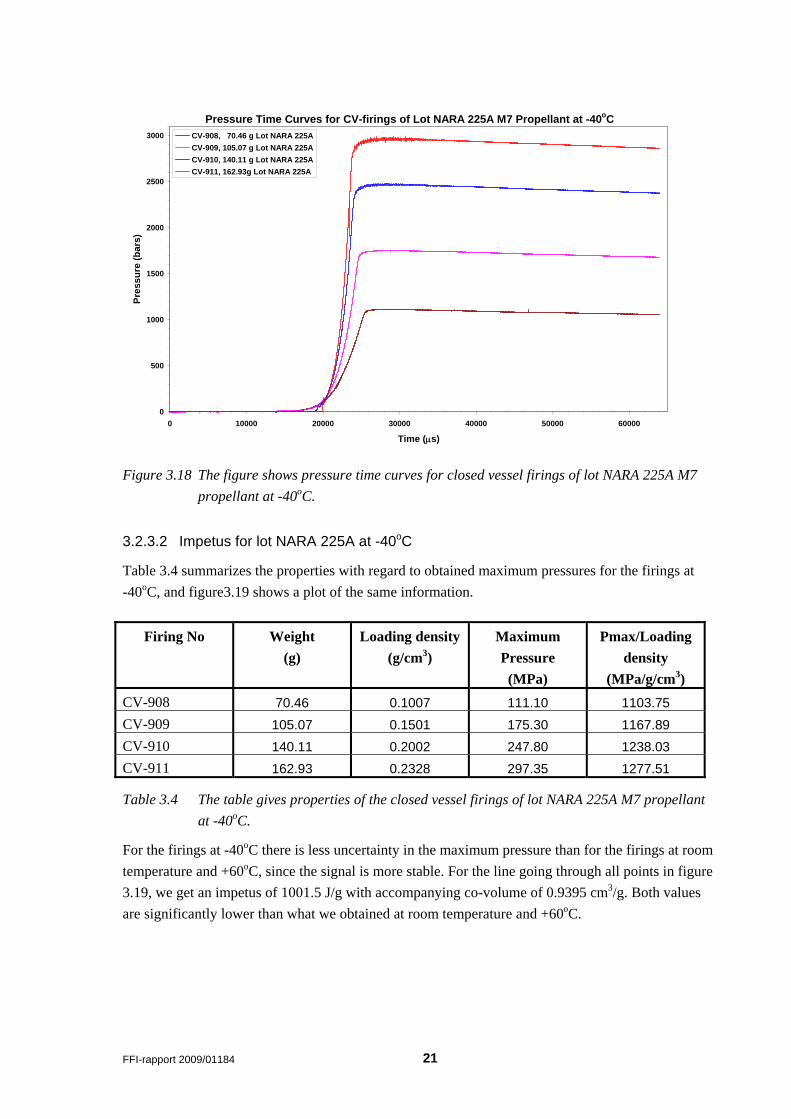
The test at -40oC was performed by loading the closed vessel and than store it in a freezer holding -40oC for 24 hours or longer. Earlier investigations have shown that the closed vessels we use need that time to be cooled down to this temperature. We did perform 4 firings with different loading density starting with 0.1 g/cm3 (70.46 g) followed by 0.15 g/cm3 (105.07g), 0.20 (105.07g) g/cm3 (105.07g) and the last one with 0.233 g/cm3 (162.93 g). Figure 3.14 to 3.17 gives pictures of the obtained pressure time curves for all firings. Figure 3.18 shows plots of all 4 curves and as can be seen from the figure, except for the intensity in the ringing they all have the same form. From figure 3.16 and 3.17 one will see that the pressure registration in the beginning before trigging is disturbed. This may be caused by the grease filled in the canal in front of the pressure gauge. At -40oC the grease may have been solid.
FFI-rapport 2009/01184 19
Pressure Time Curve for Firing CV-908 Lot NARA 225A M7 Propellant at -40oC
0
200
400
600
800
1000
1200
0 10000 20000 30000 40000 50000 60000Time (μs)
Pres
sure
(MPa
)CV-908, 70.46 g Lot NARA 225A Pmax=1111 bar
Figure 3.14 The figure shows the pressure time curve for firing CV-908 containing 70.46 g lot NARA 225A M7 propellant fired at -40oC.
Pressure Time Curve for Firing CV-909 Lot NARA 225A M7 Propellant at -40oC
0
200
400
600
800
1000
1200
1400
1600
1800
0 10000 20000 30000 40000 50000 60000
Time (μs)
Pres
sure
(bar
s)
CV-909, 105.07 g Lot NARA 225A Pmax=1753 bar
Figure 3.15 The figure shows the pressure time curve for firing CV-909 containing 105.07 g lot NARA 225A M7 propellant fired at -40oC.
20 FFI-rapport 2009/01184
Pressure Time Curve for Firing CV-910 of Lot NARA 225A M7 Propellant at -40oC
0
500
1000
1500
2000
2500
0 10000 20000 30000 40000 50000 60000
Time (μs)
Pres
sure
(bar
s)
CV-910, 140.11 g Lot NARA 225A, -40oC Pmax=2478 bar
Figure 3.16 The figure shows the pressure time curve for firing CV-910 containing 140.11 g lot NARA 225A M7 propellant fired at -40oC.
Pressure Time Curve for Firing CV-911 Lot NARA 225A M7 Propellant at -40oC
0
500
1000
1500
2000
2500
3000
0 10000 20000 30000 40000 50000 60000
Time (μs)
Pres
sure
(bar
s)
CV-911, 162.93g Lot NARA 225A, -40oCPmax=2973.5 bar
Figure 3.17 The figure shows the pressure time curve for firing CV-911 containing 162.93 g lot NARA 225A M7 propellant fired at -40oC.
FFI-rapport 2009/01184 21
Pressure Time Curves for CV-firings of Lot NARA 225A M7 Propellant at -40oC
0
500
1000
1500
2000
2500
3000
0 10000 20000 30000 40000 50000 60000
Time (μs)
Pres
sure
(bar
s)CV-908, 70.46 g Lot NARA 225ACV-909, 105.07 g Lot NARA 225ACV-910, 140.11 g Lot NARA 225ACV-911, 162.93g Lot NARA 225A
Figure 3.18 The figure shows pressure time curves for closed vessel firings of lot NARA 225A M7 propellant at -40oC.
3.2.3.2 Impetus for lot NARA 225A at -40oC
Table 3.4 summarizes the properties with regard to obtained maximum pressures for the firings at -40oC, and figure3.19 shows a plot of the same information.
Firing No Weight (g)
Loading density(g/cm3)
Maximum Pressure (MPa)
Pmax/Loading density
(MPa/g/cm3) CV-908 70.46 0.1007 111.10 1103.75 CV-909 105.07 0.1501 175.30 1167.89 CV-910 140.11 0.2002 247.80 1238.03 CV-911 162.93 0.2328 297.35 1277.51
Table 3.4 The table gives properties of the closed vessel firings of lot NARA 225A M7 propellant at -40oC.
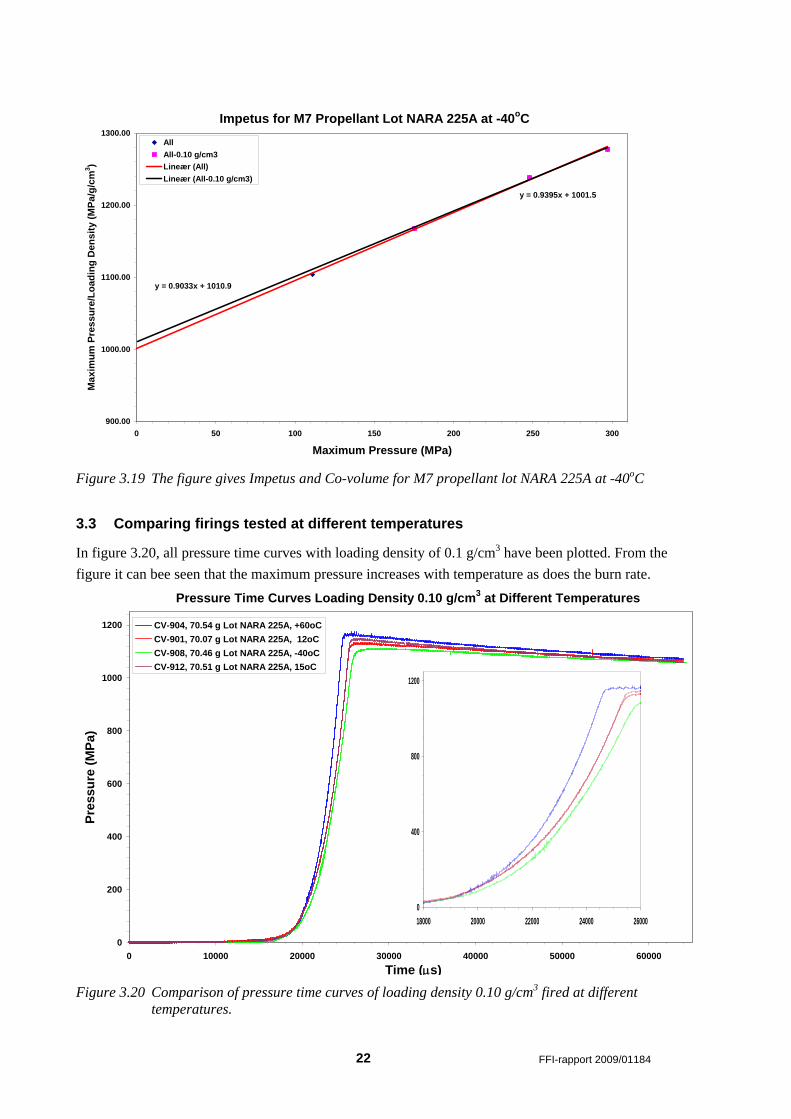
For the firings at -40oC there is less uncertainty in the maximum pressure than for the firings at room temperature and +60oC, since the signal is more stable. For the line going through all points in figure 3.19, we get an impetus of 1001.5 J/g with accompanying co-volume of 0.9395 cm3/g. Both values are significantly lower than what we obtained at room temperature and +60oC.
22 FFI-rapport 2009/01184
Impetus for M7 Propellant Lot NARA 225A at -40oC
y = 0.9395x + 1001.5
y = 0.9033x + 1010.9
900.00
1000.00
1100.00
1200.00
1300.00
0 50 100 150 200 250 300
Maximum Pressure (MPa)
Max
imum
Pre
ssur
e/Lo
adin
g D
ensi
ty (M
Pa/g
/cm
3 )
AllAll-0.10 g/cm3Lineær (All)Lineær (All-0.10 g/cm3)
Figure 3.19 The figure gives Impetus and Co-volume for M7 propellant lot NARA 225A at -40oC
3.3 Comparing firings tested at different temperatures
In figure 3.20, all pressure time curves with loading density of 0.1 g/cm3 have been plotted. From the figure it can bee seen that the maximum pressure increases with temperature as does the burn rate.
Pressure Time Curves Loading Density 0.10 g/cm3 at Different Temperatures
0
200
400
600
800
1000
1200
0 10000 20000 30000 40000 50000 60000Time (μs)
Pres
sure
(MPa
)
CV-904, 70.54 g Lot NARA 225A, +60oCCV-901, 70.07 g Lot NARA 225A, 12oCCV-908, 70.46 g Lot NARA 225A, -40oCCV-912, 70.51 g Lot NARA 225A, 15oC
Figure 3.20 Comparison of pressure time curves of loading density 0.10 g/cm3 fired at different
temperatures.
0
400
800
1200
18000 20000 22000 24000 26000
FFI-rapport 2009/01184 23
Pressure Time Curves Loading Density 0.15 g/cm3 at Different Temperatures
0
200
400
600
800
1000
1200
1400
1600
1800
2000
0 10000 20000 30000 40000 50000 60000
Time (μs)
Pres
sure
(bar
s)CV-905, 105.09 g Lot NARA 225A, +60oCCV-902, 104.73 g Lot NARA 225A, +12oCCV-909, 105.07 g Lot NARA 225A, -40oC
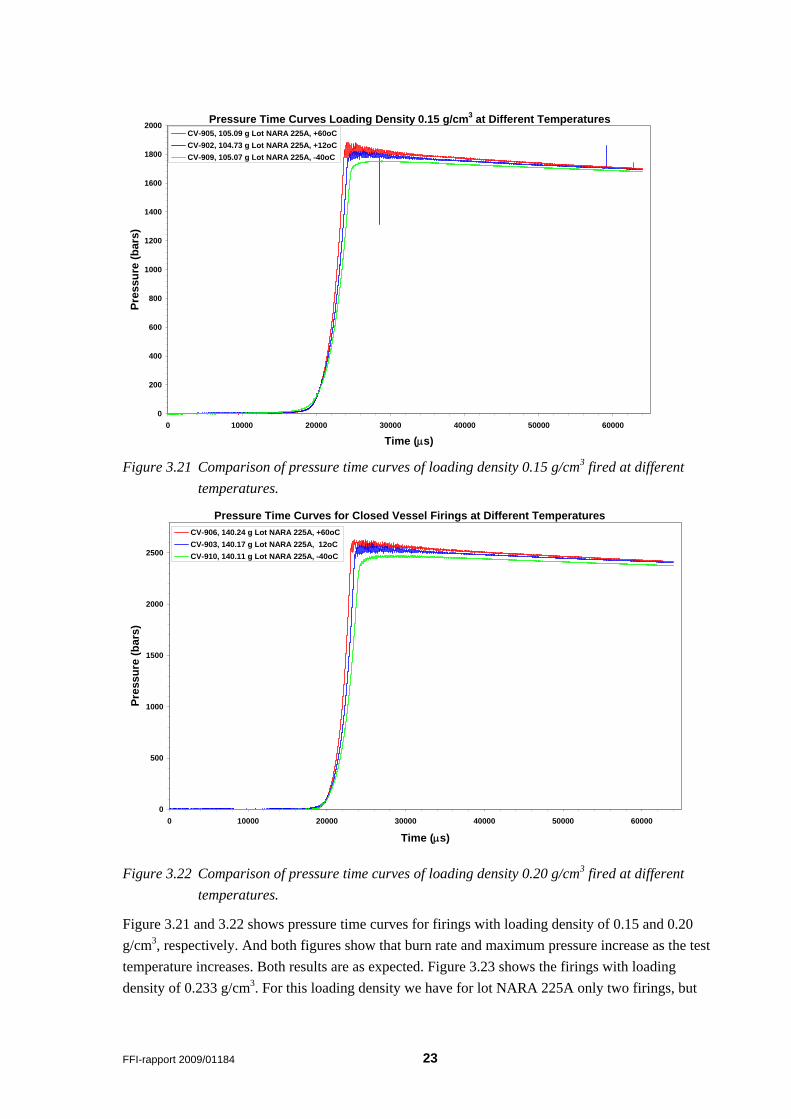
Figure 3.21 Comparison of pressure time curves of loading density 0.15 g/cm3 fired at different
temperatures.
Pressure Time Curves for Closed Vessel Firings at Different Temperatures
0
500
1000
1500
2000
2500
0 10000 20000 30000 40000 50000 60000
Time (μs)
Pres
sure
(bar
s)
CV-906, 140.24 g Lot NARA 225A, +60oCCV-903, 140.17 g Lot NARA 225A, 12oCCV-910, 140.11 g Lot NARA 225A, -40oC
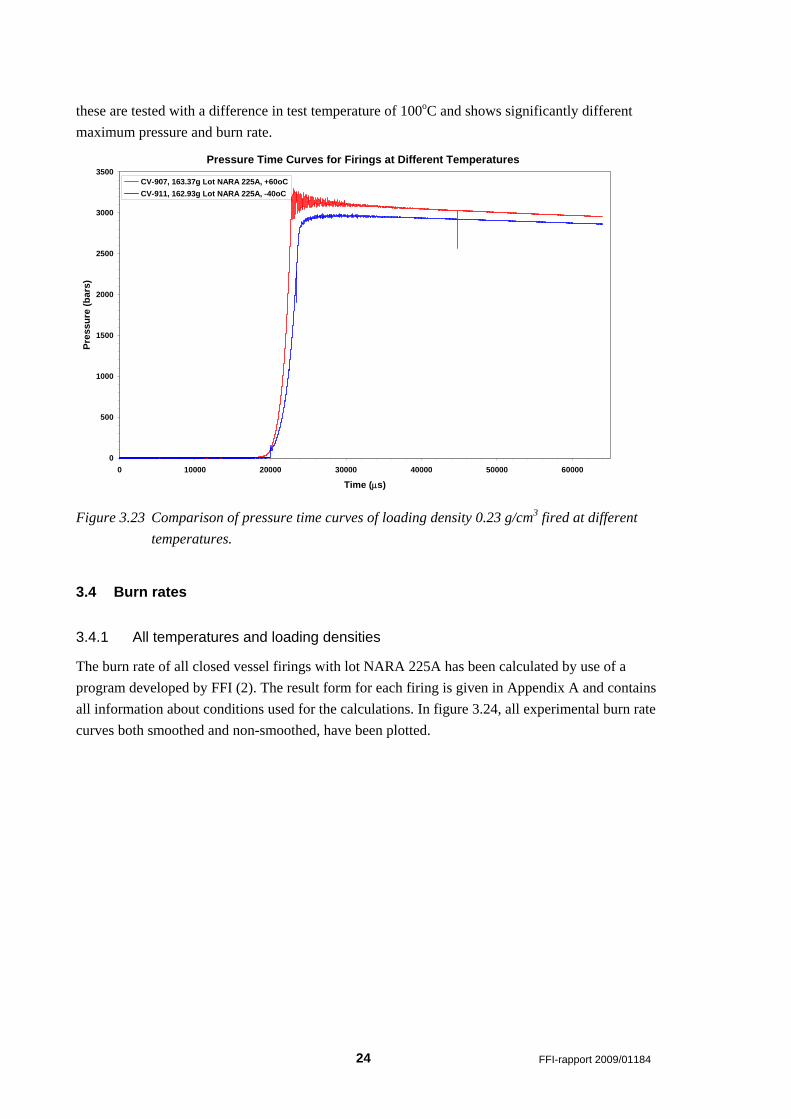
Figure 3.22 Comparison of pressure time curves of loading density 0.20 g/cm3 fired at different temperatures.
Figure 3.21 and 3.22 shows pressure time curves for firings with loading density of 0.15 and 0.20 g/cm3, respectively. And both figures show that burn rate and maximum pressure increase as the test temperature increases. Both results are as expected. Figure 3.23 shows the firings with loading density of 0.233 g/cm3. For this loading density we have for lot NARA 225A only two firings, but
24 FFI-rapport 2009/01184
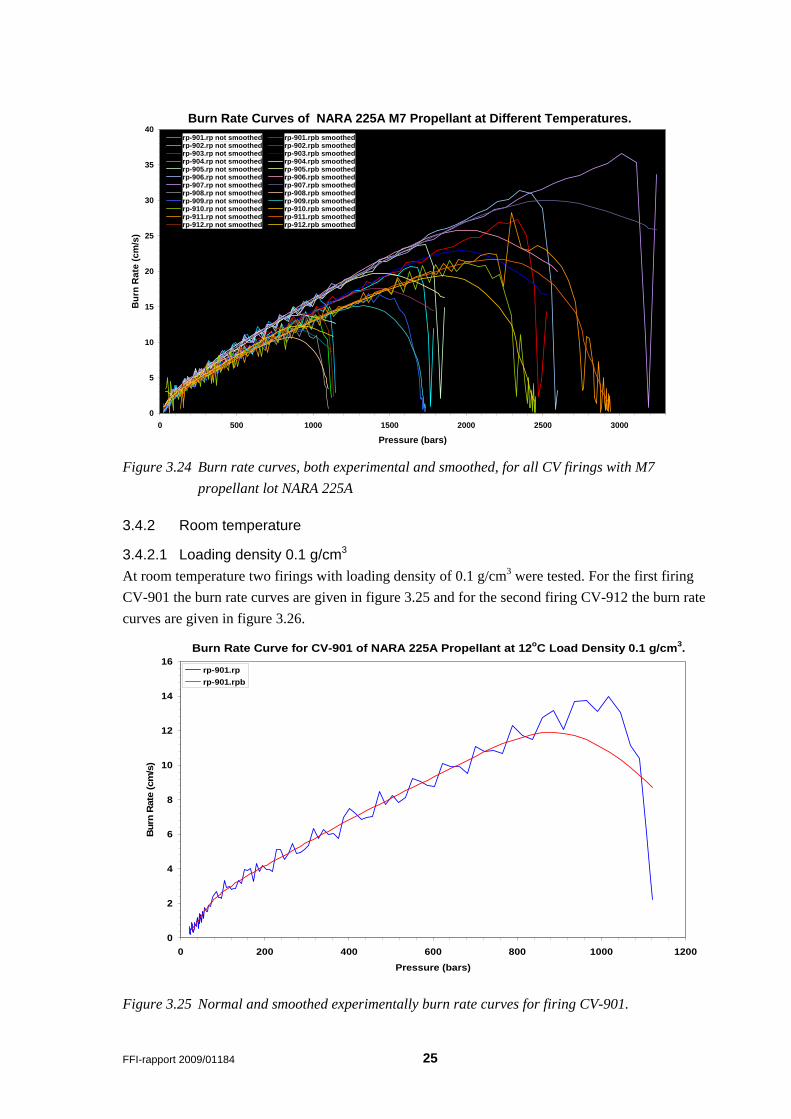
these are tested with a difference in test temperature of 100oC and shows significantly different maximum pressure and burn rate.
Pressure Time Curves for Firings at Different Temperatures
0
500
1000
1500
2000
2500
3000
3500
0 10000 20000 30000 40000 50000 60000
Time (μs)
Pres
sure
(bar
s)
CV-907, 163.37g Lot NARA 225A, +60oCCV-911, 162.93g Lot NARA 225A, -40oC
Figure 3.23 Comparison of pressure time curves of loading density 0.23 g/cm3 fired at different temperatures.
3.4 Burn rates
3.4.1 All temperatures and loading densities
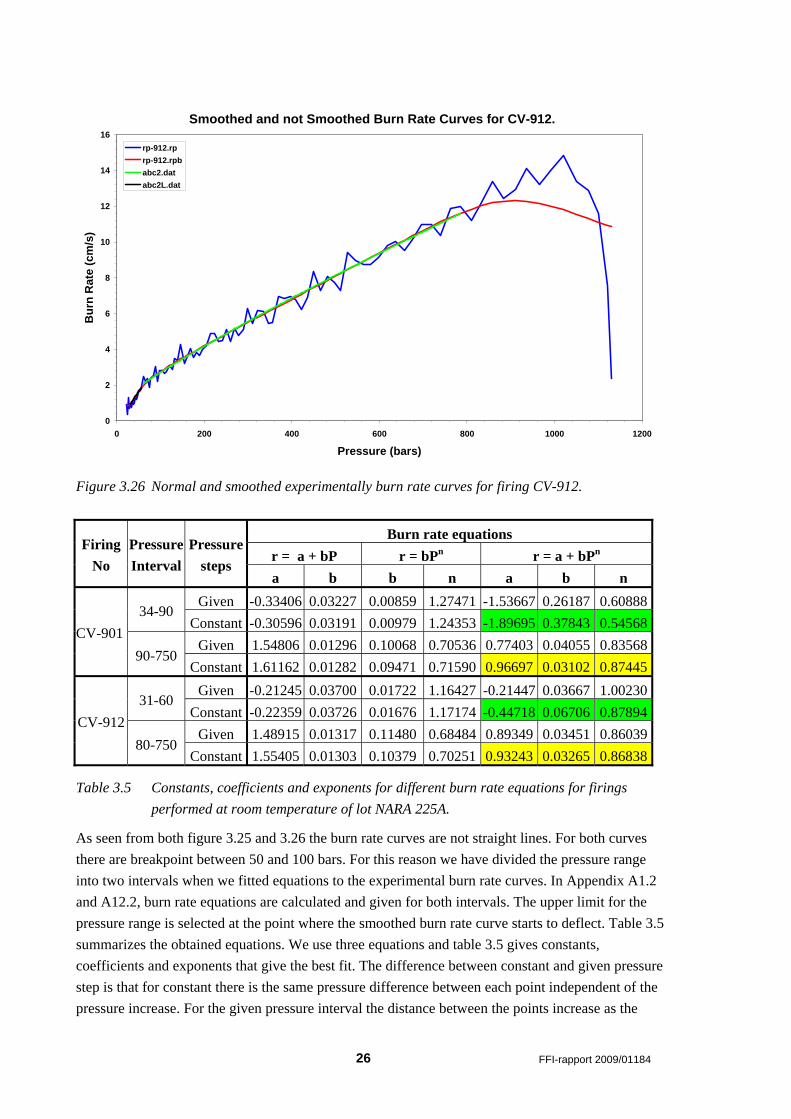
The burn rate of all closed vessel firings with lot NARA 225A has been calculated by use of a program developed by FFI (2). The result form for each firing is given in Appendix A and contains all information about conditions used for the calculations. In figure 3.24, all experimental burn rate curves both smoothed and non-smoothed, have been plotted.
FFI-rapport 2009/01184 25
Burn Rate Curves of NARA 225A M7 Propellant at Different Temperatures.
0
5
10
15
20
25
30
35
40
0 500 1000 1500 2000 2500 3000
Pressure (bars)
Bur
n R
ate
(cm
/s)
rp-901.rp not smoothed rp-901.rpb smoothedrp-902.rp not smoothed rp-902.rpb smoothedrp-903.rp not smoothed rp-903.rpb smoothedrp-904.rp not smoothed rp-904.rpb smoothedrp-905.rp not smoothed rp-905.rpb smoothedrp-906.rp not smoothed rp-906.rpb smoothedrp-907.rp not smoothed rp-907.rpb smoothedrp-908.rp not smoothed rp-908.rpb smoothedrp-909.rp not smoothed rp-909.rpb smoothedrp-910.rp not smoothed rp-910.rpb smoothedrp-911.rp not smoothed rp-911.rpb smoothedrp-912.rp not smoothed rp-912.rpb smoothed
Figure 3.24 Burn rate curves, both experimental and smoothed, for all CV firings with M7
propellant lot NARA 225A
3.4.2 Room temperature
3.4.2.1 Loading density 0.1 g/cm3 At room temperature two firings with loading density of 0.1 g/cm3 were tested. For the first firing CV-901 the burn rate curves are given in figure 3.25 and for the second firing CV-912 the burn rate curves are given in figure 3.26.
Burn Rate Curve for CV-901 of NARA 225A Propellant at 12oC Load Density 0.1 g/cm3.
0
2
4
6
8
10
12
14
16
0 200 400 600 800 1000 1200Pressure (bars)
Bur
n R
ate
(cm
/s)
rp-901.rprp-901.rpb
Figure 3.25 Normal and smoothed experimentally burn rate curves for firing CV-901.
26 FFI-rapport 2009/01184
Smoothed and not Smoothed Burn Rate Curves for CV-912.
0
2
4
6
8
10
12
14
16
0 200 400 600 800 1000 1200
Pressure (bars)
Bur
n R
ate
(cm
/s)
rp-912.rprp-912.rpbabc2.databc2L.dat
Figure 3.26 Normal and smoothed experimentally burn rate curves for firing CV-912.
Burn rate equations r = a + bP r = bPn r = a + bPn
Firing No
Pressure Interval
Pressuresteps
a b b n a b n Given -0.33406 0.03227 0.00859 1.27471 -1.53667 0.26187 0.60888
34-90 Constant -0.30596 0.03191 0.00979 1.24353 -1.89695 0.37843 0.54568
Given 1.54806 0.01296 0.10068 0.70536 0.77403 0.04055 0.83568 CV-901
90-750 Constant 1.61162 0.01282 0.09471 0.71590 0.96697 0.03102 0.87445
Given -0.21245 0.03700 0.01722 1.16427 -0.21447 0.03667 1.00230 31-60
Constant -0.22359 0.03726 0.01676 1.17174 -0.44718 0.06706 0.87894 Given 1.48915 0.01317 0.11480 0.68484 0.89349 0.03451 0.86039
CV-912 80-750
Constant 1.55405 0.01303 0.10379 0.70251 0.93243 0.03265 0.86838
Table 3.5 Constants, coefficients and exponents for different burn rate equations for firings performed at room temperature of lot NARA 225A.
As seen from both figure 3.25 and 3.26 the burn rate curves are not straight lines. For both curves there are breakpoint between 50 and 100 bars. For this reason we have divided the pressure range into two intervals when we fitted equations to the experimental burn rate curves. In Appendix A1.2 and A12.2, burn rate equations are calculated and given for both intervals. The upper limit for the pressure range is selected at the point where the smoothed burn rate curve starts to deflect. Table 3.5 summarizes the obtained equations. We use three equations and table 3.5 gives constants, coefficients and exponents that give the best fit. The difference between constant and given pressure step is that for constant there is the same pressure difference between each point independent of the pressure increase. For the given pressure interval the distance between the points increase as the
FFI-rapport 2009/01184 27
pressure increase, and this gives only a few point at high pressure when the rate of pressure increase is high. Therefore the equations fitted with constant pressure interval normally gives the best fit with the experimentally found burn rate curve. For CV-901 all equations together with the experimentally smoothed burn rate curve have been plotted for the pressure range 34-90 bars in Figure App. 1 and in Figure App.2 for the pressure range 90-750 bars. In both figures the equations of the form r = a +b*Pn give the best fit and the equations using constant pressure interval gives better fit than those using given pressure interval. In figure 3.26 the burn rate equation r=a +b*Pn using constant pressure interval has been plotted, and as the figure shows this equation fits well with the experimental burn rate curve.
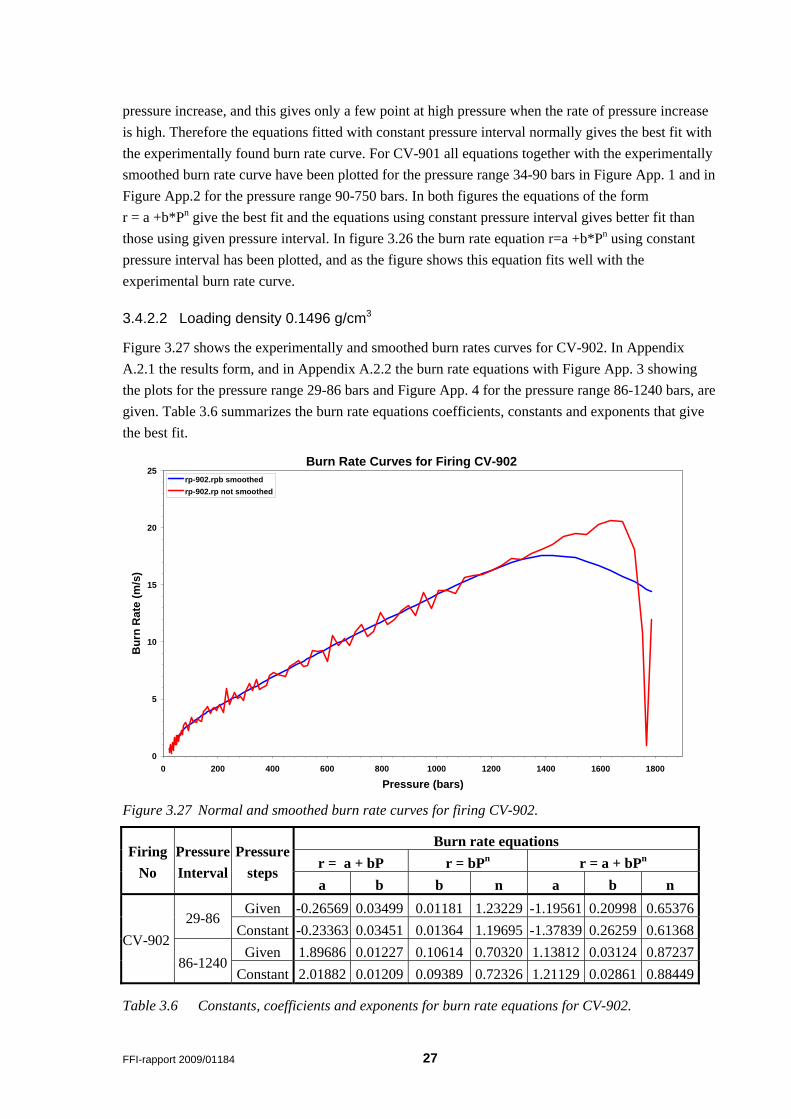
3.4.2.2 Loading density 0.1496 g/cm3
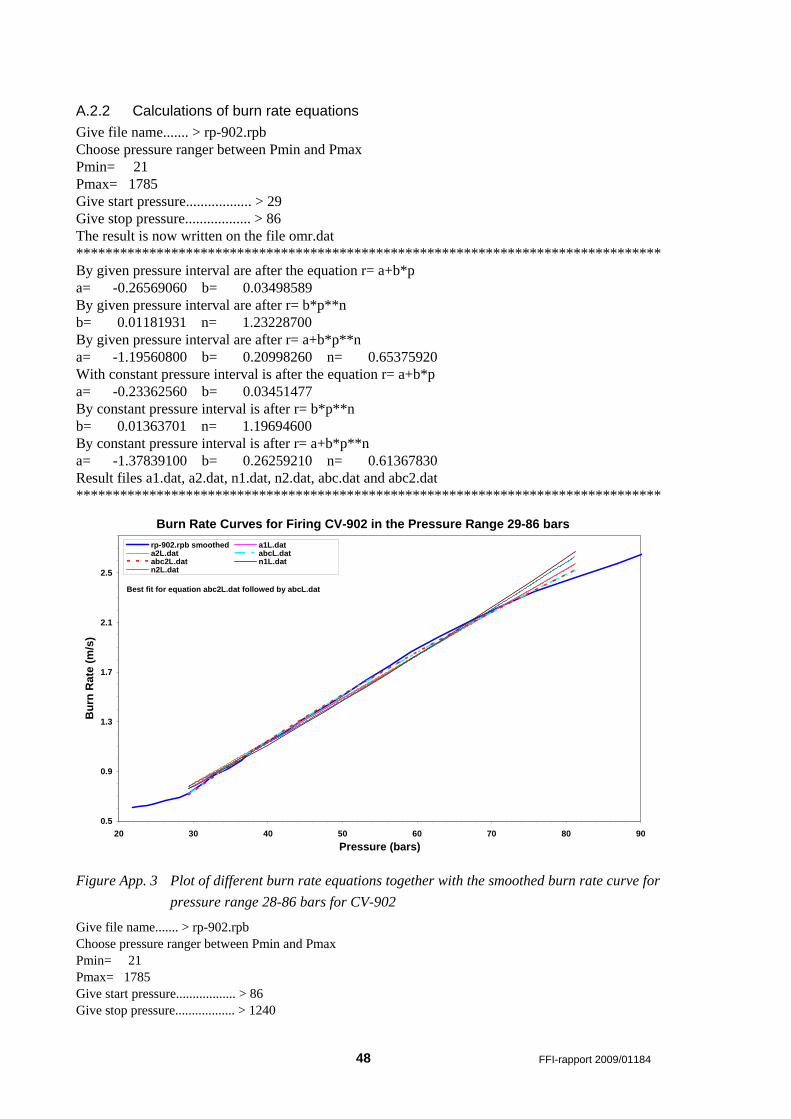
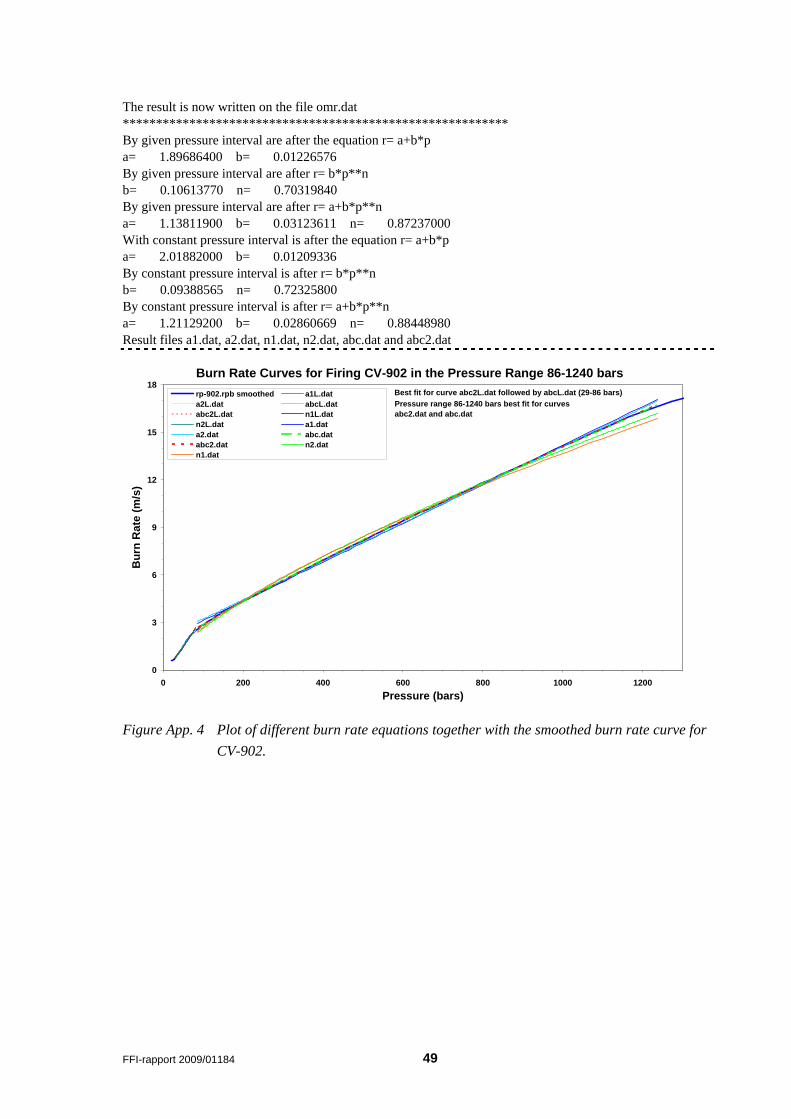
Figure 3.27 shows the experimentally and smoothed burn rates curves for CV-902. In Appendix A.2.1 the results form, and in Appendix A.2.2 the burn rate equations with Figure App. 3 showing the plots for the pressure range 29-86 bars and Figure App. 4 for the pressure range 86-1240 bars, are given. Table 3.6 summarizes the burn rate equations coefficients, constants and exponents that give the best fit.
Burn Rate Curves for Firing CV-902
0
5
10
15
20
25
0 200 400 600 800 1000 1200 1400 1600 1800
Pressure (bars)
Bur
n R
ate
(m/s
)
rp-902.rpb smoothedrp-902.rp not smoothed
Figure 3.27 Normal and smoothed burn rate curves for firing CV-902.
Burn rate equations r = a + bP r = bPn r = a + bPn
Firing No
Pressure Interval
Pressure steps
a b b n a b n Given -0.26569 0.03499 0.01181 1.23229 -1.19561 0.20998 0.65376
29-86 Constant -0.23363 0.03451 0.01364 1.19695 -1.37839 0.26259 0.61368
Given 1.89686 0.01227 0.10614 0.70320 1.13812 0.03124 0.87237CV-902
86-1240 Constant 2.01882 0.01209 0.09389 0.72326 1.21129 0.02861 0.88449
Table 3.6 Constants, coefficients and exponents for burn rate equations for CV-902.
28 FFI-rapport 2009/01184
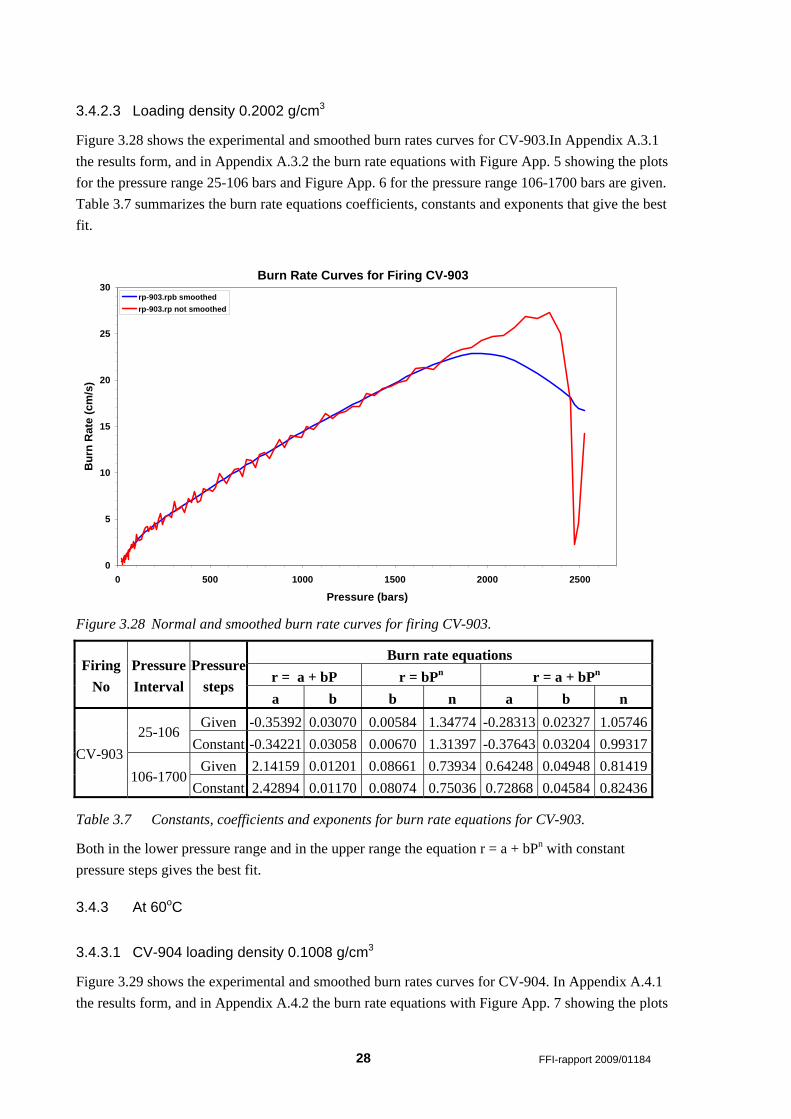
3.4.2.3 Loading density 0.2002 g/cm3
Figure 3.28 shows the experimental and smoothed burn rates curves for CV-903.In Appendix A.3.1 the results form, and in Appendix A.3.2 the burn rate equations with Figure App. 5 showing the plots for the pressure range 25-106 bars and Figure App. 6 for the pressure range 106-1700 bars are given. Table 3.7 summarizes the burn rate equations coefficients, constants and exponents that give the best fit.
Burn Rate Curves for Firing CV-903
0
5
10
15
20
25
30
0 500 1000 1500 2000 2500
Pressure (bars)
Bur
n R
ate
(cm
/s)
rp-903.rpb smoothedrp-903.rp not smoothed
Figure 3.28 Normal and smoothed burn rate curves for firing CV-903.
Burn rate equations r = a + bP r = bPn r = a + bPn
Firing No
Pressure Interval
Pressure steps
a b b n a b n Given -0.35392 0.03070 0.00584 1.34774 -0.28313 0.02327 1.05746
25-106 Constant -0.34221 0.03058 0.00670 1.31397 -0.37643 0.03204 0.99317
Given 2.14159 0.01201 0.08661 0.73934 0.64248 0.04948 0.81419 CV-903
106-1700 Constant 2.42894 0.01170 0.08074 0.75036 0.72868 0.04584 0.82436
Table 3.7 Constants, coefficients and exponents for burn rate equations for CV-903.
Both in the lower pressure range and in the upper range the equation r = a + bPn with constant pressure steps gives the best fit.
3.4.3 At 60oC
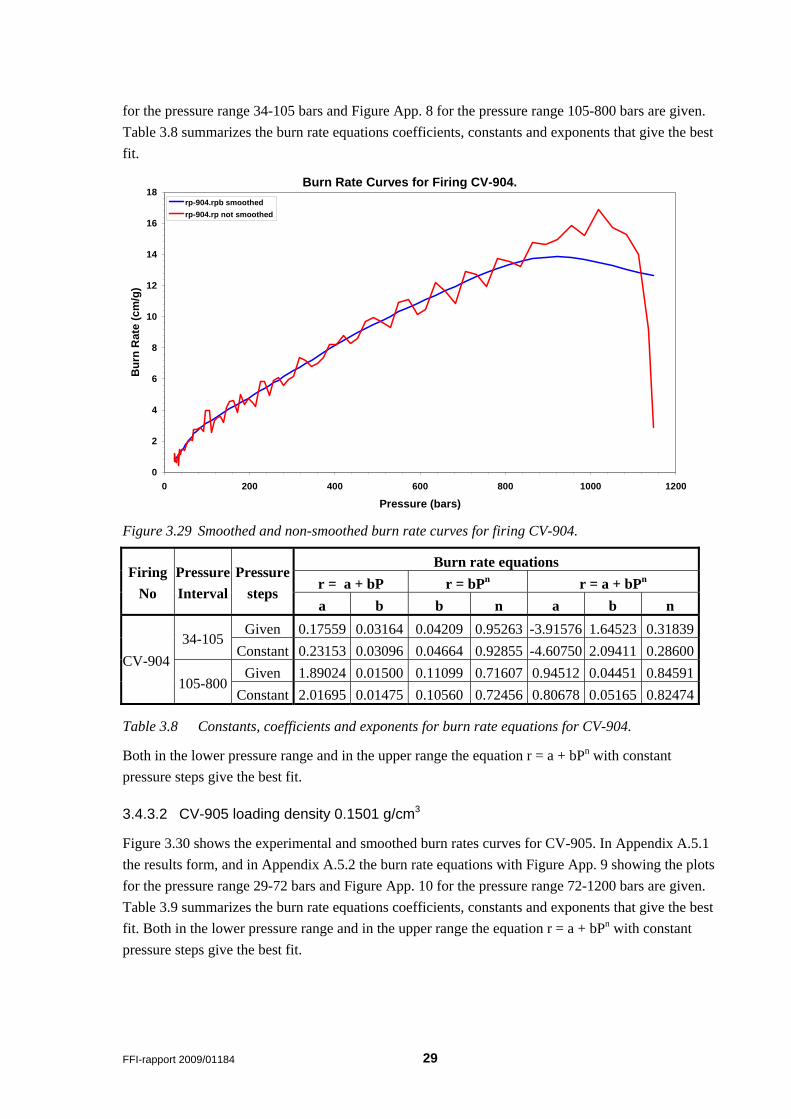
3.4.3.1 CV-904 loading density 0.1008 g/cm3
Figure 3.29 shows the experimental and smoothed burn rates curves for CV-904. In Appendix A.4.1 the results form, and in Appendix A.4.2 the burn rate equations with Figure App. 7 showing the plots
FFI-rapport 2009/01184 29
for the pressure range 34-105 bars and Figure App. 8 for the pressure range 105-800 bars are given. Table 3.8 summarizes the burn rate equations coefficients, constants and exponents that give the best fit.
Burn Rate Curves for Firing CV-904.
0
2
4
6
8
10
12
14
16
18
0 200 400 600 800 1000 1200
Pressure (bars)
Bur
n R
ate
(cm
/g)
rp-904.rpb smoothedrp-904.rp not smoothed
Figure 3.29 Smoothed and non-smoothed burn rate curves for firing CV-904.
Burn rate equations r = a + bP r = bPn r = a + bPn
Firing No
Pressure Interval
Pressure steps
a b b n a b n Given 0.17559 0.03164 0.04209 0.95263 -3.91576 1.64523 0.31839
34-105 Constant 0.23153 0.03096 0.04664 0.92855 -4.60750 2.09411 0.28600
Given 1.89024 0.01500 0.11099 0.71607 0.94512 0.04451 0.84591CV-904
105-800 Constant 2.01695 0.01475 0.10560 0.72456 0.80678 0.05165 0.82474
Table 3.8 Constants, coefficients and exponents for burn rate equations for CV-904.
Both in the lower pressure range and in the upper range the equation r = a + bPn with constant pressure steps give the best fit.
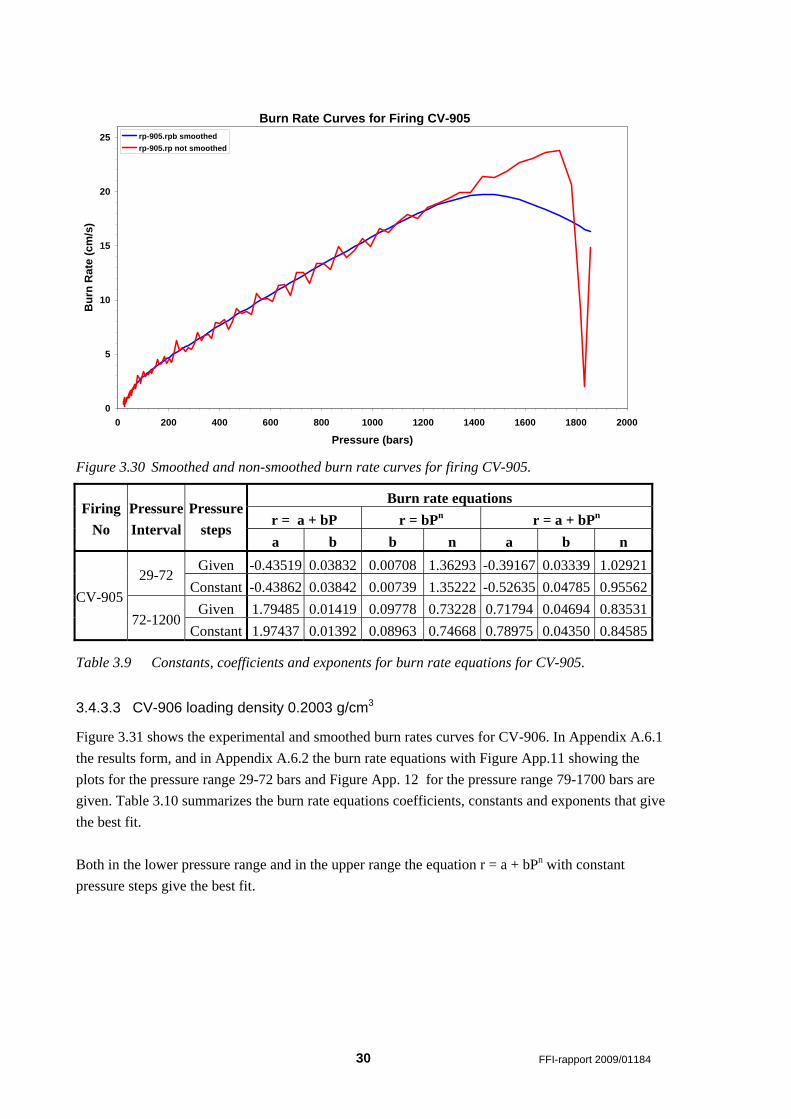
3.4.3.2 CV-905 loading density 0.1501 g/cm3
Figure 3.30 shows the experimental and smoothed burn rates curves for CV-905. In Appendix A.5.1 the results form, and in Appendix A.5.2 the burn rate equations with Figure App. 9 showing the plots for the pressure range 29-72 bars and Figure App. 10 for the pressure range 72-1200 bars are given. Table 3.9 summarizes the burn rate equations coefficients, constants and exponents that give the best fit. Both in the lower pressure range and in the upper range the equation r = a + bPn with constant pressure steps give the best fit.
30 FFI-rapport 2009/01184
Burn Rate Curves for Firing CV-905
0
5
10
15
20
25
0 200 400 600 800 1000 1200 1400 1600 1800 2000
Pressure (bars)
Bur
n R
ate
(cm
/s)
rp-905.rpb smoothedrp-905.rp not smoothed
Figure 3.30 Smoothed and non-smoothed burn rate curves for firing CV-905.
Burn rate equations r = a + bP r = bPn r = a + bPn
Firing No
Pressure Interval
Pressuresteps
a b b n a b n Given -0.43519 0.03832 0.00708 1.36293 -0.39167 0.03339 1.02921
29-72 Constant -0.43862 0.03842 0.00739 1.35222 -0.52635 0.04785 0.95562
Given 1.79485 0.01419 0.09778 0.73228 0.71794 0.04694 0.83531 CV-905
72-1200 Constant 1.97437 0.01392 0.08963 0.74668 0.78975 0.04350 0.84585
Table 3.9 Constants, coefficients and exponents for burn rate equations for CV-905.
3.4.3.3 CV-906 loading density 0.2003 g/cm3
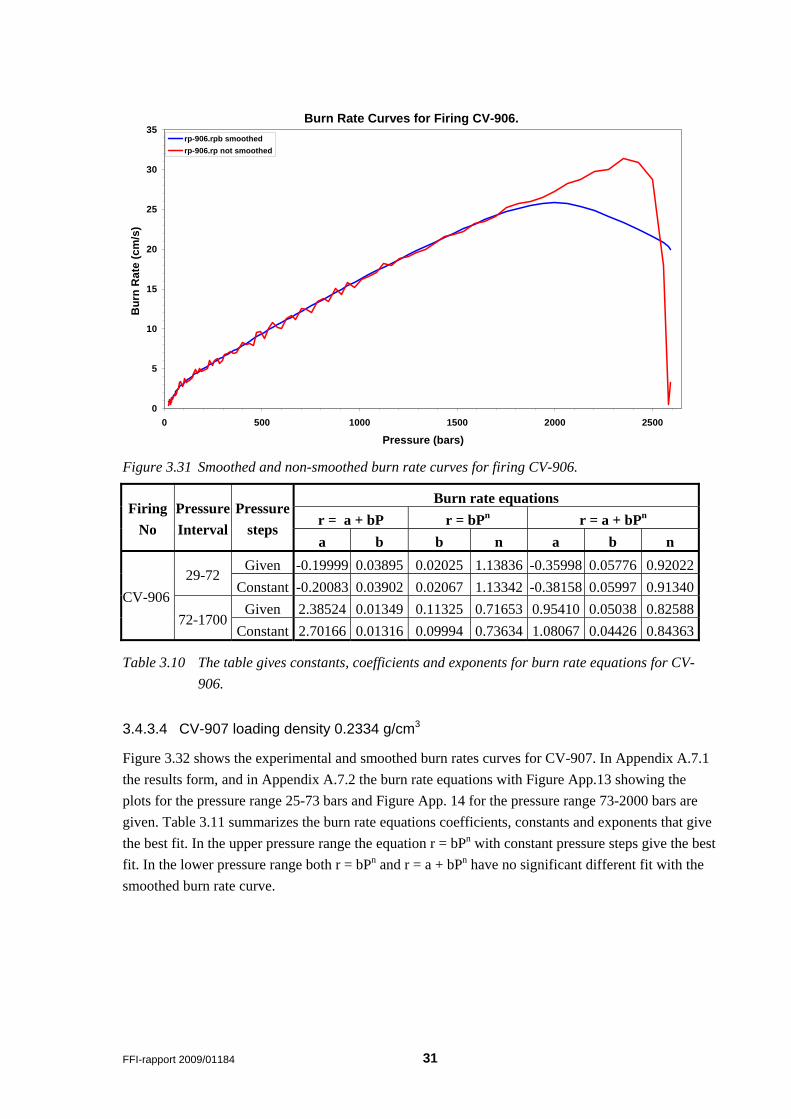
Figure 3.31 shows the experimental and smoothed burn rates curves for CV-906. In Appendix A.6.1 the results form, and in Appendix A.6.2 the burn rate equations with Figure App.11 showing the plots for the pressure range 29-72 bars and Figure App. 12 for the pressure range 79-1700 bars are given. Table 3.10 summarizes the burn rate equations coefficients, constants and exponents that give the best fit. Both in the lower pressure range and in the upper range the equation r = a + bPn with constant pressure steps give the best fit.
FFI-rapport 2009/01184 31
Burn Rate Curves for Firing CV-906.
0
5
10
15
20
25
30
35
0 500 1000 1500 2000 2500
Pressure (bars)
Bur
n R
ate
(cm
/s)
rp-906.rpb smoothedrp-906.rp not smoothed
Figure 3.31 Smoothed and non-smoothed burn rate curves for firing CV-906.
Burn rate equations r = a + bP r = bPn r = a + bPn
Firing No
Pressure Interval
Pressure steps
a b b n a b n Given -0.19999 0.03895 0.02025 1.13836 -0.35998 0.05776 0.92022
29-72 Constant -0.20083 0.03902 0.02067 1.13342 -0.38158 0.05997 0.91340
Given 2.38524 0.01349 0.11325 0.71653 0.95410 0.05038 0.82588CV-906
72-1700 Constant 2.70166 0.01316 0.09994 0.73634 1.08067 0.04426 0.84363
Table 3.10 The table gives constants, coefficients and exponents for burn rate equations for CV-906.
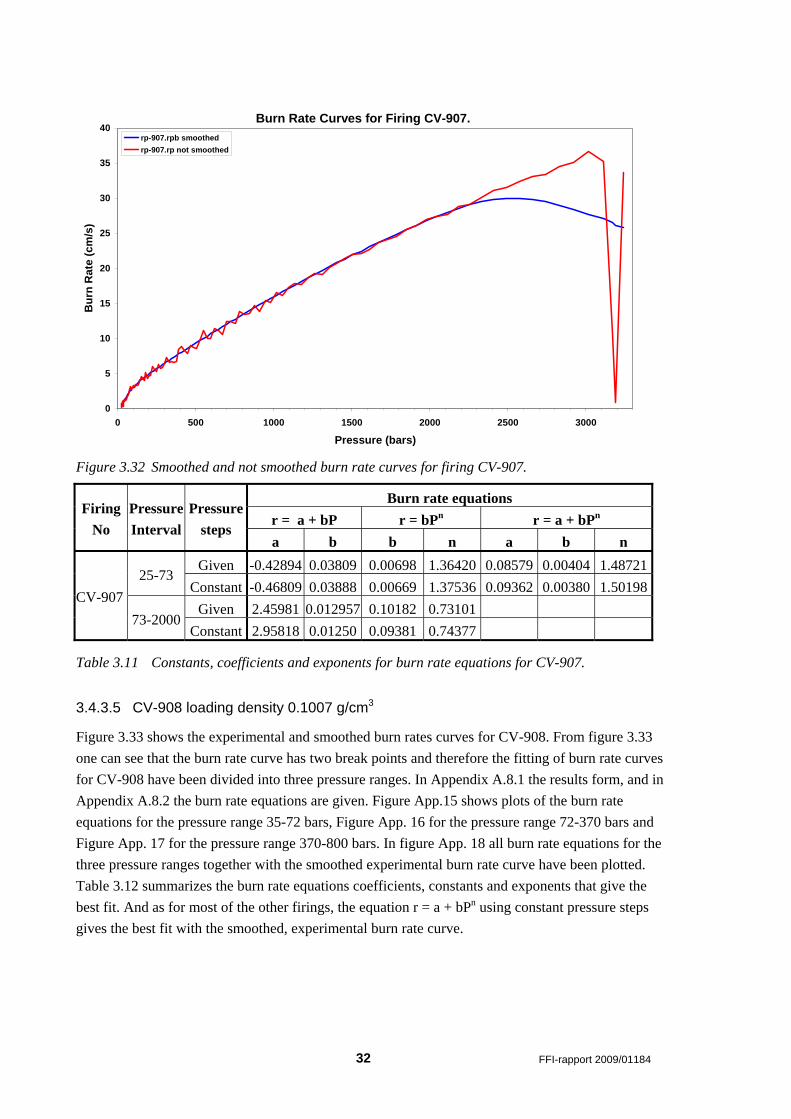
3.4.3.4 CV-907 loading density 0.2334 g/cm3
Figure 3.32 shows the experimental and smoothed burn rates curves for CV-907. In Appendix A.7.1 the results form, and in Appendix A.7.2 the burn rate equations with Figure App.13 showing the plots for the pressure range 25-73 bars and Figure App. 14 for the pressure range 73-2000 bars are given. Table 3.11 summarizes the burn rate equations coefficients, constants and exponents that give the best fit. In the upper pressure range the equation r = bPn with constant pressure steps give the best fit. In the lower pressure range both r = bPn and r = a + bPn have no significant different fit with the smoothed burn rate curve.
32 FFI-rapport 2009/01184
Burn Rate Curves for Firing CV-907.
0
5
10
15
20
25
30
35
40
0 500 1000 1500 2000 2500 3000
Pressure (bars)
Bur
n R
ate
(cm
/s)
rp-907.rpb smoothedrp-907.rp not smoothed
Figure 3.32 Smoothed and not smoothed burn rate curves for firing CV-907.
Burn rate equations r = a + bP r = bPn r = a + bPn
Firing No
Pressure Interval
Pressuresteps
a b b n a b n Given -0.42894 0.03809 0.00698 1.36420 0.08579 0.00404 1.48721
25-73 Constant -0.46809 0.03888 0.00669 1.37536 0.09362 0.00380 1.50198
Given 2.45981 0.012957 0.10182 0.73101 CV-907
73-2000 Constant 2.95818 0.01250 0.09381 0.74377
Table 3.11 Constants, coefficients and exponents for burn rate equations for CV-907.
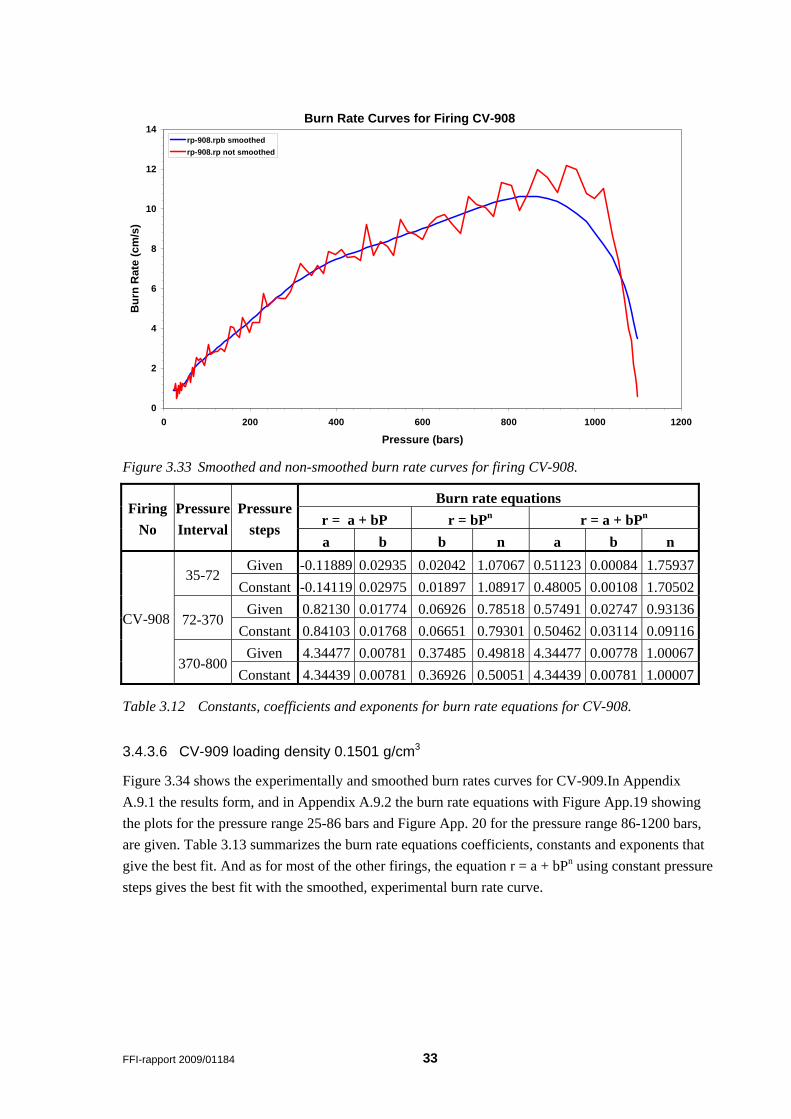
3.4.3.5 CV-908 loading density 0.1007 g/cm3
Figure 3.33 shows the experimental and smoothed burn rates curves for CV-908. From figure 3.33 one can see that the burn rate curve has two break points and therefore the fitting of burn rate curves for CV-908 have been divided into three pressure ranges. In Appendix A.8.1 the results form, and in Appendix A.8.2 the burn rate equations are given. Figure App.15 shows plots of the burn rate equations for the pressure range 35-72 bars, Figure App. 16 for the pressure range 72-370 bars and Figure App. 17 for the pressure range 370-800 bars. In figure App. 18 all burn rate equations for the three pressure ranges together with the smoothed experimental burn rate curve have been plotted. Table 3.12 summarizes the burn rate equations coefficients, constants and exponents that give the best fit. And as for most of the other firings, the equation r = a + bPn using constant pressure steps gives the best fit with the smoothed, experimental burn rate curve.
FFI-rapport 2009/01184 33
Burn Rate Curves for Firing CV-908
0
2
4
6
8
10
12
14
0 200 400 600 800 1000 1200
Pressure (bars)
Bur
n R
ate
(cm
/s)
rp-908.rpb smoothedrp-908.rp not smoothed
Figure 3.33 Smoothed and non-smoothed burn rate curves for firing CV-908.
Burn rate equations r = a + bP r = bPn r = a + bPn
Firing No
Pressure Interval
Pressure steps
a b b n a b n Given -0.11889 0.02935 0.02042 1.07067 0.51123 0.00084 1.75937
35-72 Constant -0.14119 0.02975 0.01897 1.08917 0.48005 0.00108 1.70502
Given 0.82130 0.01774 0.06926 0.78518 0.57491 0.02747 0.9313672-370
Constant 0.84103 0.01768 0.06651 0.79301 0.50462 0.03114 0.09116Given 4.34477 0.00781 0.37485 0.49818 4.34477 0.00778 1.00067
CV-908
370-800 Constant 4.34439 0.00781 0.36926 0.50051 4.34439 0.00781 1.00007
Table 3.12 Constants, coefficients and exponents for burn rate equations for CV-908.
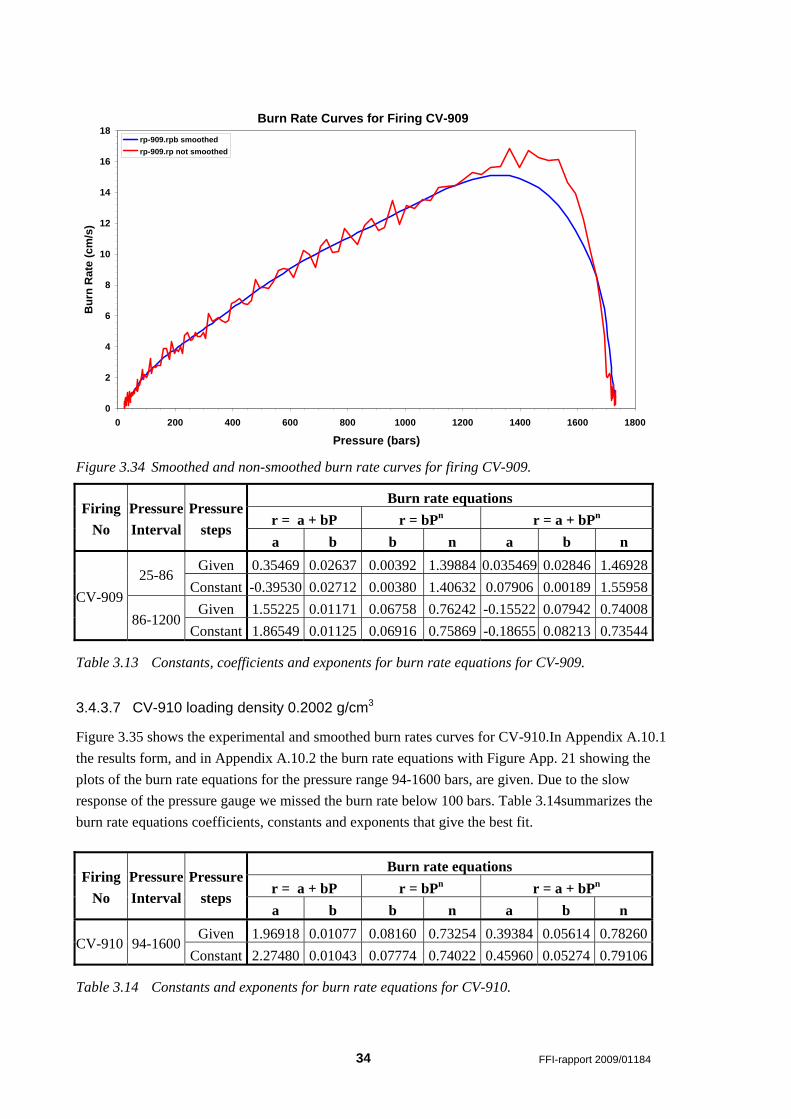
3.4.3.6 CV-909 loading density 0.1501 g/cm3
Figure 3.34 shows the experimentally and smoothed burn rates curves for CV-909.In Appendix A.9.1 the results form, and in Appendix A.9.2 the burn rate equations with Figure App.19 showing the plots for the pressure range 25-86 bars and Figure App. 20 for the pressure range 86-1200 bars, are given. Table 3.13 summarizes the burn rate equations coefficients, constants and exponents that give the best fit. And as for most of the other firings, the equation r = a + bPn using constant pressure steps gives the best fit with the smoothed, experimental burn rate curve.
34 FFI-rapport 2009/01184
Burn Rate Curves for Firing CV-909
0
2
4
6
8
10
12
14
16
18
0 200 400 600 800 1000 1200 1400 1600 1800
Pressure (bars)
Bur
n R
ate
(cm
/s)
rp-909.rpb smoothedrp-909.rp not smoothed
Figure 3.34 Smoothed and non-smoothed burn rate curves for firing CV-909.
Burn rate equations r = a + bP r = bPn r = a + bPn
Firing No
Pressure Interval
Pressuresteps
a b b n a b n Given 0.35469 0.02637 0.00392 1.39884 0.035469 0.02846 1.46928
25-86 Constant -0.39530 0.02712 0.00380 1.40632 0.07906 0.00189 1.55958
Given 1.55225 0.01171 0.06758 0.76242 -0.15522 0.07942 0.74008 CV-909
86-1200 Constant 1.86549 0.01125 0.06916 0.75869 -0.18655 0.08213 0.73544
Table 3.13 Constants, coefficients and exponents for burn rate equations for CV-909.
3.4.3.7 CV-910 loading density 0.2002 g/cm3
Figure 3.35 shows the experimental and smoothed burn rates curves for CV-910.In Appendix A.10.1 the results form, and in Appendix A.10.2 the burn rate equations with Figure App. 21 showing the plots of the burn rate equations for the pressure range 94-1600 bars, are given. Due to the slow response of the pressure gauge we missed the burn rate below 100 bars. Table 3.14summarizes the burn rate equations coefficients, constants and exponents that give the best fit.
Burn rate equations r = a + bP r = bPn r = a + bPn
Firing No
Pressure Interval
Pressuresteps
a b b n a b n Given 1.96918 0.01077 0.08160 0.73254 0.39384 0.05614 0.78260
CV-910 94-1600 Constant 2.27480 0.01043 0.07774 0.74022 0.45960 0.05274 0.79106
Table 3.14 Constants and exponents for burn rate equations for CV-910.
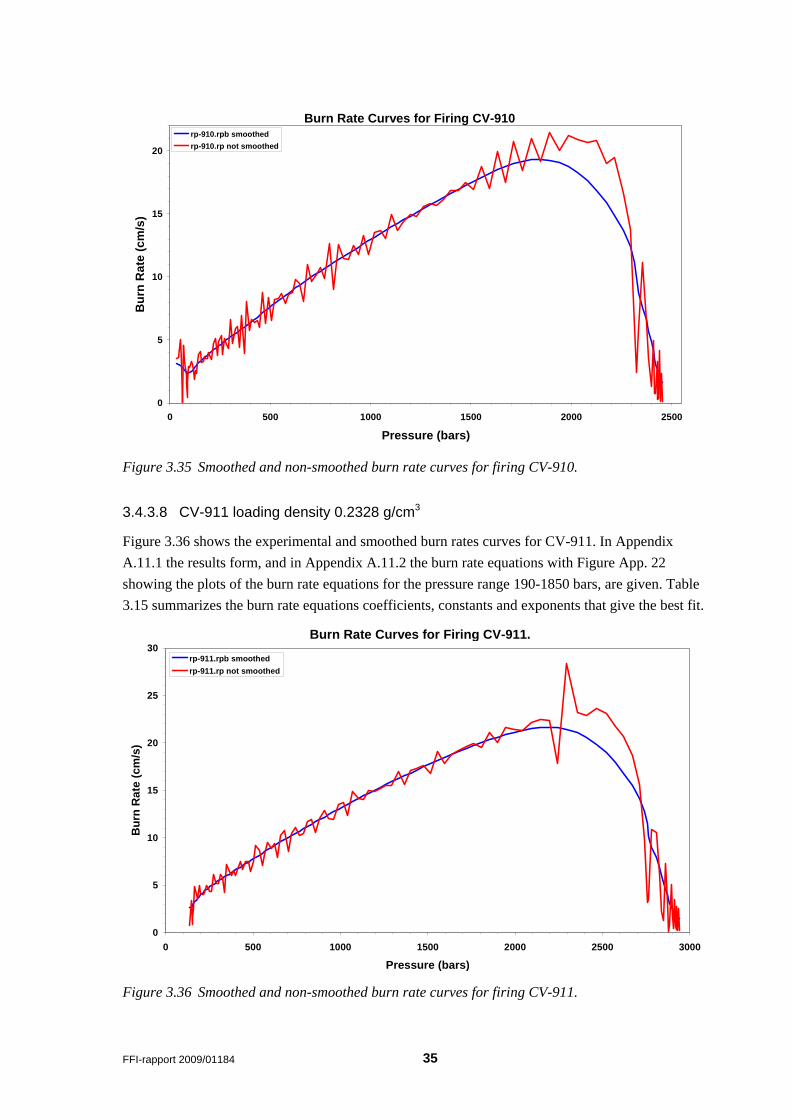
FFI-rapport 2009/01184 35
Burn Rate Curves for Firing CV-910
0
5
10
15
20
0 500 1000 1500 2000 2500
Pressure (bars)
Bur
n R
ate
(cm
/s)
rp-910.rpb smoothedrp-910.rp not smoothed
Figure 3.35 Smoothed and non-smoothed burn rate curves for firing CV-910.
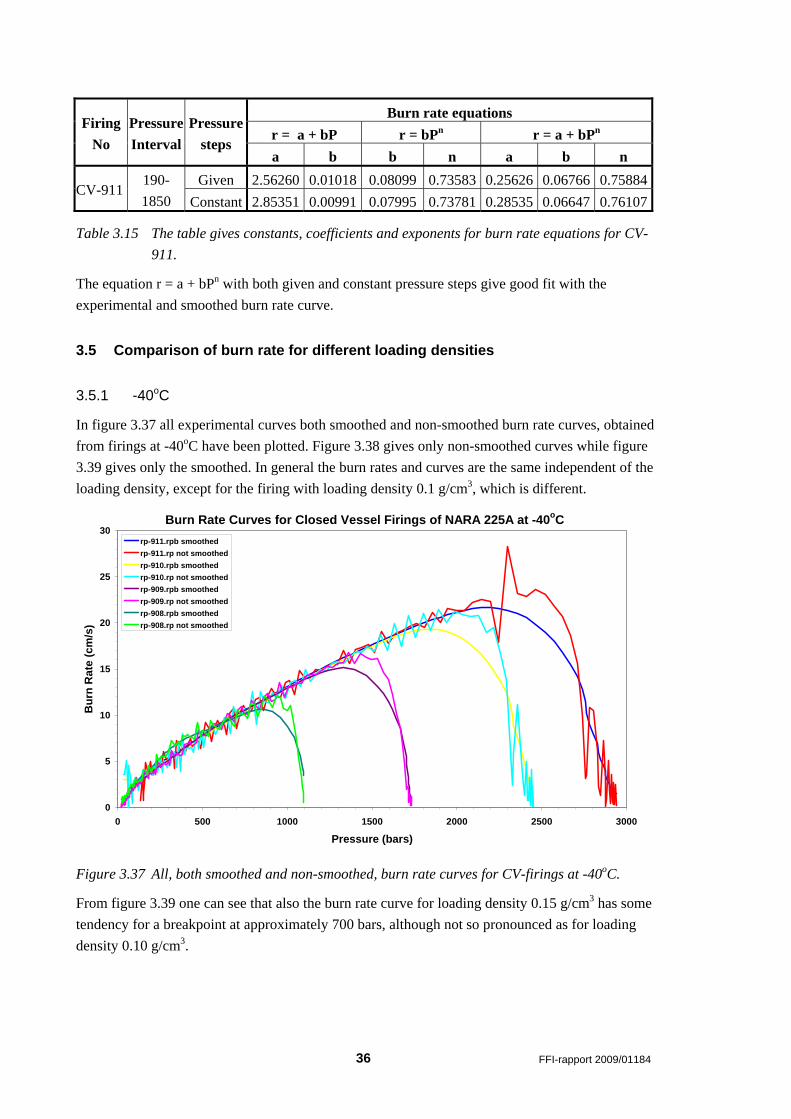
3.4.3.8 CV-911 loading density 0.2328 g/cm3
Figure 3.36 shows the experimental and smoothed burn rates curves for CV-911. In Appendix A.11.1 the results form, and in Appendix A.11.2 the burn rate equations with Figure App. 22 showing the plots of the burn rate equations for the pressure range 190-1850 bars, are given. Table 3.15 summarizes the burn rate equations coefficients, constants and exponents that give the best fit.
Burn Rate Curves for Firing CV-911.
0
5
10
15
20
25
30
0 500 1000 1500 2000 2500 3000
Pressure (bars)
Bur
n R
ate
(cm
/s)
rp-911.rpb smoothedrp-911.rp not smoothed
Figure 3.36 Smoothed and non-smoothed burn rate curves for firing CV-911.
36 FFI-rapport 2009/01184
Burn rate equations r = a + bP r = bPn r = a + bPn
Firing No
Pressure Interval
Pressuresteps
a b b n a b n Given 2.56260 0.01018 0.08099 0.73583 0.25626 0.06766 0.75884
CV-911 190-1850 Constant 2.85351 0.00991 0.07995 0.73781 0.28535 0.06647 0.76107
Table 3.15 The table gives constants, coefficients and exponents for burn rate equations for CV-911.
The equation r = a + bPn with both given and constant pressure steps give good fit with the experimental and smoothed burn rate curve.
3.5 Comparison of burn rate for different loading densities
3.5.1 -40oC
In figure 3.37 all experimental curves both smoothed and non-smoothed burn rate curves, obtained from firings at -40oC have been plotted. Figure 3.38 gives only non-smoothed curves while figure 3.39 gives only the smoothed. In general the burn rates and curves are the same independent of the loading density, except for the firing with loading density 0.1 g/cm3, which is different.
Burn Rate Curves for Closed Vessel Firings of NARA 225A at -40oC
0
5
10
15
20
25
30
0 500 1000 1500 2000 2500 3000
Pressure (bars)
Bur
n R
ate
(cm
/s)
rp-911.rpb smoothedrp-911.rp not smoothedrp-910.rpb smoothedrp-910.rp not smoothedrp-909.rpb smoothedrp-909.rp not smoothedrp-908.rpb smoothedrp-908.rp not smoothed
Figure 3.37 All, both smoothed and non-smoothed, burn rate curves for CV-firings at -40oC.
From figure 3.39 one can see that also the burn rate curve for loading density 0.15 g/cm3 has some tendency for a breakpoint at approximately 700 bars, although not so pronounced as for loading density 0.10 g/cm3.
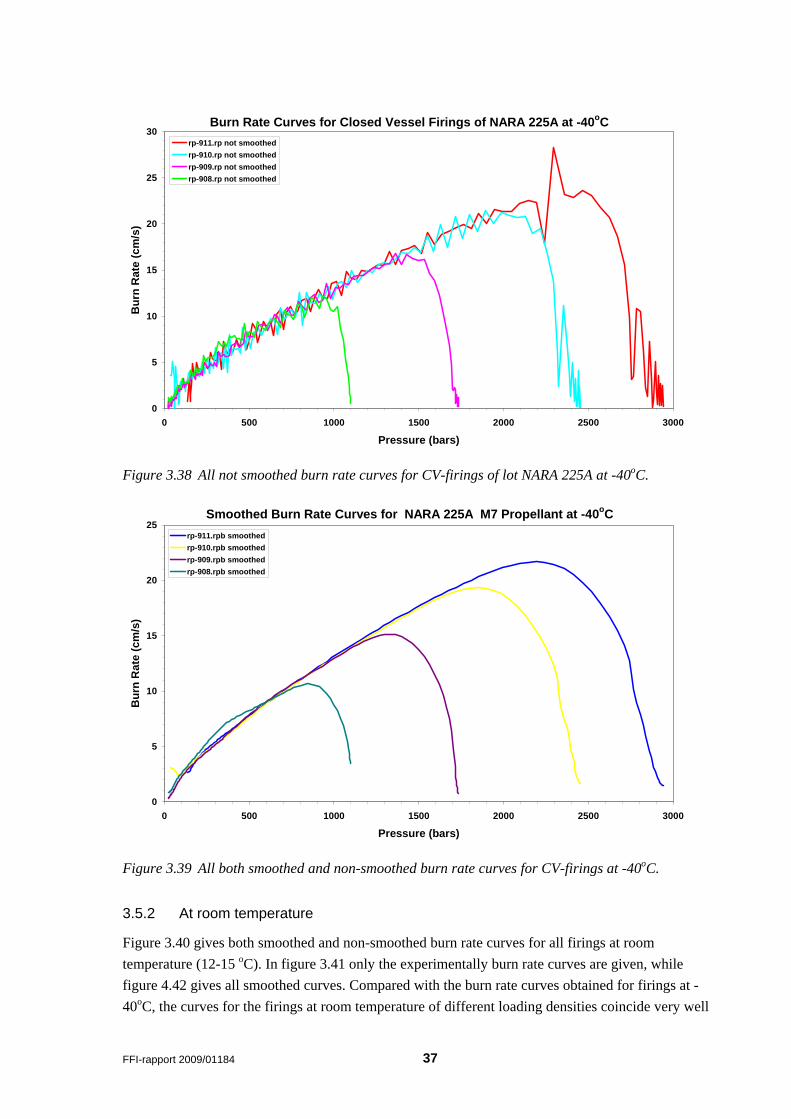
FFI-rapport 2009/01184 37
Burn Rate Curves for Closed Vessel Firings of NARA 225A at -40oC
0
5
10
15
20
25
30
0 500 1000 1500 2000 2500 3000
Pressure (bars)
Bur
n R
ate
(cm
/s)
rp-911.rp not smoothedrp-910.rp not smoothedrp-909.rp not smoothedrp-908.rp not smoothed
Figure 3.38 All not smoothed burn rate curves for CV-firings of lot NARA 225A at -40oC.
Smoothed Burn Rate Curves for NARA 225A M7 Propellant at -40oC
0
5
10
15
20
25
0 500 1000 1500 2000 2500 3000
Pressure (bars)
Bur
n R
ate
(cm
/s)
rp-911.rpb smoothedrp-910.rpb smoothedrp-909.rpb smoothedrp-908.rpb smoothed
Figure 3.39 All both smoothed and non-smoothed burn rate curves for CV-firings at -40oC.
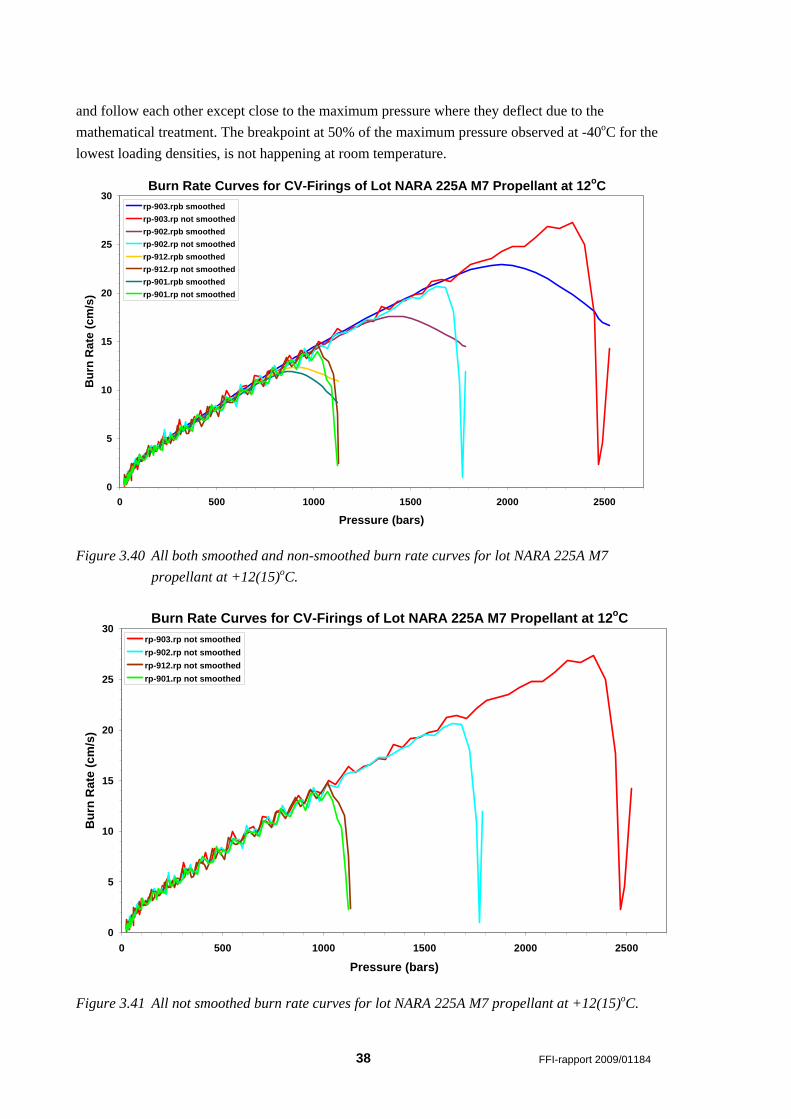
3.5.2 At room temperature
Figure 3.40 gives both smoothed and non-smoothed burn rate curves for all firings at room temperature (12-15 oC). In figure 3.41 only the experimentally burn rate curves are given, while figure 4.42 gives all smoothed curves. Compared with the burn rate curves obtained for firings at -40oC, the curves for the firings at room temperature of different loading densities coincide very well
38 FFI-rapport 2009/01184
and follow each other except close to the maximum pressure where they deflect due to the mathematical treatment. The breakpoint at 50% of the maximum pressure observed at -40oC for the lowest loading densities, is not happening at room temperature.
Burn Rate Curves for CV-Firings of Lot NARA 225A M7 Propellant at 12oC
0
5
10
15
20
25
30
0 500 1000 1500 2000 2500
Pressure (bars)
Bur
n R
ate
(cm
/s)
rp-903.rpb smoothedrp-903.rp not smoothedrp-902.rpb smoothedrp-902.rp not smoothedrp-912.rpb smoothedrp-912.rp not smoothedrp-901.rpb smoothedrp-901.rp not smoothed
Figure 3.40 All both smoothed and non-smoothed burn rate curves for lot NARA 225A M7 propellant at +12(15)oC.
Burn Rate Curves for CV-Firings of Lot NARA 225A M7 Propellant at 12oC
0
5
10
15
20
25
30
0 500 1000 1500 2000 2500
Pressure (bars)
Bur
n R
ate
(cm
/s)
rp-903.rp not smoothedrp-902.rp not smoothedrp-912.rp not smoothedrp-901.rp not smoothed
Figure 3.41 All not smoothed burn rate curves for lot NARA 225A M7 propellant at +12(15)oC.
FFI-rapport 2009/01184 39
Burn Rate Curves for CV-Firings of Lot NARA 225A M7 Propellant at 12oC
0
5
10
15
20
25
0 500 1000 1500 2000 2500
Pressure (bars)
Bur
n R
ate
(cm
/s)
rp-903.rpb smoothedrp-902.rpb smoothedrp-912.rpb smoothedrp-901.rpb smoothed
Figure 3.42 All smoothed burn rate curves for lot NARA 225A M7 propellant at +12(15) oC.
3.5.3 +60oC
Figure 3.43 gives both smoothed and non-smoothed burn rate curves for all firings at +60oC. In figure 3.44 only the experimental burn rate curves are given, while figure 4.45 gives all smoothed curves.
Burn Rate Curves for CV-Firings of NARA 225A M7 Propellant at +60oC .
0
5
10
15
20
25
30
35
40
0 500 1000 1500 2000 2500 3000
Pressure (bars)
Bur
n R
ate
(cm
/s)
rp-904.rp not smoothedrp-904.rpb smoothedrp-905.rp not smoothedrp-905.rpb smoothedrp-906.rp not smoothedrp-906.rpb smoothedrp-907.rp not smoothedrp-907.rpb smoothed
Figure 3.43 The figure shows both smoothed and non-smoothed burn rate curves for lot NARA 225A M7 propellant at +60oC.
40 FFI-rapport 2009/01184
Compared with the burn rate curves obtained for firings at -40oC the curves for the firings at +60oC with different loading densities coincide very well and follow each other except close to the maximum pressure where they deflect due to the mathematical treatment and differences in burn area due to dissymmetry. The breakpoint at 50% of the maximum pressure observed at -40oC for the lowest loading densities is not happening at +60oC.
Burn Rate Curves for CV-Firings of NARA 225A M7 Propellant at +60oC .
0
5
10
15
20
25
30
35
40
0 500 1000 1500 2000 2500 3000
Pressure (bars)
Bur
n R
ate
(cm
/s)
rp-904.rp not smoothedrp-905.rp not smoothedrp-906.rp not smoothedrp-907.rp not smoothed
Figure 3.44 Not smoothed burn rate curves for lot NARA 225A M7 propellant at +60oC.
Burn Rate Curves for CV-Firings of NARA 225A M7 Propellant at +60oC .
0
5
10
15
20
25
30
35
0 500 1000 1500 2000 2500 3000
Pressure (bars)
Bur
n R
ate
(cm
/s)
rp-904.rpb smoothedrp-905.rpb smoothedrp-906.rpb smoothedrp-907.rpb smoothed
Figure 3.45 The figure shows smoothed burn rate curves for lot NARA 225A M7 propellant at
+60oC.
FFI-rapport 2009/01184 41
3.6 Different temperature at same loading density
3.6.1 Load density 0.1 g/cm3
In figure 3.46 smoothed burn rate curves of loading density 0.1 g/cm3 have been plotted from all three test temperatures. The figure shows that there are significant differences in the burn rate due to the temperature difference. In addition the figure shows that burn rate curves for the two firings performed at room temperature are equal, and as earlier indicated the burn rate curve obtained at -40oC has a different form and an extra breakpoint.
Burn Rate Curves of NARA 225A M7 Propellant at Different Temperatures.
0
2
4
6
8
10
12
14
16
0 200 400 600 800 1000 1200
Pressure (bars)
Bur
n R
ate
(cm
/s)
rp-901.rpb smoothedrp-904.rpb smoothedrp-908.rpb smoothedrp-912.rpb smoothed
- 40oC
+60oC
Figure 3.46 Smoothed burn rate curves for loading density 0.1 g/cm3 tested at different temperatures.
3.6.2 Load density 0.15 g/cm3
In figure 3.47 smoothed burn rate curves of loading density 0.15 g/cm3 have been plotted for all three test temperatures. The figure shows that there are significant differences in the burn rate due to the temperature difference.
42 FFI-rapport 2009/01184
Burn Rate Curves of NARA 225A M7 Propellant at Different Temperatures.
0
5
10
15
20
0 300 600 900 1200 1500 1800
Pressure (bars)
Bur
n R
ate
(cm
/s)
rp-902.rpb smoothed
rp-905.rpb smoothedrp-909.rpb smoothed
+60oC
- 40oC
Figure 3.47 Smoothed burn rate curves for loading density 0.15 g/cm3 tested at different temperatures
3.6.3 Load density 0.2 g/cm3
In figure 3.48 smoothed burn rate curves of loading density 0.1 g/cm3 have been plotted from all three test temperatures. The figure shows that there are significant differences in the burn rate due to the difference in test temperature.
Burn Rate Curves of NARA 225A M7 Propellant at Different Temperatures.
0
5
10
15
20
25
0 500 1000 1500 2000 2500
Pressure (bars)
Bur
n R
ate
(cm
/s)
rp-903.rpb smoothed
rp-906.rpb smoothed
rp-910.rpb smoothed
- 40oC
+60oC
Figure 3.48 Smoothed burn rate curves for loading density 0.2 g/cm3 tested at different
temperatures.
FFI-rapport 2009/01184 43
3.6.4 Load density 0.23 g/cm3
In figure 3.49 smoothed burn rate curves of loading density 0.23 g/cm3 have been plotted for two test temperatures. The figure shows that there are significant differences in the burn rate due to the different test temperature.
Burn Rate Curves of NARA 225A M7 Propellant at Different Temperatures.
0
5
10
15
20
25
30
35
0 500 1000 1500 2000 2500 3000
Pressure (bars)
Bur
n R
ate
(cm
/s)
rp-907.rpb smoothed
rp-911.rpb smoothed +60oC
- 40oC
Figure 3.49 Smoothed burn rate curves for loading density 0.23 g/cm3 tested at different temperatures
44 FFI-rapport 2009/01184
Appendix A Results forms from and calculations of burning rate equations
A.1 CV-901
A.1.1 Results form ********************************************************
****************** CLOSED VESSEL TEST ****************** ******************************************************** Firing identity................= mo-901.asc Firing date....................= 09.02.09 Test temperature...............= 12 oC Propellant type................= NARA 225A Loading density................= 0.1001 g/cm3 Primer........................ = 1 g Black powder ---------------------------------------------------- Propellant density.............= 1.659 g/cm3 Covolume.......................= 1.050 cm3/g ---------------------------------------------------- Propellant geometry............= Single-Perf Outer diameter.................= 0.5920 cm Inner diameter.................= 0.4070 cm Length.........................= 4.0090 cm ---------------------------------------------------- Calibration factor.............= 500.00 Sampling time..................= 1 μs Averaging time.................= 80 μs ---------------------------------------------------- Pressure-time-file.............= pt-901.pt Burn rate file.................= rp-901.rp Dynamic vivacity file..........= dl-901.dl Dynamic vivacity file.(dlp)....= dlp-901.dl ---------------------------------------------------- Pmax...........................= 1134 bar ---------------------------------------------------- p(bar) r(cm/s) | Z dl(1/(bar*s)) --------------------------|------------------------- 200 4.17 | 0.1 0.5256 300 5.51 | 0.2 0.4418 400 6.82 | 0.3 0.3881 500 8.07 | 0.4 0.3601 600 9.31 | 0.5 0.3436 700 10.51 | 0.6 0.3325 800 11.53 | 0.7 0.3223 900 11.87 | 0.8 0.2997 **********************************************************
FFI-rapport 2009/01184 45
A.1.2 Calculations of burn rate equations Give file name....... > rp-901.rpb Choose pressure ranger between Pmin and Pmax Pmin= 21 Pmax= 1122 Give start pressure.................. > 34 Give stop pressure.................. > 90 The result is now written on the file omr.dat ********************************************************************************* By given pressure interval are after the equation r= a+b*p a= -0.33405930 b= 0.03227048 By given pressure interval are after r= b*p**n b= 0.00859274 n= 1.27470700 By given pressure interval are after r= a+b*p**n a= -1.53667300 b= 0.26187340 n= 0.60888110 With constant pressure interval is after the equation r= a+b*p a= -0.30595990 b= 0.03190645 By constant pressure interval is after r= b*p**n b= 0.00978550 n= 1.24352500 By constant pressure interval is after r= a+b*p**n a= -1.89695200 b= 0.37842900 n= 0.54567590 Result files a1.dat, a2.dat, n1.dat, n2.dat, abc.dat and abc2.dat *********************************************************************************
Burn Rate Curves for CV-901 of NARA 225A Propellant in the Pressure range 34-90
0.5
1
1.5
2
2.5
20 30 40 50 60 70 80 90 100Pressure (bars)
Bur
n R
ate
(cm
/s)
rp-901.rpb a1.data2.dat abc.databc2.dat n1.datn2.dat
Best fit for equation abc2 followed by abc
Figure App. 1 Plot of different burn rate equations together with the smoothed burn rate curve for pressure range 34-90 bars for CV-901.
Give file name....... > rp-901.rpb Choose pressure ranger between Pmin and Pmax Pmin= 21 Pmax= 1122 Give start pressure.................. > 90 Give stop pressure.................. > 750
46 FFI-rapport 2009/01184
The result is now written on the file omr.dat ********************************************************************************* By given pressure interval are after the equation r= a+b*p a= 1.54805900 b= 0.01295971 By given pressure interval are after r= b*p**n b= 0.10067970 n= 0.70536210 By given pressure interval are after r= a+b*p**n a= 0.77402950 b= 0.04055494 n= 0.83567640 With constant pressure interval is after the equation r= a+b*p a= 1.61162300 b= 0.01281864 By constant pressure interval is after r= b*p**n b= 0.09470630 n= 0.71589680 By constant pressure interval is after r= a+b*p**n a= 0.96697390 b= 0.03101851 n= 0.87445400 Result files a1.dat, a2.dat, n1.dat, n2.dat, abc.dat and abc2.dat *********************************************************************************
Burn Rate Curves for CV-901 of NARA 225A Propellant in the Pressure range 90-750
0.5
3.5
6.5
9.5
12.5
20 120 220 320 420 520 620 720Pressure (bars)
Bur
n R
ate
(cm
/s)
rp-901.rpb a1L.data2L.dat abcL.databc2L.dat n1L.datn2L.dat a1.data2.dat abc.databc2.dat n1.datn2.dat
Best fit for equation abcL2 followed by abcL (34-90 Best fit for equation abc2 followed by abc (90-750
Figure App. 2 Plot of different burn rate equations together with the smoothed burn rate curve for pressure range 90-750 bars for CV-901.
FFI-rapport 2009/01184 47
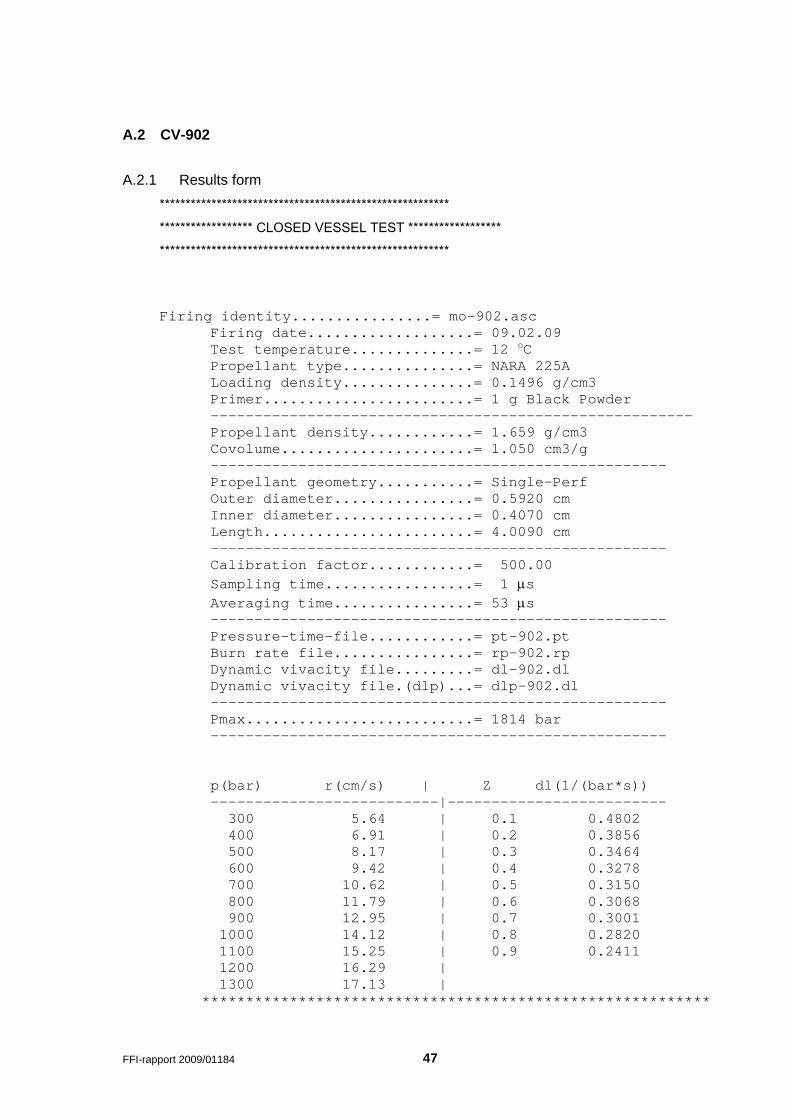
A.2 CV-902
A.2.1 Results form ******************************************************** ****************** CLOSED VESSEL TEST ****************** ******************************************************** Firing identity................= mo-902.asc Firing date...................= 09.02.09 Test temperature..............= 12 oC Propellant type...............= NARA 225A Loading density...............= 0.1496 g/cm3 Primer........................= 1 g Black Powder ------------------------------------------------------- Propellant density............= 1.659 g/cm3 Covolume......................= 1.050 cm3/g ---------------------------------------------------- Propellant geometry...........= Single-Perf Outer diameter................= 0.5920 cm Inner diameter................= 0.4070 cm Length........................= 4.0090 cm ---------------------------------------------------- Calibration factor............= 500.00 Sampling time.................= 1 μs Averaging time................= 53 μs ---------------------------------------------------- Pressure-time-file............= pt-902.pt Burn rate file................= rp-902.rp Dynamic vivacity file.........= dl-902.dl Dynamic vivacity file.(dlp)...= dlp-902.dl ---------------------------------------------------- Pmax..........................= 1814 bar ---------------------------------------------------- p(bar) r(cm/s) | Z dl(1/(bar*s)) --------------------------|------------------------- 300 5.64 | 0.1 0.4802 400 6.91 | 0.2 0.3856 500 8.17 | 0.3 0.3464 600 9.42 | 0.4 0.3278 700 10.62 | 0.5 0.3150 800 11.79 | 0.6 0.3068 900 12.95 | 0.7 0.3001 1000 14.12 | 0.8 0.2820 1100 15.25 | 0.9 0.2411 1200 16.29 | 1300 17.13 | **********************************************************
48 FFI-rapport 2009/01184
A.2.2 Calculations of burn rate equations Give file name....... > rp-902.rpb Choose pressure ranger between Pmin and Pmax Pmin= 21 Pmax= 1785 Give start pressure.................. > 29 Give stop pressure.................. > 86 The result is now written on the file omr.dat ******************************************************************************** By given pressure interval are after the equation r= a+b*p a= -0.26569060 b= 0.03498589 By given pressure interval are after r= b*p**n b= 0.01181931 n= 1.23228700 By given pressure interval are after r= a+b*p**n a= -1.19560800 b= 0.20998260 n= 0.65375920 With constant pressure interval is after the equation r= a+b*p a= -0.23362560 b= 0.03451477 By constant pressure interval is after r= b*p**n b= 0.01363701 n= 1.19694600 By constant pressure interval is after r= a+b*p**n a= -1.37839100 b= 0.26259210 n= 0.61367830 Result files a1.dat, a2.dat, n1.dat, n2.dat, abc.dat and abc2.dat ********************************************************************************
Burn Rate Curves for Firing CV-902 in the Pressure Range 29-86 bars
0.5
0.9
1.3
1.7
2.1
2.5
20 30 40 50 60 70 80 90Pressure (bars)
Bur
n R
ate
(m/s
)
rp-902.rpb smoothed a1L.data2L.dat abcL.databc2L.dat n1L.datn2L.dat
Best fit for equation abc2L.dat followed by abcL.dat
Figure App. 3 Plot of different burn rate equations together with the smoothed burn rate curve for pressure range 28-86 bars for CV-902
Give file name....... > rp-902.rpb Choose pressure ranger between Pmin and Pmax Pmin= 21 Pmax= 1785 Give start pressure.................. > 86 Give stop pressure.................. > 1240
FFI-rapport 2009/01184 49
The result is now written on the file omr.dat ********************************************************** By given pressure interval are after the equation r= a+b*p a= 1.89686400 b= 0.01226576 By given pressure interval are after r= b*p**n b= 0.10613770 n= 0.70319840 By given pressure interval are after r= a+b*p**n a= 1.13811900 b= 0.03123611 n= 0.87237000 With constant pressure interval is after the equation r= a+b*p a= 2.01882000 b= 0.01209336 By constant pressure interval is after r= b*p**n b= 0.09388565 n= 0.72325800 By constant pressure interval is after r= a+b*p**n a= 1.21129200 b= 0.02860669 n= 0.88448980 Result files a1.dat, a2.dat, n1.dat, n2.dat, abc.dat and abc2.dat
Burn Rate Curves for Firing CV-902 in the Pressure Range 86-1240 bars
0
3
6
9
12
15
18
0 200 400 600 800 1000 1200Pressure (bars)
Bur
n R
ate
(m/s
)
rp-902.rpb smoothed a1L.data2L.dat abcL.databc2L.dat n1L.datn2L.dat a1.data2.dat abc.databc2.dat n2.datn1.dat
Best fit for curve abc2L.dat followed by abcL.dat (29-86 bars)Pressure range 86-1240 bars best fit for curves abc2.dat and abc.dat
Figure App. 4 Plot of different burn rate equations together with the smoothed burn rate curve for CV-902.
50 FFI-rapport 2009/01184
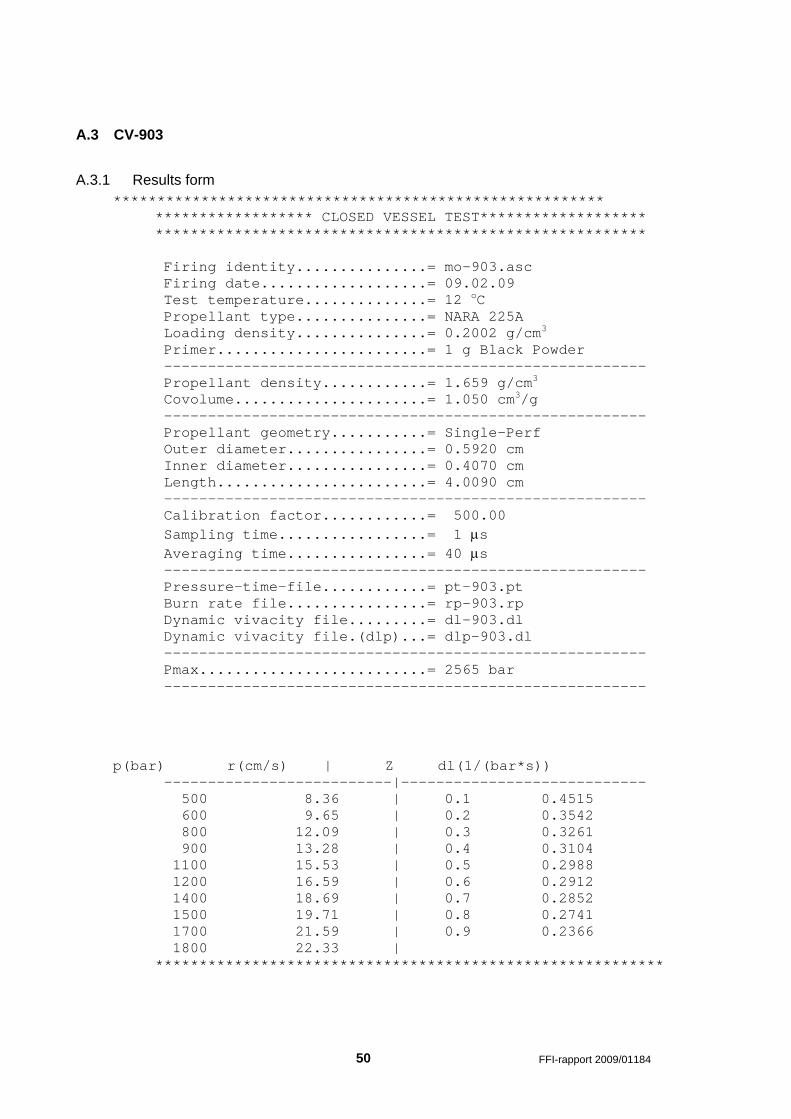
A.3 CV-903
A.3.1 Results form ******************************************************** ****************** CLOSED VESSEL TEST******************* ******************************************************** Firing identity...............= mo-903.asc Firing date...................= 09.02.09 Test temperature..............= 12 oC Propellant type...............= NARA 225A Loading density...............= 0.2002 g/cm3 Primer........................= 1 g Black Powder ------------------------------------------------------- Propellant density............= 1.659 g/cm3 Covolume......................= 1.050 cm3/g ------------------------------------------------------- Propellant geometry...........= Single-Perf Outer diameter................= 0.5920 cm Inner diameter................= 0.4070 cm Length........................= 4.0090 cm ------------------------------------------------------- Calibration factor............= 500.00 Sampling time.................= 1 μs Averaging time................= 40 μs ------------------------------------------------------- Pressure-time-file............= pt-903.pt Burn rate file................= rp-903.rp Dynamic vivacity file.........= dl-903.dl Dynamic vivacity file.(dlp)...= dlp-903.dl ------------------------------------------------------- Pmax..........................= 2565 bar ------------------------------------------------------- p(bar) r(cm/s) | Z dl(1/(bar*s)) --------------------------|---------------------------- 500 8.36 | 0.1 0.4515 600 9.65 | 0.2 0.3542 800 12.09 | 0.3 0.3261 900 13.28 | 0.4 0.3104 1100 15.53 | 0.5 0.2988 1200 16.59 | 0.6 0.2912 1400 18.69 | 0.7 0.2852 1500 19.71 | 0.8 0.2741 1700 21.59 | 0.9 0.2366 1800 22.33 | **********************************************************
FFI-rapport 2009/01184 51
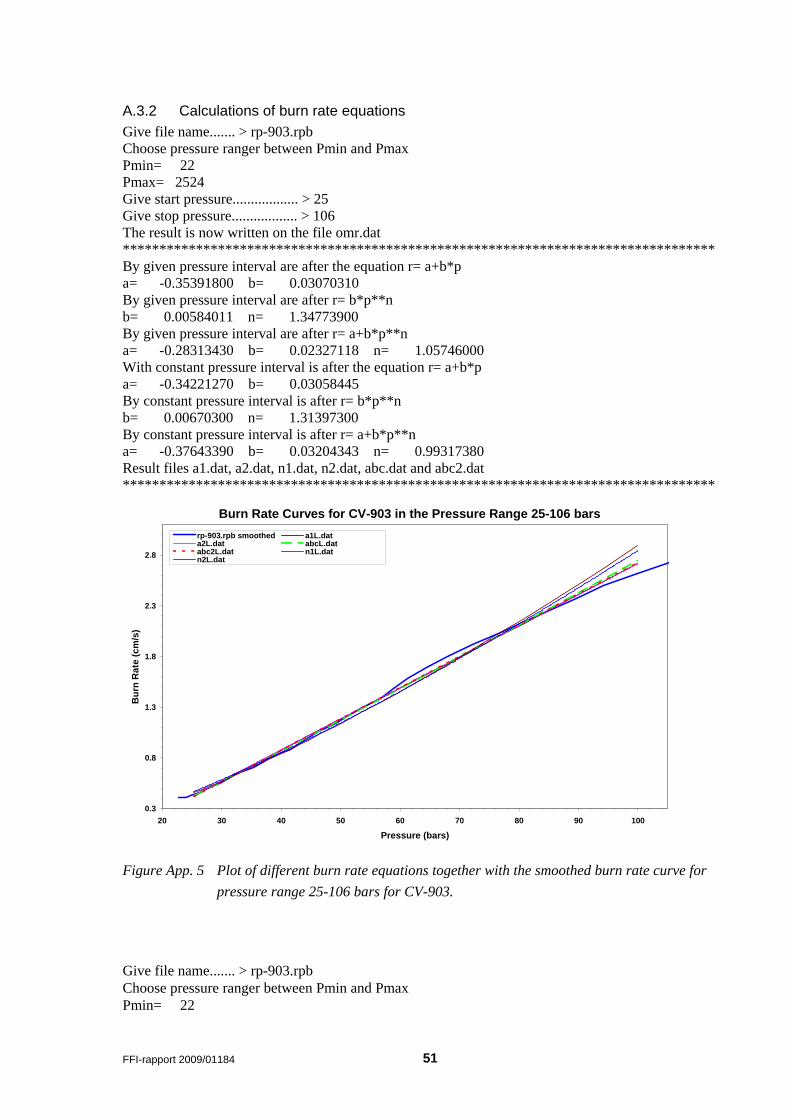
A.3.2 Calculations of burn rate equations Give file name....... > rp-903.rpb Choose pressure ranger between Pmin and Pmax Pmin= 22 Pmax= 2524 Give start pressure.................. > 25 Give stop pressure.................. > 106 The result is now written on the file omr.dat ********************************************************************************* By given pressure interval are after the equation r= a+b*p a= -0.35391800 b= 0.03070310 By given pressure interval are after r= b*p**n b= 0.00584011 n= 1.34773900 By given pressure interval are after r= a+b*p**n a= -0.28313430 b= 0.02327118 n= 1.05746000 With constant pressure interval is after the equation r= a+b*p a= -0.34221270 b= 0.03058445 By constant pressure interval is after r= b*p**n b= 0.00670300 n= 1.31397300 By constant pressure interval is after r= a+b*p**n a= -0.37643390 b= 0.03204343 n= 0.99317380 Result files a1.dat, a2.dat, n1.dat, n2.dat, abc.dat and abc2.dat *********************************************************************************
Burn Rate Curves for CV-903 in the Pressure Range 25-106 bars
0.3
0.8
1.3
1.8
2.3
2.8
20 30 40 50 60 70 80 90 100
Pressure (bars)
Bur
n R
ate
(cm
/s)
rp-903.rpb smoothed a1L.data2L.dat abcL.databc2L.dat n1L.datn2L.dat
Figure App. 5 Plot of different burn rate equations together with the smoothed burn rate curve for pressure range 25-106 bars for CV-903.
Give file name....... > rp-903.rpb Choose pressure ranger between Pmin and Pmax Pmin= 22
52 FFI-rapport 2009/01184
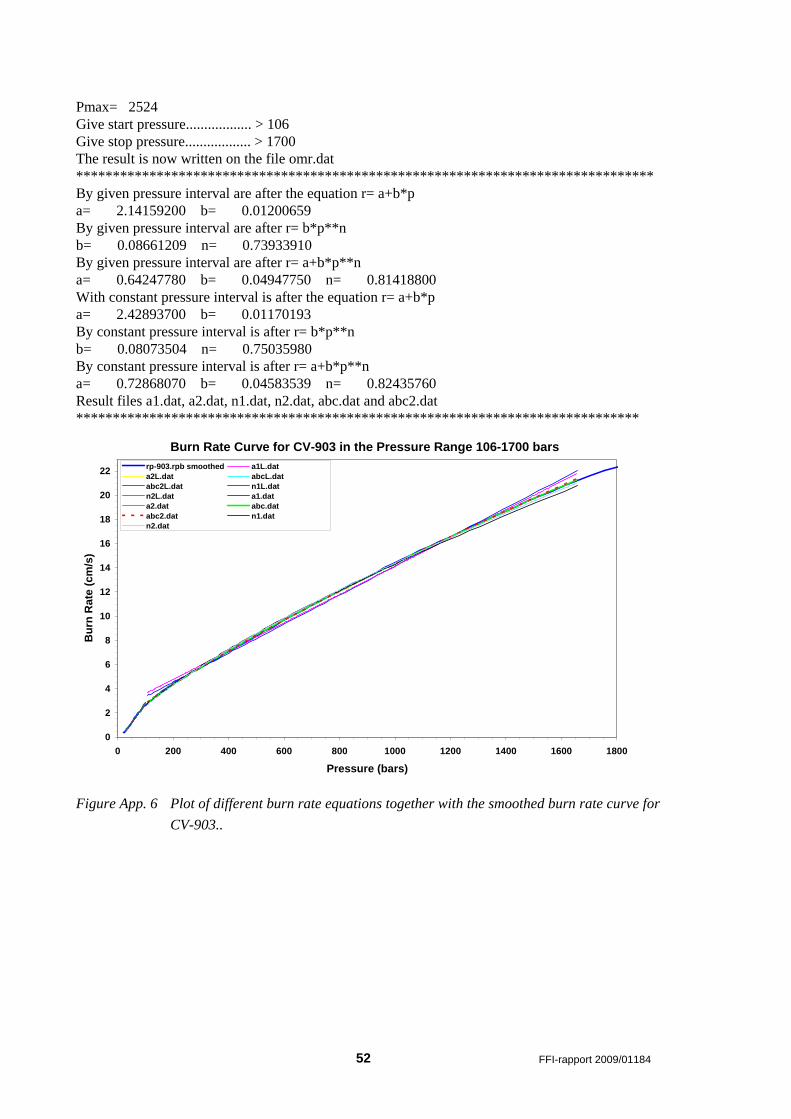
Pmax= 2524 Give start pressure.................. > 106 Give stop pressure.................. > 1700 The result is now written on the file omr.dat ******************************************************************************* By given pressure interval are after the equation r= a+b*p a= 2.14159200 b= 0.01200659 By given pressure interval are after r= b*p**n b= 0.08661209 n= 0.73933910 By given pressure interval are after r= a+b*p**n a= 0.64247780 b= 0.04947750 n= 0.81418800 With constant pressure interval is after the equation r= a+b*p a= 2.42893700 b= 0.01170193 By constant pressure interval is after r= b*p**n b= 0.08073504 n= 0.75035980 By constant pressure interval is after r= a+b*p**n a= 0.72868070 b= 0.04583539 n= 0.82435760 Result files a1.dat, a2.dat, n1.dat, n2.dat, abc.dat and abc2.dat *****************************************************************************
Burn Rate Curve for CV-903 in the Pressure Range 106-1700 bars
0
2
4
6
8
10
12
14
16
18
20
22
0 200 400 600 800 1000 1200 1400 1600 1800
Pressure (bars)
Bur
n R
ate
(cm
/s)
rp-903.rpb smoothed a1L.data2L.dat abcL.databc2L.dat n1L.datn2L.dat a1.data2.dat abc.databc2.dat n1.datn2.dat
Figure App. 6 Plot of different burn rate equations together with the smoothed burn rate curve for CV-903..
FFI-rapport 2009/01184 53
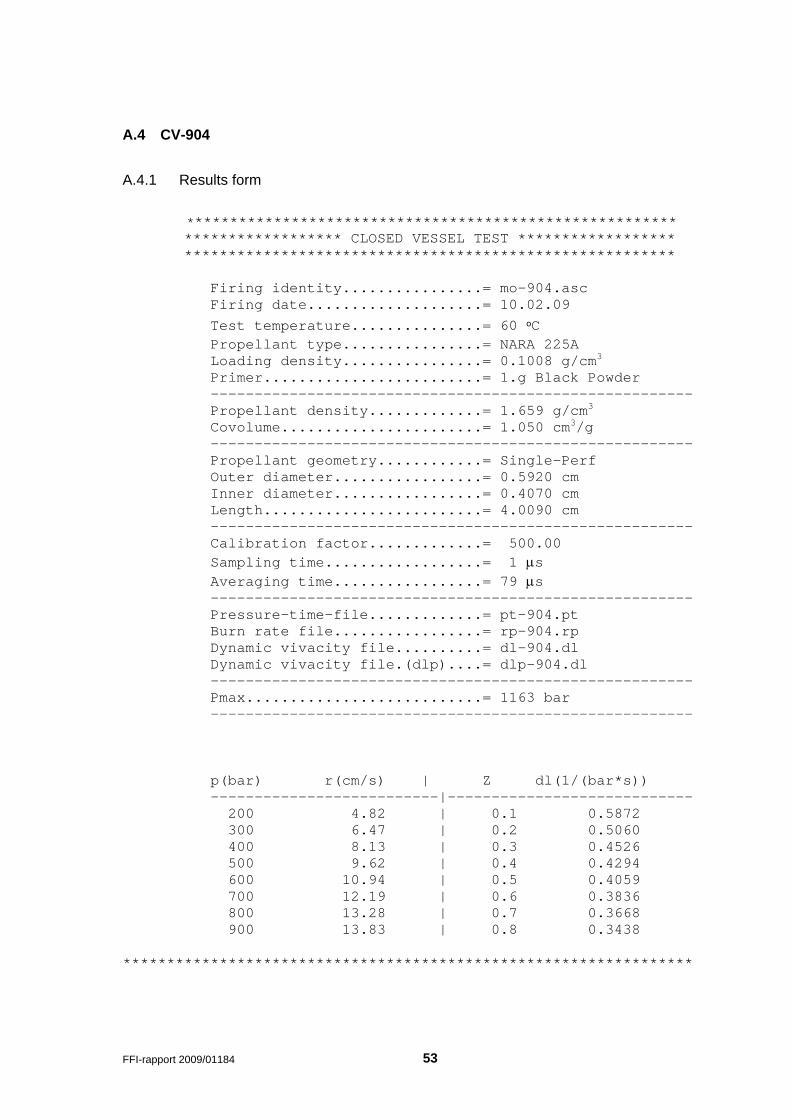
A.4 CV-904
A.4.1 Results form
******************************************************** ****************** CLOSED VESSEL TEST ****************** ******************************************************** Firing identity................= mo-904.asc Firing date....................= 10.02.09 Test temperature...............= 60 oC Propellant type................= NARA 225A Loading density................= 0.1008 g/cm3 Primer.........................= 1.g Black Powder ------------------------------------------------------- Propellant density.............= 1.659 g/cm3 Covolume.......................= 1.050 cm3/g ------------------------------------------------------- Propellant geometry............= Single-Perf Outer diameter.................= 0.5920 cm Inner diameter.................= 0.4070 cm Length.........................= 4.0090 cm ------------------------------------------------------- Calibration factor.............= 500.00 Sampling time..................= 1 μs Averaging time.................= 79 μs ------------------------------------------------------- Pressure-time-file.............= pt-904.pt Burn rate file.................= rp-904.rp Dynamic vivacity file..........= dl-904.dl Dynamic vivacity file.(dlp)....= dlp-904.dl ------------------------------------------------------- Pmax...........................= 1163 bar ------------------------------------------------------- p(bar) r(cm/s) | Z dl(1/(bar*s)) --------------------------|---------------------------- 200 4.82 | 0.1 0.5872 300 6.47 | 0.2 0.5060 400 8.13 | 0.3 0.4526 500 9.62 | 0.4 0.4294 600 10.94 | 0.5 0.4059 700 12.19 | 0.6 0.3836 800 13.28 | 0.7 0.3668 900 13.83 | 0.8 0.3438 *****************************************************************
54 FFI-rapport 2009/01184
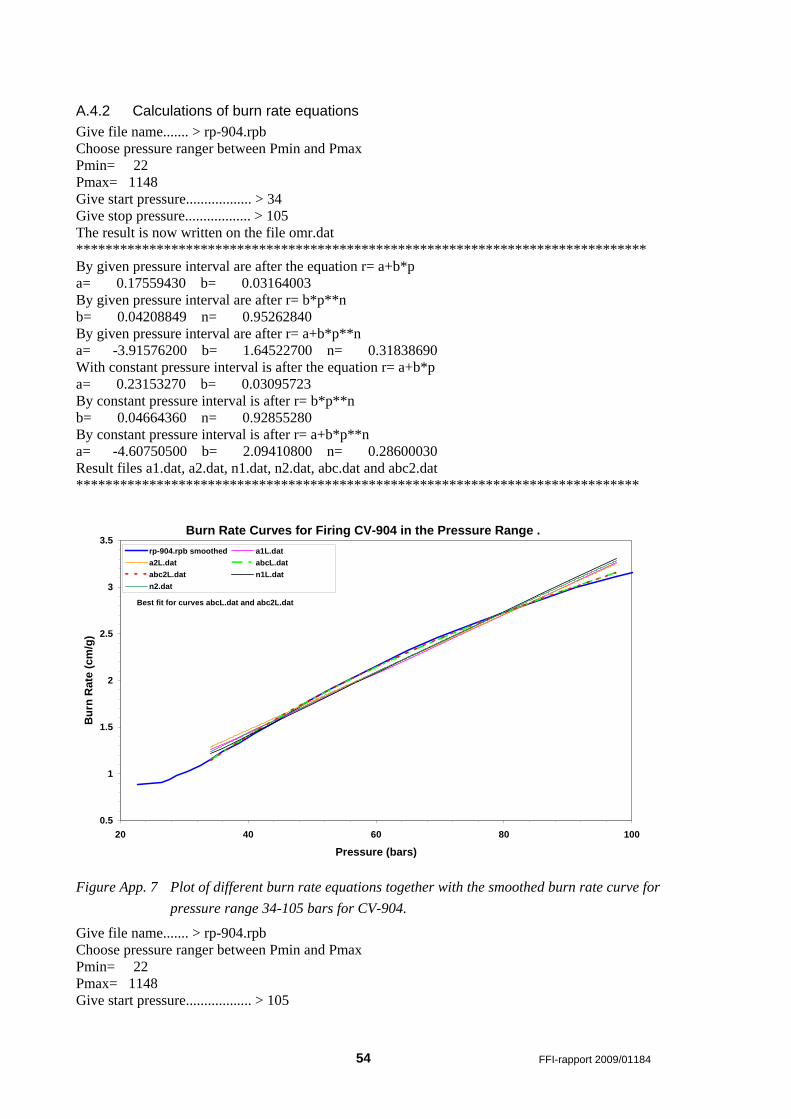
A.4.2 Calculations of burn rate equations Give file name....... > rp-904.rpb Choose pressure ranger between Pmin and Pmax Pmin= 22 Pmax= 1148 Give start pressure.................. > 34 Give stop pressure.................. > 105 The result is now written on the file omr.dat ****************************************************************************** By given pressure interval are after the equation r= a+b*p a= 0.17559430 b= 0.03164003 By given pressure interval are after r= b*p**n b= 0.04208849 n= 0.95262840 By given pressure interval are after r= a+b*p**n a= -3.91576200 b= 1.64522700 n= 0.31838690 With constant pressure interval is after the equation r= a+b*p a= 0.23153270 b= 0.03095723 By constant pressure interval is after r= b*p**n b= 0.04664360 n= 0.92855280 By constant pressure interval is after r= a+b*p**n a= -4.60750500 b= 2.09410800 n= 0.28600030 Result files a1.dat, a2.dat, n1.dat, n2.dat, abc.dat and abc2.dat *****************************************************************************
Burn Rate Curves for Firing CV-904 in the Pressure Range .
0.5
1
1.5
2
2.5
3
3.5
20 40 60 80 100
Pressure (bars)
Bur
n R
ate
(cm
/g)
rp-904.rpb smoothed a1L.data2L.dat abcL.databc2L.dat n1L.datn2.dat
Best fit for curves abcL.dat and abc2L.dat
Figure App. 7 Plot of different burn rate equations together with the smoothed burn rate curve for pressure range 34-105 bars for CV-904.
Give file name....... > rp-904.rpb Choose pressure ranger between Pmin and Pmax Pmin= 22 Pmax= 1148 Give start pressure.................. > 105
FFI-rapport 2009/01184 55
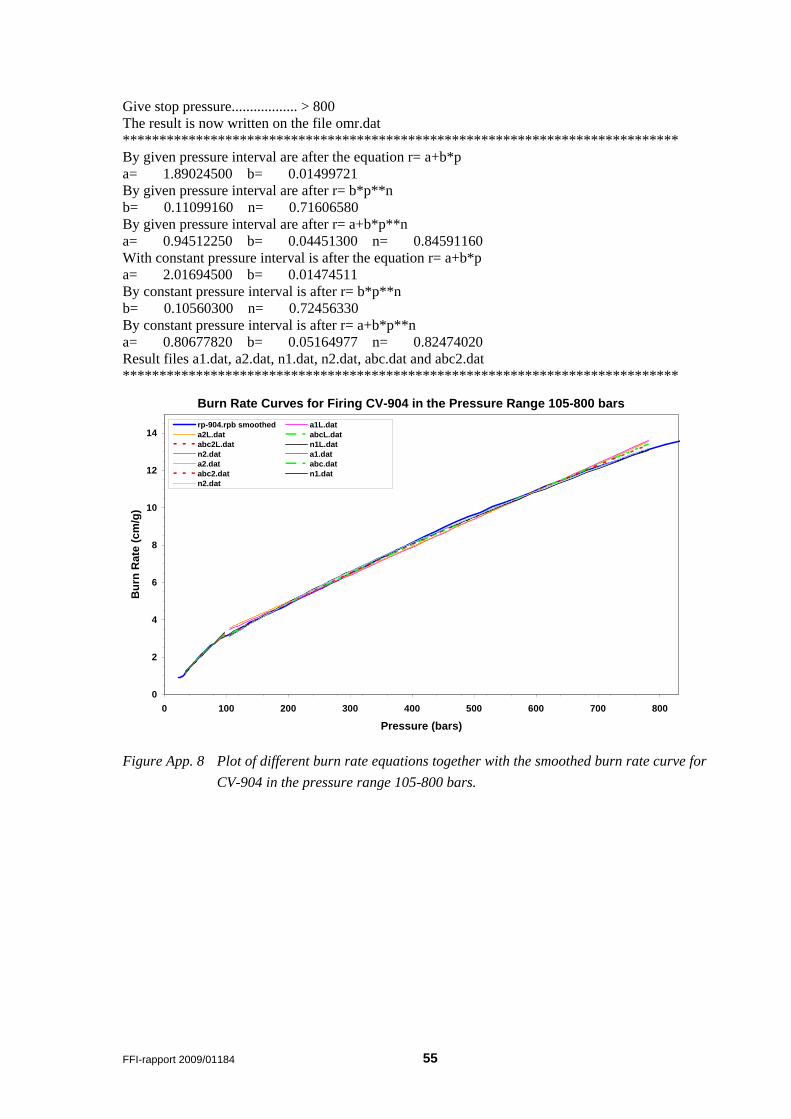
Give stop pressure.................. > 800 The result is now written on the file omr.dat **************************************************************************** By given pressure interval are after the equation r= a+b*p a= 1.89024500 b= 0.01499721 By given pressure interval are after r= b*p**n b= 0.11099160 n= 0.71606580 By given pressure interval are after r= a+b*p**n a= 0.94512250 b= 0.04451300 n= 0.84591160 With constant pressure interval is after the equation r= a+b*p a= 2.01694500 b= 0.01474511 By constant pressure interval is after r= b*p**n b= 0.10560300 n= 0.72456330 By constant pressure interval is after r= a+b*p**n a= 0.80677820 b= 0.05164977 n= 0.82474020 Result files a1.dat, a2.dat, n1.dat, n2.dat, abc.dat and abc2.dat ****************************************************************************
Burn Rate Curves for Firing CV-904 in the Pressure Range 105-800 bars
0
2
4
6
8
10
12
14
0 100 200 300 400 500 600 700 800
Pressure (bars)
Bur
n R
ate
(cm
/g)
rp-904.rpb smoothed a1L.data2L.dat abcL.databc2L.dat n1L.datn2.dat a1.data2.dat abc.databc2.dat n1.datn2.dat
Figure App. 8 Plot of different burn rate equations together with the smoothed burn rate curve for CV-904 in the pressure range 105-800 bars.
56 FFI-rapport 2009/01184
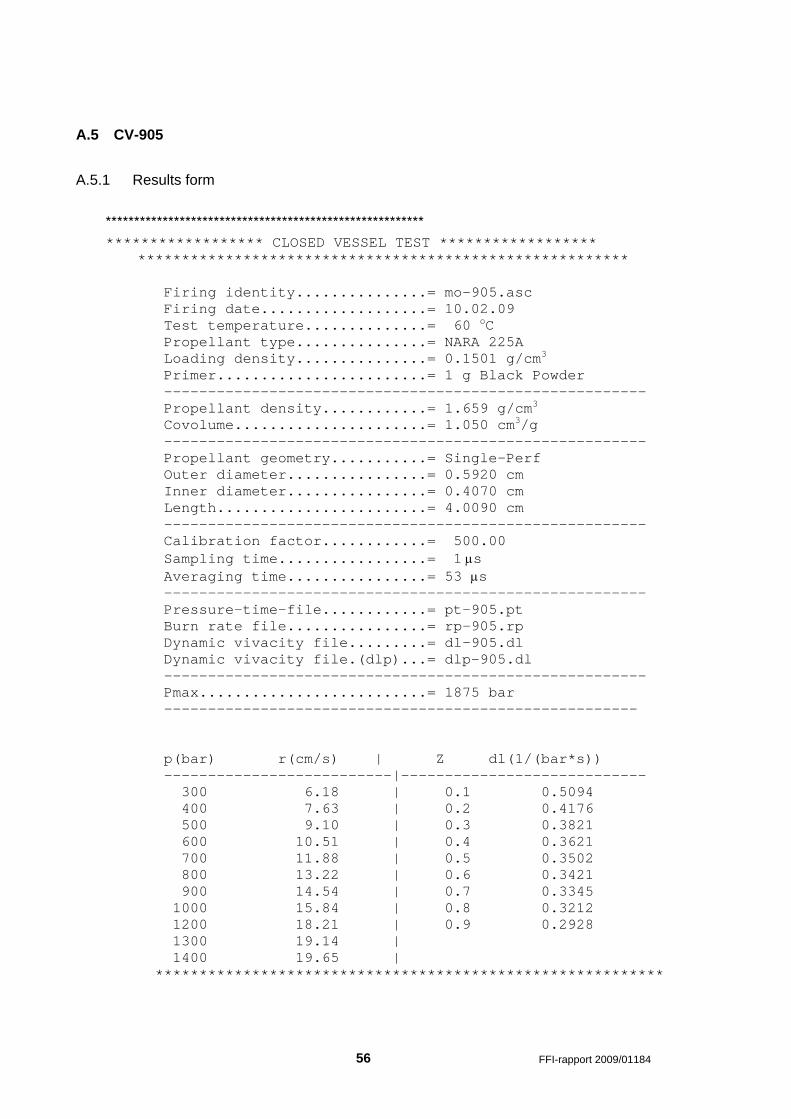
A.5 CV-905
A.5.1 Results form ******************************************************** ****************** CLOSED VESSEL TEST ****************** ******************************************************** Firing identity...............= mo-905.asc Firing date...................= 10.02.09 Test temperature..............= 60 oC Propellant type...............= NARA 225A Loading density...............= 0.1501 g/cm3 Primer........................= 1 g Black Powder ------------------------------------------------------- Propellant density............= 1.659 g/cm3 Covolume......................= 1.050 cm3/g ------------------------------------------------------- Propellant geometry...........= Single-Perf Outer diameter................= 0.5920 cm Inner diameter................= 0.4070 cm Length........................= 4.0090 cm ------------------------------------------------------- Calibration factor............= 500.00 Sampling time.................= 1 μs Averaging time................= 53 μs ------------------------------------------------------- Pressure-time-file............= pt-905.pt Burn rate file................= rp-905.rp Dynamic vivacity file.........= dl-905.dl Dynamic vivacity file.(dlp)...= dlp-905.dl ------------------------------------------------------- Pmax..........................= 1875 bar ------------------------------------------------------ p(bar) r(cm/s) | Z dl(1/(bar*s)) --------------------------|---------------------------- 300 6.18 | 0.1 0.5094 400 7.63 | 0.2 0.4176 500 9.10 | 0.3 0.3821 600 10.51 | 0.4 0.3621 700 11.88 | 0.5 0.3502 800 13.22 | 0.6 0.3421 900 14.54 | 0.7 0.3345 1000 15.84 | 0.8 0.3212 1200 18.21 | 0.9 0.2928 1300 19.14 | 1400 19.65 | **********************************************************
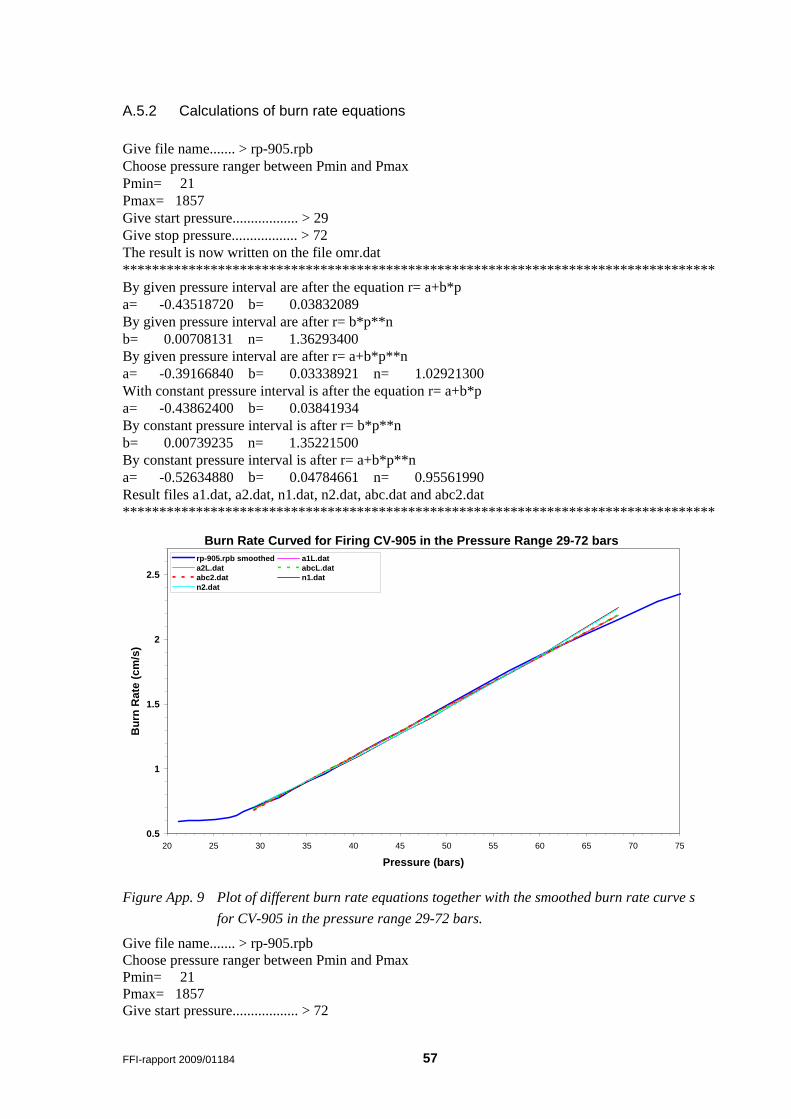
FFI-rapport 2009/01184 57
A.5.2 Calculations of burn rate equations Give file name....... > rp-905.rpb Choose pressure ranger between Pmin and Pmax Pmin= 21 Pmax= 1857 Give start pressure.................. > 29 Give stop pressure.................. > 72 The result is now written on the file omr.dat ********************************************************************************* By given pressure interval are after the equation r= a+b*p a= -0.43518720 b= 0.03832089 By given pressure interval are after r= b*p**n b= 0.00708131 n= 1.36293400 By given pressure interval are after r= a+b*p**n a= -0.39166840 b= 0.03338921 n= 1.02921300 With constant pressure interval is after the equation r= a+b*p a= -0.43862400 b= 0.03841934 By constant pressure interval is after r= b*p**n b= 0.00739235 n= 1.35221500 By constant pressure interval is after r= a+b*p**n a= -0.52634880 b= 0.04784661 n= 0.95561990 Result files a1.dat, a2.dat, n1.dat, n2.dat, abc.dat and abc2.dat *********************************************************************************
Burn Rate Curved for Firing CV-905 in the Pressure Range 29-72 bars
0.5
1
1.5
2
2.5
20 25 30 35 40 45 50 55 60 65 70 75
Pressure (bars)
Bur
n R
ate
(cm
/s)
rp-905.rpb smoothed a1L.data2L.dat abcL.databc2.dat n1.datn2.dat
Figure App. 9 Plot of different burn rate equations together with the smoothed burn rate curve s for CV-905 in the pressure range 29-72 bars.
Give file name....... > rp-905.rpb Choose pressure ranger between Pmin and Pmax Pmin= 21 Pmax= 1857 Give start pressure.................. > 72
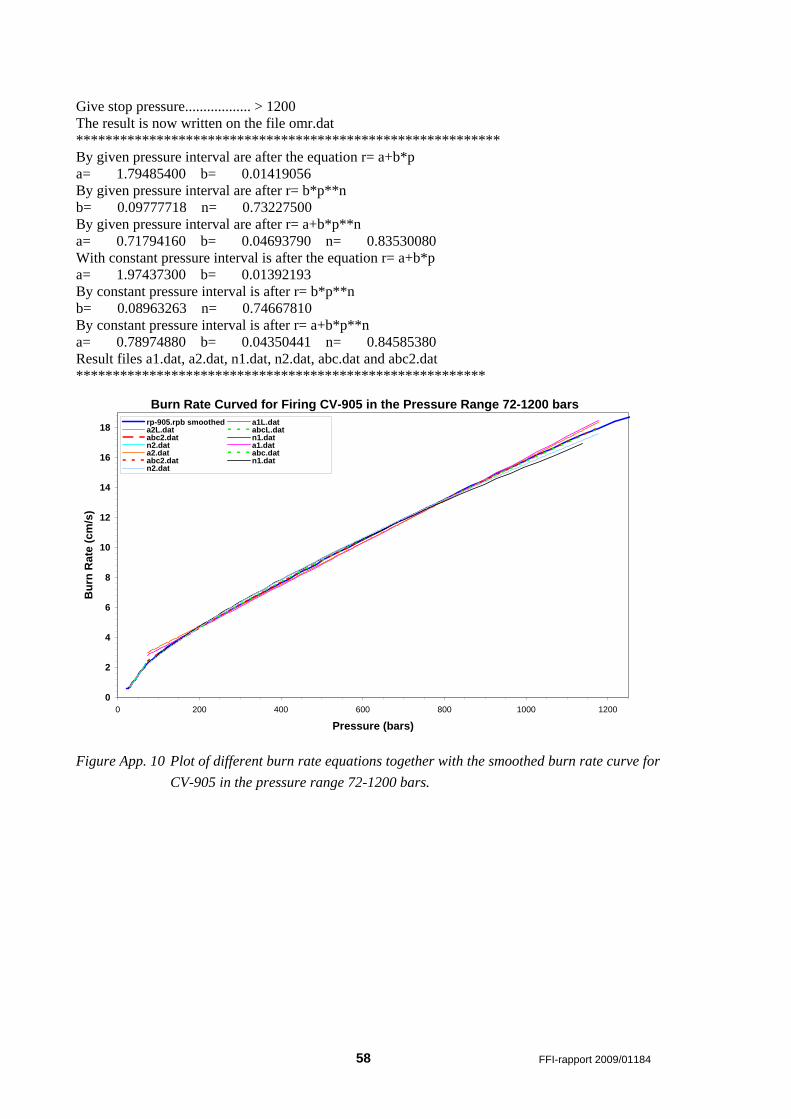
58 FFI-rapport 2009/01184
Give stop pressure.................. > 1200 The result is now written on the file omr.dat ********************************************************** By given pressure interval are after the equation r= a+b*p a= 1.79485400 b= 0.01419056 By given pressure interval are after r= b*p**n b= 0.09777718 n= 0.73227500 By given pressure interval are after r= a+b*p**n a= 0.71794160 b= 0.04693790 n= 0.83530080 With constant pressure interval is after the equation r= a+b*p a= 1.97437300 b= 0.01392193 By constant pressure interval is after r= b*p**n b= 0.08963263 n= 0.74667810 By constant pressure interval is after r= a+b*p**n a= 0.78974880 b= 0.04350441 n= 0.84585380 Result files a1.dat, a2.dat, n1.dat, n2.dat, abc.dat and abc2.dat ********************************************************
Burn Rate Curved for Firing CV-905 in the Pressure Range 72-1200 bars
0
2
4
6
8
10
12
14
16
18
0 200 400 600 800 1000 1200
Pressure (bars)
Bur
n R
ate
(cm
/s)
rp-905.rpb smoothed a1L.data2L.dat abcL.databc2.dat n1.datn2.dat a1.data2.dat abc.databc2.dat n1.datn2.dat
Figure App. 10 Plot of different burn rate equations together with the smoothed burn rate curve for CV-905 in the pressure range 72-1200 bars.
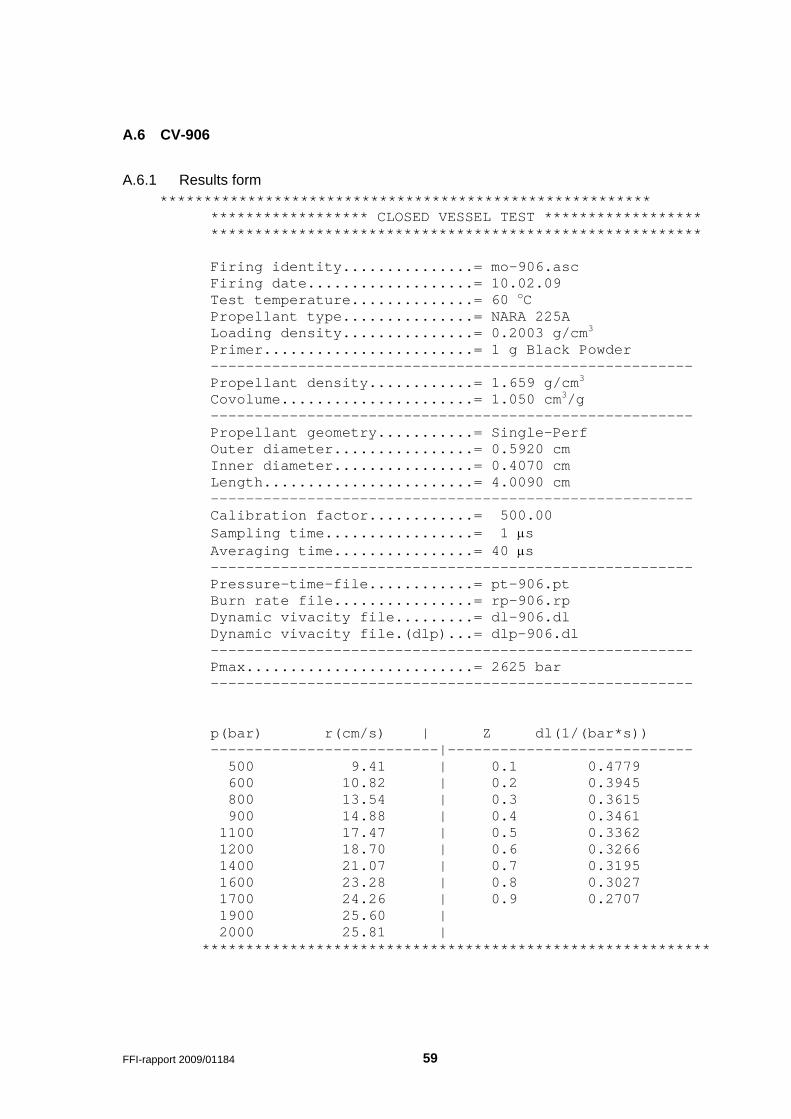
FFI-rapport 2009/01184 59
A.6 CV-906
A.6.1 Results form ******************************************************** ****************** CLOSED VESSEL TEST ****************** ******************************************************** Firing identity...............= mo-906.asc Firing date...................= 10.02.09 Test temperature..............= 60 oC Propellant type...............= NARA 225A Loading density...............= 0.2003 g/cm3 Primer........................= 1 g Black Powder ------------------------------------------------------- Propellant density............= 1.659 g/cm3 Covolume......................= 1.050 cm3/g ------------------------------------------------------- Propellant geometry...........= Single-Perf Outer diameter................= 0.5920 cm Inner diameter................= 0.4070 cm Length........................= 4.0090 cm ------------------------------------------------------- Calibration factor............= 500.00 Sampling time.................= 1 μs Averaging time................= 40 μs ------------------------------------------------------- Pressure-time-file............= pt-906.pt Burn rate file................= rp-906.rp Dynamic vivacity file.........= dl-906.dl Dynamic vivacity file.(dlp)...= dlp-906.dl ------------------------------------------------------- Pmax..........................= 2625 bar ------------------------------------------------------- p(bar) r(cm/s) | Z dl(1/(bar*s)) --------------------------|---------------------------- 500 9.41 | 0.1 0.4779 600 10.82 | 0.2 0.3945 800 13.54 | 0.3 0.3615 900 14.88 | 0.4 0.3461 1100 17.47 | 0.5 0.3362 1200 18.70 | 0.6 0.3266 1400 21.07 | 0.7 0.3195 1600 23.28 | 0.8 0.3027 1700 24.26 | 0.9 0.2707 1900 25.60 | 2000 25.81 | **********************************************************
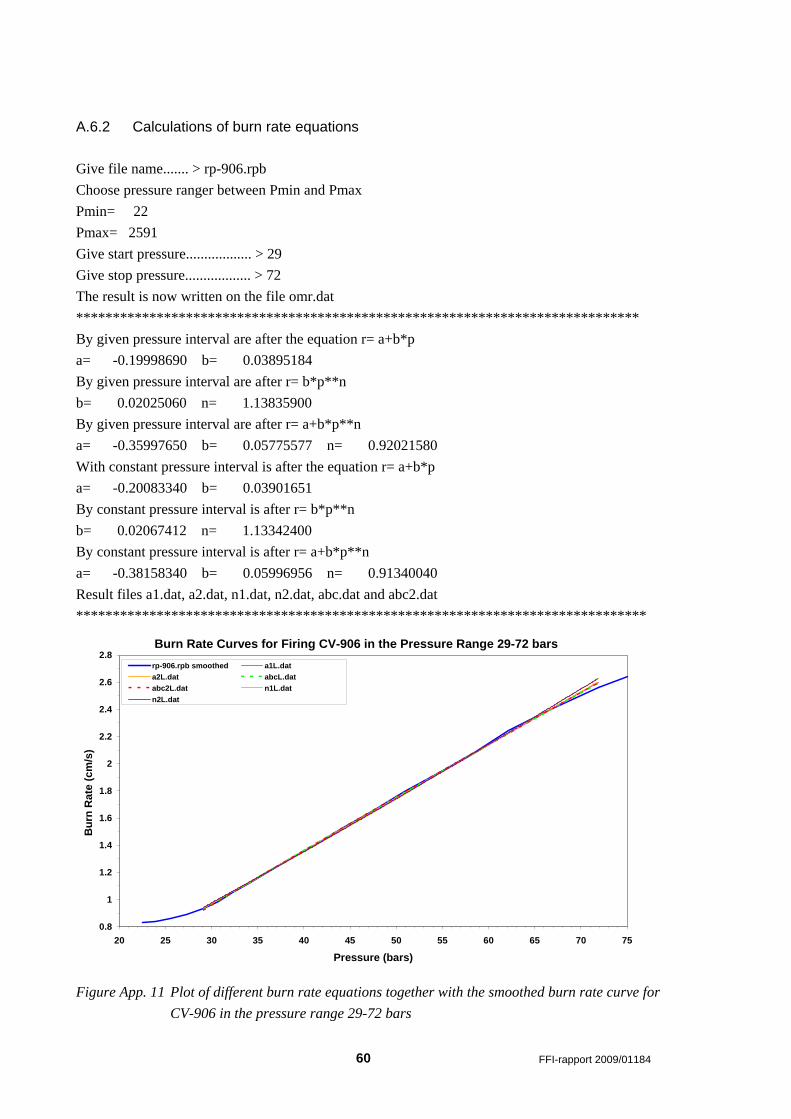
60 FFI-rapport 2009/01184
A.6.2 Calculations of burn rate equations Give file name....... > rp-906.rpb Choose pressure ranger between Pmin and Pmax Pmin= 22 Pmax= 2591 Give start pressure.................. > 29 Give stop pressure.................. > 72 The result is now written on the file omr.dat ***************************************************************************** By given pressure interval are after the equation r= a+b*p a= -0.19998690 b= 0.03895184 By given pressure interval are after r= b*p**n b= 0.02025060 n= 1.13835900 By given pressure interval are after r= a+b*p**n a= -0.35997650 b= 0.05775577 n= 0.92021580 With constant pressure interval is after the equation r= a+b*p a= -0.20083340 b= 0.03901651 By constant pressure interval is after r= b*p**n b= 0.02067412 n= 1.13342400 By constant pressure interval is after r= a+b*p**n a= -0.38158340 b= 0.05996956 n= 0.91340040 Result files a1.dat, a2.dat, n1.dat, n2.dat, abc.dat and abc2.dat ******************************************************************************
Burn Rate Curves for Firing CV-906 in the Pressure Range 29-72 bars
0.8
1
1.2
1.4
1.6
1.8
2
2.2
2.4
2.6
2.8
20 25 30 35 40 45 50 55 60 65 70 75
Pressure (bars)
Bur
n R
ate
(cm
/s)
rp-906.rpb smoothed a1L.data2L.dat abcL.databc2L.dat n1L.datn2L.dat
Figure App. 11 Plot of different burn rate equations together with the smoothed burn rate curve for CV-906 in the pressure range 29-72 bars
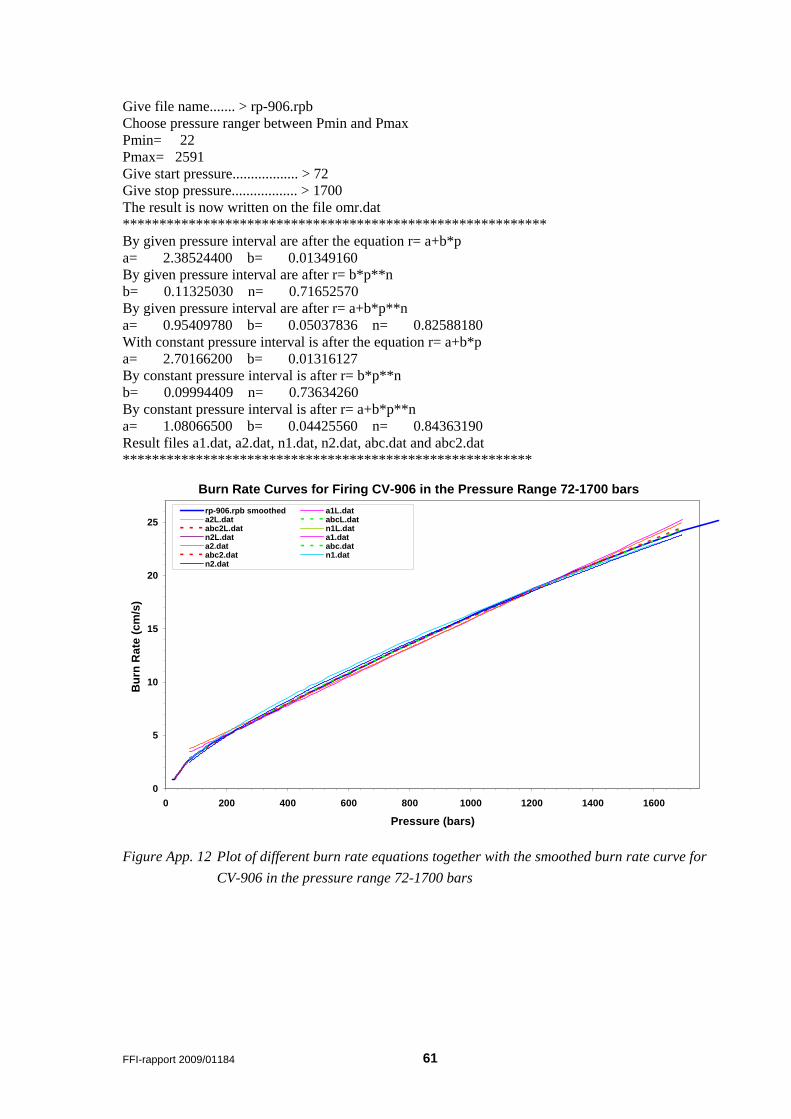
FFI-rapport 2009/01184 61
Give file name....... > rp-906.rpb Choose pressure ranger between Pmin and Pmax Pmin= 22 Pmax= 2591 Give start pressure.................. > 72 Give stop pressure.................. > 1700 The result is now written on the file omr.dat ********************************************************** By given pressure interval are after the equation r= a+b*p a= 2.38524400 b= 0.01349160 By given pressure interval are after r= b*p**n b= 0.11325030 n= 0.71652570 By given pressure interval are after r= a+b*p**n a= 0.95409780 b= 0.05037836 n= 0.82588180 With constant pressure interval is after the equation r= a+b*p a= 2.70166200 b= 0.01316127 By constant pressure interval is after r= b*p**n b= 0.09994409 n= 0.73634260 By constant pressure interval is after r= a+b*p**n a= 1.08066500 b= 0.04425560 n= 0.84363190 Result files a1.dat, a2.dat, n1.dat, n2.dat, abc.dat and abc2.dat ********************************************************
Burn Rate Curves for Firing CV-906 in the Pressure Range 72-1700 bars
0
5
10
15
20
25
0 200 400 600 800 1000 1200 1400 1600
Pressure (bars)
Bur
n R
ate
(cm
/s)
rp-906.rpb smoothed a1L.data2L.dat abcL.databc2L.dat n1L.datn2L.dat a1.data2.dat abc.databc2.dat n1.datn2.dat
Figure App. 12 Plot of different burn rate equations together with the smoothed burn rate curve for CV-906 in the pressure range 72-1700 bars
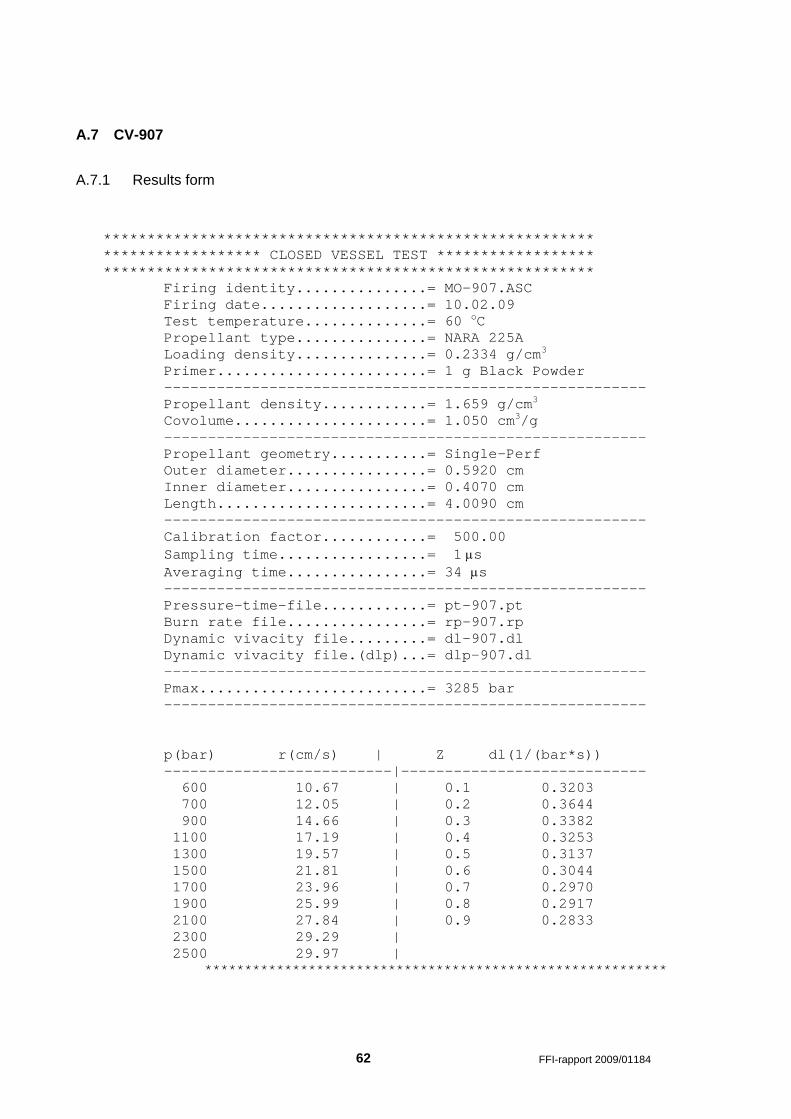
62 FFI-rapport 2009/01184
A.7 CV-907
A.7.1 Results form
******************************************************** ****************** CLOSED VESSEL TEST ****************** ********************************************************
Firing identity...............= MO-907.ASC Firing date...................= 10.02.09 Test temperature..............= 60 oC Propellant type...............= NARA 225A Loading density...............= 0.2334 g/cm3 Primer........................= 1 g Black Powder ------------------------------------------------------- Propellant density............= 1.659 g/cm3 Covolume......................= 1.050 cm3/g ------------------------------------------------------- Propellant geometry...........= Single-Perf Outer diameter................= 0.5920 cm Inner diameter................= 0.4070 cm Length........................= 4.0090 cm ------------------------------------------------------- Calibration factor............= 500.00 Sampling time.................= 1 μs Averaging time................= 34 μs ------------------------------------------------------- Pressure-time-file............= pt-907.pt Burn rate file................= rp-907.rp Dynamic vivacity file.........= dl-907.dl Dynamic vivacity file.(dlp)...= dlp-907.dl ------------------------------------------------------- Pmax..........................= 3285 bar ------------------------------------------------------- p(bar) r(cm/s) | Z dl(1/(bar*s)) --------------------------|---------------------------- 600 10.67 | 0.1 0.3203 700 12.05 | 0.2 0.3644 900 14.66 | 0.3 0.3382 1100 17.19 | 0.4 0.3253 1300 19.57 | 0.5 0.3137 1500 21.81 | 0.6 0.3044 1700 23.96 | 0.7 0.2970 1900 25.99 | 0.8 0.2917 2100 27.84 | 0.9 0.2833 2300 29.29 | 2500 29.97 |
**********************************************************
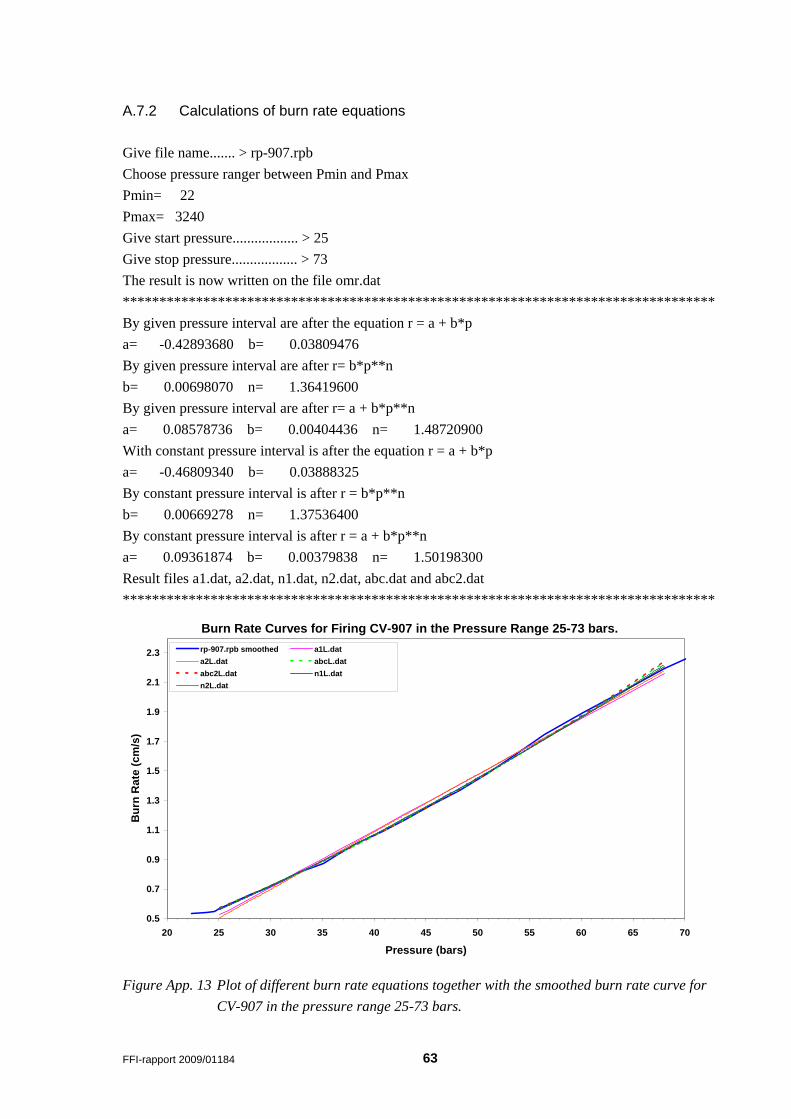
FFI-rapport 2009/01184 63
A.7.2 Calculations of burn rate equations Give file name....... > rp-907.rpb Choose pressure ranger between Pmin and Pmax Pmin= 22 Pmax= 3240 Give start pressure.................. > 25 Give stop pressure.................. > 73 The result is now written on the file omr.dat ********************************************************************************* By given pressure interval are after the equation r = a + b*p a= -0.42893680 b= 0.03809476 By given pressure interval are after r= b*p**n b= 0.00698070 n= 1.36419600 By given pressure interval are after r= a + b*p**n a= 0.08578736 b= 0.00404436 n= 1.48720900 With constant pressure interval is after the equation r = a + b*p a= -0.46809340 b= 0.03888325 By constant pressure interval is after r = b*p**n b= 0.00669278 n= 1.37536400 By constant pressure interval is after r = a + b*p**n a= 0.09361874 b= 0.00379838 n= 1.50198300 Result files a1.dat, a2.dat, n1.dat, n2.dat, abc.dat and abc2.dat *********************************************************************************
Burn Rate Curves for Firing CV-907 in the Pressure Range 25-73 bars.
0.5
0.7
0.9
1.1
1.3
1.5
1.7
1.9
2.1
2.3
20 25 30 35 40 45 50 55 60 65 70
Pressure (bars)
Bur
n R
ate
(cm
/s)
rp-907.rpb smoothed a1L.data2L.dat abcL.databc2L.dat n1L.datn2L.dat
Figure App. 13 Plot of different burn rate equations together with the smoothed burn rate curve for CV-907 in the pressure range 25-73 bars.
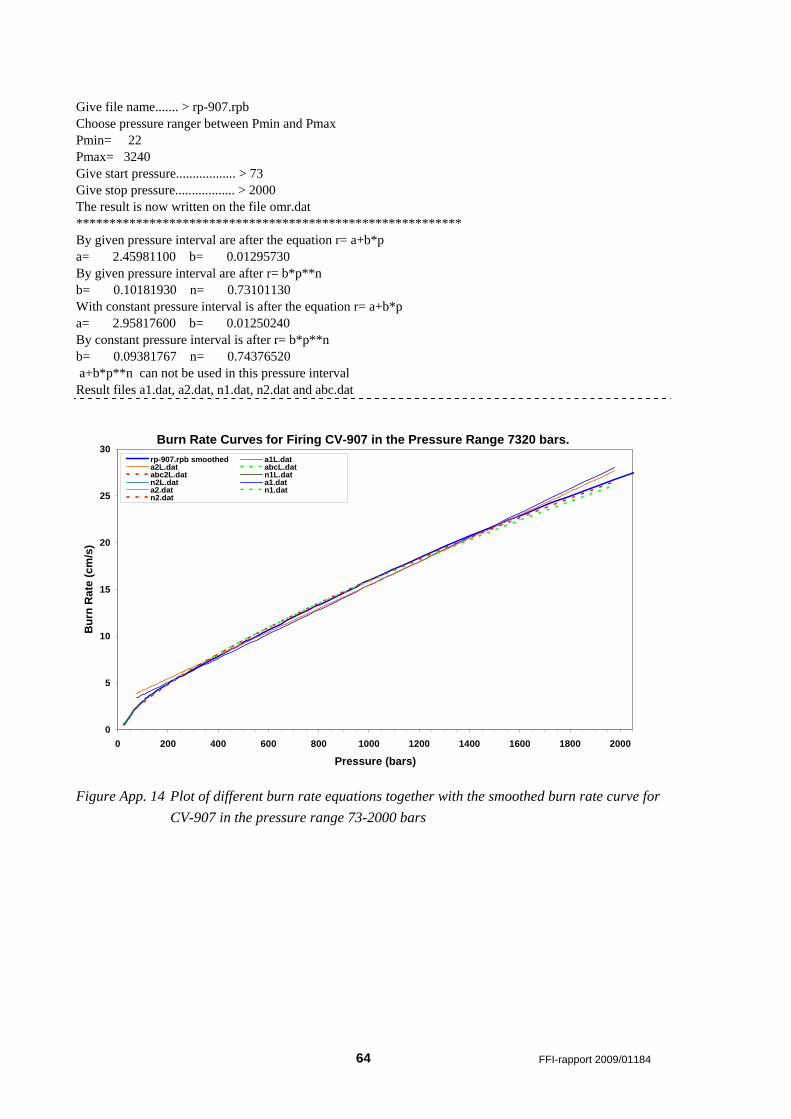
64 FFI-rapport 2009/01184
Give file name....... > rp-907.rpb Choose pressure ranger between Pmin and Pmax Pmin= 22 Pmax= 3240 Give start pressure.................. > 73 Give stop pressure.................. > 2000 The result is now written on the file omr.dat ********************************************************** By given pressure interval are after the equation r= a+b*p a= 2.45981100 b= 0.01295730 By given pressure interval are after r= b*p**n b= 0.10181930 n= 0.73101130 With constant pressure interval is after the equation r= a+b*p a= 2.95817600 b= 0.01250240 By constant pressure interval is after r= b*p**n b= 0.09381767 n= 0.74376520 a+b*p**n can not be used in this pressure interval Result files a1.dat, a2.dat, n1.dat, n2.dat and abc.dat
Burn Rate Curves for Firing CV-907 in the Pressure Range 7320 bars.
0
5
10
15
20
25
30
0 200 400 600 800 1000 1200 1400 1600 1800 2000
Pressure (bars)
Bur
n R
ate
(cm
/s)
rp-907.rpb smoothed a1L.data2L.dat abcL.databc2L.dat n1L.datn2L.dat a1.data2.dat n1.datn2.dat
Figure App. 14 Plot of different burn rate equations together with the smoothed burn rate curve for CV-907 in the pressure range 73-2000 bars
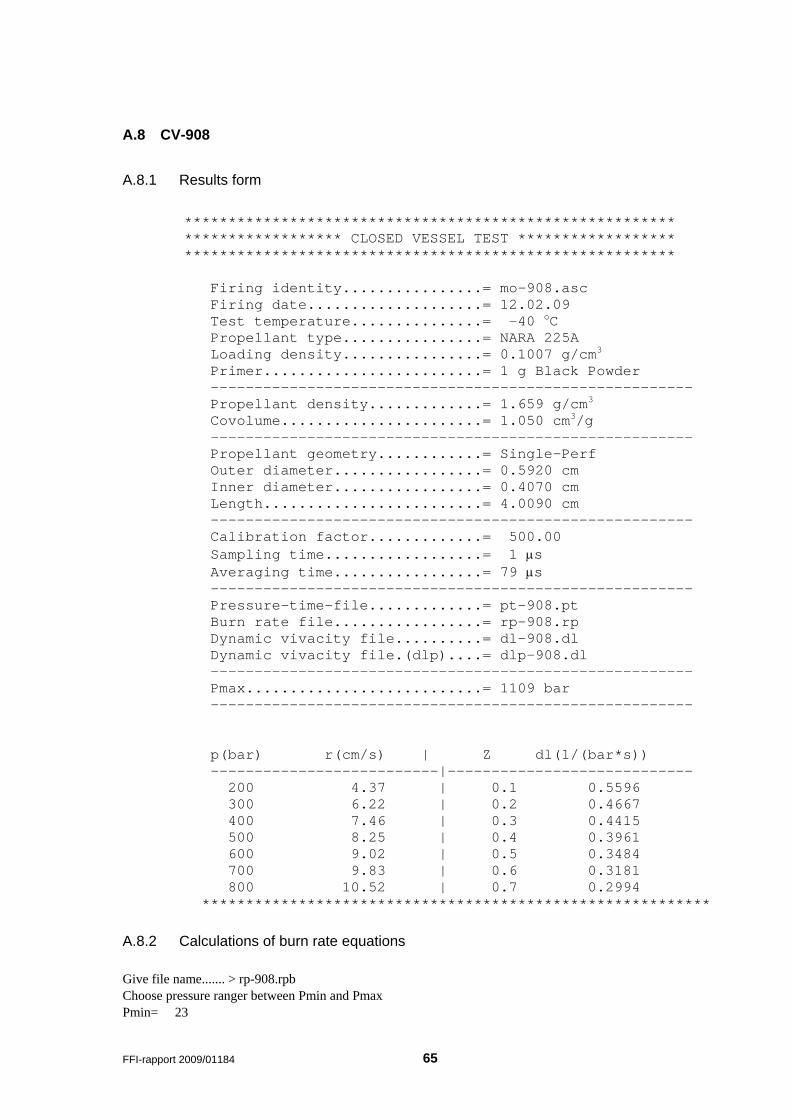
FFI-rapport 2009/01184 65
A.8 CV-908
A.8.1 Results form
******************************************************** ****************** CLOSED VESSEL TEST ****************** ******************************************************** Firing identity................= mo-908.asc Firing date....................= 12.02.09 Test temperature...............= -40 oC Propellant type................= NARA 225A Loading density................= 0.1007 g/cm3 Primer.........................= 1 g Black Powder ------------------------------------------------------- Propellant density.............= 1.659 g/cm3 Covolume.......................= 1.050 cm3/g ------------------------------------------------------- Propellant geometry............= Single-Perf Outer diameter.................= 0.5920 cm Inner diameter.................= 0.4070 cm Length.........................= 4.0090 cm ------------------------------------------------------- Calibration factor.............= 500.00 Sampling time..................= 1 μs Averaging time.................= 79 μs ------------------------------------------------------- Pressure-time-file.............= pt-908.pt Burn rate file.................= rp-908.rp Dynamic vivacity file..........= dl-908.dl Dynamic vivacity file.(dlp)....= dlp-908.dl ------------------------------------------------------- Pmax...........................= 1109 bar ------------------------------------------------------- p(bar) r(cm/s) | Z dl(1/(bar*s)) --------------------------|---------------------------- 200 4.37 | 0.1 0.5596 300 6.22 | 0.2 0.4667 400 7.46 | 0.3 0.4415 500 8.25 | 0.4 0.3961 600 9.02 | 0.5 0.3484 700 9.83 | 0.6 0.3181 800 10.52 | 0.7 0.2994 **********************************************************
A.8.2 Calculations of burn rate equations Give file name....... > rp-908.rpb Choose pressure ranger between Pmin and Pmax Pmin= 23
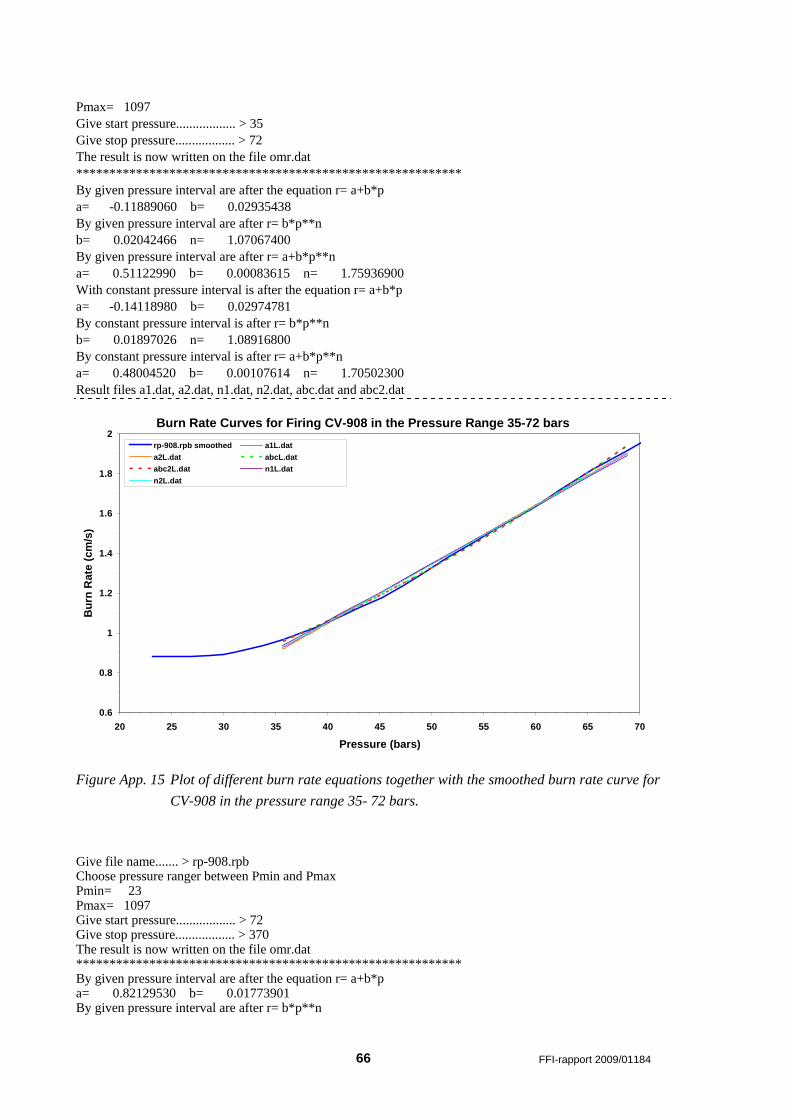
66 FFI-rapport 2009/01184
Pmax= 1097 Give start pressure.................. > 35 Give stop pressure.................. > 72 The result is now written on the file omr.dat ********************************************************** By given pressure interval are after the equation r= a+b*p a= -0.11889060 b= 0.02935438 By given pressure interval are after r= b*p**n b= 0.02042466 n= 1.07067400 By given pressure interval are after r= a+b*p**n a= 0.51122990 b= 0.00083615 n= 1.75936900 With constant pressure interval is after the equation r= a+b*p a= -0.14118980 b= 0.02974781 By constant pressure interval is after r= b*p**n b= 0.01897026 n= 1.08916800 By constant pressure interval is after r= a+b*p**n a= 0.48004520 b= 0.00107614 n= 1.70502300 Result files a1.dat, a2.dat, n1.dat, n2.dat, abc.dat and abc2.dat
Burn Rate Curves for Firing CV-908 in the Pressure Range 35-72 bars
0.6
0.8
1
1.2
1.4
1.6
1.8
2
20 25 30 35 40 45 50 55 60 65 70
Pressure (bars)
Bur
n R
ate
(cm
/s)
rp-908.rpb smoothed a1L.data2L.dat abcL.databc2L.dat n1L.datn2L.dat
Figure App. 15 Plot of different burn rate equations together with the smoothed burn rate curve for CV-908 in the pressure range 35- 72 bars.
Give file name....... > rp-908.rpb Choose pressure ranger between Pmin and Pmax Pmin= 23 Pmax= 1097 Give start pressure.................. > 72 Give stop pressure.................. > 370 The result is now written on the file omr.dat ********************************************************** By given pressure interval are after the equation r= a+b*p a= 0.82129530 b= 0.01773901 By given pressure interval are after r= b*p**n
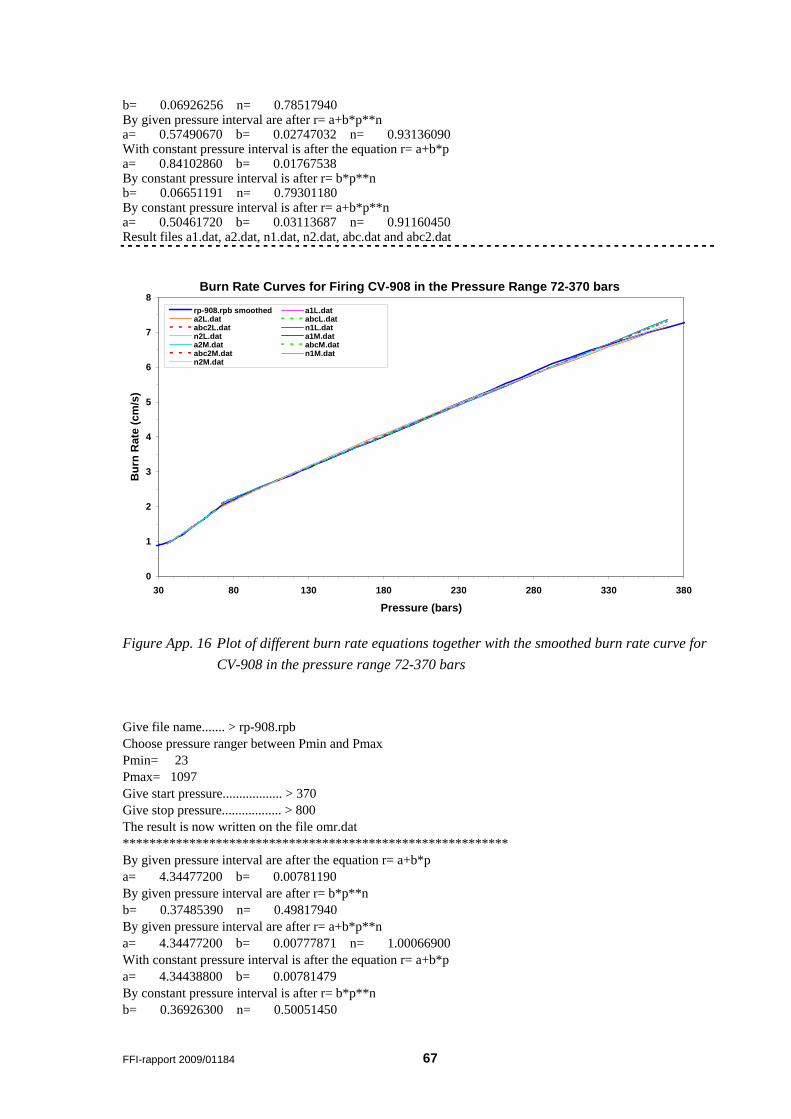
FFI-rapport 2009/01184 67
b= 0.06926256 n= 0.78517940 By given pressure interval are after r= a+b*p**n a= 0.57490670 b= 0.02747032 n= 0.93136090 With constant pressure interval is after the equation r= a+b*p a= 0.84102860 b= 0.01767538 By constant pressure interval is after r= b*p**n b= 0.06651191 n= 0.79301180 By constant pressure interval is after r= a+b*p**n a= 0.50461720 b= 0.03113687 n= 0.91160450 Result files a1.dat, a2.dat, n1.dat, n2.dat, abc.dat and abc2.dat
Burn Rate Curves for Firing CV-908 in the Pressure Range 72-370 bars
0
1
2
3
4
5
6
7
8
30 80 130 180 230 280 330 380
Pressure (bars)
Bur
n R
ate
(cm
/s)
rp-908.rpb smoothed a1L.data2L.dat abcL.databc2L.dat n1L.datn2L.dat a1M.data2M.dat abcM.databc2M.dat n1M.datn2M.dat
Figure App. 16 Plot of different burn rate equations together with the smoothed burn rate curve for CV-908 in the pressure range 72-370 bars
Give file name....... > rp-908.rpb Choose pressure ranger between Pmin and Pmax Pmin= 23 Pmax= 1097 Give start pressure.................. > 370 Give stop pressure.................. > 800 The result is now written on the file omr.dat ********************************************************** By given pressure interval are after the equation r= a+b*p a= 4.34477200 b= 0.00781190 By given pressure interval are after r= b*p**n b= 0.37485390 n= 0.49817940 By given pressure interval are after r= a+b*p**n a= 4.34477200 b= 0.00777871 n= 1.00066900 With constant pressure interval is after the equation r= a+b*p a= 4.34438800 b= 0.00781479 By constant pressure interval is after r= b*p**n b= 0.36926300 n= 0.50051450
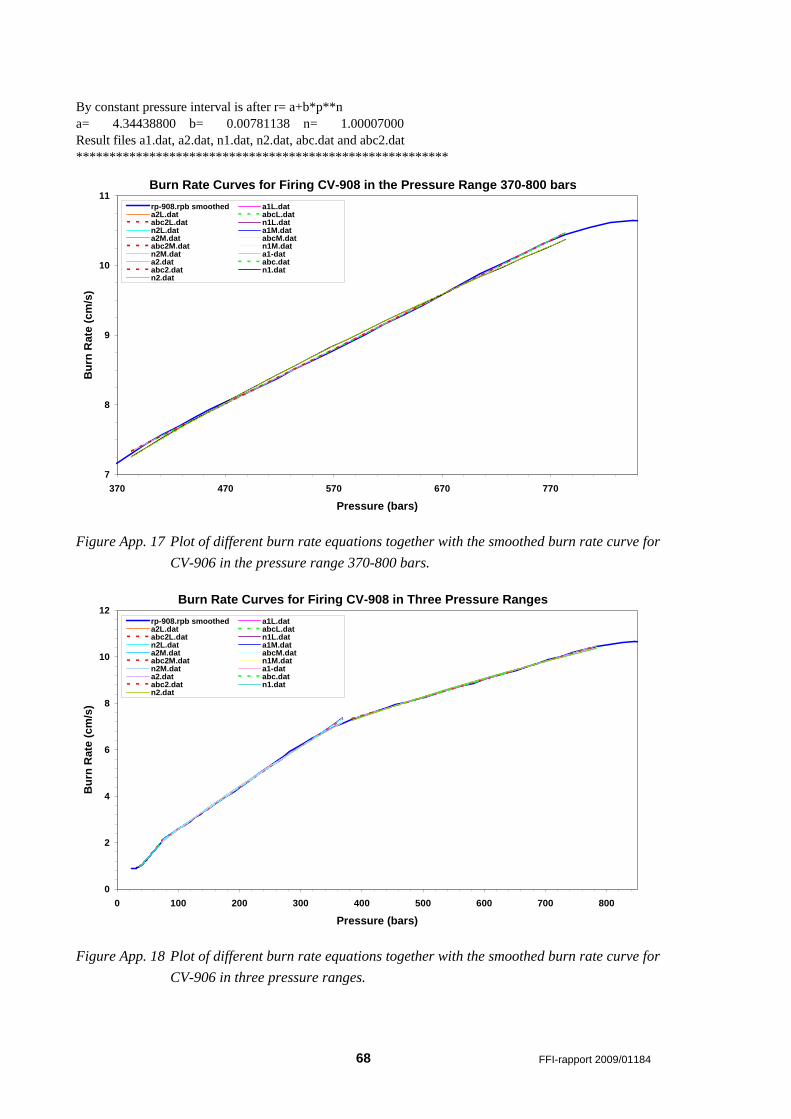
68 FFI-rapport 2009/01184
By constant pressure interval is after r= a+b*p**n a= 4.34438800 b= 0.00781138 n= 1.00007000 Result files a1.dat, a2.dat, n1.dat, n2.dat, abc.dat and abc2.dat ********************************************************
Burn Rate Curves for Firing CV-908 in the Pressure Range 370-800 bars
7
8
9
10
11
370 470 570 670 770
Pressure (bars)
Bur
n R
ate
(cm
/s)
rp-908.rpb smoothed a1L.data2L.dat abcL.databc2L.dat n1L.datn2L.dat a1M.data2M.dat abcM.databc2M.dat n1M.datn2M.dat a1-data2.dat abc.databc2.dat n1.datn2.dat
Figure App. 17 Plot of different burn rate equations together with the smoothed burn rate curve for CV-906 in the pressure range 370-800 bars.
Burn Rate Curves for Firing CV-908 in Three Pressure Ranges
0
2
4
6
8
10
12
0 100 200 300 400 500 600 700 800
Pressure (bars)
Bur
n R
ate
(cm
/s)
rp-908.rpb smoothed a1L.data2L.dat abcL.databc2L.dat n1L.datn2L.dat a1M.data2M.dat abcM.databc2M.dat n1M.datn2M.dat a1-data2.dat abc.databc2.dat n1.datn2.dat
Figure App. 18 Plot of different burn rate equations together with the smoothed burn rate curve for CV-906 in three pressure ranges.
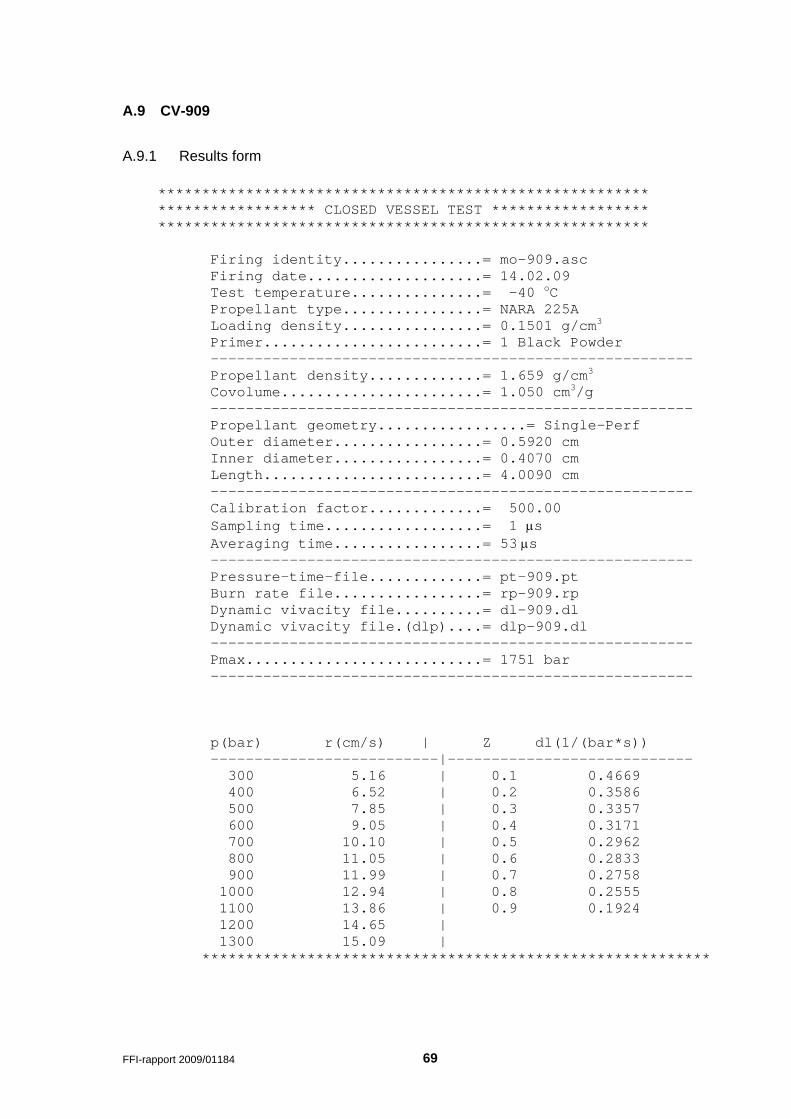
FFI-rapport 2009/01184 69
A.9 CV-909
A.9.1 Results form ******************************************************** ****************** CLOSED VESSEL TEST ****************** ******************************************************** Firing identity................= mo-909.asc Firing date....................= 14.02.09 Test temperature...............= -40 oC Propellant type................= NARA 225A Loading density................= 0.1501 g/cm3 Primer.........................= 1 Black Powder ------------------------------------------------------- Propellant density.............= 1.659 g/cm3 Covolume.......................= 1.050 cm3/g ------------------------------------------------------- Propellant geometry.................= Single-Perf Outer diameter.................= 0.5920 cm Inner diameter.................= 0.4070 cm Length.........................= 4.0090 cm ------------------------------------------------------- Calibration factor.............= 500.00 Sampling time..................= 1 μs Averaging time.................= 53 μs ------------------------------------------------------- Pressure-time-file.............= pt-909.pt Burn rate file.................= rp-909.rp Dynamic vivacity file..........= dl-909.dl Dynamic vivacity file.(dlp)....= dlp-909.dl ------------------------------------------------------- Pmax...........................= 1751 bar ------------------------------------------------------- p(bar) r(cm/s) | Z dl(1/(bar*s)) --------------------------|---------------------------- 300 5.16 | 0.1 0.4669 400 6.52 | 0.2 0.3586 500 7.85 | 0.3 0.3357 600 9.05 | 0.4 0.3171 700 10.10 | 0.5 0.2962 800 11.05 | 0.6 0.2833 900 11.99 | 0.7 0.2758 1000 12.94 | 0.8 0.2555 1100 13.86 | 0.9 0.1924 1200 14.65 | 1300 15.09 | **********************************************************
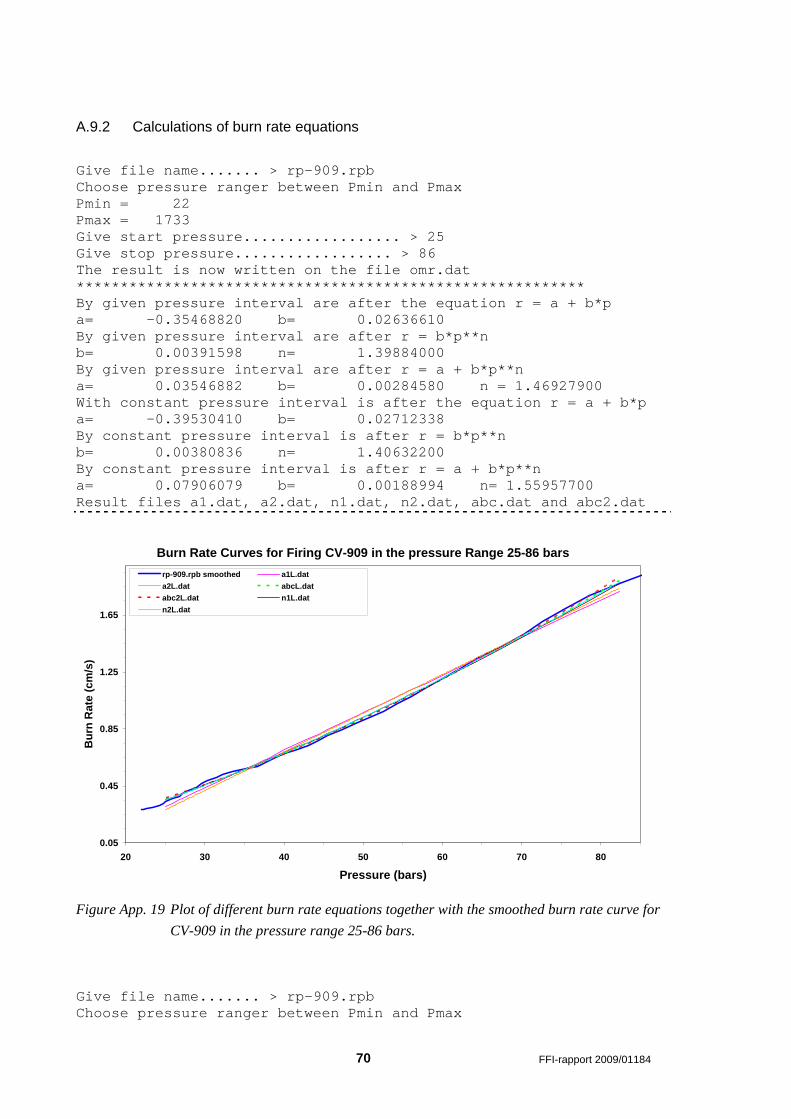
70 FFI-rapport 2009/01184
A.9.2 Calculations of burn rate equations Give file name....... > rp-909.rpb Choose pressure ranger between Pmin and Pmax Pmin = 22 Pmax = 1733 Give start pressure.................. > 25 Give stop pressure.................. > 86 The result is now written on the file omr.dat ********************************************************** By given pressure interval are after the equation r = a + b*p a= -0.35468820 b= 0.02636610 By given pressure interval are after r = b*p**n b= 0.00391598 n= 1.39884000 By given pressure interval are after r = a + b*p**n a= 0.03546882 b= 0.00284580 n = 1.46927900 With constant pressure interval is after the equation r = a + b*p a= -0.39530410 b= 0.02712338 By constant pressure interval is after r = b*p**n b= 0.00380836 n= 1.40632200 By constant pressure interval is after r = a + b*p**n a= 0.07906079 b= 0.00188994 n= 1.55957700 Result files a1.dat, a2.dat, n1.dat, n2.dat, abc.dat and abc2.dat
Burn Rate Curves for Firing CV-909 in the pressure Range 25-86 bars
0.05
0.45
0.85
1.25
1.65
20 30 40 50 60 70 80
Pressure (bars)
Bur
n R
ate
(cm
/s)
rp-909.rpb smoothed a1L.data2L.dat abcL.databc2L.dat n1L.datn2L.dat
Figure App. 19 Plot of different burn rate equations together with the smoothed burn rate curve for CV-909 in the pressure range 25-86 bars.
Give file name....... > rp-909.rpb Choose pressure ranger between Pmin and Pmax
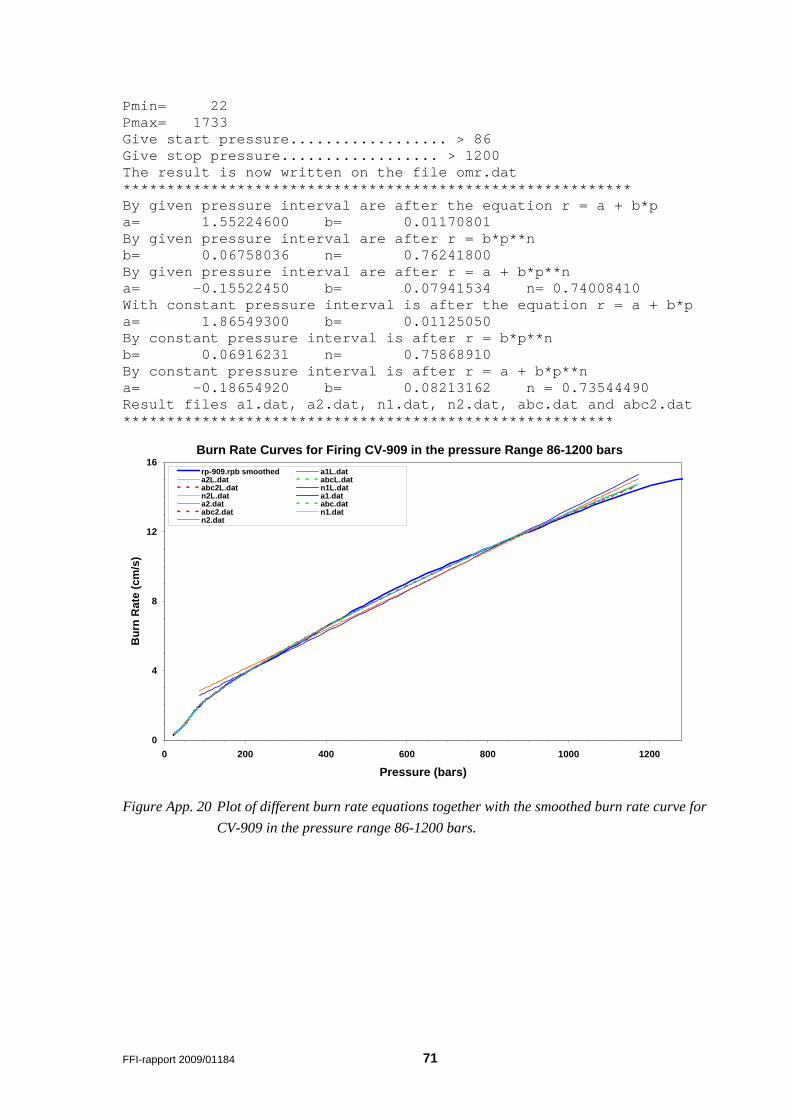
FFI-rapport 2009/01184 71
Pmin= 22 Pmax= 1733 Give start pressure.................. > 86 Give stop pressure.................. > 1200 The result is now written on the file omr.dat ********************************************************** By given pressure interval are after the equation r = a + b*p a= 1.55224600 b= 0.01170801 By given pressure interval are after r = b*p**n b= 0.06758036 n= 0.76241800 By given pressure interval are after r = a + b*p**n a= -0.15522450 b= 0.07941534 n= 0.74008410 With constant pressure interval is after the equation r = a + b*p a= 1.86549300 b= 0.01125050 By constant pressure interval is after r = b*p**n b= 0.06916231 n= 0.75868910 By constant pressure interval is after r = a + b*p**n a= -0.18654920 b= 0.08213162 n = 0.73544490 Result files a1.dat, a2.dat, n1.dat, n2.dat, abc.dat and abc2.dat ********************************************************
Burn Rate Curves for Firing CV-909 in the pressure Range 86-1200 bars
0
4
8
12
16
0 200 400 600 800 1000 1200
Pressure (bars)
Bur
n R
ate
(cm
/s)
rp-909.rpb smoothed a1L.data2L.dat abcL.databc2L.dat n1L.datn2L.dat a1.data2.dat abc.databc2.dat n1.datn2.dat
Figure App. 20 Plot of different burn rate equations together with the smoothed burn rate curve for CV-909 in the pressure range 86-1200 bars.
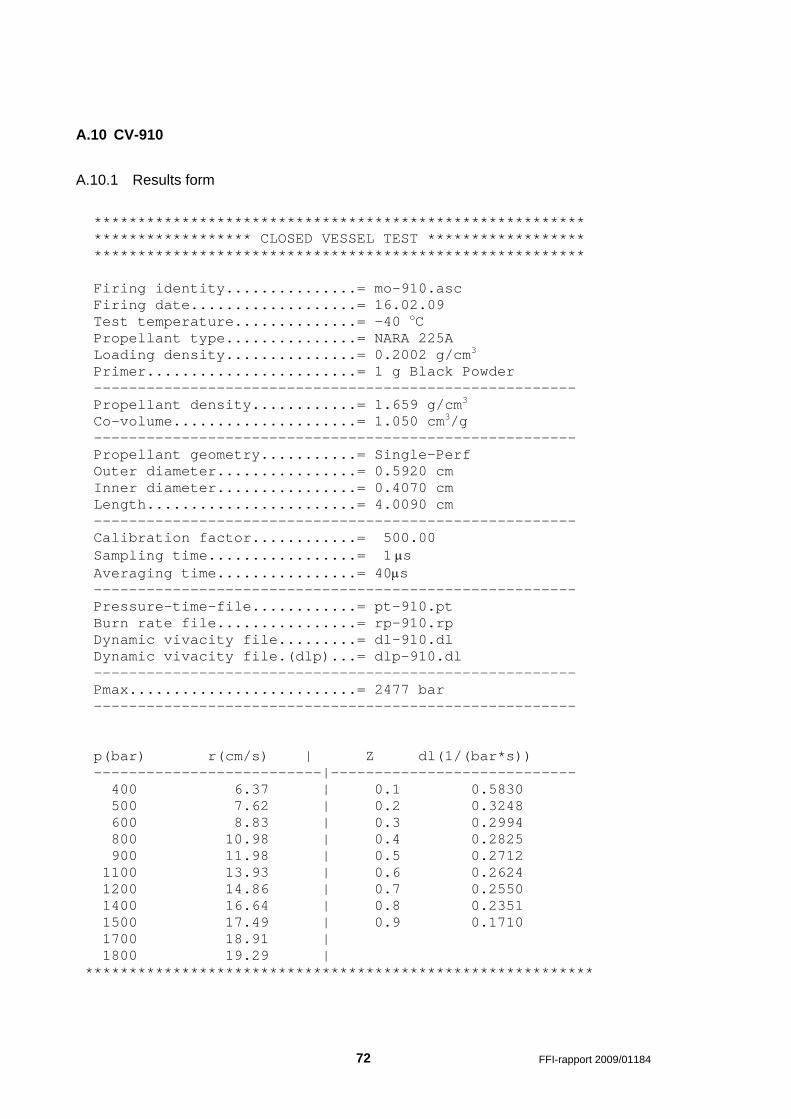
72 FFI-rapport 2009/01184
A.10 CV-910
A.10.1 Results form
******************************************************** ****************** CLOSED VESSEL TEST ****************** ******************************************************** Firing identity...............= mo-910.asc Firing date...................= 16.02.09 Test temperature..............= -40 oC Propellant type...............= NARA 225A Loading density...............= 0.2002 g/cm3 Primer........................= 1 g Black Powder ------------------------------------------------------- Propellant density............= 1.659 g/cm3 Co-volume.....................= 1.050 cm3/g ------------------------------------------------------- Propellant geometry...........= Single-Perf Outer diameter................= 0.5920 cm Inner diameter................= 0.4070 cm Length........................= 4.0090 cm ------------------------------------------------------- Calibration factor............= 500.00 Sampling time.................= 1 μs Averaging time................= 40μs ------------------------------------------------------- Pressure-time-file............= pt-910.pt Burn rate file................= rp-910.rp Dynamic vivacity file.........= dl-910.dl Dynamic vivacity file.(dlp)...= dlp-910.dl ------------------------------------------------------- Pmax..........................= 2477 bar ------------------------------------------------------- p(bar) r(cm/s) | Z dl(1/(bar*s)) --------------------------|---------------------------- 400 6.37 | 0.1 0.5830 500 7.62 | 0.2 0.3248 600 8.83 | 0.3 0.2994 800 10.98 | 0.4 0.2825 900 11.98 | 0.5 0.2712 1100 13.93 | 0.6 0.2624 1200 14.86 | 0.7 0.2550 1400 16.64 | 0.8 0.2351 1500 17.49 | 0.9 0.1710 1700 18.91 | 1800 19.29 | **********************************************************
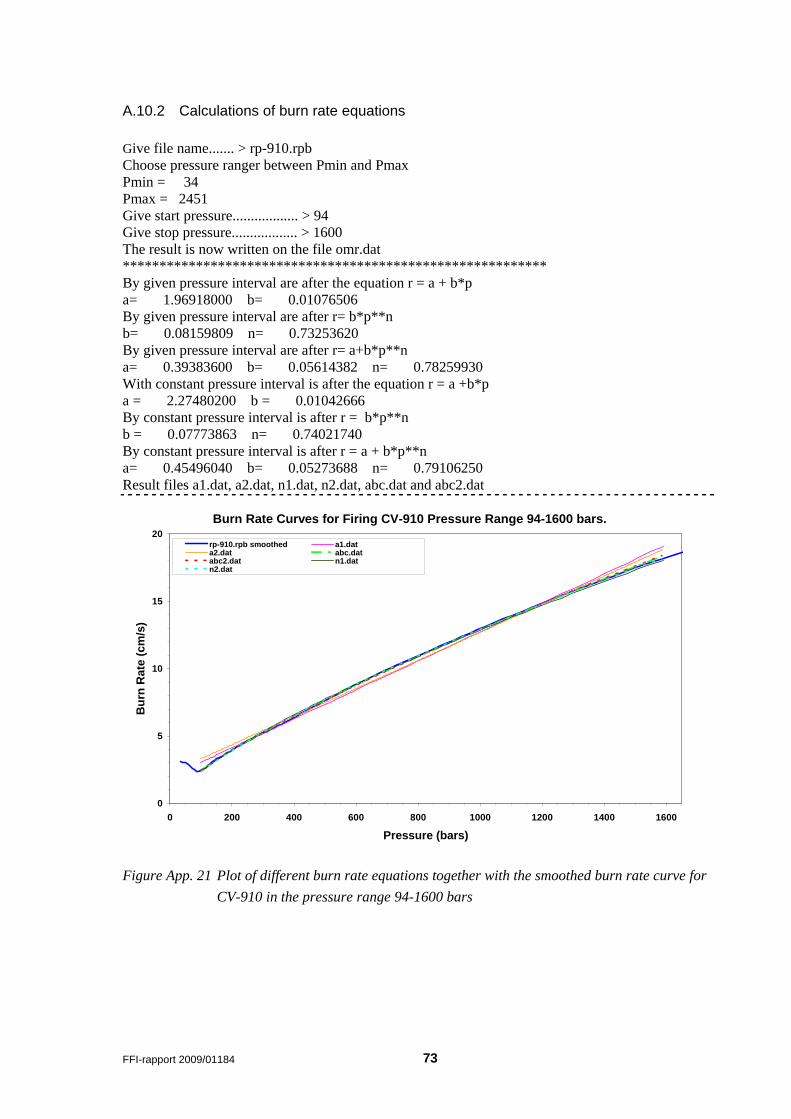
FFI-rapport 2009/01184 73
A.10.2 Calculations of burn rate equations Give file name....... > rp-910.rpb Choose pressure ranger between Pmin and Pmax Pmin = 34 Pmax = 2451 Give start pressure.................. > 94 Give stop pressure.................. > 1600 The result is now written on the file omr.dat ********************************************************** By given pressure interval are after the equation r = a + b*p a= 1.96918000 b= 0.01076506 By given pressure interval are after r= b*p**n b= 0.08159809 n= 0.73253620 By given pressure interval are after r= a+b*p**n a= 0.39383600 b= 0.05614382 n= 0.78259930 With constant pressure interval is after the equation r = a +b*p a = 2.27480200 b = 0.01042666 By constant pressure interval is after r = b*p**n b = 0.07773863 n= 0.74021740 By constant pressure interval is after r = a + b*p**n a= 0.45496040 b= 0.05273688 n= 0.79106250 Result files a1.dat, a2.dat, n1.dat, n2.dat, abc.dat and abc2.dat
Burn Rate Curves for Firing CV-910 Pressure Range 94-1600 bars.
0
5
10
15
20
0 200 400 600 800 1000 1200 1400 1600
Pressure (bars)
Bur
n R
ate
(cm
/s)
rp-910.rpb smoothed a1.data2.dat abc.databc2.dat n1.datn2.dat
Figure App. 21 Plot of different burn rate equations together with the smoothed burn rate curve for CV-910 in the pressure range 94-1600 bars

74 FFI-rapport 2009/01184
A.11 CV-911
A.11.1 Results form ******************************************************** ****************** CLOSED VESSEL TEST ****************** ******************************************************** Firing identity...............= mo-911.asc Firing date...................= 18.02.09 Test temperature..............= -40 oC Propellant type...............= NARA 225A Loading density...............= 0.2328 g/cm3 Primer........................= 1 g Black Powder ------------------------------------------------------- Propellant density............= 1.659 g/cm3 Co-volume.....................= 1.050 cm3/g ------------------------------------------------------- Propellant geometry...........= Single-Perf Outer diameter................= 0.5920 cm Inner diameter................= 0.4070 cm Length........................= 4.0090 cm ------------------------------------------------------- Calibration factor............= 500.00 Sampling time.................= 1 μs Averaging time................= 34 μs ------------------------------------------------------- Pressure-time-file............= pt-911.pt Burn rate file................= rp-911.rp Dynamic vivacity file.........= dl-911.dl Dynamic vivacity file.(dlp)...= dlp-911.dl ------------------------------------------------------- Pmax..........................= 2972 bar ------------------------------------------------------- p(bar) r(cm/s) | Z dl(1/(bar*s)) --------------------------|---------------------------- 500 7.77 | 0.1 0.4070 600 8.90 | 0.2 0.3141 800 11.07 | 0.3 0.2873 1000 13.12 | 0.4 0.2733 1200 15.04 | 0.5 0.2622 1300 15.94 | 0.6 0.2528 1500 17.66 | 0.7 0.2432 1700 19.25 | 0.8 0.2223 1900 20.61 | 0.9 0.1556 2100 21.54 | 2200 21.67 | **********************************************************
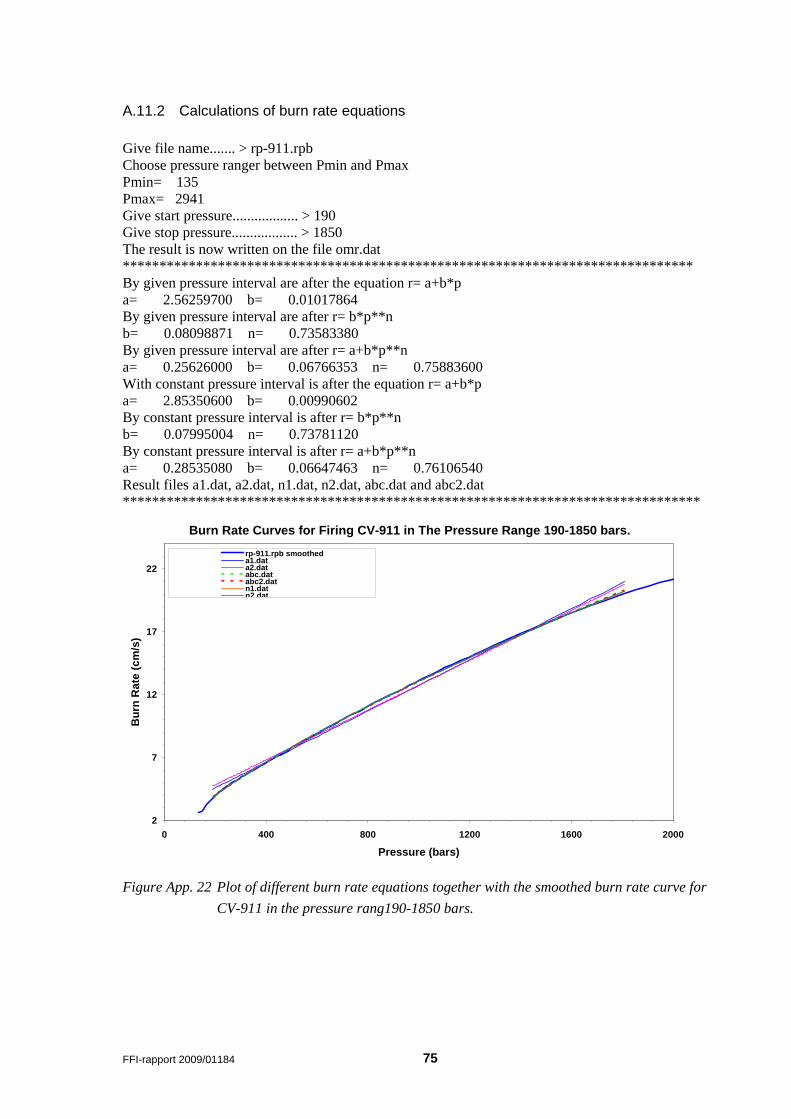
FFI-rapport 2009/01184 75
A.11.2 Calculations of burn rate equations Give file name....... > rp-911.rpb Choose pressure ranger between Pmin and Pmax Pmin= 135 Pmax= 2941 Give start pressure.................. > 190 Give stop pressure.................. > 1850 The result is now written on the file omr.dat ****************************************************************************** By given pressure interval are after the equation r= a+b*p a= 2.56259700 b= 0.01017864 By given pressure interval are after r= b*p**n b= 0.08098871 n= 0.73583380 By given pressure interval are after r= a+b*p**n a= 0.25626000 b= 0.06766353 n= 0.75883600 With constant pressure interval is after the equation r= a+b*p a= 2.85350600 b= 0.00990602 By constant pressure interval is after r= b*p**n b= 0.07995004 n= 0.73781120 By constant pressure interval is after r= a+b*p**n a= 0.28535080 b= 0.06647463 n= 0.76106540 Result files a1.dat, a2.dat, n1.dat, n2.dat, abc.dat and abc2.dat *******************************************************************************
Burn Rate Curves for Firing CV-911 in The Pressure Range 190-1850 bars.
2
7
12
17
22
0 400 800 1200 1600 2000
Pressure (bars)
Bur
n R
ate
(cm
/s)
rp-911.rpb smootheda1.data2.databc.databc2.datn1.datn2.dat
Figure App. 22 Plot of different burn rate equations together with the smoothed burn rate curve for CV-911 in the pressure rang190-1850 bars.
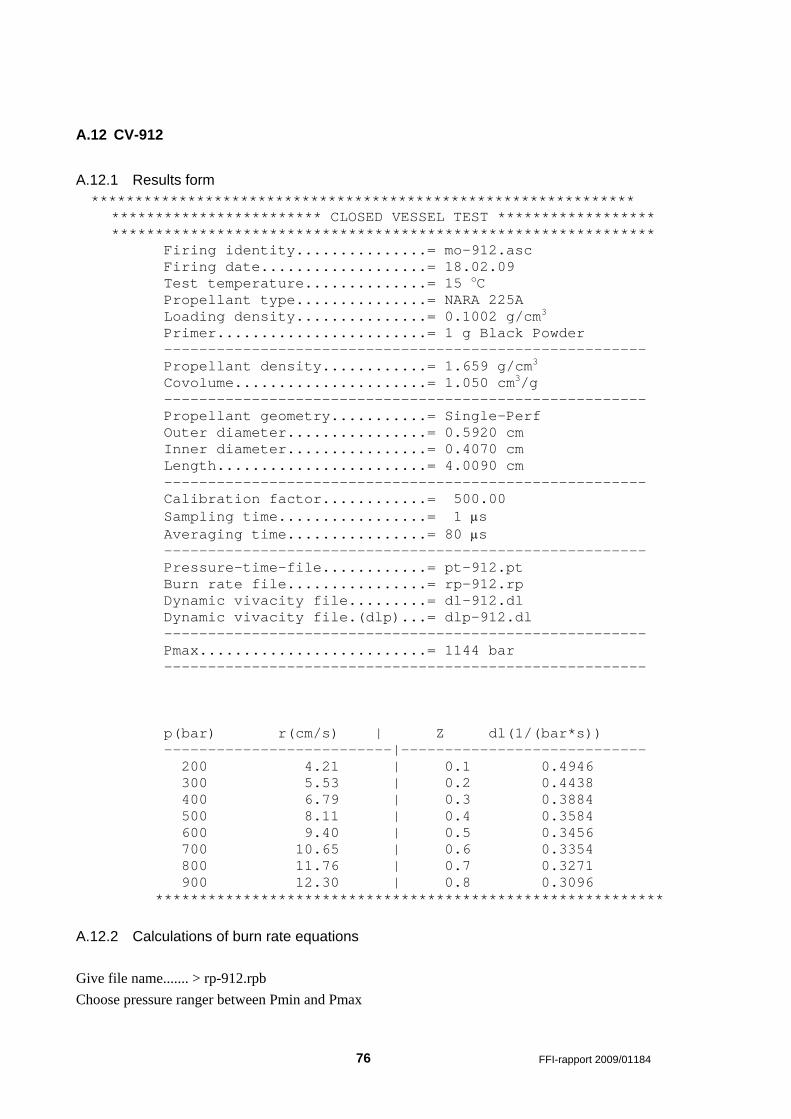
76 FFI-rapport 2009/01184
A.12 CV-912
A.12.1 Results form ************************************************************** ************************ CLOSED VESSEL TEST ****************** ************************************************************** Firing identity...............= mo-912.asc Firing date...................= 18.02.09 Test temperature..............= 15 oC Propellant type...............= NARA 225A Loading density...............= 0.1002 g/cm3 Primer........................= 1 g Black Powder ------------------------------------------------------- Propellant density............= 1.659 g/cm3 Covolume......................= 1.050 cm3/g ------------------------------------------------------- Propellant geometry...........= Single-Perf Outer diameter................= 0.5920 cm Inner diameter................= 0.4070 cm Length........................= 4.0090 cm ------------------------------------------------------- Calibration factor............= 500.00 Sampling time.................= 1 μs Averaging time................= 80 μs ------------------------------------------------------- Pressure-time-file............= pt-912.pt Burn rate file................= rp-912.rp Dynamic vivacity file.........= dl-912.dl Dynamic vivacity file.(dlp)...= dlp-912.dl ------------------------------------------------------- Pmax..........................= 1144 bar ------------------------------------------------------- p(bar) r(cm/s) | Z dl(1/(bar*s)) --------------------------|---------------------------- 200 4.21 | 0.1 0.4946 300 5.53 | 0.2 0.4438 400 6.79 | 0.3 0.3884 500 8.11 | 0.4 0.3584 600 9.40 | 0.5 0.3456 700 10.65 | 0.6 0.3354 800 11.76 | 0.7 0.3271 900 12.30 | 0.8 0.3096 **********************************************************
A.12.2 Calculations of burn rate equations Give file name....... > rp-912.rpb Choose pressure ranger between Pmin and Pmax
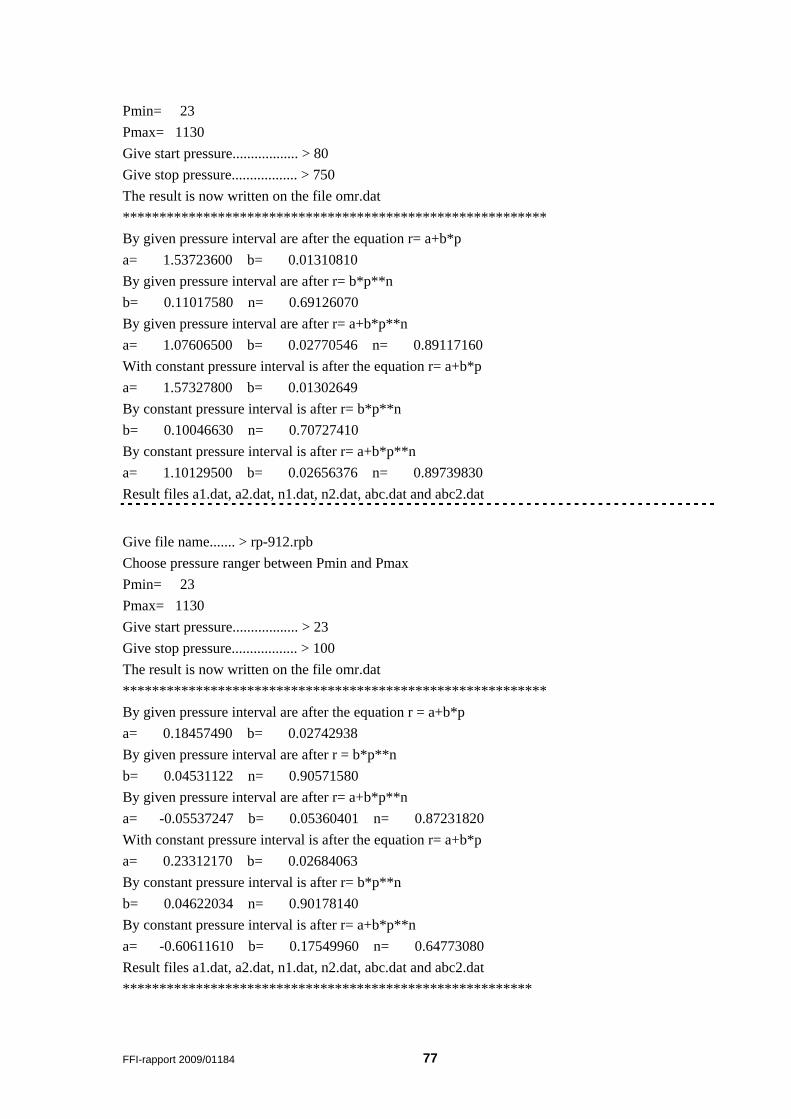
FFI-rapport 2009/01184 77
Pmin= 23 Pmax= 1130 Give start pressure.................. > 80 Give stop pressure.................. > 750 The result is now written on the file omr.dat ********************************************************** By given pressure interval are after the equation r= a+b*p a= 1.53723600 b= 0.01310810 By given pressure interval are after r= b*p**n b= 0.11017580 n= 0.69126070 By given pressure interval are after r= a+b*p**n a= 1.07606500 b= 0.02770546 n= 0.89117160 With constant pressure interval is after the equation r= a+b*p a= 1.57327800 b= 0.01302649 By constant pressure interval is after r= b*p**n b= 0.10046630 n= 0.70727410 By constant pressure interval is after r= a+b*p**n a= 1.10129500 b= 0.02656376 n= 0.89739830 Result files a1.dat, a2.dat, n1.dat, n2.dat, abc.dat and abc2.dat
Give file name....... > rp-912.rpb Choose pressure ranger between Pmin and Pmax Pmin= 23 Pmax= 1130 Give start pressure.................. > 23 Give stop pressure.................. > 100 The result is now written on the file omr.dat ********************************************************** By given pressure interval are after the equation r = a+b*p a= 0.18457490 b= 0.02742938 By given pressure interval are after r = b*p**n b= 0.04531122 n= 0.90571580 By given pressure interval are after r= a+b*p**n a= -0.05537247 b= 0.05360401 n= 0.87231820 With constant pressure interval is after the equation r= a+b*p a= 0.23312170 b= 0.02684063 By constant pressure interval is after r= b*p**n b= 0.04622034 n= 0.90178140 By constant pressure interval is after r= a+b*p**n a= -0.60611610 b= 0.17549960 n= 0.64773080 Result files a1.dat, a2.dat, n1.dat, n2.dat, abc.dat and abc2.dat ********************************************************
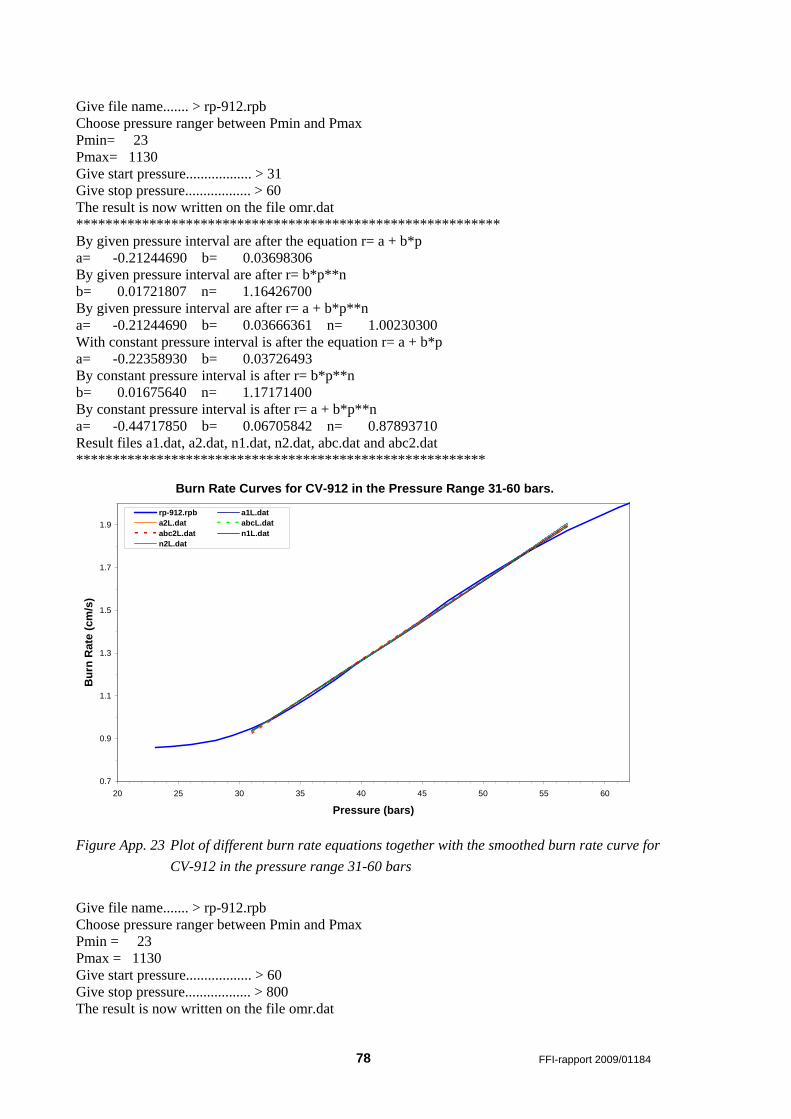
78 FFI-rapport 2009/01184
Give file name....... > rp-912.rpb Choose pressure ranger between Pmin and Pmax Pmin= 23 Pmax= 1130 Give start pressure.................. > 31 Give stop pressure.................. > 60 The result is now written on the file omr.dat ********************************************************** By given pressure interval are after the equation r= a + b*p a= -0.21244690 b= 0.03698306 By given pressure interval are after r= b*p**n b= 0.01721807 n= 1.16426700 By given pressure interval are after r= a + b*p**n a= -0.21244690 b= 0.03666361 n= 1.00230300 With constant pressure interval is after the equation r= a + b*p a= -0.22358930 b= 0.03726493 By constant pressure interval is after r= b*p**n b= 0.01675640 n= 1.17171400 By constant pressure interval is after r= a + b*p**n a= -0.44717850 b= 0.06705842 n= 0.87893710 Result files a1.dat, a2.dat, n1.dat, n2.dat, abc.dat and abc2.dat ********************************************************
Burn Rate Curves for CV-912 in the Pressure Range 31-60 bars.
0.7
0.9
1.1
1.3
1.5
1.7
1.9
20 25 30 35 40 45 50 55 60
Pressure (bars)
Bur
n R
ate
(cm
/s)
rp-912.rpb a1L.data2L.dat abcL.databc2L.dat n1L.datn2L.dat
Figure App. 23 Plot of different burn rate equations together with the smoothed burn rate curve for CV-912 in the pressure range 31-60 bars
Give file name....... > rp-912.rpb Choose pressure ranger between Pmin and Pmax Pmin = 23 Pmax = 1130 Give start pressure.................. > 60 Give stop pressure.................. > 800 The result is now written on the file omr.dat
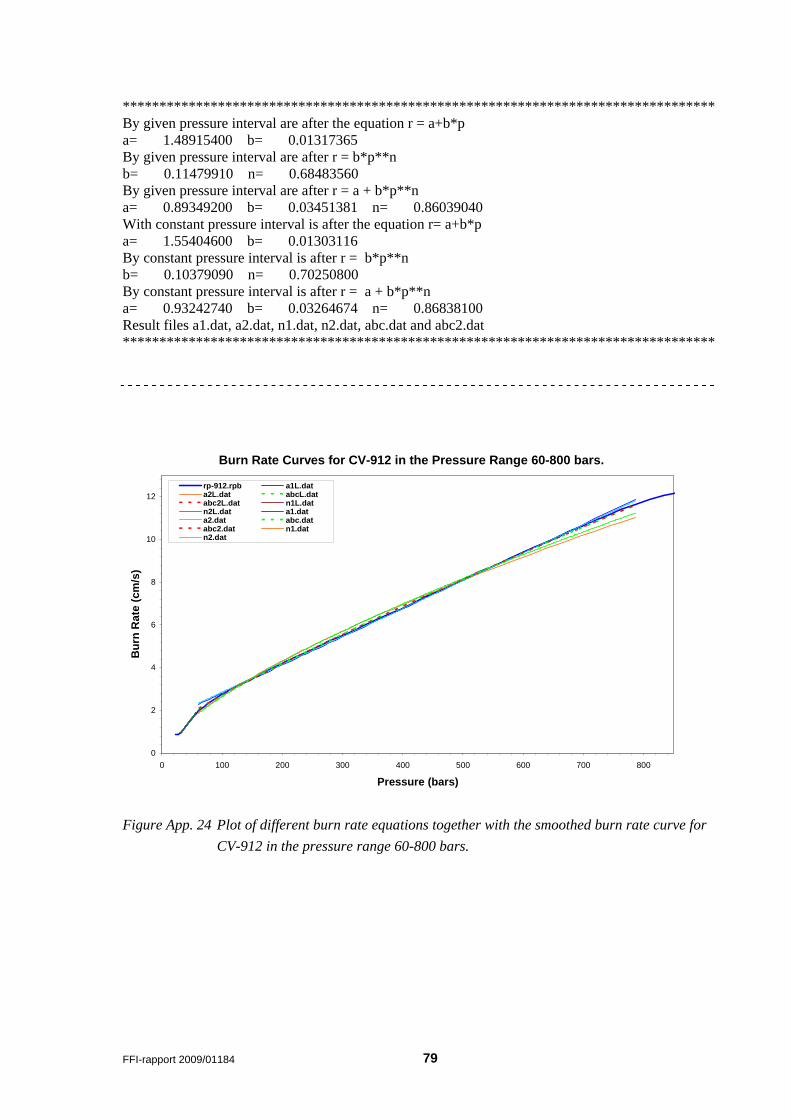
FFI-rapport 2009/01184 79
********************************************************************************* By given pressure interval are after the equation r = a+b*p a= 1.48915400 b= 0.01317365 By given pressure interval are after r = b*p**n b= 0.11479910 n= 0.68483560 By given pressure interval are after r = a + b*p**n a= 0.89349200 b= 0.03451381 n= 0.86039040 With constant pressure interval is after the equation r= a+b*p a= 1.55404600 b= 0.01303116 By constant pressure interval is after r = b*p**n b= 0.10379090 n= 0.70250800 By constant pressure interval is after r = a + b*p**n a= 0.93242740 b= 0.03264674 n= 0.86838100 Result files a1.dat, a2.dat, n1.dat, n2.dat, abc.dat and abc2.dat *********************************************************************************
Burn Rate Curves for CV-912 in the Pressure Range 60-800 bars.
0
2
4
6
8
10
12
0 100 200 300 400 500 600 700 800
Pressure (bars)
Bur
n R
ate
(cm
/s)
rp-912.rpb a1L.data2L.dat abcL.databc2L.dat n1L.datn2L.dat a1.data2.dat abc.databc2.dat n1.datn2.dat
Figure App. 24 Plot of different burn rate equations together with the smoothed burn rate curve for CV-912 in the pressure range 60-800 bars.
80 FFI-rapport 2009/01184
References (1) North Atlantic Council (1995):”STANAG 4115 (Edition 2): Definition and Determination
of Ballistic Properties of Gun Propellants” AC/225-D/1330, 27th February.
(2) Eriksen Svein Walter (March 22, 1995):”PC-program for closed vessel test”, FFI/NOTAT-95/01535
(3) Nevstad Gunnar Ove (February 21, 2008): “Testing of M7 propellant in closed vessel”,
FFI-rapport 2008/00470.
(4) Nevstad Gunnar Ove (July 2, 2009): “Testing of two M7 propellant lots in closed vessel”, FFI-rapport 2009/01183.