Testing market integration and convergence to the law of ...
10
Vol. 9(40), pp. 2975-2984, 2 October, 2014 DOI: 10.5897/AJAR2013.8037 Article Number: 0A0D28247746 ISSN 1991-637X Copyright © 2014 Author(s) retain the copyright of this article http://www.academicjournals.org/AJAR African Journal of Agricultural Research Full Length Research Paper Testing market integration and convergence to the law of one price in Indian onions Sendhil R. 1 *, Sundaramoorthy C. 2 , Venkatesh P. 3 and Thomas L. 4 1 Directorate of Wheat Research, Karnal (Haryana), India. 2 Central Institute for Research on Cotton Technology, Mumbai, India. 3 Indian Agricultural Research Institute, New Delhi, India. 4 Directorate of Rapeseed-Mustard Research, Bharatpur, India. Received 5 October, 2013; Accepted 9 September, 2014 Spiraling prices of onions in India undermine the sustainability of current economic growth process and raised the question of price integration among the spatially separated markets. Co-integration test has been used to identify whether onion markets in India share a common linear deterministic trend and the law of one price holds true in view of rising prices in the recent past. The study sourced the wholesale daily prices of major onion markets across the country from January 2010 to March 2011. Augmented Dickey Fuller test statistic has been used to check the presence of a unit root in the time series data. Empirical results indicated the presence of unit root and a strong spatial integration between major markets. The study also confirms the law of one price in Indian onions. Key words: Co-integration, onion, law of one price. INTRODUCTION Onion (Allium cepa) is being used as a vegetable and spice for thousands of years by many cultures around the world, and it has immense medicinal and therapeutic value (Sendhil, 2012). It is cultivated across different states in India for domestic consumption and international trade. Among them, Maharashtra accounts for about 40% of India’s onion output. Rajasthan is the next major producer followed by Karnataka, Andhra Pradesh and Tamil Nadu. Onion is a commercial crop in India, but the crises of 1998 and 2010 played spoilsport in the economy and the welfare of the producers (Sendhil, 2012). Price surge during the crises led to many economic as well as political implications. The prices have hit the roof across the entire nation and the absence of timely intervention to control them resulted in an explosive situation of prices (Nayyar, 2011). Prices rose by 600% from INR 12 to 18 per kg to INR 60 to 100 per kg during December, 2010 across different markets in the country. Even in the recent past, the wholesale prices hit a two-and-a-half- year high bringing tears in the eyes of millions (Reuters, 2013). Following a 50% increase in the monthly wholesale prices, retail prices increase by cent percent particularly in Indian metros with a wide range of prices across major cities. In comparison to the last year, the *Corresponding author. E-mail: [email protected], Tel: +91 1842209191. Fax: +91 1842267390. Author(s) agree that this article remain permanently open access under the terms of the Creative Commons Attribution License 4.0 International License
Transcript of Testing market integration and convergence to the law of ...

Vol. 9(40), pp. 2975-2984, 2 October, 2014 DOI: 10.5897/AJAR2013.8037 Article Number: 0A0D28247746 ISSN 1991-637X Copyright © 2014 Author(s) retain the copyright of this article http://www.academicjournals.org/AJAR
African Journal of Agricultural Research
Full Length Research Paper
Testing market integration and convergence to the law of one price in Indian onions
Sendhil R.1*, Sundaramoorthy C.2, Venkatesh P.3 and Thomas L.4
1Directorate of Wheat Research, Karnal (Haryana), India. 2Central Institute for Research on Cotton Technology, Mumbai, India.
3Indian Agricultural Research Institute, New Delhi, India. 4Directorate of Rapeseed-Mustard Research, Bharatpur, India.
Received 5 October, 2013; Accepted 9 September, 2014
Spiraling prices of onions in India undermine the sustainability of current economic growth process and raised the question of price integration among the spatially separated markets. Co-integration test has been used to identify whether onion markets in India share a common linear deterministic trend and the law of one price holds true in view of rising prices in the recent past. The study sourced the wholesale daily prices of major onion markets across the country from January 2010 to March 2011. Augmented Dickey Fuller test statistic has been used to check the presence of a unit root in the time series data. Empirical results indicated the presence of unit root and a strong spatial integration between major markets. The study also confirms the law of one price in Indian onions. Key words: Co-integration, onion, law of one price.
INTRODUCTION Onion (Allium cepa) is being used as a vegetable and spice for thousands of years by many cultures around the world, and it has immense medicinal and therapeutic value (Sendhil, 2012). It is cultivated across different states in India for domestic consumption and international trade. Among them, Maharashtra accounts for about 40% of India’s onion output. Rajasthan is the next major producer followed by Karnataka, Andhra Pradesh and Tamil Nadu. Onion is a commercial crop in India, but the crises of 1998 and 2010 played spoilsport in the economy and the welfare of the producers (Sendhil, 2012). Price surge during the crises led to many economic as well as
political implications. The prices have hit the roof across the entire nation and the absence of timely intervention to control them resulted in an explosive situation of prices (Nayyar, 2011). Prices rose by 600% from INR 12 to 18 per kg to INR 60 to 100 per kg during December, 2010 across different markets in the country. Even in the recent past, the wholesale prices hit a two-and-a-half-year high bringing tears in the eyes of millions (Reuters, 2013). Following a 50% increase in the monthly wholesale prices, retail prices increase by cent percent particularly in Indian metros with a wide range of prices across major cities. In comparison to the last year, the
*Corresponding author. E-mail: [email protected], Tel: +91 1842209191. Fax: +91 1842267390. Author(s) agree that this article remain permanently open access under the terms of the Creative Commons Attribution License 4.0 International License

2976 Afr. J. Agric. Res. reported price rise was about 500% in Lasalgoan in Maharashtra, Asia’s biggest market. Though supply shock arising from excessive rainfall or drought that spoils the bulbs was a major reason for the spiraling prices, it undermined the sustainability and efficiency of public management in controlling the price of the commodity. The difference in prices that prevailed across onion markets in India raised the question of price integration among the spatially separated markets.
Spatial market integration is a situation in which prices of a commodity in spatially separated markets move together due to arbitrage and the price signals and information are transmitted smoothly across the markets. With the free flow of information in a competitive market, the difference in prices of a product in the two markets would be equal to or less than the transportation cost between them. Empirical studies on market integration of agricultural products typically use bilateral price relationships as an indicator of market integration. This methodology falls under the law of one price (LOOP), which states that if the commodity prices are converted to a common currency, then the particular commodity should be sold at the same price in each country or region.
However, in practice is a very rare case. In case of onions too, there is a great likelihood of market integration and price transmission between markets in India, if the markets are efficient and competitive. In this case, a causal relationship between prices in different spatial markets can be measured (Moodley et al., 2000). Market integration also means that a measurable long-run relationship exists between spatially separated prices for the same product. Thus, even when prices temporarily deviate from each other in the short-run, the differentials should eventually converge in the long-run and the speed of price convergence indicates the degree of market integration. In this context, an attempt has been made with the objective finding the extent of market integration within India and whether the LOOP holds true in the case of onions across different markets in India. MATERIALS AND METHODS The study is based on time series data on wholesale daily prices of onion collected from the AGMARKNET portal from January 2010 to March 2011. The data set can be used to analyze the price instability which occurred during 2010 to 2011. Instability in prices Instability index was used to examine the extent of variation and risk involved in prices. It was measured by Cuddy-Della Valle Index (Cuddy and Della Valle, 1978; Anuja et al., 2013) which is given as,
Cuddy-Della Valle Instability (%) )1( 2RCV . Where, CV
is the coefficient of variation in per cent, and 2R is the coefficient
of determination from a time trend regression adjusted to its degrees of freedom.
Market integration and price transmission Estimation of bivariate correlation coefficients between price changes in different markets has been employed as the most common methodology for testing market integration (Cummings, 1967; Lele, 1967, 1971). But it indicates the integration of markets only in the short-run. Economic theory often suggests that certain pairs of economic variables should be linked by a long-run equilibrium relationship. Despite price series move away from the equilibrium point for a while, economic forces may be expected to act so as to restore equilibrium. Granger (1981) proposed the concept of co-integration which states that even though several price time series have unit roots, a linear combination of them would not have a unit root. Since the introduction of co-integration techniques by Engle and Granger (1987), Johansen (1988, 1991, 1994, 1995), Johansen and Juselius (1990), and Goodwin and Schroeder (1991) researchers have applied it on non-stationary data. The Engle and Granger method is basically a bi-variate approach that accommodates relationships only between two price series.
As a result, this shortcoming does not lend itself well to analyzing multivariate systems that characterize, for example, markets with many sellers and buyers. In addition, the results are sensitive to which price series is used to normalize the other. Hypothesis testing on the estimated co-integration vector is also not possible under this approach. The Johansen method is preferred over the Engle and Granger approach and has proven to be popular in the recent literature on market integration (Kumar and Sharma, 2003). Before testing for co-integration, the time series has to be checked for its stationary property. The stationarity properties and the exhibition of unit roots in the time series are substantiated by performing the Augmented Dickey-Fuller (ADF) test. This test is conducted on the variables in level (original price series) and first differences. Price series co-integration arises when the variables are integrated of the same order against the unit root test which identifies the variables that are integrated of order one, or I (1). In a co-integrated equation system:
tktiti
k
it YYY
'
1
1
where Yt is the price time series, is the first difference operator (Yt
- Yt-1) and matrix ' is (n x n) with rank r (0 r n), which is
the number of linear independent co-integration relations in the vector space of a matrix. The Johansen's method of co-integrated system is a restricted maximum likelihood method with rank
restriction on matrix ' (Anuja et al., 2013). The rank of
can be determined by using trace or max test statistics. Integration between two markets can be checked in a similar fashion through bi-variate Johansen’s test. Since the test is very sensitive to price lag, the choice of lag length should be determined well. After testing for co-integration, the residuals show the deviation from equilibrium and this equilibrium error in the long-run tends to zero. Vector error-correction model (VECM) can be used to capture the deviations from the long-run equilibrium (Brosig et al., 2011). The model is represented as: Where, At is the price of market ‘A’, Bt is the price of market ‘B’ and ut is the co-integration vector. The coefficient (α2) of the error-correction term (ut-1) indicates the speed at which the series returns to equilibrium. If it is less than zero, the series converge to long-run equilibrium and if it is positive and zero, the series diverges from equilibrium.
tttt uBA 1210
Sendhil et al. 2977
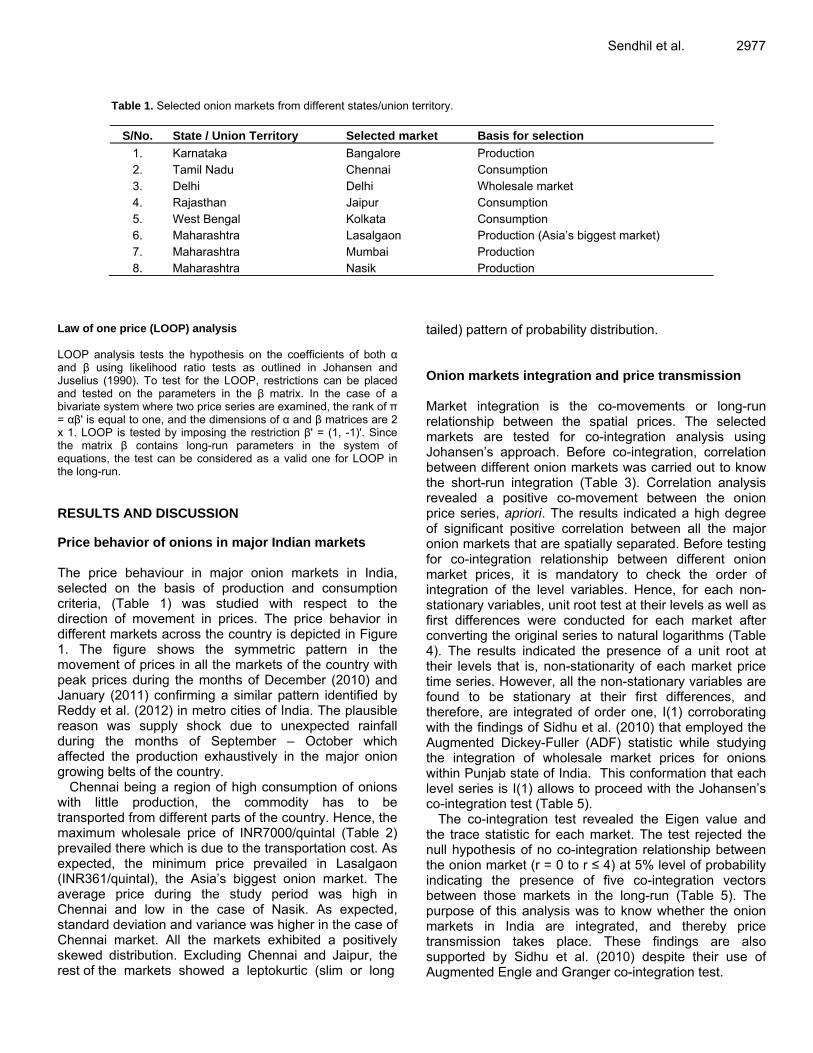
Table 1. Selected onion markets from different states/union territory.
S/No. State / Union Territory Selected market Basis for selection
1. Karnataka Bangalore Production 2. Tamil Nadu Chennai Consumption 3. Delhi Delhi Wholesale market 4. Rajasthan Jaipur Consumption 5. West Bengal Kolkata Consumption 6. Maharashtra Lasalgaon Production (Asia’s biggest market) 7. Maharashtra Mumbai Production 8. Maharashtra Nasik Production
Law of one price (LOOP) analysis LOOP analysis tests the hypothesis on the coefficients of both α and β using likelihood ratio tests as outlined in Johansen and Juselius (1990). To test for the LOOP, restrictions can be placed and tested on the parameters in the β matrix. In the case of a bivariate system where two price series are examined, the rank of π = αβ' is equal to one, and the dimensions of α and β matrices are 2 x 1. LOOP is tested by imposing the restriction β' = (1, -1)'. Since the matrix β contains long-run parameters in the system of equations, the test can be considered as a valid one for LOOP in the long-run. RESULTS AND DISCUSSION Price behavior of onions in major Indian markets The price behaviour in major onion markets in India, selected on the basis of production and consumption criteria, (Table 1) was studied with respect to the direction of movement in prices. The price behavior in different markets across the country is depicted in Figure 1. The figure shows the symmetric pattern in the movement of prices in all the markets of the country with peak prices during the months of December (2010) and January (2011) confirming a similar pattern identified by Reddy et al. (2012) in metro cities of India. The plausible reason was supply shock due to unexpected rainfall during the months of September – October which affected the production exhaustively in the major onion growing belts of the country.
Chennai being a region of high consumption of onions with little production, the commodity has to be transported from different parts of the country. Hence, the maximum wholesale price of INR7000/quintal (Table 2) prevailed there which is due to the transportation cost. As expected, the minimum price prevailed in Lasalgaon (INR361/quintal), the Asia’s biggest onion market. The average price during the study period was high in Chennai and low in the case of Nasik. As expected, standard deviation and variance was higher in the case of Chennai market. All the markets exhibited a positively skewed distribution. Excluding Chennai and Jaipur, the rest of the markets showed a leptokurtic (slim or long
tailed) pattern of probability distribution. Onion markets integration and price transmission Market integration is the co-movements or long-run relationship between the spatial prices. The selected markets are tested for co-integration analysis using Johansen’s approach. Before co-integration, correlation between different onion markets was carried out to know the short-run integration (Table 3). Correlation analysis revealed a positive co-movement between the onion price series, apriori. The results indicated a high degree of significant positive correlation between all the major onion markets that are spatially separated. Before testing for co-integration relationship between different onion market prices, it is mandatory to check the order of integration of the level variables. Hence, for each non-stationary variables, unit root test at their levels as well as first differences were conducted for each market after converting the original series to natural logarithms (Table 4). The results indicated the presence of a unit root at their levels that is, non-stationarity of each market price time series. However, all the non-stationary variables are found to be stationary at their first differences, and therefore, are integrated of order one, I(1) corroborating with the findings of Sidhu et al. (2010) that employed the Augmented Dickey-Fuller (ADF) statistic while studying the integration of wholesale market prices for onions within Punjab state of India. This conformation that each level series is I(1) allows to proceed with the Johansen’s co-integration test (Table 5).
The co-integration test revealed the Eigen value and the trace statistic for each market. The test rejected the null hypothesis of no co-integration relationship between the onion market (r = 0 to r ≤ 4) at 5% level of probability indicating the presence of five co-integration vectors between those markets in the long-run (Table 5). The purpose of this analysis was to know whether the onion markets in India are integrated, and thereby price transmission takes place. These findings are also supported by Sidhu et al. (2010) despite their use of Augmented Engle and Granger co-integration test.

2978 Afr. J. Agric. Res.
Figure 1. Price behaviour (INR/quintal) of onion in different markets of India.
Yogisha et al. (2006) employed a distributed lag model and found that onion markets in Kolar district of Karnataka were highly integrated attributing to the timely available information on prices. Reddy et al. (2012) also confirmed a high degree of price integration for a majority of the onion markets and they indicated that inter alia, prices are governed not only based on market arrivals but also several factors prevailing in other markets like varieties, appearance, moisture content, colour, size and shape of the produce. However, the flow of market information across markets will help to realize the law of one price in onions and the speed of flow can be
estimated through the VECM. For this, bi-variate (2 markets) co-integration analysis has been done and the integrated markets were tested with error-correction mechanism. The results of the VECM indicated that most of the estimated coefficients were negative for market 1 and positive for market 2 (Table 6). This indicated that those series with positive coefficients diverge from equilibrium and negative coefficients converge to equilibrium in the short-run. However, further changes in the subsequent periods help the price series to achieve equilibrium in the long-run. The vector error-correction coefficient was estimated at -0.1467 for market 1

Sendhil et al. 2979
Table 2. Summary statistics of onion market prices.
Particulars Bangalore Chennai Delhi Jaipur Kolkata Lasalgaon Mumbai Nasik
Observations 448 448 448 448 448 448 448 448 Maximum (INR/quintal) 4000 7000 3975 4500 5250 3800 5250 4000 Minimum (INR/quintal) 425 700 450 370 500 361 525 375 Range (INR/quintal) 3575 6300 3525 4130 4750 3439 4725 3625 Mean (INR/quintal) 1185.30 1724.93 1203.97 1092.57 1501.42 1064.95 1318.87 1044.60 Standard deviation 758.16 1059.75 709.58 681.41 893.19 610.24 852.99 613.20 Variance 574809 1123063 503504 464316 797790 372389 727595 376018 Skewness 1.74 1.78 1.60 1.71 1.33 1.58 1.60 1.59 Kurtosis 2.54 3.36 2.58 3.53 1.39 2.69 2.30 2.70 Instability (%) 56.24 55.97 53.47 57.47 53.90 53.57 58.24 54.50
Table 3. Price correlation between major onion markets in India.
Market (n = 448) Bangalore Chennai Delhi Jaipur Kolkata Lasalgaon Mumbai Nasik
Bangalore 1 0.95* 0.95* 0.92* 0.94* 0.92* 0.95* 0.94* Chennai 0.95* 1 0.95* 0.92* 0.95* 0.93* 0.94* 0.93* Delhi 0.95* 0.95* 1 0.93* 0.95* 0.94* 0.94* 0.93* Jaipur 0.92* 0.92* 0.93* 1 0.92* 0.92* 0.89* 0.92* Kolkata 0.94* 0.95* 0.95* 0.92* 1 0.94* 0.95* 0.94* Lasalgaon 0.92* 0.93* 0.94* 0.92* 0.94* 1 0.89* 0.93* Mumbai 0.95* 0.94* 0.94* 0.89* 0.95* 0.89* 1 0.93* Nasik 0.94* 0.93* 0.93* 0.92* 0.94* 0.93* 0.93* 1
* indicates the significance of Spearman’s correlation coefficient at one per cent level of probability. Table 4. Estimates of ADF test for unit root and lag length based on Akaike Information Criterion (AIC).
Market Level series 1st differenced series
ADF statistic AIC lag length ADF statistic AIC lag length
Bangalore -1.64 13 -3.15* 17 Chennai -1.39 5 -12.95* 4 Delhi -2.14 15 -4.20* 14 Jaipur -1.44 4 -16.47* 3 Kolkata -2.08 16 -3.78* 16 Lasalgaon -2.67 17 -9.05* 7 Mumbai -1.83 15 -4.05* 14 Nasik -2.62 17 -3.84* 17
* indicate significance at one per cent level of MacKinnon (1996) one-sided p-values. (Bangalore) and 0.1761 for market 2 (Chennai). This indicated the speed at which Chennai and Bangalore prices adjust towards the equilibrium in case of any price shocks in other markets. In other words, the coefficient measures the ability of the prices to incorporate shocks or price news available in the market. In this case, Chennai and Bangalore markets absorb 17.61 and 14.67% respectively to bring about the equilibrium in prices. The information flow is more in Chennai market as evident by the magnitude of the coefficient (0.1761).
Hence Chennai is more efficient than the Bangalore market in terms of reaction to news on price. Similar kind of interpretation can be done for rest of the markets. Law of one price (LOOP) Trace tests showed one co-integrating vector for all the selected markets, the number of common stochastic trends turned out to be one for these markets (Table 7).

2980 Afr. J. Agric. Res.
Table 5. Estimates of Johansen’s multivariate co-integration test.
Data period : 6/01/2010 to 24/03/2011 Included observations : 443 after adjustments Trend assumption : Linear deterministic trend Lag length : 1 to 4 Markets: Lasalgaon, Mumbai, Delhi, Chennai, Jaipur, Kolkata, Nasik and Bangalore
Null Hypothesis Eigen Value Trace Statistic Critical Value at 5 % Significance**
r = 0* 0.1418 250.5196 159.5297 0.0000 r ≤ 1* 0.1248 182.7667 125.6154 0.0000 r ≤ 2* 0.0918 123.7211 95.7537 0.0002 r ≤ 3* 0.0708 81.0821 69.8189 0.0048 r ≤ 4* 0.0611 48.5636 47.8561 0.0428 r ≤ 5 0.0230 20.6124 29.7971 0.3822 r ≤ 6 0.0178 10.3184 15.4947 0.2570 r ≤ 7 0.0053 2.3651 3.8415 0.1241
Trace test indicates five co-integrating equation(s) at the 0.05 level, * denotes rejection of the hypothesis at the 0.05 level and ** shows the MacKinnon-Haug-Michelis (1999) probability values.
Table 6. Estimates of Johansen’s bivariate co-integration analysis and error correction model.
Markets Null hypothesis H0: rank= r Eigen Value
Trace Statistic
Error-correction estimates Log Likelihood
Market 1 Market 2
Bangalore and Chennai r = 0* 0.1284 62.81 -0.1467 0.1761
846.75 r ≤ 1 0.0034 1.54 (0.0322) (0.0308)
Bangalore and Delhi r = 0* 0.0671 31.86 -0.1058 0.0547
1023.70 r ≤ 1 0.0019 0.87 (0.0260) (0.0162)
Bangalore and Jaipur r = 0* 0.0645 31.72 -0.0237 0.0935
845.51 r ≤ 1 0.0045 1.99 (0.0204) (0.0186)
Bangalore and Kolkata r = 0* 0.0744 35.00 -0.1286 0.0589
903.85 r ≤ 1 0.0012 0.53 (0.0262) (0.0217)
Bangalore and Lasalgaon
r = 0* 0.0554 26.84 -0.0748 0.0601 869.87
r ≤ 1 0.0032 1.44 (0.0222) (0.0198)
Bangalore and Mumbai r = 0* 0.0884 42.58 -0.1623 0.0403
889.69 r ≤ 1 0.0030 1.32 (0.0271) (0.0241)
Bangalore and Nasik r = 0* 0.0816 39.52 -0.1059 0.0878
905.98 r ≤ 1 0.0035 1.56 (0.0260) (0.0211)
Chennai and Delhi r = 0* 0.0628 29.87 -0.0372 0.1131
1047.68 r ≤ 1 0.0021 0.95 (0.0170) (0.0260)
Chennai and Jaipur r = 0* 0.0643 31.67 -0.0264 0.1042
869.46 r ≤ 1 0.0045 2.02 (0.0223) (0.0207)
Chennai and Kolkata r = 0* 0.0873 41.29 -0.1577 0.0589
926.13 r ≤ 1 0.0013 0.57 (0.0282) (0.0245)

Sendhil et al. 2981
Table 6. Contd.
Chennai and Lasalgaon r = 0* 0.0668 32.37 -0.1050 0.0568
895.30 r ≤ 1 0.0034 1.51 (0.0245) (0.0231)
Chennai and Mumbai r = 0* 0.1163 56.58 -0.2010 0.0263
913.85 r ≤ 1 0.0032 1.44 (0.0279) (0.0262)
Chennai and Nasik r = 0* 0.1040 50.48 -0.1502 0.0810
929.34 r ≤ 1 0.0033 1.49 (0.0266) (0.0229)
Delhi and Jaipur r = 0* 0.1295 63.16 0.019416 0.2086
1071.86 r ≤ 1 0.0029 1.31 (0.0185) (0.0258)
Delhi and Kolkata r = 0* 0.0376 17.53 -0.0417 0.0573
1110.60 r ≤ 1 0.0010 0.44 (0.0152) (0.0200)
Delhi and Lasalgaon r = 0* 0.0564 26.73 -0.0517 0.0589
1079.69 r ≤ 1 0.0019 0.84 (0.0142) (0.0204)
Delhi and Mumbai r = 0* 0.0730 34.78 -0.0856 0.0422
1096.76 r ≤ 1 0.0022 0.99 (0.0163) (0.0232)
Delhi and Nasik r = 0* 0.0692 33.07 -0.0676 0.0653
1113.10 r ≤ 1 0.0024 1.08 (0.0156) (0.0208)
Jaipur and Kolkata r = 0* 0.0459 21.91 -0.0764 -0.0051
933.67 r ≤ 1 0.0021 0.95 (0.0167) (0.0149)
Jaipur and Lasalgaon r = 0* 0.0466 23.24 -0.0745 0.0007
917.81 r ≤ 1 0.0044 1.98 (0.0163) (0.0166)
Jaipur and Mumbai r = 0* 0.0573 28.72 -0.0838 -0.0130
915.30 r ≤ 1 0.0053 2.39 (0.0162) (0.0153)
Jaipur and Nasik r = 0* 0.0531 26.98 -0.0808 0.0126
935.57 r ≤ 1 0.0059 2.65 (0.0174) (0.0155)
Kolkata and Lasalgaon r = 0* 0.0650 30.62 -0.0680 0.0752
977.34 r ≤ 1 0.0014 0.64 (0.0207) (0.0228)
Kolkata and Mumbai r = 0* 0.0907 43.26 -0.1354 0.0699
985.05 r ≤ 1 0.0019 0.83 (0.0233) (0.0250)
Kolkata and Nasik r = 0* 0.0775 36.79 -0.0867 0.0934
998.14 r ≤ 1 0.0018 0.81 (0.0227) (0.0229)
Lasalgaon and Mumbai r = 0* 0.0483 23.61 -0.0882 0.0291
971.87 r ≤ 1 0.0035 1.55 (0.0232) (0.0218)
Lasalgaon and Nasik r = 0* 0.1057 51.56 -0.1459 0.1225
989.30 r ≤ 1 0.0039 1.74 (0.0310) (0.0273)

2982 Afr. J. Agric. Res.
Table 6. Contd.
Mumbai and Nasik r = 0* 0.0683 32.92 -0.0510 0.0976
979.78 r ≤ 1 0.0030 1.36 (0.0227) (0.0212)
* denotes rejection of the null hypothesis at 5 % level of MacKinnon-Haug-Michelis (1999) probability values. The critical value for rejecting the null hypothesis at 5% , H0: r=0 is 15.49 and r ≤ 1is 3.81. Figures in parenthesis indicate the standard errors.
Table 7. LOOP analysis for onion markets.
Markets Null hypothesis
H0: rank= r Number of co-integrated vectors Number of stochastic trends LOOP
Bangalore and Chennai r = 0* 1 1
Yes r ≤ 1 1 1
Bangalore and Delhi r = 0* 1 1
Yes r ≤ 1 1 1
Bangalore and Jaipur r = 0* 1 1
Yes r ≤ 1 1 1
Bangalore and Kolkata r = 0* 1 1
Yes r ≤ 1 1 1
Bangalore and Lasalgaon r = 0* 1 1
Yes r ≤ 1 1 1
Bangalore and Mumbai r = 0* 1 1
Yes r ≤ 1 1 1
Bangalore and Nasik r = 0* 1 1
Yes r ≤ 1 1 1
Chennai and Delhi r = 0* 1 1
Yes r ≤ 1 1 1
Chennai and Jaipur r = 0* 1 1
Yes r ≤ 1 1 1
Chennai and Kolkata r = 0* 1 1
Yes r ≤ 1 1 1
Chennai and Lasalgaon r = 0* 1 1
Yes r ≤ 1 1 1
Chennai and Mumbai r = 0* 1 1
Yes r ≤ 1 1 1
Chennai and Nasik r = 0* 1 1
Yes r ≤ 1 1 1
Delhi and Jaipur r = 0* 1 1
Yes r ≤ 1 1 1

Sendhil et al. 2983 Table 7. Contd.
Delhi and Kolkata r = 0* 1 1
Yes r ≤ 1 1 1
Delhi and Lasalgaon r = 0* 1 1
Yes r ≤ 1 1 1
Delhi and Mumbai r = 0* 1 1
Yes r ≤ 1 1 1
Delhi and Nasik r = 0* 1 1
Yes r ≤ 1 1 1
The number of common stochastic trends was determined by subtracting the number of co-integrating vectors from the dimension of the impact matrix given by the number of variables (n) included in the co-integration test. The findings of n - 1 co-integrating vectors implied that all the prices contain the same stochastic trend and so they are co-integrated in pairs. This suggested that the LOOP holds true for the onion markets across India. Conclusions The study of past price behavior and price co-movement in major onion markets in India conclusively support the existence of an integrated market in the commodity. Several conclusions follow from this result. Price transmission occurs between geographically separated markets in onion due to market information flow through diverse channels.
However, the speed of convergence of onion prices to equilibrium depends on the speed of information dissemination, the government’s control over the commodity, time-to-time regulations and policy harmonisation within the regions of the country. One of the reasons for market integration is the efficient functioning of markets itself which is clearly evident from the realisation of law of one price. Therefore, commodity based analysis on marketing integration and market research are better suited to understand the price behaviour of different agricultural commodities. This kind of studies is equally important as they provide policy makers with better information on expected market behaviour which will enable the decision making process on resource allocation. More resources should be allocated to those markets having a higher degree of integration and market efficiency. This will help in enhancing the overall efficiency of the marketing function in agricultural commodities and reduce market distortions.
Conflict of Interest The authors have not declared any conflict of interest. REFERENCES Anuja AR, Amit K, Jha GK, Rakesh K (2013). Price dynamics and
market integration of natural rubber under major trade regimes of India and abroad. Ind. J. Agric. Sci. 83(5):555-560.
Brosig S, Glauben T, Gotz L, Weitzel E, Bayaner A (2011). The Turkish wheat market: Spatial price transmission and the impact of transaction costs. Agribuss 27(2):147-161. http://dx.doi.org/10.1002/agr.20257
Cuddy JDA, Della-Valle PA (1978). Measuring the instability of time series data. Oxf. Bull. Eco. Stat. 40(1):79-85. http://dx.doi.org/10.1111/j.1468-0084.1978.mp40001006.x
Cummings RW (1967). Pricing Efficiency in the Indian Wheat Market. Impex India, New Delhi.
Engle RF, Granger CWJ (1987). Cointegration and error-correction: Representation, estimation and testing. Econometrica 55:251-276. http://dx.doi.org/10.2307/1913236
Goodwin BK, Schroeder TC (1991). Cointegration tests and spatial price linkages in regional cattle markets. Am. J. Agric. Econ. 73:452-64. http://dx.doi.org/10.2307/1242730
Granger C (1981). Some properties of time series data and their use in econometric model specification. J. Econ. 16:121-130. http://dx.doi.org/10.1016/0304-4076(81)90079-8
Johansen S (1988). Statistical analysis of cointegration vectors. J. Eco. Dyn. Control 12:231-254. http://dx.doi.org/10.1016/0165-1889(88)90041-3
Johansen S (1991). Estimation and hypothesis testing of cointegration vectors in Gaussian vectors auto regression models. Econometrica 59:51-80. http://dx.doi.org/10.2307/2938278
Johansen S (1994). The role of the constant and linear terms in cointegration analysis of nonstationary variables. Econom. Rev. 13:205-229. http://dx.doi.org/10.1080/07474939408800284
Johansen S (1995). Likelihood-based Interference in Cointegrated Vector Autoregressive Models. Oxford: Oxford University Press. http://dx.doi.org/10.1093/0198774508.001.0001
Johansen S, Juselius K (1990). Maximum likelihood estimation and inference on cointegration with applications to the demand for money. Oxf. Bultn. Econ. Stat. 52(2):169-210. http://dx.doi.org/10.1111/j.1468-0084.1990.mp52002003.x
Kumar P, Sharma RK (2003). Spatial price integration and price efficiency at farm level: A study of paddy in Haryana. Ind. J. Agric. Econ. 58(2):201-217.

2984 Afr. J. Agric. Res. Lele UJ (1967). Market integration: A study of sorghum prices in
western India. J. Farm. Econ. 49:147-159. http://dx.doi.org/10.2307/1237074
Lele UJ (1971). Food Grain Marketing in India: Private Performance and Public Policy. Cornell University Press, Ithaca, New York. PMCid:PMC2008758
Moodley D, Kerr WA, Gordon DV (2000). Has the Canada - US trade agreement fostered price integration?. Rev Weltwirtschaftliches Arch. 136:334-354. http://dx.doi.org/10.1007/BF02707691
Nayyar D (2011). The great onion coverup - Special report on onion. India Today 1:29-33.
Reddy BS, Chandrashekhar SM, Dikshit AK, Manohar NS (2012). Price trend and integration of wholesale markets for onion in metro cities of India. J. Econ. Sust. Dev. 3(7):120-129.
Reuters (2013). Wholesale onion price jumps 5-times; To push up retail rates. NDTV Profit published on July 17, 2013. Retrieved on 20.07.2013 from http://profit.ndtv.com/news/economy/article-wholesale-onion-price-jumps-5-times-to-push-up-retail-rates-324600.
Sendhil R (2012). Production and export performance of onions – An
exploratory study. Agric. Sitn. Ind. 69(7):355-362. Sidhu RS, Sanjay K, Kamal V, Parminder S (2010). Supply chain
analysis of onion and cauliflower in Punjab. Agric. Econ. Res. Rev. 23:445-453.
Yogisha GM, Karnool NN, Vijayakumar HS, Basavaraja H (2006). Market integration for major agricultural commodities in Kolar district, Karnataka. J. Agric. Sci. 19(4):857-861.