Testing Established Models of Hydrothermal Fluid ... · By examining ancient hydrothermal fluids...
212
UNLV eses, Dissertations, Professional Papers, and Capstones 12-1-2015 Testing Established Models of Hydrothermal Fluid Distribution Around Porphyry Deposits: e Application of Fluid Inclusion Research to Porphyry Deposit Exploration Wya Moyer Bain University of Nevada, Las Vegas, [email protected] Follow this and additional works at: hp://digitalscholarship.unlv.edu/thesesdissertations Part of the Geology Commons is esis is brought to you for free and open access by Digital Scholarship@UNLV. It has been accepted for inclusion in UNLV eses, Dissertations, Professional Papers, and Capstones by an authorized administrator of Digital Scholarship@UNLV. For more information, please contact [email protected]. Repository Citation Bain, Wya Moyer, "Testing Established Models of Hydrothermal Fluid Distribution Around Porphyry Deposits: e Application of Fluid Inclusion Research to Porphyry Deposit Exploration" (2015). UNLV eses, Dissertations, Professional Papers, and Capstones. 2596. hp://digitalscholarship.unlv.edu/thesesdissertations/2596
Transcript of Testing Established Models of Hydrothermal Fluid ... · By examining ancient hydrothermal fluids...
UNLV Theses, Dissertations, Professional Papers, and Capstones
12-1-2015
Testing Established Models of Hydrothermal FluidDistribution Around Porphyry Deposits: TheApplication of Fluid Inclusion Research toPorphyry Deposit ExplorationWyatt Moyer BainUniversity of Nevada, Las Vegas, [email protected]
Follow this and additional works at: http://digitalscholarship.unlv.edu/thesesdissertations
Part of the Geology Commons
This Thesis is brought to you for free and open access by Digital Scholarship@UNLV. It has been accepted for inclusion in UNLV Theses, Dissertations,Professional Papers, and Capstones by an authorized administrator of Digital Scholarship@UNLV. For more information, please [email protected].
Repository CitationBain, Wyatt Moyer, "Testing Established Models of Hydrothermal Fluid Distribution Around Porphyry Deposits: The Application ofFluid Inclusion Research to Porphyry Deposit Exploration" (2015). UNLV Theses, Dissertations, Professional Papers, and Capstones.2596.http://digitalscholarship.unlv.edu/thesesdissertations/2596

TESTING ESTABLISHED MODELS OF HYDROTHERMAL FLUID DISTRIBUTION
AROUND PORPHYRY DEPOSITS: THE APPLICATION OF FLUID INCLUSION
RESEARCH TO PORPHYRY DEPOSIT EXPLORATION
By
Wyatt M. Bain
Bachelor of Science – Geology and Geophysics
University of Wisconsin, Madison
2011
A thesis submitted in partial fulfillment
of the requirements for the
Masters of Science – Geoscience
Department of Geoscience
College of Science
The Graduate College
University of Nevada, Las Vegas
December 2015

Copyright by Wyatt M. Bain, 2015
All Right Reserved

ii
Thesis Approval
The Graduate College
The University of Nevada, Las Vegas
August 6, 2015
This thesis prepared by
Wyatt M. Bain
entitled
Testing Established Models of Hydrothermal Fluid Distribution around Porphyry
Deposits: The Application of Fluid Inclusion Research to Porphyry Deposit Exploration
is approved in partial fulfillment of the requirements for the degree of
Master of Science – Geoscience
Department of Geosciences
Jean S. Cline, Ph.D. Kathryn Hausbeck Korgan, Ph.D. Examination Committee Chair Graduate College Interim Dean
Rodney V. Metcalf, Ph.D. Examination Committee Member
Minghua Ren, Ph.D. Examination Committee Member
Barbara Luke, Ph.D. Graduate College Faculty Representative

iii
ABSTRACT
Testing Established Models of Hydrothermal Fluid Distribution Around Porphyry Deposits: The
Application of Fluid Inclusion Research to Porphyry Deposit Exploration
By
Wyatt M. Bain
Dr. Jean S. Cline, Examination Committee Chair
Professor
University of Nevada, Las Vegas
The Kabba porphyry copper prospect in northwestern Arizona contains two zones of
porphyry style mineralization and alteration, which are spatially separated by a north-south
trending normal fault. These two zones are referred to as the Kabba footwall and hanging wall
and are hypothesized to represent the root and intermediate depth levels of the same porphyry-
like hydrothermal system, respectively. If this hypothesis is correct, then fluid inclusions found
in the hanging wall and footwall should have the physical and chemical characteristics of fluid
inclusions in the root and intermediate depth levels of other known porphyry deposits.
Vein and alteration petrography, fluid inclusion petrography and microthermometry, and Raman
and LA-ICP-MS analyses of individual fluid inclusions from Kabba footwall and hanging wall
samples lead to the following observations: 1) the textures and paragenetic sequence of alteration
and mineralization in the Kabba hanging wall is almost identical to the textures and paragenetic
sequence of alteration and mineralization in the footwall, 2) the mineralization and alteration in

iv
the Kabba prospect is consistent with the footwall and hanging wall having formed in the deep
roots and intermediate zones to a porphyry-like hydrothermal system, respectively, 3) the
distribution of fluid inclusion types in the footwall and hanging wall broadly matches the
distribution of fluid inclusion types in the deep roots and intermediate zones of other porphyry
systems, 4) the chemical and physical conditions of fluid inclusions in the Kabba system are very
similar to the chemical and physical conditions of fluid inclusions in the Butte porphyry system
in Montana, 5) Cu concentrations in fluid inclusions from Kabba are highest in inclusions with
the lowest Sr, Rb, and Ba, and 6) Cu concentrations were consistently high in vapor-rich fluid
inclusions. These observations strongly suggest that the mineralization and alteration in the
Kabba system formed at great depth in a porphyry-like hydrothermal system, and that the
hanging wall and footwall represent the root and intermediate depth levels of that system. Based
on the microthermometric behavior of fluid inclusions from the hanging wall and footwall it is
interpreted that, 1) the mineralization and alteration in the Kabba system formed via 5 episodes
of hydrothermal fluid flux through the footwall and hanging wall, 2) immiscibility may have
played a role in forming the mineralization in the hanging wall, 3) fluids went from being H2O-
to CO2-rich over time, 4) the Kabba footwall and hanging wall formed at pressures between
2500-3000 bars (10-12 km) and 1500-2000 bars (6-8 km), respectively, 6) fluids in the footwall
and hanging wall were trapped between <300-545°C and <300-525°C, respectively, and 7)
additional drilling in the Kabba prospect should focus on the hanging wall area, around the
flanks of the aeromagnetic anomaly to the northeast and northwest of drill hole K-10, as this area
is in indicated to contain the mineralized portion of a porphyry-like hydrothermal system.

v
TABLE OF CONTENTS
ABSTRACT ................................................................................................................................... iii
LIST OF TABLES ........................................................................................................................ vii
LIST OF FIGURES ..................................................................................................................... viii
CHAPTER 1:INTRODUCTION .....................................................................................................1
CHAPTER 2: BACKGROUND ......................................................................................................4
Porphyry Deposits ........................................................................................................................4
The Kabba Prospect ..................................................................................................................12
CHAPTER 3: METHODS ............................................................................................................17
Sample Selection and Fieldwork: Hanging Wall .......................................................................17
Sample Selection and Fieldwork: Footwall ...............................................................................17
Doubly Polished Thick Section Sample Selection .....................................................................18
Conventional Petrographic Analysis .........................................................................................18
Scaning Electron Microscope-Energy Dispersive Spectroscopy (SEM-EDS)/
Cathodaluminescence (SEM-CL) Analysis ................................................................................19
Microthermometry ......................................................................................................................20
Raman Analysis ..........................................................................................................................20
Laser Ablation-Inductively Coupled Plasma-Mass Spectrometry (LA-ICP-MS) ......................21
CHAPTER 4: VEINS AND ALTERATION ...............................................................................22
Host Rocks: Footwall .................................................................................................................22
Vein Assemblages: Footwall ......................................................................................................22
Veins: Footwall ..........................................................................................................................25
Host Rocks: Hanging Wall .........................................................................................................26
Vein Assemblages: Hanging Wall ..............................................................................................27
Veins: Hanging Wall ..................................................................................................................30
A Veins ...............................................................................................................................30
B Veins ..............................................................................................................................32
D Veins ...............................................................................................................................33
Alteration in Footwall and Hanging Wall Rocks .......................................................................34
Potassic Alteration .............................................................................................................34

vi
Green Mica Alteration ......................................................................................................35
Coarse Mica Alteration......................................................................................................36
Vein and Alteration Interpretation: Footwall ............................................................................37
Vein and Alteration Interpretation: Hanging Wall ....................................................................39
CHAPTER 5: FLUID INCLUSION PETROGRAPHY AND ANALYSIS ................................42
Fluid Inclusion Assemblages (FIAs) ..........................................................................................42
Fluid Inclusion Group Assignment and Notation ......................................................................43
Fluid Inclusion Group: Footwall ...............................................................................................44
Fluid Inclusion Group: Hanging Wall .......................................................................................46
Fluid Inclusion Group Distribution ...........................................................................................50
Microthermometric Evaluation of CO2 Content ........................................................................51
Raman Analysis ..........................................................................................................................52
Microthermometry: Application .................................................................................................55
Microthermometry: Footwall .....................................................................................................57
Microthermometry: Hanging Wall .............................................................................................58
CHAPTER 6: LA-ICP-MS ...........................................................................................................65
LA-ICP-MS Results: Footwall ...................................................................................................66
LA-ICP-MS Results: Hanging Wall ...........................................................................................70
Patterns and Interpretation of LA-ICP-MS Data ......................................................................84
CHAPTER 7: DISCUSSION AND INTERPRETATION ...........................................................88
CHAPTER 8: CONCLUSION ...................................................................................................101
APPENDICES ............................................................................................................................137
APPENDIX A HANGING WALL SAMPLES AND ANALYSIS .........................................137
APPENDIX B FOOTWALL SAMPLES AND ANALYSIS .................................................139
APPENDIX C HANGING WALL HAND SAMPLE AND DESCRIPTIONS .....................142
APPENDIX D FOOTWALL HAND SAMPLE AND DESCRIPTIONS ..............................148
APPENDIX E MICROTHERMOMETRIC OBSERVATIONS AND DATA ......................158
APPENDIX F UNPROCESSED LA-ICP-MS DATA ............................................................177
APPENDIX G SUMMARY OF LA-ICP-MS DATA ............................................................194
REFERENCES ...........................................................................................................................198 CURRICULUM VITAE .............................................................................................................202

vii
LIST OF TABLES
Table 1. Footwall Sulfide and Oxide Mineral Characteristics ...................................................104
Table 2. Vein Types ....................................................................................................................105
Table 3. Comparison Between AB and ANB Veins .....................................................................106
Table 4. Hanging Wall Sulfide and Oxide Mineral Characteristics ...........................................107
Table 5. Mineral Paragenisis for the Hanging Wall ...................................................................108
Table 6. Mineral Paragenisis for the Footwall ............................................................................109
Table 7. Interpretation of Fluid Evolution From the Footwall to the Hanging Wall and the
Formation of Mineralization in Each Area .....................................................................110
Table 8. Microthermometric Properties of Fluid Inclusions ......................................................111
Table 9. Raman Spectroscopy Data ...........................................................................................112
Table 10. Summary of Relative Abundances of Elements Within Inclusion Groups .................113
Table 11. Summary of Hanging Wall and Footwall Isochors .....................................................114

viii
LIST OF FIGURES
Figure 1. Global distribution of porphyry copper deposit ........................................................115
Figure 2. Distribution of porphyry copper deposit throughout Arizona ....................................116
Figure 3. Porphyry deposit formation and characteristics .........................................................117
Figure 4. Schematic chronology of A, B and D veins in a typical Cu-Mo porphyry deposit ...118
Figure 5. Fluid inclusion assemblage distribution model for the Butte porphyry deposit ........119
Figure 6. Satellite photo of Maynard District and Kabba Prospect ...........................................120
Figure 7. Geologic map of the hanging wall and footwall ........................................................121
Figure 8. Satellite photo of Mineral Park and Bagdad porphyry copper deposits, and the Kabba
hanging wall and footwall ...............................................................................................122
Figure 9. Interpreted east-west cross section through the Kabba hanging wall and footwall. .123
Figure 10. Aeromagnetic map of the Kabba hanging wall and footwall ....................................124
Figure 11. Seismic reflection data from the Kabba prospect ......................................................125
Figure 12. Satellite photo of the Kabba footwall and hanging wall area ....................................126
Figure 13. Satellite photo of drill hole K-10 and individual sampling locations from the Kabba
footwall ...........................................................................................................................127
Figure 14. Scanning electron microscope cathodoluminescence (SEM-CL) images of hanging
wall and footwall samples ...........................................................................................................128
Figure 15. Photomicrograph of footwall sulfides, oxides, and silicate minerals .........................129
Figure 16. Scanned images of selected thick sections showing vein types from the footwall and
hanging wall. ....................................................................................................................130
Figure 17. Photomicrograph of hanging wall sulfides , oxides, and silicate minerals ...............131
Figure 18. Photomicrographs of individual fluid inclusions from the nine inclusion groups found
in the Kabba hanging wall and footwall .........................................................................132
Figure 19. Abundance of fluid inclusion (FI) types in the hanging wall and footwall ................133
Figure 20. Bar charts showing range in homogenization temperatures for hanging wall and
footwall groups ................................................................................................................134
Figure 21. Isochors for B15D, B30, and B15C inclusions from the footwall. ............................135
Figure 22. Isochors for B15, B30D, B30H, B75, B20C, and B75C inclusions from the hanging
wall ..................................................................................................................................136

1
CHAPTER 1
INTRODUCTION
Porphyry deposits are the source of ~60% of the world’s copper (John et al., 2010), and a
major source of the world’s lead, zinc, tungsten, tin, gold, and silver. Because of their status as a
major source of mineral resources, these deposits are critically important to supplying the raw
material needed to grow and sustain global economies, and their discoveries create economic
opportunities in many regions around the world. The American cordillera is one such region,
being particularly well-endowed with these deposits (Figure 1), and the southwestern United
States, particularly Arizona, is a premier region for porphyry exploration in North American
(Figure 2). Exploration and production from porphyry deposits in Arizona is a major source of
income and economic opportunity in the Southwestern US and this underscores the importance
of understanding how these mineral resources form and developing techniques which can
efficiently locate and characterize these deposits in the Earth’s crust.
Fluid inclusion research is an important method for understanding how porphyry and
other ore systems formed and evolved through time. By examining ancient hydrothermal fluids
trapped in fluid inclusions in porphyry environments we can identify patterns of pressure,
temperature, and ore fluid chemistry across hydrothermal systems and characterize how the
hydrothermal fluids evolved as they migrated from depth and into the shallow crust of the Earth.
In the past 20 years our ability to analyze fluid inclusions has grown dramatically with the advent
of sophisticated analytical techniques, particularly LA-ICP-MS (Ulrich et al, 2011), that allow us
to quantify the compositions of fluids in fluid inclusions. Recent research has combined LA-ICP-
MS analysis with detailed fluid inclusions petrography and microthermometry, and this work has
led to the development of fluid inclusion distributions models that show typical three-

2
dimensional patterns of fluid inclusion compositions and distributions throughout porphyry
systems (Reynolds and Beane, 1985; Ulrich et al., 2001; Rusk et al., 2008; Landtwing et al.,
2010). These patterns involve fluids evolving from high temperature, pressure, and density at
depth, to low temperature, pressure, and density as they move upward and outward through a
porphyry system. Because this pattern is common to many porphyry systems, fluid inclusion
distribution models should have predictive capabilities applicable to resource exploration. If
these fluid inclusion distribution models can be successfully applied to porphyry exploration,
then fluid inclusion research and established fluid inclusion distribution models will constitute an
additional tool that can aid exploration geologists as they search for new mineral resources.
The thesis presented herein tests the predictive power of established fluid inclusion distribution
models by using them to understand the Kabba porphyry copper prospect in Northwestern
Arizona. This prospect contains two structurally separated areas of porphyry style alteration and
mineralization, which are hypothesized to represent the deep roots and intermediate depth zones
of a single porphyry system. If this hypothesis is correct, and if Kabba represents a porphyry
system, then fluid inclusions found in these areas of porphyry-style alteration and mineralization
should have the physical and chemical characteristics of fluid inclusions found in the root and
intermediate depth zones of other known deposits, as predicted by the models. In order to test
this hypothesis, vein and alteration petrography, fluid inclusion petrography and
microthermometry, and Raman and LA-ICP-MS analyses of individual fluid inclusions were
integrated and compared to established fluid inclusions distribution models. Based on this
comparison, the alteration, mineralogy, and fluid inclusions types found in the Kabba system are
consistent with the presence of a porphyry system and do support the faulted porphyry system
hypothesis. These results and the data collected from the Kabba prospect are presented and

3
discussed in the following chapters.

4
CHAPTER 2
BACKGROUND
Porphyry Deposits
Porphyry deposits are large concentrically zoned systems of hydrothermally altered
igneous rock that contain abundant sulfide and oxide minerals which are rich in base and
precious metals (Lowell and Guilbert, 1970; Gustafson and Hunt, 1975; Hedenquist and
Lowenstern, 1994; Sillitoe 2010) (Figure 3 A). Most porphyry deposits are hosted by intrusive
igneous rocks that typically range in character from intermediate to felsic, and typical porphyry
systems have a genetic association with intermediate calc-alkaline porphyritic rocks. Most
models of porphyry deposit formation describe a process which begins with a reservoir of
andesitic magma forming above a subduction zone and rising into a highly-fractured zone in the
upper crust, such as a pull-apart jog or a restraining bend in a transform fault (Figure 3 B), where
it begins to slowly cool and crystalize at depth (Lowell and Guilbert, 1970; Guilbert, 1986;
Sillitoe, 2010; Cloos and Sepiie, 2013). As the andesitic magma cools it forms a water-saturated
carapace around its outer margins and becomes saturated in volatiles including H2O and minor
amounts of CO2 (Figure 3 C). These volatiles, particularly H2O, can contain high concentrations
of ions such as Cl- and HS-, which complex with metal ions such as Cu+, Mo+, Zn+, Pb+, and Sn+
and, as the volatiles become saturated in the melt, the complexing ions efficiently extract metal
ions from the parental andesitic magma (Cline and Bodnar, 1991). After the andesitic magma
becomes saturated in hot, metal-rich fluids it buoyantly rises and forms an elevated dome-shaped
cupola of H2O-saturated magma under the roof of the magma chamber (Figure 3 B, C), (Cloos
and Sepiie, 2013). Eventually the cupola will become over pressured and will rupture, causing
the hot metal-rich fluids to exsolve from the magma and vent upward and outward into the
5
igneous country rock above the magma chamber. As the fluids move away from the magma
chamber they are focused into low pressure pathways in the subsurface, such as faults, and the
fluid pressure on the country rock above the magma chamber increases. This increased fluid
pressure causes the formation of hydraulic fractures in the country rock. As the fluids in
hydraulic fractures continue to rise, the metal-rich fluids cool, depressurize, react with the
country rock, and precipitate sulfide, oxide, and silicate minerals. As the minerals fill fractures
they form abundant veins, which are common in porphyry systems, and as the fluids react with
the wall rocks, they form the concentric zones of alteration that are the hallmark of porphyry
deposits around the world (Lowell and Guilbert, 1970; Guilbert, 1986; Sillitoe, 2010; Cloos and
Sepiie, 2013).
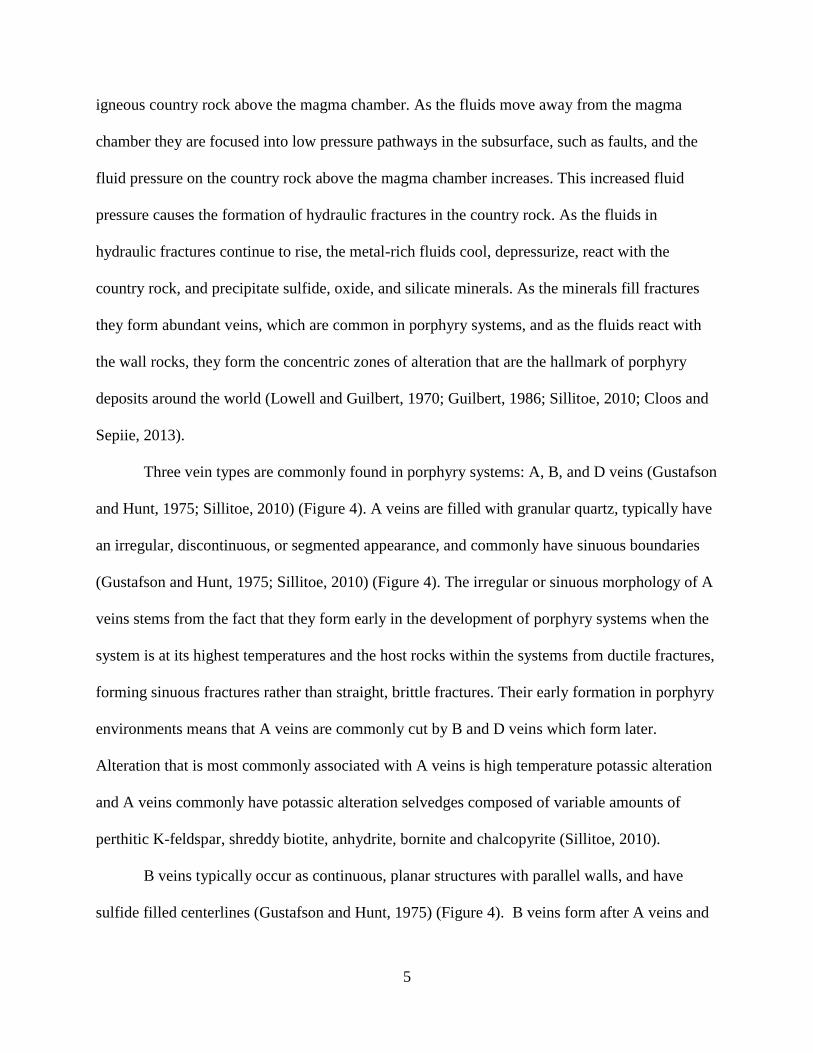
Three vein types are commonly found in porphyry systems: A, B, and D veins (Gustafson
and Hunt, 1975; Sillitoe, 2010) (Figure 4). A veins are filled with granular quartz, typically have
an irregular, discontinuous, or segmented appearance, and commonly have sinuous boundaries
(Gustafson and Hunt, 1975; Sillitoe, 2010) (Figure 4). The irregular or sinuous morphology of A
veins stems from the fact that they form early in the development of porphyry systems when the
system is at its highest temperatures and the host rocks within the systems from ductile fractures,
forming sinuous fractures rather than straight, brittle fractures. Their early formation in porphyry
environments means that A veins are commonly cut by B and D veins which form later.
Alteration that is most commonly associated with A veins is high temperature potassic alteration
and A veins commonly have potassic alteration selvedges composed of variable amounts of
perthitic K-feldspar, shreddy biotite, anhydrite, bornite and chalcopyrite (Sillitoe, 2010).
B veins typically occur as continuous, planar structures with parallel walls, and have
sulfide filled centerlines (Gustafson and Hunt, 1975) (Figure 4). B veins form after A veins and

6
after the porphyry system has cooled enough to allow for the formation of straight, brittle
fractures. The centerlines of B veins form as the result of reopening of these veins or incomplete
filling of the veins originally, along their long axis followed by precipitation of younger
generations of quartz, sulfides, or alteration minerals (Gustafson and Hunt, 1975). Where filled
with sulfides, the center lines typically contain chalcopyrite and pyrite. Also, phyllic, propylitic,
and/or moderate potassic alteration selvedges are commonly observed around the margins of B
veins.
D veins are typically narrow (<2-20 mm in width), continuous, systematically oriented
structures filled entirely with sulfides (Figure 4). The dominant sulfide found in D veins is pyrite,
but D veins commonly also contain minor chalcopyrite, bornite, enargite, sphalerite and galena.
D veins form along with B veins and can commonly crosscut, or be crosscut by B veins.
Conversely, D veins cut A veins but are typically not cut by A veins. D veins can be associated
with alteration and commonly have selvedges composed of phyllic alteration minerals or sericite-
chlorite.
The typical types of alteration associated with porphyry deposits (potassic, propylitic,
phyllic, and argillic) occur in a roughly “light bulb” shaped or telescoping pattern in which
different alteration types occur along side or partly overlapping one another (Lowell and
Guilbert, 1970; Gustafson and Hunt, 1975; Hedenquist and Lowenstern, 1994; Seedorff et al.,
2008; Sillitoe, 2010) (Figure 4). The spatial distribution of alteration types relative to one
another in a porphyry system is controlled by pressure and temperatures and chemical gradients,
which form around the igneous source of the hydrothermal fluids involved in the formation of
the porphyry deposit. As a result the different types of alteration found around porphyry deposits

7
will occur in relatively predictable locations, and this is an important aspect of porphyry deposits
because the recognition of alteration zones can be used to vector to sulfide ore in these systems.
Potassic alteration is found in the deep core of porphyry systems (Figure 3 A), is associated with
the highest temperature fluids, and is an early alteration type to form. This alteration is
characterized by alkali exchange, primarily K+ for Ca+ and Na+, and the replacement of primary
plagioclase with potassium feldspar, and primary pyroxene and amphibole with shreddy
secondary biotite (Sillitoe 2010). This alteration typically occurs as selvedges along the outer
margins of quartz veins and veinlets, and zones with this alteration are typically highly fractured
and commonly contain abundant chalcopyrite and bornite, with minor amounts of diginite, and
pyrite (Lowell and Guilbert, 1970; Seedorff et al.; 2008; Sillitoe, 2010).
Propylitic alteration is found on the periphery of porphyry systems, and is associated with
lower temperature, relative to potassic alteration, volatiles such as H2O and CO2 (Seedorff et al.,
2008) on the cooler outer edge of the system. This alteration type is associated with the
replacement of primary minerals with chlorite, epidote, and albite, and rocks that are
propylitically altered typically have a green color. The formation of propylitic alteration occurs
at the same time as potassic alteration, and potassic alteration typically grades outward
overprinting earlier propylitic alteration until the magmatic system begins to cool, at which time
propylitic alteration encroaches on and overprints potassic alteration towards the system center
(Lowell and Guilbert, 1970; Seedorff et al., 2008; Sillitoe, 2010).
Phyllic alteration commonly consists of an assemblage of quartz, sericite, and pyrite
(QSP), which typically overprints the highly fractured boundary between the propylitic and
potassic alteration zones, or is found directly above the potassic zone and grades upward into
argillic alteration. Phyllic alteration results from decreasing hydrothermal fluid temperature and

8
pH as the porphyry hydrothermal system cools, and is most abundant in areas with high fracture
densities. As fluids related to phyllic alteration cool below about 400°C, precipitation of copper
sulfide minerals (Lowell and Guilbert 1970; Seedorff et al., 2008; Sillitoe, 2010) occurs forming
ore zones within the phyllic alteration zone or along its contact between potassic and phyllic
alteration.
Phyllic alteration is also commonly associated with chlorite-sericite alteration, which
results from primary host rock plagioclase and biotite altering to chlorite, sericite, illite, and
hematite (Sillitoe et al., 2010). These alteration styles are closely related to each other, can
commonly be intermixed or form discrete zones adjacent to one another, and typically constitute
some or all of the ore zones found in porphyry systems (Sillitoe, 2010).
Advanced argillic alteration typically forms at the top of porphyry systems, distal from
the core of the system, and is characterized by the conversion of host rock plagioclase to
kaolinite, dickite, and pyrophyllite, the formation of a vuggy quartz lithocap, and the
precipitation of alunite at the top of porphyry systems. The presence of this alteration type in
porphyry systems is variable and is related to the formation of low temperature H+-rich vapor
that leaches the shallowest portions of porphyry systems.
Greisen alteration forms in the deepest parts of porphyry systems, commonly from 4-12
km depth to the base of major ore zones or below the potassic alteration zone, and is
characterized by the conversion of primary potassium feldspar and plagioclase to coarse-grained,
grey muscovite. This alteration type commonly occurs as selvedges of coarse muscovite along
the outer margins of quartz veins and occurs with or overprints deep potassic alteration (Stavast,
2006; Seedorff et al., 2008; Maher, 2008). Greisen is a hallmark of major feeder zones or large
hydrothermal conduits in the deepest parts of porphyry systems, through which voluminous

9
quantities of hydrothermal fluids pass as they rise into the upper crust (Stavast, 2006; Seedorff et
al., 2008; Maher 2008).
All models of porphyry deposit formation more or less outline how hydrothermal fluids
derived from magmas evolve and move up through the crust. To better understand this process
many studies have examined fluid inclusions associated with porphyry alteration and
mineralization. These studies, first, group fluid inclusions into assemblages based on common
spatial association and similar phase ratios indicating that they were all trapped at about the same
time (Goldstein and Reynolds, 1994), and then characterize inclusion assemblages relative to the
porphyry deposit in terms of their spatial distribution throughout the porphyry system. Resulting
fluid inclusion assemblage (FIA) distribution models have described porphyry systems that
formed at various paleodepths including shallow systems such as Santa Rita (Reynolds and
Beane, 1985) and Refugio (Muntean and Einaudi, 2000), intermediate depth systems such as
Bingham Canyon (Landtwing et al., 2010), Bajo de la Alumbrera (Ulrich et al., 2001), and Far
Southeast (Hedenquist et al., 1998), and deep systems such as Butte (Rusk et al., 2008) and
Endako (Selby et al., 2000) (Figure 5). These models are important to our understanding of fluid
evolution in porphyry systems and they illustrate a common pattern in the spatial distribution of
various types of FIAs relative to a system’s barren core and ore zones. This pattern is
characterized by a transition from high temperature and pressure, high salinity, aqueous
inclusions in the core of a porphyry system, to low temperature and pressure, moderate to low
salinity, vapor-rich inclusions in the intermediate and high level periphery of the system
(Reynolds and Beane, 1985; Hedenquist et al., 1998; Muntean and Einaudi, 2000; Selby et al.,
2000; Ulrich et al., 2001; Rusk et al., 2008; Landtwing et al., 2010). This pattern is described in
general below.

10
In the deep core of some typical porphyry systems, aqueous, low salinity fluids with ~20-
30% vapor dominate (Rusk et al., 2008). These fluids are not always encountered because they
reside in the deepest levels of porphyry systems and recorded the highest temperatures and
pressures in a porphyry environment. Because of their abundance in the deep levels of porphyry
systems, these fluids are widely recognized as parental fluids that exsolved from a magma, and
are thought to evolve into the fluids that are commonly found in the shallower levels of porphyry
environments.
Above the deep core of typical porphyry systems, at mid system levels, halite-saturated
inclusions coexist with vapor-rich inclusions, resulting from fluid immiscibility at ~400 – 700°C
and ~350 to 950 bars pressure. Salinities range from ~35 – 70 wt.% NaCl equivalent in halite-
bearing inclusions to ~1 – 19 wt.% NaCl equivalent salinity in vapor-rich inclusions (Ulrich et
al., 2001). Though mostly dominated by coexisting halite-saturated and vapor inclusions, the
intermediate depth portions of typical porphyry systems also contain minor aqueous inclusions,
which have salinities between 0.2-25 wt% NaCl equiv, record temperatures between 200-330°C,
and record pressures <100 bars (Ulrich et al., 2001).
The shallow upper regions in a typical porphyry system are dominated by vapor-rich
inclusions, which commonly appear similar to vapor-rich inclusions found in the intermediate
depth portions of typical porphyry systems, but commonly record lower pressures and
temperatures. Also, veins in the shallow depth areas in a typical porphyry system also contain
small amounts of the aqueous, 0.2-25 wt% NaCl equivalent inclusions.
Though the general pattern of fluid inclusions recording high temperatures and pressures
in the core of porphyry systems and lower temperatures and pressures in the shallow periphery of
porphyry systems is common for most porphyry deposits, patterns in various porphyries differ.

11
This variation arises from differences in depth of formation, the chemistry and physical
conditions of the fluids that exsolved from their parental magma, and the country rocks that the
fluids moved through as they rose through the crust. For example, the porphyry deposit at Butte,
Montana formed between 8-10 km depth, and is one of the most deeply-formed porphyry
deposits ever mined and studied (Figure 5) (Rusk et al., 2008). Fluid inclusions in veins in drill
core from the deepest available part of the Butte porphyry deposit are dominated by two types of
liquid-rich, CO2-bearing fluid inclusions: B35 and B60 (Rusk et al., 2008). B35 inclusions are
two-phase inclusions containing ~35 vol% vapor that contains 3-8 mol% CO2 and a liquid with a
salinity of ~1-8% wt% NaCl equiv.; these inclusions homogenized to liquid between 330-400°C.
B60 inclusions are two-phase inclusions containing ~60 vol% vapor that contains ~3-9 mol%
CO2, and a liquid with a salinity of ~1-7 wt% NaCl equiv.; these inclusions homogenized to
liquid between 360-400°C. Similar to other porphyry systems, veins in the deep root zone of the
Butte porphyry deposit contain few vapor-rich inclusions. However, unlike other porphyry
systems, moderate amounts of halite-saturated inclusions were found, and the B35 and B60
inclusions that dominate at depth contain CO2, although only two inclusions that contain liquid
CO2 were observed. In the shallow part of the Butte system, B60 inclusions dominate along with
vapor-rich B85 inclusions, which contain ~70-85% vapor with 10-20 mol% CO2 and 0-3 wt%
NaCl equiv., and have homogenization temperatures between 370-520°C (Rusk et al., 2008).
Along with these B60 inclusions and B85 inclusions, a moderate proportion of B15H inclusions,
which contain ~15% vapor, liquid, and a halite daughter crystal, and homogenize by halite
melting between 175-415°C, are also present in the shallow portions of Butte. The B60 and B85
inclusions that dominate the shallow part of the Butte systems are similar to other porphyry
systems; however, the presence of CO2 in the B60 and B85 inclusions, the moderate rather than
12
abundant evidence for boiling and related halite-bearing inclusions, and the great depth of
formation (8-10 km) are unusual (Rusk et al., 2008).
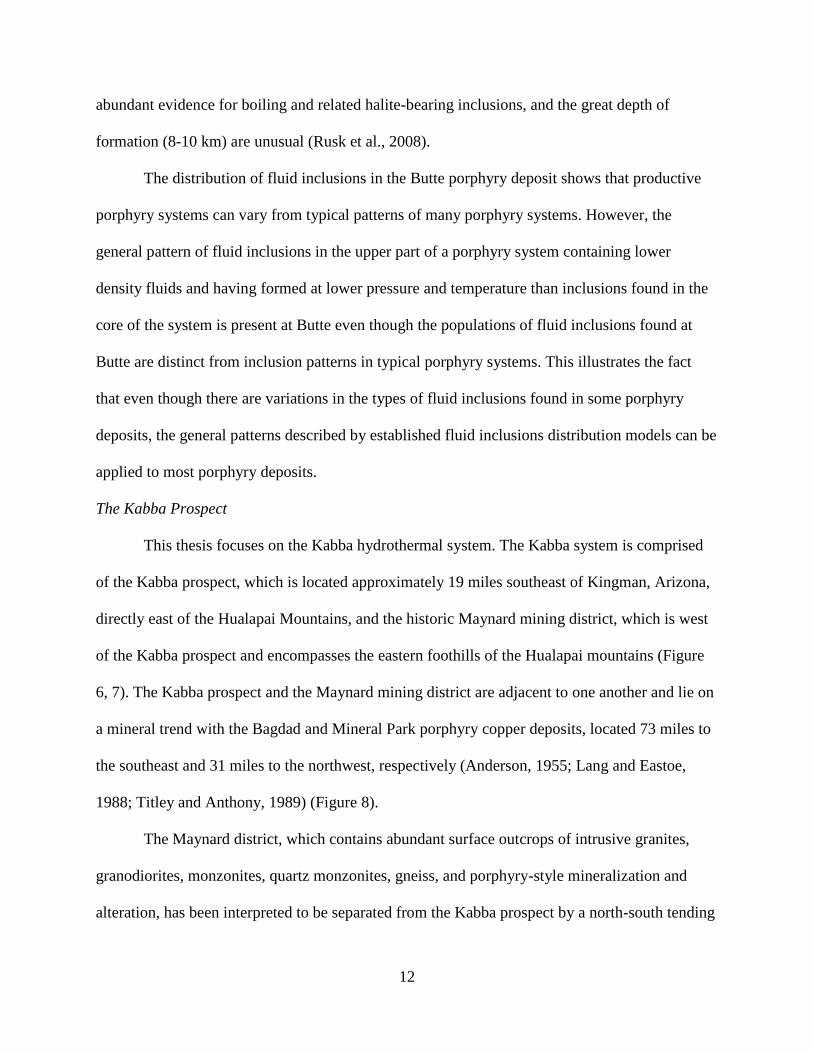
The distribution of fluid inclusions in the Butte porphyry deposit shows that productive
porphyry systems can vary from typical patterns of many porphyry systems. However, the
general pattern of fluid inclusions in the upper part of a porphyry system containing lower
density fluids and having formed at lower pressure and temperature than inclusions found in the
core of the system is present at Butte even though the populations of fluid inclusions found at
Butte are distinct from inclusion patterns in typical porphyry systems. This illustrates the fact
that even though there are variations in the types of fluid inclusions found in some porphyry
deposits, the general patterns described by established fluid inclusions distribution models can be
applied to most porphyry deposits.
The Kabba Prospect
This thesis focuses on the Kabba hydrothermal system. The Kabba system is comprised
of the Kabba prospect, which is located approximately 19 miles southeast of Kingman, Arizona,
directly east of the Hualapai Mountains, and the historic Maynard mining district, which is west
of the Kabba prospect and encompasses the eastern foothills of the Hualapai mountains (Figure
6, 7). The Kabba prospect and the Maynard mining district are adjacent to one another and lie on
a mineral trend with the Bagdad and Mineral Park porphyry copper deposits, located 73 miles to
the southeast and 31 miles to the northwest, respectively (Anderson, 1955; Lang and Eastoe,
1988; Titley and Anthony, 1989) (Figure 8).
The Maynard district, which contains abundant surface outcrops of intrusive granites,
granodiorites, monzonites, quartz monzonites, gneiss, and porphyry-style mineralization and
alteration, has been interpreted to be separated from the Kabba prospect by a north-south tending
13
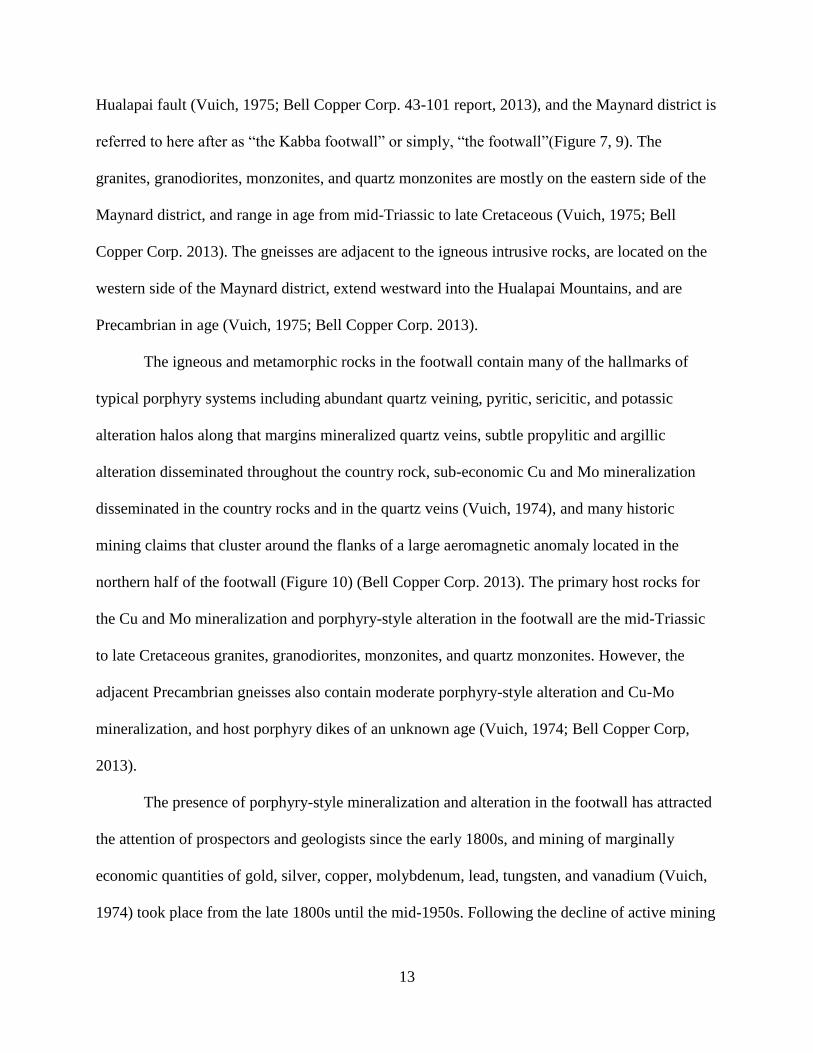
Hualapai fault (Vuich, 1975; Bell Copper Corp. 43-101 report, 2013), and the Maynard district is
referred to here after as “the Kabba footwall” or simply, “the footwall”(Figure 7, 9). The
granites, granodiorites, monzonites, and quartz monzonites are mostly on the eastern side of the
Maynard district, and range in age from mid-Triassic to late Cretaceous (Vuich, 1975; Bell
Copper Corp. 2013). The gneisses are adjacent to the igneous intrusive rocks, are located on the
western side of the Maynard district, extend westward into the Hualapai Mountains, and are
Precambrian in age (Vuich, 1975; Bell Copper Corp. 2013).
The igneous and metamorphic rocks in the footwall contain many of the hallmarks of
typical porphyry systems including abundant quartz veining, pyritic, sericitic, and potassic
alteration halos along that margins mineralized quartz veins, subtle propylitic and argillic
alteration disseminated throughout the country rock, sub-economic Cu and Mo mineralization
disseminated in the country rocks and in the quartz veins (Vuich, 1974), and many historic
mining claims that cluster around the flanks of a large aeromagnetic anomaly located in the
northern half of the footwall (Figure 10) (Bell Copper Corp. 2013). The primary host rocks for
the Cu and Mo mineralization and porphyry-style alteration in the footwall are the mid-Triassic
to late Cretaceous granites, granodiorites, monzonites, and quartz monzonites. However, the
adjacent Precambrian gneisses also contain moderate porphyry-style alteration and Cu-Mo
mineralization, and host porphyry dikes of an unknown age (Vuich, 1974; Bell Copper Corp,
2013).
The presence of porphyry-style mineralization and alteration in the footwall has attracted
the attention of prospectors and geologists since the early 1800s, and mining of marginally
economic quantities of gold, silver, copper, molybdenum, lead, tungsten, and vanadium (Vuich,
1974) took place from the late 1800s until the mid-1950s. Following the decline of active mining

14
in the Maynard district (i.e. the footwall area) in the mid 1950s, several companies including
Bear Creek Exploration, Union Carbide, Conoco, Kerr-McGee, AMAX, Cerromin, and Noranda
operated significant diamond drilling exploration programs investigating the mid-Triassic to late
Cretaceous granites, granodiorites, monzonites, and quartz monzonites in the area. These
exploration activities failed to discover a productive resource but did identify abundant
porphyry-style alteration and local areas of high copper and molybdenum in the sub-surface.
Drilling in this area continues to this day, but an economic resource has yet to be discovered
(Bell Copper Corp, 2013).
The Kabba prospect is located at the northern end of the valley to the east of the Hualapai
fault, south of Interstate 40, and west of US Highway 93 (Figure 6, 7). The valley that contains
the Kabba prospect and the surrounding area is referred to hereafter as the “Kabba hanging
wall,” or simply as the “hanging wall”. The hanging wall region is mostly covered by Quaternary
gravels and has few bedrock outcrops. However, small outcrops of granites and granodiorites
with abundant quartz veins are present where ephemeral streams have cut through the valley
gravels, and historic small-scale gold, silver, lead, and zinc deposits dot the valley (Figure 7).
The hanging wall also contains a large areomagnetic anomaly, the southern end of which runs
through the northern end of the Kabba prospect (Figure 10), and seismic data collected by Bell
Copper Corp. from the hanging wall shows that several fault blocks, which have moved
northeast along the Hualapai normal fault, reside below the Quaternary gravels present at the
surface in the hanging wall area (Figure 11).
The aeromagnetic anomaly in the hanging wall is similar to the aeromagnetic anomaly
present in the footwall in terms of its diameter and the fact that small-scale mines in the hanging
wall align around its flanks. Also, the hanging wall aeromagnetic anomaly is ~8 km northeast of

15
the footwall aeromagnetic anomaly. This ~8 km northeast offset between the hanging wall and
footwall anomalies is consistent with the inferred offset of the fault blocks along the Hualapai
fault characterized using seismic data. Based on these patterns, Bell Copper Corp has
hypothesized that the hanging wall and footwall aeromagnetic anomalies represent a single
anomaly now offset by faulting.
Though the hanging wall area contains abundant small-scale mines, a large aeromagnetic
anomaly, and surface outcrops of granites and granodiorites with abundant quartz veins, no
porphyry-style alteration is exposed at the surface and the only mineralization present at the
surface has been removed by historic mining. In 2005 the Bell Copper Corporation acquired
8031 acres of contiguous claims covering this area now known as the Kabba prospect (Figure 7)
and has been conducting an exploration and drilling program on this prospect to the present day
(Bell Copper Corp, 2013).
In 2011, Bell Copper Corp drilled diamond drill hole K-10 into the southern flank of the
aeromagnetic anomaly on the northern part of the Kabba prospect, and intersected pervasive
quartz veining, green mica, potassic alteration, and chalcopyrite-molybdenite-galena-sphalerite-
pyrite mineralization. Based on the mineralization and alteration found in the K-10 drill core, the
Bell Copper Corporation interpreted that the K-10 drill hole may have pierced the periphery of a
porphyry-like hydrothermal system. To test this interpretation, Bell Copper Corporation plans to
drill additional holes north and northeast of the K-10 drill hole in search of major Cu-Mo
mineralization. This drilling is set to commence in the summer of 2015 (Bell Copper Press
Release, 2015).
Exploration in the hanging wall and footwall areas has led to the hypothesis that the
hanging wall and footwall contain two distinct zones of porphyry-style mineralization and

16
alteration that were once part of the same system, but have since been separated by the north-
south trending Hualapai normal fault (Figures 9) (Vuich, 1974; Bell Copper Corp, 2013). If this
hypothesis is correct, then it follows that the mineralization and alteration in the hanging wall
and footwall were formed at the same time, and, owing to their separation by a normal fault, the
mineralization and alteration in the footwall formed at a greater depth than the mineralization
and alteration in the hanging wall. This means that the mineralization and alteration found in the
footwall and hanging wall might represent two distinct zones that formed at different depths as
part of a single porphyry system.
The objective of this study is to test the faulted porphyry system hypothesis by 1)
characterizing the mineralization, alteration, and vein types found in the hanging wall and
footwall, and comparing these features to the mineralization, alteration, and vein types in other
porphyry systems, 2) characterizing the physical and chemical characteristics and spatial
distribution of fluid inclusion assemblages (FIAs) trapped in veins in the hanging wall and
footwall, and comparing these data to the established FIA distribution models for economic
porphyry systems. If the hanging wall and footwall area were previously part of a single
porphyry system and each formed at different depths and conditions, then it follows that 1) the
paragenetic sequence of mineralization and alteration types associated with veins in the hanging
wall and footwall should be related to one another, 2) the mineralization and alteration in each
location should have formed from the same hydrothermal fluids and therefore the fluid
inclusions found in the hanging wall and footwall should have related patterns in enrichment and
depletion of various elements, and 3) the distribution of fluid inclusion types in the footwall and
the hanging wall should show related patterns of decreasing fluid pressure, temperature, and
density with decreasing depth, similar to patterns in economic porphyry systems.

17
CHAPTER 3
METHODS
Sample Selection and Field Work: Hanging wall
Samples collected from drill core were supplied by Bell Copper Co. and came from drill
hole K-10 (Figure 7, 12, 13), which was collared in the Kabba hanging wall in alluvial cover that
fills the valley east of the Hualapai Mountains (249595E 3890992N, UTM 12). The drill hole
has a total depth of 1346 meters, including 996 meters of alluvium and 349 meters of moderately
mineralized igneous and metamorphosed country rock. This is the only hole drilled by Bell
Copper Co. that encountered significant sulfide mineralization and alteration. Core samples
chosen from K-10 contain a variety of sulfide minerals, alteration, host rocks, and cross-cutting
relationships, and sampling focused on quartz veins that hosted sulfide mineralization, exhibited
well-developed alteration selvedges adjacent to veins, and had the potential to host fluid
inclusions related to mineralization and alteration and suitable for analysis. In total, 67 core
samples were collected from drill hole K-10. Samples selected from drill hole K-10 and the
analysis carried out on each sample are listed in Appendix A.
Sample Selection and Field Work: Footwall
Fieldwork in the footwall focused on areas mapped by Vuich (1974), which are known to
contain variable amounts of Cu and Mo sulfide mineralization and alteration typical of porphyry
systems (Sillitoe, 2010) (Figure 12 C, 13 B-E). The primary objective of fieldwork in the
footwall was to collect samples representative of the local mineralization and suitable for
detailed petrographic and fluid inclusion analysis, and to gather information on the mineralogy,
texture, abundance, and spatial distribution of quartz and sulfide veins. In order to put footwall

18
samples in temporal context with one another, veins and cross-cutting relationships in footwall
outcrops were characterized in detail.
Samples were collected from outcrops of quartz veins that hosted sulfide mineralization
and porphyry-style alteration. Barren and mineralized veins were collected in order to document
the variation in vein types and associated alteration and mineralization present in the footwall. A
total of 85 samples for fluid inclusion analysis were selected from historic mines and prospect
pits that are distributed throughout the footwall area. These samples represent areas with
abundant Cu and Mo mineralization and were the most likely candidates for hosting fluid
inclusion that trapped ore forming fluids. Samples selected from the Kabba footwall and the
analyses carried out on each sample are listed in Appendix B.
Doubly Polished Thick Section Sample Selection
A total of 25 footwall and 15 hanging wall samples that showed particularly well
developed alteration selvedges, abundant sulfide mineralization, and clear quartz veins with a
thickness >0.5 cm were selected to be made into thick sections for petrographic and fluid
inclusion analysis. Billets for sections were ground to a thickness of ~100 µm and doubly
polished for fluid inclusion analyses. Descriptions of footwall and hanging wall samples prior to
cutting and polishing can be found in appendix C and D.
Conventional Petrographic Analysis
Doubly polished thick sections were studied using both transmitted and reflected light to
characterize ore and alteration mineralogy, textures, and crosscutting relationships. Microscopic
observations were used to establish the paragenetic sequence of ore and alteration minerals in

19
and associated with quartz veins in each sample. This paragenetic sequence was then used to
identify assemblages of fluid inclusions with consistent liquid to vapor ratios that indicate
synchronous trapping of past hydrothermal fluids related to specific generations of vein minerals
and alteration (Goldstein and Reynolds, 1994). These fluid inclusion assemblages or “FIAs” are
important to this study because they indicate the presence of fluid inclusions that have not been
modified since trapping. Thus, they can provide an accurate record of pressure, temperature, and
chemical (P-T-X) conditions of the fluids involved in alteration and mineralization.
Scanning Electron Microscope-Energy Dispersive Spectroscopy (SEM-
EDS)/Cathodoluminescence (SEM-CL) Analysis
Semi-quantitative SEM-EDS analysis was carried out using the JEOL-5600 Scanning
Electron Microscope (SEM) located in the Electron Microanalysis and Imaging Laboratory
(EMiL) at the University of Nevada, Las Vegas (UNLV). This analysis was used to confirm
mineral identifications and paragenetic relationships observed during conventional microscope
analysis. Beam conditions for SEM-EDS analysis were 15 KeV acceleration voltage, 40 µm spot
size, aperture 2, and a 20 mm working distance
SEM-CL analysis was used to distinguish between successive generations of quartz and
characterize crosscutting relationships and quartz textures that are not visible with conventional
transmitted and reflected light microscopy. SEM-CL images were collected with a Centaurus CL
detector with 185 to 850 nM spectral range, and the optimum beam conditions for SEM-CL
imaging were 15 KeV acceleration voltage, 42-46 µm spot size, aperture 2, and a 14-18 mm
working distance. Images were recorded in greyscale and, thus, CL intensities for target material
are referred to as “CL-bright” and “CL-dark”, and are further defined by their texture. This

20
analysis links discrete areas of quartz and included fluid inclusions to particular paragenetic
stages, which is key for distinguishing different fluid inclusion groups from one another.
Microthermometry
Ice melting, clathrate melting, and homogenization temperatures were collected for
individual groups of fluid inclusions using a Linkam THMSG 600 stage mounted on an Olympus
BX60 petrographic microscope. The Linkam stage was calibrated using synthetic fluid inclusions
produced by Synflinc. Using the synthetic inclusions, temperatures measured within this stage
were compared to the known temperatures of CO2 melting at -56.6 ±0.01°C, pure ice melting at
0.0°C, and the liquid-vapor homogenization of pure H2O at the critical point of 374.2°C. The
accuracy of ice melting temperatures are +/- 0.1°C and homogenization temperature accuracy is
estimated at ~5°C. Calculation of P-T-X conditions for analyzed groups of fluid inclusions was
accomplished using the MacFlincor program (Brown, 1989; Brown and Hagemann, 1995).
MacFlincor yielded bulk compositions, salinities, and isochors for analyzed inclusions.
Raman Analysis
The density of CO2 in select inclusions was determined using microRaman spectroscopy
at the University of Bern, Switzerland. Measurements were performed with a Jobin Yvon
LabRAM-HR800 system with an integrated Raman microprobe consisting of an Olympus BX41
confocal microscope coupled to an 800 mm focal-length spectrograph. All measurements were
gathered using a 100x objective on the Olympus microscope and a frequency-doubled Nd-YAG
continuous-wave laser with an excitation wavelength of 532.12 nm (green) that was used to
excite the samples. Acquisition times ranged from 15 to 30 seconds and acquisitions were

21
repeated 3 times per inclusion. This analysis was used to characterize the composition and
distribution of CO2-bearing fluid inclusions.
Laser Ablation – Inductively Coupled Plasma – Mass Spectrometry (LA-ICP-MS)
LA-ICP-MS analysis was used to quantify major and minor trace element compositions
of selected fluid inclusions. The LA-ICP-MS system used consisted of a 193-nm ArF Excimer
laser system with a fast-washout, rhomb-shaped ablation cell with a volume of 1cm3 coupled to
an ELAN 6100 DRC quadruple mass spectrometer. The instrument was tuned to high sensitivity
while keeping the ThO/Th-ratio below 0.5%. Carrier gas flow rate was 1.1 L/min He + 5 ml/min
H2 (Guillong and Heinrich, 2007), and laser repetition rate was 10 Hz. Element concentration
ratios were determined using NIST glass standard SRM-610. Data reduction was done using
SILLS software (Guillong et al., 2008), and Na concentrations (salinities) derived from
microthermometric measurements were used to correct for variance in measured element
concentrations caused by contributions from other cations.
22
CHAPTER 4
VEINS AND ALTERATION
Footwall and hanging wall samples selected for analysis typically contained > 0.5 cm
thick quartz veins that host sulfide and oxide minerals and display the variety of alteration types
and mineralization found in drill core and outcrop in the hanging wall and footwall areas. Below
is a detailed description of footwall and hanging wall host rocks, veins, alteration, and mineral
assemblages present in the veins.
Host Rocks: Footwall
The host rocks in the footwall were collected from surface outcrops along dry washes in
the footwall area, and are comprised of moderately to heavily altered intrusive phaneritic rocks
of late Cretaceous age (Vuich, 1974) (Figure 12 C, 13 B-E). These intrusive rocks are commonly
composed of ~45-70% euhedral to subhedral plagioclase, ~20-45% subhedral to anhedral
quartz, and ~5-10% euhedral biotite with minor white micas, and plot in the quartz monzonite
and granodiorite fields on a quartz-plagioclaes-alkili-foid (QPAF) diagram. The degree of
alteration in host rock outcrops and hand samples increases with increasing quartz vein density
and, where quartz vein density was highest, the original texture of the host rocks is partly to
completely obscured. These rocks are described in detail by Vuich, 1974.
Vein Assemblages: Footwall
The minerals found in footwall veins tend to occur in consistent and discrete groups that
are referred to as assemblages. Four mineral assemblages were identified in the footwall and the
minerals within each assemblage are consistently intergrown with one another, have similar
23
textures and temporal range, and, with the exception of assemblage 4F, which is described below,
are associated with a single generation of quartz. The textures and occurrences of many of the
minerals from each assemblage are, in many cases, the same as those found in the hanging wall.
As a result, many of the sulfide and oxide minerals found in the footwall share the same
abbreviation as their analogues in the hanging wall. However, footwall and hanging wall mineral
assemblages are described separately from one another below.
Each footwall assemblage is described below and in Table 1. All footwall assemblages
are identified by a number, which signifies temporal order relative to other assemblages in the
footwall. The subscript “F” signifies “footwall” and is used to differentiate between hanging
wall samples, which do not have a subscript.
Assemblage 1F: This assemblage is associated with quartz that has a bright white color
and a mottled or growth-zoned pattern in cathodoluminescence (Figure 14) and is referred to
hereafter as CL-bright quartz. Individual crystals of this quartz range in size between 100-900
µm, have rounded edges and euhedral growth-zoned or mottled cores, and are light to
moderately fractured. The sulfide minerals in assemblage 1F include anhedral chalcopyrite
(Cpy1) and pyrrhotite (Po) that occur as 5-50 µm wide inclusions in subhedral pyrite (Py2)
(Figure 15 A, B), and molybdenite (Mo1) (Figure 15 C) that occurs as masses of elongate,
subhedral-euhedral, lath-shaped crystals that range in size from 100-800 µm. Cpy1 and Po
inclusions in pyrite occur as individual anhedral inclusions or as individual inclusions of adjacent
Cpy1 and Po crystals. Cpy1 also occurs in minor amounts as anhedral-subhedral inclusions in
magnetite (Figure 15 D, E). However, Cpy1 does not occur with Po in magnetite, and no Po
inclusions are found in any magnetite crystals.

24
Masses of abundant euhedral Mo1 crystals are typical and are commonly intergrown with
CL-bright quartz. Rarely, Mo1 is partly rimmed by magnetite (Mt), chalcopyrite (Cpy2) (Figure
15 C) and pyrite (Py2) crystals, but is never intergrown with these minerals. Also, Mo1 is much
less abundant than Cpy1 in assemblage 1F
Assemblage 2F: Assemblage 2F, as well as assemblage 3F, is associated with quartz that
has a flat black color under cathodoluminescence, ranges in size between 5-500 µm, fills
fractures in and crosscuts CL-bright quartz, and is referred to here after as CL-dark
cathodoluminescence (Figure 14 A, B, C). CL-dark quartz fills fractures in sulfide and oxide
minerals in assemblage 1F, commonly contains rounded inclusions of CL-bright quartz, is
associated with white muscovite, and is typically associated with the bulk of the sulfide
mineralization in the footwall.
The sulfide and oxide minerals in assemblage 2F include subhedral pyrite (Py2) that
ranges in size between 100-1000µm and contains inclusions of Cpy1 and Po (Figure 15 A, B),
masses of euhedral-subhedral magnetite (Mt) crystals that range in size between 100-800µm
(Figure 15 E, G ), and anhedral rutile (Ru) (Figure 15 H, F) that ranges in size from 10-200µm
and commonly occur within and adjacent to masses of coarse, euhedral white muscovite (Figure
15 H, I) that range in size from 20-500µm. Py2 and Mt in this assemblage commonly occur as
individual crystals or as masses of individual crystals intergrown with CL-dark quartz. Rarely,
Mt also occurs as anhedral inclusions in Py2 alongside Cpy1 and Po. Where occurring as an
inclusion in Py2, Mt crystals commonly are euhedral to subhedral (Figure 15 F). Also, individual
Mt crystals in this assemblage contain minor anhedral-subhedral Cpy1. Cpy1 inclusions in Mt are
similar to the Cpy1 inclusions in Py2, but differ in that individual Cpy1 inclusions in Mt have a
more euhedral shape (Figure 15 E). Rutile-bearing coarse white muscovite is included in
25
assemblage 2 and also in assemblage 3, and occurs as masses of anhedral-subhedral crystals,
which form along the outer boundaries of CL-dark quartz or in fractures in CL-bright quartz
(Figure 15 H, I).
Assemblage 3F: Assemblage 3F includes anhedral-subhedral chalcopyrite (Cpy2), which
ranges in size from 20-500µm (Figure 15 C, D, K, J), and elongate, euhedral, lath-shaped
molybdenite crystals (Mo2) (Figure 15 L) that range in size from 50-100µm, and both of these
minerals are typically intergrown with CL-dark quartz and coarse white muscovite.
Chalcopyrite2 occurs in only minor amounts and is always intergrown with CL-dark
quartz, filling fractures in Cl-bright quartz or fractures in sulfide phases in assemblages 1F and
2F. Cpy2 crystals also commonly have a rough or “pitted” surface (Figure 15 K).
Molybdenite2 crystals in this assemblage always occur within or adjacent to masses of
rutile-bearing coarse white muscovite, which are lined by or intergrown with CL-dark quartz.
Rarely, masses of rutile-bearing coarse white muscovite also include Cpy2. Also, Mo2 is much
less abundant than Cpy2 in assemblage 3F and Cpy1 in assemblage 1F, but is much more abundant
than Mo1 in assemblage 1F.
Assemblage 4F: This assemblage is characterized by hematite (Figure 15 E, G), which is
not associated with quartz. Hematite forms anhedral crystals that are typically <2 µm and that
rim magnetite and rutile.
Veins: Footwall
Based on size and morphology, two types of veins were identified in the granites and
quartz monzonites exposed in the footwall: AB and ANB veins (Tables 2 and 3). AB veins are
>2cm wide commonly and are composed of multiple vertical bands of quartz that are parallel to

26
one another (Figure 16 A, B). These veins are always found in prospect pits and are referred to
herein as AB veins, wherein “B” signifies banded. Within an AB vein, each band has straight
margins and commonly exhibits discontinuous bands of coarse sulfides or coarse phyllosilicates,
which are aligned parallel to the vein margins. Coarse muscovite associated with these bands
fills vein centerlines or rims the outer margins of individual bands of CL-dark quartz (Figure 16
A). AB veins also commonly contain host rock fragments within or in-between individual bands
and elongated parallel to vein margins (Figure 16 B).
ANB veins range in size from <0.5-2cm and are analogous to individual quartz bands in
the AB veins, but occur as single veins (Figure 16 C, D). These veins are commonly found
throughout the footwall area and are referred to hereafter as ANB veins, wherein “NB” signifies
“non-banded.” ANB veins have moderately sinuous boundaries, and are very similar to the
individual bands in AB veins in that they host the same mineral assemblages, exhibit the same
mineral textures and alteration types, and contain host rock fragments. These smaller veins
typically don’t have sulfide or mica filled centerlines, and rarely host sulfides, oxides, and coarse
phyllosilicates along their margins. However, when filled with CL-dark quartz, ANB veins
commonly have coarse mica alteration selvedges. ANB veins also commonly contain large
masses of magnetite, which are absent from AB veins (Figure 16 C).
AB and ANB veins generally contain the same sulfide and oxide minerals and quartz types.
However, minor differences exist between AB and ANB veins in terms of the abundances and
textures of the sulfide and oxide mineral phases found in the veins, particularly Mo1, Mo2, CPy2,
Py2, and Mt (Tables 2 and 3).
Host rocks: Hanging wall

27
The host rocks for vein samples from drill hole K-10 (Figure 7, 12 B, 13 A) that
penetrated hanging wall rocks are variably altered igneous porphyritic and phaneritic rocks. The
phaneritic rocks found in the hanging wall typically contain ~10-30% euhedral to subhedral
potassium feldspar, ~20-50% euhedral to anhedral plagioclase, ~20-30% subhedral to anhedral
quartz, and ~2-5% subhedral to euhedral biotite, and plot in the granite field on a QPAF diagram.
The porphyritic rocks found in the hanging wall typically contain phenocrysts of euhedral
plagioclase (~60-70%), anhedral potassium feldspar (10-20%) anhedral quartz (~20-30%),
euhedral biotite (2-5 %), and euhedral to subhedral amphibole (~2%) in a fine plagioclase- and
quartz-rich ground mass. These rocks plot in the granodiorite field on a QPAF diagram. All the
hanging wall samples were collected from drill core and are not available in outcrop. However,
surface outcrops to the west of the hanging wall field area are of late Cretaceous and
Precambrian age; thus, it’s possible that hanging wall host rocks are from this age range (Vuich,
1974).
Vein Assemblages: Hanging Wall
Vein minerals in the hanging wall occur in 5 discrete assemblages based on textural and
crosscutting temporal relationships. The minerals from each assemblage are commonly
intergrown with one another and are described generally below, and in detail in Table 4.
Assemblage 1: Assemblage 1 minerals are intergrown with CL-bright quartz, which has a
growth-zoned or mottled appearance in cathodoluminescence (Figure 14 A, B, C). Individual
crystals of this quartz commonly range in size between 100-900 µm, have rounded edges and
euhedral growth-zoned or mottled cores, are commonly highly fractured, and are crosscut by
later quartz generations. This quartz is identical to the CL-bright quartz found in the footwall.

28
Sulfide and oxide minerals in assemblage 1 include pitted euhedral, non-inclusion-
bearing pyrite (Py1) that ranges in size between 50-200µm (Figure 17 A), anhedral galena (Gl)
that ranges in size between 50-600µm (Figure 17 A, B), and anhedral sphalerite (Sp) that
encloses anhedral chalcopyrite and ranges in size between 50-500µm (Figure 17 A, B). This
assemblage also includes grey, very fined-grained (<2 µm) masses of anhedral calcite (Cc),
which are intergrown with Sp and Gl along with CL-bright quartz (Figure 16 F).
Assemblage 2: The sulfide minerals in assemblage 2 are also intergrown with CL-bright
quartz, and fill or partially fill cracks in assemblage1 sulfides. Assemblage 2 sulfides include
anhedral chalcopyrite (Cpy1) and pyrrhotite (Po) that occur as 5-50 µm wide inclusions in
euhedral pyrite (Py2) crystals (Figure 17 C), and euhedral-anhedral molybdenum (Mo1) that
ranges in size between 50-100µm (Figure 17 D) and commonly forms along vein margins or fills
fractures in assemblage 1 sulfides. Chalcopyrite and pyrrhotite inclusions in pyrite are identical
to the chalcopyrite and pyrrhotite in footwall assemblage 1 and thus, share the Cpy1 and Po
abbreviation, respectively. However, footwall Cpy1 and hanging wall Cpy1 differ in that hanging
wall Cpy1 does not occur as inclusions in Mt.
Molybdenite1 in this assemblage is similar to molybdenite1 in footwall assemblage 1 and
also shares the Mo1 abbreviation. However, masses of Mo1 in the hanging wall tend to be smaller
in size 100-500 µm, less abundant, and contain more euhedral crystals than footwall Mo1. Mo1
masses in the hanging wall are also never encompassed by magnetite (Mt), chalcopyrite (Cpy2),
or pyrite (Py2) crystals.
Assemblage 3: Unlike assemblages 1 and 2, the sulfide, oxide and silicate minerals in
assemblage 3 are intergrown with or adjacent to fine-grained CL-dark quartz crystals, which
range in size between 5-500 µm and are identical to CL-dark quartz found in the footwall (Figure

29
14 A, B, C). This quartz fills fractures in and crosscuts CL-bright quartz, fills fractures in sulfide
and oxide phases associated with assemblages 1 and 2, contains rounded inclusions of CL-bright
quartz, and is typically associated with the bulk of the sulfide mineralization in the hanging wall.
Assemblage 3 sulfides and oxides include euhedral pyrites (Py2) that range in size
between 100-1000 µm and contain Cpy1 and Po inclusions (Figures 17 C, D, E), euhedral
magnetite (Mt), which ranges in size between 100-800µm and occurs as individual crystals
intergrown with CL-dark quartz or Py2 (Figure 17 E), and anhedral masses of rutile which range
in size between 10-200µm and occur adjacent to or within masses of green mica (Figure 17 G,
K) or as inclusions in Py2 (Figure 17 F). Rutile-bearing green micas (GM) are also included in
this assemblage, and occur as masses of anhedral-subhedral crystals, which range in size
between 50-200 µm and are intergrown with CL-dark quartz or fill fractures in CL-bright quartz
(Figure 17 G).
Cpy1 and Po inclusion-bearing pyrites in the hanging wall are identical to Py2 found in the
footwall and share its abbreviation. Magnetite and rutile in the hanging wall are also identical to
Mt and Ru found in footwall assemblage 3 and share the Mt and Ru abbreviations, respectively.
However, one key difference between the Ru found in the hanging wall and in the footwall is
that hanging wall Ru is associated with green mica rather than coarse white muscovite. Also, as
in the footwall, hanging wall Mt commonly occurs as inclusions in Py2, but these inclusions
typically are euhedral. Furthermore, Mt crystals in the hanging wall that occur by themselves and
are not inclusions in Py2, never contains Cpy1 inclusions similar to the Cpy1 inclusions in Py2.
Assemblage 4: All sulfide phases in assemblage 4 are intergrown with CL-dark quartz
and green mica, and fill fractures in assemblages 1, 2 and 3 minerals. Assemblage 4 sulfides
include anhedral chalcopyrite (Cpy2) that ranges in size between 20-500µm and occurs adjacent

30
to or fills fractures in Py2 (Figure 17 H), subhedral to euhedral molybdenum (Mo2) that ranges in
size between 50-100µm and occurs within masses of green mica (Figure 17 I), and anhedral
bornite (Bn), which ranges in size between 10-50µm and forms rims round chalcopyrite (Figure
17 J).
Cpy2 in the hanging wall is identical to Cpy2 found in the footwall, and shares the Cpy2
abbreviation. Likewise, Mo2 in assemblage 4 is identical to Mo2 in the footwall, but is associated
with green mica rather than coarse white muscovite. Never the less, molybdenum from
assemblage 4 shares the Mo2 abbreviation with the molybdenite2 in hanging wall assemblage 3
because of its similar texture and occurrence within and around a phyllosilicate mineral.
Green micas (GM), which host masses of anhedral rutile, are also included in this
assemblage and occur as masses of anhedral-subhedral crystals that rim CL-dark quartz or fill
fractures in CL-bright quartz (Figures 17 G). Rutile-hosting green micas form green alteration
selvedges adjacent to the veins.
Assemblage 5: Assemblage 5 is identical to assemblage 4 in the footwall and contains
hematite, which is not associated with quartz. Hematite in the hanging wall occurs as very fine-
grained anhedral crystals that rim individual magnetite and rutile crystals, and commonly also
forms splays of elongate, lath-shaped crystals that range in size between 5-150µm (Figure 17 E,
K). Given its general similarity to hematite found in the footwall, hematite in hanging wall
assemblage 5 shares the “Hem” abbreviation with hematite in footwall assemblage 4.
Veins: Hanging Wall
A Veins: A veins (Table 2) are the second most common vein type occurring in the
hanging wall, are found in ~29% of hanging wall samples, have sinuous or jagged boundaries,

31
commonly branch off to form multiple veins, never have centerlines, contain sulfides along their
margins, and are similar to “A” veins described by Gustafson and Hunt (1975) (Figure 16 G). A
veins are commonly crosscut by B veins that have straight, well-defined margins, and such A
veins are overprinted by alteration and mineralization associated with cross-cutting B veins
(Figures 16 G). However, A veins are never crosscut by sphalerite- and galena-rich B veins with
moderately sinuous boundaries.
The abundance and variety of minerals present in A veins is variable and A veins
commonly contain both assemblage 1 and 2 minerals, which are consistently related to CL-bright
quartz, and assemblage 3 and 4 minerals which are consistently related to CL-dark quartz (Table
5). However, typical A veins are composed of 75-80% CL-bright quartz, 5-10% CL-dark quartz,
1-1.5% Py1, 0.5-1% Sp; 1-2% Cpy1, 0.5-1% Po, 1-2% Mo1; 2-7% Py2, 2-4% Ru; 2-4% Cpy2, 2-
5% Bn; and 1-5% Hem. Typically, CL-bright quartz is the dominant quartz in A-veins but
individual CL-bright quartz crystals are commonly crosscut by multiple sets of fractures filled
with CL-dark quartz. Py1, Sp, Gl, and assemblage 2 Mo1 occur as scattered masses of anhedral to
subhedral crystals within veins along the vein margins, and are intergrown with CL-bright
quartz. Assemblage 3 Mt and Py2 containing assemblage 2 Cpy1 and Po inclusions occur in
masses within A veins, along the vein margins, or in the center of the veins as a centerline, and
are only observed where CL-bright quartz is cut by CL-dark quartz-filled fractures. Assemblage
4 Cpy2, Ru, and Bn all occur as scattered masses of fine crystals throughout the A veins and are
always adjacent to CL-dark quartz. Hematite in A veins mostly occurs as elongate lath-shaped
crystals in A-veins, but also forms well-defined rims around masses of anhedral rutile crystals.
These observations demonstrate that assemblage 1 and 2 minerals are consistently related to CL-

32
bright quartz, and assemblage 3 and 4 minerals are consistently related to CL-dark quartz (Table
5).
Fragments of host rock granites and granodiorites that contain plagioclase and orthoclase
phenocrysts and groundmass are also common in A veins (Figure 17 L). These host rock
fragments range in size from 0.8-3mm and are typically rimmed by sulfide minerals from
assemblages 1, 2, and 3 (Figure 17 L).
Potassic alteration is the most abundant alteration typically associated with A veins,
which are never temporally related to green mica alteration or alteration selvedges composed of
green mica. However, A veins are locally overprinted by green mica alteration where A veins
are cut by B veins (Figure 16 G).
B Veins: B veins (Table 2) are the most common hanging wall vein type, are found in
65% of hanging wall granite and granodiorite samples, have straight to moderately sinuous vein
boundaries, commonly contain sulfide or calcite filled centerlines, and are similar to the “B”
veins described by Gustafson and Hunt (1975) (Figure 16 E, F, H). Of all examined B veins in
the hanging wall, ~75% have straight, well-defined vein margins and commonly contain
disseminated sulfides or sulfides filling a centerline. The remaining ~25% of B veins have
moderately sinuous boundaries, small masses of disseminated sulfides and/or sulfide filled
centerlines, calcite bands, and a high ratio of CL-bright to CL-dark quartz.
Like A veins, B veins commonly also contain both assemblage 1 and 2 minerals, which
are consistently related to CL-bright quartz, and assemblage 3 and 4 minerals which are
consistently related to CL-dark quartz (Table 5). However, B veins are typically composed of 40-
55% CL-bright quartz, 30-50% of cross-cutting CL-dark quartz, 0-10% calcite, 0-5% Py1, 10-

33
20% Py2, 0-15% Sp, 0-15% Gl, 2-7% Mt, 2-5% Ru, 1-5% Hem, 1-5% Cpy2, 1-5% Mo2, 1-3%
Cpy1, 1-3%Mo1, 1-2% Po, and 1-2% Py1. CL-bright quartz in B veins commonly forms along the
outer margin of the vein in contact with the host rock and commonly has abundant fractures,
which are filled with CL-dark quartz. The density of CL-dark quartz-filled fractures in CL-bright
quartz increases from the margins of the quartz veins to their centers, with CL-bright quartz near
vein margins having few fractures (Figure 14 D, E), and CL-bright quartz in the interior of the
vein having abundant fractures (Figure 14 F). B vein centerlines are primarily filled with highly
fractured assemblage 3 Cpy1 and Po inclusion-bearing Py2, which is rimmed by CL-dark quartz.
Rutile-bearing green micas in B veins are commonly intergrown with centerline sulfides and CL-
dark quartz, or fill fractures in CL-bright quartz. Fractures in centerline Py2 are typically filled by
assemblage 4 Mo2 and Cpy2 along with CL-dark quartz and rutile-bearing green micas. B veins
also commonly contain fragments of host rock granites and granodiorites that range in size from
0.5-3 mm and are commonly rimmed by assemblage 1, 2, and 3 sulfide minerals.
The ~25% of B veins with moderately sinuous boundaries contain a greater abundance of
assemblage 1 Py1, Sp, and Gl than B veins with straight boundaries, tend to contain the largest
euhedral CL-bright quartz crystals (500 µm-2.5 mm), commonly contain calcite bands along
their margins that are intergrown with Py1, Sp, and Gl (Figure 16 F), and are never cut by, nor
crosscut, A veins. In contrast, the ~75% of B veins with straight, well-defined margins and little
or no assemblage 1 Py1, Sp, and Gl, have a wide range of quartz crystal sizes, and do not
crosscut, nor are crosscut by, A-veins.
D Veins: D veins (Table 2) are the least common vein type in the hanging wall, and are
found in ~27% of hanging wall granites and granodiorites. Like the D veins described by

34
Gustafson and Hunt (1975), they have straight margins, and are composed entirely of sulfides
(Figure 16 E, H). D veins are typically 1-2.5 mm wide, are always found <0.5 cm from the
margins of B veins, and are parallel to spatially associated B veins. D veins are composed
entirely of assemblage 3 Py2 (~90%) with its typical inclusions of assemblage 2 Cpy1 (~8%) and
Po (~2%), and are never crosscut by other vein types.
Alteration in Footwall and Hanging Wall Rocks
Potassic aAlteration: The most common alteration found in hanging wall granites and
granodiorites and footwall quartz monzonites and granodiorites is potassic alteration (Figure 16
C, G). It is associated with all the vein types in the hanging wall and footwall, but is most well
developed proximal to CL-bright quartz-rich A veins in the hanging wall, and CL-bright quartz-
rich ANB veins in the footwall. Potassic alteration typically forms a selvedge along quartz vein
margins, is typically ~1-3x the width of its associated vein (typically ~2cm-2m), and is
characterized by potassium feldspar replacement of plagioclase feldspar phenocrysts and fine-
grained plagioclase in the ground mass of the granites, granodiorites, and quartz monzonites.
While mostly affecting plagioclase phenocrysts and groundmass, this alteration does not affect
primary biotite and quartz phenocrysts in host rocks. Rarely, orthoclase in potassic alteration
selvedges along the outer margins of ANB veins can be as large as 2mm wide.
Where potassic alteration is most well developed, original plagioclase textures including
polysynthetic twining and original crystal textures are absent. The intensity of this alteration
typically increases with proximity to vein margins, but where it is overprinted by green mica
alteration, potassic alteration textures and minerals are absent. Also, this alteration commonly
forms localized red-brown patches of fine-grained potassium feldspar on altered plagioclase

35
crystals that are partly or fully opaque in transmitted light. SEM-EDS analysis of these opaque
areas showed only spectra for potassium feldspar, so the origin of these opaque patches is not
known.
Green Mica Alteration: Green mica alteration is only found in hanging wall granites and
granodiorites and occurs as B vein selvedges of intergrown dark green, subhedral to anhedral
muscovite that ranges in size from ~20-100 µm, anhedral sericite that is typically < 50 µm,
anhedral rutile that is typically 1-10 µm, and minor anhedral quartz and subhedral pyrite (Figure
16 E, G). This alteration is found in ~30-40% of the granite and granodiorite host rocks in the
hanging wall and typically forms well-defined vein selvages with sharp outer boundaries that
extend ~2.5-15 mm from B veins with straight margins, >40% CL-dark quartz, and a sulfide-
filled center line.
Where green mica has altered host rock granites and granodiorites, phenocryst and
groundmass textures have been destroyed. Furthermore, where a vein with a selvedge of this
alteration type cross-cuts a vein with a potassic alteration selvedge, the potassic alteration
minerals and textures have been completely destroyed.
Green muscovite in this alteration type occurs as masses of subhedral to anhedral crystals
that range in size from ~50-300 µm and are most abundant proximal to vein margins. Grey
sericite also occurs with this alteration type and forms masses of anhedral crystals that are
typically <50 µm and intergrown with the green muscovite selvedges that characterize this
alteration type.
Rutile is a common oxide mineral associated with green mica alteration. Rutile
commonly occurs as masses of round, anhedral crystals that range in size from 1-25 µm, and
form along cleavage planes or around the outer margins of individual green muscovite crystals in

36
the vein selvages. Where this alteration type is most intense, rutile is sufficiently abundant that
masses of rutile crystals throughout the green muscovite cause the muscovite to appear opaque in
transmitted light (Figure 17 G).
Where this alteration overprints primary euhedral biotite in host rock granites and
granodiorites, the outer margins of the biotites are typically green. Many such altered biotites
also contain elongate, euhedral rutile needles, which are disseminated throughout individual
crystals of biotite, and differ from the aggregates of fine-grained rutile crystals that align along
cleavage planes in green muscovite.
Coarse Mica Alteration: Coarse mica alteration is only found in host rock granites and
quartz monzonites in footwall rocks, is associated with all AB veins and CL-dark ANB veins, and
over prints potassic alteration. This alteration is characterized by multiple, adjacent masses of
clear euhedral muscovite that range in size from 50 µm-6 mm forming rims along the outer
margins of banded quartz veins, individual CL-dark bands in banded quartz veins, and the outer
margins of non-banded quartz veins (Figure 16 A, C, D). Minor grey, anhedral, 2-8 µm masses
of sericite are also commonly intergrown with the coarse muscovite in selvedges along vein
margins. In addition, both the sericite and muscovite in coarse muscovite alteration contain
abundant masses of round, anhedral rutile, which are1-10 µm in diameter and commonly occur
along cleavage planes or around the margins of the muscovite and sericite masses. This alteration
is best developed proximal to footwall veins, and multiple, adjacent masses of clear euhedral
muscovite and sericite commonly form vein selvages that extend into host rock granites and
quartz monzonites ~0.5-3x the width of their associated vein, typically 5mm-<3.5m. Coarse
muscovite from this alteration type also occurs in fractures that cut AB and ANB veins and host
rock (Figure 15 I).

37
Chalcopyrite, pyrite, and molybdenite are also associated with coarse muscovite
alteration. Chalcopyrite and pyrite commonly occur around the margins of or surrounded by
masses of muscovite and sericite (Figure 15 B, J, K). Molybdenite occurs similarly to
chalcopyrite and pyrite, but is only associated with muscovite and commonly occurs along
cleavage planes (Figure 15 L).
The mineralogy and textures that characterize this alteration are consistent with greisen
alteration (Stavast, 2006; Seedorff et al., 2008; Maher, 2008) that typically forms at significant
depth in porphyry systems (Seedorff et al., 2008). Because of this similarity, this alteration type
is interpreted to be analogous to greisen.
Vein and Alteration Interpretation: Footwall
ANB veins in the footwall are analogous to individual bands within AB veins and the
formation of single CL-dark or CL-bright quartz-rich ANB veins was concurrent with the
formation of single CL-dark or CL-bright quartz-rich bands in AB veins. Thus, the sequence of
events presented below does not include a separate discussion of ANB and AB veins.
The paragenetic stages discussed in the following paragraphs are presented in order from
oldest to youngest (Tables 2, 5) and are based on the crosscutting relationships between the vein
minerals found in the footwall and their associated alteration types, as well as the inferred
chemical evolution of this hydrothermal system. One important detail of this interpretation for
the footwall is that both ANB and AB veins have undergone multiple periods of fracturing or
reopening, and thus, contain two discrete quartz generations and multiple mineral phases that
formed at multiple times intervals. These time intervals are represented by early CL-bright

38
quartz, which is associated with assemblage 1F minerals, and later CL-dark quartz, which is
associated with assemblage 2F and 3F minerals.
1) Precipitation of CL-bright quartz and assemblage 1 (CPy1, Po, Mo1) and formation of
potassic alteration. CL-bright quartz and assemblage 1F Cpy1, Po, and Mo1 precipitated
concurrently and were the earliest minerals to form, as indicated by consistent intergrowths of
these minerals with one another in the footwall. Potassic alteration formed concurrently with CL-
bright quartz, Cpy1, Po, and Mo1 because of its common association with these minerals; all are
commonly overprinted by later coarse muscovite alteration.
2) Precipitation of CL-dark quartz, replacement of assemblage 1F Cpy1 and Po by
assemblage 2F Mt and Py2, and formation of coarse muscovite alteration with assemblage 2F
rutile. All assemblage 2F minerals are intergrown with or surrounded by CL-dark quartz, which
crosscuts and formed after CL-bright quartz. Also, Py2, which is part of assemblage 2F, encloses
assemblage 1F Cpy1 and Po, and, thus, Py2 formed after assemblage 1 minerals. Furthermore,
assemblage 2F Mt and Py2 are intergrown with one another and Mt crystals intergrown with Py2
commonly have a euhedral shape. These textures, as well as the fact that 1F Po and 2F Mt must
have formed under different oxidation conditions, are consistent with Mt having formed after
assemblage 1F minerals.
Coarse muscovite, sericite, and Ru are always intergrown with CL-dark quartz, overprint
potassic alteration, and are commonly adjacent to or intergrown with assemblage 2F Mt and Py2,
indicating that these minerals formed under the same conditions and at approximately the same
time. Because of its ubiquitous and consistent association with coarse muscovite, it is likely that
rutile formed during this timeframe.

39
3) Continued precipitation of CL-dark quartz and coarse mica alteration with
assemblage 2F rutile, and precipitation of assemblage 3F CPy2 and Mo2. Cpy2 and Mo2 are
intergrown with coarse muscovite and rutile and fill fractures in assemblages 1F and 2F sulfide
minerals; thus, assemblage 3F Cpy2 and Mo2 formed after assemblages 1F and 2F. Also, coarse
mica alteration formed concurrently with assemblage 3F minerals because coarse muscovite
crystals are commonly intergrown with or encompass assemblage 3F minerals.
4) Oxidation and precipitation of hematite (Hem). Euhedral to anhedral hematite in the
footwall occurs along the margins of Mt and Py2. Hematite is not associated with quartz or
hydrothermal alteration and formed by supergene oxidation processes after the system cooled.
Vein and Alteration Interpretation: Hanging wall
The petrographic steps discussed below for the hanging wall are presented in order from
oldest to youngest (Table 6) and based on crosscutting relationships between vein mineral
assemblages, vein types, and alteration types. Like the footwall, hanging wall A and B veins
have undergone multiple periods of fracturing or reopening, and contain quartz and minerals that
formed at two discrete times. These time intervals are represented by early CL-bright quartz,
which is associated with assemblages 1 and 2 in the hanging wall, and later CL-dark quartz,
which is associated with assemblages 3 and 4 in the hanging wall.
1) Precipitation of CL-bright quartz and assemblage 1 Sp, Gl, Cc, and Py1 in A and B
veins, and the formation of potassic alteration. CL-bright quartz is intergrown with, and
therefore formed within the same timeframe as, assemblage 1 minerals. Also, because CL-bright
quartz is crosscut by CL-dark quartz and mineral assemblages 2, 3, and 4, CL-bright quartz
formed prior to CL-dark quartz. Furthermore, assemblage 1 minerals, which are associated with

40
CL-bright quartz, are commonly crosscut, replaced, or enclosed by minerals in assemblages 2, 3,
and 4, indicating that assemblage 1 minerals formed prior to assemblages 2, 3, and 4. Similarly,
potassic alteration is spatially associated with and formed concurrently with assemblage 1
minerals and CL-bright quartz.
2) Continued precipitation of CL-bright quartz, precipitation of assemblage 2 Cpy1 Po,
and Mo1, and continued formation of potassic alteration. Cpy1 and Po in assemblage 2 are
always associated with one another and formed together, thus, they are likely to have formed
within the same timeframe, and prior to Py2, which now hosts them as inclusions. Mo1 is part of
assemblage 2 because, similar to Cpy1 and Po, it is commonly partly surrounded by Py2. CL-
bright quartz continued to precipitate while assemblage 2 was precipitating because it is
intergrown with assemblage 2 CPy1 and Mo1. Furthermore, assemblage 2 minerals formed after
assemblage 1 minerals because Mo1, Cpy1, and CL-bright quartz fill fractures in assemblage 1
minerals.
3) Reopening of B veins, fracturing of A veins, precipitation of CL-dark quartz and
assemblage 3 Py2, and Mt, formation of green mica alteration with assemblage 3 rutile, and
formation of D veins. Centerlines and fractures in CL-bright quartz in B veins and fractures that
crosscut CL-bright quartz in A veins are filled with CL-dark quartz and assemblage 3 and 4
minerals. The formation of fractures and spatial relationships clearly indicate that CL-dark quartz
and assemblage 3 and 4 minerals formed after CL-bright quartz and assemblages 1 and 2.
Given that green mica, sericite, and rutile are always associated with CL-dark quartz and
commonly are adjacent to or intergrown with assemblage 3 Py2, Ru, and Mt, green mica
alteration is likely to have formed concurrently with assemblage 3 minerals. Therefore, green
mica alteration is interpreted to be part of assemblage 3.
41
4) Continued reopening of B veins and fracturing of A veins, precipitation of CL-dark
quartz and assemblage 4 Cpy2, Mo2, Bn, and further development of green mica alteration with
assemblage 4 Ru. Cpy2 and Mo2 from assemblage 4 are intergrown with green mica and/or CL-
dark quartz, and partly enclose or fill fractures in all assemblage 1, 2, and 3 sulfide minerals.
These textures indicate that Cpy2 and Mo2 formed after assemblages 1, 2, and 3. Also, Bn
typically forms rims around either CPy1 or CPy2 and it is not clear which generation of
chalcopyrite is associated with Bn. However, given that the majority of CPy1 crystals occur as
inclusions in Py2, its likely that Bn is forming rims on CPy2, and thus, it is included in
assemblage 4 chalcopyrite mineralization.
Intergrown green micas, sericite, and Ru in CL-dark vein quartz and in alteration
selvedges are most abundant in and commonly occur adjacent to samples with abundant
assemblage 4 minerals. These textures indicate that green mica alteration continued to form
during this timeframe and, therefore, green mic alteration is interpreted to also be part of
assemblage 4.
5) Oxidation and precipitation of hematite (Hem). Assemblage 5 hematite occurs on the
margins of Mt and Py2 and is not associated with quartz veining or any observed hydrothermal
alteration. These observations are consistent with formation of hematite by supergene processes
after assemblages 1-4 formed and the system cooled.

42
CHAPTER 5
FLUID INCLUSION PETROGRAPHY AND ANALYSIS
Fluid Inclusions Assemblages (FIAs)
Most fluid inclusions studies of hydrothermal systems focus on spatially related
assemblages of fluid inclusions that have consistent phase ratios indicating they synchronously
trapped past hydrothermal fluids during a discrete time interval and have not been significantly
altered following their formation, and therefore confidently record the pressure, temperature, and
chemical (P-T-X) conditions of the hydrothermal fluid that were present during that time. These
fluid inclusions assemblages, or FIAs (Goldstein and Reynolds, 1994), are commonly found
within growth zones, healed fractures that terminate at the boundary of single crystals of
translucent minerals, or along healed fractures the cut across multiple crystals of translucent
minerals. FIAs are important because they record the evolution of P-T-X conditions within a
hydrothermal system over time, and can be confidently linked to particular generations of
hydrothermal minerals. However, recognition of FIAs in samples from porphyry environments is
made difficult by the fact that the formation of a porphyry system involves many episodes of
fracturing, input of hydrothermal fluids, and precipitation of mineral assemblages overprinting
earlier assemblages. This process results in the overprinting of multiple generations of fluid
inclusions, which makes it difficult to distinguish one generation from another and, because
different generations of fluid inclusions can be hosted by the same mineral, the timing
relationships between them can become obscured. To deal with this difficulty, past studies have
used SEM-CL analysis to differentiate between multiple generations of quartz and the fluid
inclusions they host (Rusk et al., 2004), and to place inclusions into discrete groups based on
spatial association and consistent phase ratios.

43
In samples from the Kabba hanging wall and footwall, unambiguous FIAs were rare.
Most inclusions found in hanging wall and footwall samples occur in scattered clusters and lack
clear evidence for contemporaneous trapping, or occur within fractures in vein quartz, which
crosscut crystal boundaries and inclusions are likely to be secondary. However, spatially related
inclusions were found throughout these samples and were placed in groups based on their liquid
to vapor ratios, CO2 content, the consistent presence or absence of daughter crystals, and
occurrence in either CL-bright or CL-dark quartz. All of these groups typically exhibited similar
behavior during microthermometry and, based on this information, are inferred to have been
trapped more or less synchronously and, thus, represent FIAs.
Fluid Inclusion Group Assignment and Notation
The system used herein to classify fluid inclusions places inclusions in groups based on
liquid to vapor ratios, the number of phases present at room temperature, the presence or absence
of CO2 identified through either petrography or microthermometry, the presence of daughter
crystals that homogenized during heating, and occurrence in either CL-bright or CL-dark quartz.
This system is similar to and uses some of the same terminology as that used by Rusk et al.
(2008) for distinguishing fluid inclusion types found in the Butte Cu-Mo porphyry system.
For the fluid inclusion groups outlined below, “B” stands for bubble, and the number
denotes the average volume percent vapor, “D” is used to denote the presence of opaque or
translucent daughter crystals, and “C” is used to denote the presence of CO2 in an inclusion
group. Using this system, six groups of fluid inclusions were identified in and described for the
hanging wall (B15, B30D, B30H, B75, B20C, and B75C) and three groups were identified in and
described for the footwall (B15C, B15D, and B30).

44
Fluid Inclusion Groups: Footwall
B15D: B15D inclusions represent 52% of all footwall inclusions, and occur as scattered
clusters of individual inclusions in Cl-bright quartz in both AB and ANB veins (Figure 18 A, 19).
These inclusions are similar to B15 inclusions found in the hanging wall in that B15D inclusions
contain liquid, a vapor bubble that occupies ~5-15 vol% of the inclusions, and, rarely, a
translucent or opaque daughter crystal. The inclusions range in size between 5-30 µm (~7.5 µm
mode), and have outer walls that form triangular and rectangular shapes with rounded edges.
However, unlike B15 inclusions, B15D inclusions, in some localities, have jagged or irregular
boundaries and form large, elongate inclusions.
Approximately 19% of B15D inclusions contain an oval- or triangular-shaped opaque
daughter crystal. The oval opaque daughter crystals are ~1-2 µm wide, did not homogenize
during heating, and were not identified. The triangular daughter crystals typically occupied a
volume slightly greater than or equal to the volume occupied by the vapor phase, approximately
~1.5-3 µm, and, based on their shape, are inferred to be chalcopyrite. These triangular daughter
crystals did not homogenize during heating and only rarely occur in the same inclusions as the
unidentified oval daughters.
Approximately 4% of B15D inclusions contain an elongate, rectangular, translucent
daughter crystal. These daughter crystals never homogenized during heating and are up to ~1.5-4
µm wide. Similar daughter crystals in CO2-rich inclusions in the footwall were identified by
Raman analysis as calcite, and it is likely that these translucent daughter crystals in B15D
inclusions are also calcite.

45
B30: B30 inclusions comprise 2% of all footwall inclusions and occur as scattered
clusters in CL-bright quartz in AB and ANB veins (Figure 18 B, 19). These inclusions generally
have a rectangle shape with a variably sinuous outer rim, contain liquid and a vapor phase that
occupies ~10-30 vol% of the inclusion, and most contain an opaque daughter crystal. The
inclusions contain no detectable CO2 and range in size from 10-30 µm.
Eighty percent of B30 inclusions contain round or oval opaque daughter crystals that are
~1-2 µm wide and did not homogenize during heating. Like other inclusions with similar opaque
daughters, this phase was not identified.
B15C: B15C inclusions comprise ~46% of all inclusions found in the footwall and occur
as scattered clusters in bands of CL-dark quartz or in CL-dark quartz that fills fractures in CL-
bright quartz (Figure 18 C, 19). These inclusions are two- or three-phase H2O-CO2 inclusions
that normally have a rectangular or elongate shape and were typically ~10 µm in size, but range
from 5-72 µm. B15C inclusions contain H2O liquid and CO2 vapor that typically occupies 5-15
vol% of the inclusion, but ranges between ~ 2-30 vol%. B15C inclusions also commonly contain
a CO2 liquid phase that is visible at room temperature, and occupies 2-5 vol% of the inclusion.
The presence of liquid CO2 is more common and consistently present in this inclusion group
compared to other CO2-bearing fluid inclusions groups; however, a distinct liquid CO2 phase was
difficult to observe in small inclusions.
Approximately 6% of B15C inclusions contain an elongate or round opaque daughter
crystal. This opaque phase is typically ½ - ¼ the volume occupied by the inclusion’s vapor
bubble, approximately ~1-2µm, and did not homogenize during heating. As with other inclusions
that contain a similar opaque phase, this daughter crystal was not identified. Also, ~3.5% of
46
B15C inclusions contain a rectangular, translucent daughter phase that is ~1.5-3µm wide, and did
not homogenize during heating. Raman analysis of two of these crystals determined that they are
calcite.
Fluid Inclusion Groups: Hanging Wall
B15: B15 inclusions comprise 6% of all hanging wall inclusions. These inclusions occur
in randomly scattered clusters in CL-bright quartz in A and B veins, contain a vapor bubble that
occupies 5-15 vol% of the inclusions, range in size from 5-17.5 µm (~7.5 µm mode), and have
angular or sinuous outer walls (Figure 18 D, 19). B15 inclusions do not contain any opaque or
translucent daughter crystals; however, their irregular shape made it difficult to inspect the
interior of some inclusions for the presence of small elongate opaque daughters that might have
been present in corners or alcoves against the inclusion’s outer walls.
B30D: B30D inclusions comprise 31% of all fluid inclusions found in the hanging wall.
These inclusions typically occur as scattered clusters spread throughout CL-bright quartz in A
and B veins, contain liquid and a vapor bubble that occupies ~10-30 vol% of the inclusion, and
some contain one or two translucent or one opaque daughter crystals. The inclusions range in
size from 5-20 µm (~10 µm mode), and form rounded rectangular shapes (Figure 18 E, 19). In
three locations in B veins, primary B30D inclusions are aligned within growth zones in CL-
bright quartz; however, most B30D inclusions lack conclusive evidence for a primary origin.
At room temperature 44 % of B30D inclusions contain at least one, or in rare cases two,
translucent daughter crystals. The most common translucent daughter is ~1.5-3 µm wide,
rectangular or cubic with rounded edges, never melted during heating, and was not identified.
The other common translucent daughter found in B30D inclusions is round or oval in shape,

47
always occurred with the rectangular translucent daughter, and is found in <10% of the B30D
inclusions. This oval translucent daughter never melted during heating and was not identified.
Approximately 37% of B30D inclusions contain a single triangular or oval opaque
daughter crystal. The oval opaque daughter crystal is ~1-2 µm wide, never homogenized, and
represents ~80% of all of the opaque daughters observed in B30D inclusions. As with the oval
opaque daughters identified in other inclusions groups, the opaque in B30D inclusions never
homogenized and was not identified. The triangular opaque crystal comprises the other 20% of
all the opaque phases observed in B30D inclusions, never homogenized, and is ~1-3µm wide.
Based on its triangular shape it is likely that this opaque daughter is chalcopyrite. Both opaque
crystals commonly occur with translucent daughter crystals, but never occur together in the same
inclusion.
B30H: B30H inclusions comprise ~9% of all hanging wall inclusions and occur as
scattered clusters in CL-bright quartz near the outer boundary of individual quartz crystals in A
and B veins (Figure 18 F, 19). B30H inclusions contain liquid, a vapor phase that occupies ~10-
30 vol% of the inclusion, halite, and some contain one or two opaque daughter crystals. Within a
cluster of B30H inclusions it is common for 3-5 of these inclusions to be within 15-30 µm of
each other. The inclusions range in size from 5-20 µm (~10 µm mode) and have a sinuous or
oval shape. All B30H inclusions contain a translucent halite daughter crystal at room temperature
that has a rectangular or cubic shape, and is 1-3.5 µm in diameter. This halite daughter crystal
was identified by its shape, similar index of refraction with quartz, and by melting during
microthermometry.
Approximately 25% of B30H inclusions contain one to two opaque daughter crystals. Of
these, 88% have an oval shape and range in size from 0.5-1.5 µm wide, never melted during

48
heating, and were not identified. The remaining 12% of opaque daughters are triangular in shape,
range in size from 0.5-1 µm, never melted during heating and, based on the triangular shape, are
likely to be chalcopyrite.
B75: B75 inclusions comprise 6% of all hanging wall inclusions, contain liquid, a vapor
phase that occupies 70-85 vol% of the inclusion, and a few contain an opaque daughter crystal.
The inclusions range in size from 5-17.5 µm (~10 µm mode), and have a rectangular shape with
rounded edges (Figure 18 G, 19). These inclusions occur as scattered clusters of inclusions in
CL-bright quartz in A and B veins and are absent from hanging wall samples that are dominated
by CL-dark quartz. B75 inclusions are also commonly found interspersed with B30D inclusions
in A and B veins.
Unlike the B75C inclusions that occur the hanging wall, these inclusions exhibited
neither visible nor microthermometric behavior that would indicate the presence of CO2.
However, because of their similar shape, size, and vol% vapor to B75C inclusions, B75
inclusions are difficult to distinguish. Also, though B75 inclusions occur exclusively in CL-
bright quartz and B75C inclusions occur exclusively in CL-dark quartz, distinguishing between
the CL-dark and CL-bright quartz is not possible in transmitted light and these two quartz
varieties and the fluid inclusions they contain are commonly adjacent. Thus, recognition of CO2
or a lack thereof during microthermometry was key to differentiating between these two
inclusion types.
Approximately 3% of B75 inclusions contain an oval opaque daughter crystal, which is
similar to the oval opaque daughters described in B30D and B20C inclusions, but is slightly
larger in size. This opaque crystal normally occupies an area within the small liquid portion of

49
B75 inclusions, did not homogenize during heating, is typically difficult to clearly view, and was
not identified.
B20C: B20C inclusions comprise 22% of the inclusions found in hanging wall samples
and occur as scattered clusters of inclusions in CL-dark quartz in B veins or along randomly
oriented CL-dark quartz-filled fractures that crosscut CL-bright quartz (Figure 18 H, 19). B20C
inclusions contain liquid, a CO2 vapor bubble that occupies 10-30 vol% (~15-25 vol% average)
of the inclusion, and a few inclusions contain an opaque or translucent daughter crystal. Also,
50% of B20C inclusions contain visible liquid CO2 that typically occupies ~2-5 vol% of the
inclusions, but may reach 10 vol% in some inclusions. The inclusions typically have irregular
shapes with sinuous or jagged boundaries and range in size from 5-32.5 µm (~10 µm mode).
Approximately 4% of B20C inclusions contain a rectangular translucent daughter, which
occupies the same vol% as the vapor phase within the inclusion. Similar translucent daughters in
CO2-bearing inclusions analyzed with Raman were identified as calcite and it is concluded that
these daughters are calcite as well.
Approximately 7% of B20C inclusions contain an elongate or oval opaque phase that is
similar to that described in B30D inclusions. This phase also did not homogenize during heating
and could not be identified optically. With the exception of 3 inclusions, B20C inclusions do not
contain more than one daughter crystal.
B75C: B75C inclusions comprise 26% of the inclusions found in hanging wall samples
and contain liquid, a vapor bubble that occupies 70-85 vol% of the inclusion and contains CO2,
and many inclusions contain liquid CO2 that occupies 2-3 vol% of the inclusion (Figure 18 F,
19). These inclusions commonly occur in scattered clusters in CL-dark quartz in B veins or in
CL-dark quartz that filled fractures that cut CL-bright quartz in A veins, can range in size from

50
~5-25 µm (~7.5 µm mode), and have an oval or rectangular shape. No opaque or translucent
daughter crystals were observed in B75C inclusions.
Fluid Inclusion Group Distribution
The A, AB, ANB, and B veins described in the previous sections host the fluid inclusion
groups described above. These veins were collected from the hanging wall and the footwall
areas that comprise the Kabba porphyry prospect and each vein type contains both CL-bright and
CL-dark quartz.
B15D, B15C, and B30 inclusions are found only in the footwall (Figure 19) and occur in
both AB and ANB veins. B15D and B30 inclusions were only identified in CL-bright quartz in AB
and ANB veins associated with potassic alteration (Table 7) and comprise 54% of the inclusions
in the footwall, with B15D inclusions representing 52% and B30 representing 2% of all footwall
inclusions (Figure 19). In contrast, B15C inclusions were only identified in CL-dark quartz in AB
veins associated with coarse mica alteration and ANB veins with well-defined coarse mica
alteration selvedges, and comprise 46% of all footwall inclusions (Figure 19).
B15, B30D, B30H, B75, B20C, and B75C inclusions are all only found in the hanging
wall and were trapped in CL-bright and CL-dark quartz in A and B veins (Table 7). The aqueous
inclusion groups, B15, B30D, B30H, and B75, are found solely in CL-bright quartz and are most
abundant in A veins with potassic alteration halos, and B veins which are composed of > 60%
Cl-bright quartz and have no well-defined green mica alteration selvedge. In total, these
inclusions comprise 52% of all hanging wall inclusions including 6% B15 inclusions, 31% B30D
inclusions, 9% B30H inclusions, and 6% B75 inclusions (Figure 19).

51
The CO2-bearing B20C and B75C inclusion groups are found solely in CL-dark quartz
and are most abundant in B veins that are composed of >40% CL-dark quartz and have well-
defined green mica alteration selvedges. B20C and B75C inclusions comprise 48% of the
inclusions in the hanging wall, with B20C inclusions representing 22% and B75C representing
26% (Figure 19).
Microthermometric Evaluation of CO2 Content
The CO2 content of each inclusion group was evaluated and quantified during fluid
inclusion petrography and microthermometry. The majority of fluid inclusions that contain CO2
contain a visible liquid CO2 phase at room temperature or exhibited one or more of the following
criteria during microthermometry: condensation of liquid CO2 during cooling below 10°C,
discrete freezing of H2O and CO2 or “double freezing” while cooling, CO2 ice melting at
approximately -56.6 ± 0.1°C during heating, or clathrate melting between 0.2-10.0°C during
heating.
B15C, B20C, and B75C inclusions all exhibited at least one of the above criteria and
>75% of the inclusions in each group exhibited two or more of these criteria (Table 8).
Recognition of the presence of CO2 in B20C, B75C, and B15C inclusions is a key diagnostic
characteristic for these inclusion groups, and differentiates them from fluid inclusions that have
similar liquid to vapor ratios, but show no evidence for CO2 during microthermometry.
Inclusions in these three groups are referred to as “CO2-bearing” here after.
Most commonly, the presence of CO2 in each group was identified by clathrate melting
between 0.2-10°C, which was observed in 94% of B20C inclusions, 86% of B75C inclusions,
and 95% of B15C inclusions (Table 8). In other inclusions, CO2 ice melting at approximately -

52
56.6 ± 0.1°C during heating indicated the presence of CO2 (Appendix E). The presence of liquid
CO2 was highly variable for all three CO2-bearing inclusion types, and observing liquid CO2 was
difficult because of the small size and vol% of the liquid CO2 phase, the small size of the
inclusions themselves, and the CO2 homogenization temperature range for each group (23.1-
28.8°C for B75C, 23.0-28.0°C for B20C and 20.6-30.5°C for B15C), which bridges typical room
temperatures (~26°C) (Appendix E). However, where absent at room temperature, liquid CO2
condensed in the majority of these inclusions during cooling to below ~10°C.
For B15C, B20C, and B75C inclusions, bulk CO2 and mol% CO2 were calculated using
the MacFlincor program (Brown, 1989; Brown and Hagemann, 1994), based on the equation of
state for H2O-CO2 (Bowers and Helgeson, 1983). This program calculates bulk CO2 for CO2-
bearing inclusions from clathrate melting temperature, CO2 homogenization temperature, and an
estimated vol% CO2 from petrography. With the exception of CO2 homogenization temperature,
all of these variables were observed in the vast majority of B20C, B75C, and B15C inclusions.
For inclusions in which CO2 homogenization was not observed, the average CO2
homogenization temperature of an inclusion group was used for the calculations.
All B15, B15D, B30, B30D, B30H, and B75 inclusions lacked any evidence of the
presence of CO2 during petrographic analysis and microthermometry; thus, it was assumed that
these inclusions either contain no CO2 or contain a vanishingly small amount of CO2. These
inclusions are referred to hereafter as aqueous inclusions.
Raman Analyses
Raman analysis was used to measure CO2 density in B15C, B20C, and B75C inclusions
and to evaluate the possible CO2 content of B15, B15D, B30, B30D, B30H, and B75 inclusion

53
groups (Table 9). This technique was also used to identify some of the translucent daughter
crystals present in B15C inclusions. All calculations of CO2 densities measured by Raman
analysis were accomplished by measurement of the spacing and displacement of bands in the
Fermi diad of CO2 (Wang et al., 2011).
Raman analyses detected CO2 in all analyzed B20C and B75C inclusions (Table 9).
B20C inclusions have a CO2 density between 0.01 – 0.76 g/cm3, and an average density of 0.245
g/cm3, with 70% inclusions being between 0.14-0.34 g/cm3. B75C inclusions have a similar CO2
density range of 0.001 – 0.76 g/cm3 and an average density of 0.307 g/cm3, and have a regular
distribution of CO2 densities throughout this range.
Though all seven B15C inclusions analyzed with Raman had exhibited evidence of CO2
during microthermometry, Raman analysis only detected the presence of CO2 in 4 of the 7
analyzed inclusions (Table 9). A probable explanation for the absence of a Raman signal for
some B15C inclusions relates to the fact that the Raman laser must be focused on the vapor
phase in an inclusion, and the small vapor fraction typically present in this inclusion group,
movement of the vapor phase within the inclusions during analysis, and the typical small size of
B15C inclusions made focusing on the vapor phase difficult. B15C inclusions that exhibited a
Raman signal for CO2 have a CO2 density between 0.001-0.77 g/cm3 and an average CO2 density
of 0.243 g/cm3 (Table 9). The CO2 densities measured for B15C inclusions have a regular
distribution throughout this range, thus, the CO2 density of B15C inclusions is highly variable. In
addition to evaluating the CO2 content of B15C inclusions, three translucent daughter crystals
present in this inclusion group were analyzed with Raman microscopy. All three daughter
crystals analyzed showed the same spectra, which are consistent with calcite.

54
None of the analyzed B15, B15D, B30D, B30H, and B75 inclusions exhibited
microthermometric evidence of CO2. However, fluid inclusions from porphyry environments that
do not show evidence of CO2 during microthermometry, such as the B35 or B60 fluid inclusions
in the Butte porphyry (Rusk et al., 2008), exhibited evidence of CO2 when analyzed using
Raman spectroscopy. Thus inclusions from the B15, B15D, B30D, B30H, and B75 groups were
analyzed with Raman to determine if CO2 was present in any of these groups.
Raman analysis of the B15, B15D, B30D, B30H, and B75 groups showed that one of five
analyzed B15, 15 of 24 of B30D, one of seven B30H, four of six B75, and eight Of 25 B15D
inclusions contained detectable CO2 (Table 9). CO2-bearing inclusions in the B15D, B20D, and
B75 groups had similar average CO2 densities of 0.157 g/cm3, 0.159 g/cm3, and 0.11 g/cm3,
respectively. In the B15 and B30H groups, only one of the analyzed inclusions in each group
contained detectable CO2. The CO2-bearing inclusions in the B15 group had a density of 0.77
g/cm3 and the CO2-bearing inclusion in the B30H group had a density of 0.14 g/cm3. These CO2-
bearing inclusions were kept in their respective groups because they comprised only a small
number of inclusions within their groups; however, they do provide evidence for at least a small
component of CO2 in these inclusion fluids. Also, as only small amounts of CO2 were identified
in inclusions within the aqueous inclusion groups, the presence of CO2 is variable and generally
minor. Therefore detection of CO2 by Raman analysis was not used as a parameter for assigning
fluid inclusions to particular groups.
No B30 inclusions were analyzed with Raman spectroscopy. However, given that many
of the other inclusion groups that did not show microthermometric evidence of CO2 contained
detectable CO2, it is likely that this inclusion group contains some CO2-bearing inclusions as
well.

55
Microthermometry: Application
All fluid inclusion groups described previously were initially evaluated using
microthermometry to quantify P-T-X conditions related to fluids trapped in each inclusion group
(Table 8). Detailed microthermometric data from the hanging wall and footwall are tabulated in
Appendix E. Salinity, bulk density, bulk CO2 fraction (where applicable), and isochors that are
used to identify approximate trapping temperatures of fluid inclusions were determined using the
MacFlincor program (Brown, 1989; Brown and Hagemann, 1994). Calculations for B15, B15D,
B30, B30D, B30H, and B75 inclusions were based on phase equilibria for a fluid in the H2O-
NaCl-KCl system (Bodnar and Vityk, 1994). Other than the B30H inclusions, these inclusion
groups did not contain halite at 25°C and did not exhibit microthermometic evidence for CO2;
thus, the final ice melting temperature was used to determine salinity, and final homogenization
temperature was used to determine bulk density and construct isochors for each trapped fluid.
B30H inclusions exhibited halite melting during heating; thus, the halite melting temperature
was used to calculate salinity. B15, B15D, B30D, and B30 inclusions all homogenized to liquid
and none exhibited critical behavior. B75 inclusions also did not exhibit critical behavior, but
homogenized to vapor rather than liquid, and minimum homogenization temperatures were
determined from the earliest apparent filling of the inclusion by vapor expansion.
B15C, B20C, and B75C inclusions all showed microthermometic and/or Raman evidence
for the presence of CO2 and were evaluated by the MacFlincor program (Brown, 1989; Brown
and Hagemann, 1994) using phase equilibria for H2O-CO2 (Bowers and Helgeson, 1983). For
these inclusions the variable used in the calculation of salinity was the final clathrate melting
temperature; the variables used to determine bulk density and bulk CO2 fraction include the

56
temperature of CO2 liquid and CO2 vapor homogenization and estimation of the CO2 vapor
fraction, respectively. For many B15C, B20C, and B75C inclusions, CO2 homogenization
temperatures were not observed because of the lack of visible liquid CO2 and the small size of
many of the inclusions, which made the liquid CO2 phase difficult to see. Bulk density and mol%
CO2 calculations for such inclusions in the B15C, B20C, and B75C groups used the average
observed CO2 homogenization temperature for other inclusions within the same inclusion group.
Leaking or decrepitation occurred commonly while heating many inclusions within all
fluid inclusion groups between 350-500°C. This problem was particularly common for B15C,
B20C, B30D, B30H, B75C, and B75 inclusion groups when the rate of heating was > 10°C/min.
Therefore, great care was taken during microthermometric heating to verify that inclusions did
not leak, and a rate of 5°C/min was used to minimize decrepitation.
In the B15, B30D, B20C, B75C inclusion groups in the hanging wall and the B15D and
B30 inclusion groups in the footwall, the temperature range of homogenization is typically wide,
with the lowest and highest temperatures differing by as much as 100->200°C. Part of this large
range is a result of each inclusion group containing with of at least 10 vol% vapor in the group.
In addition, the range in homogenization temperatures might be linked to the variable CO2
compositions of inclusions within these groups, but the true cause is not clear. However, within
the overall range of homogenization temperatures for the B15, B30D, B20C, B15D, and B30
groups, many inclusions were part of smaller, spatially related inclusion groups with smaller
homogenization temperature ranges. These smaller ranges are more representative of the
homogenization behavior of an FIA and are presented in the following paragraphs.

57
Microthermometry: Footwall
B15D: Approximately 32% of B15D inclusions contained minor CO2 detectable during
Raman analysis, but none showed behavior consistent with the presence of CO2 during
microthermometry. Therefore, ice melting temperatures were used to calculate salinities for these
inclusions (Table 8). Ice melting temperatures in B15D inclusions ranged from -0.9 - -6.0°C,
with an average of ~ -3.1°C. This melting point depression range corresponds to a salinity range
of 2.0-9.0 wt% NaCl equivalent (5.0 wt% NaCl equivalent average), with 71% of inclusions
having salinities between 2.5-5.9 wt% equivalent.
The majority of B15D inclusions homogenized to liquid between 115.0-271.0°C and had
an average homogenization temperature of 203.0°C. Within this range of homogenization
temperatures, 22% of B15C inclusions were between 120.0-137.0°C, and 25% were between
167.0-179.0°C (Figure 20). These homogenization temperatures correspond to a bulk density
range of 0.85-1.00 g/cm3 and an average bulk density of 0.94 g/cm3. The fluid trapped by B15D
inclusions is the second most dense fluid trapped in the hanging wall and the second most dense
inclusion type overall. Daughter phases in B15D inclusions did not homogenize or shrink during
heating.
B15C: Approximately 88% of B15C inclusions exhibited clathrate melting between 0.2 –
10°C and have an average clathrate melting temperature of 8.0°C (Table 8). These clathrate
melting temperatures correspond to a salinity range of 0.0-15.0 wt% NaCl equiv. and an average
salinity of 3.8 wt% NaCl equivalent. Within the 0.0-15.0wt% NaCl equiv range, 48 % of B15C
inclusions have salinities between 0.0-1.8 wt% NaCl equivalent. Approximately 51.4% of B15C
inclusions were successfully heated without leaking or decrepitation. All of these homogenized

58
to liquid between 115.0-271.0°C and have an average homogenization temperature 203.0°C
(Figure 20).
Carbon dioxide homogenization was only observed in 36.5% of B15C inclusions and
occurred between 20.6-30.5°C, with 87% of these homogenizing between 30-30.5°C (30.1°C on
average). This CO2 homogenization temperature range, as well as the average homogenization
temperature of 30.1°C, yielded a range of CO2 concentrations between 1-10.3 mol% CO2, with
~79% of B15C inclusions containing between 3-5 mol% CO2. Corresponding densities for these
inclusions range from 0.89-1.10 g/cm3 and an average CO2 density of 0.98 g/cm3. Based on these
densities, B15C inclusions contain the densest fluid trapped in inclusions in the footwall and the
second densest fluid trapped in all inclusion groups.
B30: During microthermometry B30 inclusions exhibited similar behavior to B30D
inclusions in the hanging wall, but had a narrower range in ice melting temperatures and
salinities. Final ice melting in B30 inclusions occurred between -2.3 - -3.4°C and was -3.1°C on
average (Table 8). These ice melting temperatures correspond to a salinity range of 4.0 - 6.0 wt%
NaCl equivalent and an average salinity of 4.8 wt% NaCl equivalent.
B30 inclusions homogenized to liquid between 151.0-283.0°C and have an average
homogenization temperature of 227.0°C. Within this range of homogenization temperatures,
80% of B30 inclusions homogenize between 242.0-282.0°C (Figure 20). The overall
homogenization temperature range for B30 inclusions corresponds to a bulk density range of
0.80-0.92 g/cm3 and an average bulk density of 0.84 g/cm3. Also, none of the opaque phases in
B30 inclusions homogenized during heating.
Microthermometry: Hanging Wall

59
B15: B15 inclusions showed no behavior consistent with the presence of CO2 during
microthermometry and do not contain any opaque or translucent daughters. Ice melting
temperatures are between -1.6 - -11°C (-4.5 °C average) (Table 8). This is a wide ice melting
temperature range and B15 inclusions exhibit a regular distribution across this range; thus, there
is no mode representing a majority of inclusions (Figure 20). However, this ice melting
temperature range corresponds to a salinity range of ~3.0-15.0 wt% NaCl equivalent and an
average salinity of 8.5 wt% NaCl equivalent.
Homogenization temperatures in B15 inclusions ranged from 167.0-342.0°C, and had an
average temperature of ~257.0°C (Figure 20), with 37% of inclusions homogenizing between
239.0-265.5°C and 37% between 305.3-342.6°C. This homogenization temperature range
corresponds to a bulk density range of 0.73-0.93 g/cm3 and an average bulk density of 0.82
g/cm3. Based on this density range, B15 inclusions have the second highest average bulk density
of all fluids trapped in hanging wall inclusions.
B30D: B30D inclusions do not show microthermometric evidence for CO2 and none of
the translucent or opaque daughter crystals in the inclusions melted during heating; thus, the
variables that determine the salinities and bulk densities for these inclusions are final ice melting
temperature and L-V homogenization, respectively. Ice melting temperatures for B30D
inclusions ranged between -0.1 - -21.1°C and averaged -5.7°C, with 71% of B30D inclusions
exhibiting ice melting between -2.5 - -4.6°C (Table 8). Inclusions in the total ice melting
temperature range had corresponding salinities between 2.0 -16.0 wt% NaCl equivalent and an
average salinity of 8.6 wt% NaCl equivalent, with 71% having salinities of 4.1-7.3 wt% NaCl
equivalent.

60
Approximately 40% of the B30D inclusions homogenized to liquid between 106.0 –
430.0°C during heating (Figure 20). Within this homogenization temperature range, 36%
homogenized between 220.0-234.0°C. The remaining 60% of B30D inclusions, which did not
homogenize, either decrepitated before final homogenization or were not heated and were
preserved for LA-ICP-MS analysis. The homogenization temperature range observed in B30D
inclusions corresponds to a bulk density range of 0.55 – 0.97 g/cm3 and an average bulk density
of 0.75 g/cm3, with 32% between 0.702-0.785 g/cm3.
B30H: None of the B30H inclusions showed microthermometric evidence for CO2 and
halite melting was used to calculate salinity. A total of 11 B30H inclusions were heated to
homogenization without leaking or decrepitation. Of these 11 inclusions, 8 exhibited final
homogenization to liquid via vapor bubble disappearance at a temperature above the halite
melting temperature. The remaining three inclusions exhibited final homogenization via halite
melting at temperatures above the liquid-vapor homogenization temperature.
For the 8 inclusions which exhibited final homogenization via vapor bubble
disappearance, halite melting occurred along a wide temperature range between 176.6-312.1°C
(~203.0 on average), which corresponds to a wide range in salinities between 31.0-39.0 wt%
NaCl equivalent (Table 8). However, within the halite melting temperature range for these
inclusions, ~88% exhibited halite melting along a narrower temperature range between 176.6-
215.2°C, which corresponds to a salinity range between 31.0-33.0 wt% NaCl equivalent (Table
8). Following halite melting, these inclusions exhibited liquid-vapor homogenization along a
wide temperature range between 210.5-437.6°C (~271.0°C on average), which corresponds to a
bulk density range between 0.88-1.11 g/cm3 (~1.06 g/cm3 on average) (Table 8). Within the
range in liquid-vapor homogenization temperatures for these inclusions, ~75% exhibited vapor

61
bubble disappearance within a narrower temperature range between 210.5-286.4°C, which
corresponds to a narrower range in bulk density between 1.03-1.11 g/cm3 (Table 8). Based on the
overall bulk density range, B30H inclusions are the most dense inclusion group in the hanging
wall and the most dense inclusion group over all.
For the three inclusions that exhibited final homogenization by halite melting, halite
melting occurred between 312.1-365.0°C (~332.9°C on average) and vapor bubble
disappearance occurred between 265.1-285.4°C (~277.4°C on average). These inclusions could
have formed via three possibilities: 1) very high pressures during formation, 2) post entrapment
modification, and 3) heterogeneous entrapment (Lecumberri-Sanchez, 2015). It is not clear
which possibility is most likely and this uncertainty makes calculating salinities and bulk
densities from these inclusions difficult. However, given the fact that only three inclusions in the
B30H group exhibited this behavior, it is likely that they do not represent a pattern and are
therefore excluded from the discussion and interpretation in the following chapters.
B75: The large vapor fraction present in B75 inclusions made it difficult to observe the
liquid fraction and collect ice melting temperatures for the majority of these inclusions.
However, incremental heating and cooling during microthermomentry facilitated determination
of accurate temperatures for many of these inclusions. Ice melting temperatures for B75
inclusions ranged between -1.0 - -5.5°C with an average of -2.9°C (Table 8). These temperatures
correspond to a salinity range of 2.0-6.0 wt% NaCl equivalent and an average salinity of ~4.5
wt% NaCl equivalent, with 75% between 4.4-5.8 wt% NaCl equivalent.
As with all vapor-rich inclusions, final homogenization temperatures for B75 inclusions
cannot be accurately determined because final homogenization to vapor cannot be accurately
measured (Sterner and Bodnar, 1989; Sterner, 1992). Also, some inclusions from this group

62
decrepitated before homogenization. Thus, it was only possible to gather minimum
homogenization temperatures for a limited number of B75 inclusions. Despite these limitations,
23% of analyzed inclusions yielded minimum homogenization temperatures between 357.0-
405.0°C and averaged 378.0°C.
B75 inclusions contain the lowest density fluid trapped in the hanging wall and the
second lowest density fluid over all. Bulk densities for these inclusions have a very narrow range
between 0.53 - 0.58 g/cm3 and an average bulk density of 0.55 g/cm3.
B20C: Clathrate melting was observed in 91% of B20C inclusions between 5.3-10.0°C,
and averaged 9.3°C (Table 8). This range corresponds to a salinity range of 0.0-8.0 wt% NaCl
equivalent and an average salinity of 1.6 wt% NaCl equivalent. Within this salinity range 75% of
B20C inclusions have salinities from 0.0-1.8 wt% NaCl equivalent.
Approximately, 49% of B20C inclusions were successfully heated without leaking or
decrepitation. These inclusions all homogenized to liquid between 120.0-400.0°C and 294.0°C
on average, with 40% homogenizing between 301.0-352.0°C.
CO2 homogenization was observed in only 13.5% of B20C inclusions at temperatures
between 23.0-28.0°C, with an average temperature of 27.3°C. These temperatures correspond to
a range in CO2 concentrations between 3.0-45.0 mol% and an average CO2 content of ~15.0
mol%. Within this range, inclusions clustered between 3.0-15.0 mol% CO2 and 21.0-45.0 mol%
CO2, with ~72% of inclusions being in the 3.0-15.0 mol% CO2 group. Corresponding bulk
densities for B20C inclusions are between 0.74-0.98 g/cm3 and were approximately 0.88 g/cm3
on average. Based on bulk density B20C inclusions are the second-most dense fluids trapped by
inclusions in the hanging wall and the fourth most dense fluid inclusion group overall.

63
B75C: Due to their large vapor fraction, clathrate melting temperatures for B75C
inclusions were difficult to observe. However, 84% of B75C inclusions formed clathrate during
cooling. Observed clathrate melting temperatures (Tmclath) were between 3.5-10.0°C with an
average temperature of 8.8°C (Table 8). This Tmclath range corresponds to a salinity range of 0.0-
9.0 wt% NaCl equivalent, with ~69% of B75 inclusion having salinities between 0.0–1.6 wt %
NaCl equivalent.
All B75C inclusions homogenized to vapor, and recorded temperatures are minimum
estimates owing to the difficulties of determining final homogenization temp (Sterner and
Bodnar, 1989; Sterner, 1992). Minimum homogenization temperatures ranged between 101.0-
533.0°C and were ~300.0°C on average, with 17% between 200.0-210.0°C and 46% between
300.0-393.0°C. As homogenization temperatures for B75C are minimum temperatures, the
calculated bulk densities of these inclusions are also minimum values.
Mole % CO2 for B75C was difficult to determine because liquid CO2 was only observed
in 3% of B75C inclusions at room temperature. It was hard to discern the CO2 liquid-vapor
homogenization temperature in inclusions that did have a clearly visible liquid CO2 phase
because there was usually <2-3% liquid CO2 and the phase boundary was normally obscured by
the wall of the inclusion. Of the 3% of B75C inclusions that contained visible liquid CO2 at room
temperature, CO2 homogenization occurred between 23.0-29.0°C, with an average temperature
of 25.0°C. For B75C inclusions in which CO2 homogenization was not observed, the average
temperature of 25.0°C was used to calculate mol% CO2. Calculations using the observed and
average CO2 homogenization temperatures yielded a mol% CO2 range for B75C inclusions
between 3.0-27.0 mol% CO2, with ~84% falling between 22.0-27.0 mol% CO2. Corresponding
bulk densities for B75C inclusions were between 0.47-0.90 g/cm3, with an average value of 0.53

64
g/cm3. Based on this bulk density and mol% CO2, B75C inclusions trapped the lowest density
CO2-bearing fluid, and the lowest density fluid identified in this study.

65
CHAPTER 6
LA-ICP-MS
Following petrographic characterization of fluid inclusion groups and microthermometry,
individual inclusions from the B15, B15C, B15D, B20C, B30D, B30H, B75, and B75C inclusion
groups were analyzed by laser ablation, inductively coupled plasma, mass spectrometry (LA-
ICP-MS) to quantify the abundance of a number of elements present in the fluids trapped within
the inclusions. Single inclusion LA-ICP-MS signals and element ratios were quantified by
integration of all measured elements, corrected for host rock contributions, compared to intensity
ratios with a NIST glass standard, and referenced to the absolute concentration of Na determined
by microthermometry. Because heating typically resulted in leakage or decrepitation of
inclusions from most analyzed inclusion groups, and because inclusions that have leaked or
decrepitated during heating are not acceptable for LA-ICP-MS analysis, inclusions from B15,
B15D, B15C, B20C, B30D, B75, and B75C groups that were analyzed with LA-ICP-MS were
frozen and incrementally thawed to determine their salinity, but were never heated above 30°C
prior to LA-ICP-MS analysis. Because the analyzed inclusions have similar characteristics to,
and are spatially related to, other inclusions within their respective fluid inclusions groups, it is
reasonable to assume that the analyzed inclusions that were destroyed during LA-ICP-MS
analysis had homogenization temperatures similar to analogous inclusions that were not analyzed
with LA-ICP-MS and were heated during microthermometry. Also, the salinity of halite-bearing
inclusions is typically determined by halite melting during heating, and it was not possible to
determine salinities for B30H inclusions prior to analysis. To address this problem, salinities for
B30H inclusions analyzed using LA-ICP-MS were derived from the average salinity of B30H
inclusions that were heated to determine halite melting temperatures.

66
The elements chosen for analysis with LA-ICP-MS include Ag, Au, As, Ba, Ca, Cu, Cs,
Fe, K, La, Li, Mn, Mo, Na, Pb, Rb, S, Si, Sn, Sr, Ti, V, W, Zn. These elements were chosen
because they are major constituents of fluids found in other porphyry systems (Ulrich et al.,
2001; Rusk et al., 2004). The LA-ICP-MS data presented herein are compared to LA-ICP-MS
analysis of fluid inclusions from the Butte and Bajo de la Alumbrera deposits (Ulrich et al.,
2001; Rusk et al., 2004), which analyzed a similar group of elements (Ag, Au, As, Ba, Ca, Cu,
Cs, Fe, K, La, Li, Mn, Mo, Na, Pb, Rb, S, Si, Sn, Sr, Ti, W, Zn). The data presented below focus
on Au, Ba, Ca, Cs, Cu, Fe, K, Mn, Mo, Na, Pb, Rb, Sr, and Zn, because these elements were
commonly above the limit of detection (LOD) in samples from the Kabba prospect and in the
Butte and Bajo de la Alumbrera porphyry deposits. Silver, As, La, S, Ti, V, and W were typically
below the limit of detection in samples from Kabba and the Butte and Bajo de la Alumbrera
porphyry deposits, and are excluded from the data presented below. However, concentrations for
all analyzed elements are included in Appendices F and G.
LA-ICP-MS Results: Footwall
B15C and B15D inclusions were the only inclusion types analyzed from the footwall as
they were the most abundant fluid inclusions found in footwall samples (Table 10 and Appendix
F, G). B15C and B15D inclusions commonly contained detectable Ba, Ca, Cu, Cs, Fe, K, Mn,
Mo, Na, Pb, Rb, Sn, Sr, and Zn, but the abundance of each element in individual inclusions is
highly variable. Also, the concentrations of Ca, Cu, Fe, K, Mn, Na, Sn, and Zn in B15C and
B15D inclusions typically had a wide range, and the difference between the maximum and
minimum concentrations of each element within an inclusion group was as much as 98,400 ppm.
This is due to the typically high concentrations (>10,000 ppm) of Ca, Cu, Fe, K, Mn, Na, Sn, and

67
Zn as well as the presence of at least one or two inclusions with in a group that contained low
concentrations (<500 ppm) of each element. The consequence of this is that the standard
deviation for many analyses of B15C and B15D inclusions is >25,000 ppm. However, for
elements that have high standard deviations, there is commonly a mode within the total range,
and a modal average that differs from the total average by <700 ppm. Where this mode and
average are more representative of typical concentrations of elements within an inclusion group,
they are reported in addition to the averages of the total range of elements quantified in the B15D
and B15C inclusions. Furthermore, modes and modal averages typically have standard
deviations < 500 ppm. Exceptions include Na, K, Fe, and Ca that typically have wide ranges in
concentrations in individual inclusions that differ by as much as 1000 ppm per inclusion. In these
cases the modes are commonly large and standard deviations are >1000 ppm.
B15D: Approximately 21% of B15D inclusions (20 inclusions) were analyzed by LA-
ICP-MS. These inclusions are dominated by Na, K, and Ca; however, the abundance of each
element varies between samples. Sodium is above the LOD in all analyzed B15D inclusions and
ranges between 1,114-21,767 ppm (12,186 ppm average), with 50% of analyzed B15D
inclusions having a mode between 15,206-17,955 ppm and a modal average of 16,342 ppm.
Potassium is above the LOD in 40% of analyzed B15D inclusions and ranges from 1,121-75,681
ppm (20,679 ppm average), with 50% of K concentrations having a mode between 3,105-4,451
ppm and a modal average of 3,942 ppm. Calcium is above the LOD in 25% of B15D inclusions
and has a total range of 4,736-25,372 ppm (13,732 ppm average). As only 25% of the inclusions
contained detectable Ca, and Ca concentrations vary regularly across the total range, there is no
mode for Ca in B15D inclusions. However, B15D inclusions also commonly contain translucent
daughter crystals, which were identified using Raman analysis as calcite; thus, some of the

68
highest Ca values came from inclusions that contained translucent daughter crystals and this is
consistent with the daughters being calcite.
Iron and Cu are also major constituents of B15D inclusions but their concentrations were
below the LOD in many analyzed inclusions, and they are much lower than the concentrations
determined for Na, K, or Ca. Iron exceeds the LOD in ~20% of analyzed B15D inclusions and
had a range of concentrations between 2,800-6,283 ppm (4,560 ppm average) with no mode. In
contrast, Cu exceeds the limit of detection in ~60% of analyzed B15D inclusions, and had a
much wider range, but lower concentrations than Fe in some inclusions, with total Cu ranging
between 227-9,280 ppm (3,587 ppm average). Also, Cu differed from Fe in that Cu exhibits a
mode between 3,049-4,628 ppm and a modal average of 3,849 ppm in about a third of analyzed
B15D inclusions. Though having a wide range of concentrations, B15D inclusions have the
largest number of inclusions in the footwall with detectable Cu and Fe, and the inclusions that
contain Fe and Cu typically have the largest Cu and Fe concentrations in the footwall.
Strontium and Rb were both above the LOD in many B15D inclusions but were typically
in low concentrations relative to dominant cations such as Na, K, Ca, Fe, and Cu. Strontium was
above the LOD in 60% of analyses and Rb in 35% of analyses, but both typically have low
concentrations <150 ppm.
Other elements that were present but in low abundance in B15D inclusions include Ba,
Pb, Mo, Cs, and Mn. All were above the LOD in <15% of B15D inclusions with the exception of
Mn, which had concentrations of 589 ppm and 137 ppm in two inclusions. Gold was not found in
any B15D inclusions.
Similar to Ba, Pb, Mo, Cs, and Mn, Zn is above the LOD in 15% of B15D inclusions but
is present in higher concentrations relative to Ba, Pb, Mo, Cs, and Mn, with a range between

69
178-838 ppm (415 ppm average). Also, Sn exceeds the LOD in 25% of B15D samples and is
slightly more enriched than Zn in that it had a wider total range of concentrations between 99-
900 ppm, and a slightly higher total average of 484 ppm. Given the typically low concentrations
and the low number of inclusions that host detectable concentrations of Zn and Sn, these
elements are interpreted as being in low abundances in B15D inclusions.
B15C: Approximately 28% of B15C inclusions (23 inclusions) were analyzed with LA-
ICP-MS. Sodium, K, and Ca were the dominant cations in B15C inclusions. Sodium is detected
in all analyzed B15C inclusions and is regularly distributed between 27-35,544 ppm. Two modes
occur within the total range of Na values. Approximately 35% of inclusions have a mode
between 3,465-6,603 ppm Na and another 35% have a mode between 27-83 ppm with an average
of 62 ppm. Potassium is above the LOD in 48% of B15C inclusions and has a total range of 10-
86,392 ppm (16,714 ppm average). No mode was identified for K because of the regular
distribution of values as indicated by a standard deviation of 25,501 ppm. Calcium is above the
LOD in 35% of B15C inclusions and varies regularly between 95-98,488 ppm. Similar to K, no
mode was identified because of the regular distribution of Ca concentrations and its large
standard deviation of 32,996 ppm.
B15C inclusions contain only small amounts of Cu, Zn, Fe, and Sn. Copper is above the
LOD in only 17% of the analyses and, with the exception of one inclusion, which had a
concentration of 8927 ppm, has a narrow range between 1-79 ppm. This range in Cu
concentrations is significantly lower than B15D inclusions and much lower than hanging wall
inclusion groups. Similar to Cu, Zn was only present in small amount with only 22% of B15C
inclusions having Zn concentrations above the LOD. Where above the LOD, Zn varies regularly

70
between 4-5,487 ppm. Within this range, 60% of the Zn-bearing B15C inclusions have a mode
between 101-189 ppm and a modal average of 157 ppm. Iron exceeds the LOD in the same
number of inclusions as Zn (22% of B15C inclusions) and had a wide range of concentrations
between 121-1,431 ppm and an average concentration of 626 ppm. Because of its wide range in
concentration no mode was identified for Fe. Tin is above the LOD in a slightly greater number
of inclusions than Zn and Fe (26% of B15C inclusions) and varies regularly between 8-3397
ppm. Within this range, 60% of the analyses have a mode between 145-269 ppm and a modal
average of 208 ppm.
Strontium is relatively abundant in B15C inclusions in that it is present in ~87% of B15C
inclusions. Inclusions with Sr have a range in concentrations between 1-184 ppm and an average
concentration of 39 ppm. Within this range ~61% of B15C inclusions have a mode between 1-25
ppm and a mode average of 6 ppm.
Other elements that typically have low concentrations in B15C inclusions include Au, Ba,
Cs, Mo, Mn, Pb, and Rb. Barium, Mo, Cs, and Rb are above the LOD in <22% of B15C
inclusions, with the exception of Rb, which is above the LOD in 40% of B15C inclusions, but at
concentrations < 58 ppm. Gold, Pb, and Mn are above the LOD in <17% of B15C inclusions and
typically have low concentrations, with the exception of one inclusion, which contains ~156 ppm
Pb, and another that contains 942 ppm Mn. One inclusion was determined to contain 0.07 ppm
Au; however, Au was not detected in any other B15C inclusions.
LA-ICP-MS Results: Hanging wall
Select fluid inclusions from B15, B30D, B30H, B75, B20C, and B75C inclusion groups
in samples from the hanging were all analyzed with LA-ICP-MS (Table 10 and appendices F and

71
G). These inclusion groups typically contained detectable Ba, Ca, Cu, Cs, Fe, K, Li, Mn, Na, Pb,
Rb, Sn, Sr, and Zn, but their abundance in each inclusion and the range of abundances within
each inclusion group is highly variable. As in the footwall, the variation in abundance of an
element within a particular inclusions group may be > 90,000 ppm. This range is related to
concentrations for single elements that range from as low as <500 ppm to 97,000 ppm. Such
elements have standard deviations in excess of 25,000 ppm. In such instances the average
concentrations of these elements are not representative of the typical abundance of that element
within an inclusion group. As with footwall inclusion groups, there is commonly a narrower
mode of concentrations for some hanging wall inclusion groups, and a corresponding modal
average that differs from the total average by >600 ppm. Where this mode and average are more
representative than the total range and average concentration of an element within an inclusion
group, the mode and average are reported in addition to the total range and average for the
element. These modes and averages typically have standard deviations < 250 ppm but, as with
B15C and B15D inclusions in the footwall, the total range of concentrations for cations such as
Na, K, Fe, and Ca, which tend to dominate hanging wall inclusions, is still large as inclusions
have concentrations that differ by as much as 1,000 ppm and standard deviations >1,000 ppm.
Many analyses of B15, B20C, B30D, B30C, B75, and B75C inclusion groups had very
high LOD and, with the exception of Na, K, and Sr, analyses of many inclusions were either at or
below the LOD. This is probably a result of the small size of the analyzed inclusions and the
difficulty of distinguishing the LA-ICP-MS signal for small inclusions from the background
signal from the quartz containing the ablated inclusions.
B15: Approximately 40% of B15 inclusions (7 inclusions) were analyzed by LA-ICP-
MS. The dominant cations in B15 inclusions were Na, K, Fe, and Ca. All B15 inclusions have

72
Na above the LOD, but its concentrations vary regularly between 6,237-70,197 ppm (24,960
ppm average). The difference in Na concentrations between inclusions within B15 inclusions is
commonly 3,000-4,000 ppm, as is indicated by its standard deviation of 22,423 ppm; thus, no
mode was determined for Na. Potassium is present in 57% of inclusions and also varies regularly
between 2,498-47,267 ppm (18,763 ppm average). As with Na, K has no mode because of its
wide range of concentrations that vary from 3,000-20,000 ppm between inclusions. Calcium
exceeds the LOD in only three B15 inclusions (43% of B15 inclusions) and is more abundant
than any other element in the B15 group with concentrations ranging between 9,773-95,028 ppm.
Because of the wide variation in Ca, no mode was determined for Ca within the B15 group.
Therefore, the presence of Ca is highly variable but, where present, is abundant. Also, Ca and Fe
are correlated with one another in that Fe is also only found in three of the seven analyzed B15
inclusions, all of which have high Ca. Iron is similar to Ca in that its concentrations have a wide
range between 5,906-28,653 ppm (19,205 ppm average). An average value is not representative
of the Fe content of this group and no mode was identified.
Copper, Zn, Pb, Mn, and Sn are also commonly above the LOD in B15 inclusions, and
the B15 inclusion group is moderately enriched Cu, Zn, Pb, Mn, and Sn compared to the other
hanging wall and footwall inclusions groups. Copper is detected in 71% of B15 inclusions and
varies regularly between 132-7,933 ppm (3,754 ppm on average). Within the 71% of inclusions
that contain Cu, 60% contained between 3,691-7,933 ppm with the remaining 40% between 132-
516 ppm. Because of the wide range of Cu concentrations in B15 inclusions, no mode was
identified. However, the high number of Cu-bearing inclusions in the B15 group makes this
inclusion group the second most consistent Cu-bearing group. Pb is above the LOD in 86% of
B15 inclusions and ranges between 36-1085 ppm, with 67% of B15 inclusions having a mode Pb

73
concentration between 36-77 ppm, and a mode average of 57 ppm, indicating that Pb is
commonly present but in small concentrations. Lead is also commonly detected in B15
inclusions that contain high concentrations of Mn and Zn. Zinc is above the LOD in 43% of B15
inclusions and has a wide range between 542-5,473 ppm. Because of the wide range in Zn
concentrations, no mode was identified for Zn. Manganese exceeds the LOD in 57% of B15
inclusions and has a regular range between 548-5804 ppm. Zinc and Mn in B15 inclusions have
similar concentrations, were typically detected in the same inclusions, and correlate with one
another. Similar to Mn, Sn exceeds the LOD in 57% of B15 inclusions, but has a narrow range
between 123-539 ppm (268 ppm average). Tin also did not correlate with Zn, Pb, or Mn, but was
commonly present in inclusions that had high Cu concentrations.
Strontium is above the LOD in 85% of B15 inclusions but at low concentrations,
commonly between 11-185 ppm, with a single inclusion containing 9,416 ppm. The inclusion
that contains 9416 ppm Sr, also contains high Ba (1028 ppm) and no Cu. Inclusions with low Sr
typically contain the highest Cu concentrations and little or no Ba. Owing to high concentrations
of Cu and low concentrations of Sr and Ba, B15 inclusions are referred to as Cu-enriched and Sr-
Ba-depleted relative to other hanging wall and footwall inclusions groups. Rubidium and Sn
were above the LOD in most inclusions but typically had low concentrations. Rubidium is above
the LOD in 86% of B15 inclusions, but at low concentration with a mode between 10-31 ppm
and a mode average of 21 ppm. Inclusions with the lowest Rb values also contain low Sr and Ba,
and the highest Cu.
B30D: Thirty-six percent of B30D inclusions (25 inclusions) were analyzed with LA-
ICP-MS. B30D inclusions were typically dominated by Na, K and Ca. Sodium exceeds the LOD
in all B30D inclusions and had concentrations between 1351-89,537 ppm and an average of

74
24165 ppm. Approximately 48% of B30D inclusions have a mode of Na concentrations between
10,315-20,145 ppm and a mode average of 15,822 ppm. Potassium concentrations were above
the LOD in 68% of B30D inclusions and vary regularly between 819-38,789 ppm. Within this
range of K concentrations in B30D inclusions there are two modes, with 24% of analyzed
inclusions between 15,204-17,675 ppm (16,522 average) and another 24% of B30D inclusions
between 7,433-9,214 ppm (8,350 average). Calcium exceeds the LOD in 91% of B30D
inclusions and has a regular range between 2,305-89,457 ppm (27,330 ppm average). The regular
range and large standard deviation for Ca concentrations (45,865 ppm) made it difficult to
identify a mode, and Ca is commonly present in B30D inclusions, but its concentration varies
widely.
Relative to other hanging wall and footwall inclusion groups, Pb, Zn, and Mn were
commonly moderately enriched in B30D inclusions. Lead exceeds the LOD in 72% of B30D
inclusions and had a range of 16-3,645 ppm (677 ppm average), with 33% of analyzed B30D
inclusions having a mode values between 16-85 ppm and a mode average of 51 ppm. Zinc
exceeds the LOD in 44% of B30D inclusions and had a wider range of 181-11,101 ppm. Within
the total range of Zn concentrations there are two modes with 33% of inclusions between 1215-
1865 ppm (1485 ppm average) and 25% between 270-274 ppm (272 ppm average). Manganese
is above the LOD in 60% of B30D inclusions and has a range of 149-17,513 ppm (3686 ppm
average). As with Zn, Mn has two modes with 26% of inclusions containing between 2833-4621
ppm (3427 ppm average) and 22% of inclusions containing between 149-208 ppm (171 ppm
average). Manganese concentrations are positively correlated with Pb and Zn concentrations in
B30D inclusions in that Zn and Pb both have high concentrations in inclusions with high Mn
concentrations.

75
Copper exceeds the LOD in 44% of B30D inclusions and had a wide range in
concentrations between 145-12,224 ppm (2012 ppm average). Two modes were identified for
Cu in B30D inclusions with 25% of inclusions containing 145-432 ppm (284 ppm average) and
25% of inclusions containing between 1254-1469 ppm (1397 ppm average). Despite being above
the LOD in only 44% of B30D inclusions, Cu is moderately enriched in B30D inclusions in that
it is commonly above 1000 ppm where present.
Iron exceeds the detection limit in only 24% of B30D inclusions but had a regular range
of high concentrations between 4060-54,663 ppm (28,332 ppm average). Though having a wide
range of concentrations, 50% of the Fe-bearing B30D inclusions had a narrower mode of high
concentrations between 31,252-35,567 ppm (33,533 ppm average). However, though Fe is above
the LOD in less than a quarter of B30D inclusions, it is in high abundance when present. Also,
Cs, which exceeds the LOD in 44% of B30D inclusions and had a relatively narrow range of
concentrations between 2-249 ppm (48 ppm average), has a positive correlation with Fe.
Specifically, Fe and Cs are commonly above the LOD in the same inclusions, and the highest
concentrations of Fe are found in inclusions with the highest Cs concentrations. Strontium
exceeds the LOD in 84% of B30D inclusions and had a range between 15-2,252 ppm (186 ppm
average) with 54% of B30D inclusions having a mode between 15-99 ppm and a modal average
of 52 ppm. Relative to the B15 and B75 inclusion groups, B30D inclusions are moderately
enriched in Sr. Also, Sr and Cu are negatively correlated with one another in that inclusions with
high Cu concentrations have low Sr concentrations. Ba, which exceeds the LOD in 20% of B30D
inclusions and varies between 17-529 ppm (280 ppm average), also correlates negatively with
Cu, in that Ba was commonly absent in inclusions with high Cu values. Tin exceeds the LOD in
only 24% of B30D inclusions and ranges between 100-10,112 ppm (3,232 ppm average), with

76
50% of B30D inclusions having a mode between 100-121 ppm (113 ppm modal average).
Though much less abundant than Ca, Sn is correlated with Ca, in that Sn is most abundant in
B20D inclusions, which had the highest Ca concentrations.
B30H: Approximately 34% of B30H inclusions (11 inclusions) were analyzed with LA-
ICP-MS. The dominant cations in B30H inclusions include Na, K, Ca and Fe. Na exceeds the
LOD in all B30H samples and had a wide range between 56,685-120,491 ppm (85,332 ppm
average) with 90% of B30H inclusions having a mode between 56,685-9,9972 ppm (mode
average of 81,816 ppm). Like Na, K exceeds the LOD in all B30H inclusions and had a similar
total range of concentrations, with K concentrations being between 29,259-126,539 ppm (64,409
ppm average). Within this range, ~81% of B30H inclusions had a mode between 29,259-73,481
ppm and a modal average of 56,071 ppm. Calcium exceeds the LOD in 90% of B30H inclusions
and ranged between 14,318-98,369 ppm (59,013 ppm average), with ~67% of B30H inclusions
having a mode between 633-753 ppm and a modal average of 696 ppm. The particularly high
concentrations of Na, K, and Ca in B30H inclusions are consistent with the presence of halite
daughter crystals in B30H inclusions, and indicate high concentrations of other dissolved salts
such as KCl and CaCl2 in B30H fluids.
Despite having elevated concentrations of Fe, Pb, Zn, and Na, K and Ca, which are
related to the presence of Cl, B30H inclusions contain less Cu than might be expected, and
relative to other hanging wall inclusions groups, Cu is less abundant in B30H inclusions. Copper
exceeds the LOD in 45% of B30H inclusions and ranged between 401-2,390 ppm (947 ppm
average). Within this range, 80% of analyzed inclusions have a mode between 401-801 ppm and
have a modal average of 586 ppm. The overall low range of Cu concentrations and low

77
abundance of inclusions with Cu in the B30H inclusions is unusual for highly saline, halite-
bearing inclusions.
Iron exceeds the LOD in 91% of B30H inclusions and had a range of concentrations
between 6,288-41,883 ppm (25,474 ppm average), with one elevated outlying concentration of
102,466 ppm. Within the range of Fe concentrations, ~70% of B30H inclusions had a mode
between 21,604-41,883 ppm and a modal average of 30,427 ppm. Given its overall high
concentrations, Fe is abundant in B30H inclusion compared to other inclusion groups. Iron
shows a positive correlation with Na, K, and Ca, in that high Fe concentrations typically
correspond to high Na, K, and Ca concentrations. Iron also shows a positive correlation with Cs
in that Cs, which exceeds the LOD in 82% of B30H samples and had a range of concentrations
between 20-113 ppm (51 ppm average), is commonly elevated in inclusions with elevated Fe.
However, Cs concentrations are commonly lower than Na, K, or Ca concentrations and, thus, the
correlation between Fe and Cs is more variable.
Relative to all other inclusions groups, B30H inclusions were enriched in Pb, Zn, and
Mn. Lead exceeds the LOD in all B30H inclusions and had a range between 200-13,650 ppm
(2,639 ppm average), with ~54% of B30H inclusions having a mode range of Pb concentrations
between 1,388-1,901 ppm and a modal average of 1,561 ppm. Like Pb, Zn is also above the LOD
in all B30H inclusions and has a range between 938-26,294 ppm (9,218 ppm average), with
~36% having a mode range between 5111-6485 ppm and a modal average of 5,807 ppm.
Relative to Zn and Pb, Mn was one of the most enriched elements in B30H inclusions in that it
exceeds the LOD in all B30H inclusions, and had a range between 2,529-60,222 ppm (20,516
ppm average). Also, Mn had a large modal range with ~36% of B30H inclusions between
13,382-23,777 ppm and a modal average of 18,188 ppm.

78
Strontium exceeds the LOD in all B30H inclusions and, relative to all inclusion groups, is
highly enriched in B30H inclusions. This is illustrated in the wide and regular range of Sr
concentrations in B30H inclusions between 249-10,713 ppm (2,160 ppm average) and the fact
that ~55% of Sr-bearing B30H inclusions have a mode of Sr concentrations between 1,034-
1,548 ppm and a modal average of 1,220 ppm. Like Sr, Rb is also above the LOD in all B30H
inclusions and relative to all inclusion groups, Rb is highly enriched in B30H inclusions. This is
illustrated by the fact that B30H inclusions have a consistent range of Rb concentrations between
235-877 ppm (414 ppm average), with 73% of B30H inclusions having a mode of Rb
concentrations between 235-371 ppm and a modal average of 311 ppm. Similar to Sr and Rb, Ba
is also enriched in B30H inclusions both in terms of its total and modal concentrations and the
percentage of inclusions within this group that have Ba above the LOD. Barium exceeds the
LOD in 73% of B30H inclusions and had a range of concentrations between 692-1,339 ppm (951
ppm average). Furthermore, ~50% of B30H inclusions have a mode of Ba concentrations
between 993-1,162 ppm and a modal average of 1,043 ppm, and this indicates that most B30H
inclusions have relatively high Ba concentrations.
Compared to other hanging wall inclusions groups, Sn is depleted in B30H inclusions.
Tin concentrations exceed the LOD in 20% of B30H samples and had a low total range of
concentrations between 1-269 ppm (69 ppm average). Within this range, Sn concentrations in
67% of B30H had a mode between 633-753 ppm and a mode average of 696 ppm.
B75: Approximately 43% of B75 inclusions (9 inclusions) were analyzed with LA-ICP-
MS. B75 inclusions are dominated by Na, K, Ca, and Cu. Na exceeds the LOD in all B75
samples and had a range between 1,098-13,720 ppm (6,252 ppm average). Within this range
there were two modes, with 44% of B75 inclusions containing between 1,098-4,463 ppm (2,396

79
ppm mode average) and 44% between 8,513-13,720 ppm (10,909 ppm modal average).
Potassium exceeds the LOD in 55% of B75 inclusions and had a regular range of concentrations
between 2,200-9,155 ppm (6,230 ppm average). Though having a wide range of concentrations,
K has a regular distribution and does not exhibit a mode; the standard deviation is 2,950 ppm and
concentrations did not cluster within the total concentration range. Calcium exceeds the LOD in
56% of B75 inclusions and had a regular range between 7,073-33,586 ppm (19,904 ppm
average). Within this range, ~80% of B75 inclusions have a mode between 11,519-33,586 ppm
and have a modal average of 23,111 ppm.
Copper is highly enriched in B75 inclusions and, as stated above, Cu is a dominant cation
in the B75 inclusion group. Copper exceeds the LOD in 88% of B75 inclusions and has a wide
range of concentrations between 24-17,724 ppm and an average concentration of 5,923 ppm,
which is the highest average Cu concentration of any inclusion group. Approximately 63% of
Cu-bearing B75 inclusions have a mode between 842-5,258 ppm, and a modal average of 2,720
ppm. Given the high number of inclusions with high average Cu concentrations, the B75
inclusion group is the most Cu-enriched inclusion group.
Relative to the B30H, B30D, and B15 inclusion groups, B75 inclusions are low in Pb,
Mn, Zn, and Fe. Lead exceeds the LOD in 55% of B75 inclusions and ranged between 4-166
ppm (87 ppm average). Within the range of Pb concentrations there is a mode range between
111-166 ppm and a mode average of 136 ppm. Manganese exceeds the LOD in 56% of B75
inclusions and had a range of concentrations between 152-12,204 ppm with an average of 3099
ppm owing to two inclusions having high outlier concentrations (12,204 ppm and 2,026 ppm).
Owing to a regular range of Mn concentrations, no Mn mode was identified for B75 inclusions.
Zinc and Fe were only present in ~22% (2 inclusions each) of B75 inclusions. The inclusions

80
that contained detectable Zn, had concentrations of 779 ppm and 62 ppm, which are low relative
to the B30H, B30D, and B15 inclusion groups. However, the two B75 inclusions that contained
detectable Fe, had high Fe concentrations (2,7818 ppm and 13,852 ppm) comparable to the
B30H, B30D, and B15 inclusion groups. These B75 inclusions are still generally low in Fe,
however, because most (~78%) of B75 inclusions contain no detectable Fe.
Relative to the B30H, B30D, and B15 inclusions, Sr is low in B75 inclusions despite
being consistently present in most B75 inclusions. Strontium exceeds the LOD in 89% of B75
inclusions and had a narrow range 3-112 ppm (44 ppm average).
Compared to other hanging wall samples Sn is somewhat enriched in B75 inclusions in
that it has consistently elevated concentrations in many samples. Tin exceeds the LOD in 44% of
hanging wall inclusions, and had a regular range between 21-1276 ppm (476 ppm average). B75
inclusions are low in Ba, Cs, and Rb in that they were detected in <22% of B75 inclusions and
typically had concentrations <130 ppm. Neither Au nor Mo was detected in B75 inclusions.
B20C: Approximately 38% of B20C inclusions (23 inclusions) were analyzed with LA-
ICP-MS analysis. Compared to aqueous inclusions in the hanging wall, B15, B30D, B30H, and
B75 inclusions, B20C inclusions contain much lower concentrations of all elements. The ranges
of concentrations of Na, K, Ca, Fe, Cu, Sr, Ba, Pb, Zn, and Mn vary, but these ranges are narrow
compared to concentration ranges in aqueous inclusion groups.
The dominant cations in B20C inclusions are Na and Ca. Sodium exceeds the LOD in all
samples and had a range between 33-32,211 ppm (4,774 ppm average). Within this range there
are two modes, with 57% of B20C inclusions containing between 1,672-8,643 ppm (modal
average of 4,753 ppm) and 35% of B20C inclusions containing between 33-83 ppm (modal
average of 63 ppm). Calcium exceeds the LOD in 43% of B20C inclusions and had a wide range

81
between 54-26,100 ppm (7,550 ppm average). Within this range, Ca had two modes with 40% of
B20C inclusions having a narrow mode between 54-97 ppm (modal average of 78 ppm) and 40%
having a mode between 9,028-15,568 ppm (modal average of 11,401 ppm).
Unlike the Aqueous inclusion groups in the hanging wall, B20C inclusions are low in K,
in that K is only above the LOD in 22% of B20C inclusions. This is the smallest number of
inclusions with concentrations of K above the LOD of all hanging wall inclusion groups.
However, K concentrations have a wide total range between 34-7,741 ppm and an average K
concentration of 3,399 ppm.
Compared to all aqueous inclusions and B75C inclusions in the hanging wall, B20C
inclusions are low in Cu. Copper exceeds the LOD in 48% of B20C inclusions and had a range
between 3-4,052 ppm (454 ppm average). Within this range, 55% of B20C inclusions have a
mode between 42-352 ppm and a modal average of 153 ppm. Though low relative to other
hanging wall inclusion groups, B20C inclusions are enriched in Cu compared to B15C inclusions
from the footwall.
B20C inclusions are also low in Pb, Zn, and Mn relative to aqueous inclusions in the
hanging wall, in that Pb, Zn, and Mn are present in few B20C inclusions and have low
concentrations. Lead exceeds the LOD in 57% of B20C inclusions and had a narrow range
between 1-885 ppm (173 ppm average). Within this range, 77% of inclusions have a mode
between 1-136 ppm and a modal average between 55 ppm. Manganese exceeds the LOD in 52%
of B20C inclusions and had a range between 1-3,057 ppm (850 ppm average). Within this range
there are two modes, with 42% of B20C inclusions having a range between 1-76 ppm (modal
average of 22 ppm) and 33% having a range between 242-585 ppm (modal average of 476 ppm).
Zinc exceeds the LOD in 39% of B20C inclusions and had a moderately wide range between 2-
82
1612 ppm (428 ppm average). However, Zn concentrations were consistently on the low end of
this range with 56% of B20C inclusions having a mode between 2-93 ppm and a modal average
of 24 ppm. Though low in Pb, Zn, and Mn, B20C inclusions are enriched in these elements
relative to B75C inclusions in the hanging wall and B15C inclusions in the footwall.
Relative to the aqueous hanging wall inclusions, B20C inclusions are low in Fe, with Fe
exceeding the LOD in only 26% of B20C inclusions. However Fe had a wide range between 31-
16,557 ppm (4705 ppm average), and 50% of B20C inclusions have a mode between 1,321-
5,768 ppm and a modal average of 3,864 ppm. Though low relative to the aqueous inclusions,
B20C inclusions are enriched in Fe relative to B75C inclusions in the hanging wall and B15C
inclusions in the footwall.
Relative to aqueous inclusions, B20C inclusions are depleted in Sr. Strontium exceeds the
LOD in 57% of B20C inclusions and had a range between 1-755 ppm (104 ppm average). Within
this range, Sr had a mode between 1-77 ppm and a modal average of 18 ppm. Though low
relative to aqueous inclusions, B20C inclusions are enriched in Sr relative to B75C inclusions
from the hanging wall and B15C inclusions in the footwall.
Ba is similar to Sr in B20C inclusions in that, relative to aqueous inclusion groups, Ba is
low. However, relative to B75C inclusions from the hanging wall and B15C inclusions in the
footwall, B20C inclusions are enriched in Ba. Barium exceeds the LOD in 39% of B20C
inclusions and had a range between 1-629 ppm (113 ppm average), and within the range, Ba had
a mode range in 78% of inclusions between 1-55 ppm and a mode average of 31 ppm.
Cs and Rb are low in B20C inclusion in that they were above the limit of detection in
only 13% of B20C inclusions and both are present in concentrations < 20 ppm. No Au or Mo
were detected in B20C inclusions.

83
B75C: Approximately 24% of B75C inclusions (20 inclusions) were analyzed with LA-
ICP-MS. As with B20C inclusions, B75C inclusions contain much smaller concentrations of all
elements analyzed with LA-ICP-MS relative to aqueous inclusions in the hanging wall, and
though the ranges of high to low concentrations of some elements including Na, K, Ca, Fe, Cu,
Sr, Ba, Pb, Zn, and Mn, are present in B75C inclusions, the range of concentrations is narrow
compared to ranges for aqueous inclusions.
Sodium is the only element that is above the LOD in all B75C inclusions and is the
dominant cation in B75C inclusions. Sodium has a range of concentrations between 41-18,375
ppm and an average concentration of 4,899 ppm. Within the range of Na concentrations there are
two modes with 40% of B75C inclusions having a mode between 41-83 ppm (modal average of
65 ppm), and 25% having a mode of 6,194-11,641 ppm (modal average of 8,870 ppm).
Potassium exceeds the LOD in only 40% of B75C inclusions and had a range between 6-
3268 ppm (628 ppm average). Within this range, 75% of B75C inclusions have a mode of 6-75
ppm and a mode average of 43 ppm. Despite having a regular range of concentrations, K in
B75C inclusions is low relative to aqueous inclusions and B20C inclusions because of the small
number of K-bearing inclusions and low K concentrations where present. Similarly, Ca is only
above the LOD in 20% of B75C inclusion and, though it has a very wide range of concentrations
between 23-31,198 ppm, it is considered low in B75C inclusions.
Relative to aqueous inclusion groups, B75C inclusions are depleted in Cu. However,
relative to B20C inclusions and B15C inclusions, B75C inclusions are consistently enriched in
Cu. Copper exceeds the LOD in 60% of B75C inclusions and had a range between 1-783 ppm
(291 ppm average). Within this range, 58% of analyzed B75C inclusions have a mode of 283-
783 ppm and a modal average of 463 ppm.

84
Relative to aqueous inclusions, B20C inclusions, and B15C inclusions, Pb, Zn, Mn, and
Fe are all low in B75C inclusions. Lead exceeds the LOD in 55% of B75C inclusions and had a
range of 1-241 ppm (57 ppm average). Within this range, 36% of B75C inclusions have a mode
between 85-105 ppm and a modal average of 93 ppm. Mn exceeds the LOD in 50% of B75C
inclusions and had a range between 1-1158 ppm (201 ppm average). Within the range, 70% of
B75C inclusions have a mode between 1-49 ppm and a modal average of 23 ppm. Zinc exceeds
the LOD in 40% of B75C inclusions and has a range between 2-836 ppm (201 ppm average).
Within this range of Zn concentrations 63% of B75C inclusions have a mode of Zn
concentrations between 2-18 ppm and a modal average of 9 ppm. Iron exceeds the LOD in 20%
of B75C inclusions and has a range between 9-253 ppm (85 ppm average). Like Pb, Zn, and Mn,
Fe concentrations within 75% of analyzed B75C inclusions have a mode between 9-61 ppm and
a modal average of 30 ppm.
Relative to all other inclusions in the hanging wall B75C inclusions are low in Sr.
Strontium exceeds the LOD in 70% of B75C inclusions and had a regular range between 1-193
ppm and an average value of 43 ppm. Within the range of Sr concentration 43% of B75C
inclusions have a mode between 22-110 ppm and a modal average of 68 ppm.
Ba, Cs, Rb, and Sn were only above the LOD in <20% of B75C inclusions and were
commonly in concentrations < 70 ppm. Also, Mo and Au were not detected in any B75C
inclusions.
Patterns and Interpretation of LA-ICP-MS Data
The LA-ICP-MS data presented herein vary greatly between fluid inclusion groups,
between aqueous and CO2-rich inclusion groups, and between fluid inclusion groups in the

85
footwall and hanging wall. This variation between fluid inclusions groups and within fluid
inclusions groups is likely owed to the fact that many of the inclusions analyzed were ~7.5µm or
less in size. For small inclusions, the amount of background in the LA-ICP-MS signal from the
quartz hosting the analyzed inclusions is much greater than it would be for larger inclusions.
However broad patterns in concentrations of some elements are present and these patterns are
outlined below.
1) Strontium, Rb, and Ba are typically high in inclusions that have relatively low Cu
concentrations. This pattern is present in both the footwall and hanging wall, and in CO2-
bearing and aqueous inclusion groups, but is especially true for aqueous inclusion groups
in the hanging wall and footwall. For example, 89% of B75 inclusions contain Sr and Cu,
but the average Cu concentration in B75 inclusions is 5,923 ppm, whereas the average Sr
concentration is 43 ppm. Furthermore, 22% of B75 inclusions contain Ba and Rb, but the
average concentration of each is <70 ppm, far below the average concentration of Cu. For
CO2-bearing groups, this pattern is subtle, but is still present. For example, only 17% of
B15C inclusions contain detectable Cu, whereas 87% contain detectable Sr, 22% contain
Ba, and 39% contain Rb, and all are typically in greater concentrations than Cu. This
inverse relationship between Rb, Ba, and Sr concentrations and Cu concentrations is
commonly observed in other porphyry systems, such as Bajo de la Alumbrera (Ulrich et
al., 2001), and is likely due to Cu behaving compatibly, and Rb, Ba, and Sr behaving
incompatibly in sulfide mineral phases, with Sr being the most incompatible followed by
Ba and Rb. Specifically, as sulfide minerals precipitate from hydrothermal fluid, Cu is
readily incorporated into sulfide minerals; whereas Sr, Ba, and Rb behave incompatibly
and remain in solution (Candela and Holland., 1986).

86
2) In both hanging wall and footwall inclusion groups with high to moderate Cu
concentrations, Mn, Pb, and Zn are typically moderately elevated. The only groups that
diverged from this pattern are vapor-rich B75 and B75C inclusions, which had regularly
high Cu concentrations, but low Mn, Pb, and Zn concentrations. This pattern is likely due
to differing compatibility of Cu and Mn, Pb, and Zn
3) The consistently high Cu concentrations found in B75C and B75 inclusions are consistent
with partitioning of Cu into the vapor fraction of both CO2-bearing and non CO2-bearing
fluids, and this has been observed in other Cu-bearing hydrothermal systems (Heinrich, et
al., 1999). This is likely due to the fact that Cu can be portioned in to a low density fluid
much easier than other metals ions (Candela and Holland., 1986).
4) B30H inclusions typically had very high Mn, Pb, and Zn concentrations, but low Cu
concentrations. This is likely due to Cu precipitation from these fluids and/or partitioning
of Cu into an immiscible vapor phase that may have formed at the same time as the brine
fluid captured in B30H inclusions.
5) Inclusions that had round, opaque daughter crystals commonly had elevated Fe
concentrations, and inclusions that had triangular, opaque daughter crystals commonly
had elevated Cu concentrations. This indicates that the round opaque crystals may have
been an Fe-bearing mineral, such as magnetite or hematite. Likewise, the elevated Cu
concentrations in inclusions with triangular opaque daughter crystals strongly suggests
that the triangular daughter crystals were chalcopyrite or another Cu-bearing mineral.
6) Inclusions that had translucent daughter crystals that did not melt during heating
commonly had elevated Ca concentrations compared to the concentrations of other

87
cations in those inclusion. This indicates that the translucent daughter crystals may have
been calcite or another Ca-bearing mineral
7) In the majority of analyzed inclusions, little or no Mo was detected, and this is consistent
with observations made at other porphyries (Ulrich et al., 2001, Rusk et al., 2008). The
lack of significant amounts of Mo in the fluid inclusions in the Kabba systems is likely
related to the fact that Mo extraction from melts tends to be inefficient, compared to
copper, resulting in the Mo:Cu ratio in early exsolved fluids being low (Candela and
Holland, 1986). Also, because Mo is highly insoluble at temperatures below 400°C it is
likely that Mo will precipitate early from hydrothermal fluids and, thus, is likely not to be
present in high abundances in fluids trapped in fluid inclusions below 400°C (Candela
and Holland, 1986).
8) Typical concentrations of most elements in B20C, B75C, and B15C inclusions were low
relative to all other inclusion groups. This is likely due to the fact that these inclusions are
CO2-rich. As hydrothermal fluids exsolved from magmas at depth, CO2 reduced the
ability of the hydrothermal fluid to extract Cl-complexed Cu, as well as other metals,
from the melt (Tattitch, et al., 2015). Therefore, the CO2 in the B20C, B75C, and B15C
inclusions likely reduced the ability of these fluids to transport dissolved ions and this
would contribute to their over-all low metal concentrations.

88
CHAPTER 7
DISCUSSION AND INTERPRETATION
The focus of this project is to test the hypothesis that the footwall and hanging wall field
areas of the Kabba prospect represent the deep roots and intermediate depths of a single
porphyry-like hydrothermal system, respectively, which formed at the same time, but have since
been separated by an extensional basin and range normal fault. This hypothesis was initially
supported by several lines of evidence including: 1) the presence of pervasive veining and
porphyry-style mineralization and alteration in footwall outcrops and hanging wall drill core, 2)
the N-S trending Hualapai normal fault, which runs between the hanging wall and footwall areas,
3) seismic data, which show the presence of fault blocks that appear to have moved eastward
along the Hualapai normal fault and are now buried under Quaternary gravels present in the
hanging wall, 4) an aeromagnetic anomaly in the footwall that has historic Cu-Mo and Pb-Zn
mines exposed at the surface around its flanks, and 5) a comparable aeromagnetic anomaly in the
hanging wall with historic Cu, Pb-Zn, and Au mines exposed at the surface around its flanks. To
further test the hypothesis, data from conventional vein and alteration petrography, fluid
inclusion petrography and microthermometry, and single inclusion LA-ICP-MS analysis of
samples from the hanging wall and footwall were integrated and compared to ore and alteration
in the deep roots and intermediate depths of known porphyry deposits and to established fluid
inclusion distribution models for porphyry systems. This comparison has led to the following
interpretation of the evolution of the Kabba hydrothermal system, based on identified
relationships between vein minerals and alteration in the hanging wall and footwall, and
analyzed fluid inclusion populations from in each area.

89
The conventional petrography of veins and alteration from the hanging wall and footwall
indicate that the ANB and AB veins in the footwall are broadly related to each other and to the A,
B, and D veins in the hanging wall. This interpretation is based on similarities between vein
minerals, alteration, and crosscutting relationships observed between vein types, and is supported
by seven key observations.
1. All of the hanging wall and footwall veins are composed of the same two types of
quartz: CL-bright and CL-dark. Both CL-bright and CL-dark quartz in the
hanging wall and footwall have identical characteristics. Similarly, cross-cutting
relationships between CL-dark quartz and CL-bright quartz in the hanging wall
are identical to the crosscutting relationships between CL-bright and CL-dark
quartz observed in the footwall.
2. The textures of the sulfide and oxide minerals found in hanging wall veins and the
cross-cutting relationships these minerals have with one another are identical to
textures and cross-cutting relationships observed in sulfide and oxide minerals
found in the footwall.
3. The presence of abundant chalcopyrite and molybdenite and general lack of
sphalerite and galena in the footwall is consistent with mineralization in the deep
root zones of porphyry systems (Sillitoe, 2010). Likewise, the presences and
relative abundances of chalcopyrite, molybdenite, sphalerite, and galena in the
hanging wall are similar to what is observed in the intermediate depths of other
porphyry systems (Sillitoe, 2010), with chalcopyrite and molybdenite dominating,
and lesser sphalerite and galena.

90
4. The vein and alteration mineral assemblages observed in the ANB and AB veins in
the footwall and the A, B, and D veins in the hanging wall are very similar in that
footwall assemblages 1F, 2F, 3F, and 4F are nearly identical to hanging wall
assemblages 2, 3, 4, and 5, and the precipitation of these assemblages aligns
temporally with one another.
5. Coarse mica alteration observed in footwall samples always occurs with
orthoclase feldspar that represents potassic alteration and is interpreted as greisen.
This alteration type, found only in footwall rocks overprinting potassic alteration,
is a hallmark of the root zone of porphyry systems, indicates that the footwall
formed at a greater deeper depth than the hanging wall and in or near the central
root zone of a porphyry-like hydrothermal system.
6. Green mica alteration at Kabba, which is found only in the hanging wall and
commonly overprints potassic alteration, contains abundant sericite, quartz, and
pyrite, analogous to phyllic alteration commonly found above or overlapping
potassic alteration at intermediate depths in most porphyry systems. Thus, the
green mica alteration and potassic alteration in the hanging wall indicate that
hanging wall rocks formed at an intermediate depth in a porphyry-like
hydrothermal system.
7. The ANB and AB veins in the footwall are wider than typical veins in the hanging
wall and resemble large, feeder veins described in the root zones of many
porphyry systems (Rusk et al., 2008; Sillitoe, 2010). In contrast, the narrow A, B,
and D veins in the hanging wall are identical to A, B, and D veins in the central
91
and peripheral regions within typical porphyry systems (Gustafson and Hunt,
1975.
All of these observations support the hypothesis that the hanging wall and footwall areas
formed at approximately the same time and represent two different levels within a single
porphyry-like hydrothermal system, with the hanging wall representing an intermediate depth
and the footwall representing a deep root zone.
A reasonable time-integrated model for the formation of the fossil hydrothermal system
at Kabba is presented below and is based on a comparison between veins, alteration, and fluid
inclusions found in the Kabba hanging wall and footwall, and the veins, alteration, and fluid
inclusions found in the Butte porphyry deposit in Butte, Montana. The Kabba hydrothermal
system is compared to Butte because the mineralization in both systems is associated with fluid
inclusions that indicate less aqueous fluid immiscibility than is typical of most porphyry systems,
and which contain significant CO2. At Butte, the microthermometric behavior of fluid inclusions
that contain CO2 vapor in the deepest levels of the Butte porphyry system led to the
interpretation that the base of the Butte porphyry formed under lithostatic pressures between
~2000-2500 bars and at a depth of ~10 Km (Rusk et al., 2008). Thus, a similarly high lithostatic
pressure and depth of formation is suggested for the Kabba footwall, as it is interpreted to
represent the deepest part of the Kabba hydrothermal system. This interpretation is further
supported by the observation that the Kabba footwall contains no vapor-rich inclusions, which
would indicate low to modereate pressures and depths of formation, and this is similar to what is
observed in the deepest parts of the Butte porphyry, which contained rare vapor-rich inclusions.
In addition, CO2-bearing fluid inclusions at Kabba contain high CO2, from 3->27 mol%, whereas
Butte inclusions contain ~2-8 mol% CO2. Furthermore, Kabba fluid inclusions commonly

92
contain both liquid and vapor CO2, whereas, other than two inclusions, Butte fluid inclusions
contain only CO2 vapor. These observations indicate that the base of the Kabba system formed at
greater pressure than the base of the Butte system and thus, lithostatic pressures of formation
>2500 bars and a depth of formation >10 Km are estimated for the Kabba footwall. This
interpretation is supported by the presence of greisen in the footwall, which was not recognized
at Butte, but is found in the deepest levels of some porphyry systems (Seedorff et al., 2008).
Correspondingly, the hanging wall of the Kabba system is interpreted to have formed under
lower pressures than the footwall. This interpretation is supported by the fact that the hanging
wall contains vapor-rich fluid inclusions that likely formed in response to fluid immiscibility at
lower pressures than those interpreted for the footwall. Based on a comparison of fluid inclusion
types and abundances in the hanging wall at Kabba with the depth and inferred pressure of the
region that contains similar fluid inclusions at Butte, a lithostatic pressure of formation between
~1500-2000 bars is estimated for the Kabba hanging wall.
Subsequent to establishing reasonable lithostatic pressures for formation of the footwall
and hanging wall at Kabba, trapping temperatures were interpreted for fluid inclusions analyzed
using microthermometry based on isochors generated with MacFlincor (Brown, 1989; Brown
and Hagemann, 1994). Using pressure, temperature and chemistry data available for all fluid
inclusions groups, a time integrated model for the formation of the Kabba hydrothermal system
was constructed. All time-integrated steps described in the following model are correlated with
the paragenetic sequences observed for the mineral assemblages in the veins and alteration in the
hanging wall and footwall, and are based on the interpretation that the footwall formed at greater
depth than the hanging wall (Table 7).
Time 1: Precipitation of assemblage 1 minerals in the hanging wall from B30H fluids

93
B30H fluids are interpreted to have precipitated assemblage 1 Gl and Sp in the hanging
wall because they contain the highest concentrations of Zn and Pb of any inclusion group and are
commonly spatially related with Zn and Pb mineralization. Given that B30H inclusions contain a
saline brine and are saturated in halite at 25°C, it is reasonable that B30H fluids formed as the
result of aqueous fluid immiscibility and would, therefore, have formed with a coexisting
immiscible vapor. Based on H2O-NaCl phase equilibria (Bodnar et al., 1985), B30H fluids,
which have a salinity of ~35 wt% NaCl equivalent, could have formed at 500-600°C along with
a vapor with a salinity between <1-4 wt% NaCl equivalent. In a productive porphyry system,
these immiscible fluids could have been derived from a parental aqueous fluid with ~5-8 wt%
NaCl equivalent (Bodnar et al., 1985).
A reasonable scenario (Table 7) for the formation of B30H fluids begins with an ~5 wt%
NaCl equivalent parental fluid moving buoyantly upwards through a fracture network into the
hanging wall where pressure was reduced and immiscible B30H liquid and vapor formed at
~500-600°C. Depressurization could have occurred in response to a fracturing event which
decreased pressure in the hanging wall from lithostatic pressure of ~1500-2000 bars, to
hydrostatic pressure of ~550-750 bars. Following immiscibility, the dense B30H fluid may have
ponded in the hanging wall (Henley and McNabb, 1978), cooled, precipitated assemblage 1
minerals, and been trapped as B30H fluid inclusions between <300-350°C and 550-750 bars.
These estimated pressure-temperature conditions are based on isochors for B30H fluids (Figure
21, Table 11), derived from the microthermometric behavior of B30H inclusions (Table 8), and
the interpreted hydrostatic pressure of the hanging wall. Furthermore, this temperature range is
consistent with the precipitation of galena and sphalerite from B30H fluids. As isochors are not
valid below 300°C due to the limitation of hydrothermal experiments from which the isochors

94
were derived (Bodnar et al., 1985), the lower limit of trapping temperatures is not precisely
constrained. Also, though this model of formation for B30H fluids is plausible, the immiscible
vapor and parental moderate salinity aqueous liquid were not captured by fluid inclusions in the
hanging wall or footwall, and their presence and compositions are inferred.
Time 2) Precipitation of assemblage 1F and trapping of B15D inclusions in the footwall, the
onset of assemblage 2 mineral precipitation and trapping of B15 and B30D inclusions in the
hanging wall, and transition to higher temperature hydrothermal fluids (Table 7)
B15D fluids are hypothesized to have exsolved from a magma at depth at temperatures
>400°C, which allowed these fluids to transport Cu (Ulrich et al., 2001; Heinrich et al., 2004) as
they ascended from an unknown depth into the footwall. As these fluids moved through the
footwall, they cooled below 400°C and precipitated assemblage 1F chalcopyrite and
molybdenite. At ~2500-3000 bars lithostatic pressure, isochors indicate trapping of B15D fluids
between ~225-370°C (Figure 21, Table 11). Because chalcopyrite precipitation begins as fluid
temperatures decrease to about 400°C, the temperatures recorded by B15D inclusions are
consistent with B15D fluids having been trapped as fluids cooled during or slightly after the
initiation of chalcopyrite precipitation in the footwall. This interpretation is supported by LA-
ICP-MS data from B15D inclusions which quantified high Cu concentrations in B15D fluids.
Concurrent with cooling and entrapment of some B15D fluids in the footwall, B15D
fluids continued to rise into the hanging wall where they variably expanded in response to
decreasing pressure and were trapped by B30D and B15 inclusions which, based on their spatial
association with one another and relatively continuous range in salinity, are interpreted to have
formed a continuum with one another (Figure 22, Table 11). Expansion to form B15/B30D fluids
occurred in response to a drop in pressure from 2500-3000 bars in the footwall to 1500-2000 bars
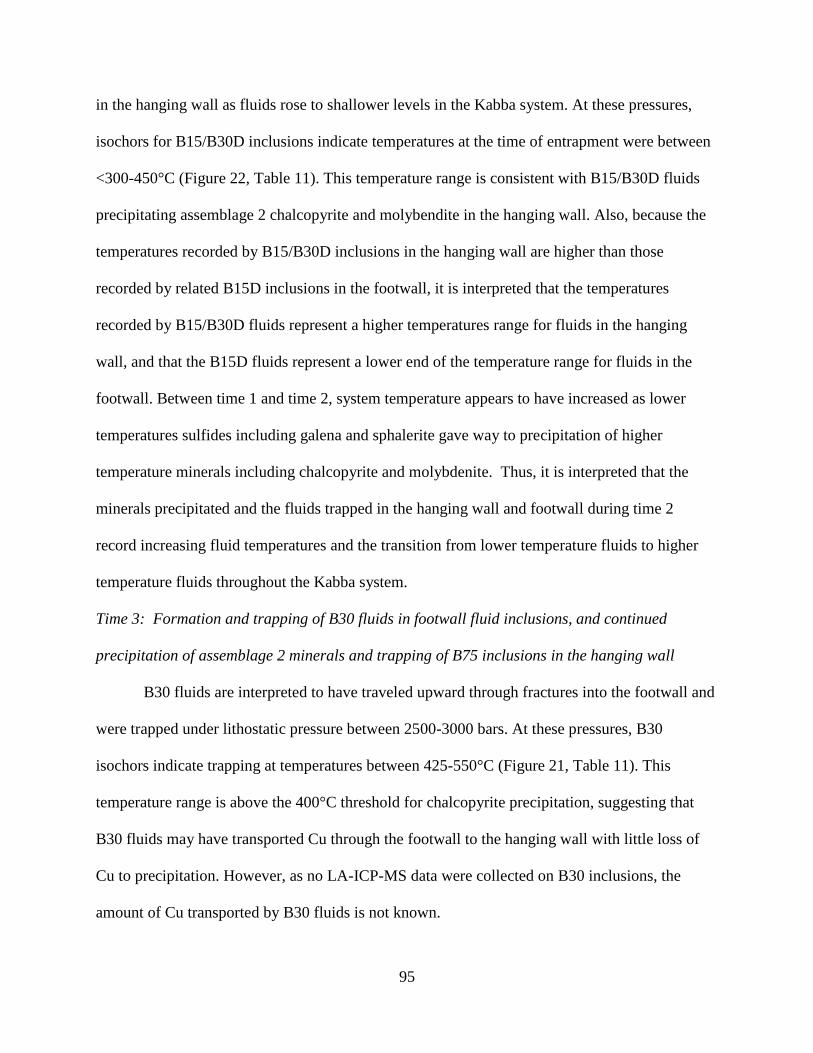
95
in the hanging wall as fluids rose to shallower levels in the Kabba system. At these pressures,
isochors for B15/B30D inclusions indicate temperatures at the time of entrapment were between
<300-450°C (Figure 22, Table 11). This temperature range is consistent with B15/B30D fluids
precipitating assemblage 2 chalcopyrite and molybendite in the hanging wall. Also, because the
temperatures recorded by B15/B30D inclusions in the hanging wall are higher than those
recorded by related B15D inclusions in the footwall, it is interpreted that the temperatures
recorded by B15/B30D fluids represent a higher temperatures range for fluids in the hanging
wall, and that the B15D fluids represent a lower end of the temperature range for fluids in the
footwall. Between time 1 and time 2, system temperature appears to have increased as lower
temperatures sulfides including galena and sphalerite gave way to precipitation of higher
temperature minerals including chalcopyrite and molybdenite. Thus, it is interpreted that the
minerals precipitated and the fluids trapped in the hanging wall and footwall during time 2
record increasing fluid temperatures and the transition from lower temperature fluids to higher
temperature fluids throughout the Kabba system.
Time 3: Formation and trapping of B30 fluids in footwall fluid inclusions, and continued
precipitation of assemblage 2 minerals and trapping of B75 inclusions in the hanging wall
B30 fluids are interpreted to have traveled upward through fractures into the footwall and
were trapped under lithostatic pressure between 2500-3000 bars. At these pressures, B30
isochors indicate trapping at temperatures between 425-550°C (Figure 21, Table 11). This
temperature range is above the 400°C threshold for chalcopyrite precipitation, suggesting that
B30 fluids may have transported Cu through the footwall to the hanging wall with little loss of
Cu to precipitation. However, as no LA-ICP-MS data were collected on B30 inclusions, the
amount of Cu transported by B30 fluids is not known.

96
As B30 fluids ascended via fractures into the hanging wall, they may have become
immiscible in response to a fracturing episode that produced vapor that was trapped in B75
inclusions under hydrostatic pressures. B30 fluids, which contain ~5 wt% NaCl equivalent, may
have been the parental fluid for B75 fluids, which contain ~4.5 wt% NaCl equivalent. Water-
NaCl phase equilibria predicts that unmixing of such a parent fluid under hydrostatic pressure of
~550-750 bars would occur between 500-575°C and would produce a brine containing ~20-35
wt% NaCl equivalent and a coexisting ~4.5wt% NaCl equivalent vapor.
The presence of B75 vapor-rich inclusions in the hanging wall supports the interpretation
that a decrease in pressure and immiscibility occurred in the hanging wall during time 3. Isochors
indicate that B75 fluids under hydrostatic pressures of ~550-750 bars, would have trapped B75
inclusions at temperatures between 425-525°C (Figure 22, Table 11). This temperature range is
above the precipitation temperature of chalcopyrite and is consistent with the presence of
abundant Cu in these inclusions as indicated by LA-ICP-MS analyses. Subsequent fluid cooling
following immiscibility, likely led to the precipitation of assemblage 2 minerals at higher
elevations in the hanging wall. However, as no coexisting brine inclusions were identified, the
elevation of fluid immiscibility cannot be determined.
Time 4: Hiatus of hydrothermal activity.
A hiatus in hydrothermal fluid activity led to system cooling that was followed by
incursion of a new hydrothermal fluid with a different trace element chemistry, responsible for
precipitation of quartz with a different CL luminescence (Rusk et al,. 2006, Rusk et al ,.2001),
into the system. Also, at some time during this hiatus, a tectonic event responsible for fracturing
of existing minerals, especially CL-bright quartz, must have occurred. Incursion of the new
hydrothermal fluid was likely related to this event.

97
Time 5: Incursion of CO2-bearing hydrothermal fluids, precipitation of assemblage 2F minerals
and trapping of B15C inclusions in the footwall, and precipitation of assemblage 3 minerals and
trapping of B20C inclusions in the hanging wall, and precipitation of CL-dark quartz.
Following the hiatus, hydrothermal activity was renewed and chemically distinct CO2-
bearing hydrothermal fluids ascended through fractures into the footwall, precipitated
assemblage 2F minerals Py2, Mt, and CL-dark quartz in the footwall, cooled, and were trapped as
B15C inclusions under lithostatic pressure between 2500-3000 bars and temperatures of <300-
315°C (Table 7). Coincidently, some B15C fluids ascended into the hanging wall, where they
expanded to form B20C fluids, and precipitated assemblage 3 Py2, Mt, and CL-dark quartz.
B20C fluids in the hanging wall formed from B15C footwall fluids that expanded with
decreasing pressure to 1500-2000 bars in the hanging wall. Based on B20C isochors, these
inclusions were trapped between <300-330°C (Figure 22, Table 11). The interpretation that
B15C and B20C fluids are linked to the precipitation of assemblage 2F minerals in the footwall
and assemblage 3 minerals in the hanging wall is consistent with the moderate concentrations of
Fe quantified by LA-ICP-MS analyses in B15C and B20C fluids (Table 11).
Time 6: Precipitation of assemblage 3F in the footwall, and precipitation of assemblage 4 and
trapping of B75C inclusions in the hanging wall.
During time 6, hydrothermal fluids in excess of ~400°C and capable of transporting Cu
traveled upward through fractures into footwall rocks. As these fluids cooled they would have
precipitated assemblage 3F chalcopyrite and molybdenite in the footwall. Though, no fluid
inclusions related to assemblage 3F were identified, pressures of 2500-3000 bars and
temperatures of <400°C, which would allow for chalcopyrite and molybdenite precipitation are
inferred for assemblage 3F mineral precipitation.

98
As hydrothermal fluids associated with assemblage 3F mineralization ascended into the
hanging wall, a drop in pressure from lithostatic to hydrostatic conditions, probably in response
to a fracturing episode, caused the fluids to unmix, producing a CO2-bearing vapor, captured in
B75C inclusions. As the B75C fluid contains CO2, which would decrease the fluid pressure, the
hydrostatic pressure exerted by the fluid would be somewhat lower than the inferred hydrostatic
pressure of 550-750 bars interpreted for the hanging wall during times 1 and 3. Therefore,
hydrostatic pressure in the hanging wall during time 6 may have been reduced to ~500-650 bars,
which would correspond to trapping temperatures between ~350-380°C for B75C fluids (Figure
22, Table 11). Though the B75C inclusions were trapped in the hanging wall, no corresponding
saline inclusions, which would have formed in response to immiscibility and would further
support this interpretation were found in the hanging wall.
Time 7: The hydrothermal system waned and over time Fe-bearing minerals were oxidized.
After the hydrothermal system terminated and the hanging and footwall regions were
extended, faulted, uplifted and eroded, Fe-bearing minerals oxidized and were variably replaced
by hematite. This process is confirmed by the presence of hematite rims on many oxide and
sulfide minerals found in the hanging wall and footwall.
The paragenesis of fluids and minerals observed in the hanging wall and footwall, and
observed patterns of fluid inclusion distribution from the footwall to the hanging wall broadly
support the hypothesis that the footwall and the hanging wall represent a deep root zone and an
intermediate depth zone in a single porphyry-like hydrothermal system, respectively. In
particular, the presence of nearly identical quartz types and sulfide and oxide minerals in the
footwall and hanging wall, as well as their similar parageneses, virtually confirms that the
hydrothermal systems visible in both areas are genetically related. In addition, the temporal

99
evolution of fluids and minerals observed in the hanging wall and footwall is consistent with
B15D, B30, and B15C fluids trapped in the footwall to have evolved to the somewhat or
significantly lower density B15, B30H, B30D, B75, B75C, and B20C fluids trapped in the
hanging wall. These patterns support a genetic link between the hanging wall and the footwall, as
well as the faulted porphyry hypothesis. One aspect of the model of fluid evolution from the
footwall to the hanging wall presented above that is somewhat different from most productive
porphyries, is that the hanging wall, though having a broad similarity to the intermediate levels
of other porphyry systems, contains only sparse brine inclusions, which typically dominate in the
intermediate levels of most porphyry systems. An explanation for the low abundance of brine
inclusions and mineralization in the hanging wall might be that the inferred depth of formation
for the hanging wall, ~6-8 km, and the high lithostatic pressures between 1500-2000 bars
interpreted for the hanging wall, might have greatly reduced the amount of fracturing in a system
as deep as Kabba. Thus, the depth of the system may have reduced the amount of immiscibility
associated with fracturing. A reduction in immiscibility would, in turn, reduce the potential for
the formation of brine and coexisting vapor and would reduce the amount of mineralization that
would occur in response to immiscibility. This explanation is plausible for the Kabba system;
however, further exploration of the Kabba system is needed to better constrain the spatial
relationship of hanging wall samples to the inferred Kabba porphyry hydrothermal system, and
to identify the density of fracturing and fluid immiscibility present during the formation of
alteration and mineralization in the Kabba hanging wall.
One significant aspect of the fluid inclusion analyses is that vapor-rich B75 fluids appear
to have transported significant Cu, contributing to chalcopyrite mineralization in the hanging
wall. This is indicated by LA-ICP-MS analyses that showed that B75 inclusions typically

100
contained the highest Cu concentrations of any analyzed inclusions. Zajacz et al. (2012) have
shown experimentally that significant Cu can partition into vapor, and in the Bajo de la
Alumbrera porphyry in Argentina, vapor transport of Cu is thought to have been an important
factor in forming chalcopyrite mineralization in that system (Ulrich et al., 2001). Thus, it is
feasible that vapor transport was important in forming chalcopyrite mineralization in the hanging
wall; unfortunately, the partitioning of Cu between liquid and vapor phases cannot be determined
for this study because of the lack of immiscible fluid pairs in examined samples.
In addition to the fluid inclusion petrography and microthermometry data and
petrographic observations of the mineralization and alteration associated with veins in the
footwall and hanging wall, the hypothesis that the Kabba systems is porphyry-like in nature is
broadly supported by the patterns in Ba, Rb, and Sr concentration relative to Cu in inclusions in
the hanging wall and footwall. LA-ICP-MS analysis showed that inclusions with the highest
concentration of Ba, Rb, and Sr typically had the lowest Cu concentrations and vice versa. This
pattern has been recognized in ore fluids from other porphyry deposits, including Butte and Bajo
de la Alumbrera (Ulrich et al., 2001, Rusk et al., 2004), and indicates that the fluids in the Kabba
system may have evolved in a similar way to fluids in other porphyry systems. This suggests that
the Kabba is a porphyry-like hydrothermal system that may have economic mineralization.
However, further exploration and drilling are needed to test this interpretation.

101
CHAPTER 8
CONCLUSIONS
The objective of this thesis project was to test the hypothesis that the structurally
separated areas of mineralization and alteration in the Kabba footwall and hanging wall formed
together within the same hydrothermal system, and represent the deep root and intermediate
zones of a single porphyry-like hydrothermal system. Based on the results of this study, the
following conclusions have been identified.
1. The alteration types observed in the hanging wall and footwall are consistent
with alteration in intermediate zones and root zones of other porphyry systems
and suggest, and this suggests that the Kabba system is similar to some other
productive porphyry systems found around in the world.
2. The mineralization, alteration, and distribution of fluid inclusion types from
the footwall and the hanging strongly suggest that the hanging wall and
footwall formed as part of the same hydrothermal system, and that the
hanging wall formed at a shallower depth than the footwall.
3. Based on the microthermometric behavior of the fluid inclusions found in the
hanging wall and footwall it is possible for fluids found in the footwall to have
evolved into the fluids found in the hanging wall, suggesting a genetic link
between the two areas.
4. LA-ICP-MS data from the individual fluid inclusion groups found in the
hanging wall and footwall indicate that the fluids trapped in the fluid
inclusions associated with the mineralization and alteration in the hanging

102
wall and footwall were capable of forming the mineralization found
throughout the Kabba system.
5. Patterns in the concentrations of Sr, Ba, and Rb relative to Cu in all inclusions
groups in the hanging wall and foot wall are consistent with those found in
other porphyry systems and this further suggests that the Kabba system is
similar to other productive porphyry systems found around in the world.
6. Five distinct generations of hydrothermal fluid ascended from depth, traversed
the footwall and the hanging wall, cooled, and precipitated the mineralization
and alteration found in and adjacent to the veins in each area.
7. The fluids involved in forming the mineralization and alteration in the
hanging wall and footwall changed from being H2O to CO2-bearing over time.
8. Chalcopyrite mineralization in the hanging wall was associated with a low-
density vapor and the high Cu content of the vapor suggests that vapor
transport may have been important in the Kabba system.
9. The lithostatic pressure recorded by fluid inclusions in the footwall was
consistently at or between ~2500-3000 bars. The pressure conditions in the
hanging wall fluctuated between lithostatic pressures of ~1500-2000 bars, and
hydrostatic pressures of ~550-750 bars. These pressures correspond to depths
between 6-8 Km for the hanging wall and 10-12 Km for the footwall, and
indicate that the Kabba system formed at depths greater than those determined
for the Butte porphyry deposit.
103
10. Temperatures in the Kabba system fluctuated from high to low over time with
mineralization in the footwall forming between <300-545°C, and
mineralization in the hanging wall forming between <300-525.
11. The exploration model used by Bell Copper Corp. to guide past and current
drilling in the hanging wall, which is predicated on the assumption that the
hanging wall and the footwall formed as part of the same hydrothermal system
and have since been separated along a north-south trending normal fault, is
broadly supported by the comparison between the vein minerals, alteration
types, and fluid inclusion data from the hanging wall and footwall.
12. Additional drilling is needed to determine the economic potential of this
system and to further delineate economic mineralization and alteration in the
hanging wall that may have formed as part of the fossil hydrothermal system
present at Kabba. Additional exploration drilling at Kabba should focus on the
hanging wall area around the flanks of the Aeromagnetic anomaly, northeast
and northwest of drill hole K-10, as these areas have potential to host
economic mineralization. Conversely, further exploration and drilling in the
footwall is not recommended as this area appears to represent the sparsely
mineralized, root zone of the Kabba porphyry system and would have formed
bellow the productive part of the system.

104
Mineral name Characteristics and diagnostic features
Temporally
associated
sulfide/oxide
phases
Associated vein and
quartz type
Associated
alteration
type
Chalcopyrite 1
(Cpy1)
Small - moderately large (5-50µm), round anhedral inclusions in Py2,
small (5-50µm) anhedral inclusions in Mt, or large (50-200µm) pitted
crystals with sinuous boundaries that are intergrown with CL-bright
quartz.
Mo1 and Po ANB -and AB -veins; CL-
bright Potassic
Molybdenite 1
(Mo1)
Large (100-800µm) elongate clusters of euhedral crystals intergrown
with individual CL-bright quartz crystals along the margins of CL-
bright bands in AB veins. Also occurs as small elongate clusters of
euhedral crystals intergrown with individual CL-bright quartz along
the inner vein margin in ANB veins. In both AB and ANB veins Mo1 is
commonly surrounded by Mt, CPy2, or Py2 crystals.
CPY1 and PoANB- and AB -veins; CL-
brightPotassic
Pyrrhotite
(Po)
Small (5-50µm) round anhedral inclusions in CL-dark rimed Py2
crystals, either as individual Po crystals or alongside CPy1. Po is only
found as an inclusions in pyrite .
CPy1 and Mo1
ANB - and AB -veins; CL-
BrightPotassic
Pyrite 2
(Py2)
Large (100-1000µm) euhedral crystals that are rimmed by CL-dark
quartz, and commonly contain round anhedral inclusions of CPy1 and
Po, small angular euhedral inclusions of Mt, and small subhedral-
anhedral elongate inclusions of Ru. In AB veins individual Py2 crystals
can align along the center of the veins long axis.
Mt and Ru
CL-dark bands in ANB -
veins and in CL-dark
quartz-rich AB -veins;
CL-dark
Coarse Mica
Magnetite
(Mt)
Occurs as clusters of large (100-800µm), euhedral-subhedral crystals
or as euhedral -subhedral inclusions in Py2 crystals. Commonly
contains inclusions of subhedral CPy1 and Py2, have patches of Hem
on their surfaces and outer crystal margins, and is adjacent to
clusters of Ru in CM. Found in both vein types but most abundant in
ANB veins.
Py2 and Ru
Mostly ANB - and in
minor amounts in AB -
veins; CL-drak
Coarse Mica
Rutile
(Ru)
Occurs as clusters of small (10-200µm), anhedral crystals that coat
individual muscovite crystals along their margins and cleavage
planes. Ru is always associated with CL-dark quartz and forms along
the margins or individual AB veins and along the margins of
individual bands in ANB veins. Ru can also occur as an inclusions in
Py2
Py2, Mt, CPy2,
and Mo2
CL-dark bands in ANB-
viens and in CL-dark
quartz-rich AB- viens;
CL-dark
Coarse Mica
Coarse
Muscovite
(CM)
Occurs as clusters of large (10-500µm) euhedral crystals that host Ru
and Mo1 along their cleavage planes and outer crystal boundaries,
and form along the margins of CL-dark bands in AB veins and along
the outer margins of CL-dark rich ANB veins
Py2, Ru, Mt,
CPy2, and Mo2
Mostly CL-dark bands
in ANB- and in CL-dark
quartz-rich AB- viens;
CL-dark
Coarse Mica
Chalcopyrite 2
(Cpy2)
Clusters of crystals cryastals that range in size from 20-500µm , and
occur adjacent to or fill fractures in Py2. Only found in minor
amounts and is surrounded by CL-Dark quartz and commonly
adjacent to clusters of CM.
Mo2 and Ru
CL-dark bands in ANB -
veins and in CL-dark
quartz-rich AB- viens;
CL-dark
Coarse Mica
Molybdenite 2
(Mo2)
Occurs as large (50-100µm) elongate, subhedral-euhedral crystals
that form along cleavage planes in CM crystals or at random
orientations in elongate, “whispy”, clusters of coarse, Ru-bearing
muscovite in CL-Dark bands in AB veins. In ANB veins with abundant CL-
dark quartz, Mo2 typically occurs along the outer margins of the veins
and can be with in or adjacent to accumulations of CM.
CPy2 and Ru
CL-dark bands in ANB-
veins and in CL-dark
quartz-rich AB- viens;
CL-dark
Coarse Mica
Assem
blage 4F
Hematite
(Hem)
Always occurs as patchy rims of fine grained (<2µm) anhedral crystals
that form along through going fractures and outer boundaries of Py2
and Mt crystals.
No other
associated
minerals
ANB- and AB- viens Coarse Mica
Table 1. Footwall Sulfide and Oxide Mineral Characteristics
Assem
blage 1F
Assem
blage 2F
Assem
blage 3F
Table 1. Footwall Sulfide and Oxide Mineral Characteristics

105
Vein Type Characteristics Width Associated
alteration type
Quartz type
abundance
Sulfide/Oxide minerals
present
Sulfide/Oxide
occurrenceLocation
A
Granular quartz vein with sinuous or jagged boundaries
composed primarily of CL-bright quartz with cross-
cutting CL-dark quartz-filled fractures. These veins
never have sulfide centerlines, can be single veins or
multiple branching vein, and are cross cut by B veins.
Found in ~29% of hanging wall samples.
0.25 - 1 cm Potassic 80-85% CL-bright
15-20% CL-dark
Py 1-Sp; Cpy 1-Mo 1-Po;
Ru; Cpy2-Bn; Hem
Along the vein
margins or as
disseminated
clusters
Hanging wall
(K-10 Drill
Core)
B
Granular quartz vein with straight, well defined
margins. The edges of this vein type are typically
composed of coarse, euhedral, highly fractures , CL-
bright quartz, and the center of this vein type is
typically composed of anhedral CL-dark quartz that
surrounds the sulfide filled centerlines and fills in
fractures in Cl-bright quartz. Sulfides in this vein type
occur as disseminated clusters in the absence of a well
defined centerline. Most common hanging wall vein
type.
0.5 - 2 cmPotassic and
green mica
50-65% CL-bright
35-50% CL-dark
Py1-Sphl-Gl;
Cpy1-Mo1-Po;
Py2 -Ru-Mt;
Cpy2 -Mo2 ; Hem
Along the vein
margins, as
disseminated
clusters, or as a
centerline along the
veins long axis
Hanging wall
(K-10 Drill
Core)
D
Straight, semi-continuous vein composed completely
of sulfide minerals. Always found <0.5cm from the
margins of B-type veins and are oriented parallel to
the B-type vein's long axis. Found in ~27% of hanging
wall samples and are never cross cut my any other vein
type.
2-4 mmPotassic and
green Mica n/a Cpy1-Po; Py2
Through out this
vein type
Hanging wall
(K-10 Drill
Core)
ANB
Moderately sinuous granular quartz veins that are
identical to individual Cl-dark and Cl-bright bands in
the A-typeB veins in terms of their mineralogy and
associated alteration selvedges. A-typeNB differ form A-
typeB veins in that their sulfide and oxide phases only
occur as disseminated clusters throughout the vein or
along its margin, and are not aligned. These veins also
host large masses of magnetite which are absent from
A-typeB veins.
0.5-5 cm
Potassic and
coarse
muscovite
50% CL-bright
50% CL-dark
Cpy1-Mo1-Po;
Py-Mt-Ru; Cpy2 -Mo 2;
Hem
Along the vein
margins or as
disseminated
clusters
Foot Wall
(Outcrops)
AB
Vertically oriented vein with moderately sinuous or
straight margins composed of multiple parallel bands
of CL-bright and CL-dark quartz. Individual bands can
have clusters of coarse sulfides that align parallel to
the long axis and/or coarse muscovite along the band
margins. This vein type also typically has an alteration
selvedge which extends 10 cm-1.5m from the vein
margins
0.05-2m
Potassic and
coarse
muscovite
50% CL-bright
50% CL-dark
Cpy 1-Mo 1-Po;
Py-Mag- Ru;
Cpy 2-Mo 2; Hem
Along the vein
margins or as
disseminated
clusters that align
parallel to vein's
long axis
Foot Wall
(Prospect
Pits)
Hanging W
all Foot W
all
Table 2. Vein Types

106
AB ANB
CL-bright/dark
Quartz
Both quartz types form multiple discrete
bands within single veins
CL-bright quartz is most abundant in sinuous ANB
veins and little or no coarse mica. CL-dark quartz is
most abundant in veins with straight margins and
abundant coarse mica.
Ru and Mo2 -
hosting coarse
muscovite
Ru and Mo2 hosting coarse muscovite
typically occurs in between individual CL-
dark and CL-bright bands or fills fractures in
CL-bright bands.
Ru and Mo2 hosting coarse muscovite occurs both
within the ANB veins and along its margins.
Mo1
Mo1 is commonly intergrown with individual
quartz crystals throughout a CL-bright
quartz AB band .
Mo1 is intergrown with CL-bright quartz along the
outer margin of ANB veins
Cpy2 Cpy2 is typically more abundant in AB veins. Cpy2 is typically less abundant in ANB veins.
Mo2
Mo2 forms subhedral-euhedral, crystals
along cleavage planes in coarse mica
crystals, or at random orientations in
“wispy”, masses of coarse mica, which align
parallel the outer margins of individual
bands in AB veins.
Mo2 occurs mostly in moderately straight ANB vein
boundaries with abundant CL-dark quartz, and forms
along the outer margins of the ANB veins and can be
adjacent to or surrounded by coarse muscovite
Py2
Py2 is normally found in CL-Dark bands and
forms subhedral-euhedral crystals which
align parallel to the margins of individual
bands.
Py2 commonly occurs along the vein margins and
individual crystals are only weakly aligned with one
another.
Mt masses Mt masses are commonly <1-2mm wide
Mt masses are commonly between 1-5mm wide. In
ANB veins with straight margins and abundant CL-
dark quartz, Mt masses can be >5mm
Table 3. Comparison between AB and ANB veinsTable 3. Comparison Between AB and ANB Veins

107
Mineral name Characteristics and diagnostic features
Temporaly
associated
slufide/oxide
phases
Associated vein and quartz typeAssociated
alteration type
Pyrite 1
(Py1)
Euhedral pyrite crystals (50-200µm ) with a rough or pitted appearance. Contain no
inclusions of any other sulfide or oxide minerals. Can be partly or completely surrounded
by other sulfides, particularly chalcopyrite.
Sp, Gl, cc In B- veins and in minor
amounts in A-veins; CL-brightPotassic
Sphalerite
(Spl)
Large (50-500µm) anhedral crystals with smooth, undulating boundaries. Individual
crystals can have abundant angular anhedral inclusions of chalcopyrite, minor round
inclusions of galena, and can be trasparten yellow or fully opaque in transmitted light.
Can occur as an inclusion in CPy2, Py2, or Mt.
Gl, cc, Py1
B-vein that have <40% Cl-dark
quatz, and in minor amount in A-
veins; CL-bright
Potassic
Galena
(Gl)
Large (50-600µm ) anhedral crystals with smooth, undulating boundaries. Always
adjacent to Sp crystals which can surround or fill crack in individual Gl crystals. Also
adjacent to Py1 and calcite, and cross cut by CPy 2.
Sp, Py1, CCB-vein that have <40% Cl-dark
quatz; CL-brightPotassic
Carbonate
(cc)
Clumps of small (<2µm) anhedral, grey crystals that fill in around CL-bright quartz
crystals, Sp, and Gl. Forms bands along the outer margins of B-type veins and is
commonly intergrown with euhedral, CL-bright quartz crystals that can range in size from
5-8mm long.
Sp, Py1, GlOnly along the
margins of B- veins; CL-brightPotassic
Chalcopyrite 1
(Cpy1)
Small (5-50µm) round anhedral inclusions in Py2 crystals that are rimed by CL-Dark
quartz. Can also occurs as small anhedral to subhedral crystals intergrown with CL-bright
quartz or as small anhedral crystals disseminated in the host rock.
Mo1 and Po
In B-veins as an inclusions in Py2
andi n A-veins when occuring as
induvidual crystals; CL-bright
Potassic
Molybdenite 1
(MO 1)
Moderatly sized (100-500 µm) clumps of euhedral-subhedral, lath-shaped crystals that
range in size from 50-100µm intergrown with CL-bright quartz crystals or as individual
euhedarl crystals along the margins of CL-bright quartz domnianted veins. Individual
euhedarl crystals rarely fill cracks in Py1 or are surounded by Py2.
CPy1 and Po
In CL-bright dominated B-veins
and in minor amounts in A-veins;
CL-bright
Potassic
Pyrrhotite
(Po)
Small (5-50µm ) round anhedral inclusions in Py2. Commonly occurs with CPy1 either
within the same inclusion or as single inclusions adjacent to individual CPy1 inclusions. CPy1 andMo1
In B- and D- veins, but also
found in minor amounts in A-
veins; CL-birght
Potassic
Pyrite 2
(Py2)
Lar ge (100-1000 µm) euhedral-subhedral cystals that contain round anhedral inclusions
of CPy1 and Po, anhedral inclusions of Ru, and euhedral inclusions of Mt. Commonly
forms centerlines in B-type veins, can have a shatered appearance, and are surrounded
by CL-dark quartz.
Mt and Ru
In B-and D-veins, but also found
in minor amounts in A-veins; CL-
dark
Green
phyllosilicate
Magnetite
(Mt)
Large (100-800µm) euhedral to subhedral crystals intergrown with CL-Dark quartz and
GM, and in CL-dark filled fractures in CL-bright quartz. Can occur adjacent to or within
inclusion Py2 crystals. Mt inclusions in Py2 are commonly euhedral . Normally rimmed by
Hem.
Py2 and Ru Only in B-veins; CL-darkGreen
phyllosilicate
Rutile
(Ru)
Masses of small (10-200µm) round anhedral crystals adjacent to or within clusters of GM
. Can also occur as oval or elongate subhedral- anhedral inclusion in Py2. Py2 and Mt
In B-veins, and most abundant in
B-veins with well developed
green phyllosilicate alteration
selvedges; CL-dark
Green
phyllosilicate
Greem
muscovite
(GM)
Clusters of dark green, crystals that range in size from 50-200µm, fill fractures in CL-
bright quartz and are intergrown with CL-dark quartz. Most abundant in samples with
well developed GM alteration selvedges.
Py2, Mt, Ru,
CPy2, Mo2,
and Bn
Only found in B-veins; CL-darkGreen
phyllosilicate
Chalcopyrite 2
(Cpy2)
Large (20-500µm ) anhedral crystals that form adjeacent to inclusion bearing Py2, and in
CL dark filled fractures in Cl-bright quartz, Gl, Sp, and Py1. Can have Gl inclusions or Bn
rims.
Mo2 and Bn
In B-veins but also in A-veins
essecally when associated with
Bn; CL-dark
Green
phyllosilicate
Molybednite 2
(Mo2)
Clusters of (50-100µm) euhedral, lath-shaped cystals that occur within or adjacent to
clusters green muscovite and Cl-dark quartz. Clusters of CL-dark quartz, GM, and Mo2
cross-cut Cl-Bright quartz and filling fractures in shattered Py2 crystals.
CPy2 and BnIn B-veins with > 40% Cl-dark
quartz; CL-dark
Green
phyllosilicate
Bornite
(Bn)
Forms rims of small (10-50µm) anhedral crystals around CPy2 crystals. Bn rimed CPy2 are
commonly surrounded by or adjecent to spalys of lath-shaped Hem.Mo2 and CPy2 Only found in A-veins; CL-dark
Green
phyllosilicate
Assem
blage 5
Hematite
(Hem)
Splays of large (5-150µm ) elongate, euhedral, lath shaped crystals, or rims of small,
anhedral crystals along the outer margins of Fe baring oxide and sulfide phases, and
clusters of Ru.
No associated
phases
In all vein types; Not associated
with any quartz type
no associated
alteration type
Table 4. Hanging wall sulfide and oxide mineral characteristics
Assem
blage 1
Assem
blage 2
Assem
blage 4
Assem
blage 3
Table 4. Hanging Wall Sulfide and Oxide Mineral Characteristics

108
Assemblage Minerals Time 1 Time 2 Time 3 Time 4 Time 5 Time 6 Time 7
Pyrite 1
Sphalerite
Galena
Carbonate
Chalcopyrite 1
Molybdenite 1
Pyrrhotite
Pyrite 2
Magnetite
Chalcopyrite 2
Molybednite 2
Bornite
5 Hematite
3 & 4Greem muscovite
+ Rutile
1 & 2 Cl-Bright Quartz
3 & 4 CL-Dark Quartz
Hanging w
all
Table 5. Mineral paragenisis for the hanging wall
1
2
3
4
Table 5. Mineral Paragenisis For the Hanging Wall
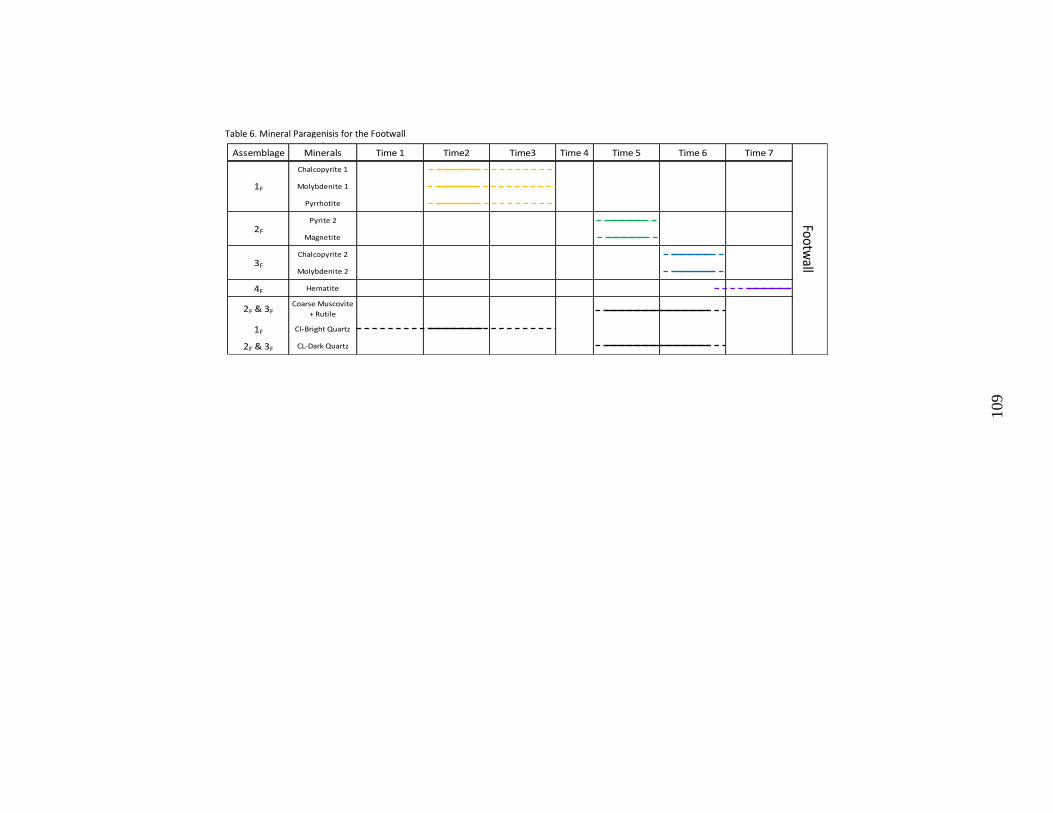
109
Assemblage Minerals Time 1 Time2 Time3 Time 4 Time 5 Time 6 Time 7
Chalcopyrite 1
Molybdenite 1
Pyrrhotite
Pyrite 2
Magnetite
Chalcopyrite 2
Molybdenite 2
4F Hematite
2F & 3FCoarse Muscovite
+ Rutile
1F Cl-Bright Quartz
2F & 3F CL-Dark Quartz
Footwall
Table 6. Mineral paragenisis for the footwall
3F
1F
2F
Table 6. Mineral Paragenisis for the Footwall

110
Time 1 Time 2 Time 3 Time 4 Time 5 Time 6 Time 7
Cooling Cooling
Minerals
Precipitated
Assemblage 1
(Gl, Sp, Py1)
CL-B, K-alt
Beginning
Assemblage 2
CL-B, K-alt
Assemblage 2
(CPy1, Mo1, Po)
CL-B, K-alt
Assemblage 3
(Py2, Mt)
CL-D, GM-Alt
Assemblage 4
(CPy2, Mo2, Bn)
CL-D, GM-Alt
Entrapment
Conditions
<300-350°C
(Hydro) 550-750 Bars
325-450°C
(Litho) 1500-2000 Bars
425-525°C
(Hydro) 550-750 Bars
<300-330°C
(Litho) 1500-2000 Bars
350-380°C
(Hydro) 500-650 Bars
Inclusions
B30H brine
(~35.4 wt% NaCl equiv)
No Vapor Trapped
(~1-4.5 wt% NaCl equiv)
B15
(~8 wt% NaCl equiv)
B30D
(~8 wt% NaCl equiv)
No brine trapped
(~30-50 wt% NaCl equiv)
B75 Vapor
(~4.5 wt% NaCl equiv)
B20C
(~2 wt% NaCl equiv)
No brine trapped
B75C Vapor
(~2 wt% NaCl equiv)
Immiscibility or
Expansion ?
Immiscibility
(Fracturing event and P
decrease at 500-600°C)
Expansion
Immiscibility
(Fracturing event and P
decrease at 500-575°C)
Expansion
Immiscibility?
(Fracturing event
and P decrease )
Ascending
hydrothermal
fluids
Minerals
PrecipitatedN/A
Assemblage 1F
(CPy1, Mo1, Po)
CL-B, K-alt
CL-B, K-alt
Assemblage 2F
(Py2, Mt)
CL-D, CM-Alt
Assemblage 3F
(CPy2, Mo2)
CL-D, CM-AltEntrapment
ConditionsN/A
<300-370°C
2500-3000 Bars
425-545°C
2500-3000 Bars
<300-315°C
2500-3000 BarsN/A
Inclusions None trappedB15D
(~5 wt% NaCl equiv)
B30
(~5 wt% NaCl equiv)
B15C
(~4 wt% NaCl equiv)None trapped
Ascending
hydrothermal
fluids
*Predicated by H2O-NaCl phase diagram
CL-B=CL-bright, CL-D=CL-dark, K-alt=Potassic alteration, GM-alt= green mica alteration, CM-alt=Coarse mica alteration
Table 7. Interpretation of fluid evolution from the footwall to the hanging wall and the formation of mineralization and alteration in each area
Heating Heating
M+ -rich Fluids exsolved from H2O-saturated magma at depth
Han
ging
Wal
l Injection of
hydrothermal fluids
subsides
and system cools.
Fracturing of CL-B
quartz.
Injection of
hydrothermal fluids
subsides, system
cools and Fe-bearing
phases oxidize to
Hematite (Assemblage
5)
Foot
wal
l
Injection of
hydrothermal fluids
subsides
and system cools.
Fracturing of CL-B
quartz.
Injection of
hydrothermal fluids
subsides, system
cools and Fe-bearing
phases oxidize to
Hematite (Assemblage
4F)
Table 7. Interpretation of Fluid Evolution From the Footwall to the Hanging Wall and the Formation of Mineralization in Each Area

111
Inclusion
type
3Phases
present
TmIce Range (°C)
Avg
TmCla Range (°C)
Avg
4TmH Range (°C)
Avg
Th Range (°C)
Avg
Th CO2 (°C)
Avg
2Salinity Range
(Wt% NaCl
equiv)
Mol% CO2
2Bulk Density
(g/cm3)
B15
n=20
H2O(L) +
H2O(V)
-1.6 - -11.0
-4.5n/a n/a
167.0-342.0 (L)
~257.0
37% between
239.0-265.5
37% between
305.3-342.6
n/a~3.0-15.0
avg = ~8.5 n/a
0.73 - 0.93
0.82
B30D
n=98
H2O(L) +
H2O(V) +/-
TDC
+/- T +/- O
-0.1 - -21.1
-5.7
71% between
-2.5 - -4.6
n/a n/a
106.0-430.0(L)
~325.0
36% between
220.0-234.0
n/a
~2.0 - 16.0
avg = 8.6
71% between
4.1 - 7.3
n/a0.55 - 0.97
0.75
B30H
n=42
H2O(L) +
H2O(V) + H
+/- T +/- O
n/a n/a
176.6-312.1
203.0
88% between
176.6-215.2
210.5-437.6 (L)
~271.0 n/a
~31.0 - 39.0
avg = 32.0n/a
0.88 - 1.11
1.06
B75
n=21
H2O(L) +
H2O(V) +/- O
-1.0 - -5.5
-2.9n/a n/a
357.0-405.0 (V)
~378.0n/a
~2.0 - 6.0
avg = 4.5
75% between
4.4 - 5.8
n/a0.53 - 0.58
0.55
B20C
n=77
H2O(L) +/-
CO2(L) +
CO2(V) +/-
TDC +/- O
n/a5.3 - 10.0
9.3 n/a
120.0 - 400.0 (L)
~294.0
40% between
301.0-352.0
23.0 - 28.0
27.3
~0.0 - 8.0
avg = 1.6
75% between
0.0 - 1.8
~3.0 - 45.0
72% between
3.0-15.0
0.74 - 0.98
0.88
B75C
n=93
H2O(L) +/-
CO2(L)
+ CO2(V)
n/a3.5 - 10.0
8.8n/a
101.0-533.0 (V)
~300.0
46% between
300.0-393.0
23.0 - 29.0
25.0
~0.0 - 9.0
avg = 2.1
69% between
0.0 - 1.6
~3.0-27.0
84% between
22.0-27.0
0.47 - 0.90
0.53
B15D
n=120
H2O(L) +
H2O(V) +/-
TDC +/- T
+/- O
-0.9 - -6.0
-3.1n/a n/a
115.0-271.0 (L)
~203.0
22% between
120.0-137.0
25% between
167.0-179.0
n/a
~2.0 - 9.0
avg = 5.0
71% between
2.5 - 5.9
n/a0.85 - 1.00
0.94
B30
n=5
H2O(L) +
H2O(V) +/- O
-2.3 - -3.4
-3.1n/a n/a
151.0-283.0 (L)
~227.0
80% between
242.0-282.0
n/a~4 - 6
avg = 4.8n/a
0.80 - 0.92
0.84
B15C
n=107
H2O(L) +/-
CO2(L) +
CO2(V) +/-
TDC +/- O
n/a0.2 - 10.0
8.0n/a
115.0-271.0 (L)
~203.0
20.6 - 30.5
30.1
0.0 - 15.0
avg = 3.8
48% between
0.0 - 1.8
~1.0-10.3
79% between
3.0-5.0
0.89 - 1.10
0.98
4 TmH only for those inclusions which exhibited final homogenization by vapor bubble disapearance
Table 8. Microthermometric Properties of Fluid Inclusions
1Th= minimum temperature due to difficulty in observing final homogenization2Calculated in MacFlincor. B15, B30D, B30H, B75, B30 and B15D: H2O-NaCl-[KCl] system. B20C, B75C, and B15C: H2O-CO2-[NaCl] system. 3 TDC= translucent daughter crystal, T= triangular opaque, O= Oval opaque

112
Inclusion
Type
Number of
analyzed
inclusions with
detectable CO2
CO2 density
range
and average
(g/cm3)
B15
n=51 0 .77
B30D
n=2415
0.0 - 0.35
avg = 0.16
B30H
n=71 [0.14]
B75
n=64
0.01 - 0.15
avg = 0.11
B15D
n=258
0.0 - 0.77
avg = 0.16
B30
n=0n/a n/a
B20C
n=1010
0.01 - 0.76
avg = 0.25
B75C
n=66
0.0 - 0.76
avg = 0.31
B15C
n=74
0.00 - 0.77
avg = 0.24
Table 9. Raman Spectroscopy Data

113
Cu Zn, Pb, Mn Sr, Rb, Ba Fe Cu Zn, Pb, Mn Sr, Rb, Ba Fe
B15 High Moderate-Low Moderate Moderate-High High Moderate-Low Moderate Moderate-High
B30D Moderate-Low Moderate-Low Moderate Low Low Moderate-Low Moderate-Low Moderate-Low
B30H Moderate-Low Very high High High Low High High High
B75 High low-very low Low-Very Low Low-Very Low High Low Low Low
B15D High-moderate Low Low Low High-moderate Moderate-Low Moderate-Low Moderate-Low
B20C Low Low Low Low Low Low Moderate-High Moderate-High
B75C Low Low Low Low moderate-high Low Low Low
B15C Low Low Low Low Moderate Moderate Moderate Moderate
Table 10. Summarry of Relative Abundnaces of Elements Within Inclusion Groups
Overall Compared to other CO2 inclusions
Compared to other H2O inclusionsOverall
H2O
-rich
CO2-
rich

114
Inclusiongroups 500-1000Bars 1000-1500Bars 1500-2000Bars 2000-2500Bars 2500-3000Bars 3000-3500Bars 3500-4000Bars
B15High 275-315 315-350 350-385 385-415 415-455 455-490 n/a
B15Low 345-390 390-445 445-490 490-530 530-580 580-625 n/a
B30DHigh1 350-395 395-445 445-490 490-540 540-585 585-635 635-685
B30DLow1 425-515 515-590 590-675 675-750 n/a n/a n/a
B30DHigh2 270-290 290-325 325-355 355-385 385-420 420-450 450-480
B30dLow2 335-380 380-425 425-470 470-515 515-555 555-600 600-645
B30HHigh 240-265 265-290 290-325 325-350 350-380 380-410 410-435
B30HLow 320-350 350-385 385-420 420-455 455-490 490-525 525-560
B75High 425-510 510-600 600-680 680-770 n/a n/a n/a
B75Low 470-570 570-675 675-775 n/a n/a n/a n/a
B30High 275-315 315-350 350-380 380-425 425-460 460-500 n/a
B30low 325-365 365-410 410-455 455-500 500-545 545-580 n/a
B15DHigh1 n/a n/a n/a 200-225 225-235 235-270 270-290
B15DLow1 n/a n/a 220-245 245-260 260-290 290-320 320-345
B15DHigh2 n/a 220-245 245-275 275-305 305-335 335-365 365-380
B15DLow2 225-250 250-275 275-310 310-340 340-370 370-395 395-425
Inclusiongroups 500-1000Bars 1000-1500Bars 1500-2000Bars 2000-2500Bars 2500-3000Bars 3000-3500Bars 3500-4000Bars
B20CHigh n/a n/a 250-260 260-275 275-310 310-325 325-350
B20CLow n/a 265-290 290-330 330-365 365-390 390-435 435-470
B75CHigh 350-475 475-600 n/a n/a n/a n/a n/a
B75CLow 355-500 500-670 670-860 n/a n/a n/a n/a
B15CHigh n/a n/a n/a 230-240 240-275 275-295 295-320
B15CLow n/a n/a 240-265 265-280 280-315 315-330 330-360
Table11.SummaryofHangingWallandFootwallIsochors
FW
CO2-Rich
HW
FW
Aqueous
HW

115
Figure 1. Global distribution of porphyry copper deposits. Major deposits are shown in red text. From John et al., 2010,
modified from Seedorff et al., 2005.

116
Figure 2. Distribution of porphyry copper deposits throughout Arizona. Porphyry copper deposits are
denoted by orange diamonds, Laramide-aged igneous intrusive rocks are shown in red, older igneous
intrusive rocks are shown in blue, and post-Laramide cover is shown in white. Modified from John et al.,
2010.

1
17
Figure 3. Porphyry deposit formation and characteristics. A)
Generalized cross-section through a porphyry deposit showing the
relative position and zoning of alteration types. Modified from Sillitoe,
2010. B) Generalized model of a cupola at the top of a magma chamber,
under a pull-apart jog in a strike slip fault. H2O-saturated magma under
the cupola is exsolving metal-rich fluid into the cupola. Over time,
displacement along the strike-slip fault causes the cupola to rupture and
vent the fluids in to the fractured area within the pull-apart jog where
they cool and form porphyry-style alteration and mineralization.
Modified from Cloos and Sapiie, 2013. C) Schematic diagram of an
inwardly cooling stock showing the convection of H2O-saturated
magma under a fluid-charged cupola. The red boxes labeled ‘A’ and ‘B’
show the relative positions of the areas depicted in parts A and B of this
figure. Modified from Cloos and Sapiie, 2013.

118
Figure 4. Schematic chronology of A, B and D veins in a typical Cu-Mo porphyry
deposit. The dashed line in on the B veins signifies a centerline and the hashed and
stippled areas around the veins represent potassic (K-alt) and mica (mica-alt) alteration
selvedges. Modified from Sillitoe, 2010.

119
Figure 5. Fluid inclusion assemblage distribution model for the Butte porphyry deposit. The pie charts indicate the relative
abundances of each identified FIA throughout the deposit. The notation B# indicates the vol% of vapor in a particular FIA
(B20 = 20 vol% of this inclusion is occupied by a vapor bubble). The notation B15H indicates 15 vol% vapor and a halite
daughter crystal. Note how the abundance of 85 vol% inclusions increases with decreasing depth. From Rusk et al., 2008.
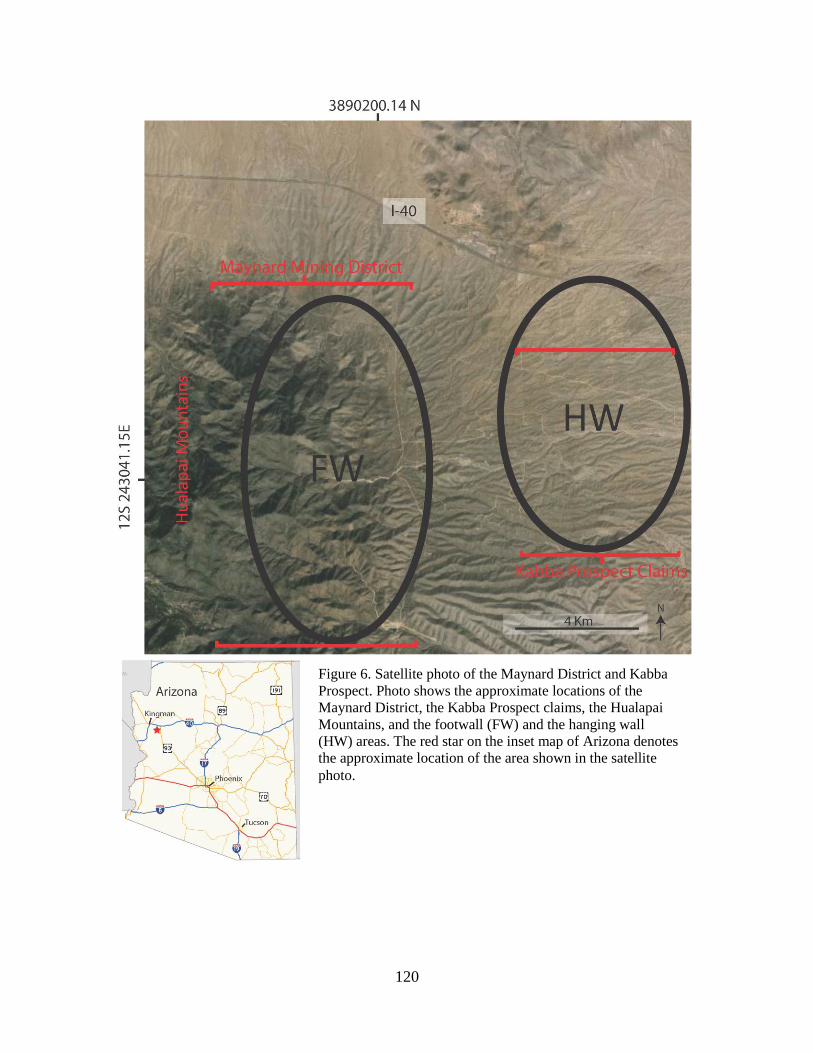
120
Figure 6. Satellite photo of the Maynard District and Kabba
Prospect. Photo shows the approximate locations of the
Maynard District, the Kabba Prospect claims, the Hualapai
Mountains, and the footwall (FW) and the hanging wall
(HW) areas. The red star on the inset map of Arizona denotes
the approximate location of the area shown in the satellite
photo.

121
Figure 7. Geologic map of the hanging wall and footwall.
The approximate locations of hanging wall (labeled HW) and
footwall (labeled FW) areas are circled in black. The
Hualapai fault is denoted by a dashed blue line, Bell Copper
Co. drill holes are denoted by red dots, historic mines are
denoted by crossed pick axes, and the locations of cross
section shown in Figure 9 are denoted by lines A-A’ and B-
B’. In the footwall, surface outcrops of Laramide granites,
granodiorites, monzonites, and quartz monzonites are west of
the Hualapai fault and are shown in red, and Precambrian
granites and gneisses are shown in tan and brown,
respectively. In the hanging wall, Quaternary gravels are
shown in light yellow and surface outcrops of granites and
granodiorites are shown in light orange and yellow,
respectively. Modified from Pastor, 2013. The red star on the
inset map of Arizona denotes the approximate location of the
area shown in the satellite photo.

122
Figure 8. Satellite photo of Mineral Park and Bagdad porphyry copper deposits, and the
Kabba hanging wall and footwall. The Kabba hanging wall and footwall locations are
denoted by the black square.

123
Figure 9. Interpreted east-west cross
sections through the Kabba hanging wall
and footwall. Cross-sections show the
interpreted displacement along the
Hualapai fault, the location of exploration
holes drilled by Bell Copper Corp (K-
1,2….) and others, and the potential
location of a mineralized porphyry
system (TKqm with purple cross
hatching). Modified from Pastor, 2013.

124
124
Figure 10. Aeromagnetic map of the Kabba hanging wall and footwall. The black arrows
denote the approximate direction of displacement of interpreted faulted magnetic highs
along the Hualapai normal fault (dashed blue line). The hot colors of the anomaly indicate a
positive anomaly. Laramide granites, granodiorites, monzonites, and quartz monzonites in
the footwall are outlined in black and the exploration claims owned by Bell Copper Co. are
outlined with a red dashed line. Crossed pickaxes show the locations of the historic mining
claims. USGS aeromagnetic data modified from Bell Copper Co. (2013), after Sweeney and
Hill (2001).

125
125
Figure 11. Seismic reflection data from the Kabba prospect. A) Seismic reflection data from the
Kabba prospect. The survey line used to gather this seismic data is roughly parallel to the B-B’
cross-section line shown in Figure 7 and this is denoted by the B and B’ lettering on the top left
and right-hand corners of this image. B) The same seismic reflection data shown in A, but with
the Hualapai normal fault, as well as other smaller unnamed faults, traced in black. The purple,
green, and yellow lines trace the contacts between layers of Quaternary sediments. Modified from
Bell Copper Corp, 2013.

126
Figure 12. Satellite photos of the Kabba footwall and hanging wall area. A) Satellite photo of the Kabba hanging wall and
footwall areas showing the approximate locations of images shown in B and C. The red star on the inset map of Arizona
denotes the approximate location of the area shown in the satellite photos. B) Satellite photo of the Kabba hanging wall
showing the approximate location of image A in Figure 13 (red box). C) Satellite photo of the Kabba footwall showing the
approximate locations of images B (blue box), C (red box), D (green box), and E (yellow box) in Figure 13 (red box).

127
Figure 13. Satellite photo of drill hole
K-10 and individual sampling
locations from the Kabba Footwall. A)
Satellite photo of the Kabba hanging
wall showing location of drill hole K-
10. B-E) Satellite photos showing
sampling locations for the Kabba
footwall. Each sample location is
denoted by a white dot with the
catalog ID for the sample set that was
collected from that location. Location
of A shown in Figure 12 B; location of
B-E shown in Figure 12 C.
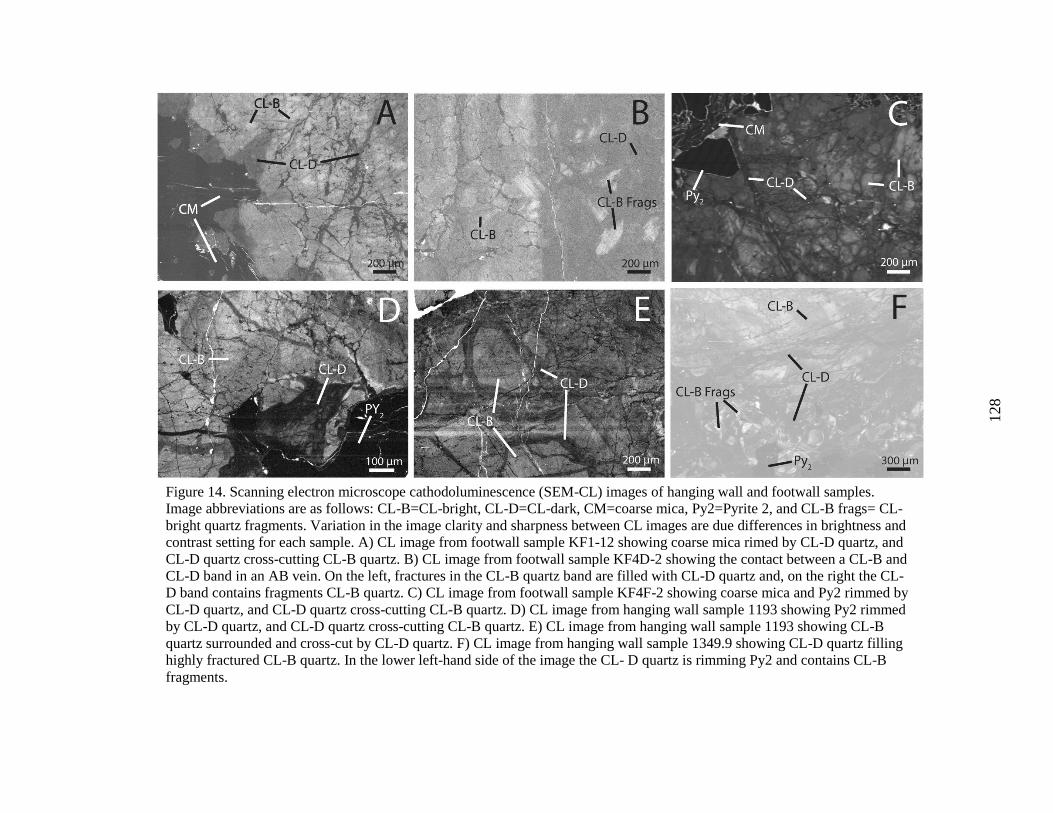
128
Figure 14. Scanning electron microscope cathodoluminescence (SEM-CL) images of hanging wall and footwall samples.
Image abbreviations are as follows: CL-B=CL-bright, CL-D=CL-dark, CM=coarse mica, Py2=Pyrite 2, and CL-B frags= CL-
bright quartz fragments. Variation in the image clarity and sharpness between CL images are due differences in brightness and
contrast setting for each sample. A) CL image from footwall sample KF1-12 showing coarse mica rimed by CL-D quartz, and
CL-D quartz cross-cutting CL-B quartz. B) CL image from footwall sample KF4D-2 showing the contact between a CL-B and
CL-D band in an AB vein. On the left, fractures in the CL-B quartz band are filled with CL-D quartz and, on the right the CL-
D band contains fragments CL-B quartz. C) CL image from footwall sample KF4F-2 showing coarse mica and Py2 rimmed by
CL-D quartz, and CL-D quartz cross-cutting CL-B quartz. D) CL image from hanging wall sample 1193 showing Py2 rimmed
by CL-D quartz, and CL-D quartz cross-cutting CL-B quartz. E) CL image from hanging wall sample 1193 showing CL-B
quartz surrounded and cross-cut by CL-D quartz. F) CL image from hanging wall sample 1349.9 showing CL-D quartz filling
highly fractured CL-B quartz. In the lower left-hand side of the image the CL- D quartz is rimming Py2 and contains CL-B
fragments.
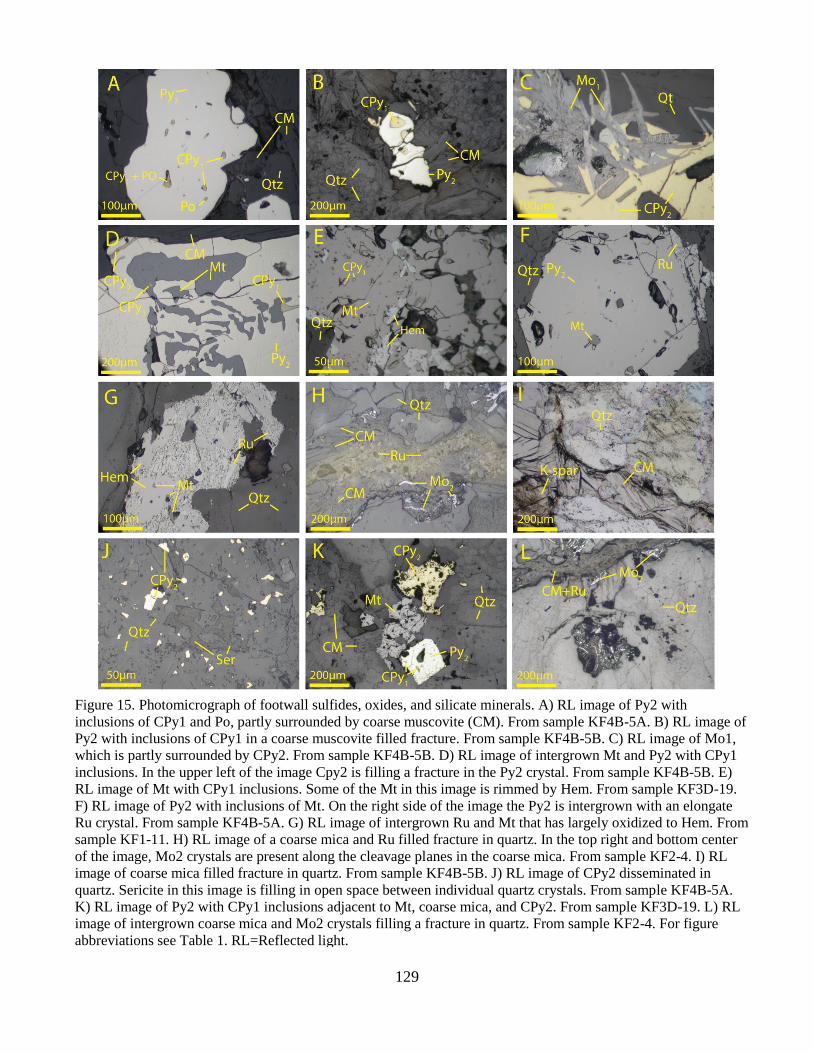
129
Figure 15. Photomicrograph of footwall sulfides, oxides, and silicate minerals. A) RL image of Py2 with
inclusions of CPy1 and Po, partly surrounded by coarse muscovite (CM). From sample KF4B-5A. B) RL image of
Py2 with inclusions of CPy1 in a coarse muscovite filled fracture. From sample KF4B-5B. C) RL image of Mo1,
which is partly surrounded by CPy2. From sample KF4B-5B. D) RL image of intergrown Mt and Py2 with CPy1
inclusions. In the upper left of the image Cpy2 is filling a fracture in the Py2 crystal. From sample KF4B-5B. E)
RL image of Mt with CPy1 inclusions. Some of the Mt in this image is rimmed by Hem. From sample KF3D-19.
F) RL image of Py2 with inclusions of Mt. On the right side of the image the Py2 is intergrown with an elongate
Ru crystal. From sample KF4B-5A. G) RL image of intergrown Ru and Mt that has largely oxidized to Hem. From
sample KF1-11. H) RL image of a coarse mica and Ru filled fracture in quartz. In the top right and bottom center
of the image, Mo2 crystals are present along the cleavage planes in the coarse mica. From sample KF2-4. I) RL
image of coarse mica filled fracture in quartz. From sample KF4B-5B. J) RL image of CPy2 disseminated in
quartz. Sericite in this image is filling in open space between individual quartz crystals. From sample KF4B-5A.
K) RL image of Py2 with CPy1 inclusions adjacent to Mt, coarse mica, and CPy2. From sample KF3D-19. L) RL
image of intergrown coarse mica and Mo2 crystals filling a fracture in quartz. From sample KF2-4. For figure
abbreviations see Table 1. RL=Reflected light.
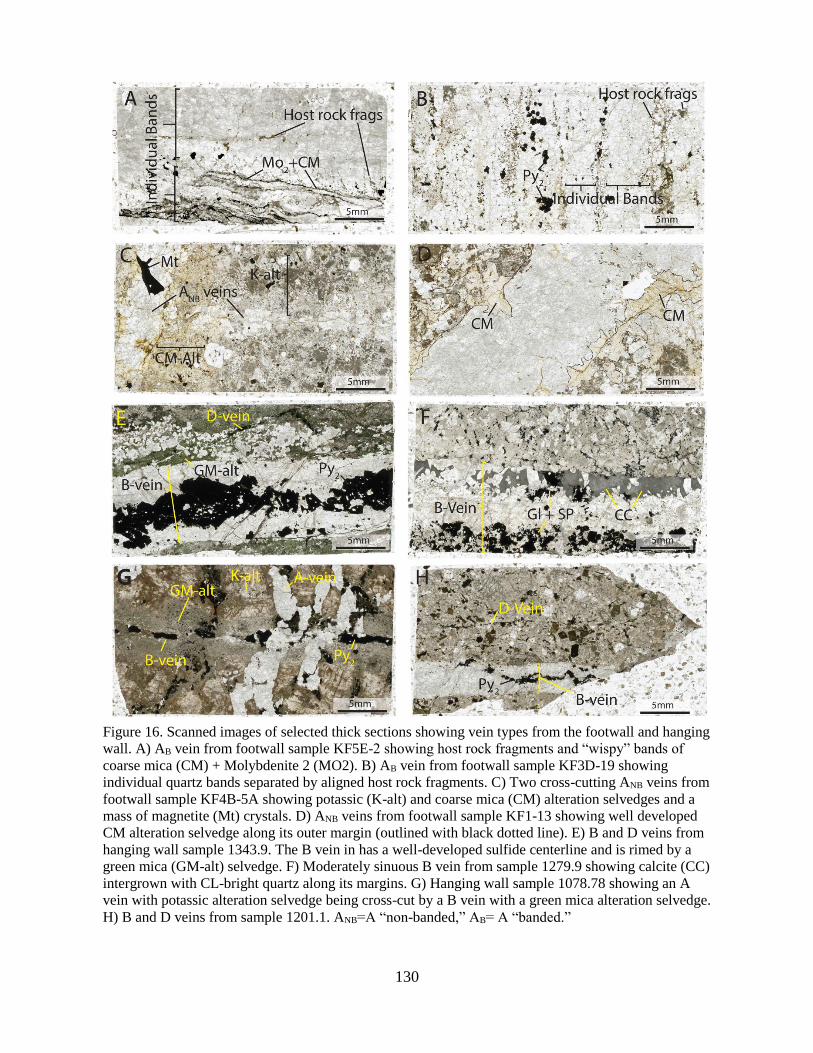
130
Figure 16. Scanned images of selected thick sections showing vein types from the footwall and hanging
wall. A) AB vein from footwall sample KF5E-2 showing host rock fragments and “wispy” bands of
coarse mica (CM) + Molybdenite 2 (MO2). B) AB vein from footwall sample KF3D-19 showing
individual quartz bands separated by aligned host rock fragments. C) Two cross-cutting ANB veins from
footwall sample KF4B-5A showing potassic (K-alt) and coarse mica (CM) alteration selvedges and a
mass of magnetite (Mt) crystals. D) ANB veins from footwall sample KF1-13 showing well developed
CM alteration selvedge along its outer margin (outlined with black dotted line). E) B and D veins from
hanging wall sample 1343.9. The B vein in has a well-developed sulfide centerline and is rimed by a
green mica (GM-alt) selvedge. F) Moderately sinuous B vein from sample 1279.9 showing calcite (CC)
intergrown with CL-bright quartz along its margins. G) Hanging wall sample 1078.78 showing an A
vein with potassic alteration selvedge being cross-cut by a B vein with a green mica alteration selvedge.
H) B and D veins from sample 1201.1. ANB=A “non-banded,” AB= A “banded.”

131
Figure 17. Photomicrograph of hanging wall sulfides, oxides, and silicate minerals. A) RL image of
intergrown Sp, Gl, and Py1, which are partly encompassed by CPy1. From sample 1279.79. B) RL image
of intergrown Sp and Gl, which are partly encompassed by CPy1. Sp contains inclusions of Cpy1. From
sample 1279.9. C) RL image of Py2 showing inclusions of CPy1 and Po. From sample 1343.9. D) RL
image of Mo1 partly encompassed by Py2 with CPy1 inclusions. From sample 1200.4. E) RL image of
Py2, with inclusions of CPy1 and Po, intergrown with Mt. The Mt in this image is dark grey and has light
grey rims of Hem (upper right), or has been completely replaced by Hem (lower left). From sample
1193. F) RL image of Py2 intergrown with Ru and partly surrounded by green mica (GM) crystals. From
sample 1279.9. G) TL image of intergrown quartz (Qtz), green mica, and Ru. The green mica is opaque
in parts of this image because of the presence of dense masses of Ru crystals. From sample 1343.9. H)
RL image of CPy2-filled fractures in Py2 crystals. The fracture-filling CPy2 contains abundant inclusions
of Gl. From sample 1279.9. I) RL image of intergrown Mo2 and CPy2 filling a fracture in quartz. From
sample1201.1. J) RL image of CPy2 with rims of Bn adjacent to Hem crystals and enclosed in. From
sample 1086.6. K) RL image of a mass of fine-grained Ru rimed by Hem at extinction. From sample
1078.78. L) Host rock fragments in an A vein from sample 1078.78. For figure abbreviations see Table
4. RL=reflected light, TL=Transmitted light

132
Figure 18. Photomicrographs of individual fluid inclusions from the nine inclusion groups
found in the Kabba hanging wall and footwall. Abbreviations on micrograph labels are as
follows: V=vapor, L=liquid, TDC=translucent daughter crystal, H=halite, T=triangular opaque
daughter crystal, and O=oval opaque daughter crystal. Variation in the brightness and color
between photomicrographs are due to the depth of the imaged inclusions from the surface of
the thick sections that host them, and the level of magnification needed to resolve clear
images. A) B15D inclusion in CL-bright quartz. B) B30 inclusion in CL-bright quartz. C)
B15C inclusion in CL-dark quartz. D) B15 inclusion in CL-bright quartz. E) B30D inclusion
in CL-bright quartz. F) B30H inclusion in CL-bright quartz. G) B75 inclusion in CL-bright
quartz. H) B20C inclusion in CL-dark quartz. I) B75C inclusion in CL-dark quartz.

133
Figure 19. Abundance of fluid inclusion (FI) types in the
hanging wall and footwall. The hanging wall fluid inclusion
abundance pie chart corresponds to the cross-section in the
upper left-hand corner and the footwall fluid inclusion
abundance pie chart corresponds to the cross-section in the
lower right hand corner. The red boxes on each cross-section
denote the approximate areas sampled from the footwall and
hanging wall and the pie charts represent the approximate
abundance of fluid inclusion types in samples from those areas.
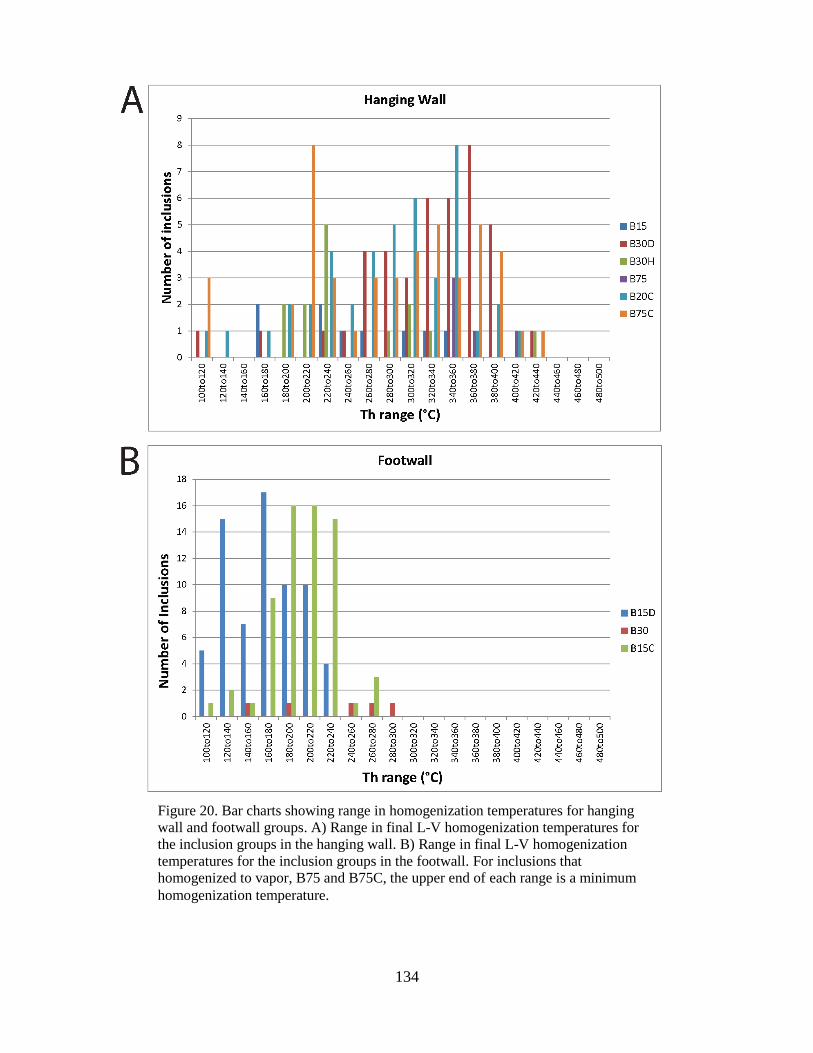
134
134
Figure 20. Bar charts showing range in homogenization temperatures for hanging
wall and footwall groups. A) Range in final L-V homogenization temperatures for
the inclusion groups in the hanging wall. B) Range in final L-V homogenization
temperatures for the inclusion groups in the footwall. For inclusions that
homogenized to vapor, B75 and B75C, the upper end of each range is a minimum
homogenization temperature.

135
Figure 21. Isochors for B15D, B30, and B15C inclusions from the footwall. Isochors for B15D
(G), B30 (H), and B15C (I) inclusions generated using the MacFlincor program (Brown, 1989;
Brown and Hagemann, 1994). MacFlincor calculations for H2O-, NaCl-, and KCl-bearing
inclusions are based on data from Bodnar and Vityk (1994). Calculations for CO2-bearing
inclusions are based on thermodynamic data from Bowers and Helgeson (1983). Pressures in the
footwall (red horizontal lines at 2500 and 3000 bars) were interpreted based on analogous
pressure-depth conditions at the Butte porphyry copper deposit (Rusk et al., 2008). Intersections
of pressure with inclusion isochors identify the upper and lower limits of trapping temperatures
for each inclusion isochor. The equations of state used to generate isochors are only valid above
300°C, thus, isochors terminate at 300°C.

136
Figure 22. Isochors for B15, B30D, B30H, B75, B20C, and B75C inclusions from the hanging
wall. Isochors for B15 (A), B30D (B), B30H (C), B75 (D), B20C (E), and B75C (F) inclusions
were generated using the MacFlincor program (Brown, 1989; Brown and Hagemann, 1994). The
yellow lines on each chart show the upper and lower limits for trapping temperatures along
isochors at lithostatic pressures between 1500-2000 bars. The green lines on each chart show the
upper and lower limits for trapping temperatures along isochors at hydrostatic pressures between
550-750 bars. The equations of state used to generate ischors are only valid above 300°C, thus,
isochors terminate at 300°C.

137
APPENDIX A
HANGING WALL SAMPLES AND ANALYSIS
The following shows the samples collected from the K-10 drill hole and the analysis
preformed on each sample. Sample IDs correspond to the depth in the K-10 drill hole which they
were collected from (1201.1= collected at 1201.1 ft depth in the K-10 drill hole). Y= Yes, N=
No.

138
Hanging wall
SmaplesThick Section SEM-EDS SEM-CL Microthermometry Raman LA-ICP-MS Northing Easting UTM Zone
1005.34 N N N N N N 3890987.708 249594.823 12
1011.65 N N N N N N 3890987.708 249594.823 12
1012.30 N N N N N N 3890987.708 249594.823 12
1013.00 N N N N N N 3890987.708 249594.823 12
1023.10 N N N N N N 3890987.708 249594.823 12
1023.81 N N N N N N 3890987.708 249594.823 12
1030.08 N N N N N N 3890987.708 249594.823 12
1034.30 N N N N N N 3890987.708 249594.823 12
1036.10 N N N N N N 3890987.708 249594.823 12
1038.30 N N N N N N 3890987.708 249594.823 12
1042.90 N N N N N N 3890987.708 249594.823 12
1050.10 N N N N N N 3890987.708 249594.823 12
1050.15 N N N N N N 3890987.708 249594.823 12
1055.50 N N N N N N 3890987.708 249594.823 12
1058.90 N N N N N N 3890987.708 249594.823 12
1063.80 N N N N N N 3890987.708 249594.823 12
1073.70 N N N N N N 3890987.708 249594.823 12
1078.75 Y Y Y N N N 3890987.708 249594.823 12
1081.10 N N N N N N 3890987.708 249594.823 12
1086.20 N N N N N N 3890987.708 249594.823 12
1086.60 Y Y Y Y Y Y 3890987.708 249594.823 12
1095.40 Y N N N N N 3890987.708 249594.823 12
1097.40 N N N N N N 3890987.708 249594.823 12
1098.90 N N N N N N 3890987.708 249594.823 12
1107.10 N N N N N N 3890987.708 249594.823 12
1108.20 N N N N N N 3890987.708 249594.823 12
1109.60 N N N N N N 3890987.708 249594.823 12
1117.00 N N N N N N 3890987.708 249594.823 12
1121.20 N N N N N N 3890987.708 249594.823 12
1123.90 Y N N N N N 3890987.708 249594.823 12
1125.60 N N N N N N 3890987.708 249594.823 12
1132.30 N N N N N N 3890987.708 249594.823 12
1148.80 Y N Y N N N 3890987.708 249594.823 12
1152.10 N N N N N N 3890987.708 249594.823 12
1176.80 N N N N N N 3890987.708 249594.823 12
1181.00 N N N N N N 3890987.708 249594.823 12
1181.50 N N N N N N 3890987.708 249594.823 12
1181.60 N N N N N N 3890987.708 249594.823 12
1185.50 N N N N N N 3890987.708 249594.823 12
1189.00 N N N N N N 3890987.708 249594.823 12
1189.60 N N N N N N 3890987.708 249594.823 12
1193.00 Y N Y Y Y Y 3890987.708 249594.823 12
1196.10 N N N N N N 3890987.708 249594.823 12
1200.40 Y N Y N N N 3890987.708 249594.823 12
1201.10 Y Y Y Y Y Y 3890987.708 249594.823 12
1201.20 N N N N N N 3890987.708 249594.823 12
1205.80 N N N N N N 3890987.708 249594.823 12
1206.80 Y N N N N N 3890987.708 249594.823 12
1219.10 N N N N N N 3890987.708 249594.823 12
1227.40 N N N N N N 3890987.708 249594.823 12
1228.10 N N N N N N 3890987.708 249594.823 12
1234.10 Y N N N N N 3890987.708 249594.823 12
1237.60 N N N N N N 3890987.708 249594.823 12
1274.90 N N N N N N 3890987.708 249594.823 12
1277.30 N N N N N N 3890987.708 249594.823 12
1279.90 Y Y Y N N N 3890987.708 249594.823 12
1286.00 N N N N N N 3890987.708 249594.823 12
1297.00 N N N N N N 3890987.708 249594.823 12
1298.10 N N N N N N 3890987.708 249594.823 12
1314.20 N N N N N N 3890987.708 249594.823 12
1322.50 N N N N N N 3890987.708 249594.823 12
1327.70 N N N N N N 3890987.708 249594.823 12
1329.50 Y N N N N N 3890987.708 249594.823 12
1331.50 Y N N N N N 3890987.708 249594.823 12
1340.20 Y Y Y N N N 3890987.708 249594.823 12
1343.90 Y Y Y Y Y Y 3890987.708 249594.823 12

139
APPENDIX B
FOOTWALL SAMPLES AND ANALYSIS
The following shows the samples collected from the Kabba footwall and the analysis
preformed on each sample. Sample IDs correspond to the locations marked in Figure 12 B-E
(KF3D-1=sample #1 from location KF3D). Y=Yes, N=No.

140
Footwall
SamplesThick Section SEM-EDS SEM-CL Microthermometry Raman LA-ICP-MS Northing Easting UTM Zone
KF4F-1 N N N N N N 3889210.599 243844.815 12
KF4F-2 Y N Y N N N 3889210.599 243844.815 12
KF4G-1 N N N N N N 3889210.599 243844.815 12
KF5A-1 N N N N N N 3887984.709 241784.827 12
KF5B-1 N N N N N N 3887984.709 241784.827 12
KF5C-1 Y N Y N N N 3887984.709 241784.827 12
KF5C-2 N N N N N N 3887984.709 241784.827 12
KF5C-3 N N N N N N 3887984.709 241784.827 12
KF5D-1 N N N N N N 3887984.709 241784.827 12
KF5E-1 N N N N N N 3887984.709 241784.827 12
KF5E-2 Y N N N N N 3887984.709 241784.827 12
KF5F-1 N N N N N N 3887984.709 241784.827 12
KF5F-2 N N N N N N 3887984.709 241784.827 12
KF5F-3 N N N N N N 3887984.709 241784.827 12
KF5F-4 N N N N N N 3887984.709 241784.827 12
KF5G-1 N N N N N N 3887984.709 241784.827 12
KF5G-2 N N N N N N 3887984.709 241784.827 12
KF5H-1 N N N N N N 3887984.709 241784.827 12
KF5I-1 Y N N N N N 3888328.624 242396.492 12
KF5J-1 N N N N N N 3888328.624 242396.492 12
KF5J N N N N N N 3888328.624 242396.492 12
KF5K N N N N N N 3888328.624 242396.492 12
KF5L N N N N N N 3891157.378 242582.800 12
KF6A N N N N N N 3891157.378 242582.800 12
KF6B N N N N N N 3891974.222 243508.156 12
KF6C-1 N N N N N N 3889015.063 247283.645 12
KF6C-2 N N N N N N 3889015.063 247283.645 12
KF6C-3 N N N N N N 3889015.063 247283.645 12
KF6C-4 Y N N N N N 3889015.063 247283.645 12

141
APPENDIX C
HANGING WALL HAND SAMPLE DESCRIPTIONS
General descriptions of drill core samples from drill hole K-10 from the Kabba hanging
wall. All core samples from drill hole K-10 contain igneous host rocks and quartz +/- sulfide
veins. Short descriptions of K-10 core samples were produced prior to thick section preparation
in order to document ore and alteration mineralogy, textures, or crosscutting relationships related
to the Kabba hydrothermal system prior to petrographic examination with transmitted and
reflected light.

142
Sample ID Description
1078.78 Host Rock:
70% subhedral pink potassium feldspar, 20% clear anhedral quartz, 10% black
subhedral biotite. Individual potassium feldspar crystals have very clear exsolution
lamellae. Individual quartz crystals have a weak alignment with one another.
Masses of biotite crystals also show an alignment and yellow specs of leucoxene
and green chlorite appears to form around the margins of the biotite masses.
Veins:
A variety of veins cut the host rock in this sample. Most veins in this sample
are >1cm wide (1mm wide) and dominated by sulfides, mostly pyrite, and minor
quartz. Veins have two dominant orientations that are roughly at a 60-120 angle
to one another. The largest vein is composed of quartz and has a sulfide-filled
(possibly pyrite and sphalerite) centerline, and an alteration selvedge composed of
green mica.
1086.6 Host rock:
10-15%subhedral potassium feldspar; 40-45% sudhedral plagioclase; 20-30%
subhdral-anhedral quartz; 2-5% subhedral-euhedral biotite. Much of the feldspar
in this sample is altering from a white or pink color to tan-green color. This
alteration increases in intensity with proximity to the quartz vein.
Vein:
Sinuous quartz veins with 2-5% disseminated soft, grey, euhedral sulfide
metallic, crystals (Molybdenum or Galena?) and 2-5% euhedral pyrite.
1095.4 Host rock:
Tan brown porphyry with 20%subhedral-anhedral, tan-white plagioclase;
2%sub-anhedral black bitotite; and 2-5% anhedral, clear quartz phenocrysts; with
a brown-gray, very fine grained, quartz and feldspar rich groundmass.
Veins:
A large mass of quartz and multiple clear quartz veins. The veins are all
parallel to one another, are mostly clear quartz. The largest vein in this sample has
sinuous margins and a vugy centerline that contains a soft, pink, powdery mineral.
The large quartz mass has a half football shape and is composed of alternating
zones of clear quartz and plagioclase rich porphyry. The margins of the mass have
an odd, coliform-like texture.
1123.9 Host Rock:
Very altered tan-brown to dark brown porphyry with 20% subhedral-euhedral,
tan-white to tan-pink plagioclase; 2%euhedral yellow-brown tabular amphiboles;
2% subhedral-anhedral black bitotite; and 2-5% anhedral quartz phenocrysts; with
a dark green-brown, very fine grained, quartz-feldspar-phylosilicate rich

143
groundmass.
Veins and Alteration:
Several 1-5mm quartz veins cut this sample and are parallel to one another. The
largest vein (5 mm wide) is composed of clear quartz and has a pyrite filled
centerline. All of the veins have selvedges of tan-green, soft, micas around their
vein margins. This alteration is most intense closest to the outer margin to the
veins and is characterized by abundant tan-green, soft, micas replacing parts of the
host rock’s ground mass and the phenocrysts.
1148.8 Host Rock:
Pyrite rich porphyry with 30% subhedral, light greenish brown, plagioclase
phenocrysts; and 5%anhedral, brown quartz phenocrysts; in a fine-grained,
plagioclase and quartz rich ground mass. The porphyry host also rock contains
~5% disseminated, oxidized, fine grained pyrite.
Veins and Alteration:
Multiple sinuous quartz veins with moderated amounts of anhedral-euhedral
grey and yellow sulfide crystals cut this sample. The veins all have alteration
selvedges which are characterized by host rock plagioclase phenocrysts altering to
soft, green-brown, powdery minerals.
1193 Host Rock:
Greenish-white phaneritic granodiorite with 40-50% greenish-white, subhedral
plagioclase; 30%gray, anhedral quartz; 5-10% black, euhedral amphibole; and 5-
10% black, euhedral biotite.
Veins and Alteration:
This sample contains a single ~10mm wide quartz + sulfide vein. Sulfides
hosted in the quartz vein occur at the vein margins and do not form a centerline.
This vein also has an alteration selvedge composed of green mica which extends ~
5mm from the vein’s outer margins. Closest to the veins margin the igneous
textures of the host rock are absent and most of the host rock plagioclase has been
replaced by green mica.
1201.1 Host Rock:
Greenish-white phaneritic granodiorite with 40-50% greenish-white, subhedral,
coarse grained plagioclase; 30% gray, anhedral, coarse grained quartz; 5-10%
black, euhedral, amphibole; and 5-10% black, euhedral biotite. The host rock also
contains minor amounts of very fine disseminated pyrite and fine-grained
accumulations of bright yellow-green, soft, powdery mineral.
Veins and Alteration:
Multiple quartz veins which range in size between 2-9 mm wide cut this
sample. Most are only 1-2 mm across and are easily identified by the pink
alteration seledvege around their margins and the very fine, darkly colored sulfides

144
along their inner and outer margins. The largest quartz vein is 9 mm wide, has a
pink alteration selvedge which extend ~1cm from the vein margin, contains
euhedral-anhedral pyrite, and minor amounts of a soft grey metallic mineral
(molybdenite / galena?) which forms euhedral crystals that range in size between
1-2mm.
The typical width of the pink alteration selvedges around the veins in this
sample is between 0.5-1cm and is interpreted to be potassic alteration. Potassic
alteration appears to be attacking the margins of most plagioclase phenocrysts in
this sample, and proximal to veins (0.1-1cm) potassic alteration becomes much
more pervasive, forming a distinct pink selvedge where plagiocalse phenocrysts
appear almost completely replaced by potassium-feldspar.
1206.8 Host Rock:
Greenish-white phaneritic granodiorite with 40-50% greenish-white, subhedral,
coarse grained plagioclase; 30% gray, anhedral, coarse grained quartz ; 5-10%
black, euhedral amphibole; and 5-10% black, euhedral, medium grained biotite.
Most of this sample is dominated by phenocryst and has very little fine grained
ground mass. This sample also contains minor amounts of very fine disseminated
pyrite.
Veins and Alteration:
Multiple quartz veins, which range in size from 0.5-2 cm wide, cut this sample.
All of the veins are parallel to on another, have sinuous margins, and hosts minor
amounts of euhedral-anhedral pyrite and a soft grey metallic mineral. The veins in
this sample have pink alteration selvedges which range in thickness between 2-
8mm. This alteration is interpreted to be potassic alteration and is characterized by
host rock plagioclase phenocrysts alteration to potassium feldspar.
1200.4 Host Rock:
Greenish-white phaneritic granodiorite with 40-50% greenish-white, subhedral,
coarse grained plagioclase; 30% gray, anhedral, coarse grained quartz ; 5-10%,
black, euhedral, amphibole; and 5-10%black, euhedral, medium grained biotite.
Disseminate pyrite is very spars in this sample
Veins and Alteration:
Multiple quartz veins, which range in thickness between .5-1 cm, cut this
sample. All of the veins have roughly about the same orientation to one another
and have straight edges. The biggest vein (~1cm wide) hosts large masses (>0.7cm
wide) of euhedral-anhedral pyrite and a soft grey metallic mineral
(molybdenum/galena?). These masses occur on the inner margins of the quartz
vein at the vein-host rock interface.
The veins in this sample have tan-pink alteration selvedges which range in
thickness between 2-8mm. This alteration is characterized by host rock plagioclase
phenocrysts alteration to potassium feldspar or a soft, tan mineral.
1279.9 Host Rocks:

145
Intensely altered dark green-gray phaneritic granodirote/quartz monzonite with
~20% green-black, anhedral-subhedral, coarse grained biotites; ~50% green-gray,
subhedral, coarse grained plagioclase; ~5% green-black, anhedral-subhedral,
amphiboles; and ~20% gray-green, coarse grained, anhedral quartz. Very fine
disseminated pyrite occurs throughout and increases in abundance closer to the
quartz vein that cross-cuts this sample.
Veins and Alteration:
A single quartz vein, which is ~1 cm wide, cuts this sample and hosts
accumulations of white, amorphous carbonate, coarse euhedral pyrite, coarse
subhedral-euhedral chalcopyrite, and minor amounts of very fine-grained
molybdenum. Carbonate only occurs along the inner margins of the quartz veins
but the sulfides occur on both sides of the vein-host rock interface. Sulfide
abundances are highest right at the vein host-rock interface.
Green mica and soft brown-tan alteration minerals pervade this sample and
form a selvedge around the margins of the vein. This alteration is most intense
proximal to the veins margins and where it is most well developed the original
textures of the igneous host is obscured.
1343.9 Host rock:
Altered dark green-gray phaneritic granodirote/quartz monzonite with ~30%
green-black, anhedral-subhedral, coarse grained biotites; ~40-50% green-gray,
subhedral, coarse grained plagioclase; ~5% green-black, anhedral-subhedral,
amphiboles; and ~20% gray-green, coarse grained, anhedral quartz. Very fine,
disseminated pyrite throughout.
Veins and Alteration:
Multiple veins cut this sample and range in size from 5-10 mm. The biggest
vein (~1cm wide) has a center line filled with block anhedral-euhedral pyrite, and
minor amounts of very fine-grained carbonate. Alteration in this sample is
characterized by plagioclase phenocrysts and groundmass being replaced by green
micas. The intensity of this alteration increases abruptly proximally to quartz veins
and tends to form a distinct, green, selvedge that extends <1cm out from the vein-
host rock interface and obscures the igneous textures of the host.
1234.1 Host rock:
Intensely altered porphyry with 50% tan-white, coarse grained, anhedral
plagioclase; and 20-25% gray, anhedral quartz phenocrysts; and a quartz and
plagioclase-rich, fine-grained groundmass. The host rock’s original texture and
mineralogy has been destroyed by alteration and much of the plagioclase in this
rock has been replaced by tan clay minerals (koalinite, sericite, illite, and swelling
clays/).
Veins and Alteration:
A single banded quartz vein cuts this sample. The outer most band is 1.2 cm
think, is composed of quartz, and has minor amounts of very fine grained pyrite

146
and a very fine-grained gray, soft, metallic mineral (molybdenite/galena ?) on its
upper and lower inner margins. The inner band is ~4 cm wide and composed
mostly of quartz with abundant white carbonate along its inner margins. The inner
band also has a distinct center line composed of multiple anhedral-euhedral, coarse
grained sulfides.
1329.5 Host Rock:
Altered dark green-gray phaneritic granodirote/quartz monzonite with ~30%
green-black, anhedral-subhedral, biotites; ~40-50% green-gray, subhedral,
plagioclase; ~5% green-black, anhedral-subhedral, amphiboles; and ~20% gray-
green, anhedral quartz. Very fine-medium grained, pyrite disseminated
throughout.
Veins and Alteration:
The vein in this sample as composed of granular quartz and multiple euhedral-
anhedral , fine-coarse grained sulfides (~5-10%). The outer boundary of this veins
is sinuous, and appears to be “eating away” the host rock. Minor amounts of
alteration are associated with the vein and are characterized by plagioclase
phenocrysts in the host rock altering to fine clay-like minerals.
1331.5 Host Rock:
Altered dark green-gray phaneritic granodirote/quartz monzonite with ~30%
green-black, anhedral-subhedral, biotites; ~40-50% green-gray, subhedral,
plagioclase; ~5%green-black, anhedral-subhedral, amphiboles; and ~20% gray-
green, coarse grained, anhedral quartz. Host rock also contains ~2-3%
disseminated pyrite throughout.
Veins and Alteration:
A single ~1.5cm wide quartz vein with poorly defined sinuous boundaries cuts
this sample. This vein hosts multiple euhedral-anhedral , fine-coarse grained
yellow and grey sulfides (Pyrite ~4% > molybdenum/galena? ~3-2%) and minor
amounts of bright white carbonate. Sulfides mostly occur within the vein but do
also occur disseminated in the host rock. In addition, multiple veinlets can be seen
cross-cutting one another in this sample and are identified by the presence of
coarse sulfides and the faint green alteration halo that surrounds them.
Alteration in this sample does not form a selvedge and is characterized by host
rock plagioclase altering to a soft, clay-like mineral.
1340.2 Host Rock:
Altered dark green-gray phaneritic granodirote/quartz monzonite with ~30%
green-black, anhedral-subhedral, coarse grained biotites; ~40-50% green-gray,
subhedral, plagioclase; ~0-2% green-black, anhedral-subhedral, amphiboles; and
~20% gray-green, anhedral quartz. The host rock also includes ~2-3% pyrite
disseminated throughout.
Veins and Alteration:

147
A ~5cm wide vein cuts this sample and is composed quartz and ~1-2%
euhedral-anhedral pyrite and a soft, gray, metallic mineral (molybdenum/galena?)
which occurs along its inner margins. Small (<2mm wide) veinlets also occur
throughout this sample, and can contain a variety of minerals including sulfides
and a very fine grained, soft, powdery mineral. Around the veins margins there is
a 2-4mm wide alteration selvedge composed of green mica. This alteration
selvedge is most well developed proximal to the vein and obscures the original
texture of the host rock. A bright yellow-green, soft, fine grained mineral
(jerosite?) also occurs within the mica selvedge and appears to form a irregular
halo in the host rock surrounding the vein. This mineral also fills a ~1mm wide
veinlet that comes off the large quartz vein.
148
APPENDIX D
FOOTWALL HAND SAMPLE DESCRIPTIONS
General descriptions of drill core samples from surface outcrops in the Kabba footwall.
All surface samples from the footwall contain igneous host rocks and quartz +/- sulfide veins.
Short descriptions of surface sample from the footwall that follow were produced prior to
petrographic examination with transmitted and reflected light in order to document ore and
alteration mineralogy, textures, or crosscutting relationships related to the Kabba hydrothermal
system prior.

149
Sample # Description
KF1-11 Sample from a fresh looking pile near a prospect pit. In area with abundant
veining, neoticite, and chrisicola coming out of water seeps.
Host Rock:
~45% white to greenish white, euhedral to subhedral, <15 mm wide
plagioclase phenocrysts; ~45% clear, subhedral to anhedral, <6 mm wide quartz
phenocrysts; ~8%, black to greenish black, subhedral, <2 mm phyllosilicate
phenocrysts. Many of the plagioclase pheonocrysts are turning green and have a
powdery look to them. Near the two largest veins in the sample the plagioclase
crystals are turning pink and possibly altering to potassium feldspar.
The host rock seems to have small amounts (1-2%) of magnetite and coarse tan
phyllosilicates disseminated throughout, especially between grain boundaries.
These minerals are most abundant where small, subtly apparent veins cut through
the sample, and are not present where the plagioclase are altered to potassium
feldspar.
Veins and Alteration:
This sample contains 2 quartz veins with significant amounts (~ 5% of the
entire vein) of molybdenum. The older of the two veins is in the bottom corner of
the sample, composed mostly of quartz, has a sinuous and poorly defined outer
boundary, and is cross-cut by the younger quartz. The older vein also has
molybdenum along its outer margins and has a pink alteration selvedge which
host rock plagioclase are altering to potassium feldspar. The younger vein cuts
across the front of this sample and is composed mostly of quartz with minor
molybdenite, has sinuous boundaries outer boundaries, and crosscuts the older
vein. Like the older vein, the younger vein has molybdenum along the inside of
its outer boundary and a bright pink alteration selvedge.
This sample has at least two veins which contain quartz, magnetite, and coarse
mica. Though they occur at a similar angle to the quartz + molybdenite veins
they are not as visually apparent and are defined by dark accumulations of coarse
tan phyllosilicates (muscovite) +/- magnetite that occur along/within a vein of
quartz. Most of the magnetite that is associated with these veins occurs in the host
rock near the veins so the veins themselves are only weakly magnetic. These
magnetite-bearing veins do not have well developed halos but host masses of
coarse mica similar to the coarse phyllosilicates that occur along crystal
boundaries between phenocrysts in the host rock. The phyllosilicate masses in the
host rock seem to be most abundant adjacent to veins of either type.
KF2-6 Sample from prospect pit up the wash from the KF1-11
Host Rock:
The original textures of this rock have been completely obliterated by
alteration and the rock is now composed mostly of fine to coarse, anhedral quartz
crystals (~60-70%), fine grained, subhedral to anhedral, red-brown to gray-green,
weathered phyllosilicates (~20-30% ), and minor amounts of disseminated

150
sulfides and oxides (mostly pyrite and magnetite). In spots primary plagioclase
can be seen altering from white to a red-brown color and turning into a powdery
mineral. On cut surfaces one can see that some of the quartz in the host rock was
once anhedral phenocrysts. The abundance of this secondary quartz increases
sharply close to the outer margin of the veins which cut the host rock.
Veins and Alteration:
The largest in the sample has sinuous boundaries, is ~4cm wide and is
composed mostly of white, granular looking quartz with small masses of dark
fine grained magnetite and euhedral pyrite disseminated throughout. This vein
also contains trace amounts of a soft grey mineral that is commonly associated
with coarse phyllosilicates. Around the veins margins, fine to medium grained
phyllosilicates are very abundant and the amount of disseminated pyrite in the
host rock increases with proximity to the vein.
Other veins in this sample are typically composed of ~50% anhedral quartz,
~25% euhedral to subhedral pyrite, and ~25% anhedral magnetite. Where quartz
dominates in these samples pyrite and magnetite are almost absent, and vice
versa. Where the sulfides and oxides dominate, magnetite lines the outside of the
vein and pyrite forms a blocky centerline.
All the veins in this sample typically have an alteration selvedge which is
characterized by coarse phyllosilicates replacing host rock phenocrysts and
groundmass. This selvedge commonly obscures the host rock textures and the
host fine grained disseminated pyrite.
KF3A-6 Sample from the standard mine
Host Rock:
The original texture of this host rock has been completely obliterated by
alteration, especially with in 2cm of the vein’s outer margin where the alteration
selvedge is most intense. Where some original textures are still visible, the host
rock is composed of ~50-70% anhedral, fine to coarse grained feldspars that are
turning green or pink, and ~20-30% anhedral, coarse grained quartz crystals. The
remaining 10-20% of the rock is composed of disseminated coarse, gray
phyllosilicates (muscovite), the amount of which increases with proximity to the
alteration selvedge.
Veins and Alteration:
This sample contains two white, parallel quartz veins that have sinuous, poorly
defined boundaries. Both of these veins are associated with a 2cm wide, well
developed green-brown alteration selvedge that destroys the original rock texture.
These alteration selvedges are composed mostly of coarse, euhedral, grey-brown
phyllosilicates (muscovite); gray, anhedral, quartz; and fine grained, disseminated
masses of dark brown-black, magnetic magnetite;, and the intensity of the
alteration increases with proximity to their associated veins.
KF3A-5 Sample of Standard Mine host rock from nearby the northern shaft.

151
Host Rock:
The host rock is composed of anhedral, bright pink potassium feldspar
(~80%), and anhedral quartz (~15%)phenocrysts in a fine-grained feldspathic
ground mass.
Veins and Alteration:
This sample is cut by multiple generations of quartz veins. Most of the veins
are composed entirely of quartz, have sinuous, poorly defined boundaries, and
clearly crosscut a second generation of thin quartz + mica veins. The quartz +
mica veins are dominated by soft, gray, coarse, mica (muscovite), and are
generally thin (<3mm) with sinuous boundaries.
Alteration is most well developed around the quartz + mica veins and is
characterized by a yellow-brown alteration selvedge that extends <3mm from the
outer boundary of the quartz + mica veins. These selvedges are composed mostly
of brown to yellow brown, fuzzy looking muscovite.
KF3D-19 Sample from the south mine shaft of the Standard Mine
Host Rock:
This rock is composed of ~50%, white to greenish-white, subhedral to
euhedral, <5mm plagioclase phenocrysts; ~40%, gray, anhedral to euhedral,
<6mm quartz crystals; and ~10% black to greenish black subhedral to euhedral
biotites. There are also minor amounts of subhedral to anhedral pyrite and
magnetite disseminated throughout the host rock and the abundance of these
minerals increases with proximity to the vein.
Veins and Alteration:
Half of this sample contains a large quartz vein with a sinuous, poorly defined
boundary. The vein contains abundant bands or elongate masses of fine-grained,
anhedral, black to reddish black, magnetite; and blocky, coarse grained pyrite.
These bands of magnetite and pyrite are parallel to the veins outer boundary. No
well-defined selvedge exists around the vein . However, many of the plagioclase
phenocrysts in the sample are altering to a soft powdery mineral.
KF4B-6 Host rock from pile next to prospect pit.
Host Rock:
The host rock is composed of ~ 40-45% anhedral, white to white-gray, quartz
phenocrysts; ~40-45%, subhedral to anhedral white to greenish white, plagioclase
phenocrysts; ~5-10%, euhedral to subhedral, black to greenish black, soft, mica
(biotite?) phenocrysts; ~2-3%, euhedral to subhedral, disseminated pyrite. Many
of the plagioclase phenocrysts in this sample are green around their margins, and
the greener phenocrysts tend to be softer. Host rock textures ~1-2cm from the
veins have been completely obliterated by alteration.
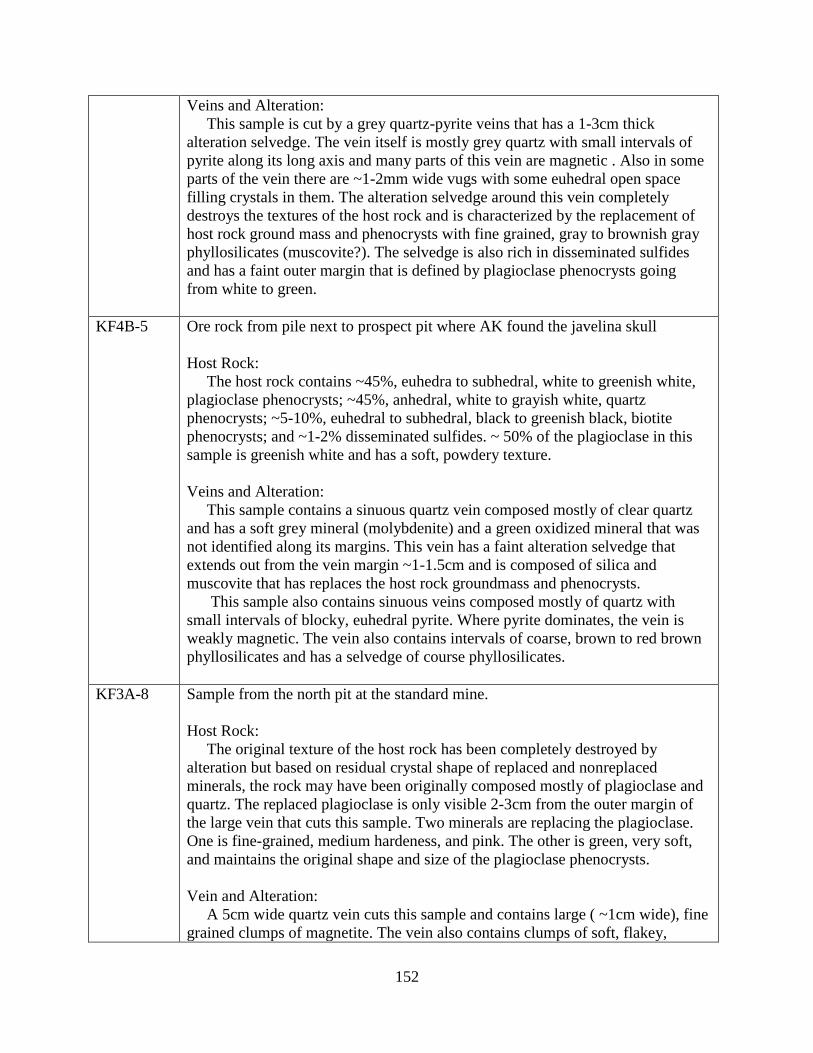
152
Veins and Alteration:
This sample is cut by a grey quartz-pyrite veins that has a 1-3cm thick
alteration selvedge. The vein itself is mostly grey quartz with small intervals of
pyrite along its long axis and many parts of this vein are magnetic . Also in some
parts of the vein there are ~1-2mm wide vugs with some euhedral open space
filling crystals in them. The alteration selvedge around this vein completely
destroys the textures of the host rock and is characterized by the replacement of
host rock ground mass and phenocrysts with fine grained, gray to brownish gray
phyllosilicates (muscovite?). The selvedge is also rich in disseminated sulfides
and has a faint outer margin that is defined by plagioclase phenocrysts going
from white to green.
KF4B-5 Ore rock from pile next to prospect pit where AK found the javelina skull
Host Rock:
The host rock contains ~45%, euhedra to subhedral, white to greenish white,
plagioclase phenocrysts; ~45%, anhedral, white to grayish white, quartz
phenocrysts; ~5-10%, euhedral to subhedral, black to greenish black, biotite
phenocrysts; and ~1-2% disseminated sulfides. ~ 50% of the plagioclase in this
sample is greenish white and has a soft, powdery texture.
Veins and Alteration:
This sample contains a sinuous quartz vein composed mostly of clear quartz
and has a soft grey mineral (molybdenite) and a green oxidized mineral that was
not identified along its margins. This vein has a faint alteration selvedge that
extends out from the vein margin ~1-1.5cm and is composed of silica and
muscovite that has replaces the host rock groundmass and phenocrysts.
This sample also contains sinuous veins composed mostly of quartz with
small intervals of blocky, euhedral pyrite. Where pyrite dominates, the vein is
weakly magnetic. The vein also contains intervals of coarse, brown to red brown
phyllosilicates and has a selvedge of course phyllosilicates.
KF3A-8 Sample from the north pit at the standard mine.
Host Rock:
The original texture of the host rock has been completely destroyed by
alteration but based on residual crystal shape of replaced and nonreplaced
minerals, the rock may have been originally composed mostly of plagioclase and
quartz. The replaced plagioclase is only visible 2-3cm from the outer margin of
the large vein that cuts this sample. Two minerals are replacing the plagioclase.
One is fine-grained, medium hardeness, and pink. The other is green, very soft,
and maintains the original shape and size of the plagioclase phenocrysts.
Vein and Alteration:
A 5cm wide quartz vein cuts this sample and contains large ( ~1cm wide), fine
grained clumps of magnetite. The vein also contains clumps of soft, flakey,

153
phyllosilicates. Along the top of the vein, immediately outside the vein’s margin
there is a band of very coarse, flakey phyllosilicates. Outside of this band, on
both sides of the vein there is a 2-3cm think, green gray selvedge of silica and
green phyllosilicates that have totally replaced the host rock. This selvedge also
contains black, fine-grained accumulations of magnetite and some reddish,
nonmagnetic clumps fe-oxide (hematite?). Further out from the vein the green
gray halo fades into the zone of green and pink, altered plagioclase.
KF2-4 Massive, Vugy quartz vein from quarry west of the traverse parking lot
No host rock is present in this sample.
Vein and Alteration:
This sample is from a ~1-2 m wide quartz vein and is much like the samples
KF4F-2, KF4D-2, and KF4E-2. Other than fine-grained quartz, this sample is
contains ~5-10% sulfides (molybdenum>pyrite>>chalcopyrite?), ~1-2% hematite
and magnetite, and ~ 1-2% coarse grained mica. The accumulations of sulfides
commonly line vugs in the quartz but can also occur within the quartz. On non-
cut surfaces, HCl turns the staining on the outside of the rock bright yellow.
KF4F-2 Massive quartz vein from quarry west of KF4B
No host rock is present in this sample.
Vein:
This sample is from a ~1-1.5 m wide quartz vein and is much like the samples
KF2-4, KF4D-2/1, and KF4E-1. Other than fine-grained quartz, this sample
contains ~10-15% blocky, euhedral pyrite. This pyrite occurs in masses of
euhedral-anhedral crystals that have a random orientation or are sometimes
elongate, and can be 2-3cm wide.
Also, throughout the sample there are faint metallic gray “wisps” that are
particularly abundant proximal to the accumulations of pyrite. This metallic gray
mineral might be molybdenite.
The vein quartz also has abundant small (<5mm) vugs that are commonly
filled with euhedral pyrite and quartz. These vugs occur in the quartz and along
the outer boundary of some of the pyrite crystals.
KF4E-1 Massive quartz with sulfides vein from a molybdenite prospect pit west of KF4D
No host rock is present in this sample.
Vein:
This vein sample was collected from a molybdenite prospect pit that exposes a
1-2.5 m wide, vertical quartz vein that occurs between two different igneous rock
types. This vein is very similar to the veins that samples KF2-4, KF4D-2/1, and
KF4F-1 came from and is composed mostly of fine grained quartz (~75-80%)
with ~10% coarse, euhedral-subhedral pyrite, and ~3-5% of a metallic blue-gray,

154
wispy mineral that may be molybdenite. The pyrites and the blue-gray wisps
occur together in clearly defined trails that are parallel to the outer boundary of
the vein itself.
Like sample KF4F-1, this sample has small (<5mm) vugs throughout that can
host open space filling crystals. These vugs occur in quartz or along the outer
boundary of the individual pyrite crystals. Some of the vugs that are associated
with the pyrites may not be primary and were created by weathering.
KF4D-2 Massive quartz with sulfide vein from unmapped prospect pit east of KF4E and
KF4C.
No host rock is present in this sample.
Veins:
This vein was collected from a prospect pit that was not mapped by Vuich
1975. The pit hosted many, 5-6cm wide, closely spaced veins which had a texture
and orientation similar to the veins samples in KF2-4, KF4E-1, and KF4F-1.
However, the veins also had elongate vugs that were lined with open space filling
quartz crystals which were coated with a red-brown, powdery mineral, or rarely a
bright yellow powder that appeared to host small (<1mm) pyrite crystals. Many
of the individual veins also had 5-6cm wide, coarse to fine grained, brown gray,
mica salvages around them.
The veins in the pit are composed of ~95-99%, fine grained quartz with 1-2%
subhedral to anhedral pyrite, and 1-3% powder coated vugs. The pyrites do not
seem to have any preferred orientation accept for the fact that they mostly occur
in the solid quartz rather than in vugs. The vugs are commonly elongate, 2-6mm
wide, are stacked parallel to one another, and are coated with open space filling
crystals and a red-brown or bright yellow, powdery material. These vugs do not
host any noticeable accumulations of sulfides, but the yellow powder mineral
may have some small sulfide crystals.
KF3C-16 Standard mine ore sample: massive quartz with wispy molybdenite .
No host rock is present in this sample.
Vein and Alteration:
This sample was taken from a rock dump by the water tanks at the standard
mine. The pile contained abundant rocks with molybdenite and copper oxides so
it was interpreted to be an ore pile. The vein in this sample is composed mostly of
fine-grained quartz (~95%), with scattered masses of coarse euhdral quartz
crystals surrounded my fine grained, granular quartz. Throughout the sample
there are small wispy masses, of a metallic blue-gray mineral that may be
molybdenite (~2-5%). Also, small bits of a dark red-brown, magnetic, fine-
grained mineral appear throughout the sample. Along fractures in the quartz, and
on the un-cut surface of the sample there is a lot of red-orange oxidation. This

155
gives the sample an orange appearance.
Two parallel, uncut surfaces of the sample are coated by brown-gray to silvery
gray, flaky mica crystals. These surfaces are interpreted to be the top and bottom
outer margins of the vein and suggest that the vein had a micaceous vein
selvedge.
KF1-13 Quartz vein sample from outcrops east of the KF2 pit.
Host Rock:
The host rock is composed of ~75% white to greenish-pink, subhedral to
anhedral plagioclase, ~20-25% anherdal to subhedral quartz, and 1-5% coarse,
greenish-gray, flaky muscovite. Much of the original texture of the host rock is
obscured by alteration which increases with proximity to the vein margins.
Veins and Alteration:
Two parallel, sinuous veins cut this sample and are composed entirely of fine-
grained quartz and they have very distinct coarse green-gray, flaky phillosilicate
alteration selvedge that completely destroy the original texture of the host rock.
Compared to other samples (such as KF3A-6 and KF3A-8) the phillosilicate
alteration halos here are much more discrete and extend out from the vein ~0.5X
the width of the vein itself.
KF1-12 Multiple quartz veins with pyrite, molybdenite, and magnetite
Host Rock:
The host rock is composed ~70%, white to greenish-white to pinkish-orange,
coarse subhedral to euhedral plagioclase feldspar, ~25% gray-clear, subhedral to
anhedral quartz, and ~2-5% coarse grained mica. Much of the host rock’s original
texture is intact but becomes more obscured by alteration with proximity to the
veins.
Veins and Alteration:
Two thin (<3mm) quartz veins cut this sample parallel to one another. These
veins are composed entirely of quartz, do not have clearly defined alteration
halos, and have sinuous boundaries. These veins are cut by sinuous veins which
are composed of ~95-85% fine-grained quartz, ~5% fine-grained, molybdenite,
and ~2-5% fine-grained, magnetite. The molybdenum and magnetite in these
crosscutting veins occur along the inside of the margins of this vein and are
parallel to the vein boundary.
The sample also contains veins which are composed of ~75% coarse, anhedral
sulfides and ~25% anhedral quartz. The relationship between these sulfide-
dominated veins and the quartz-dominated veins is not clear.
All vein-types in this sample seem to be associated with green-gray
phyllosilicate-rich alteration selvedges that extends out from the vein margin
~0.5-1X the width of their associated vein. The host-rock feldspars in the
phyllosilicte-rich selvedge appear to be alternating to a pinkish-green soft mineral

156
and in between the feldspar grains there is abundant, coarse, flaky phyllosilicates.
KF1-3 A veins with potassic and mica alteration halos.
Host Rock:
The host rock is composed of ~75% pinkish-white subhedral feldspar, ~25-
23% gray, anhedral to subhedral quartz, and ~1-2% medium grained, flaky
phyllosilicates. A lot of the plagioclase feldspars in the host rock are pink around
their margins and might be altering to potassium feldspar.
Veins and Alteration:
There are two types of veins in this sample. The oldest vein is composed
entirely of quartz, has sinuous boundaries, and has a distinct selvedge of
potassicaly altered feldspars around its margins. This vein and its textures are cut
by the younger vein which has straight margins, a phyllosilicate alteration
selvedge, and is composed entirely of quartz. Both the mica and potassic
alteration increase in abundance with increasing proximity to the veins.
KF5E-2 Quartz vein sample from a prospect pit west of the river fork in the southern part
of the footwall.
No host rock is present in this sample.
Vein:
This sample is from one of the “big vein” prospect pits. It is composed of
85% fine grained quartz, ~5% fine-grained molybdenite , ~5% coarse anhedral
phyllosilicates, and ~5% coarse (~5-10mm), subhedral to euhedral pyrite
crystals. This vein is very similar to the veins in samples KF2-4, KF4D-2/1, and
KF4F-1.
KF6C-4 Quartz vein sample from pile on near a shaft on the ridge above Century mine.
No host rock is present in this sample.
Vein:
The exact origin of this sample is not clear but given its location in a pile of
ore rocks next to a mine shaft for the century mine, it is likely that this is an ore
sample from the century mine. The Vein is composed of ~97% fine-grained
quartz and ~3% sulfide and oxide minerals. The oxides occurs as a red powdery
mineral in cracks in the quartz and the sulfides occur as large (>3 mm) blocky
euhedral pyrite crystals in the quartz mass. In spots the vein quartz has
rectangular voids that are coated with a soft, fine grained mineral that might have
replace feldspars crystals.
KF5I-1 Quartz + feldspar “vein” sample of pinching and swelling veins from prospect
pits at the south west end of the footwall

157
No host rock is present in this sample.
Vein and Alteration:
This sample is composed of 50% coarse, subhedral feldspars, ~25% soft, fine-
grained phyllosilicates and sulfides, and ~25% anhedral quartz. The quartz seems
to “flow” around the individual feldspar crystals and is mixed with the
sulfide/phyllosilicate mixture. It is not clear if the feldspars in this sample are
from the host rock or are part of the vein.
The phyllosilicates associated with this vein are green or grey and occur as
soft anhedral crystals mixed with fine-grained sulfides (mostly pyrite). It is not
clear whether the mixture of phyllosilicates is part of the vein or part of an
alteration selvedge in the host rock.
KF5C-1 Quartz vein sample from a prospect pit at the turn in the river in the southwest
sampling area.
No host rock is present in this sample.
Vein:
The vein is composed of ~90% fine to medium sized, anhedral- subhedral
quartz crystals. Quartz crystals in this vein typically form alternating bands of
fine and medium crystals. Bands of coarse (<4mm) subhedral pyrite (~6%) and
fine grained, anhedral molybdenite (~4%) commonly form parallel to the
alternating quartz bands.
Along cracks and on the surface of the sample there is a lot of secondary
oxidation.

158
APPENDIX E
MICROTHERMOMETRIC OBSERVATIONS AND DATA
Observed microthermometic behavior and calculated mole percent NaCl (Mol% NaCl),
weight percent NaCl (wt% NaCl), bulk density (Bulk Den), bulk CO2 (Bulk xCO2), and mole
percent CO2 (Mol% CO2) of fluid inclusion groups from the hanging wall and the footwall are
presented in the following tables. Fluid inclusions without Mol% NaCl, wt% NaCl, Bulk Den,
Bulk xCO2, and Mol% CO2 values had either insufficient data for calculations or were destroyed
or modified during analysis. Abbreviations for microthermometric behavior are as follows: TF-
H2O = H2O freezing temperature, TM-H2O = H2O melting temperature, TF-clath = clathrate
freezing temperature, TM-clath = clathrate melting temperature, TF-CO2 = CO2 freezing
temperature, TM-CO2 = CO2 melting temperature, TH-CO2 = CO2 liquid-vapor homogenization
temperature, TH-H2O = H2O liquid-vapor homogenization temperature, and TM-halite = halite
melting temperature. Note that approximate “freezing” temperatures, collected while samples
were frozen, provide non-diagnostic information that can be helpful in distinguishing FIAs;
however, these data were not used to interpret phase changes or phase equilibria.

159
B15D
Sample TF-H2O Tm-H2O Th-H2O Size (µm) Shape Photo ID Molal NaCl Wt% NaCl Bulk Den
KF3C-16 -36.4 -3.4 162.5 ~10 Negative crystal KF3C-16-FI-18 0.99 5.47 0.945
KF3C-16 -36.4 -3.4 150 ~10 Undulating KF3C-16-FI-18 0.99 5.47 0.955
KF3C-16 -35.3 -1.5 137 ~7.5 Negative crystal KF3C-16-FI-21 0.43 2.47 0.948
KF3C-16 -35 -3.2 233.3 ~7.5 Negative crystal KF3C-16-FI-13 0.93 5.17 0.869
KF3C-16 -35 -3.2 151 ~7.5 Negative crystal KF3C-16-FI-13 0.93 5.17 0.953
KF3C-16 -35 -3.2 151 ~5 Negative crystal KF3C-16-FI-13 0.93 5.17 0.953
KF3C-16 -35 -3.2 169.7 ~5 Negative crystal KF3C-16-FI-13 0.93 5.17 0.937
KF3C-16 -34.5 -4 137 ~5 Undulating KF3C-16-FI-8 1.16 6.37 0.97
KF3C-16 -34.5 -4 114.5 ~7.5 Undulating KF3C-16-FI-8 1.16 6.37 0.984
KF3C-16 -34.5 -4 137 ~7.5 Undulating KF3C-16-FI-8 1.16 6.37 0.97
KF3C-16 -32.3 -1.2 137 ~7.5 Undulating KF3C-16-FI-16 0.35 1.98 0.945
KF3C-16 -37 -3.7 162.4 ~5 Undulating KF3C-16-FI-22 1.08 5.93 0.948
KF3C-16 -37 -3.7 162.4 ~5 Undulating KF3C-16-FI-22 1.08 5.93 0.948
KF3C-16 -37 -3.7 179 ~5 Undulating KF3C-16-FI-22 1.08 5.93 0.934
KF3C-16 -37 -3.7 204.3 ~5 Undulating KF3C-16-FI-22 1.08 5.93 0.91
KF3C-16 -37 -3.7 204.3 ~5 Undulating KF3C-16-FI-22 1.08 5.93 0.91
KF3C-16 -37 -2.7 204.3 ~7.5 Undulating KF3C-16-FI-22 0.79 4.39 0.898
KF3C-16 -37 -2.7 204.3 ~7.5 Undulating KF3C-16-FI-22 0.79 4.39 0.898
KF3C-16 -35 -3.2 151.9 ~12.5 Undulating KF3C-16-FI-13 0.93 5.17 0.952
KF3C-16 -36 -2.5 n/a ~10 Negative crystal KF3C-16-FI-28 0.73 4.07
KF3C-16 -40 -3.6 n/a ~12.5 Undulating KF3C-16-FI-28 1.05 5.78
KF3C-16 -38 -3.5 n/a ~12.4 Undulating KF3C-16-FI-29 1.02 5.62
KF3C-16 -38 -3.5 n/a ~7.5 Negative crystal KF3C-16-FI-29
KF3C-16 -39.4 -2.8 n/a ~7.5 Negative crystal KF3C-16-FI-29 0.81 4.55
KF3C-16 -39.4 -2.8 n/a ~10 Negative crystal KF3C-16-FI-29
KF3C-16 -37 -2.8 n/a ~12.5 Negative crystal KF3C-16-FI-32 0.81 4.55
KF3C-16 -34 -2.8 n/a ~10 Negative crystal KF3C-16-FI-32 0.81 4.55
KF3C-16 -41.3 -2.5 n/a ~10 Negative crystal KF3C-16-FI-40 0.73 4.07
KF3C-16 -37.7 -2.8 n/a ~7.5 Negative crystal KF3C-16-FI-44 0.81 4.55
KF3C-16 -38.7 -2.8 n/a ~7.5 Negative crystal KF3C-16-FI-44
KF3C-16 -37.5 -2.7 n/a ~10 Negative crystal KF3C-16-FI-45 0.79 4.39
KF3C-16 -40 -3.2 n/a ~12.5 Undulating KF3C-16-FI-46 0.93 5.17
KF3C-16 -37.1 -3 n/a ~12.5 Negative crystal KF3C-16-FI-48 0.87 4.86
KF3C-16 -39.5 -2.8 n/a ~10 Negative crystal KF3C-16-FI-55 0.81 4.55
KF3C-16 -37.7 -3 n/a ~7.5 Negative crystal KF3C-16-FI-52 0.87 4.86
KF3C-16 -38.1 -3 n/a ~10 Negative crystal KF3C-16-FI-52
KF3C-16 -37.5 -2.8 n/a ~12.5 Undulating KF3C-16-FI-51 0.81 4.55
KF3C-16 -37 -3 n/a ~20 Negative crystal KF3C-16-FI-53 0.87 4.86
KF3C-16 -34 -2.8 117 ~15 Undulating KF3C-16-FI-15 0.81 4.55 0.973
KF3C-16 -34 -3.4 137 ~15 Undulating KF3C-16-FI-7 0.99 5.47 0.965
KF3C-16 -35.8 -3 179.4 ~15 Undulating KF3C-16-FI-7
KF3C-16 -32 -3 179.5 ~12.5 Undulating KF3C-16-FI-6 0.87 4.86 0.926

160
B15D
Sample TF-H2O Tm-H2O Th-H2O Size (µm) Shape Photo ID Molal NaCl Wt% NaCl Bulk Den
KF3C-16 -35 -3 n/a ~15 Undulating KF3C-16-FI-26 0.87 4.86
KF3C-16 -35 -2.8 n/a ~15 Undulating KF3C-16-FI-27 0.81 4.55
KF3C-16 -37.6 -3 n/a ~10 Negative crystal KF3C-16-FI-30
KF3C-16 -38.6 -2.4 n/a ~10 Negative crystal KF3C-16-FI-31 0.7 3.92
KF3C-16 -36 -2.6 n/a ~15 Negative crystal KF3C-16-FI-33
KF3C-16 -35 -2.4 n/a ~30 Undulating KF3C-16-FI-37 0.7 3.92
KF3C-16 -36.6 -2.8 n/a ~10 Negative crystal KF3C-16-FI-38
KF3C-16 -35.6 -2.6 n/a ~7.5 Negative crystal KF3C-16-FI-39
KF3C-16 -37.5 -2.9 n/a ~25 Negative crystal KF3C-16-FI-41 0.84 4.7
KF3C-16 -39.9 -3 n/a ~25 Negative crystal KF3C-16-FI-42 0.87 4.86
KF3C-16 -37.2 -2.5 n/a ~15 Undulating KF3C-16-FI-43 0.73 4.07
KF3D-19 -38.6 -5.4 191.1 ~15 Undulating KF3D-19-FI-5 1.19 6.52 0.981
KF3D-19 -34.5 -4.2 120.4 ~10 Undulating KF3D-19-FI-4
KF3D-19 -34.5 -4.2 205.6 ~7.5 Undulating KF3D-19-FI-4
KF3D-19 -38.5 -4.2 205.6 ~5 Undulating KF3D-19-FI-4
KF3D-19 -34.5 -4.4 182.6 ~10 Undulating KF3D-19-FI-3
KF3D-19 -38 -4.4 191.1 ~10 Undulating KF3D-19-FI-3
KF3D-19 -37 -3.7 200.4 ~15 Undulating KF3D-19-FI-2
KF3D-19 -37 -4.2 210.4 ~15 Undulating KF3D-19-FI-2
KF3D-19 -42.2 -5.5 190 ~5 Negative crystal KF3D-19-FI-6 1.59 8.51 0.942
KF3D-19 -38 -4.9 161.6 ~7.5 Negative crystal KF3D-19-FI-8
KF3D-19 -38 -2.2 161.6 ~7.5 Negative crystal KF3D-19-FI-8
KF3D-19 -38 -2.2 161.6 ~7.5 Negative crystal KF3D-19-FI-8
KF3D-19 -36 -3 130.4 ~10 Undulating KF3D-19-FI-14
KF3D-19 -39 -3 235.2 ~7.5 Undulating KF3D-19-FI-14 0.87 4.86 0.864
KF3D-19 -35 -3.9 141.6 ~10 Negative crystal KF3D-19-FI-15
KF3D-19 -39 -3.9 164 ~7.5 Negative crystal KF3D-19-FI-15 1.14 6.23 0.949
KF3D-19 -37.4 -3.9 130.4 ~7.5 Undulating KF3D-19-FI-17
KF3D-19 -36.5 -1.6 149.6 ~7.5 Undulating KF3D-19-FI-18
KF3D-19 -36.5 -1.6 130.4 ~7.5 Undulating KF3D-19-FI-18 0.46 2.63 0.953
KF3D-19 -35.1 -3.4 120.4 ~7.5 Undulating KF3D-19-FI-18 0.99 5.47 0.976
KF3D-19 n/a -2.4 130.4 ~10 Negative crystal KF3D-19-FI-19
KF3D-19 -38.5 -3 161.6 ~10 Undulating KF3D-19-FI-20 0.87 4.86 0.942
KF3D-19 -38.5 -3 161.6 ~7.5 Undulating KF3D-19-FI-20
KF3D-19 -37.5 -2.9 156.4 ~5 Negative crystal KF3D-19-FI-20
KF3D-19 -37.5 -2.9 135.4 ~5 Negative crystal KF3D-19-FI-20
KF3D-19 -37.2 -2.5 100 ~10 Undulating KF3D-19-FI-1 0.73 4.07 0.981
KF3D-19 -41.1 -4 169.9 ~10 Undulating KF3D-19-FI-17 1.16 6.37 0.945
KF3D-19 -41 -6 110.9 ~5 Undulating KF3D-19-FI-3 1.73 9.19 1.002
KF4D-2 -27 -2.8 n/a ~12.5 Undulating KF4D-2-FI-3
KF4D-2 -33 -3 n/a ~10 Negative crystal KF4D-2-FI-3
KF4D-2 -34 -6 n/a ~10 Negative crystal KF4D-2-FI-7 1.73 9.19

161
B15D
Sample TF-H2O Tm-H2O Th-H2O Size (µm) Shape Photo ID Molal NaCl Wt% NaCl Bulk Den
KF4D-2 -37 -3 n/a ~12.5 Undulating KF4D-2-FI-7 0.87 4.86
KF4D-2 -34 -3 n/a ~10 Negative crystal KF4D-2-FI-4
KF4D-2 -34 -1.8 n/a ~7.5 Negative crystal KF4D-2-FI-4
KF4D-2 -34 -1.8 n/a ~7.5 Negative crystal KF4D-2-FI-4
KF4D-2 -34 -1.6 n/a ~7.5 Negative crystal KF4D-2-FI-4
KF4D-2 -34 -0.9 n/a ~7.5 Negative crystal KF4D-2-FI-4 0.26 1.49
KF4D-2 -32 -2.5 n/a ~12.5 Undulating KF4D-2-FI-9 0.73 4.07
KF4D-2 -32 -2.5 n/a ~15 Undulating KF4D-2-FI-9 0.73 4.07
KF4D-2 -34 -2.8 n/a ~10 Negative crystal KF4D-2-FI-8
KF4D-2 -36 -4.1 129.5 ~5 Negative crystal KF4D-2-FI-16
KF4D-2 -36 -4.1 203.4 ~5 Negative crystal KF4D-2-FI-16 1.19 6.52 0.915
KF4D-2 -36 -4.1 170.7 ~5 Negative crystal KF4D-2-FI-16 1.19 6.52 0.945
KF4D-2 -36 -4.1 129.5 ~7.5 Negative crystal KF4D-2-FI-16 1.19 6.52 0.975
KF4D-2 -36 -4.1 136.2 ~7.5 Negative crystal KF4D-2-FI-16
KF4D-2 -36 -4.1 185.5 ~7.5 Negative crystal KF4D-2-FI-16
KF4D-2 -37 -2.3 114.8 ~5 Negative crystal KF4D-2-FI-19 0.67 3.76 0.97
KF4D-2 -37 -2.3 239.4 ~5 Negative crystal KF4D-2-FI-19 0.67 3.76 0.847
KF4D-2 -37 -2.3 221.9 ~5 Negative crystal KF4D-2-FI-19
KF4D-2 -37 -2.3 170.7 ~7.5 Negative crystal KF4D-2-FI-19 0.67 3.76 0.927
KF4D-2 -30 -2 200 ~7.5 Negative crystal KF4D-2-FI-20
KF4D-2 -40 -3.7 n/a ~7.5 Negative crystal KF4D-2-FI-30
KF4D-2 -38.5 -3.7 n/a ~7.5 Negative crystal KF4D-2-FI-30
KF4D-2 -38.5 -3.7 n/a ~7.5 Negative crystal KF4D-2-FI-30_1 1.08 5.93
KF4D-2 -38.5 -3.7 n/a ~5 Negative crystal KF4D-2-FI-30
KF4D-2 -39 -3 n/a ~7.5 Negative crystal KF4D-2-FI-31
KF4D-2 -39 -2.3 n/a ~7.5 Negative crystal KF4D-2-FI-31 0.67 3.76
KF4D-2 -39 -2 n/a ~5 Negative crystal KF4D-2-FI-31
KF4D-2 -40 -2.6 n/a ~17.5 Negative crystal KF4D-2-FI-1
KF4D-2 -36 -2 179.1 ~7.5 Negative crystal KF4D-2-FI-18 0.58 3.28 0.916
KF4D-2 -37 -3 n/a ~10 Negative crystal KF4D-2-FI-27 0.87 4.86
KF4D-2 -40 -3.4 n/a ~10 Negative crystal KF4D-2-FI-25 0.99 5.47
KF4D-2 -35 -3 n/a ~10 Negative crystal KF4D-2-FI-24 0.87 4.86
KF4D-2 n/a -2.6 n/a ~7.5 Negative crystal KF4D-2-FI-28
KF4D-2 n/a -2.6 n/a ~7.5 Negative crystal KF4D-2-FI-28 0.76 4.23
KF4D-2 -33 -2.8 n/a ~20 Undulating KF4D-2-FI-10 0.81 4.55
KF4D-2 -33 -2.2 n/a ~10 Negative crystal KF4D-2-FI-10

162
B30
Sample TF-H2O Tm-H2O Th-H2O Size (µm) Shape Photo ID Molal NaCl Wt% NaCl Bulk Den
KF3C-16 -30.7 -3.2 282.6 ~30 Negative crystal KF3C-16-FI-17 0.93 5.17 0.797
KF3C-16 -35.3 -3 189.4 ~10 Negative crystal KF3C-16-FI-21 0.87 4.86 0.917
KF3C-16 -29.8 -3.4 270.2 ~12.5 Negative crystal KF3C-16-FI-11
KF3C-16 -30 -2.3 150.9 ~15 Undulating KF3C-16-FI-5 0.67 3.76 0.8
KF3C-16 -34.6 -3.4 242.2 ~10 Negative crystal KF3C-16-FI-10 0.99 5.47 0.861

163
B15C
Sample TF-clath TF-H2O TF-CO2 Tm-CO2 Tm-H2O Tm-clath TH-CO2 TH-H2O Size (µm) Shape Photo ID Molal NaCl Wt% NaCl Bulk XCO2 Bulk Den Mol % CO2
KF3C-16 n/a -37 n/a n/a -2.7 9.3 30 204.3 ~7.5 Undulating KF3C-16-FI-22 0.246 1.419 0.027 0.96 2.7
KF3C-16 n/a -37 -96 n/a -2.7 9.3 30 204.3 ~7.5 Undulating KF3C-16-FI-22 0.246 1.419 0.027 0.96 2.7
KF3C-16 n/a -37 -96 n/a -2.7 9.3 30 221.9 ~10 Undulating KF3C-16-FI-22 0.246 1.419 0.027 0.96 2.7
KF3C-16 n/a -37 -96 -95 -2.7 9.3 30 n/a ~12.5 Undulating KF3C-16-FI-22 0.246 1.419 0.027 0.96
KF3C-16 n/a -36 n/a n/a -3.5 9 29.8 179.5 ~12.5 Undulating KF3C-16-FI-16 0.35 2.003 0.027 0.965 2.7
KF3C-16 n/a -32.3 n/a n/a -2.9 9 29.8 179.5 ~10 Undulating KF3C-16-FI-16 0.35 2.003 0.027 0.965 2.7
KF3C-16 n/a 34.5 -94 -55.8 -6 8.4 29.9 221.9 ~17.5 Undulating KF3C-16-FI-24 0.556 3.147 0.027 0.972 2.7
KF3C-16 ~-20.4 -39.1 -94 -55.2 -5 8.4 29.9 233.3 ~5 Negative crystal KF3C-16-FI-8 0.556 3.147 0.027 0.972 2.7
KF3C-16 n/a -34 n/a n/a -2.7 9.4 20.6 220 ~72 Undulating KF3C-16-FI-15 0.212 1.222 0.034 0.977 3.4
KF3C-16 n/a -36.4 n/a n/a -2.6 8.4 30.5 221.9 ~10 Negative crystal KF3C-16-FI-18 0.556 3.147 0.025 0.969 2.5
KF3C-16 n/a -37 n/a n/a -2.5 8.5 30.5 221.9 ~7.5 Negative crystal KF3C-16-FI-23 0.522 2.959 0.025 0.968 2.5
KF3C-16 n/a -37 n/a n/a -2.5 8.5 30.5 233.2 ~5 Negative crystal KF3C-16-FI-23 0.522 2.959 0.025 0.968 2.5
KF3C-16 n/a -37 n/a n/a -2.5 8.5 30.5 233.2 ~5 Negative crystal KF3C-16-FI-23 0.522 2.959 0.025 0.968 2.5
KF3C-16 n/a -37 n/a n/a -2.5 8.5 30.5 221.9 ~5 Negative crystal KF3C-16-FI-23 0.522 2.959 0.025 0.968 2.5
KF3C-16 n/a -37 n/a n/a -2.5 8.5 30.5 221.9 ~5 Negative crystal KF3C-16-FI-23 0.522 2.959 0.025 0.968 2.5
KF3C-16 n/a -37 n/a n/a -2.5 8.5 30.5 221.9 ~5 Negative crystal KF3C-16-FI-23 0.522 2.959 0.025 0.968 2.5
KF3C-16 n/a -37 n/a n/a -2.5 8.5 30.5 179.5 ~5 Negative crystal KF3C-16-FI-23 0.522 2.959 0.025 0.968 2.5
KF3C-16 n/a -37 n/a n/a -2.5 8.5 30.5 137 ~5 Negative crystal KF3C-16-FI-23 0.522 2.959 0.025 0.968 2.5
KF3C-16 n/a -30 n/a n/a -2.5 8.5 30.5 221.9 ~10 Negative crystal KF3C-16-FI-23 0.522 2.959 0.025 0.968 2.5
KF3C-16 -25 -39.7 -102.2 -56.6 -3 7.9 n/a n/a ~7.5 Undulating KF3C-16-FI-25 0.727 4.074 0.026 0.978 2.6
KF3C-16 n/a -39.7 n/a n/a -3 7.9 n/a n/a ~7.5 Undulating KF3C-16-FI-25 0.727 4.074 0.026 0.978 2.6
KF3C-16 n/a -39.7 n/a n/a -3 7.9 n/a n/a ~7.5 Undulating KF3C-16-FI-25 0.727 4.074 0.026 0.978 2.6
KF3C-16 -25 -39.7 -102.2 -56.6 -3 7.9 n/a n/a ~7.5 Undulating KF3C-16-FI-25 0.727 4.074 0.026 0.978 2.6
KF3C-16 n/a -41.1 n/a n/a -3.4 10.1 n/a n/a ~10 Undulating KF3C-16-FI-25 0.004 0.021
KF3C-16 n/a -41.7 n/a n/a -3.3 10.1 n/a n/a ~5 Undulating KF3C-16-FI-25
KF3C-16 n/a -41.7 n/a n/a -3.3 10 n/a n/a ~7.5 Undulating KF3C-16-FI-25
KF3C-16 -34 -40.7 n/a n/a -4.2 9.4 n/a n/a ~10 Undulating KF3C-16-FI-35
KF3C-16 -32 n/a n/a n/a -3.2 9.4 n/a n/a ~7.5 Undulating KF3C-16-FI-36 0.212 1.222 0.103 0.894 10.3
KF3C-16 -32 n/a n/a n/a -3.2 8.2 n/a n/a ~7.5 Undulating KF3C-16-FI-36
KF3C-16 -33 -40 n/a n/a -2.8 9.5 n/a n/a ~10 Undulating KF3C-16-FI-47
KF3C-16 -32 -40 n/a n/a -3.7 10 n/a n/a 15 Undulating KF3C-16-FI-34_1 0.004 0.021 0.029 0.956 2.9
KF3C-16 -32.8 -40.9 n/a n/a -3.2 10 n/a n/a ~10 Undulating KF3C-16-FI-49
KF3C-16 -33 -40.5 -101 -56.4 -3 8.7 n/a n/a ~20 Undulating KF3C-16-FI-54 0.453 2.58 0.045 0.956 4.5
KF3C-16 -34.5 -41.5 -101 -56.4 -2.5 8.3 n/a n/a ~12.5 Undulating KF3C-16-FI-50 0.59 3.334 0.045 0.961 4.5
KF3C-16 -34.2 n/a <-20 8.7 -54.5 2.9 30.5 204.3 ~10 Negative crystal KF3C-16-FI-19 2.338 12.02 0.025 1.031 2.5
KF3C-16 -34.2 n/a n/a 9.3 n/a 3.5 30.5 189.4 ~15 Negative crystal KF3C-16-FI-20 2.157 11.193 0.025 1.025 2.5
KF3C-16 34.2 n/a n/a 9.3 n/a 3.5 30.5 221.9 ~10 Negative crystal KF3C-16-FI-20 2.157 11.193 0.025 1.025 2.5
KF3C-16 -29.1 n/a <-25 9.3 n/a 3.5 30.5 189.4 ~12.5 Negative crystal KF3C-16-FI-20 0.246 1.419 0.045 0.948 4.5
KF3C-16 -32.3 -96 -31.2 8.7 -55.3 3.2 30 270.5 ~12.5 Negative crystal KF3C-16-FI-16 2.248 11.611 0.027 1.031 2.7
KF3C-16 -27 n/a -15 8.6 n/a 3.8 30 204.3 ~12.5 Negative crystal KF3C-16-FI-1 2.157 11.193 0.027 1.028 2.7
KF3C-16 -38.8 -100 -30 9.3 -56.5 3.7 n/a n/a 27.5 Undulating KF3C-16-FI-34_2 2.095 10.91 0.026 1.026 2.6
KF3D-19 -39 n/a n/a -5 n/a 6.4 30.5 242.4 ~5 Undulating KF3D-19-FI-6 1.231 6.71 0.025 0.994 2.5

164
B15C
Sample TF-clath TF-H2O TF-CO2 Tm-CO2 Tm-H2O Tm-clath TH-CO2 TH-H2O Size (µm) Shape Photo ID Molal NaCl Wt% NaCl Bulk XCO2 Bulk Den Mol % CO2
KF3D-19 -37 n/a n/a -4.5 n/a 7.9 30.5 196.1 ~12.5 Undulating KF3D-19-FI-13 0.727 4.074 0.025 0.975 2.5
KF3D-19 -37 n/a n/a -4.5 n/a 7.9 30.5 191.1 ~10 Undulating KF3D-19-FI-13 0.727 4.074 0.025 0.975 2.5
KF3D-19 -41.2 n/a -30 -4.5 n/a 8 30.5 191.1 ~15 Undulating KF3D-19-FI-12 0.693 3.89 0.025 0.974 2.5
KF3D-19 -41 n/a n/a -4.6 n/a 7.6 30.5 210.4 ~10 Negative crystal KF3D-19-FI-11 0.828 4.618 0.025 0.979 2.5
KF3D-19 -40.2 n/a n/a -4.5 n/a 7.5 30.5 200.4 ~12.5 Negative crystal KF3D-19-FI-10 0.862 4.798 0.025 0.98 2.5
KF3D-19 -42.5 n/a n/a -4.5 n/a 7.5 30.5 200.4 ~10 Undulating KF3D-19-FI-10 0.862 4.798 0.025 0.98 2.5
KF3D-19 -31.5 n/a n/a -4.7 n/a 7 30.5 196.1 ~10 Negative crystal KF3D-19-FI-9 1.031 5.681 0.025 0.987 2.5
KF3D-19 -38.5 n/a n/a -6 -55.8 5 30.5 264.1 ~15 Undulating KF3D-19-FI-8 1.687 8.975 0.025 1.01 2.5
KF3D-19 -38.5 n/a n/a -5.4 -56.6 5.5 30.5 231.4 ~10 Undulating KF3D-19-FI-7 1.526 8.188 0.025 1.004 2.5
KF3D-19 -40 n/a -32 -3 n/a 10 n/a n/a ~12.5 Undulating KF3D-19-FI-21 0.004 0.021 0.029 0.956 2.9
KF3D-19 -38 n/a -32 -3 n/a 8 n/a n/a ~7.5 Undulating KF3D-19-FI-23
KF3D-19 -32 -95 -40 -3 -55.4 10 n/a n/a ~15 Undulating KF3D-19-FI-24 0.004 0.021 0.045 0.939 4.5
KF3D-19 -32 -95 -40 -3 -55.4 10 n/a n/a ~12.5 Undulating KF3D-19-FI-24 0.004 0.021 0.045 0.939 4.5
KF3D-19 -41 n/a -32 -5 n/a 10 n/a n/a ~10 Undulating KF3D-19-FI-26
KF3D-19 -41 n/a -32 -5 n/a 10 n/a n/a ~7.5 Undulating KF3D-19-FI-26
KF3D-19 -40 n/a -32 -3 n/a 7.7 n/a n/a ~12.5 Undulating KF3D-19-FI-25 0.795 4.438 0.029 0.986 2.9
KF3D-19 -40 n/a -32 -3 n/a 7.7 n/a n/a ~7.5 Undulating KF3D-19-FI-25
KF3D-19 -40 n/a -34 -3 n/a 7.6 n/a n/a ~7.5 Undulating KF3D-19-FI-25
KF3D-19 -40 n/a -34 -3 n/a 7.6 n/a n/a ~12.5 Undulating KF3D-19-FI-25 0.828 4.618 0.029 0.988 2.9
KF3D-19 -38 n/a -32 -5 n/a 10 n/a n/a ~10 Undulating KF3D-19-FI-25
KF3D-19 -43.1 n/a n/a -3 n/a 7.5 n/a n/a ~10 Undulating KF3D-19-FI-27 0.862 4.798 0.045 0.97 4.5
KF3D-19 -43.1 n/a n/a -2.3 n/a 7.5 n/a n/a ~7.5 Undulating KF3D-19-FI-27 0.862 4.798 0.029 0.989 2.9
KF4D-2 -33 n/a n/a n/a -1 2.6 n/a n/a ~15 Undulating KF4D-2-FI-3 2.427 12.421 0.005 1.078 0.5
KF4D-2 -32 n/a n/a n/a -2.2 0.2 n/a n/a ~15 Undulating KF4D-2-FI-3 3.094 15.314 0.006 1.099 0.6
KF4D-2 -32 n/a n/a n/a -2.2 0.2 n/a n/a ~17.5 Undulating KF4D-2-FI-3 3.094 15.314 0.006 1.099 0.6
KF4D-2 -36 n/a n/a n/a -3.4 10 n/a 136.2 ~12.5 Undulating KF4D-2-FI-15
KF4D-2 -36 n/a n/a n/a -3.4 10 n/a 179.1 ~12.5 Undulating KF4D-2-FI-15
KF4D-2 -36 n/a n/a n/a -3.2 11 n/a 179.1 ~10 Negative crystal KF4D-2-FI-14 0.004 0.021 0.029 0.956 2.9
KF4D-2 -36 n/a n/a n/a -3.2 11 n/a 195.5 ~10 Negative crystal KF4D-2-FI-14
KF4D-2 N/a n/a n/a -55.5 -4.2 9 30.5 203.3 ~7.5 Negative crystal KF4D-2-FI-13 0.35 2.003 0.025 0.961 2.5
KF4D-2 N/a n/a n/a -55.5 -4.2 9 30.5 185.5 ~7.5 Negative crystal KF4D-2-FI-13 0.35 2.003 0.025 0.961 2.5
KF4D-2 -34 n/a -13 -55.6 -5.3 9.1 30.5 213.9 ~12.5 Negative crystal KF4D-2-FI-12 0.315 1.81 0.025 0.96 2.5
KF4D-2 -35 n/a <-30 -55.3 -3.5 9.5 30.5 221.9 ~7.5 Negative crystal KF4D-2-FI-12 0.177 1.024 0.025 0.954 2.5
KF4D-2 -35 n/a n/a n/a -3.5 9.2 n/a 213.9 ~5 Negative crystal KF4D-2-FI-12
KF4D-2 -35 n/a n/a n/a -3.5 9.2 n/a 213.9 ~5 Negative crystal KF4D-2-FI-12
KF4D-2 -36 n/a n/a n/a -2.3 8.9 n/a 115 ~7.5 Negative crystal KF4D-2-FI-22 0.384 2.197 0.029 0.971 2.9
KF4D-2 -36 n/a n/a n/a -2.3 8.9 n/a 203.3 ~7.5 Negative crystal KF4D-2-FI-22
KF4D-2 -36 n/a n/a n/a -2.3 8.9 n/a 203.3 ~7.5 Negative crystal KF4D-2-FI-22
KF4D-2 -35 n/a n/a n/a -3 9 n/a 203.3 ~12.5 Undulating KF4D-2-FI-21 0.35 2.003 0.029 0.97 2.9
KF4D-2 -37 -96 n/a -56.3 -3 9 n/a 270 ~10 Negative crystal KF4D-2-FI-23 0.35 2.003 0.103 0.898 10.3
KF4D-2 -33.7 -100 -18 n/a -3.8 9 n/a n/a ~12.5 Negative crystal KF4D-2-FI-29 0.35 2.003 0.045 0.952 4.5
KF4D-2 -37 n/a n/a -55.8 -2.3 9.3 n/a n/a ~12.5 Undulating KF4D-2-FI-31
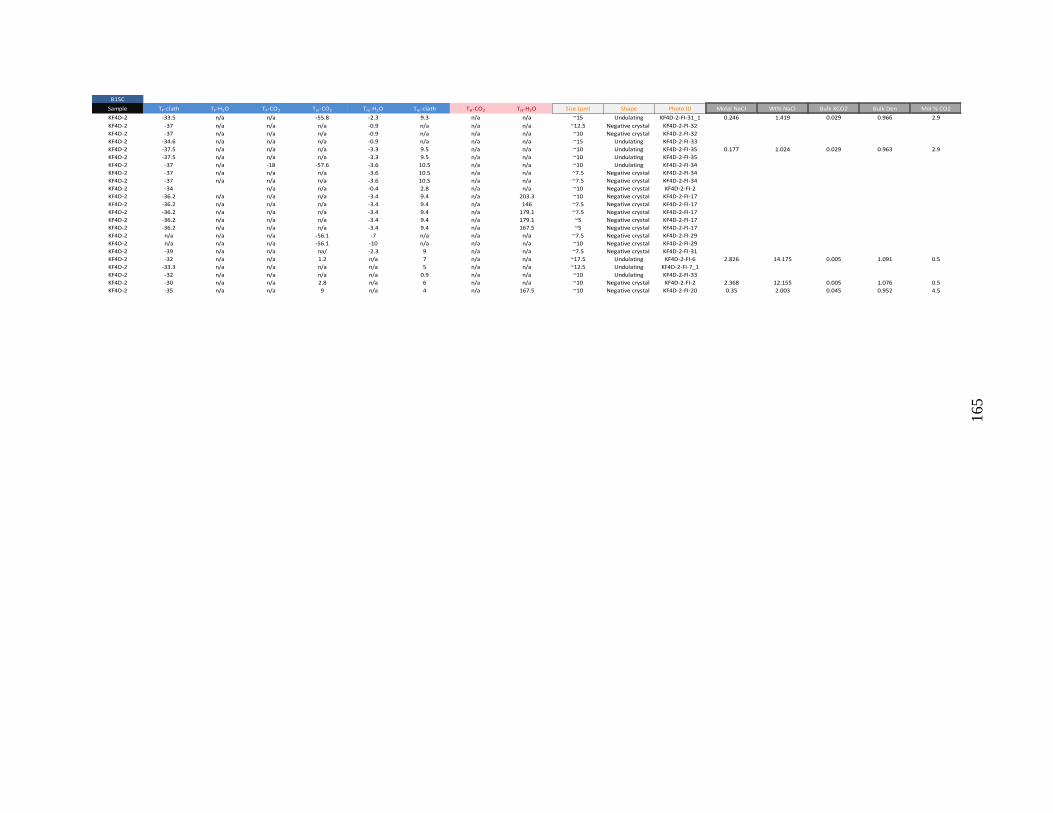
165
B15C
Sample TF-clath TF-H2O TF-CO2 Tm-CO2 Tm-H2O Tm-clath TH-CO2 TH-H2O Size (µm) Shape Photo ID Molal NaCl Wt% NaCl Bulk XCO2 Bulk Den Mol % CO2
KF4D-2 -33.5 n/a n/a -55.8 -2.3 9.3 n/a n/a ~15 Undulating KF4D-2-FI-31_1 0.246 1.419 0.029 0.966 2.9
KF4D-2 -37 n/a n/a n/a -0.9 n/a n/a n/a ~12.5 Negative crystal KF4D-2-FI-32
KF4D-2 -37 n/a n/a n/a -0.9 n/a n/a n/a ~10 Negative crystal KF4D-2-FI-32
KF4D-2 -34.6 n/a n/a n/a -0.9 n/a n/a n/a ~15 Undulating KF4D-2-FI-33
KF4D-2 -37.5 n/a n/a n/a -3.3 9.5 n/a n/a ~10 Undulating KF4D-2-FI-35 0.177 1.024 0.029 0.963 2.9
KF4D-2 -37.5 n/a n/a n/a -3.3 9.5 n/a n/a ~10 Undulating KF4D-2-FI-35
KF4D-2 -37 n/a -18 -57.6 -3.6 10.5 n/a n/a ~10 Undulating KF4D-2-FI-34
KF4D-2 -37 n/a n/a n/a -3.6 10.5 n/a n/a ~7.5 Negative crystal KF4D-2-FI-34
KF4D-2 -37 n/a n/a n/a -3.6 10.5 n/a n/a ~7.5 Negative crystal KF4D-2-FI-34
KF4D-2 -34 n/a n/a -0.4 2.8 n/a n/a ~10 Negative crystal KF4D-2-FI-2
KF4D-2 -36.2 n/a n/a n/a -3.4 9.4 n/a 203.3 ~10 Negative crystal KF4D-2-FI-17
KF4D-2 -36.2 n/a n/a n/a -3.4 9.4 n/a 146 ~7.5 Negative crystal KF4D-2-FI-17
KF4D-2 -36.2 n/a n/a n/a -3.4 9.4 n/a 179.1 ~7.5 Negative crystal KF4D-2-FI-17
KF4D-2 -36.2 n/a n/a n/a -3.4 9.4 n/a 179.1 ~5 Negative crystal KF4D-2-FI-17
KF4D-2 -36.2 n/a n/a n/a -3.4 9.4 n/a 167.5 ~5 Negative crystal KF4D-2-FI-17
KF4D-2 n/a n/a n/a -56.1 -7 n/a n/a n/a ~7.5 Negative crystal KF4D-2-FI-29
KF4D-2 n/a n/a n/a -56.1 -10 n/a n/a n/a ~10 Negative crystal KF4D-2-FI-29
KF4D-2 -39 n/a n/a na/ -2.3 9 n/a n/a ~7.5 Negative crystal KF4D-2-FI-31
KF4D-2 -32 n/a n/a 1.2 n/a 7 n/a n/a ~17.5 Undulating KF4D-2-FI-6 2.826 14.175 0.005 1.091 0.5
KF4D-2 -33.3 n/a n/a n/a n/a 5 n/a n/a ~12.5 Undulating KF4D-2-FI-7_1
KF4D-2 -32 n/a n/a n/a n/a 0.9 n/a n/a ~10 Undulating KF4D-2-FI-33
KF4D-2 -30 n/a n/a 2.8 n/a 6 n/a n/a ~10 Negative crystal KF4D-2-FI-2 2.368 12.155 0.005 1.076 0.5
KF4D-2 -35 n/a n/a 9 n/a 4 n/a 167.5 ~10 Negative crystal KF4D-2-FI-20 0.35 2.003 0.045 0.952 4.5

166
B15
Sample TF-H2O Tm-H2O TH-H2O Size (µm) Shape Photo ID Molal NaCl Wt% NaCl Bulk Den
1086 n/a -1.6 265.5 ~7,5 Negative crystal 1086.6-FI-27 0.46 2.63 0.794
1086 n/a -5.3 342.6 ~7.5 Negative crystal 1086.6-FI-15 1.54 8.24 0.733
1086 -32.1 -4.6 n/a ~12.5 Undulating 10866-FI-55
1086 -32.2 -4.5 n/a ~12.5 Undulating 1086.6-FI-54
1086 n/a -20 n/a ~10 Negative crystal 1086.6-FI-48 4.93 22.35
1086 n/a -8.5 n/a ~10 Negative crystal 1086.6-FI-44 2.4 12.29
1086 -34.1 -2.2 n/a ~17.5 Undulating 1086.6-FI-42 0.64 3.6
1086 N/a -6.1 n/a ~7.5 Negative crystal 1086.6-FI-41 1.76 9.32
1193 -42.1 -2.1 239.6 ~7.5 Negative crystal 1193-FI-6 0.61 3.44 0.844
1193 -44.9 -2.5 166.7 ~7.5 Negative crystal 1193-FI-17 0.73 4.07 0.933
1193 -44.9 -2.5 166.7 ~5 Negative crystal 1193-FI-18
1193 -52 -4.8 305.3 ~10 Negative crystal 1193-FI-29 1.39 7.54 0.79
1193 -47 -5.5 327.1 ~10 Negative crystal 1193-FI-30 1.59 8.51 0.766
1193 -45.7 -5.6 n/a ~10 Negative crystal 1193-FI-38
1193 n/a -2.8 n/a ~7.5 Negative crystal 1193-FI-41
1193 -35 -2.8 n/a ~10 Negative crystal 1193-FI-41
1193 -46.6 -11 n/a ~12.5 Negative crystal 1193-FI-56 3.01 14.98
1201 -35.5 -7.1 240 ~7.5 Negative crystal 1201.1-FI-14 2.03 10.61 0.91
1201 -36.5 -3 n/a ~7.5 Undulating 1201-FI-47
1201 -35 -2 n/a ~10 Undulating 1201-FI-48 0.58 3.28

167
B30D
Sample TF-H2O Tm-H2O TH-H2O Size (µm) Shape Photo ID Molal NaCl Wt% NaCl Bulk Den
1086 -30 -2 337.2 ~10 Negative crystal 1086.6-FI-29 0.58 3.28 0.657
1086 -31 -3.2 321.8 ~7.5 Negative crystal 1086.6-FI-33 0.93 5.17 0.724
1086 -38.5 -3.7 n/a ~7.5 Negative crystal 1086.6-FI-57
1086 n/a -4.2 n/a ~10 Negative crystal 1086.6-FI-49 1.22 6.67
1086 -38.5 -2.5 n/a ~12.5 Negative crystal 1086.6-FI-65
1086 -35 -3 n/a ~10 Negative crystal 1086.6-FI-68
1086 -34.3 -2 n/a ~7.5 Negative crystal 1086.6-FI-70 0.58 3.28
1086 -38.5 -4.4 n/a 22.5 Negative crystal 1086.6-FI-71 1.28 6.96
1086 -35.4 -3 n/a ~10 Negative crystal 1086.6-FI-72 0.87 4.86
1086 -32.5 -3 373.6 ~7.5 Negative crystal 1086.6-FI-8 0.87 4.86 0.598
1193 -16 -2.3 n/a ~12.5 Negative crystal n/a
1193 -43.9 -2.1 266.2 ~10 Negative crystal 1193-FI-5 0.61 3.44 0.803
1193 -43.1 -1 263.6 ~7.5 Negative crystal 1193-FI-6 0.29 1.65 0.785
1193 n/a -3 n/a ~10 Negative crystal 1193-FI-63
1193 -41.9 -5.9 n/a ~15 Negative crystal 1193-FI-36 1.7 9.05
1193 n/a -2.7 n/a ~10 Negative crystal 1193-FI-40 0.79 4.39
1193 -32 -3.2 n/a ~10 Negative crystal 1193-FI-35
1193 -32 -3.3 n/a ~10 Undulating 1193-FI-45 0.96 5.32
1193 -41.6 -3.7 n/a ~10 Negative crystal 1193-FI-46
1193 -41.6 -4.9 n/a ~10 Negative crystal 1193-FI-46
1193 -55.6 -15 n/a ~10 Negative crystal 1193-FI-55
1193 n/a -4.4 n/a ~7.5 Negative crystal 1193-FI-62
1193 -33.5 -4.4 n/a ~10 Negative crystal 1193-FI-62 1.28 6.96
1193 -48.6 -10.4 347.9 ~12.5 Negative crystal 1193-FI-11
1193 -35.6 -1 362.9 ~10 Negative crystal 1193-FI-20 0.29 1.65 0.558
1193 -44 -6.7 282.2 ~10 Negative crystal 1193-Fi-22 1.92 10.1 0.856
1193 -40.5 -6.7 279 ~10 Negative crystal 1193-FI-26
1193 -58.4 -12 n/a ~15 Negative crystal 1193-FI-40_2 3.25 15.96
1193 -35 -4 n/a ~7.5 Negative crystal 1193-FI-42 1.16 6.37
1193 -35 -10 n/a ~7.5 Negative crystal 1193-FI-54 2.77 13.95
1193 -28 -4.4 n/a ~10 Negative crystal 1193-FI-52 1.28 6.96
1193 -28 -4.4 n/a ~10 Negative crystal 1193-FI-52 1.28 6.96
1193 -40.2 -12 n/a ~10 Negative crystal 1193-FI-50
1193 -50.9 -11 ~10 Negative crystal 1193-FI-57
1193 -47.8 -7.1 390 ~7.5 Negative crystal 1193-FI-13 2.03 10.61 0.679
1201 -36 -5.5 295.3 ~5 Negative crystal 1201.1-FI-16 1.59 8.51 0.819
1201 -36 -6 338 ~7.5 Undulating 1201.1-FI-20 1.73 9.19 0.757
1201 -30.8 -5.3 358 ~7.5 Negative crystal 1201.1-Fi-30 1.54 8.24 0.702
1201 n/a -2.5 n/a ~7.5 Negative crystal 1201-FI-43 0.73 4.07
1201 n/a n/a n/a ~7.5 Negative crystal 1201-Fi-55
1201 -34.8 -5.3 245.5 ~7.5 Undulating 1201.1-FI-17 1.54 8.24 0.884
1201 -34.5 -5.5 330.2 ~7.5 Undulating 1201.1-FI-15

168
B30D
Sample TF-H2O Tm-H2O TH-H2O Size (µm) Shape Photo ID Molal NaCl Wt% NaCl Bulk Den
1201 -34.8 -7 389.8 ~7.5 Negative crystal 1201.1-FI-22 2 10.48 0.676
1201 -35 -4.6 353.7 ~20 Undulating 1201.1-Fi-25 1.34 7.25 0.693
1201 -28.4 -4.9 367.1 ~12.5 Negative crystal 1201.1-Fi-26
1201 n/a -4.5 370 ~15 Undulating 1201.1-Fi-27
1201 -34.5 -3 302.3 ~7.5 Negative Crysta; 1201.1-Fi-28 0.87 4.86 0.757
1201 -40.1 -2.7 n/a ~12.5 undulating 1201-FI-45 0.79 4.39
1201 -37.6 -3 n/a ~17.5 undulating 1201-FI-46 0.87 4.86
1201 -37.5 -3.3 n/a ~10 Negative crystal 1201-FI-46 0.96 5.32
1201 -38.2 -3 n/a ~10 Negative crystal 1201-FI-47 0.87 4.86
1201 -38 -2.5 n/a ~10 undluating 1201-FI-47 0.73 4.07
1201 -39.5 -2.5 n/a ~12.5 Negative crystal 1201-FI-49 0.73 4.07
1201 n/a -2.8 n/a ~7.5 Negative crystal 1201-Fi-56
1201 n/a -7.1 396.2 ~5 Negative crystal 1201.1-FI-12
1201 -35.5 -5.5 336.4 ~10 undulating 1201.1-FI-21
1201 -33.6 -4.4 361.7 ~7.5 Negative crystal 1201.1-FI-23 1.28 6.96 0.67
1201 -29.4 -3.9 361.7 ~12.5 Undulating 1201.1-FI-29
1201 n/a -4.6 365.4 ~5 Negative crystal 1201.1-FI-29 1.34 7.25 0.667
1201 n/a -4.6 282.9 ~5 Negative crystal 1201.1-FI-29 1.34 7.25 0.822
1201 -34.8 -7 283 ~10 Negative crystal 1201.1-FI-22 2 10.48 0.859
1201 -34.8 -5.5 358 ~7.5 Negative crystal 1201.1-FI-24
1201 n/a -3.9 n/a ~7.5 Negative crystal 1201.1-FI-37
1201 n/a n/a n/a ~7.5 Negative crystal 1201.1-FI-37
1201 n/a -3 n/a ~10 Undulating 1201.1-FI-37 0.87 4.86
1201 -47.5 -6.6 n/a ~10 Undulating 1201-FI-51 1.9 9.97
1201 n/a n/a n/a ~7.5 Undulating 1201-FI-51 1.9 9.97
1201 -38.7 -3.9 n/a ~10 Negative crystal 1201-FI-52 1.02 5.62
1201 n/a -3.5 n/a ~15 Negative crystal 1201-FI-52 1.02 5.62
1201 -38 -3.6 n/a ~17.5 Undulating 1201-FI-41
1201 -35 -4.4 n/a ~12.5 Undulating 1201-Fi-53 1.28 6.96
1201 -34.4 -2.8 n/a ~7.5 Negative crystal 1201-Fi-54 0.81 4.55
1201 -34.4 -2.8 n/a ~7.5 Negative crystal 1201-Fi-54
1201 -38.6 -3.2 n/a ~10 Negative crystal 1201.1-FI-33
1343 -38.2 -4.4 n/a ~10 Undulating 1343-FI-14 1.28 6.96
1343 -35 -3 331.1 ~10 Negative crystal 1343-FI-16 0.87 4.86 0.699
1343 -35 -2 260.2 ~7.5 Negative crystal 1343-FI-19 0.58 3.28 0.81
1343 -36 -3 n/a ~12.5 Undulating 1343-FI-15 0.87 4.86
1343 -33.8 -0.5 n/a ~7.5 Negative crystal 1343-FI-3
1343 -31.3 -3 n/a ~10 Negative crystal 1343-FI-5 0.87 4.86
1343 -31.3 -4 n/a ~10 Negative crystal 1343-FI-10
1343 n/a -3 n/a ~7.5 Negative crystal 1343-FI-68
1343 n/a -3 n/a ~12.5 Undulating 1343-FI-69 0.87 4.86
1343 -40 -3.7 n/a ~20 Undulating 1343-FI-69 1.08 5.93

169
B30D
Sample TF-H2O Tm-H2O TH-H2O Size (µm) Shape Photo ID Molal NaCl Wt% NaCl Bulk Den
1343 -40 -3 n/a ~10 Negative crystal 1343-FI-70 0.87 4.86
1343 -30.5 -2.7 n/a ~10 Negative crystal 1343-FI-84
1343 -37 -3 319.3 ~12.5 Negative crystal 1343-FI-91 0.87 4.86 0.724
1343 -35.5 n/a n/a ~15 Negative crystal 1343-FI-63
1343 -42.7 -3 106.3 ~12.5 Negative crystal 1343-FI-29 0.87 4.86
1343 n/a n/a 170.4 ~10 Negative crystal 1343-FI-39
1343 -32 -4.2 319.4 ~12.5 Negative crystal 1343-FI-44 1.22 6.67 0.752
1201 -35.5 -2.7 342 ~7.5 Negative crystal 1201.1-FI-8
1201 n/a -0.1 393.1 ~7.5 Negative crystal 1201.1-Fi-11
1201 -33.4 -2.1 393.1 ~7.5 Negative crystal 1201.1-FI-19
1201 -38.6 -3.2 n/a ~7.5 Negative crystal 1201.1-FI-33
1193 -30.4 -7.3 362.2 ~7.5 Negative crystal 1193-FI-19
1193 -42.3 -3.8 359.4 ~5 Negative crystal 1193-FI-24
1193 -35 -5 n/a ~7.5 Negative crystal 1193-FI-35
1201 -72.1 -21.1 n/a ~7.5 Negative crystal 1201-FI-58 5.14 23.08
1201 -61.4 -20.9 n/a ~7.5 Negative crystal 1201-FI-57 5.1 22.95
1201 -69.8 -20.5 n/a ~10 Undulating 1201-FI-42 5.02 22.69
1343 -42.1 -20.6 n/a ~7.5 Negative crystal 1343-FI-52 5.04 22.76
1343 -50 -20.6 n/a ~5 Negative crystal 1343-FI-52 5.04 22.76
1086 -46.7 -15 n/a ~17.5 Undulating 1086.6-FI-75 3.91 18.62
1086 n/a -15.5 430.4 ~7.5 Negative crystal 1086.6-Fi-10 4.02 19.03 0.754
1193 -50 -14.5 233.9 ~7.5 Negative crystal 1193-FI-23 3.81 18.2 0.971
1086 -61.6 -20.4 n/a ~10 Negative crystal 1086.6-FI-45 5 22.62
1086 -52.5 -16 n/a ~17.5 Undulating 1086.6-FI-50 4.13 19.43

170
B30H
Sample TF-H2O Tm-H2O TM-Halite TH-H2O Size (microns) Shape Photo ID Molal NaCl Wt% NaCl Bulk Den
1086 -70 -40.2 365 n/a ~12.5 Negative crystal 1086.6-FI-1 13.35 43.83
1086 -64 -25.4 180 286.4 ~10 Negative crystal 1086.6-FI-7 7.66 30.92 1.034
1086 -66.5 -25.6 365 265.6 ~10 Negative crystal 1086.6-FI-3 13.35 43.83 1.182
1086 -66.5 -40.2 180 229.1 ~7.5 Negative crystal 1086.6-FI-3 7.66 30.92 1.089
1086 -73.3 -34 180 437.6 ~10 Negative crystal 1086.6-FI-4 7.66 30.92 0.876
1086 n/a -30 312.1 329.7 ~12.5 Undulating 1086.6-FI-35 10.99 39.12 1.07
1086 -70 -41.9 n/a n/a ~10 Negative crystal 1086.6-FI-52
1086 n/a -40 n/a n/a ~10 Negative crystal 1086.6-FI-61
1086 -85 -39.7 n/a n/a ~10 Negative crystal 1086.6-FI-67
1086 -55.4 -23.8 n/a n/a ~15 Negative crystal 1086.6-FI-26
1086 -74.4 -40.2 n/a 211 ~12.5 Negative crystal 1086.6-FI-2
1086 -80 -40.6 n/a n/a ~5 Negative crystal 1086.6-FI-58
1086 -76 -40 312.1 286.4 ~15 Undulating 1086.6-FI-23 10.99 39.12 1.113
1086 -74.2 -45.1 321.7 265.1 ~17.5 Undulating 1086.6-FI-23 11.36 39.91 1.142
1086 -56 -27.2 n/a n/a ~20 Undulating 1086.6-FI-53
1086 n/a -25 n/a n/a ~7.5 Negative crystal 1086.6-FI-47
1086 -68 -27.2 n/a n/a ~5 Negative crystal 1086.6-FI-43
1086 ~70 -45.5 n/a n/a ~5 Negative crystal 1086.-FI-59
1086 -72 -24.2 n/a n/a ~10 Negative crystal 1086.6-FI-64
1086 n/a -45.7 n/a n/a ~10 Undulating 1086.6-FI-73
1086 n/a -51.1 n/a n/a ~10 Negative crystal 1086.6-FI-76
1086 n/a -41.3 n/a n/a ~10 Negative crystal 1086.6-FI-78
1086 -71.8 -23 n/a n/a ~7.5 Negative crystal 1086.6-FI-63
1193 -69.8 -28 176.6 220.2 ~15 Undulating 1193-FI-9 7.6 30.77 1.096
1193 -74.8 -25 215.2 220.2 ~12.5 Undulating 1193-FI-10 8.3 32.66 1.113
1193 -61.5 -24 190.2 210.5 ~10 Undulating 1193-FI-10 7.83 31.4 1.11
1193 -66.1 -25.6 190.2 233.9 ~10 Negative crystal 1193-FI-12 7.83 31.4 1.089
1193 -58.1 -17.7 n/a n/a ~15 Undulating 1193-FI-33
1343 -33 -40 n/a 319.4 ~7.5 Negative crystal 1343-FI-40
1343 -42.1 -20 n/a n/a ~5 Negative crystal 1343-FI-52
1343 -80 -22.5 n/a 227.1 ~10 Negative crystal 1343-FI-90
1343 n/a -39.9 n/a 315.5 ~12.5 Negative crystal 1343-FI-36

171
B75
Sample TF-H2O Tm-H2O TH-H2O Size (microns) Shape Photo ID Molal NaCl Wt% NaCl Bulk Den
1086 n/a -3 373.6 ~5 Negative crystal 1086.6-FI-6
1086 n/a -3.6 405 ~5 Negative crystal 1086.6-FI-5 1.05 5.78 0.533
1086 n/a n/a 356.7 ~13 Negative crystal 1086.6-FI-12
1086 -33.5 -1 356.7 ~10 Undulating 1086.6-Fi-14 0.29 1.65 0.575
1086 n/a n/a 356.7 ~5 Undulating 1086.6-Fi-14
1086 n/a -1 n/a ~7.5 Negative crystal 1086.6-FI-60
1086 -34.2 -2 n/a ~5 Negative crystal 1086.6-FI-56 0.58 3.28
1086 n/a -3.4 n/a ~10 Negative crystal 1086.6FI-39 0.99 5.47
1086 n/a -3.3 n/a ~10 Negative crystal 1086.6-Fi-38 0.96 5.32
1086 n/a -3.3 n/a ~10 Negative crystal 1086.6-Fi-38
1086 -33.4 -3.2 n/a ~17.5 Undulating 1086.6-FI-42 0.93 5.17
1086 n/a -3 n/a ~10 Negative crystal 1086.6-FI-62
1086 -42 n/a n/a ~10 Negative crystal 1086.6-FI-66
1086 -42 -2.5 n/a ~10 Negative crystal 1086.6-FI-66
1086 n/a -2.8 n/a ~10 Negative crystal 1086.6-FI-69
1086 n/a -2.8 n/a ~12.5 Undulating 1086.6-FI-74 0.81 4.55
1086 n/a -2.7 n/a ~15 Undulating 1086.6-FI-77 0.79 4.39
1193 -25.5 -5.5 n/a ~7.5 Negative crystal n/a
1201 n/a n/a n/a ~10 Negative crystal 1201.1-FI-32
1201 n/a n/a n/a ~7.5 Negative crystal 1201.1-FI-32
1201 n/a n/a n/a ~7.5 Negative crystal 1201-FI-48_1

172
B20C
Sample TF-clath TF-H2O TF-CO2 Tm-CO2 Tm-H2O Tm-clath TH-CO2 TH-H2O Size (µm) Shape Photo ID Molal NaCl Wt% NaCl Bulk XCO2 Bulk Den Mol% CO2
1193 `-30.1 -95.8 n/a -53 n/a 9.1 n/a 310.4 ~12.5 Negative crystal 1193-FI-1
1193 -32.9 n/a n/a -51.5 n/a 8 n/a 173.3 ~12.5 Undulating 1193-FI-2
1193 -32.9 n/a n/a n/a n/a n/a n/a n/a ~20 Undulating n/a
1193 -31.3 -95.8 n/a -54 n/a 8.5 n/a 278.1 ~10 Negative crystal 1193-FI-3
1193 -30.5 -93.8 n/a -55.5 n/a 8.6 n/a 287.8 ~12.5 Negative crystal 1193-FI-4
1193 -42.6 -99.5 -31.1 -56.1 -3.1 9.2 n/a n/a ~7.5 Negative crystal 1193-FI-37 0.281 1.615
1193 -45.5 -100 -32 -55.6 -5.8 10.4 n/a n/a 20 Undulating 1193-FI-32 0.004 0.021 0.212 0.82 21.2
1193 -45.5 -100 -32 -55.6 -5.8 10.4 n/a n/a ~25 Undulating 1193-FI-32 0.004 0.021
1193 n/a -96 n/a -56 -5.5 10.4 n/a n/a ~30 Undulating 1193-FI-34 0.004 0.021
1193 -45 -98 -32 -56 -3 9 n/a n/a ~10 Undulating 1193-FI-47 0.35 2.003 0.082 0.916 8.2
1193 -45 -98 -32 -56 -3 9 n/a n/a ~12.5 Undulating 1193-FI-47 0.35 2.003 0.082 0.916 8.2
1193 -36.7 -97.1 -30 -55.5 -3.3 10 n/a n/a ~32.5 Undulating 1193-FI-48 0.004 0.021 0.103 0.888 10.3
1193 -45 -98.3 -37.2 -56 -4 8 n/a n/a ~20 Undulating 1193-FI-49 0.693 3.89 0.063 0.946 6.3
1193 -45 -98.3 -37.2 -56 -4 9.2 n/a n/a ~7.5 Negative crystal 1193-FI-49 0.315 1.81 0.029 0.968 2.9
1193 n/a -98.5 n/a -56 -3.2 9.1 n/a n/a ~15 Undulating 1193-FI-58 0.315 1.81 0.029 0.968 2.9
1193 -32.1 -99.8 -32.1 -55.8 -2.5 8.9 n/a n/a ~10 Negative crystal 1193-FI-38 0.384 2.197 0.063 0.935 6.3
1193 n/a -98.9 n/a -56.1 -3.3 8.8 n/a n/a ~12.5 Negative crystal 1193-FI-40_1
1201 -33.8 93 -12.3 -55.5 n/a 8.4 25.4 236.3 ~7.5 Undulating 1201.1-FI-6
1201 -32.9 93 -12.3 n/a n/a 8.4 26.6 260.5 ~7.5 Undulating 1201.1-FI-9 0.556 3.147 0.03 0.981 3
1201 -32.9 93 -12.3 -55.5 n/a 8.4 25.4 236.3 ~5 Negative crystal 1201.1-FI-3 0.556 3.147 0.088 0.937 8.8
1201 -33.4 n/a -33.4 n/a n/a 4.6 n/a 120 ~7.5 Negative crystal 1201.1-FI-5
1201 -33.5 n/a n/a n/a -3.3 10 n/a n/a ~10 Negative crystal 1201.1-FI-34 0.004 0.021 0.067 0.931 6.7
1201 -42.1 n/a n/a n/a -3.1 10.4 n/a n/a ~10 Undulating 1201-FI-44 0.004 0.021 0.045 0.939 4.5
1343 -52 -99.5 -35 -56.2 -3 8.5 n/a 306.9 ~10 Negative crystal 1343-FI-21 0.522 2.959 0.126 0.885 12.6
1343 -33.2 -97.8 -47.7 -55.8 -2.5 8.3 30.1 230 ~12.5 Undulating 1343-FI-22 0.59 3.334 0.103 0.906 10.3
1343 -35 -92.1 n/a -55.6 n/a 7 n/a 260 ~30 Undulating 1343-FI-45
1343 n/a -97 n/a -55.6 n/a 9.7 n/a 230 ~10 Negative crystal 1343-FI-47
1343 -46 -101.8 -32 -56 -3 9.7 n/a n/a ~10 Undulating 1343-FI-53 0.108 0.626 0.103 0.891 10.3
1343 -46 -101.8 -32 -56 -3 9.7 n/a n/a ~10 Undulating 1343-FI-53
1343 -46 -101.8 -32 -56 -3 9.7 n/a n/a ~20 Undulating 1343-FI-53 0.108 0.626 0.082 0.908 8.2
1343 n/a -101.7 -33 -56.6 -2.3 7.8 n/a n/a ~10 Negative crystal 1343-FI-58 0.761 4.256 0.082 0.929 8.2
1343 -32 -101.3 -42 -55.8 -3 9 n/a n/a ~7.5 Negative crystal 1343-FI-59
1343 -37 -98 -32 -56.6 n/a n/a n/a n/a ~25 Undulating 1343-FI-62 0.073 0.425 0.082 0.907 8.2
1343 -45 -98 -32 -56.6 n/a 9.8 n/a n/a ~12.5 Negative crystal 1343-FI-62 0.073 0.425 0.063 0.924 6.3
1343 -43 n/a -33 n/a -5 8.9 n/a n/a ~15 Undulating 1343-FI-65 0.384 2.197 0.029 0.971 2.9
1343 -47.5 -100 -35 -56 -3 8 n/a n/a ~10 Negative crystal 1343-FI-66 0.693 3.89 0.332 0.779 33.2
1343 -35.9 -99.7 -28.4 -56 -3 12 n/a 317.3 ~10 Negative crystal 1343-FI-82 0.004 0.021 0.446 0.735 44.6
1343 -51 -101 -32 -56 -3 9.6 n/a n/a ~7.5 Negative crystal 1343-FI-71 0.142 0.825 0.333 0.771 33.3
1343 n/a -101 n/a -55.8 -2.8 11 n/a n/a ~10 Undulating 1343-FI-72 0.004 0.021 0.152 0.854 15.2
1343 -45 -100 -32.2 -55 -3.2 9.2 30.8 250 ~12.5 Undulating 1343-FI-75
1343 -40.9 -100.3 -33 -56.3 -3 10 31.1 320.3 ~10 Negative crystal 1343-FI-92
1343 n/a -98.5 -31 -56.1 -2.9 11 n/a 345.8 ~10 Negative crystal 1343-FI-85
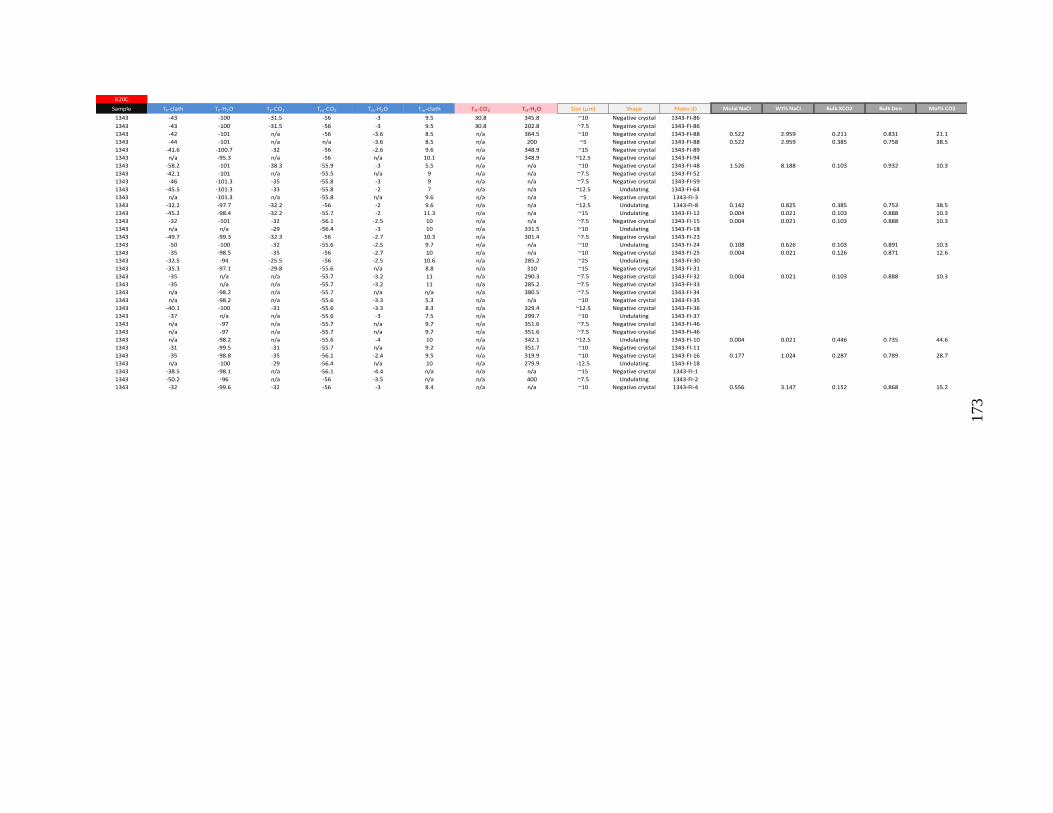
173
B20C
Sample TF-clath TF-H2O TF-CO2 Tm-CO2 Tm-H2O Tm-clath TH-CO2 TH-H2O Size (µm) Shape Photo ID Molal NaCl Wt% NaCl Bulk XCO2 Bulk Den Mol% CO2
1343 -43 -100 -31.5 -56 -3 9.5 30.8 345.8 ~10 Negative crystal 1343-FI-86
1343 -43 -100 -31.5 -56 -3 9.5 30.8 202.8 ~7.5 Negative crystal 1343-FI-86
1343 -42 -101 n/a -56 -3.6 8.5 n/a 364.5 ~10 Negative crystal 1343-FI-88 0.522 2.959 0.211 0.831 21.1
1343 -44 -101 n/a n/a -3.6 8.5 n/a 200 ~5 Negative crystal 1343-FI-88 0.522 2.959 0.385 0.758 38.5
1343 -41.6 -100.7 -32 -56 -2.6 9.6 n/a 348.9 ~15 Negative crystal 1343-FI-89
1343 n/a -95.3 n/a -56 n/a 10.1 n/a 348.9 ~12.5 Negative crystal 1343-FI-94
1343 -58.2 -101 -38.3 -55.9 -3 5.5 n/a n/a ~10 Negative crystal 1343-FI-48 1.526 8.188 0.103 0.932 10.3
1343 -42.1 -101 n/a -55.5 n/a 9 n/a n/a ~7.5 Negative crystal 1343-FI-52
1343 -46 -101.3 -35 -55.8 -3 9 n/a n/a ~7.5 Negative crystal 1343-FI-59
1343 -45.5 -101.3 -33 -55.8 -2 7 n/a n/a ~12.5 Undulating 1343-FI-64
1343 n/a -101.3 n/a -55.8 n/a 9.6 n/a n/a ~5 Negative crystal 1343-FI-3
1343 -32.2 -97.7 -32.2 -56 -2 9.6 n/a n/a ~12.5 Undulating 1343-FI-8 0.142 0.825 0.385 0.753 38.5
1343 -45.2 -98.4 -32.2 -55.7 -2 11.3 n/a n/a ~15 Undulating 1343-FI-12 0.004 0.021 0.103 0.888 10.3
1343 -32 -101 -32 -56.1 -2.5 10 n/a n/a ~7.5 Negative crystal 1343-FI-15 0.004 0.021 0.103 0.888 10.3
1343 n/a n/a -29 -56.4 -3 10 n/a 331.5 ~10 Undulating 1343-FI-18
1343 -49.7 -99.3 -32.3 -56 -2.7 10.3 n/a 301.4 ~7.5 Negative crystal 1343-FI-23
1343 -50 -100 -32 -55.6 -2.5 9.7 n/a n/a ~10 Undulating 1343-FI-24 0.108 0.626 0.103 0.891 10.3
1343 -35 -98.5 -35 -56 -2.7 10 n/a n/a ~10 Negative crystal 1343-FI-25 0.004 0.021 0.126 0.871 12.6
1343 -32.5 -94 -25.5 -56 -2.5 10.6 n/a 285.2 ~25 Undulating 1343-FI-30
1343 -35.3 -97.1 -29.8 -55.6 n/a 8.8 n/a 310 ~15 Negative crystal 1343-FI-31
1343 -35 n/a n/a -55.7 -3.2 11 n/a 290.3 ~7.5 Negative crystal 1343-FI-32 0.004 0.021 0.103 0.888 10.3
1343 -35 n/a n/a -55.7 -3.2 11 n/a 285.2 ~7.5 Negative crystal 1343-FI-33
1343 n/a -98.2 n/a -55.7 n/a n/a n/a 380.5 ~7.5 Negative crystal 1343-FI-34
1343 n/a -98.2 n/a -55.6 -3.3 5.3 n/a n/a ~10 Negative crystal 1343-FI-35
1343 -40.1 -100 -31 -55.6 -3.3 8.3 n/a 329.4 ~12.5 Negative crystal 1343-FI-36
1343 -37 n/a n/a -55.6 -3 7.5 n/a 299.7 ~10 Undulating 1343-FI-37
1343 n/a -97 n/a -55.7 n/a 9.7 n/a 351.6 ~7.5 Negative crystal 1343-FI-46
1343 n/a -97 n/a -55.7 n/a 9.7 n/a 351.6 ~7.5 Negative crystal 1343-FI-46
1343 n/a -98.2 n/a -55.6 -4 10 n/a 342.1 ~12.5 Undulating 1343-FI-10 0.004 0.021 0.446 0.735 44.6
1343 -31 -99.5 -31 -55.7 n/a 9.2 n/a 351.7 ~10 Negative crystal 1343-FI-11
1343 -35 -98.8 -35 -56.1 -2.4 9.5 n/a 319.9 ~10 Negative crystal 1343-FI-16 0.177 1.024 0.287 0.789 28.7
1343 n/a -100 -29 -56.4 n/a 10 n/a 279.9 -12.5 Undulating 1343-FI-18
1343 -38.5 -98.1 n/a -56.1 -4.4 n/a n/a n/a ~15 Negative crystal 1343-FI-1
1343 -50.2 -96 n/a -56 -3.5 n/a n/a 400 ~7.5 Undulating 1343-FI-2
1343 -32 -99.6 -32 -56 -3 8.4 n/a n/a ~10 Negative crystal 1343-FI-4 0.556 3.147 0.152 0.868 15.2

174
B75C
Sample TF-clath TF-H2O TF-CO2 Tm-CO2 Tm-H2O Tm-clath TH-CO2 TH-H2O Size (µm) Shape Photo ID Molal NaCl Wt% NaCl Bulk XCO2 Bulk Den Mol% CO2
1086 n/a -96 n/a -56.4 n/a n/a n/a n/a ~12.5 Undulating 1086.6-FI-25
1086 -33.7 n/a n/a -56.4 -11.5 n/a n/a n/a ~10 Undulating 1086.6-FI-17
1086 n/a -100 n/a -54 -8 n/a n/a 365 ~10 Undulating 1086.6-FI-18
1086 -26.7 -100 n/a -55.4 -19 12.3 n/a 365 ~10 Undulating 1086.6-FI-22
1086 -41.5 -96.2 n/a -55.2 -22.2 n/a n/a n/a ~7.5 Negative crystal 1086.6-FI-21
1086 -30.1 -95.4 n/a -55 -7.7 7.4 n/a 430.4 ~25 Negative crystal 1086.6-FI-32 0.896 4.976
1086 -30 -96 n/a n/a -5 7.2 n/a 373.6 ~10 Negative crystal 1086.6-FI-31
1086 n/a n/a n/a n/a -12 7.8 n/a 373.6 ~7.5 Negative crystal 1086.6-FI-30
1086 n/a n/a n/a n/a -12 7.8 n/a 410 ~7.5 Negative crystal 1086.6-FI-30 0.761 4.256 0.267 0.477 26.7
1086 n/a n/a n/a -56.4 -15 7.1 n/a n/a ~7.5 Negative crystal 1086.6-FI-46
1086 n/a -96 n/a -56.4 n/a 10 n/a n/a ~5 Negative crystal 1086.6-FI-56 0.004 0.021 0.268 0.469 26.8
1193 n/a -100 n/a -56 -3 9.4 n/a n/a ~10 Negative crystal 1193-FI-59 0.212 1.222 0.221 0.506 22.1
1193 n/a -100 n/a -55.9 n/a 8.8 n/a n/a ~7.5 Negative crystal 1193-FI-61
1193 -35 -100 -35 -56.1 -3.2 8.8 n/a n/a ~7.5 Negative crystal 1193-FI-35
1193 n/a -107.1 n/a -56 n/a 8.2 n/a n/a ~10 Negative crystal 1193-FI-36_1
1193 n/a -99.7 n/a -55.1 -3.4 10 n/a n/a ~7.5 Negative crystal 1193-FI-39
1193 -31.9 n/a n/a n/a n/a 6.5 n/a n/a ~7.5 Negative crystal 1193-FI-14
1193 -8 n/a n/a n/a n/a 11.2 n/a n/a ~7.2 Negative crystal 1193-FI-15 0.004 0.021 0.268 0.469 26.8
1193 -32.7 n/a n/a n/a n/a 9.2 n/a 287.8 ~5 Negative crystal 1193-FI-16 0.281 1.615 0.268 0.472 26.8
1193 -9.5 n/a n/a n/a n/a 8.2 n/a n/a ~7.5 Negative crystal 1193-FI-21.4
1193 -41.2 n/a n/a n/a n/a 5.2 n/a n/a ~7.6 Negative crystal 1193-FI-25 1.623 8.663 0.184 0.562 18.4
1193 n/a n/a n/a n/a n/a 3.5 n/a n/a ~5 Negative crystal 1193-FI-27
1193 -41 n/a n/a n/a n/a 6.1 n/a n/a ~5 Negative crystal 1193-FI-28
1193 n/a n/a n/a n/a n/a 7.4 n/a n/a ~7.5 Negative crystal 1193-FI-30
1193 -28.5 n/a -101 -55.3 1 6 n/a 502.3 ~15 Negative crystal 1193-FI-7, DB 1.363 7.376 0.029 0.897 2.9
1193 -46.6 -94.1 -27.7 -55.6 -4 8.4 n/a 533 ~12.5 Negative crystal 1193-FI-21.4
1193 -28.4 -94 n/a -56.4 -4 8.8 n/a 300 ~12.5 Negative crystal 1193-FI-21.4 0.419 2.389 0.221 0.509 22.1
1193 n/a -94.1 n/a -55.8 -4 8.2 n/a 300 ~7.5 Negative crystal 1193-FI-21.4
1201 n/a -100 n/a -56.4 -2 10.1 n/a n/a ~10 Negative crystal 1201.1-FI-36 0.004 0.021 0.222 0.504 22.2
1201 -48.2 -101 -35 n/a -3 10.1 n/a n/a ~10 Negative crystal 1201.1-FI-35 0.004 0.021 0.268 0.469 26.8
1201 n/a -100 n/a -56.4 -2 9.6 n/a n/a ~12.5 Undulating 1201.1-FI-39 0.142 0.825 0.268 0.47 26.8
1201 n/a -100 n/a -56.4 -2 n/a n/a n/a ~10 Undulating 1201.1-FI-39 0.004 0.021 0.268 0.469 26.8
1201 n/a -100 n/a -56.4 -2 10.1 n/a n/a ~15 Negative crystal 1201.1-FI-39 0.004 0.021 0.268 0.469 26.8
1201 n/a -101 n/a -56 n/a 8.6 n/a n/a ~10 Negative crystal 1201.1-FI-40
1201 n/a -101 n/a -56 n/a 8.6 n/a n/a ~12.5 Negative crystal 1201.1-FI-40 0.487 2.77 0.268 0.474 26.8
1201 n/a -101 n/a -56 n/a 8.6 n/a n/a ~7.5 Negative crystal 1201.1-FI-40
1201 n/a -101 n/a -56 n/a 8.6 n/a n/a ~7.5 Negative crystal 1201.1-FI-40
1201 n/a -99.5 n/a -56 n/a n/a n/a n/a ~12.5 Undulating 1201-FI-52
1201 n/a -99.5 n/a -56 n/a n/a n/a n/a ~15 Negative crystal 1201-FI-52_1
1201 -35 -101 n/a -56 n/a 8.6 n/a n/a ~12.5 Undulating 1201-Fi-53 0.487 2.77 0.184 0.546 18.4
1201 n/a 96 n/a -55.8 n/a 8 n/a 338 ~7.5 Negative crystal 1201.1-FI-1.1
1201 n/a 96 n/a -55.8 n/a 8 n/a 338 ~7.5 Negative crystal 1201.1-FI-1.2

175
B75C
Sample TF-clath TF-H2O TF-CO2 Tm-CO2 Tm-H2O Tm-clath TH-CO2 TH-H2O Size (µm) Shape Photo ID Molal NaCl Wt% NaCl Bulk XCO2 Bulk Den Mol% CO2
1201 n/a 96 n/a -55.8 n/a 8 n/a 358 ~7.5 Negative crystal 1201.1-FI-1.2 0.693 3.89 0.267 0.476 26.7
1201 n/a 96 n/a -55.8 n/a 8 n/a 358 ~10 Negative crystal 1201.1-FI-1.3
1201 n/a 96 n/a -55.8 n/a 8 n/a 358 ~7.5 Negative crystal 1201.1-FI-1.3
1201 -33.6 -94.1 n/a -55.3 -3.5 8.8 n/a 385 ~12.5 Undulating 1201.1-Fi-13 0.419 2.389 0.348 0.805 34.8
1201 -32.4 -95 n/a -55.3 -1.8 6.8 n/a 393.1 ~7.5 Undulating 1201.1-FI-18
1201 n/a -94 -11 -56.6 -4.6 7.1 23.1 393.1 n/a Undulating 1201.1-FI-31 0.997 5.507 0.057 0.709 5.7
1201 -29.1 n/a -13.8 n/a -0.6 8.1 23.5 393.1 ~12.5 Negative crystal 1201.1-FI-11
1343 n/a -97 n/a -56.3 n/a 9 n/a 260.2 ~15 Negative crystal 1343-FI-75
1343 n/a -97 n/a -56.3 n/a 9 n/a 202.7 ~12.5 Undulating 1343-FI-75
1343 n/a -100 n/a -56 n/a 9.5 n/a 223 ~7.5 Negative crystal 1343-FI-76
1343 n/a -100 n/a -56 n/a n/a n/a 223.1 ~7.5 Negative crystal 1343-FI-76 0.35 2.003
1343 n/a -100 n/a -56 n/a 9.5 n/a 223.2 ~10 Negative crystal 1343-FI-76
1343 n/a -98 n/a -55.5 n/a n/a n/a 202.7 ~10 Negative crystal 1343-FI-77
1343 n/a -100 -32 -55.9 -3 9.2 n/a 210.7 ~10 Negative crystal 1343-FI-78
1343 n/a -99.8 -32 -56 n/a 8 n/a 300.2 ~7.5 Negative crystal 1343-FI-80 0.693 3.89 0.267 0.476 26.7
1343 n/a n/a -32 -55.8 -3 10 n/a 300.3 ~10 Negative crystal 1343-FI-81
1343 n/a -96 n/a -56 -2.6 6 n/a 260.2 ~10 Negative crystal 1343-FI-83
1343 n/a -100 n/a -56 n/a 6 n/a 260.3 ~10 Negative crystal 1343-FI-83
1343 n/a -99.9 n/a -56 n/a 9.1 n/a 202.7 ~7.5 Negative crystal 1343-FI-87
1343 n/a -99.9 n/a -56 n/a 9.1 n/a 202.8 ~7.5 Negative crystal 1343-FI-87
1343 -39.1 -101 -32 -55.5 n/a 9.3 n/a N/a ~12.5 Negative crystal 1343-FI-93
1343 -39.1 -101 -32 -55.5 n/a 9.3 n/a 330.3 ~12.5 Negative crystal 1343-FI-93
1343 n/a -101.4 n/a -56 n/a 9 n/a n/a ~10 Negative crystal 1343-FI-49 0.35 2.003 0.268 0.473 26.8
1343 -46 -100.9 -32 -55.3 -2.5 8.5 n/a n/a ~12.5 Undulating 1343-FI-50 0.522 2.959 0.268 0.474 26.8
1343 -35 -101.6 n/a -55.7 -3.1 8.8 n/a n/a ~7.5 Undulating 1343-FI-51 0.419 2.389 0.268 0.473 26.8
1343 -35 -101.6 n/a -55.7 -3.1 8.8 n/a n/a ~7.5 Undulating 1343-FI-51 0.419 2.389 0.268 0.473 26.8
1343 n/a -101.3 n/a -56.2 n/a 11.4 n/a n/a ~10 Negative crystal 1343-FI-54 0.004 0.021 0.268 0.469 26.8
1343 n/a -102.1 -32.4 -56 -3 9.3 n/a n/a ~7.5 Negative crystal 1343-FI-56
1343 n/a -101.3 n/a -56.6 n/a 9.8 n/a n/a ~10 Undulating 1343-FI-57 0.073 0.425 0.222 0.504 22.2
1343 n/a -101.5 -32 -56.3 n/a 9.4 n/a n/a ~10 Negative crystal 1343-FI-60 0.212 1.222 0.268 0.471 26.8
1343 -39.2 -100.5 -30 -56.6 -3 10 n/a n/a ~12.5 Negative crystal 1343-FI-61 0.004 0.021 0.222 0.504 22.2
1343 n/a -98 n/a -56.6 n/a 9.8 n/a n/a ~7.5 Negative crystal 1343-FI-62
1343 n/a -100.2 n/a -56.2 -3 10.1 n/a n/a ~10 Negative crystal 1343-FI-73 0.004 0.021 0.268 0.469 26.8
1343 n/a -101 n/a -55.8 n/a 10 n/a n/a ~7.5 Negative crystal 1343-FI-74
1343 n/a -101 n/a -55.8 n/a 10 n/a n/a ~7.5 Negative crystal 1343-FI-74
1343 n/a -101 n/a -55.8 n/a 10 n/a n/a ~7.5 Negative crystal 1343-FI-74
1343 -31.6 -101 -31.6 -55.8 -2.2 10 n/a n/a ~12.5 Negative crystal 1343-FI-9
1343 -31.6 -101 -31.6 -55.8 -2.2 10 n/a n/a ~7.5 Negative crystal 1343-FI-9
1343 -31.6 -101 -31.6 -55.8 -2.2 10 n/a n/a ~7.5 Negative crystal 1343-FI-9
1343 n/a -100 n/a -55.6 n/a n/a n/a n/a ~10 Negative crystal 1343-FI-13
1343 n/a -97.6 n/a -55.8 n/a 10.3 n/a 112.7 ~7.5 Negative crystal 1343-FI-22
1343 n/a -99.3 n/a -56 n/a 10.2 n/a 112.7 ~5 Negative crystal 1343-FI-23

176
B75C
Sample TF-clath TF-H2O TF-CO2 Tm-CO2 Tm-H2O Tm-clath TH-CO2 TH-H2O Size (µm) Shape Photo ID Molal NaCl Wt% NaCl Bulk XCO2 Bulk Den Mol% CO2
1343 n/a -98.5 n/a -56 -2.7 11.2 n/a n/a ~5 Negative crystal 1343-FI-25 0.004 0.021 0.222 0.504 22.2
1343 n/a -100 n/a -55.6 n/a n/a n/a 101.1 ~7.5 Negative crystal 1343-FI-38
1343 n/a -100 n/a -55.7 n/a n/a n/a 200 ~7.5 Negative crystal 1343-FI-42
1343 n/a -100 n/a -55.7 -4.4 8 n/a 200 ~7.5 Negative crystal 1343-FI-42
1343 n/a -98.5 n/a -55.6 n/a n/a n/a 209.8 ~7.5 Undulating 1343-FI-43
1343 -46 -98 -32 -55 -3 10 28.8 250 ~10 Negative crystal 1343-FI-79
1343 -56.5 -100 -37.6 -55.6 -4 6.4 n/a 371.4 ~12.5 Negative crystal 1343-FI-26
1343 -53.6 -96.2 -33 -55.6 -3.3 10 n/a 336.9 ~12.5 Negative crystal 1343-FI-27 0.004 0.021 0.062 0.747 6.2
1343 -49.1 -97.4 n/a -55.8 -2.8 10 n/a 336.9 ~10 Negative crystal 1343-FI-28

177
APPENDIX F
UNPROCESSED LA-ICP-MS DATA
Unprocessed LA-ICP-MS data from selected fluid inclusions for the footwall and
hanging wall fluid inclusion groups. Numbers in red are detection limits for particular elements
in individual inclusions and indicate that the element was either at or below the limit of
detection. Numbers in black represent absolute concentrations for an element in an inclusion.

178
B15D Li7 Na23 Si28 S34 K39 Ca44 V51 Mn55 Fe57 Cu65 Zn66 As75
Location Photo ID µg/g µg/g µg/g µg/g µg/g µg/g µg/g µg/g µg/g µg/g µg/g µg/g
KF4D-2 KF4D-2-FI-7 7.47 7,770.09 2,670.72 3,389.35 75,681.06 1,338.42 5.59 588.71 583.58 28.88 58.82 37.34
KF3C-16 KF3C-16-FI-29 96.59 21,767.47 30,573.47 36,423.19 9,131.99 13,889.11 66.48 377.88 6,520.49 347.13 599.66 411.94
KF3C-16 KF3C-16-FI-53 1,408.02 16,024.12 151,625.62 184,494.01 46,749.73 92,845.26 411.58 2,050.87 36,998.52 2,032.48 4,310.63 2,316.47
KF3C-16 KF3C-16-FI-32 74.68 16,103.13 27,522.01 32,900.90 8,204.11 12,568.95 57.24 339.36 5,865.10 301.70 524.73 369.71
KF3C-16 KF3C-16-FI-32 74.68 16,103.13 27,522.01 32,900.90 8,204.11 12,568.95 57.24 339.36 5,865.10 301.70 524.73 369.71
KF3C-16 KF3C-16-FI-51 211.79 15,205.79 37,800.67 46,164.93 11,664.81 21,993.98 90.60 499.90 8,835.92 484.00 945.08 577.58
KF3C-16 KF3C-16-FI-28 192.17 15,849.86 32,604.82 39,116.74 9,759.06 15,044.29 74.32 402.83 7,053.20 3,689.25 652.66 451.00
KF3C-16 KF3C-16-FI-40 37.50 3,464.62 10,664.37 13,261.43 3,339.99 11,995.82 24.08 149.51 2,870.74 152.54 311.35 175.88
KF4D-2 KF4D-2-FI-9 13.74 2,192.61 19,493,282.92 20,811.16 673.10 25,371.55 5.75 28.92 513.68 81.18 49.93 31.29
KF4D-2 KF4D-2-FI-9 34.05 1,114.38 5,910.32 7,450.12 39,721.27 2,932.07 13.55 78.01 1,322.11 616.76 837.57 85.21
KF3C-16 KF3C-16-FI-26 82.96 16,958.31 6,555.15 7,741.36 4,396.61 2,984.69 12.51 80.00 2,799.86 3,049.41 178.48 88.80
KF3C-16 KF3C-16-FI-42 36.59 17,954.64 6,241.64 7,650.34 3,104.68 3,869.13 12.67 82.76 2,876.01 6,227.14 227.58 94.71
KF4D-2 KF4D-2-FI-27 34.92 16,539.66 3,204,091.18 50,330.54 1,120.53 4,735.78 11.82 49.72 909.66 226.13 95.90 53.93
KF3C-16 KF3C-16-FI-27 45.01 14,771.87 7,922.29 9,345.80 4,450.76 3,690.31 19.54 98.60 1,611.08 948.43 169.55 108.65
KF4D-2 KF4D-2-FI-10 39.26 5,469.56 5,736.56 7,281.56 33,143.48 2,973.47 15.14 136.65 1,423.11 622.91 139.08 84.25
KF4D-2 KF4D-2-FI-24 125.76 8,263.20 21,664,104.36 230,990.77 9,593.05 16,410.85 73.30 414.03 7,639.79 4,028.07 718.97 448.61
KF3C-16 KF3C-16-FI-43 138.35 11,751.03 17,901.73 23,217.43 5,528.04 10,881.96 37.59 235.96 4,225.83 4,628.12 475.05 266.98
KF3C-16 KF3C-16-FI-30 138.09 13,973.52 28,885.54 34,409.36 8,639.88 13,367.56 64.49 355.60 6,282.93 9,279.66 566.29 396.67
KF3C-16 KF3C-16-FI-31 138.09 13,973.52 28,885.54 34,409.36 8,639.88 13,367.56 64.49 355.60 6,282.93 9,279.66 566.29 396.67
KF3C-16 KF3C-16-FI-37 79.30 8,464.18 9,286.80 11,646.67 3,815.21 10,146.14 24.73 129.09 2,438.08 141.51 285.54 153.60

179
B15D Rb85 Sr88 Mo95 Ag107 Sn118 Cs133 Ba137 La139 W182 Au197 Tl205 Pb208
Location Photo ID µg/g µg/g µg/g µg/g µg/g µg/g µg/g µg/g µg/g µg/g µg/g µg/g
KF4D-2 KF4D-2-FI-7 18.83 1.58 11.36 3.73 37.69 14.27 21.27 4.33 17.56 2.32 1.41 39.48
KF3C-16 KF3C-16-FI-29 42.86 18.79 152.09 47.99 392.94 19.31 143.00 8.44 78.69 25.80 14.78 77.92
KF3C-16 KF3C-16-FI-53 224.07 139.25 719.48 259.80 2,190.33 88.53 737.14 58.55 442.42 174.69 113.09 419.11
KF3C-16 KF3C-16-FI-32 30.88 21.84 114.34 39.22 371.56 13.46 129.98 6.54 74.06 23.71 13.59 77.53
KF3C-16 KF3C-16-FI-32 30.88 21.84 114.34 39.22 371.56 13.46 129.98 6.54 74.06 23.71 13.59 77.53
KF3C-16 KF3C-16-FI-51 42.06 21.07 178.46 68.10 544.14 15.79 166.04 16.53 107.40 35.45 21.85 97.31
KF3C-16 KF3C-16-FI-28 49.40 20.59 163.19 57.57 453.30 17.61 184.29 16.69 116.15 34.00 20.29 92.55
KF3C-16 KF3C-16-FI-40 12.61 142.21 40.60 18.96 175.33 4.79 44.52 3.82 24.86 10.79 5.85 26.87
KF4D-2 KF4D-2-FI-9 12.22 2.16 11.08 4.32 899.69 1.27 12.86 1.28 6.89 2.31 1.70 6.14
KF4D-2 KF4D-2-FI-9 7.56 3.99 65.85 8.67 82.19 3.46 29.77 2.74 48.27 5.76 3.17 15.30
KF3C-16 KF3C-16-FI-26 10.72 50.19 26.28 9.12 82.16 3.59 19.29 1.13 12.02 4.75 3.07 16.72
KF3C-16 KF3C-16-FI-42 23.69 13.53 26.04 10.23 99.22 4.18 30.89 2.80 15.77 5.84 2.30 56.94
KF4D-2 KF4D-2-FI-27 6.29 3.85 27.58 12.10 146.25 3.16 44.15 2.33 15.10 5.79 3.72 12.31
KF3C-16 KF3C-16-FI-27 16.26 6.12 45.69 14.77 108.26 4.31 35.80 3.50 27.19 8.06 4.25 21.40
KF4D-2 KF4D-2-FI-10 8.67 5.11 34.35 11.00 87.55 4.28 31.31 3.35 18.96 7.29 3.24 31.45
KF4D-2 KF4D-2-FI-24 86.52 27.95 170.36 68.73 814.12 21.69 130.19 15.26 93.05 37.90 22.61 88.94
KF3C-16 KF3C-16-FI-43 20.76 42.12 76.61 27.41 460.30 8.91 68.01 8.58 46.39 18.67 12.87 45.25
KF3C-16 KF3C-16-FI-30 34.44 40.71 122.14 43.51 378.67 13.75 111.77 13.14 75.62 25.68 12.87 82.23
KF3C-16 KF3C-16-FI-31 34.44 40.71 122.14 43.51 378.67 13.75 111.77 13.14 75.62 25.68 12.87 82.23
KF3C-16 KF3C-16-FI-37 14.45 18.72 45.70 19.21 153.49 5.59 48.11 4.73 29.27 11.71 6.96 27.41

180
B15C Li7 Na23 Si28 S34 K39 Ca44 V51 Mn55 Fe57 Cu65 Zn66 As75
Location Photo ID µg/g µg/g µg/g µg/g µg/g µg/g µg/g µg/g µg/g µg/g µg/g µg/g
KF4D-2 KF4D-2-FI-3 217.03 6,602.99 78,323,146.07 95,923.30 11,250.10 98,488.42 84.55 477.27 8,583.73 424.61 861.49 511.19
KF4D-2 KF4D-2-FI-3 101.48 27,844.49 23,053.17 29,953.27 86,392.40 12,243.92 58.33 942.21 20,404.15 319.53 572.80 341.25
KF4D-2 KF4D-2-FI-2 111.74 35,544.30 13,444.39 17,313.16 25,499.97 7,408.08 36.75 183.62 3,199.77 8,927.42 5,487.18 200.23
KF3D-19 KF3D-19-FI-27 472.61 18,875.09 84,488.73 107,909.49 28,483.98 44,667.08 208.52 1,166.22 20,209.99 1,021.66 1,959.05 1,256.59
KF3D-19 KF3D-19-FI-25 87.20 18,166.98 16,171.15 20,418.00 5,200.47 8,340.42 34.04 223.84 3,786.13 172.66 355.22 234.37
KF3C-16 KF3C-16-FI-50 37.50 3,464.62 10,664.37 13,261.43 3,339.99 11,995.82 24.08 149.51 2,870.74 152.54 311.35 175.88
KF3C-16 KF3C-16-FI-54 37.50 3,464.62 10,664.37 13,261.43 3,339.99 11,995.82 24.08 149.51 2,870.74 152.54 311.35 175.88
KF4D-2 KF4D-2-FI-29 27.31 5,107.86 3,454,584.05 4,001.39 991.65 5,089.23 10.04 43.52 818.04 51.30 100.70 47.68
KF4D-2 KF4D-2-FI-32 31.88 2,063.72 6,758.52 8,401.87 15,476.43 3,330.48 14.63 90.64 1,574.82 78.31 161.09 97.93
KF4D-2 KF4D-2-FI-32 15.75 572.43 3,193.42 3,971.54 19,452.86 1,529.19 7.05 95.78 1,431.17 37.40 182.43 45.22
KF4D-2 KF4D-2-FI-33 67.28 5,909.72 13,493.80 17,040.58 5,221.34 6,534.70 42.94 184.39 3,121.02 161.36 322.11 196.05
KF4D-2 KF4D-2-FI-7_1 19.88 2,676.40 2,162,033.37 6,850.79 1,734.44 8,396.10 10.58 72.54 1,197.21 56.03 122.05 75.97
KF4D-2 KF4D-2-FI-31 4.48 593.21 6,354,339.32 5,399.43 188.23 9,160.17 1.66 8.14 149.34 36.86 14.77 18.75
KF3C-16 KF3C-16-FI-34_2 5.40 4,941.51 998.87 1,185.02 473.12 850.69 2.28 12.32 203.35 10.54 18.38 13.66
KF4D-2 KF4D-2-FI-35 3.13 794.12 4,327,751.80 5,397.46 718.58 5,443.43 1.56 8.77 255.91 78.49 188.89 9.61
KF3C-16 KF3C-16-FI-25 0.43 52.52 136.79 165.11 41.23 68.25 0.25 1.71 30.58 1.89 2.91 1.91
KF3C-16 KF3C-16-FI-25 0.43 52.52 136.79 165.11 41.23 68.25 0.25 1.71 30.58 1.89 2.91 1.91
KF3C-16 KF3C-16-FI-25 0.43 52.52 136.79 165.11 41.23 68.25 0.25 1.71 30.58 1.89 2.91 1.91
KF3C-16 KF3C-16-FI-25 0.37 71.79 147.20 176.77 44.33 73.26 0.29 1.87 32.09 2.02 3.10 2.11
KF3C-16 KF3C-16-FI-34_1 0.16 71.27 33.39 39.68 18.17 15.61 0.06 0.41 7.18 0.37 0.64 0.45
KF3D-19 KF3D-19-FI-21 0.23 27.38 26.56 33.75 9.90 94.59 1.05 0.38 120.64 0.46 4.40 0.41
KF3D-19 KF3D-19-FI-24 2.49 82.61 287.19 362.24 2,103.83 156.28 3.73 7.12 695.97 3.29 6.71 4.31
KF3D-19 KF3D-19-FI-24 0.76 82.61 117.40 149.55 37.37 61.62 0.28 1.63 28.22 1.44 2.64 1.74

181
B15C Rb85 Sr88 Mo95 Ag107 Sn118 Cs133 Ba137 La139 W182 Au197 Tl205 Pb208
Location Photo ID µg/g µg/g µg/g µg/g µg/g µg/g µg/g µg/g µg/g µg/g µg/g µg/g
KF4D-2 KF4D-2-FI-3 40.90 82.55 178.78 63.49 3,397.68 19.88 193.67 18.94 101.23 36.88 23.78 156.17
KF4D-2 KF4D-2-FI-3 31.32 183.73 126.41 48.71 337.52 11.37 110.80 12.02 82.91 22.13 15.12 65.02
KF4D-2 KF4D-2-FI-2 43.64 82.07 79.96 27.86 213.21 8.96 87.39 7.31 46.90 14.56 10.82 40.19
KF3D-19 KF3D-19-FI-27 120.54 72.84 434.94 158.25 1,267.61 47.80 435.70 47.07 215.87 82.37 69.25 227.16
KF3D-19 KF3D-19-FI-25 22.24 24.45 73.46 24.60 241.28 10.91 72.61 7.78 35.02 15.52 8.38 41.59
KF3C-16 KF3C-16-FI-50 12.61 142.21 40.60 18.96 175.33 4.79 44.52 3.82 24.86 10.79 5.85 26.87
KF3C-16 KF3C-16-FI-54 12.61 142.21 40.60 18.96 175.33 4.79 44.52 3.82 24.86 10.79 5.85 26.87
KF4D-2 KF4D-2-FI-29 5.81 3.42 25.32 8.20 145.43 2.94 58.39 2.07 14.19 4.83 3.31 11.22
KF4D-2 KF4D-2-FI-32 10.09 18.31 45.23 12.09 98.62 3.98 31.42 3.69 27.99 6.79 4.89 20.04
KF4D-2 KF4D-2-FI-32 18.67 13.14 17.28 5.50 47.16 1.68 42.10 1.44 9.59 3.16 2.17 9.13
KF4D-2 KF4D-2-FI-33 17.78 9.71 71.03 25.40 202.91 9.94 73.51 7.18 42.58 13.61 7.96 38.79
KF4D-2 KF4D-2-FI-7_1 7.22 72.44 23.68 7.92 74.31 2.64 21.14 2.12 14.88 3.98 2.01 13.78
KF4D-2 KF4D-2-FI-31 1.81 0.64 3.76 1.33 268.81 0.49 3.94 0.42 2.15 0.84 0.51 1.93
KF3C-16 KF3C-16-FI-34_2 2.17 18.82 4.41 1.79 13.42 1.14 4.06 0.51 2.87 0.93 0.47 2.69
KF4D-2 KF4D-2-FI-35 7.20 1.79 3.29 0.99 208.42 0.45 8.87 0.38 1.96 0.57 0.50 1.87
KF3C-16 KF3C-16-FI-25 0.18 0.17 0.67 0.25 2.06 0.06 0.31 0.05 0.37 0.12 0.04 0.38
KF3C-16 KF3C-16-FI-25 0.18 0.17 0.67 0.25 2.06 0.06 0.31 0.05 0.37 0.12 0.04 0.38
KF3C-16 KF3C-16-FI-25 0.18 0.17 0.67 0.25 2.06 0.06 0.31 0.05 0.37 0.12 0.04 0.38
KF3C-16 KF3C-16-FI-25 0.15 0.16 0.62 0.24 2.22 0.08 0.54 0.05 0.39 0.14 0.07 0.40
KF3C-16 KF3C-16-FI-34_1 0.09 0.09 0.16 0.06 0.44 0.03 0.17 0.02 0.10 0.03 0.02 0.18
KF3D-19 KF3D-19-FI-21 0.06 0.06 0.49 0.12 0.41 0.02 0.82 14.29 0.10 0.07 0.02 0.09
KF3D-19 KF3D-19-FI-24 10.68 0.71 1.56 0.83 7.49 0.19 21.73 0.17 0.84 0.35 0.15 0.74
KF3D-19 KF3D-19-FI-24 0.16 0.92 0.55 0.19 1.75 0.08 0.53 0.06 0.29 0.14 0.08 0.36

182
B15 Li7 Na23 Si28 S34 K39 Ca44 V51 Mn55 Fe57 Cu65 Zn66 As75
Location Sample ID µg/g µg/g µg/g µg/g µg/g µg/g µg/g µg/g µg/g µg/g µg/g µg/g
1086 1086.6-FI-48 705.64 70,197.10 128,954.25 173,981.10 47,266.94 63,640.12 214.78 2,437.46 21,911.24 1,443.33 3,456.37 2,244.88
1193 1193-FI-56 43.42 6,237.02 6,445.23 9,716.01 2,498.32 95,027.61 70.12 5,094.56 28,652.94 131.78 541.57 106.09
1086 1086.6-FI-44 7,972.25 35,461.67 7,595.09 10,203.16 20,167.53 9,773.43 26.35 5,804.37 23,055.21 516.10 5,473.26 131.72
1086 10866-FI-55 23.45 26,390.25 9,376.06 12,885.35 2,372.50 5,013.78 16.01 112.92 1,654.90 7,933.10 270.20 165.74
1086 1086.6-FI-54 147.56 13,207.01 33,758.39 46,006.42 8,709.98 23,080.70 55.15 408.27 5,905.97 6,498.97 926.09 594.72
1086 1086.6-FI-42 59.18 14,162.22 14,047.32 18,932.00 3,740.10 6,783.84 29.16 547.85 2,520.21 3,690.88 646.23 239.65
1201 1201-FI-48 51.88 9,061.98 8,458.04 9,812.82 5,119.04 4,238.44 18.72 109.84 1,589.07 107.08 204.15 130.48

183
B15 Rb85 Sr88 Mo95 Ag107 Sn118 Cs133 Ba137 La139 W182 Au197 Tl205 Pb208
Location Sample ID µg/g µg/g µg/g µg/g µg/g µg/g µg/g µg/g µg/g µg/g µg/g µg/g
1086 1086.6-FI-48 463.55 9,416.29 452.91 207.32 1,663.89 111.57 1,028.21 40.84 269.69 91.25 68.39 366.65
1193 1193-FI-56 9.64 165.49 28.06 12.49 79.73 2.79 22.65 12.61 19.43 6.25 2.59 76.92
1086 1086.6-FI-44 93.56 184.60 27.56 13.35 276.88 15.03 35.96 5.08 15.27 7.39 4.84 1,084.49
1086 10866-FI-55 27.29 30.09 31.13 12.35 122.49 3.02 15.24 1.79 13.68 6.81 4.59 46.88
1086 1086.6-FI-54 31.79 21.22 133.17 53.34 438.51 16.39 120.07 11.79 65.43 21.75 17.26 89.83
1086 1086.6-FI-42 30.97 8.31 51.47 24.13 538.51 6.99 60.40 5.25 30.47 11.32 4.41 69.53
1201 1201-FI-48 16.37 10.57 40.66 13.34 134.71 4.64 43.06 3.49 27.44 8.56 5.59 35.46

184
B30D Li7 Na23 Si28 S34 K39 Ca44 V51 Mn55 Fe57 Cu65 Zn66 As75
Location Sample ID µg/g µg/g µg/g µg/g µg/g µg/g µg/g µg/g µg/g µg/g µg/g µg/g
1343 1343-FI-52 1,202.44 76,763.88 55,505.25 72,432.55 15,203.78 43,878.83 348.34 5,108.82 54,662.55 894.18 4,161.16 911.06
1086 1086.6-FI-45 495.94 37,379.75 59,667.65 81,329.60 29,658.55 74,329.21 687.30 1,952.60 10,727.61 671.21 1,540.47 1,045.08
1086 1086.6-FI-50 12.56 1,359.89 2,936.38 12,229.31 819.29 137,280.42 5.31 13,799.45 35,566.55 29.19 1,865.31 50.55
1086 1086.6-FI-75 96.89 49,691.00 16,730.72 22,111.75 38,788.70 16,546.64 39.86 3,422.41 10,669.16 3,277.17 3,489.96 288.05
1193 1193-FI-40_2 110.98 47,104.15 12,323.40 21,748.18 15,534.89 18,095.32 31.45 4,620.76 4,059.47 416.63 1,645.74 240.21
1201 1201-FI-51 146.67 30,683.93 23,493.96 26,451.42 17,675.24 11,429.59 49.37 2,832.72 4,665.07 1,468.72 1,214.79 354.80
1201 1201-FI-51 146.67 30,683.93 23,493.96 26,451.42 17,675.24 11,429.59 49.37 2,832.72 4,665.07 1,468.72 1,214.79 354.80
1193 1193-FI-36 134.37 26,695.44 10,520.46 12,518.86 12,476.75 7,762.09 29.15 176.04 2,314.45 156.27 301.38 179.55
1343 1343-FI-14 19.96 2,947.48 3,854.69 4,576.55 1,226.00 2,304.54 8.55 150.50 804.18 431.85 274.22 56.17
1086 1086.6-FI-71 189.60 17,972.40 7,212.08 9,463.49 8,475.83 11,437.06 136.05 148.80 33,780.29 2,313.94 269.65 125.75
1201 1201-Fi-53 1,786.08 20,144.53 319,688.63 338,768.84 93,769.49 154,854.81 813.50 4,118.67 67,258.00 3,970.94 7,329.52 4,833.70
1086 1086.6-FI-49 203.78 17,680.19 43,013.68 57,484.35 11,370.51 21,379.77 92.02 523.61 7,913.53 12,224.13 1,234.42 755.54
1193 1193-FI-42 442.46 9,661.41 45,659.40 74,638.32 12,243.64 28,197.44 124.95 578.65 9,795.47 656.82 1,296.31 839.35
1201 1201-FI-52 46.91 15,744.91 4,098.37 4,555.67 5,943.22 7,592.03 8.39 51.36 787.42 48.77 95.18 61.06
1201 1201-FI-52 124.21 18,374.74 20,571.23 23,005.04 6,073.34 9,766.69 46.07 258.89 3,971.29 283.33 467.11 304.28
1343 1343-FI-52 403.15 89,536.69 80,857.00 101,510.36 33,295.30 70,213.02 152.37 17,513.24 31,252.25 854.44 11,100.47 1,261.21
1343 1343-FI-15 703.58 19,118.99 91,315.64 110,214.93 28,942.21 86,456.59 263.43 1,200.22 22,229.30 1,319.85 2,196.24 1,340.36
1201 1201-FI-46 95.84 16,461.33 5,031.20 5,793.15 1,698.48 3,710.06 10.99 449.96 972.70 65.58 125.32 77.49
1201 1201-FI-47 26.50 13,519.66 6,794.15 7,995.80 8,278.01 4,580.59 15.27 1,100.05 1,353.55 145.37 273.46 106.38
1086 1086.6-FI-72 51.03 4,607.22 6,973.34 9,167.97 2,481.55 24,935.57 14.36 207.76 1,344.58 276.21 180.62 121.02
1201 1201.1-FI-37 199.36 10,315.44 55,844.56 61,260.35 16,312.24 26,963.43 122.34 711.71 11,044.91 720.51 1,371.62 845.51
1193 1193-FI-40 105.42 7,136.87 17,885.70 29,646.43 9,214.38 12,370.29 44.49 230.17 3,668.45 265.99 490.14 327.03
1201 1201-FI-45 51.64 15,416.59 11,836.14 13,042.06 4,942.10 5,540.31 23.68 146.18 2,293.01 124.98 279.15 175.26
1201 1201-FI-49 166.67 13,223.54 22,786.12 26,202.87 7,433.03 11,546.21 70.41 977.91 4,846.20 1,254.08 831.99 359.10
1193 1193-FI-45 481.58 11,892.88 74,486.60 125,270.68 19,823.92 48,422.22 172.43 960.07 15,600.50 1,113.55 2,123.84 1,391.86

185
B30D Rb85 Sr88 Mo95 Ag107 Sn118 Cs133 Ba137 La139 W182 Au197 Tl205 Pb208
Location Sample ID µg/g µg/g µg/g µg/g µg/g µg/g µg/g µg/g µg/g µg/g µg/g µg/g
1343 1343-FI-52 67.56 182.73 225.92 100.92 778.48 41.81 358.29 22.53 160.09 63.73 40.21 1,399.07
1086 1086.6-FI-45 66.23 2,252.26 211.58 108.04 8,644.64 56.22 208.88 21.33 104.82 48.21 35.32 803.38
1086 1086.6-FI-50 12.52 126.81 9.74 3.79 117.90 2.35 17.54 15.63 4.91 1.86 1.29 744.87
1086 1086.6-FI-75 228.38 179.54 90.46 33.48 296.56 30.03 152.24 291.99 275.43 17.23 10.61 990.19
1193 1193-FI-40_2 58.16 205.58 53.98 24.01 181.75 8.84 340.59 5.11 36.61 13.04 9.39 424.66
1201 1201-FI-51 80.04 67.79 117.74 41.44 302.99 11.41 95.29 7.07 74.57 21.27 15.85 332.26
1201 1201-FI-51 80.04 67.79 117.74 41.44 302.99 11.41 95.29 7.07 74.57 21.27 15.85 332.26
1193 1193-FI-36 40.65 67.64 63.01 23.55 157.16 8.54 68.48 7.24 36.41 15.30 8.52 104.88
1343 1343-FI-14 7.19 18.47 20.14 7.11 99.99 3.60 18.40 2.01 12.81 3.88 2.41 64.82
1086 1086.6-FI-71 60.60 34.00 37.27 15.44 120.52 248.98 24.65 4.22 23.01 15.46 3.68 22.55
1201 1201-Fi-53 471.34 176.37 2,052.76 648.70 4,320.00 174.03 1,772.02 196.46 1,103.94 380.62 258.22 1,096.07
1086 1086.6-FI-49 43.84 99.05 193.31 78.62 595.60 20.08 168.56 21.42 107.73 40.34 32.67 123.67
1193 1193-FI-42 63.62 49.33 263.11 91.75 642.32 26.84 274.95 8,742.43 183.91 62.75 39.60 2,800.53
1201 1201-FI-52 50.43 76.50 237.76 5.37 55.49 5.16 18.27 0.85 11.91 3.00 1.04 55.24
1201 1201-FI-52 21.20 96.26 76.25 23.85 269.08 11.99 68.48 4.26 52.43 15.43 5.21 85.39
1343 1343-FI-52 85.97 240.88 225.43 109.03 1,008.70 107.63 529.23 11.22 268.87 53.11 37.64 3,645.38
1343 1343-FI-15 174.22 66.56 574.52 209.97 10,112.80 66.51 561.43 69.90 358.88 126.56 73.96 325.54
1201 1201-FI-46 25.13 17.38 20.54 7.87 71.02 9.26 16.56 1.95 14.41 4.20 2.38 15.76
1201 1201-FI-47 21.77 21.70 32.33 13.32 101.50 12.72 23.73 3.74 18.60 6.81 3.41 132.30
1086 1086.6-FI-72 12.80 34.39 24.82 11.49 93.07 4.06 31.99 3.32 16.64 6.01 4.51 53.22
1201 1201.1-FI-37 70.97 26.78 329.33 109.44 740.12 35.09 295.65 32.98 172.24 63.98 37.49 171.98
1193 1193-FI-40 27.47 12.33 82.66 34.19 251.30 10.27 88.10 8.71 263.27 19.60 13.20 54.88
1201 1201-FI-45 11.78 14.95 51.77 18.29 155.29 3.98 42.31 5.40 34.71 8.45 2.90 32.97
1201 1201-FI-49 688.80 36.36 149.30 51.52 316.84 15.28 160.03 12.24 92.22 30.03 20.07 169.88
1193 1193-FI-45 110.75 82.95 373.66 151.95 1,023.07 48.20 458.95 39.22 248.59 90.49 58.99 232.51

186
B30H Li7 Na23 Si28 S34 K39 Ca44 V51 Mn55 Fe57 Cu65 Zn66 As75
Location Sample ID µg/g µg/g µg/g µg/g µg/g µg/g µg/g µg/g µg/g µg/g µg/g µg/g
1086 1086.-FI-59 203.34 86,377.82 46,361.57 63,135.73 54,183.16 59,788.19 72.48 37,307.30 41,882.94 800.72 16,667.05 804.46
1086 1086.6-FI-58 527.08 71,527.77 46,397.31 64,131.05 57,399.81 84,838.69 85.99 22,211.67 28,241.97 506.81 10,941.48 817.16
1086 1086.6-FI-53 931.90 85,696.68 255,478.14 345,454.68 126,538.95 122,128.11 453.61 60,221.51 102,465.84 2,808.86 26,293.68 4,494.83
1086 1086.6-FI-43 545.22 56,684.48 104,277.97 139,125.21 77,329.54 98,368.48 5,284.97 8,957.08 19,582.88 1,257.81 6,484.56 1,825.40
1086 1086.6-FI-52 635.30 94,456.44 31,638.14 41,873.35 57,136.71 42,921.70 68.16 23,776.90 21,603.86 433.55 12,381.57 543.22
1086 1086.6-FI-76 55.29 93,225.40 23,944.77 31,503.99 73,481.04 33,927.58 44.03 26,320.82 37,506.21 706.40 8,478.66 412.07
1086 1086.6-FI-73 121.17 120,490.51 25,743.82 33,005.34 29,258.70 14,318.08 46.05 8,435.62 24,892.19 2,390.41 5,111.09 430.35
1086 1086.6-FI-61 196.69 74,132.59 48,190.05 61,239.60 69,655.43 71,617.14 97.57 13,381.76 29,429.36 556.75 5,816.24 814.22
1086 1086.6-FI-78 196.69 74,132.59 48,190.05 61,239.60 69,655.43 71,617.14 97.57 13,381.76 29,429.36 556.75 5,816.24 814.22
1086 1086.6-FI-64 159.15 99,971.52 23,057.35 29,301.41 45,145.57 41,052.58 51.87 9,154.13 9,993.78 278.53 2,473.37 393.04
1086 1086.6-FI-47 146.40 81,951.90 36,059.62 48,784.12 48,719.51 71,676.56 67.96 2,529.44 6,288.37 401.29 937.86 618.38

187
B30H Rb85 Sr88 Mo95 Ag107 Sn118 Cs133 Ba137 La139 W182 Au197 Tl205 Pb208
Location Sample ID µg/g µg/g µg/g µg/g µg/g µg/g µg/g µg/g µg/g µg/g µg/g µg/g
1086 1086.-FI-59 286.75 1,258.71 154.95 75.41 632.50 55.68 1,002.76 21.67 85.63 36.14 21.22 2,582.50
1086 1086.6-FI-58 335.58 856.35 171.67 73.68 661.81 37.64 992.64 41.89 92.52 40.89 27.47 1,572.82
1086 1086.6-FI-53 727.32 718.84 954.19 406.09 7,381.42 99.26 396.72 97.91 489.54 170.93 129.04 2,680.83
1086 1086.6-FI-43 877.33 1,548.21 425.50 189.67 1,382.26 57.66 510.92 49.38 188.85 91.03 75.84 13,650.00
1086 1086.6-FI-52 272.15 1,264.39 120.27 50.99 406.31 38.81 1,015.26 13.25 73.70 29.45 15.04 1,901.44
1086 1086.6-FI-76 371.13 1,034.21 95.23 31.68 326.49 23.98 1,338.54 9.52 58.56 19.02 10.58 1,507.53
1086 1086.6-FI-73 235.22 249.43 83.76 34.62 737.43 19.65 71.71 8.44 63.15 17.94 10.74 1,606.41
1086 1086.6-FI-61 354.15 1,108.49 237.30 484.85 614.86 63.28 692.28 20.59 152.38 39.51 25.76 1,387.78
1086 1086.6-FI-78 354.15 1,108.49 237.30 484.85 614.86 63.28 692.28 20.59 152.38 39.51 25.76 1,387.78
1086 1086.6-FI-64 276.47 3,899.61 100.20 36.82 462.06 45.05 713.80 11.96 58.88 21.65 12.29 555.33
1086 1086.6-FI-47 461.11 10,712.93 127.98 53.17 753.43 112.68 1,161.67 15.52 68.89 29.25 16.16 200.23
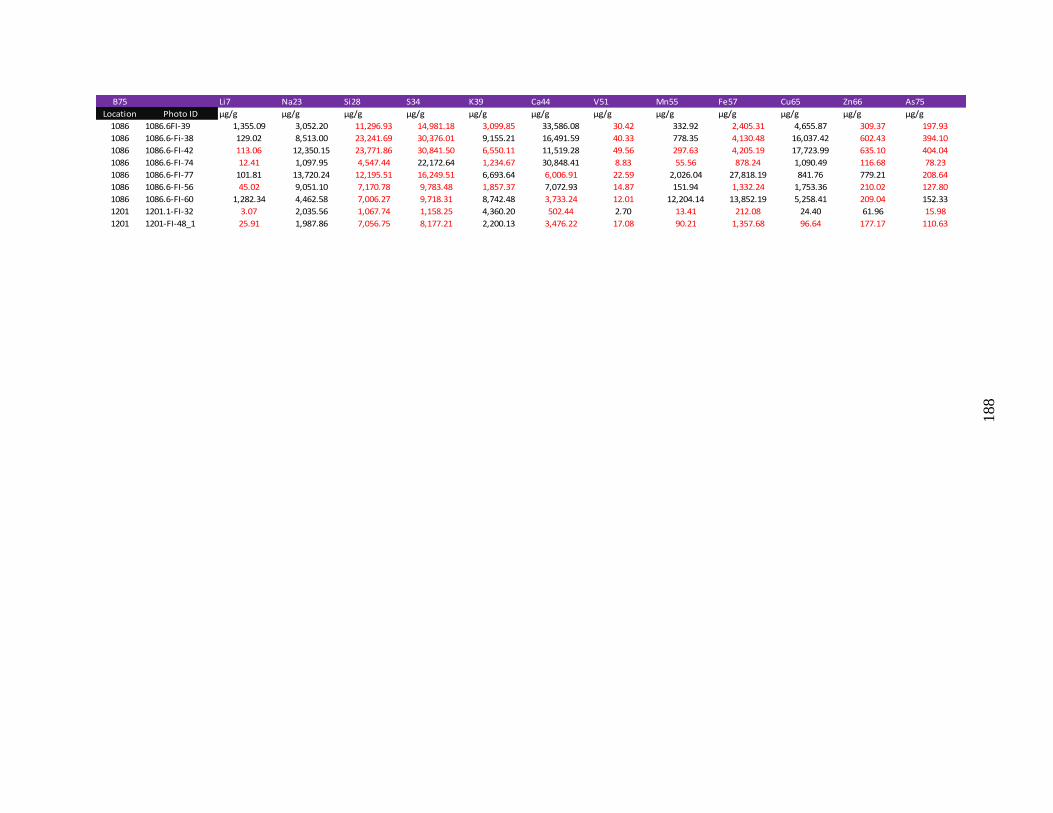
188
B75 Li7 Na23 Si28 S34 K39 Ca44 V51 Mn55 Fe57 Cu65 Zn66 As75
Location Photo ID µg/g µg/g µg/g µg/g µg/g µg/g µg/g µg/g µg/g µg/g µg/g µg/g
1086 1086.6FI-39 1,355.09 3,052.20 11,296.93 14,981.18 3,099.85 33,586.08 30.42 332.92 2,405.31 4,655.87 309.37 197.93
1086 1086.6-Fi-38 129.02 8,513.00 23,241.69 30,376.01 9,155.21 16,491.59 40.33 778.35 4,130.48 16,037.42 602.43 394.10
1086 1086.6-FI-42 113.06 12,350.15 23,771.86 30,841.50 6,550.11 11,519.28 49.56 297.63 4,205.19 17,723.99 635.10 404.04
1086 1086.6-FI-74 12.41 1,097.95 4,547.44 22,172.64 1,234.67 30,848.41 8.83 55.56 878.24 1,090.49 116.68 78.23
1086 1086.6-FI-77 101.81 13,720.24 12,195.51 16,249.51 6,693.64 6,006.91 22.59 2,026.04 27,818.19 841.76 779.21 208.64
1086 1086.6-FI-56 45.02 9,051.10 7,170.78 9,783.48 1,857.37 7,072.93 14.87 151.94 1,332.24 1,753.36 210.02 127.80
1086 1086.6-FI-60 1,282.34 4,462.58 7,006.27 9,718.31 8,742.48 3,733.24 12.01 12,204.14 13,852.19 5,258.41 209.04 152.33
1201 1201.1-FI-32 3.07 2,035.56 1,067.74 1,158.25 4,360.20 502.44 2.70 13.41 212.08 24.40 61.96 15.98
1201 1201-FI-48_1 25.91 1,987.86 7,056.75 8,177.21 2,200.13 3,476.22 17.08 90.21 1,357.68 96.64 177.17 110.63

189
B75 Rb85 Sr88 Mo95 Ag107 Sn118 Cs133 Ba137 La139 W182 Au197 Tl205 Pb208
Location Photo ID µg/g µg/g µg/g µg/g µg/g µg/g µg/g µg/g µg/g µg/g µg/g µg/g
1086 1086.6FI-39 16.73 74.95 73.40 22.58 156.83 8.62 69.33 5.67 36.35 14.94 9.74 165.58
1086 1086.6-Fi-38 24.42 23.37 97.80 41.05 1,275.52 11.68 100.09 8.63 61.09 19.38 10.91 131.05
1086 1086.6-FI-42 28.94 26.13 125.74 44.32 507.83 12.92 97.44 11.47 71.31 26.38 14.46 74.24
1086 1086.6-FI-74 4.71 111.96 18.28 7.15 59.23 1.96 23.38 5.09 11.50 3.87 1.53 13.75
1086 1086.6-FI-77 42.76 83.87 59.84 70.69 162.06 6.76 59.82 6.76 30.83 12.16 7.25 111.08
1086 1086.6-FI-56 7.57 5.55 33.26 132.43 96.82 4.10 19.26 3.24 17.47 7.47 2.98 21.49
1086 1086.6-FI-60 69.86 10.36 25.56 13.10 98.60 3.66 130.26 1,505.15 15.38 6.21 3.41 18.11
1201 1201.1-FI-32 1.38 3.26 5.48 1.38 21.26 0.41 4.41 0.52 3.41 1.04 0.39 3.63
1201 1201-FI-48_1 9.84 15.33 37.11 14.03 98.29 3.13 19.50 4.08 25.18 7.37 4.34 22.51

190
B20C Li7 Na23 Si28 S34 K39 Ca44 V51 Mn55 Fe57 Cu65 Zn66 As75
Location Photo ID µg/g µg/g µg/g µg/g µg/g µg/g µg/g µg/g µg/g µg/g µg/g µg/g
1343 1343-FI-48 189.05 32,211.18 33,633.64 40,684.57 8,565.43 26,099.52 64.73 3,056.73 6,307.10 379.96 1,611.55 501.94
1193 1193-FI-49 71.90 8,058.73 11,260.15 15,341.81 4,061.37 10,504.38 21.16 537.76 1,985.88 116.70 267.71 167.24
1343 1343-FI-66 77.62 15,303.06 16,402.35 56,062.15 4,718.20 7,439.48 30.27 2,330.00 4,503.52 159.83 659.68 217.96
1193 1193-FI-38 46.90 7,454.38 8,677.59 10,456.12 2,501.26 4,416.84 1,212.68 114.77 1,805.53 4,052.18 242.04 149.90
1193 1193-FI-40_1 45.06 6,785.81 10,006.29 16,857.69 3,352.53 6,923.92 22.01 130.80 2,052.87 142.07 276.70 184.16
1343 1343-FI-65 104.59 8,642.89 6,240.70 7,259.22 6,651.26 15,568.41 9.88 2,801.12 5,767.74 54.48 1,266.44 81.91
1193 1193-FI-49 71.90 8,058.73 11,260.15 15,341.81 4,061.37 10,504.38 21.16 537.76 1,985.88 116.70 267.71 167.24
1193 1193-FI-37 37.96 5,560.52 3,389.13 3,985.31 975.72 1,699.08 9.59 44.09 689.02 50.15 93.04 57.14
1343 1343-FI-71 73.47 3,245.51 4,898.46 19,428.05 1,441.74 2,258.72 9.29 58.37 16,556.95 261.08 101.64 93.97
1343 1343-FI-8 103.79 3,245.51 18,354.62 22,124.97 7,740.81 9,066.56 51.23 245.45 4,291.08 351.93 454.69 267.00
1343 1343-FI-53 28.87 2,462.65 4,948.06 6,042.35 1,267.24 3,488.19 10.36 584.74 1,321.04 52.32 194.21 73.09
1343 1343-FI-53 51.81 2,462.65 7,378.91 8,990.65 1,887.06 4,257.06 15.39 242.13 1,430.71 76.24 178.97 109.37
1343 1343-FI-24 22.24 2,462.65 4,848.78 5,699.53 1,545.27 2,307.07 10.33 62.58 1,064.68 56.89 101.94 68.20
1343 1343-FI-62 35.61 1,671.93 5,565.53 6,637.80 2,317.90 9,027.91 11.70 76.11 1,015.33 158.81 124.18 76.90
1343 1343-FI-62 3.47 1,671.93 584.10 689.54 252.86 298.49 1.29 16.07 110.78 54.15 12.76 8.01
1193 1193-FI-32 0.19 70.02 65.20 75.91 18.74 31.93 0.14 0.84 12.98 3.14 1.66 1.62
1193 1193-FI-32 0.79 51.80 147.90 172.92 42.58 72.35 0.32 1.90 27.23 7.57 3.92 3.33
1193 1193-FI-34 1.42 47.59 263.06 305.08 75.95 124.65 0.53 3.39 50.88 11.44 6.82 4.32
1201 1201.1-FI-34 0.52 53.24 112.12 121.93 32.88 53.94 0.26 1.42 21.82 1.28 2.53 1.70
1201 1201-FI-44 0.47 32.82 142.30 157.92 41.92 68.86 0.32 1.79 27.63 1.75 3.33 2.14
1343 1343-FI-72 0.23 82.61 36.53 42.93 34.35 97.04 0.07 1.37 49.69 3.28 1.59 0.51
1343 1343-FI-12 0.67 82.61 95.61 113.02 30.03 90.40 0.22 1.22 30.59 41.67 5.44 1.37
1343 1343-FI-25 0.47 82.61 105.62 123.43 33.94 70.08 0.23 16.10 22.82 1.18 6.64 1.46

191
B20C Rb85 Sr88 Mo95 Ag107 Sn118 Cs133 Ba137 La139 W182 Au197 Tl205 Pb208
Location Photo ID µg/g µg/g µg/g µg/g µg/g µg/g µg/g µg/g µg/g µg/g µg/g µg/g
1343 1343-FI-48 31.00 754.82 92.76 41.13 387.78 12.79 168.95 7.81 94.61 20.02 13.82 885.13
1193 1193-FI-49 12.66 76.62 41.60 17.29 139.67 3.69 47.37 5.14 29.24 9.93 5.57 136.19
1343 1343-FI-66 19.24 713.57 77.75 21.74 198.86 5.33 629.23 6.05 47.14 10.18 7.96 342.06
1193 1193-FI-38 14.43 10.11 54.99 20.52 133.73 5.84 46.61 6.60 31.72 12.74 8.44 29.76
1193 1193-FI-40_1 11.48 16.79 43.27 17.91 138.73 6.05 38.75 4.85 42.84 8.78 5.54 29.89
1343 1343-FI-65 19.58 136.69 21.45 8.05 73.92 10.47 55.20 0.90 14.99 3.53 2.56 472.08
1193 1193-FI-49 12.66 76.62 41.60 17.29 139.67 3.69 47.37 5.14 29.24 9.93 5.57 136.19
1193 1193-FI-37 3.76 3.26 18.95 7.79 50.05 2.29 47.99 1.81 10.27 4.21 2.53 10.56
1343 1343-FI-71 4.43 33.00 18.69 30.76 61.15 2.30 16.11 1.64 14.56 3.33 1.35 65.48
1343 1343-FI-8 27.67 16.21 118.66 42.41 278.12 10.68 117.71 13.12 63.68 26.61 17.00 92.84
1343 1343-FI-53 5.54 10.99 17.43 6.43 56.37 3.08 18.23 1.82 16.65 4.00 3.07 102.41
1343 1343-FI-53 11.21 13.88 27.67 10.55 88.63 4.34 24.63 2.61 21.45 5.82 2.34 21.49
1343 1343-FI-24 6.56 5.14 27.85 9.04 64.98 2.84 23.53 2.58 15.10 4.58 3.05 14.08
1343 1343-FI-62 6.09 3.70 21.05 7.77 62.53 2.23 17.64 1.81 16.47 4.42 2.61 15.41
1343 1343-FI-62 0.83 1.46 2.21 0.74 6.56 0.24 1.49 0.20 1.51 0.44 0.16 9.11
1193 1193-FI-32 0.08 0.05 0.29 0.12 1.17 0.03 0.28 0.02 0.20 0.06 0.04 0.20
1193 1193-FI-32 0.19 0.09 0.80 0.29 2.30 0.10 0.74 0.07 0.45 0.15 0.09 0.42
1193 1193-FI-34 0.34 0.12 1.21 0.50 3.68 0.16 1.44 0.13 0.75 0.29 0.11 0.80
1201 1201.1-FI-34 0.15 0.09 0.54 0.19 1.50 0.05 0.49 0.05 0.38 0.10 0.06 0.47
1201 1201-FI-44 0.18 0.10 0.74 0.26 1.95 0.08 0.73 0.05 0.43 0.14 0.09 0.46
1343 1343-FI-72 0.04 0.38 0.16 0.06 0.95 0.02 0.41 0.01 0.11 0.03 0.01 0.33
1343 1343-FI-12 0.13 0.42 0.47 0.17 1.38 0.05 0.45 0.03 0.29 0.09 0.05 0.97
1343 1343-FI-25 0.12 0.89 0.45 0.15 3.59 0.06 0.42 0.05 0.27 0.07 0.03 3.82

192
B75C Li7 Na23 Si28 S34 K39 Ca44 V51 Mn55 Fe57 Cu65 Zn66 As75
Location Photo ID µg/g µg/g µg/g µg/g µg/g µg/g µg/g µg/g µg/g µg/g µg/g µg/g
1343 1343-FI-50 21.93 11,640.56 3,391.75 4,094.17 1,501.24 2,070.88 7.41 48.68 640.64 157.33 82.65 50.46
1201 1201.1-FI-40 144.74 6,193.47 30,438.85 33,326.94 8,953.24 14,461.58 63.94 390.07 6,161.03 391.57 700.43 447.28
1201 1201-Fi-53 59.63 9,238.89 16,350.00 17,138.70 4,775.57 7,607.14 32.29 414.93 2,944.97 156.80 361.52 236.54
1343 1343-FI-51 165.41 9,398.20 36,950.92 44,989.43 9,456.16 31,197.60 66.65 428.19 7,421.73 782.66 867.52 554.75
1343 1343-FI-13 80.66 4,028.36 17,956.14 21,377.19 5,654.17 8,740.15 45.62 232.28 4,110.73 453.52 396.38 264.23
1343 1343-FI-49 93.41 7,879.70 16,405.60 20,360.08 4,177.22 11,062.69 30.68 1,157.64 3,302.73 449.53 835.86 253.29
1201 1201-FI-52 124.21 18,374.74 20,571.23 23,005.04 6,073.34 9,766.69 46.07 258.89 3,971.29 283.33 467.11 304.28
1201 1201-FI-52_1 124.21 18,374.74 20,571.23 23,005.04 6,073.34 9,766.69 46.07 258.89 3,971.29 283.33 467.11 304.28
1193 1193-FI-59 129.46 3,222.50 17,381.99 29,164.84 4,630.07 10,975.94 41.16 221.16 3,593.06 596.05 477.73 324.01
1343 1343-FI-60 19.58 4,807.29 2,702.68 3,249.27 3,267.73 1,419.31 5.87 49.32 4,472.36 93.25 100.20 37.50
1201 1201.1-FI-39 35.89 2,629.34 7,548.94 8,310.64 2,216.43 3,503.33 19.08 95.48 1,489.21 87.93 177.54 116.33
1343 1343-FI-57 52.90 1,671.93 8,223.00 9,758.65 2,139.09 4,494.98 16.77 276.16 1,682.05 86.04 576.86 114.95
1086 1086.6-FI-56 0.55 50.84 151.55 204.93 75.07 72.45 0.27 35.72 60.78 1.67 15.60 2.67
1201 1201.1-FI-36 0.23 51.57 59.26 80.78 47.44 28.08 0.13 0.74 252.55 0.66 1.94 0.89
1201 1201.1-FI-35 0.21 56.93 37.02 40.29 35.39 22.79 0.08 1.35 8.77 0.42 0.87 0.55
1201 1201.1-FI-39 4.56 71.83 551.41 608.48 162.80 260.65 1.44 7.01 110.19 7.05 12.86 8.36
1201 1201.1-FI-39 0.48 40.70 107.95 118.29 31.66 62.65 0.27 1.35 20.75 1.37 2.51 1.60
1343 1343-FI-54 0.57 82.61 80.81 98.59 24.33 46.71 0.14 2.81 15.79 2.19 3.36 1.21
1343 1343-FI-61 1.01 82.61 247.54 291.99 66.88 125.65 0.44 22.59 46.01 3.21 17.70 3.31
1343 1343-FI-73 0.09 82.61 19.41 22.60 6.35 9.21 0.04 0.95 3.84 0.71 3.94 0.26

193
B75C Rb85 Sr88 Mo95 Ag107 Sn118 Cs133 Ba137 La139 W182 Au197 Tl205 Pb208
Location Photo ID µg/g µg/g µg/g µg/g µg/g µg/g µg/g µg/g µg/g µg/g µg/g µg/g
1343 1343-FI-50 4.17 192.56 12.59 5.02 40.47 1.52 14.29 1.09 8.92 2.88 1.84 9.67
1201 1201.1-FI-40 41.20 22.36 149.19 55.08 409.19 15.37 136.27 10.23 103.41 28.33 12.52 94.75
1201 1201-Fi-53 19.36 4.49 72.84 24.64 269.27 7.34 47.35 3.45 48.88 11.02 6.90 50.78
1343 1343-FI-51 40.16 19.96 126.59 49.10 442.95 17.53 134.16 14.51 110.30 29.32 17.74 106.72
1343 1343-FI-13 28.16 15.83 112.71 40.89 265.66 14.06 105.09 7.85 69.79 20.46 14.30 97.03
1343 1343-FI-49 16.07 43.73 57.15 23.40 203.66 5.85 64.91 2.83 36.71 12.97 8.56 240.73
1201 1201-FI-52 21.20 96.26 76.25 23.85 269.08 11.99 68.48 4.26 52.43 15.43 5.21 85.39
1201 1201-FI-52_1 21.20 96.26 76.25 23.85 269.08 11.99 68.48 4.26 52.43 15.43 5.21 85.39
1193 1193-FI-59 20.56 13.39 73.97 32.05 244.30 9.43 77.28 7.54 73.22 17.58 11.50 55.26
1343 1343-FI-60 3.17 110.11 10.51 4.29 31.79 1.67 10.10 1.01 8.43 2.09 1.59 8.01
1201 1201.1-FI-39 10.55 5.32 38.33 13.04 103.58 4.60 33.57 3.55 23.25 7.26 4.34 22.58
1343 1343-FI-57 9.95 40.93 30.82 11.20 92.85 3.92 32.23 3.24 19.64 7.42 4.74 105.41
1086 1086.6-FI-56 0.43 0.43 0.57 0.24 4.38 0.06 0.24 0.06 0.29 0.10 0.08 1.59
1201 1201.1-FI-36 0.07 0.16 0.30 0.09 0.81 0.02 0.25 0.03 0.17 0.05 0.02 0.47
1201 1201.1-FI-35 0.11 0.07 0.20 0.06 0.48 0.02 0.19 0.02 0.12 0.04 0.02 0.39
1201 1201.1-FI-39 0.68 0.48 3.25 1.02 7.79 0.33 3.00 0.18 1.76 0.53 0.32 1.75
1201 1201.1-FI-39 0.13 0.21 0.58 0.20 1.41 0.05 0.49 0.05 0.34 0.10 0.06 0.33
1343 1343-FI-54 0.08 0.17 0.26 0.12 0.95 0.03 0.31 0.02 0.21 0.06 0.04 0.26
1343 1343-FI-61 0.24 0.57 0.85 0.27 2.85 0.08 0.72 0.08 0.56 0.14 0.05 7.76
1343 1343-FI-73 0.04 0.08 0.09 0.03 0.29 0.01 0.07 0.01 0.06 0.02 0.01 1.46

194
APPENDIX G
SUMMARY OF LA-ICP-MS DATA
Summary of all absolute values from unprocessed LA-ICP-MS data for all analyzed
inclusion groups from the hanging wall and footwall. The concentration of each element within
an inclusion group is summarized and includes the percent of inclusions within a group that were
above the limit of detection, the minimum and maximum concentrations of that element, the
range between that elements maximum and minimum concentration, the average overall
concentration of that element, and the overall standard deviation for that element. If elements had
smaller mode ranges within an inclusion group, their mode ranges are summarized in the rows
underneath the summary of the overall concentrations of that element.

195
Inclusions type
{ # of analyzed inclusions }
[ % of inclusions analyzed
within a group]
Na K Fe Cu Sr Ba Au Pb Mo Cs Rb Zn Mn Ca Sn% of inclusions >LOD 100% 43% 43% 71% 86% 29% 0% 86% 0% 29% 86% 43% 57% 52% 24%
Min (ppm) 6237.02 2498.32 5905.97 131.78 10.57 35.96 n/a 35.46 n/a 15.03 9.64 541.57 547.85 2304.54 99.99
Max (ppm) 70197.10 47266.94 28652.94 7933.10 9416.29 1028.21 n/a 1084.49 n/a 111.57 463.55 5473.26 5804.37 137280.42 10112.80
Range(ppm) 63960.07 44768.62 22746.97 7801.32 9405.72 992.24 n/a 1049.04 n/a 96.54 453.91 4931.68 5256.52 134975.88 10012.81
Average (ppm) 24959.61 18762.96 19204.70 3754.17 1638.04 n/a n/a 279.99 n/a n/a 106.90 2220.35 3471.06 35787.93 3232.07
Standard dev (ppm) 22423.01 20535.70 11852.26 3485.98 3811.31 na/ n/a 413.38 n/a n/a 177.28 2817.58 2428.55 42462.76 4784.29
% of inclusions >LOD n/a n/a n/a n/a n/a n/a n/a 67% n/a n/a 67% n/a n/a n/a n/a
Min (ppm) n/a n/a n/a n/a n/a n/a n/a 35.46 n/a n/a 9.64 n/a n/a n/a n/a
Max (ppm) n/a n/a n/a n/a n/a n/a n/a 76.92 n/a n/a 30.97 n/a n/a n/a n/a
Range(ppm) n/a n/a n/a n/a n/a n/a n/a 41.46 n/a n/a 21.33 n/a n/a n/a n/a
Average (ppm) n/a n/a n/a n/a n/a n/a n/a 57.20 n/a n/a 21.07 n/a n/a n/a n/a
Standard dev (ppm) n/a n/a n/a n/a n/a n/a n/a 19.32 n/a n/a 9.82 n/a n/a n/a n/a
% of inclusions >LOD 100% 68% 24% 44% 84% 20% 4% 72% 0% 44% 60% 44% 60% 91% 24%
Min (ppm) 1359.89 819.29 4059.47 145.37 14.95 17.54 15.46 15.76 n/a 2.35 7.19 180.62 148.80 14318.08 99.99
Max (ppm) 89536.69 38788.70 54662.55 12224.13 2252.26 529.23 15.46 3645.38 n/a 248.98 688.80 11100.47 17513.24 98368.48 10112.80
Range(ppm) 88176.79 37969.41 50603.08 12078.76 2237.31 511.69 0.00 3629.62 n/a 246.63 681.61 10919.85 17364.44 84050.40 10012.81
Average (ppm) 24164.67 13505.55 28331.71 2012.76 189.16 279.58 15.46 677.06 n/a 47.87 98.66 2210.18 3686.25 59012.61 3232.07
Standard dev (ppm) 21674.46 11166.18 18357.45 3504.71 477.30 198.20 n/a 1014.48 n/a 73.86 172.02 3077.54 5174.29 25610.19 4784.29
% of inclusions >LOD 48% 24% 50% 25% 55% n/a n/a 33% n/a 70% 87% 33% 27% n/a n/a
Min (ppm) 10315.44 15203.78 31252.25 145.37 14.95 n/a n/a 15.76 n/a 2.35 7.19 1214.79 2832.72 n/a n/a
Max (ppm) 20144.53 17675.24 35566.55 431.85 99.05 n/a n/a 85.39 n/a 41.81 85.97 1865.31 4620.76 n/a n/a
Range(ppm) 9829.09 2471.46 4314.30 286.48 84.10 n/a n/a 69.62 n/a 39.46 78.78 650.52 1788.04 n/a n/a
Average (ppm) 15822.10 16522.29 33533.03 284.19 52.30 n/a n/a 51.23 n/a 14.44 43.29 1485.16 3427.15 n/a n/a
Standard dev (ppm) 3053.16 1338.16 2167.75 117.10 29.24 n/a n/a 24.34 n/a 15.28 27.87 324.81 842.90 n/a n/a
% of inclusions >LOD n/a 24% n/a 25% n/a n/a n/a n/a n/a n/a n/a 25% 22% n/a n/a
Min (ppm) n/a 7433.03 n/a 1254.08 n/a n/a n/a n/a n/a n/a n/a 269.65 148.80 n/a n/a
Max (ppm) n/a 9214.38 n/a 1468.72 n/a n/a n/a n/a n/a n/a n/a 274.22 207.76 n/a n/a
Range(ppm) n/a 1781.35 n/a 214.64 n/a n/a n/a n/a n/a n/a n/a 4.57 58.96 n/a n/a
Average (ppm) n/a 8350.31 n/a 1397.18 n/a n/a n/a n/a n/a n/a n/a 272.44 170.78 n/a n/a
Standard dev (ppm) n/a 732.35 n/a 123.92 n/a n/a n/a n/a n/a n/a n/a 2.45 27.62 n/a n/a
% of inclusions >LOD 100% 100% 91% 45% 100% 73% n/a 100% n/a 82% 100% 100% 100% 20% 20%
Min (ppm) 56684.48 29258.70 6288.37 401.29 249.43 692.28 n/a 200.23 n/a 19.65 235.22 937.86 2529.44 22.79 0.29
Max (ppm) 120490.51 126538.95 102465.84 2390.41 10712.93 1338.54 n/a 13650.00 n/a 112.68 877.33 26293.68 60221.51 31197.60 269.27
Range(ppm) 63806.03 97280.25 96177.47 1989.12 10463.50 646.27 n/a 13449.77 n/a 93.03 642.11 25355.82 57692.07 31174.81 268.98
Average (ppm) 85331.61 64409.44 33173.39 946.48 2159.97 951.15 n/a 2639.33 n/a 51.12 413.76 9218.34 20516.18 8944.50 68.68
Standard dev (ppm) 16943.26 24947.52 26689.49 825.25 2984.51 237.02 n/a 3724.17 n/a 27.85 204.31 7225.83 16551.82 14983.13 133.73
% of inclusions >LOD 91% 82% 70% 80% 55% 50% n/a 55% n/a n/a 73% 36% 36% 50% 67%
Min (ppm) 56684.48 29258.70 21603.86 401.29 1034.21 992.64 n/a 1387.78 n/a n/a 235.22 5111.09 13381.76 33927.58 632.50
Max (ppm) 99971.52 73481.04 41882.94 800.72 1548.21 1161.67 n/a 1901.44 n/a n/a 371.13 6484.56 23776.90 71676.56 753.43
Range(ppm) 43287.04 44222.34 20279.09 399.43 514.00 169.03 n/a 513.66 n/a n/a 135.91 1373.47 10395.15 37748.97 120.94
Average (ppm) 81815.72 56070.60 30426.56 585.49 1220.42 1043.08 n/a 1560.63 n/a n/a 310.70 5807.03 18188.02 49873.32 696.29
Standard dev (ppm) 12957.09 14013.20 7030.89 198.29 184.70 79.60 n/a 190.25 n/a n/a 49.24 560.82 5586.46 15444.11 58.35
% of inclusions >LOD 100% 56% 22% 89% 89% 22% n/a 56% n/a 11% 22% 22% 56% 56% 44%
Min (ppm) 1097.95 2200.13 13852.19 24.40 3.26 59.82 n/a 3.63 n/a 6.76 42.76 61.96 151.94 7072.93 21.26
Max (ppm) 13720.24 9155.21 27818.19 17723.99 111.96 130.26 n/a 165.58 n/a 6.76 69.86 779.21 12204.14 33586.08 1275.52
Range(ppm) 12622.29 6955.08 13966.00 17699.59 108.70 70.44 n/a 161.95 n/a 0.00 27.10 717.25 12052.21 26513.14 1254.27
Average (ppm) 6252.29 6230.33 n/a 5923.21 43.65 n/a n/a 86.77 n/a n/a n/a n/a 3098.68 19903.66 475.80
Standard dev (ppm) 4768.06 2950.44 n/a 7020.01 40.57 n/a n/a 70.36 n/a n/a n/a n/a 5142.39 11763.97 574.30
% of inclusions >LOD 44% n/a n/a 63% n/a n/a n/a 60% n/a n/a n/a n/a n/a 80% n/a
Min (ppm) 1097.95 n/a n/a 841.76 n/a n/a n/a 111.08 n/a n/a n/a n/a n/a 11519.28 n/a
Max (ppm) 4462.58 n/a n/a 5258.41 n/a n/a n/a 165.58 n/a n/a n/a n/a n/a 33586.08 n/a
Range(ppm) 3364.63 n/a n/a 4416.65 n/a n/a n/a 54.50 n/a n/a n/a n/a n/a 22066.79 n/a
Average (ppm) 2395.99 n/a n/a 2719.98 n/a n/a n/a 135.90 n/a n/a n/a n/a n/a 23111.34 n/a
Standard dev (ppm) 1443.63 n/a n/a 2080.18 n/a n/a n/a 27.57 n/a n/a n/a n/a n/a 10766.91 n/a
% of inclusions >LOD 44% n/a n/a n/a n/a n/a n/a n/a n/a n/a n/a n/a n/a n/a n/a
Min (ppm) 8513.00 n/a n/a n/a n/a n/a n/a n/a n/a n/a n/a n/a n/a n/a n/a
Max (ppm) 13720.24 n/a n/a n/a n/a n/a n/a n/a n/a n/a n/a n/a n/a n/a n/a
Range(ppm) 5207.24 n/a n/a n/a n/a n/a n/a n/a n/a n/a n/a n/a n/a n/a n/a
Average (ppm) 10908.62 n/a n/a n/a n/a n/a n/a n/a n/a n/a n/a n/a n/a n/a n/a
Standard dev (ppm) 2528.02 n/a n/a n/a n/a n/a n/a n/a n/a n/a n/a n/a n/a n/a n/a
Han
ging
wal
l
B15
{7}
[40%]
All
Ana
lyse
sM
ode
1
B30D
{25}
[36%]
All
Ana
lyse
sM
ode
1M
ode
2
B30H
{11}
[34.4%]
All
Ana
lyse
sM
ode
1
B75
{9}
[43%]
All
Ana
lyse
sM
ode
1M
ode
2

196
Inclusions type
{ # of analyzed inclusions }
[ % of inclusions analyzed
within a group]
Na K Fe Cu Sr Ba Au Pb Mo Cs Rb Zn Mn Ca Sn% of inclusions >LOD 100% 22% 26% 48% 57% 39% n/a 57% n/a 13% 13% 39% 52% 43% 17%
Min (ppm) 32.82 34.35 30.59 3.14 0.09 0.41 n/a 0.33 n/a 3.08 0.83 1.59 1.37 53.94 0.95
Max (ppm) 32211.18 7740.81 16556.95 4052.18 754.82 629.23 n/a 885.13 n/a 10.47 19.58 1611.55 3056.73 26099.52 3.59
Range(ppm) 32178.35 7706.47 16526.36 4049.04 754.73 628.83 n/a 884.80 n/a 7.39 18.75 1609.96 3055.37 26045.58 2.64
Average (ppm) 4773.98 3399.44 4704.92 454.13 103.94 112.80 n/a 172.85 n/a n/a n/a 427.93 850.11 7550.42 2.00
Standard dev (ppm) 7165.45 3599.18 6270.76 1199.01 232.25 200.04 n/a 257.47 n/a n/a n/a 615.90 1165.09 8614.27 1.21
% of inclusions >LOD 57% n/a 50% 55% 83% 78% n/a 77% n/a n/a n/a 56% 42% 40% n/a
Min (ppm) 1671.93 n/a 1321.04 41.67 0.09 0.41 n/a 0.33 n/a n/a n/a 1.59 1.37 53.94 n/a
Max (ppm) 8642.89 n/a 5767.74 351.93 76.62 55.20 n/a 136.19 n/a n/a n/a 93.04 76.11 97.04 n/a
Range(ppm) 6970.96 n/a 4446.70 310.26 76.53 54.79 n/a 135.87 n/a n/a n/a 91.45 74.74 43.10 n/a
Average (ppm) 4752.61 n/a 3864.10 152.97 17.72 31.00 n/a 54.78 n/a n/a n/a 23.90 22.21 77.87 n/a
Standard dev (ppm) 2713.19 n/a 2291.27 129.64 25.52 23.96 n/a 58.29 n/a n/a n/a 38.86 31.01 19.65 n/a
% of inclusions >LOD 35% n/a n/a n/a n/a n/a n/a n/a n/a n/a n/a n/a 33% 40% n/a
Min (ppm) 32.82 n/a n/a n/a n/a n/a n/a n/a n/a n/a n/a n/a 242.13 9027.91 n/a
Max (ppm) 82.61 n/a n/a n/a n/a n/a n/a n/a n/a n/a n/a n/a 584.74 15568.41 n/a
Range(ppm) 49.79 n/a n/a n/a n/a n/a n/a n/a n/a n/a n/a n/a 342.61 6540.50 n/a
Average (ppm) 62.91 n/a n/a n/a n/a n/a n/a n/a n/a n/a n/a n/a 475.60 11401.27 n/a
Standard dev (ppm) 19.17 n/a n/a n/a n/a n/a n/a n/a n/a n/a n/a n/a 157.21 2863.95 n/a
% of inclusions >LOD 100% 40% 20% 60% 70% 10% n/a 55% n/a 15% 15% 40% 50% 20% 20%
Min (ppm) 40.70 6.35 8.77 0.71 0.07 0.25 n/a 0.26 n/a 0.08 0.11 1.94 0.95 22.79 0.29
Max (ppm) 18374.74 3267.73 252.55 782.66 192.56 64.91 n/a 240.73 n/a 5.85 19.36 835.86 1157.64 31197.60 269.27
Range(ppm) 18334.03 3261.38 243.78 781.96 192.50 64.66 n/a 240.47 n/a 5.77 19.25 833.92 1156.69 31174.81 268.98
Average (ppm) 4898.97 628.05 85.71 291.39 43.14 n/a n/a 56.90 n/a n/a n/a 194.43 201.01 8944.50 68.68
Standard dev (ppm) 5913.25 1182.64 113.42 252.99 59.34 n/a n/a 75.84 n/a n/a n/a 325.06 363.79 14983.13 133.73
% of inclusions >LOD 40% 75% 75% 58% 43% n/a n/a 36% n/a n/a n/a 63% 70% n/a n/a
Min (ppm) 40.70 6.35 8.77 283.33 22.36 n/a n/a 85.39 n/a n/a n/a 1.94 0.95 n/a n/a
Max (ppm) 82.61 75.07 60.78 782.66 110.11 n/a n/a 105.41 n/a n/a n/a 17.70 49.32 n/a n/a
Range(ppm) 41.91 68.72 52.02 499.33 87.74 n/a n/a 20.02 n/a n/a n/a 15.77 48.37 n/a n/a
Average (ppm) 64.96 42.58 30.10 462.86 68.28 n/a n/a 93.30 n/a n/a n/a 8.51 23.06 n/a n/a
Standard dev (ppm) 16.96 25.95 27.24 177.87 36.81 n/a n/a 9.76 n/a n/a n/a 7.51 21.90 n/a n/a
% of inclusions >LOD 25% n/a n/a n/a n/a n/a n/a n/a n/a n/a n/a n/a n/a n/a n/a
Min (ppm) 6193.47 n/a n/a n/a n/a n/a n/a n/a n/a n/a n/a n/a n/a n/a n/a
Max (ppm) 11640.56 n/a n/a n/a n/a n/a n/a n/a n/a n/a n/a n/a n/a n/a n/a
Range(ppm) 5447.09 n/a n/a n/a n/a n/a n/a n/a n/a n/a n/a n/a n/a n/a n/a
Average (ppm) 8870.16 n/a n/a n/a n/a n/a n/a n/a n/a n/a n/a n/a n/a n/a n/a
Standard dev (ppm) 2014.67 n/a n/a n/a n/a n/a n/a n/a n/a n/a n/a n/a n/a n/a n/a
Han
ging
wal
l
B20C
{23}
[38%]
All
An
alys
esM
od
e 1
Mo
de
2
B75C
{20}
[24%]
All
An
alys
esM
od
e 1
Mo
de
2

197
Inclusions type
{ # of analyzed inclusions }
[ % of inclusions analyzed
within a group]
Na K Fe Cu Sr Ba Au Pb Mo Cs Rb Zn Mn Ca Sn% of inclusions >LOD 100% 40% 20% 60% 60% 10% n/a 10% 5% 10% 35% 15% 10% 25% 25%
Min (ppm) 1114.38 1120.53 2799.86 226.13 2.16 21.27 n/a 31.45 65.85 3.59 10.72 178.48 136.65 4735.78 99.22
Max (ppm) 21767.47 75681.06 6282.93 9279.66 142.21 44.15 n/a 56.94 65.85 14.27 86.52 837.57 588.71 25371.55 899.69
Range(ppm) 20653.09 74560.53 3483.07 9053.53 140.05 22.88 n/a 25.49 0.00 10.69 75.80 659.09 452.06 20635.78 800.47
Average (ppm) 12185.73 20679.20 4560.43 3589.96 36.73 n/a n/a n/a n/a n/a 30.64 414.54 n/a 25371.55 899.69
Standard dev (ppm) 5805.63 26852.64 1989.21 3287.10 36.01 n/a n/a n/a n/a n/a 28.73 367.17 n/a 7737.25 368.94
% of inclusions >LOD 40% 50% n/a 33% n/a n/a n/a n/a n/a n/a n/a n/a n/a n/a n/a
Min (ppm) 15205.79 3104.68 n/a 3049.41 n/a n/a n/a n/a n/a n/a n/a n/a n/a n/a n/a
Max (ppm) 17954.64 4450.76 n/a 4628.12 n/a n/a n/a n/a n/a n/a n/a n/a n/a n/a n/a
Range(ppm) 2748.85 1346.08 n/a 1578.70 n/a n/a n/a n/a n/a n/a n/a n/a n/a n/a n/a
Average (ppm) 16342.33 3941.81 n/a 3848.71 n/a n/a n/a n/a n/a n/a n/a n/a n/a n/a n/a
Standard dev (ppm) 825.30 627.88 n/a 659.28 n/a n/a n/a n/a n/a n/a n/a n/a n/a n/a n/a
% of inclusions >LOD 100% 48% 22% 17% 87% 22% 4% 4% 9% 9% 39% 22% 17% 35% 26%
Min (ppm) 27.38 9.90 120.64 0.46 0.06 0.82 0.07 156.17 0.49 0.03 0.06 4.40 0.38 94.59 7.49
Max (ppm) 35544.30 86392.40 1431.17 8927.42 183.73 58.39 0.07 156.17 45.23 1.14 43.64 5487.18 942.21 98488.42 3397.68
Range(ppm) 35516.92 86382.50 1310.53 8926.96 183.66 57.57 n/a 0.00 44.73 1.11 43.57 5482.78 941.83 98393.83 3390.19
Average (ppm) 5961.53 16713.69 625.92 2260.81 39.24 26.38 n/a n/a n/a n/a 10.17 1192.72 261.37 17439.81 805.56
Standard dev (ppm) 9708.03 25500.54 590.35 4444.52 57.89 23.73 n/a n/a n/a n/a 13.91 2401.84 455.97 32996.45 1452.28
% of inclusions >LOD 35% n/a n/a n/a 61% n/a n/a n/a n/a n/a n/a n/a n/a n/a n/a
Min (ppm) 3464.62 n/a n/a n/a 0.06 n/a n/a n/a n/a n/a n/a n/a n/a n/a n/a
Max (ppm) 6602.99 n/a n/a n/a 24.45 n/a n/a n/a n/a n/a n/a n/a n/a n/a n/a
Range(ppm) 3138.37 n/a n/a n/a 24.39 n/a n/a n/a n/a n/a n/a n/a n/a n/a n/a
Average (ppm) 4915.22 n/a n/a n/a 5.68 n/a n/a n/a n/a n/a n/a n/a n/a n/a n/a
Standard dev (ppm) 1271.53 n/a n/a n/a 8.82 n/a n/a n/a n/a n/a n/a n/a n/a n/a n/a
% of inclusions >LOD 35% n/a n/a n/a n/a n/a n/a n/a n/a n/a n/a n/a n/a n/a n/a
Min (ppm) 27.38 n/a n/a n/a n/a n/a n/a n/a n/a n/a n/a n/a n/a n/a n/a
Max (ppm) 82.61 n/a n/a n/a n/a n/a n/a n/a n/a n/a n/a n/a n/a n/a n/a
Range(ppm) 55.23 n/a n/a n/a n/a n/a n/a n/a n/a n/a n/a n/a n/a n/a n/a
Average (ppm) 61.65 n/a n/a n/a n/a n/a n/a n/a n/a n/a n/a n/a n/a n/a n/a
Standard dev (ppm) 18.89 n/a n/a n/a n/a n/a n/a n/a n/a n/a n/a n/a n/a n/a n/a
Foot
wal
l
All
Ana
lyse
sM
ode
1M
ode
2A
ll A
naly
ses
Mod
e 1
B15D
{20}
[21%]
B15C
{23}
[28%]

198
REFERENCES
Anderson, C.A., Scholz, E.A., and Strobell, J.D., 1955, Geology and Ore Deposits of the Bagdad
area, Yavapai County, Arizona: USGS Professional Paper 278, p. 103.
Bodnar, R.J., Reynolds, T.J., and Kuehn, C.A., 1985, Fluid Inclusion Systematics in Epithermal
Systems: In Society of Economic Geologists, Reveiws in Economic Geology, 2, Geology
and Geochemistry of Epithermal Systems, Berger, B.R., and Bethke, P.M., eds., 73-98.
Bodnar, R.J., and Vityk, M.O., 1994, Interpretation of Microthermometric data for H2O-NaCl
Fluid Inclusions, in DeVivo, B., and Frezzotti, M.L., eds., Fluid Inclusions in Minerals:
Methods and Applications: Blacksburg, VA, Virginia Polytechnic Institute and State
University, p. 117-130.
Bowers, T.S., and Helgeson, H.C., 1983, Calculation of the Thermodynamic and Geochemical
Consequences of Nonideal Mixing in the System H2O-CO2-NaCl on Phase Relations in
Geologic Systems: Equation of State for H2O-CO2-NaCl fluids at High Pressures and
Temperatures: Geochimica et Cosmochimica Acta, v. 47, p. 1247-1275.
Brown, P. E., and Hagemann, S. G., 1994, MacFlinCor and its Application to Fluids in Archean
Lode-gold Deposits: Geochimica et Cosmochimica, v.59, no. 19, p. 3943-3952.
Brown, P.E., 1989, FLINCOR: A Microcomputer Program for the Reduction and Investigation
of Fluid-Inclusion Data: American Mineralogist: Software Notice, v.74, p. 1390-1393.
Candela, P.A., and Holland, H.D., 1986, A Mass Transfer Model for Copper and Molybdenum in
Magmatic Hydrothermal Systems: The Origins of Porphyry-Type Ore Deposits.
Economic Geology, v. 81, pp. 1-19.
Cline, J.S., and Bodnar. R.J., 1991, Can Economic Porphyry Mineralization be Generated by a
Typical Calc-alkaline Melt?: Journal of Geophysical Research, v.96, p. 8113-8126.
Cloos, M., Sepiie, B., 2013, Porphyry Copper Deposits: Strike-slip Faulting and Throttling
Cupolas: International Geology Review, v.55, no.1, 43-65.
Dale, V.B., 1961, Tungsten Deposits of Gila, Yavapai, and Mohave Counties, Arizona: United
States Bureau of Mines Information Circular I.C. 8078, p. 71-94.
Goldstein, R.H., and Reynolds, J.T., 1994, Systematics of Fluid Inclusions in Diagenetic
Minerals: Society of Sedimentary Geology, SEPM Short Course 31, p.199
Guilbert, J.M., Park, C.F., 1986. Waveland press, The geology of Ore Deposits: p405-434

199
Guillong, M., Heinrich, C.A., 2007, Sensitivity Enhancement in Laser Ablation ICP-MS Using
Small Amounts of Hydrogen in the Carrier Gas: Journal of Analytical Atomic
Spectrometry, v.22, p. 1488-1494.
Guillong, M., Meier D. M., Allan M. M., Heinrich C. A. and Yardley B., 2008, SILLS: A
MATLAB-Based Program for the Reduction of Laser Ablation ICP–MS Data of
Homogeneous Materials and Inclusions: Mineralogical Association of Canada Short
Course 40, Vancouver, B.C., pp. 328–333.
Gustafson, L. B., Hunt, J.P., 1975. The Porphyry Copper Deposit at El Salvador, Chile.
Economic Geology, v. 70, pp. 857-912.
Hedenquist, J.W., Arribas, A., Reynolds, J.T., 1998, Evolution of an intrusion- centered
hydrothermal system: Far Southeast-Lepanto porphyry and epithermal Cu-Au deposits,
Philippines: Economic Geology, v. 93, p. 373–404.
Heinrich, C.A., Günther, D., Audétat, A., Ulrich, T., and Frischknecht, R., 1999, Metal
fractionation between magmatic brine and vapor, determined by micro-analysis of fluid
inclusions: Geology, v. 27, p. 755–758.
Hedenquist, J.W., Lowenstern, J.B., 1994, The Role of Magmas in Hydrothermal Ore Deposits.
Nature, v.370, p. 519-526
Heinrich, C.A., Driesner, T., Stefánsson, A., Seward, T.M., 2004, Magmatic Vapor Contraction
and the Transport of Gold from the Porphyry Environment to Epithermal Ore Deposits:
Geological Society of America, v. 32, no. 9. P. 761-764.
Lecumberri-Sanchez, P., Steele-MacInnis, M., Weis, P., Driesner, T., Bodnar, R.J., 2015, Salt
Precipitation in magmatic-hydrothermal systems Associated with Upper-Crustal Plutons:
Unpublished manuscript
John, D.A., Ayuso, R.A., Barton, M.D., Blakely, R.J., Bodnar, R.J., Dilles, J.H., Gray, Floyd,
Graybeal, F.T., Mars, J.C., McPhee, D.K., Seal, R.R., Taylor, R.D., Vikre, P.G., 2010,
Porphyry copper deposit model, chap. B of Mineral deposit models for resource
assessment: U.S. Geological Survey Scientific Investigations Report 2010–5070–B, p.
169.
Landtwing, M.R., Furrer, C., Redmond, P.B., Pettke, T., Guillong, M., Heinrich, C.A., 2010, The
Bingham Canyon Porphyry Cu-Mo-Au Deposit. III. Zone Copper-Gold Ore Deposition
by Magmatic Vapor Expansion: Economic Geology, v. 105, p. 91-118.
Lang, J.R., and Eastoe, C.J., 1988, Relationship Between a Porphyry Cu-Mo Deposit, Base and
Precious Metal Veins, and Laramide Intrusions, Mineral Park, Arizona: Economic
Geology, v. 83, p. 551-567.

200
Lowell, J. D., Guilbert, J.M., 1970. Lateral and Vertical Alteration-Mineralization Zoning in
Porphyry Ore Deposits. Economic Geology, v. 65, pp. 373-408.
Maher, D.J., 2008, Reconstruction of middle tertiary extension and Laramide porphyry copper
systems, east-central Arizona: University of Arizona, ProQuest, UMI Dissertations
Publishing
Muntean, J.L., and Einaudi, M.T., 2001, Porphyry Gold Deposits of the Refugio District,
Maricunga Belt, Northern Chile: Economic Geology, v. 95, p. 1445-1472.
Reynolds, J.T., and Beane, R.E., 1985, Evolution of hydrothermal Fluid Characteristics at the
Santa Rita, New Mexico, Porphyry Copper Deposit: Economic Geology, v. 80, p.1328-
1347.
Rusk, B.G., Reed, M.H., Dilles, J.H., Klemm, L.M., Heinrich, C.A., 2004, Compositions of
Magmatic Hydrothermal Fluids Determined by LA-ICP-MS of Fluid Inclusions from the
Porphyry Copper-Molybdnum Deposit at Butte, MT: Chemical Geology, v. 210, p. 173-
199.
Rusk, B.G., Reed, M.H., Dilles, J.H., 2008, Fluid Inclusion Evidence for Magmatic-
Hydrothermal Fluid Evolution in the Porphyry Copper-Molybdenum Deposit at Butte,
Montana: Economic Geology, v. 103, p. 307-334.
Schrader, F.C., 1909, Mineral Deposits of the Cerbat Range, Black Mountains and Grand Wash
Cliffs, Mohave County, Arizona: USGS bulliten 397, p. 226
Seedorff, E, Dilles, J.H., Proffett, J.M., Jr., Einaudi, M.T., Zurcher, L., Stavast, W.J.A., Johnson,
D.A., and Barton, M.D., 2005, Porphyry deposits-Characteristics and origin of hypogene
features: Society of Economic Geologists, Economic Geology 100th anniversary Volume,
1905-2005, p. 251-298
Seedorff, E., Barton, M. D., Stavast, W. J. A., Maher., D. J., 2008. Root Zones of Porphyry
Systems: Extending the Porphyry System to Depth. Economic Geology, v. 103, pp. 939-
956.
Selby, D., Nesbitt, B.E., Muehlenbachs, K., Prochaska, W., 2000, Hydrothermal Alteration and
Fluid Chemistry of the Endako Porphyry Molybdenum Deposit, British Columbia:
Economic Geology, v. 95, p. 183-202.
Sillitoe, R. H., 1973. The Tops and Bottoms of Porphyry Copper Deposits: Economic Geology,
v. 68, pp. 799-815
Sillitoe, R. H., 2010. Porphyry Copper Systems: Economic Geology, v. 105, pp.3-41.

201
Stavast, W. J. A., 2006, Three Dimensional Evolution of Magmatic Hydrotherm Systems,
Schultze Granite and Ruby Star Granodiortie, Arizona: University of Arizona Ph.D
dissertation
Sterner, S.M., and Bodnar, R.J., 1984, Synthetic Fluid Inclusions in Natural Quartz. I.
Compositional Types Synthesized and Applications to Experimental Geochemistry:
Geochimica et Cosmochimica Acta, v. 48, p. 2659-2668.
Sterner, M., 1992, Homogenization of Fluid Inclusions to the Vapor Phase: The Apparent
Homogenization Phenomenon: Economic Geology, v. 87, p. 1616-1623.
Tattitch, B.C., Candela, P.A., Piccoli, P.M., Bodnar, R.J., 2015, Copper partitioning between
felsic melt and H2O-CO2 bearing saline fluids: Geochimica et Cosmochimica Acta, v.
148, p. 81-99.
Titley S. R. and Anthony E. Y., 1989, Laramide mineral deposits in Arizona. Geologic
Evolution of Arizona: Arizona Geological Society Digest, v. 17, p.485–514.
Ulrich, T., Gunther, D., Heinrich, C.A., 2001, The Evolution of a Porphyry Cu-Au Deposit,
Based on LA-ICP-MS Analysis of Fluid Inclusions: Bajo de la Alumbrera, Argentina:
Economic Geology, v. 96, p. 1743-1774.
Vuich, J.S., 1974, A geologic reconnaissance and mineral evaluation, Wheeler Wash area,
Hualpai Mountains, Mohave County, Arizona: Tucson, University of Arizona, Unpub.
M.S. thesis, 77 p., 6 sheets, scales 1:12,000, 1:24,000, and 1:125,000.
Wang, X., Chou, I., Hu, W., Burruss, R.C., Sun, Q., Song, Y., 2011, Raman Spectroscopic
Measurments of CO2 Density: Experimental Calibration with High-Pressure Optical Cell
(HPOC) and Fused Silica Capillary Capsule (FSCC) with Application to Fluid Inclusion
Observations: Geochimica et Cosmochimica Acta, v. 75, p. 4080-4093.
Zajacz, Z., Candela, P.A., Piccoli, P.M., Wälle, M., and Sanchex-Valle, C., 2012, Gold and
Copper inVolatile Saturated Mafic to Intermediate Magmas: Solubilities, Partitioning,
and Implications for Ore Deposit Formation: Geochimica et Cosmochimica Acta, v. 91,
p. 140-159.

202
CURRICULUM VITAE
Graduate College University of Nevada, Las Vegas
Wyatt M. Bain [email protected]
Degrees: Bachelors of Science, Geology and Geophysics, 2012 University of Wisconsin, Madison, WI Testing Established Models of Hydrothermal Fluid Distribution Around Porphyry Deposits: The
Application of Fluid Inclusion Research to Porphyry Deposit Exploration
Thesis Examination Committee
Chairperson, Jean S. Cline, Ph.D.
Committee Member, Rodney M. Metcalf, Ph.D.
Committee Member, Minghua Ren, Ph.D.
Graduate Faculty Representative, Barbara Luke, Ph. D.


![L 13 Fluids [2]: Fluid Statics: fluids at rest](https://static.fdocuments.in/doc/165x107/56816253550346895dd29cdf/l-13-fluids-2-fluid-statics-fluids-at-rest.jpg)