Testing and Development of Pre-Stressed CFRP Retrofit ...
45
University of Arkansas, Fayeeville ScholarWorks@UARK eses and Dissertations 8-2018 Testing and Development of Pre-Stressed CFRP Retrofit Strategies for Controlling Fatigue Cracking in Steel Waterway Lock Gate Structures Maggie Langston University of Arkansas, Fayeeville Follow this and additional works at: hp://scholarworks.uark.edu/etd Part of the Civil Engineering Commons , Hydraulic Engineering Commons , and the Structural Engineering Commons is esis is brought to you for free and open access by ScholarWorks@UARK. It has been accepted for inclusion in eses and Dissertations by an authorized administrator of ScholarWorks@UARK. For more information, please contact [email protected], [email protected]. Recommended Citation Langston, Maggie, "Testing and Development of Pre-Stressed CFRP Retrofit Strategies for Controlling Fatigue Cracking in Steel Waterway Lock Gate Structures" (2018). eses and Dissertations. 2903. hp://scholarworks.uark.edu/etd/2903
Transcript of Testing and Development of Pre-Stressed CFRP Retrofit ...
University of Arkansas, FayettevilleScholarWorks@UARK
Theses and Dissertations
8-2018
Testing and Development of Pre-Stressed CFRPRetrofit Strategies for Controlling Fatigue Crackingin Steel Waterway Lock Gate StructuresMaggie LangstonUniversity of Arkansas, Fayetteville
Follow this and additional works at: http://scholarworks.uark.edu/etd
Part of the Civil Engineering Commons, Hydraulic Engineering Commons, and the StructuralEngineering Commons
This Thesis is brought to you for free and open access by ScholarWorks@UARK. It has been accepted for inclusion in Theses and Dissertations by anauthorized administrator of ScholarWorks@UARK. For more information, please contact [email protected], [email protected].
Recommended CitationLangston, Maggie, "Testing and Development of Pre-Stressed CFRP Retrofit Strategies for Controlling Fatigue Cracking in SteelWaterway Lock Gate Structures" (2018). Theses and Dissertations. 2903.http://scholarworks.uark.edu/etd/2903
Testing and Development of Pre-Stressed CFRP Retrofit Strategies for Controlling Fatigue
Cracking in Steel Waterway Lock Gate Structures
A thesis submitted in partial fulfillment
of the requirements for the degree of
Master of Science in Civil Engineering
by
Maggie Langston
University of Arkansas
Bachelor of Science in Civil Engineering, 2017
August 2018
University of Arkansas
This thesis is approved for recommendation to the Graduate Council.
Gary Prinz, PhD
Thesis Director
Cameron Murray, PhD Micah Hale, PhD
Committee Member Committee Member
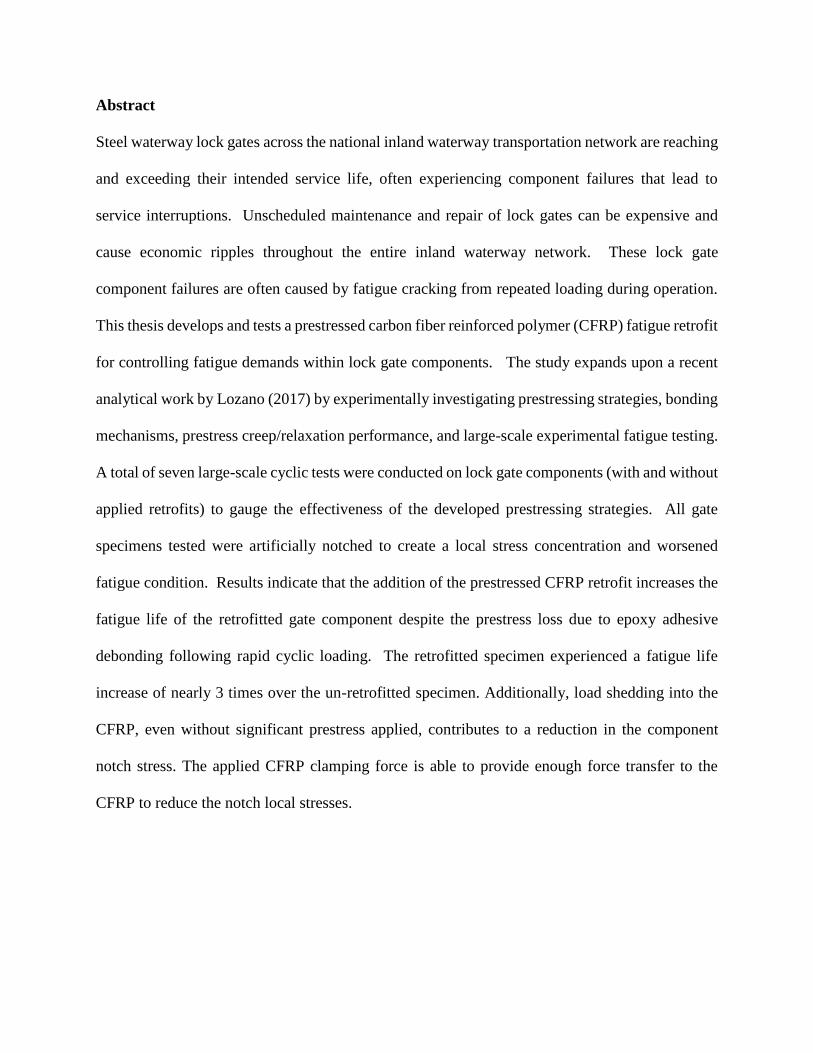
Abstract
Steel waterway lock gates across the national inland waterway transportation network are reaching
and exceeding their intended service life, often experiencing component failures that lead to
service interruptions. Unscheduled maintenance and repair of lock gates can be expensive and
cause economic ripples throughout the entire inland waterway network. These lock gate
component failures are often caused by fatigue cracking from repeated loading during operation.
This thesis develops and tests a prestressed carbon fiber reinforced polymer (CFRP) fatigue retrofit
for controlling fatigue demands within lock gate components. The study expands upon a recent
analytical work by Lozano (2017) by experimentally investigating prestressing strategies, bonding
mechanisms, prestress creep/relaxation performance, and large-scale experimental fatigue testing.
A total of seven large-scale cyclic tests were conducted on lock gate components (with and without
applied retrofits) to gauge the effectiveness of the developed prestressing strategies. All gate
specimens tested were artificially notched to create a local stress concentration and worsened
fatigue condition. Results indicate that the addition of the prestressed CFRP retrofit increases the
fatigue life of the retrofitted gate component despite the prestress loss due to epoxy adhesive
debonding following rapid cyclic loading. The retrofitted specimen experienced a fatigue life
increase of nearly 3 times over the un-retrofitted specimen. Additionally, load shedding into the
CFRP, even without significant prestress applied, contributes to a reduction in the component
notch stress. The applied CFRP clamping force is able to provide enough force transfer to the
CFRP to reduce the notch local stresses.

Acknowledgements
This thesis is part of a research project funded by the Maritime Transportation Research and
Education Center (MarTREC) and the U.S. Department of Transportation under Grant Award
Number DTRT13-G-UTC50. Material support was given by MarTREC and laboratory staff at
the Engineering Research Center (ENRC) including Mark Kuss and David Peachee as well as
assistance from Dr. Guillermo Riveros from the U.S. Army Corps of Engineers. The authors
also acknowledge in-kind support by W&W|AFCO Steel who provided the steel and fabricated
the large-scale experimental specimens. This research was conducted in the Steel Structures
Research Laboratory (SSRL) at the University of Arkansas with student help of Christine
Lozano and Diego Real.
Disclaimer
The contents of this report reflect the views of the authors, who are responsible for the facts and
the accuracy of the information presented herein. This document is disseminated under the
sponsorship of the U.S. Department of Transportation’s University Transportation Centers
Program, in the interest of information exchange. The U.S. Government assumes no liability for
the contents or use thereof.
Table of Contents
1. Introduction .............................................................................................................................. 1
2. Analytical Fatigue Investigation of the Greenup Lock and Dam by Lozano (2017) .......... 4
2.1. The Local Stress Constant Life Diagram Approach ......................................................5
2.2. The AASHTO Nominal Stress Approach ......................................................................6
3. Development of a Fatigue Retrofit Prototype ........................................................................ 9
3.1. Investigation into Retrofit Bonding Strategies for Achieving Desired Prestress Levels
and Preventing Prestress Losses ..................................................................................10
4. Experimental Investigation into Retrofit Fatigue Mitigation ............................................ 15
4.1. Specimen Geometry .....................................................................................................15
4.2. Loading .........................................................................................................................19
4.3. Experimental Setup and Testing Matrix .......................................................................21
4.4. Instrumentation and Monitoring ...................................................................................23
4.5. Experimental Fatigue Test Results ...............................................................................24
4.5.1. Testing Observations from Full-Scale and Half-Scale Specimens ......................24
4.5.2. Effect of Retrofit Prestress Levels on Specimen Local Stresses ..........................26
4.5.3. Effect of Prestressed Retrofit on Specimen Fatigue Life .....................................29
4.5.4. Performance of Half-Scale Retrofit Clamping Mechanisms during Cyclic
Loading ...............................................................................................................31
5. Summary and Conclusions .................................................................................................... 32
6. References ............................................................................................................................... 34
List of Figures
Figure 1. Loading parameters affecting fatigue life of a component. ............................................. 2
Figure 2. Finite element stress contours for Greenup Lock gate and critical fatigue
detail [29] ......................................................................................................................... 5
Figure 3. Constant life diagram using the modified Goodman criteria for smooth specimens ...... 6
Figure 4. Gate component stress shift due to various prestress levels [29] .................................... 7
Figure 5. Modified Goodman diagram and effect of prestress on the critical region stress
state [29]........................................................................................................................... 8
Figure 6. Retrofit components and assembly steps for the CFRP retrofit .................................... 10
Figure 7. Cross-section of prestress bearing mechanism with forces applied by bolts to
create the prestress ......................................................................................................... 10
Figure 8. Four bonding mechanisms for clamping the CFRP consisting of: (a) wedge
grips, (b) sandpaper, (c) epoxy, and (d) SlipnotTM surface. ......................................... 11
Figure 9. Representation of CFRP stress data showing prestress loss due to bond failure. ......... 12
Figure 10. CFRP prestress measurements from the different bonding mechanisms
considered ................................................................................................................... 13
Figure 11. Measured CFRP prestress losses due to relaxation and creep. .................................... 14
Figure 12. Measured temperature effects on CFRP prestress levels. ........................................... 15
Figure 13. Gate section F13 fabrication details for (a) full-scale specimen and
(b) half-scale specimen ............................................................................................... 17
Figure 14. Notch location for (a) full-scale specimen and (b) half-scale specimen. .................... 17
Figure 15. Constant life diagram using the modified Goodman criteria for smooth and
notched specimens ...................................................................................................... 19
Figure 16. Specimen loading configurations for the full scale component tests (C1 and C2)
and the half-scale component tests (C3) ..................................................................... 20
Figure 17. a) Stresses from submodel of Lock Gate; b) Stresses from model of test specimens . 20
Figure 18. Experimental test setup and specimen force diagrams for (a) full-scale axially
loaded specimen, (b) full-scale specimen in three-point bending, and (c) half-scale
axially loaded specimen. ............................................................................................. 22
Figure 19. Photograph of experimental setup for (a) full-scale testing in the large reaction
frame and (b) half-scale testing in the Walter+Bai servo-hydraulic bi-axial fatigue
testing machine. .......................................................................................................... 22
Figure 20. Strain gauge instrumentation locations for: a) full-scale configuration 1 (C1),
b) full-scale configuration 2 (C2), and c) half-scale configuration 3 (C3). ................ 24
Figure 21. Recorded strains, a) pre-notch; b) post-notch .............................................................. 25
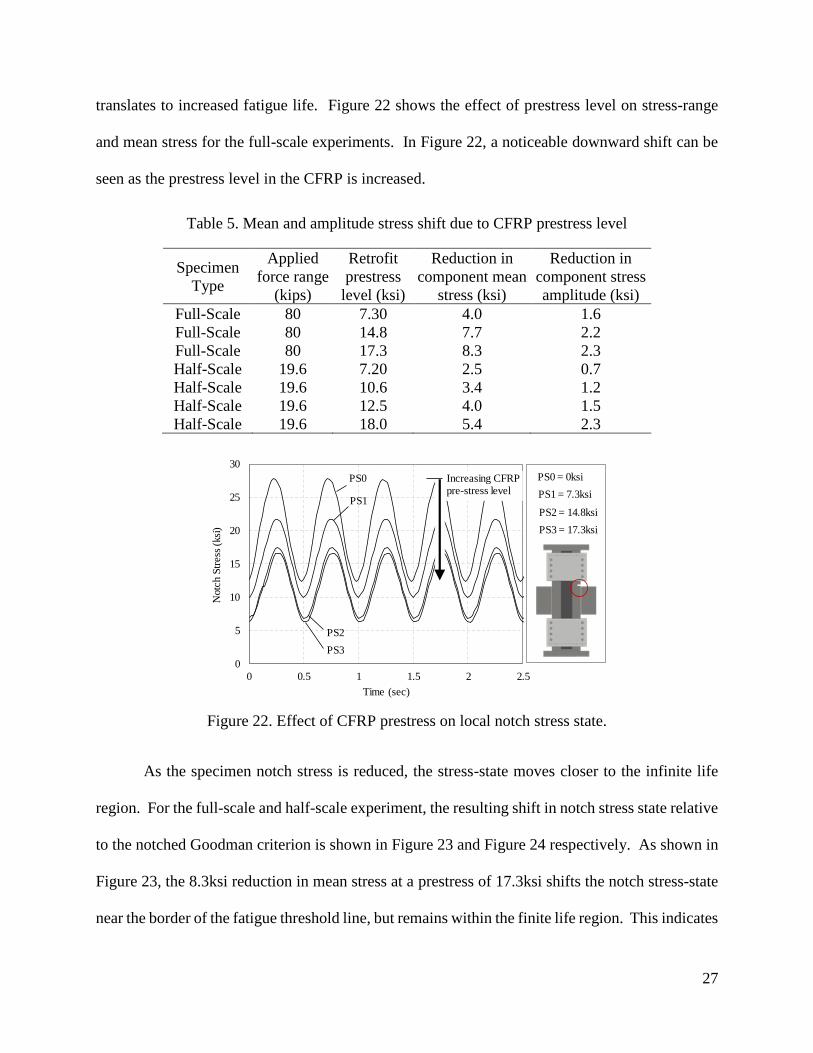
Figure 22. Effect of CFRP prestress on local notch stress state. .................................................. 27
Figure 23. Effect of CFRP prestress level on full-scale component stress state........................... 28
Figure 24. Effect of CFRP prestress level on small-scale component stress state ....................... 29
Figure 25. Fatigue fracture at the notch of specimen C3-3 following 989,235 cycles. ................ 30
Figure 26. Measured stress at the notch of specimen C3-3 (no retrofit) and specimen C3-4
(retrofit) ....................................................................................................................... 31
Figure 27. Measured CFRP prestress during rapid cyclic loading. .............................................. 32
List of Tables
Table 1. Test variations to confirm bond mechanism ................................................................... 13
Table 2. Coefficients for stress concentration factor [31] ............................................................. 18
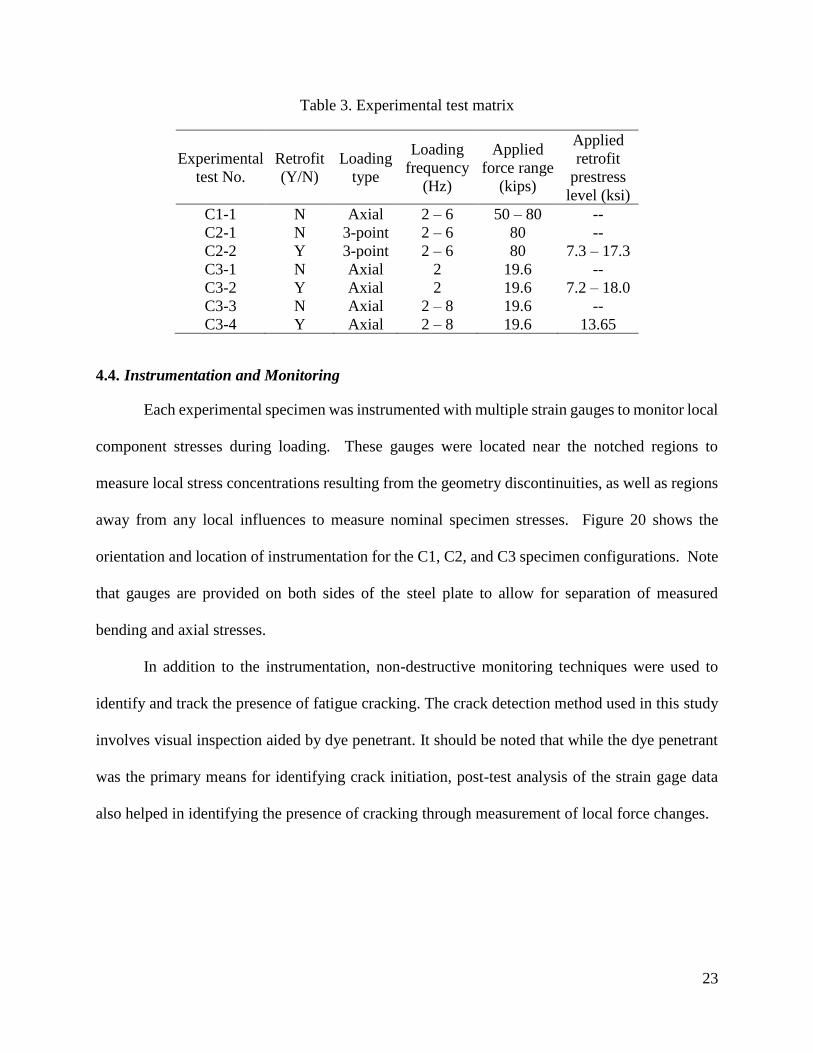
Table 3. Experimental test matrix ................................................................................................. 23
Table 4. Experimental test matrix and resulting fatigue cycles applied ....................................... 26
Table 5. Mean and amplitude stress shift due to CFRP prestress level ........................................ 27
1
1. Introduction
The current average age of existing waterway lock gates within the US waterway
transportation network is 67 years [1]. Several existing gates have even exceeded 100 years of
service, and are still in operation [1]. Given that the majority of these existing lock gates were
designed for an expected service life of 50-years, concern over infrastructure reliability and
increased unscheduled service interruptions is growing. In both 2013 and 2017 the American
Society of Civil Engineers (ASCE) gave the inland waterway infrastructure a “D” grade based on
its age and because nearly 49% of all vessels experienced infrastructure-induced delays [2, 3]. In
the ASCE scale, a “D” grade indicates that the infrastructure is in “poor to fair condition” with a
“strong risk of failure” [4].
Unscheduled maintenance and repair of lock gates can be expensive and cause economic
ripples throughout the entire inland waterway network. As an example, the 2002 upstream lock
gate failure on the John Day Lock resulted in eight months of required repairs [5]. A gate
deterioration failure within the Greenup Lock in 2003 resulted in an estimated $14 million in losses
to barge companies from lost operating costs [6]. The McApline Lock in 2004 is another example,
with failure of critical structural members causing over 1,440 hours of tow delays even with a
closure notice of 2 months [7]. Failure of the downstream gate on the Dalles Lock in 2009 resulted
in two transportation companies temporarily laying off half of their workers [8]. The United States
Army Corps of Engineers (USACE) states that waterway lock gates are the “most immediate
critical infrastructure component” because of rapid degradation [9].
Lock gate component failures are often caused by fatigue cracking from repeated loading
during operation. Fatigue cracking often occurs under service-type loading due to repeated cyclic
stresses that are often far below those required for monotonic fracture. The resulting fatigue life
2
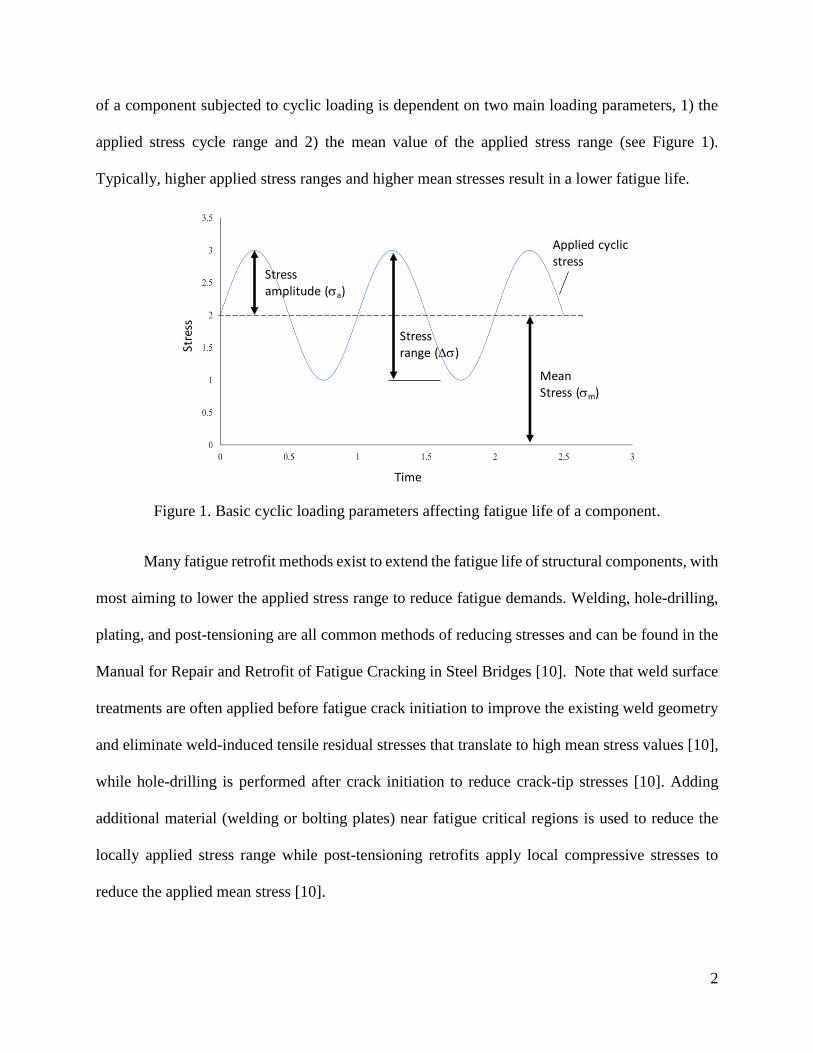
of a component subjected to cyclic loading is dependent on two main loading parameters, 1) the
applied stress cycle range and 2) the mean value of the applied stress range (see Figure 1).
Typically, higher applied stress ranges and higher mean stresses result in a lower fatigue life.
Figure 1. Basic cyclic loading parameters affecting fatigue life of a component.
Many fatigue retrofit methods exist to extend the fatigue life of structural components, with
most aiming to lower the applied stress range to reduce fatigue demands. Welding, hole-drilling,
plating, and post-tensioning are all common methods of reducing stresses and can be found in the
Manual for Repair and Retrofit of Fatigue Cracking in Steel Bridges [10]. Note that weld surface
treatments are often applied before fatigue crack initiation to improve the existing weld geometry
and eliminate weld-induced tensile residual stresses that translate to high mean stress values [10],
while hole-drilling is performed after crack initiation to reduce crack-tip stresses [10]. Adding
additional material (welding or bolting plates) near fatigue critical regions is used to reduce the
locally applied stress range while post-tensioning retrofits apply local compressive stresses to
reduce the applied mean stress [10].
Stre
ss
Time
Applied cyclic stress
Stress amplitude (sa)
Mean Stress (sm)
Stress range (Ds)
3
To allow for controlled modification of component stress states, post-tensioning retrofit
methods using high-strength fiber reinforced polymer materials were chosen for this study. Since
the 2000s, fiber reinforced polymer (FRP) has been tested as a potential retrofitting material due a
high strength-to-weight ratio, high corrosion-resistance, and excellent fatigue performance [11].
Carbon FRP (CFRP) can also have a higher elastic modulus than steel (15,900-84,000 ksi) [11].
Research has proven CFRP to be an effective and efficient retrofitting material in the form of bars,
patches, and strips for both steel and concrete [12-17]. As an example, Tajsten 2009 showed that
prestressed CFRP strips were capable of providing infinite fatigue life to steel plates and that non-
prestressed CFRP strips could increase the plate fatigue life by up to 3.74 times [18]. Because of
these advantages, prestressed CFRP strips can be bonded to the structure using special adhesives
or un-bonded to the structure using anchorage systems.
Un-bonded prestressed CFRP systems have many advantages over traditional bonded
CFRP which uses adhesives. Un-bonded systems do not permanently alter the original geometry
of the structure and can be applied to a broader range of structures such as riveted bridges or
historic landmarks. Additionally, according to Ghafoori 2015 and Lenwari 2006, un-bonded
CFRP systems require less time to install (requiring less surface preparation) and reduce de-
bonding failures that are often encountered with bonded CFRP retrofits [19, 20]. Unbonded
prestressed CFRP applications are chosen for this investigation.
Recent analytical and experimental studies have investigated the effectiveness of
prestressed CFRP retrofit methods on fatigue crack mitigation. Analytical research studies by
Colombi 2003 and Kianmofrad 2017 showed a reduction in crack tip stress and the insignificance
of CFRP geometry when applying a prestressed CFRP retrofit [21, 22]. Mohee 2017 used FEM
to develop effective anchorage systems for prestressed CFRP strips and tested them under static
4
loading [23]. Hong 2017 and Ye 2018 were successful in using un-bonded prestressed CFRP strips
to strengthen large-scale concrete and notched steel beams, respectively, with a bolted anchorage
system under 3-point bending [24, 25]. Li 2018 used bonded prestressed CFRP strips to strengthen
large-scale notched steel beams with an adhesive and bolting anchorage system under 4-point
bending [26]. Ghafoori 2015 and 2016 used un-bonded prestressed CFRP strips to strengthen
large-scale steel bridge beams with a friction anchorage system under 4-point bending [27, 28].
The goal of this research was to design an un-bonded prestressed CFRP strip retrofit to mitigate
fatigue cracking in critical lock gate details.
2. Analytical Fatigue Investigation of the Greenup Lock and Dam by Lozano (2017)
In a recent work by Lozano (2017) [29], an existing lock gate and retrofit were modeled
using ABAQUS to identify critical fatigue regions and investigate the effect of prestressed retrofits
on component fatigue susceptibility. This section summarizes the study performed by [29],
highlighting the fatigue analysis results and suggested prestress levels to achieve an infinite fatigue
life within the critical gate region. The lock gate modeled in [29] was the Greenup Lock and Dam
on the Ohio River.
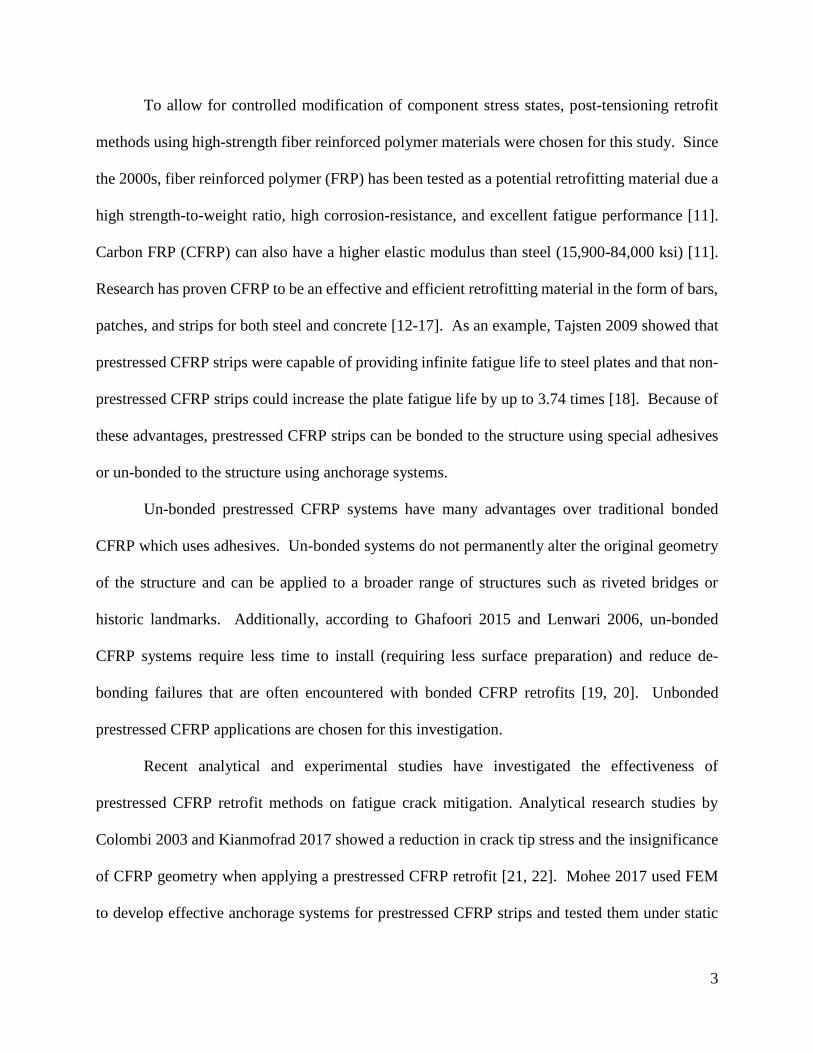
In the analytical investigation by [29], twenty-four sections of high stress were identified
using the Von Mises stress contours, see Figure 2. Miner’s rule (explained later) was then applied
to these sections and the highest amount of damage during one lockage cycle was determined to
be a cruciform section located on the centerline near the bottom of the downstream side of the
gate, see Figure 2(b) and (c). The critical fatigue region, Section F13 in Figure 2, has the smallest
cross-sectional area near the point of highest hydrostatic pressure compared to other identified
sections. The critical fatigue region was further verified by field observations conducted by the
USACE.
5
Figure 2. FEM stress contours for Greenup Lock gate and critical fatigue detail [29]
In [29], the stress changes to section F13 due to various retrofit prestress forces were
analyzed using two methods: 1) a local stress approach using constant life diagrams, and 2) a
nominal stress approach using empirical fatigue detail categories found in the AASHTO LRFD
Bridge Specification [30]. For clarity in understanding the approach taken by [29], which is also
used in this study, the two fatigue evaluation approaches are summarized briefly below.
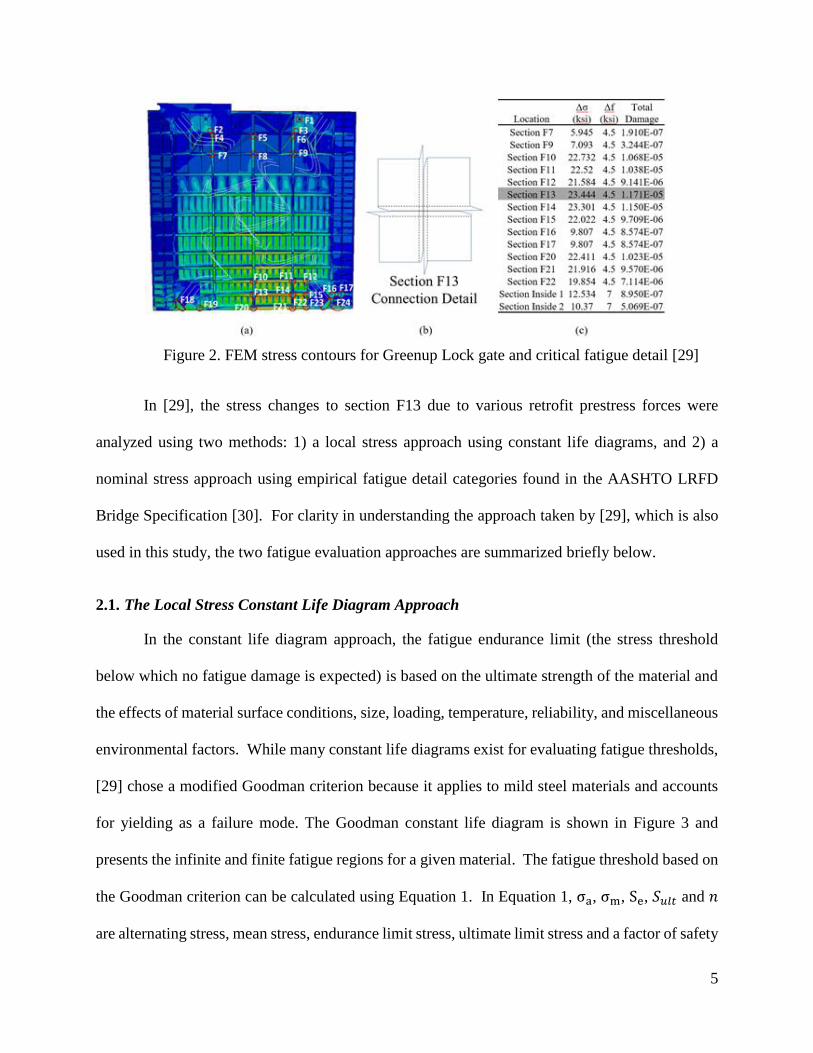
2.1. The Local Stress Constant Life Diagram Approach
In the constant life diagram approach, the fatigue endurance limit (the stress threshold
below which no fatigue damage is expected) is based on the ultimate strength of the material and
the effects of material surface conditions, size, loading, temperature, reliability, and miscellaneous
environmental factors. While many constant life diagrams exist for evaluating fatigue thresholds,
[29] chose a modified Goodman criterion because it applies to mild steel materials and accounts
for yielding as a failure mode. The Goodman constant life diagram is shown in Figure 3 and
presents the infinite and finite fatigue regions for a given material. The fatigue threshold based on
the Goodman criterion can be calculated using Equation 1. In Equation 1, σa, σm, Se, 𝑆𝑢𝑙𝑡 and 𝑛
are alternating stress, mean stress, endurance limit stress, ultimate limit stress and a factor of safety

6
respectively. In Figure 3, combinations of mean stress and stress amplitude from measurements
or finite element simulations can be plotted and determined to be in either finite or infinite fatigue
life regions.
Figure 3. Constant life diagram using the modified Goodman criteria for smooth specimens
σa
Se+
σm
𝑆𝑢𝑙𝑡=
1
𝑛 (Equation 1)
2.2. The AASHTO Nominal Stress Approach
In the nominal stress approach also taken by [29], the fatigue threshold is based on a
selected detail category that considers geometry, loading direction, and connection type (including
weld detailing). Damage due to fatigue occurs when the applied stress range is above this fatigue
threshold and can be calculated from provided stress-vs-number of cycles to failure (S-N) curves
and accumulated using Miner’s Rule. Miner’s Rule is a linear damage accumulation model in
which total damage, D, is equal to the summation of individual damaging constant amplitude
cycles, see Equation 2. Using the nominal stress approach such as that provided in AASHTO, an
estimated number of cycles to failure can be calculated using empirical S-N curves where A is
provided from the detail category, see Equation 3.
sy, Yield Strength
sy
Se, Endurance Limit
Sult, Endurance Limit
Alternating Stress, sa
Mean Stress, sm
Compression Tension
Infinite Life Region
(sm, sa)
7
D = Σ𝐷𝑖 = Σ𝑛𝑖
𝑁𝑖 (Equation 2)
𝑁𝑖 = 𝐴(Δ𝜎)−3 (Equation 3)
In [29], gate component stress ranges from the finite element simulations were analyzed
using the AASHTO nominal stress approach and fatigue damage within each high stress region
was evaluated to determine the critical region susceptible to fatigue. Following determination of
the critical region, various levels of prestress were applied to the critical section (Section F13 in
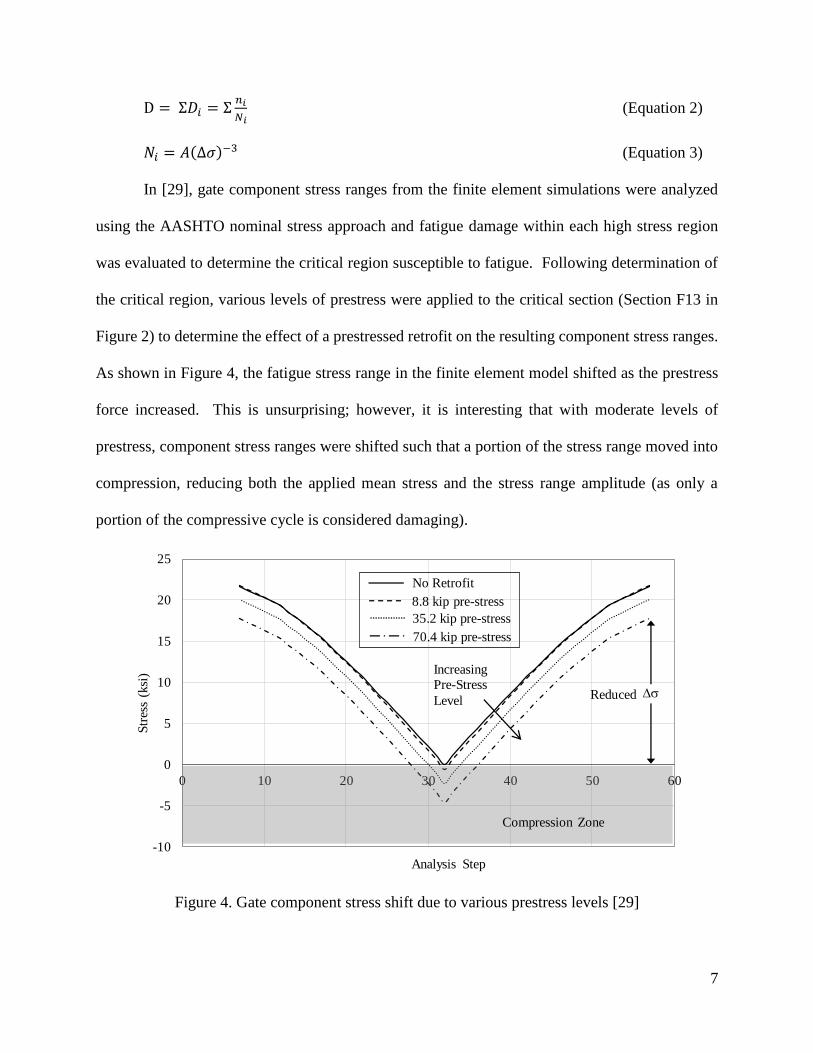
Figure 2) to determine the effect of a prestressed retrofit on the resulting component stress ranges.
As shown in Figure 4, the fatigue stress range in the finite element model shifted as the prestress
force increased. This is unsurprising; however, it is interesting that with moderate levels of
prestress, component stress ranges were shifted such that a portion of the stress range moved into
compression, reducing both the applied mean stress and the stress range amplitude (as only a
portion of the compressive cycle is considered damaging).
Figure 4. Gate component stress shift due to various prestress levels [29]
-10
-5
0
5
10
15
20
25
0 10 20 30 40 50 60
Str
ess
(ksi
)
Analysis Step
Increasing
Pre-Stress
Level
Compression Zone
No Retrofit
8.8 kip pre-stress
35.2 kip pre-stress
70.4 kip pre-stress
DsReduced
8
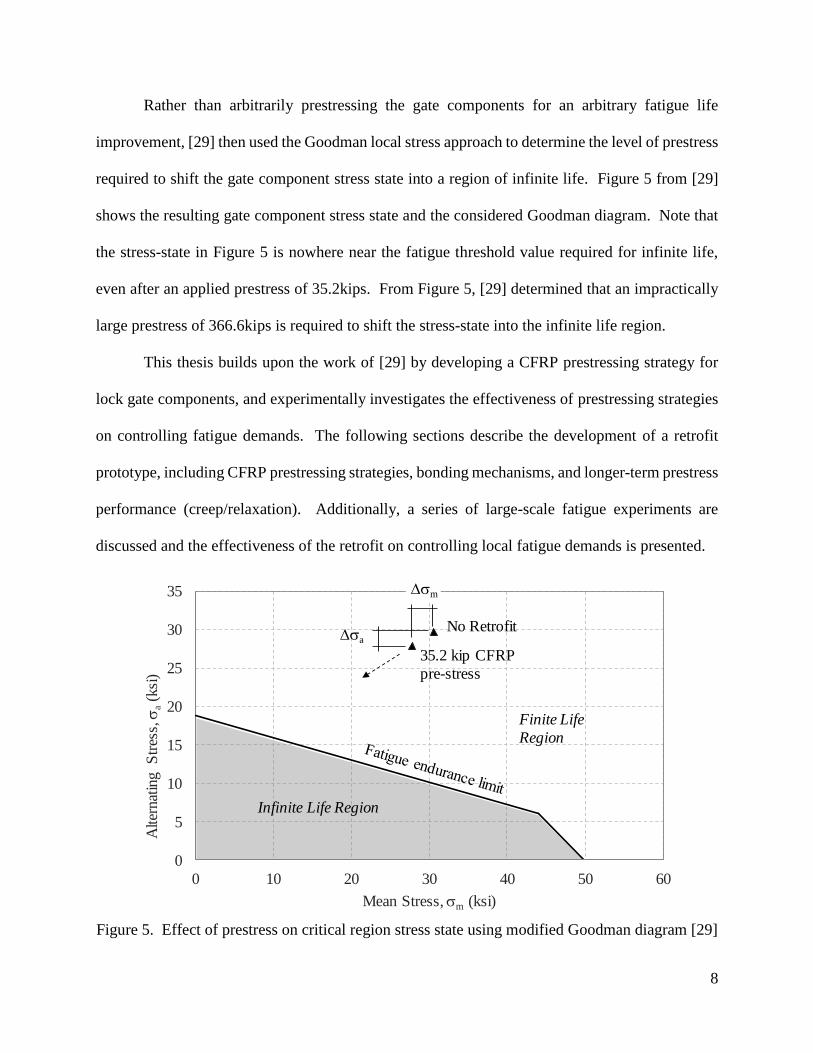
Rather than arbitrarily prestressing the gate components for an arbitrary fatigue life
improvement, [29] then used the Goodman local stress approach to determine the level of prestress
required to shift the gate component stress state into a region of infinite life. Figure 5 from [29]
shows the resulting gate component stress state and the considered Goodman diagram. Note that
the stress-state in Figure 5 is nowhere near the fatigue threshold value required for infinite life,
even after an applied prestress of 35.2kips. From Figure 5, [29] determined that an impractically
large prestress of 366.6kips is required to shift the stress-state into the infinite life region.
This thesis builds upon the work of [29] by developing a CFRP prestressing strategy for
lock gate components, and experimentally investigates the effectiveness of prestressing strategies
on controlling fatigue demands. The following sections describe the development of a retrofit
prototype, including CFRP prestressing strategies, bonding mechanisms, and longer-term prestress
performance (creep/relaxation). Additionally, a series of large-scale fatigue experiments are
discussed and the effectiveness of the retrofit on controlling local fatigue demands is presented.
Figure 5. Effect of prestress on critical region stress state using modified Goodman diagram [29]
0
5
10
15
20
25
30
35
0 10 20 30 40 50 60
Alter
nat
ing
Str
ess,
sa
(ksi
)
Mean Stress, sm (ksi)
No Retrofit
35.2 kip CFRP
pre-stress
Dsa
Dsm
Infinite Life Region
Finite Life
Region
9
3. Development of a Fatigue Retrofit Prototype
While the prestress required for infinite fatigue life in [29] may be impractically large for
a retrofit scenario, the analyses in [29] indicate that moderate prestress levels are capable of
significantly extending gate fatigue life (8.6 year extension at 32.5kip prestress). In the retrofit
development of this study, the prestress is chosen to be applied through CFRP plates; however,
corrosion precautions must be taken because the CFRP material functions as the cathode in the
galvanic reaction with the low-carbon steel anode, promoting steel corrosion. To avoid negative
corrosion effects from the retrofit on the lock gate component, the CFRP in the retrofit will need
to avoid contact with any gate components (forcing an un-bonded CFRP retrofit application).
To develop prestress within the CFRP material and transfer the prestress into the gate
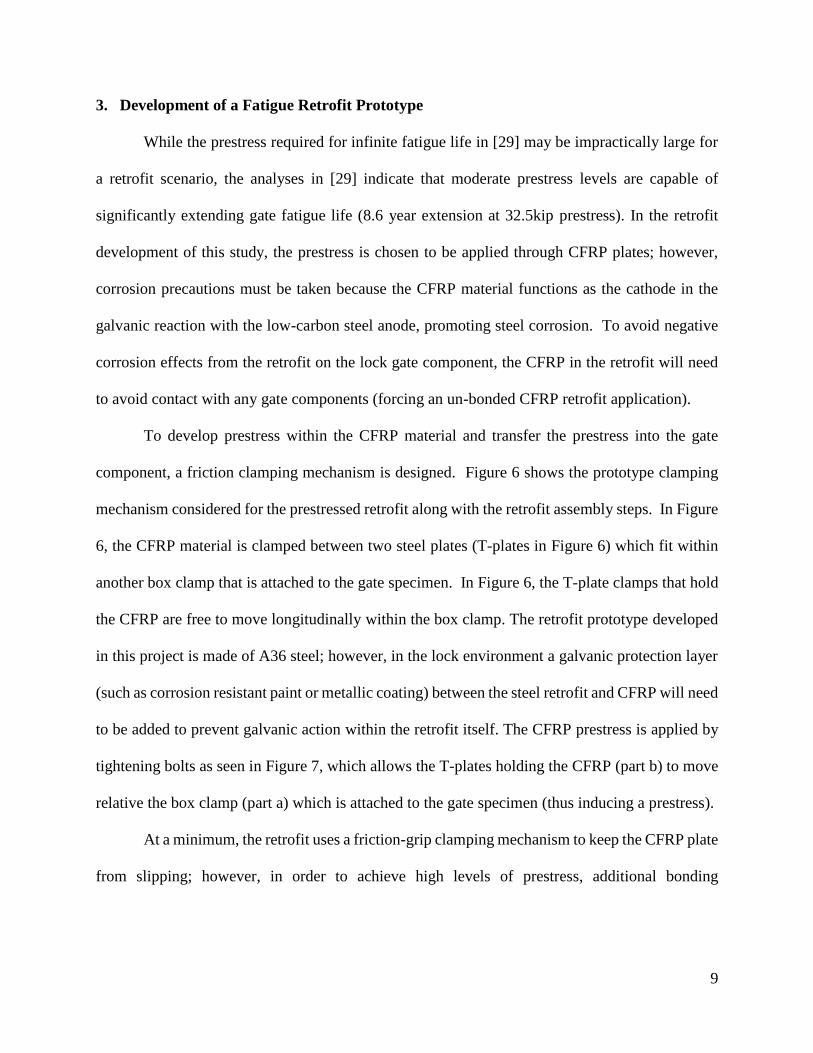
component, a friction clamping mechanism is designed. Figure 6 shows the prototype clamping
mechanism considered for the prestressed retrofit along with the retrofit assembly steps. In Figure
6, the CFRP material is clamped between two steel plates (T-plates in Figure 6) which fit within
another box clamp that is attached to the gate specimen. In Figure 6, the T-plate clamps that hold
the CFRP are free to move longitudinally within the box clamp. The retrofit prototype developed
in this project is made of A36 steel; however, in the lock environment a galvanic protection layer
(such as corrosion resistant paint or metallic coating) between the steel retrofit and CFRP will need
to be added to prevent galvanic action within the retrofit itself. The CFRP prestress is applied by
tightening bolts as seen in Figure 7, which allows the T-plates holding the CFRP (part b) to move
relative the box clamp (part a) which is attached to the gate specimen (thus inducing a prestress).
At a minimum, the retrofit uses a friction-grip clamping mechanism to keep the CFRP plate
from slipping; however, in order to achieve high levels of prestress, additional bonding
10
mechanisms may be needed. The next section investigates several CFRP-to-steel bonding
strategies to achieve high levels of prestress.
Figure 6. Retrofit components and assembly steps for the CFRP retrofit
Figure 7. Cross-section of prestress bearing mechanism with forces applied by bolts to create the
prestress [29]
3.1. Investigation into Retrofit Bonding Strategies for Achieving Desired Prestress Levels and
Preventing Prestress Losses
In order for the retrofit to be effective in reducing stresses within the critical gate
components, the induced CFRP prestress must be maintained over long durations of time. To
investigate the available prestress that can be applied and to understand any prestress losses due to
relaxation and creep of the retrofit materials, bonding experiments were conducted for both static
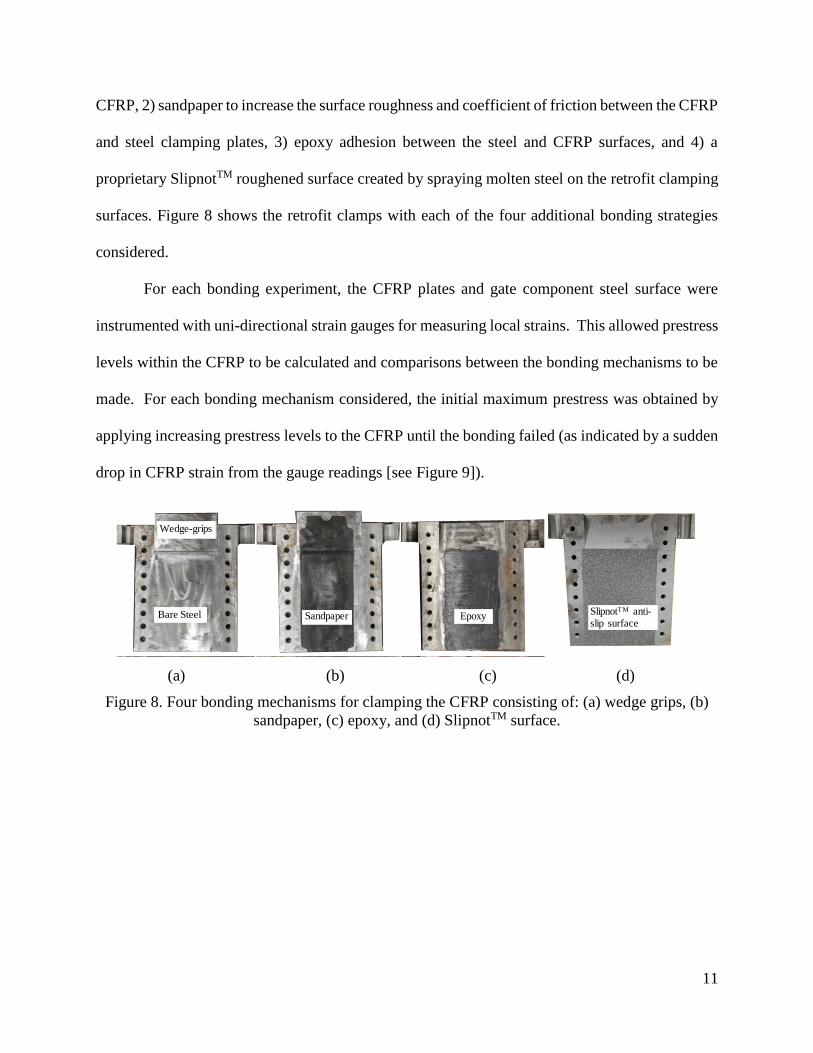
slip and longer duration prestress losses. In this study four bonding mechanisms in addition to the
bare-steel friction clamps were considered: 1) wedge grips to provide additional clamping of the
11
CFRP, 2) sandpaper to increase the surface roughness and coefficient of friction between the CFRP
and steel clamping plates, 3) epoxy adhesion between the steel and CFRP surfaces, and 4) a
proprietary SlipnotTM roughened surface created by spraying molten steel on the retrofit clamping
surfaces. Figure 8 shows the retrofit clamps with each of the four additional bonding strategies
considered.
For each bonding experiment, the CFRP plates and gate component steel surface were
instrumented with uni-directional strain gauges for measuring local strains. This allowed prestress
levels within the CFRP to be calculated and comparisons between the bonding mechanisms to be
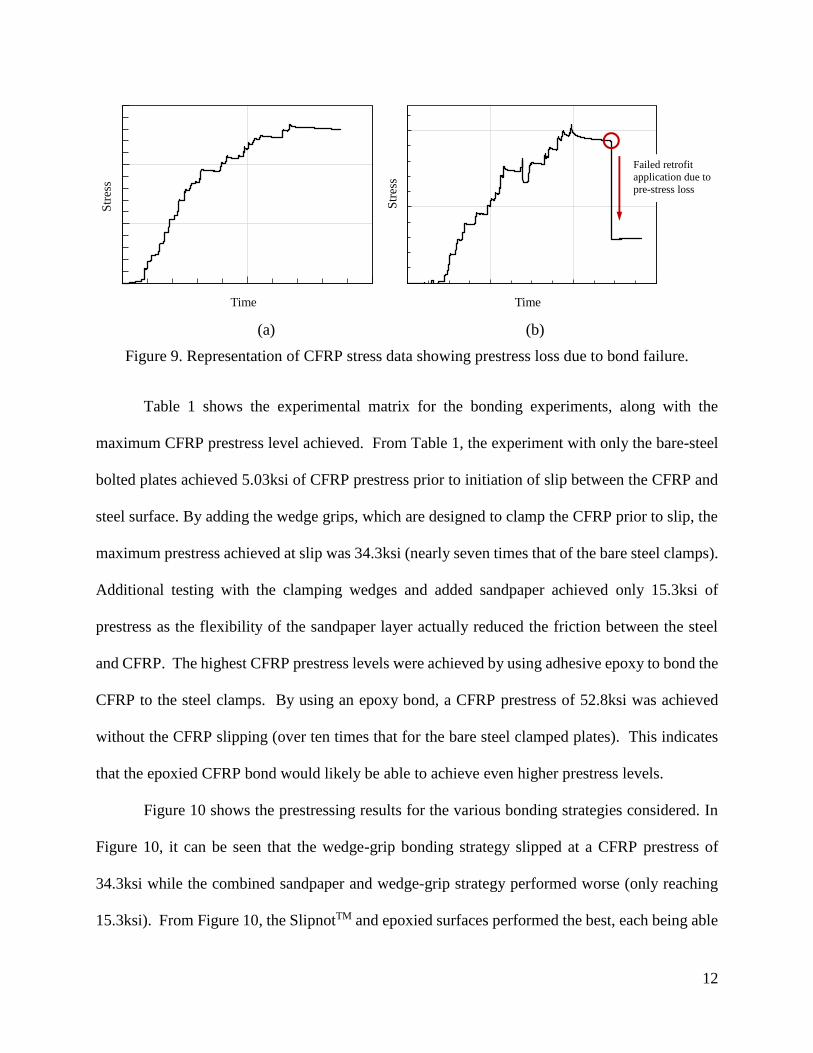
made. For each bonding mechanism considered, the initial maximum prestress was obtained by
applying increasing prestress levels to the CFRP until the bonding failed (as indicated by a sudden
drop in CFRP strain from the gauge readings [see Figure 9]).
Figure 8. Four bonding mechanisms for clamping the CFRP consisting of: (a) wedge grips, (b)
sandpaper, (c) epoxy, and (d) SlipnotTM surface.
SlipnotTM anti-slip surface
EpoxySandpaper
Wedge-grips
Bare Steel
(a) (b) (c) (d)
12
Figure 9. Representation of CFRP stress data showing prestress loss due to bond failure.
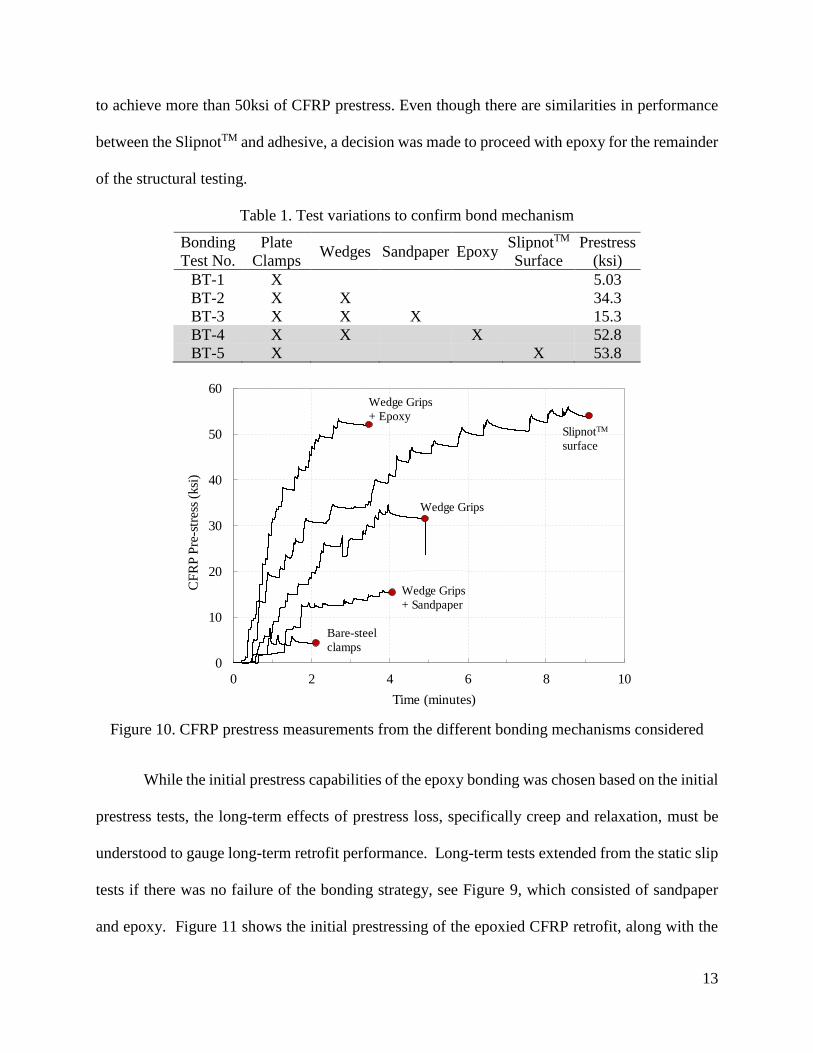
Table 1 shows the experimental matrix for the bonding experiments, along with the
maximum CFRP prestress level achieved. From Table 1, the experiment with only the bare-steel
bolted plates achieved 5.03ksi of CFRP prestress prior to initiation of slip between the CFRP and
steel surface. By adding the wedge grips, which are designed to clamp the CFRP prior to slip, the
maximum prestress achieved at slip was 34.3ksi (nearly seven times that of the bare steel clamps).
Additional testing with the clamping wedges and added sandpaper achieved only 15.3ksi of
prestress as the flexibility of the sandpaper layer actually reduced the friction between the steel
and CFRP. The highest CFRP prestress levels were achieved by using adhesive epoxy to bond the
CFRP to the steel clamps. By using an epoxy bond, a CFRP prestress of 52.8ksi was achieved
without the CFRP slipping (over ten times that for the bare steel clamped plates). This indicates
that the epoxied CFRP bond would likely be able to achieve even higher prestress levels.
Figure 10 shows the prestressing results for the various bonding strategies considered. In
Figure 10, it can be seen that the wedge-grip bonding strategy slipped at a CFRP prestress of
34.3ksi while the combined sandpaper and wedge-grip strategy performed worse (only reaching
15.3ksi). From Figure 10, the SlipnotTM and epoxied surfaces performed the best, each being able
Str
ess
Time
Str
ess
Time
Failed retrofit
application due to
pre-stress loss
(a) (b)
13
to achieve more than 50ksi of CFRP prestress. Even though there are similarities in performance
between the SlipnotTM and adhesive, a decision was made to proceed with epoxy for the remainder
of the structural testing.
Table 1. Test variations to confirm bond mechanism
Bonding
Test No.
Plate
Clamps Wedges Sandpaper Epoxy
SlipnotTM
Surface
Prestress
(ksi)
BT-1 X 5.03
BT-2 X X 34.3
BT-3 X X X 15.3
BT-4 X X X 52.8
BT-5 X X 53.8
Figure 10. CFRP prestress measurements from the different bonding mechanisms considered
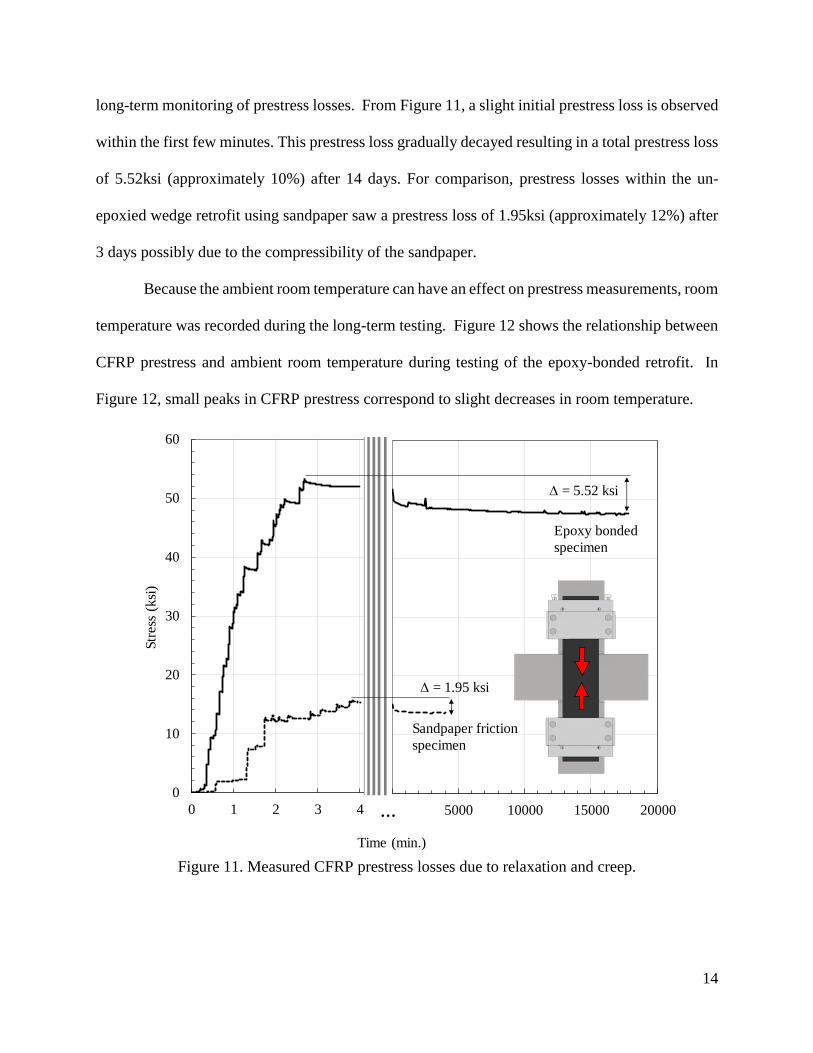
While the initial prestress capabilities of the epoxy bonding was chosen based on the initial
prestress tests, the long-term effects of prestress loss, specifically creep and relaxation, must be
understood to gauge long-term retrofit performance. Long-term tests extended from the static slip
tests if there was no failure of the bonding strategy, see Figure 9, which consisted of sandpaper
and epoxy. Figure 11 shows the initial prestressing of the epoxied CFRP retrofit, along with the
0
10
20
30
40
50
60
0 2 4 6 8 10
CF
RP
Pre
-str
ess
(ksi
)
Time (minutes)
Wedge Grips
+ Epoxy
Wedge Grips
Bare-steel
clamps
Wedge Grips
+ Sandpaper
SlipnotTM
surface
14
long-term monitoring of prestress losses. From Figure 11, a slight initial prestress loss is observed
within the first few minutes. This prestress loss gradually decayed resulting in a total prestress loss
of 5.52ksi (approximately 10%) after 14 days. For comparison, prestress losses within the un-
epoxied wedge retrofit using sandpaper saw a prestress loss of 1.95ksi (approximately 12%) after
3 days possibly due to the compressibility of the sandpaper.
Because the ambient room temperature can have an effect on prestress measurements, room
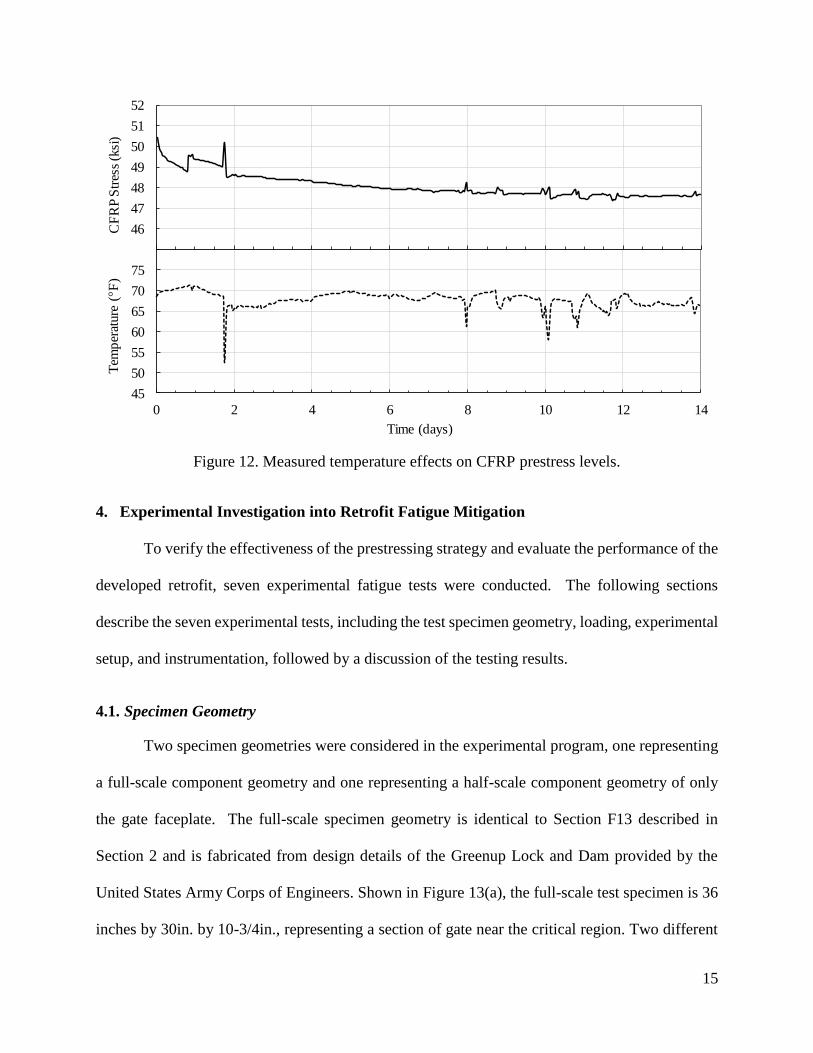
temperature was recorded during the long-term testing. Figure 12 shows the relationship between
CFRP prestress and ambient room temperature during testing of the epoxy-bonded retrofit. In
Figure 12, small peaks in CFRP prestress correspond to slight decreases in room temperature.
Figure 11. Measured CFRP prestress losses due to relaxation and creep.
0
10
20
30
40
50
60
0 1 2 3 4
Str
ess
(ksi
)
0 5000 10000 15000 20000
Time (min.)
...
Epoxy bonded
specimen
Sandpaper friction
specimen
D = 1.95 ksi
D = 5.52 ksi
15
Figure 12. Measured temperature effects on CFRP prestress levels.
4. Experimental Investigation into Retrofit Fatigue Mitigation
To verify the effectiveness of the prestressing strategy and evaluate the performance of the
developed retrofit, seven experimental fatigue tests were conducted. The following sections
describe the seven experimental tests, including the test specimen geometry, loading, experimental
setup, and instrumentation, followed by a discussion of the testing results.
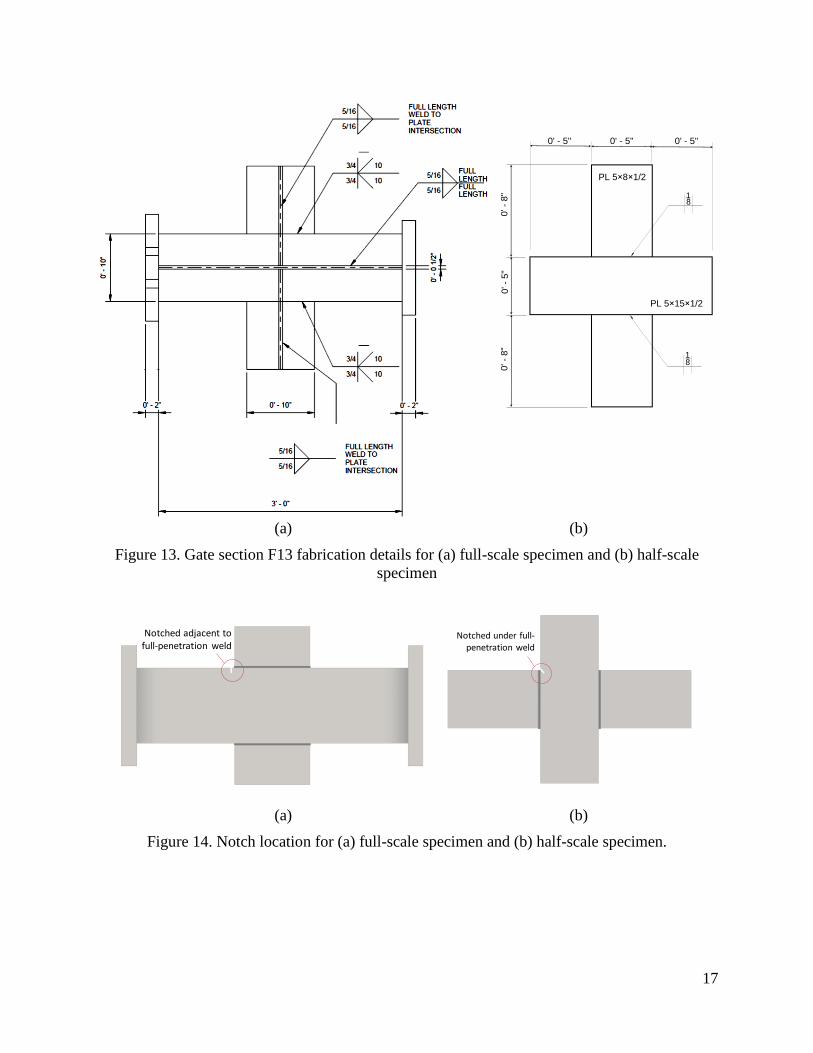
4.1. Specimen Geometry
Two specimen geometries were considered in the experimental program, one representing
a full-scale component geometry and one representing a half-scale component geometry of only
the gate faceplate. The full-scale specimen geometry is identical to Section F13 described in
Section 2 and is fabricated from design details of the Greenup Lock and Dam provided by the
United States Army Corps of Engineers. Shown in Figure 13(a), the full-scale test specimen is 36
inches by 30in. by 10-3/4in., representing a section of gate near the critical region. Two different
45
50
55
60
65
70
75
80
0 2 4 6 8 10 12 14
Tem
per
ature
( F
)
Time (days)
45
46
47
48
49
50
51
52C
FR
P S
tres
s (k
si)
16
weld types join the full-scale test specimen plates. As shown in Figure 13(a), the welds consist of
double-sided 3/4in. bevel welds and 5/16in. fillet welds. The specimen is designed with two
attachment plates connected to each end as seen in Figure 13. These attachment plates are 2in. in
thickness to avoid prying effects that cause unwanted stresses on the connections to the frame
instead of strictly tensile forces on the specimen. Figure 13(b) shows the half-scale specimen
dimensions and fabrication details.
All gate specimens tested were notched near the plate intersection welds (see Figure 14)
using abrasive cutting discs prior to testing. These notches were added to the specimens to induce
local stress concentrations (simulating gate component damage) and to create a worsened fatigue
condition.
17
(a) (b)
Figure 13. Gate section F13 fabrication details for (a) full-scale specimen and (b) half-scale
specimen
(a) (b)
Figure 14. Notch location for (a) full-scale specimen and (b) half-scale specimen.
0' - 5"
0'-
5"
18
18
0'-
8"
0'-
8"
0' - 5" 0' - 5"
PL 5 15 1/2
PL 5 8 1/2
Notched adjacent to full-penetration weld
Notched under full-penetration weld
18
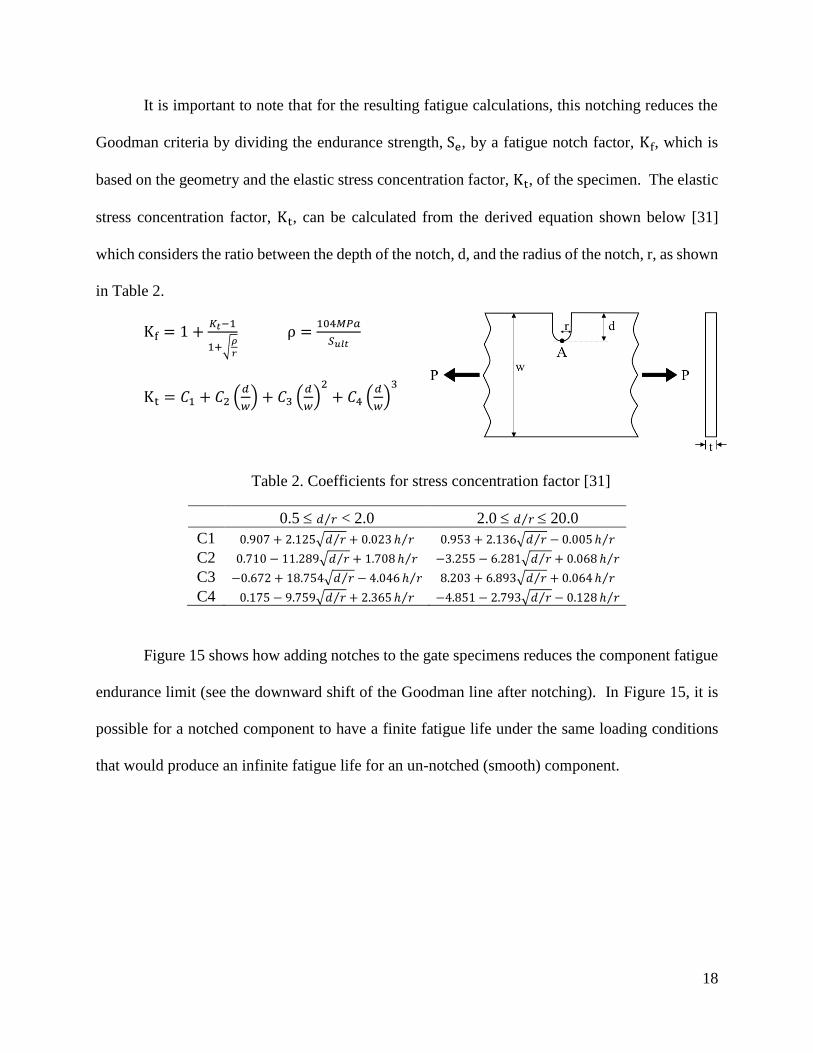
It is important to note that for the resulting fatigue calculations, this notching reduces the
Goodman criteria by dividing the endurance strength, Se, by a fatigue notch factor, Kf, which is
based on the geometry and the elastic stress concentration factor, Kt, of the specimen. The elastic
stress concentration factor, Kt, can be calculated from the derived equation shown below [31]
which considers the ratio between the depth of the notch, d, and the radius of the notch, r, as shown
in Table 2.
Kf = 1 +𝐾𝑡−1
1+√𝜌
𝑟
ρ =104𝑀𝑃𝑎
𝑆𝑢𝑙𝑡
Kt = 𝐶1 + 𝐶2 (𝑑
𝑤) + 𝐶3 (
𝑑
𝑤)
2
+ 𝐶4 (𝑑
𝑤)
3
Table 2. Coefficients for stress concentration factor [31]
0.5 𝑑 𝑟⁄ < 2.0 2.0 𝑑 𝑟⁄ 20.0
C1 0.907 + 2.125√𝑑 𝑟⁄ + 0.023 ℎ 𝑟⁄ 0.953 + 2.136√𝑑 𝑟⁄ − 0.005 ℎ 𝑟⁄
C2 0.710 − 11.289√𝑑 𝑟⁄ + 1.708 ℎ 𝑟⁄ −3.255 − 6.281√𝑑 𝑟⁄ + 0.068 ℎ 𝑟⁄
C3 −0.672 + 18.754√𝑑 𝑟⁄ − 4.046 ℎ 𝑟⁄ 8.203 + 6.893√𝑑 𝑟⁄ + 0.064 ℎ 𝑟⁄
C4 0.175 − 9.759√𝑑 𝑟⁄ + 2.365 ℎ 𝑟⁄ −4.851 − 2.793√𝑑 𝑟⁄ − 0.128 ℎ 𝑟⁄
Figure 15 shows how adding notches to the gate specimens reduces the component fatigue
endurance limit (see the downward shift of the Goodman line after notching). In Figure 15, it is
possible for a notched component to have a finite fatigue life under the same loading conditions
that would produce an infinite fatigue life for an un-notched (smooth) component.
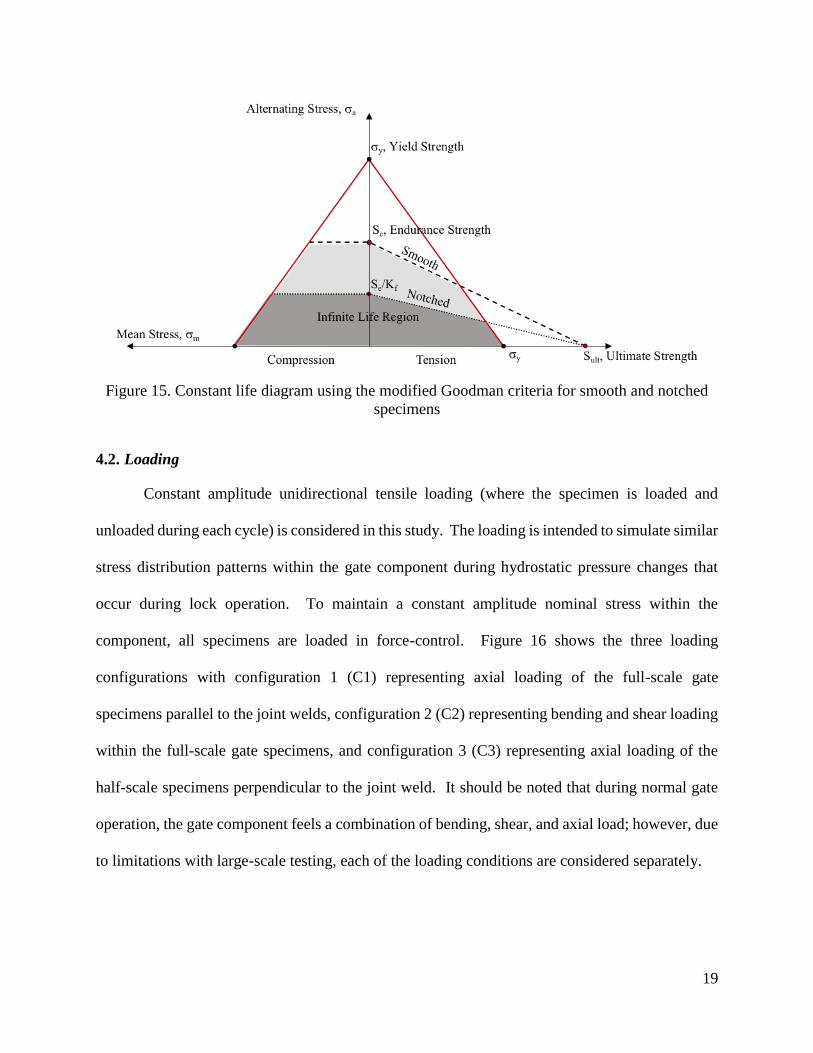
19
Figure 15. Constant life diagram using the modified Goodman criteria for smooth and notched
specimens
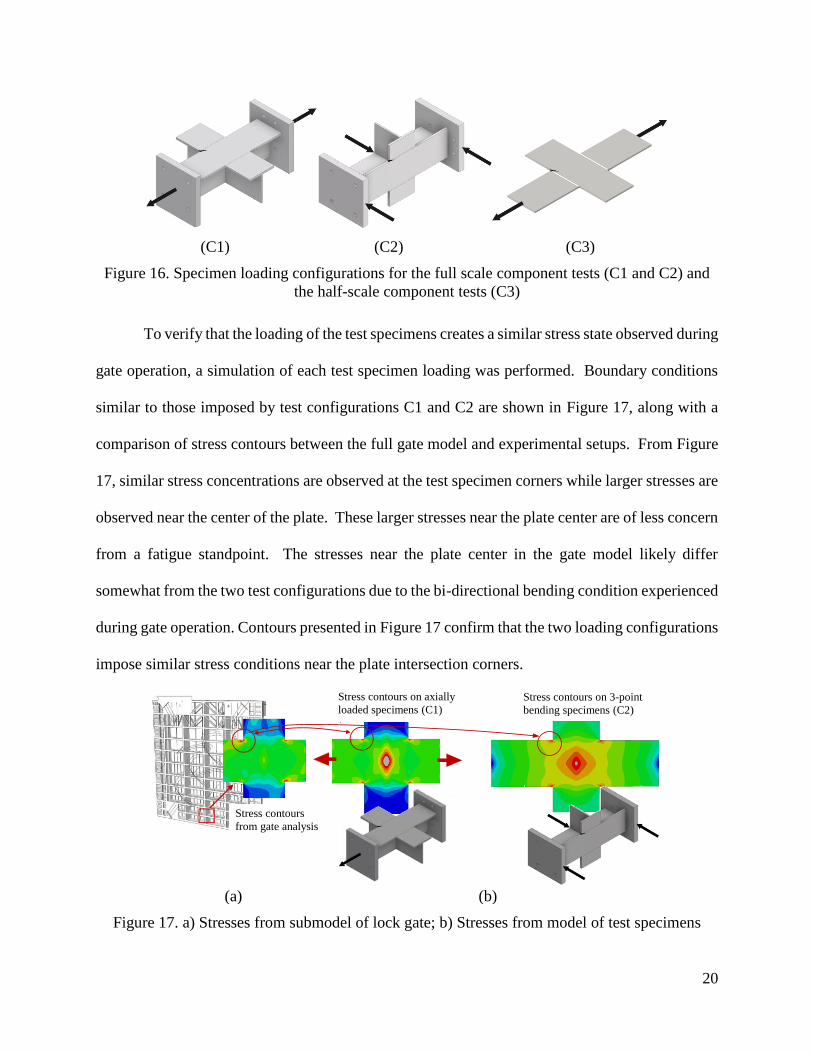
4.2. Loading
Constant amplitude unidirectional tensile loading (where the specimen is loaded and
unloaded during each cycle) is considered in this study. The loading is intended to simulate similar
stress distribution patterns within the gate component during hydrostatic pressure changes that
occur during lock operation. To maintain a constant amplitude nominal stress within the
component, all specimens are loaded in force-control. Figure 16 shows the three loading
configurations with configuration 1 (C1) representing axial loading of the full-scale gate
specimens parallel to the joint welds, configuration 2 (C2) representing bending and shear loading
within the full-scale gate specimens, and configuration 3 (C3) representing axial loading of the
half-scale specimens perpendicular to the joint weld. It should be noted that during normal gate
operation, the gate component feels a combination of bending, shear, and axial load; however, due
to limitations with large-scale testing, each of the loading conditions are considered separately.
20
Figure 16. Specimen loading configurations for the full scale component tests (C1 and C2) and
the half-scale component tests (C3)
To verify that the loading of the test specimens creates a similar stress state observed during
gate operation, a simulation of each test specimen loading was performed. Boundary conditions
similar to those imposed by test configurations C1 and C2 are shown in Figure 17, along with a
comparison of stress contours between the full gate model and experimental setups. From Figure
17, similar stress concentrations are observed at the test specimen corners while larger stresses are
observed near the center of the plate. These larger stresses near the plate center are of less concern
from a fatigue standpoint. The stresses near the plate center in the gate model likely differ
somewhat from the two test configurations due to the bi-directional bending condition experienced
during gate operation. Contours presented in Figure 17 confirm that the two loading configurations
impose similar stress conditions near the plate intersection corners.
(a) (b)
Figure 17. a) Stresses from submodel of lock gate; b) Stresses from model of test specimens
Stress contours from
gate analysis Stress contours from analysis
of experimental setup
Similar concentration location
near weld (different magnitude due to test load)
Actuator
loading
Stress contours
from gate analysis
Stress contours on axially
loaded specimens (C1)Stress contours on 3-point
bending specimens (C2)
(C1) (C2) (C3)
21
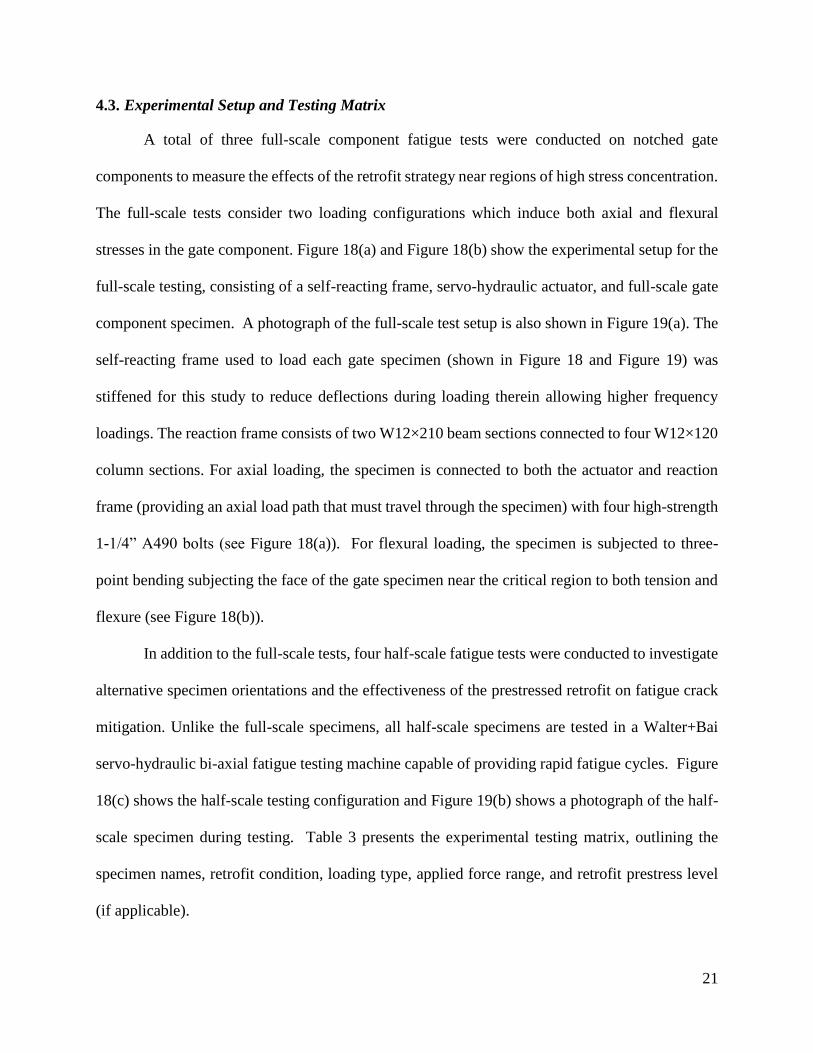
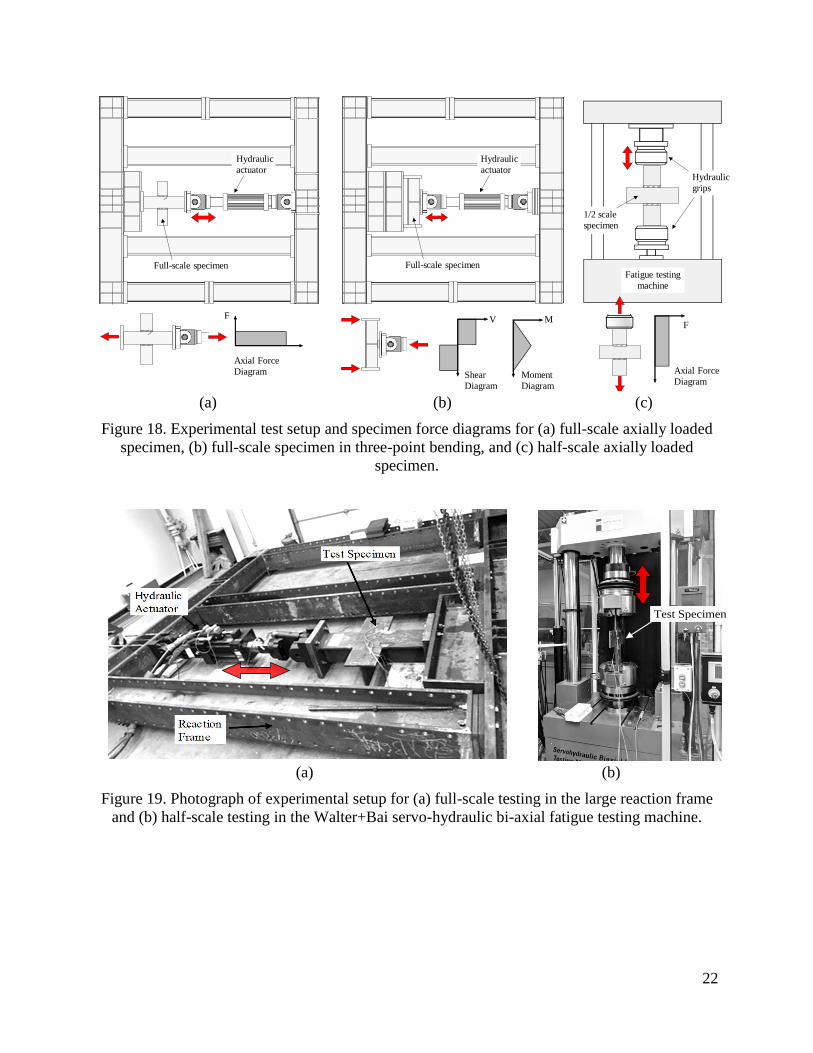
4.3. Experimental Setup and Testing Matrix
A total of three full-scale component fatigue tests were conducted on notched gate
components to measure the effects of the retrofit strategy near regions of high stress concentration.
The full-scale tests consider two loading configurations which induce both axial and flexural
stresses in the gate component. Figure 18(a) and Figure 18(b) show the experimental setup for the
full-scale testing, consisting of a self-reacting frame, servo-hydraulic actuator, and full-scale gate
component specimen. A photograph of the full-scale test setup is also shown in Figure 19(a). The
self-reacting frame used to load each gate specimen (shown in Figure 18 and Figure 19) was
stiffened for this study to reduce deflections during loading therein allowing higher frequency
loadings. The reaction frame consists of two W12×210 beam sections connected to four W12×120
column sections. For axial loading, the specimen is connected to both the actuator and reaction
frame (providing an axial load path that must travel through the specimen) with four high-strength
1-1/4” A490 bolts (see Figure 18(a)). For flexural loading, the specimen is subjected to three-
point bending subjecting the face of the gate specimen near the critical region to both tension and
flexure (see Figure 18(b)).
In addition to the full-scale tests, four half-scale fatigue tests were conducted to investigate
alternative specimen orientations and the effectiveness of the prestressed retrofit on fatigue crack
mitigation. Unlike the full-scale specimens, all half-scale specimens are tested in a Walter+Bai
servo-hydraulic bi-axial fatigue testing machine capable of providing rapid fatigue cycles. Figure
18(c) shows the half-scale testing configuration and Figure 19(b) shows a photograph of the half-
scale specimen during testing. Table 3 presents the experimental testing matrix, outlining the
specimen names, retrofit condition, loading type, applied force range, and retrofit prestress level
(if applicable).
22
Figure 18. Experimental test setup and specimen force diagrams for (a) full-scale axially loaded
specimen, (b) full-scale specimen in three-point bending, and (c) half-scale axially loaded
specimen.
Figure 19. Photograph of experimental setup for (a) full-scale testing in the large reaction frame
and (b) half-scale testing in the Walter+Bai servo-hydraulic bi-axial fatigue testing machine.
F
Axial Force
Diagram
V
Shear
Diagram
M
Moment
Diagram
F
Axial Force
Diagram
1/2 scale
specimen
Hydraulic
grips
Fatigue testing
machine
Hydraulic
actuator
Full-scale specimen Full-scale specimen
Hydraulic
actuator
(a) (b) (c) (a) (b) (c)
(a) (b)
Test Specimen
(a) (b)
23
Table 3. Experimental test matrix
Experimental
test No.
Retrofit
(Y/N)
Loading
type
Loading
frequency
(Hz)
Applied
force range
(kips)
Applied
retrofit
prestress
level (ksi)
C1-1 N Axial 2 – 6 50 – 80 --
C2-1 N 3-point 2 – 6 80 --
C2-2 Y 3-point 2 – 6 80 7.3 – 17.3
C3-1 N Axial 2 19.6 --
C3-2 Y Axial 2 19.6 7.2 – 18.0
C3-3 N Axial 2 – 8 19.6 --
C3-4 Y Axial 2 – 8 19.6 13.65
4.4. Instrumentation and Monitoring
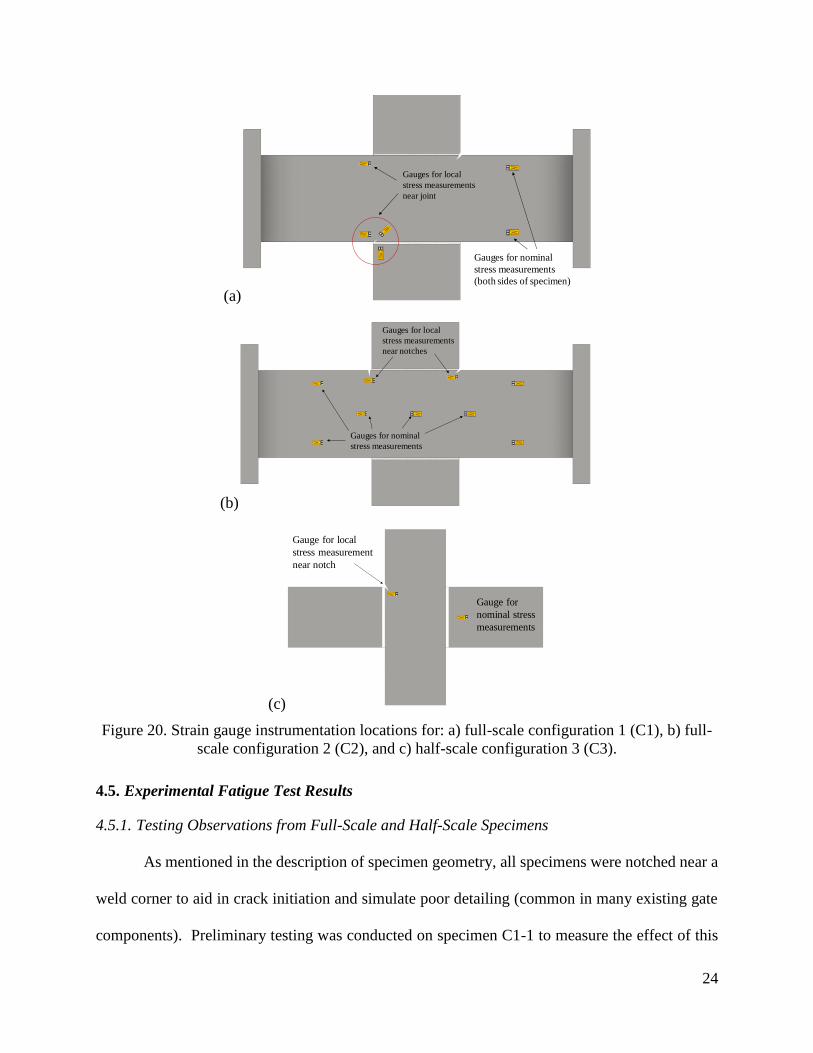
Each experimental specimen was instrumented with multiple strain gauges to monitor local
component stresses during loading. These gauges were located near the notched regions to
measure local stress concentrations resulting from the geometry discontinuities, as well as regions
away from any local influences to measure nominal specimen stresses. Figure 20 shows the
orientation and location of instrumentation for the C1, C2, and C3 specimen configurations. Note
that gauges are provided on both sides of the steel plate to allow for separation of measured
bending and axial stresses.
In addition to the instrumentation, non-destructive monitoring techniques were used to
identify and track the presence of fatigue cracking. The crack detection method used in this study
involves visual inspection aided by dye penetrant. It should be noted that while the dye penetrant
was the primary means for identifying crack initiation, post-test analysis of the strain gage data
also helped in identifying the presence of cracking through measurement of local force changes.
24
(a)
(b)
(c)
Figure 20. Strain gauge instrumentation locations for: a) full-scale configuration 1 (C1), b) full-
scale configuration 2 (C2), and c) half-scale configuration 3 (C3).
4.5. Experimental Fatigue Test Results
4.5.1. Testing Observations from Full-Scale and Half-Scale Specimens
As mentioned in the description of specimen geometry, all specimens were notched near a
weld corner to aid in crack initiation and simulate poor detailing (common in many existing gate
components). Preliminary testing was conducted on specimen C1-1 to measure the effect of this
Gauges for local
stress measurements
near joint
Gauges for nominal
stress measurements
(both sides of specimen)
Gauges for nominal
stress measurements
Gauges for local
stress measurements
near notches
Gauge for
nominal stress
measurements
Gauge for local
stress measurement
near notch
25
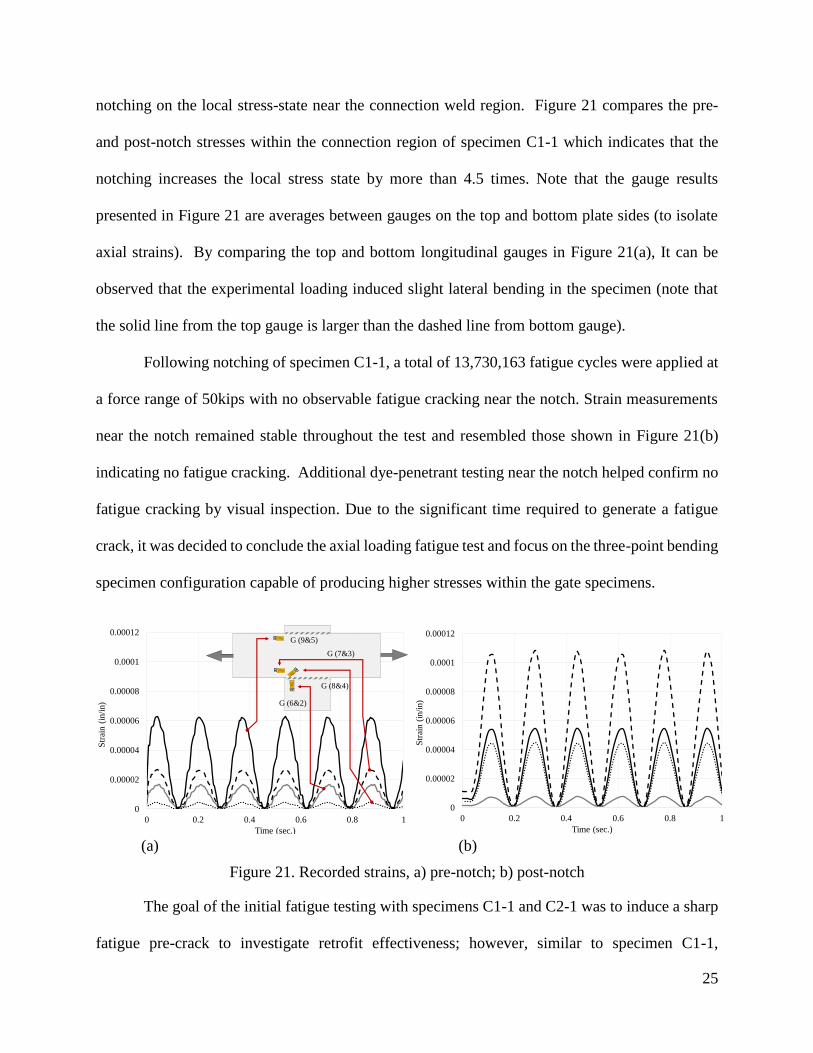
notching on the local stress-state near the connection weld region. Figure 21 compares the pre-
and post-notch stresses within the connection region of specimen C1-1 which indicates that the
notching increases the local stress state by more than 4.5 times. Note that the gauge results
presented in Figure 21 are averages between gauges on the top and bottom plate sides (to isolate
axial strains). By comparing the top and bottom longitudinal gauges in Figure 21(a), It can be
observed that the experimental loading induced slight lateral bending in the specimen (note that
the solid line from the top gauge is larger than the dashed line from bottom gauge).
Following notching of specimen C1-1, a total of 13,730,163 fatigue cycles were applied at
a force range of 50kips with no observable fatigue cracking near the notch. Strain measurements
near the notch remained stable throughout the test and resembled those shown in Figure 21(b)
indicating no fatigue cracking. Additional dye-penetrant testing near the notch helped confirm no
fatigue cracking by visual inspection. Due to the significant time required to generate a fatigue
crack, it was decided to conclude the axial loading fatigue test and focus on the three-point bending
specimen configuration capable of producing higher stresses within the gate specimens.
Figure 21. Recorded strains, a) pre-notch; b) post-notch
The goal of the initial fatigue testing with specimens C1-1 and C2-1 was to induce a sharp
fatigue pre-crack to investigate retrofit effectiveness; however, similar to specimen C1-1,
0
0.00002
0.00004
0.00006
0.00008
0.0001
0.00012
0 0.2 0.4 0.6 0.8 1
Str
ain (
in/i
n)
Time (sec.)
0
0.00002
0.00004
0.00006
0.00008
0.0001
0.00012
0 0.2 0.4 0.6 0.8 1
Str
ain (
in/i
n)
Time (sec.)
G (9&5)
G (7&3)
G (8&4)
G (6&2)
a) b) (a) (b)
26
specimen C2-1 (loaded in three-point bending at a force range of 80kips) was subjected to
4,598,234 fatigue cycles with no observable fatigue crack forming at the notch. Rather than
continue with the fatigue crack initiation experiments, it was decided to use the local stress
concentration from the induced notch to investigate the local stress effects of the prestressed
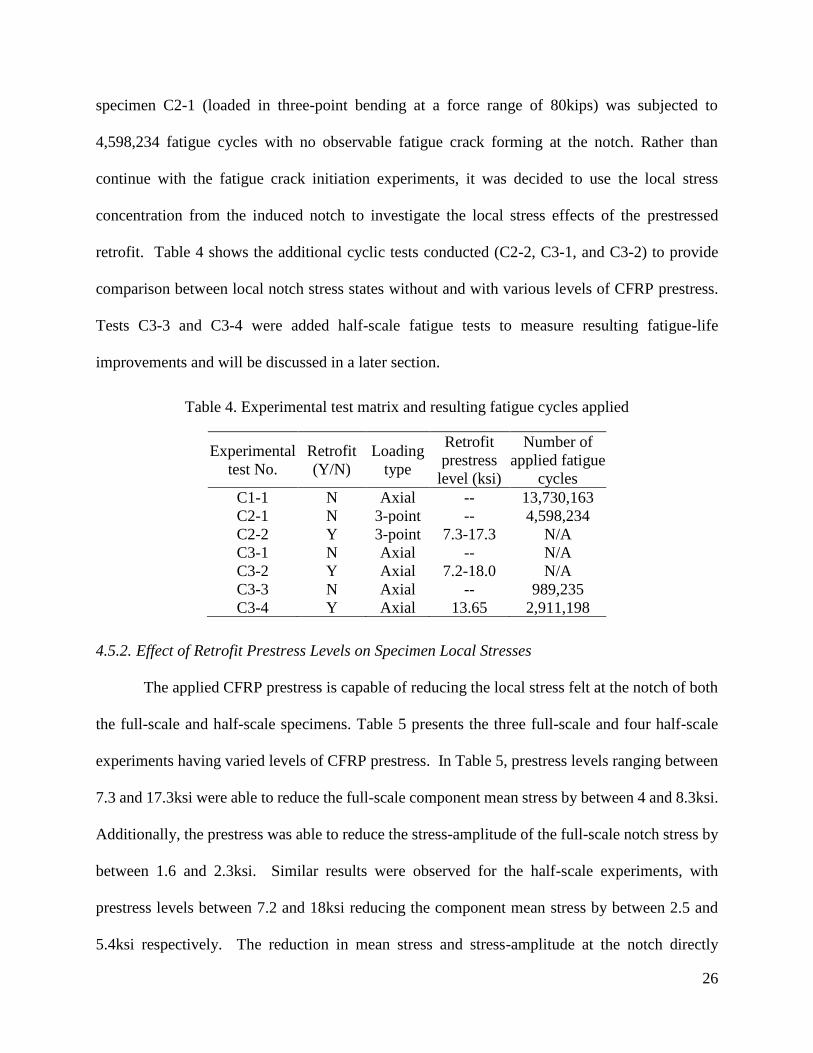
retrofit. Table 4 shows the additional cyclic tests conducted (C2-2, C3-1, and C3-2) to provide
comparison between local notch stress states without and with various levels of CFRP prestress.
Tests C3-3 and C3-4 were added half-scale fatigue tests to measure resulting fatigue-life
improvements and will be discussed in a later section.
Table 4. Experimental test matrix and resulting fatigue cycles applied
Experimental
test No.
Retrofit
(Y/N)
Loading
type
Retrofit
prestress
level (ksi)
Number of
applied fatigue
cycles
C1-1 N Axial -- 13,730,163
C2-1 N 3-point -- 4,598,234
C2-2 Y 3-point 7.3-17.3 N/A
C3-1 N Axial -- N/A
C3-2 Y Axial 7.2-18.0 N/A
C3-3 N Axial -- 989,235
C3-4 Y Axial 13.65 2,911,198
4.5.2. Effect of Retrofit Prestress Levels on Specimen Local Stresses
The applied CFRP prestress is capable of reducing the local stress felt at the notch of both
the full-scale and half-scale specimens. Table 5 presents the three full-scale and four half-scale
experiments having varied levels of CFRP prestress. In Table 5, prestress levels ranging between
7.3 and 17.3ksi were able to reduce the full-scale component mean stress by between 4 and 8.3ksi.
Additionally, the prestress was able to reduce the stress-amplitude of the full-scale notch stress by
between 1.6 and 2.3ksi. Similar results were observed for the half-scale experiments, with
prestress levels between 7.2 and 18ksi reducing the component mean stress by between 2.5 and
5.4ksi respectively. The reduction in mean stress and stress-amplitude at the notch directly
27
translates to increased fatigue life. Figure 22 shows the effect of prestress level on stress-range
and mean stress for the full-scale experiments. In Figure 22, a noticeable downward shift can be
seen as the prestress level in the CFRP is increased.
Table 5. Mean and amplitude stress shift due to CFRP prestress level
Specimen
Type
Applied
force range
(kips)
Retrofit
prestress
level (ksi)
Reduction in
component mean
stress (ksi)
Reduction in
component stress
amplitude (ksi)
Full-Scale 80 7.30 4.0 1.6
Full-Scale 80 14.8 7.7 2.2
Full-Scale 80 17.3 8.3 2.3
Half-Scale 19.6 7.20 2.5 0.7
Half-Scale 19.6 10.6 3.4 1.2
Half-Scale 19.6 12.5 4.0 1.5
Half-Scale 19.6 18.0 5.4 2.3
Figure 22. Effect of CFRP prestress on local notch stress state.
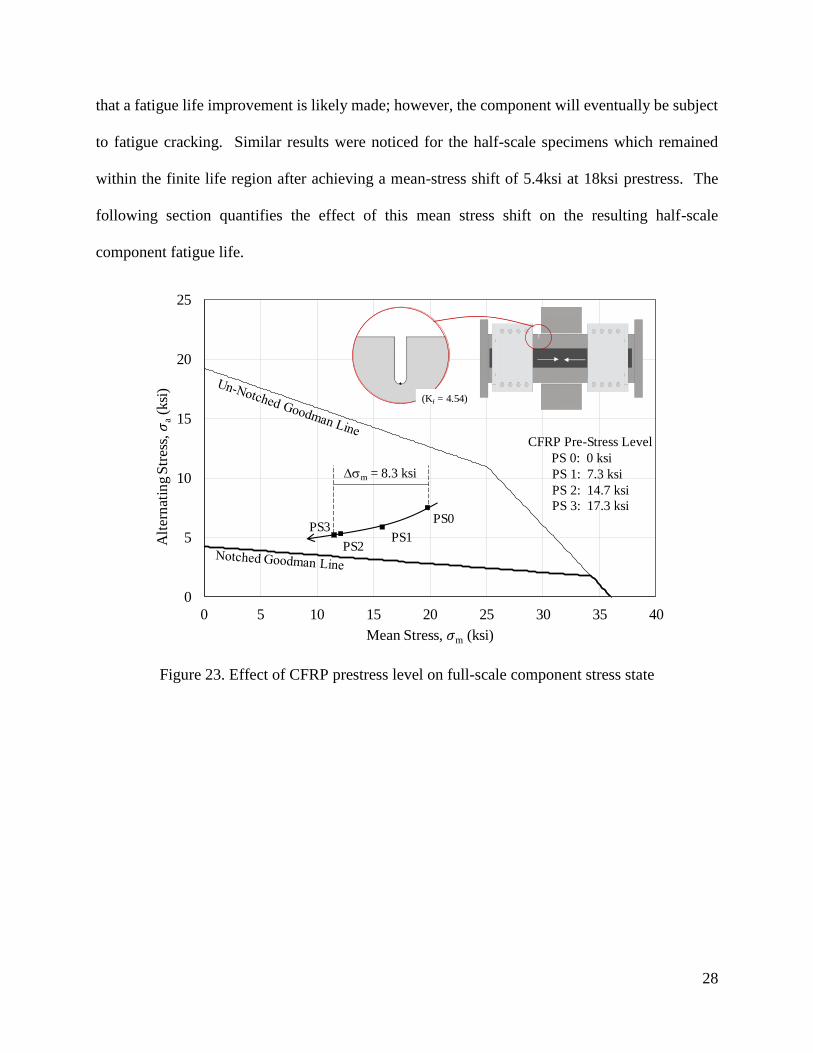
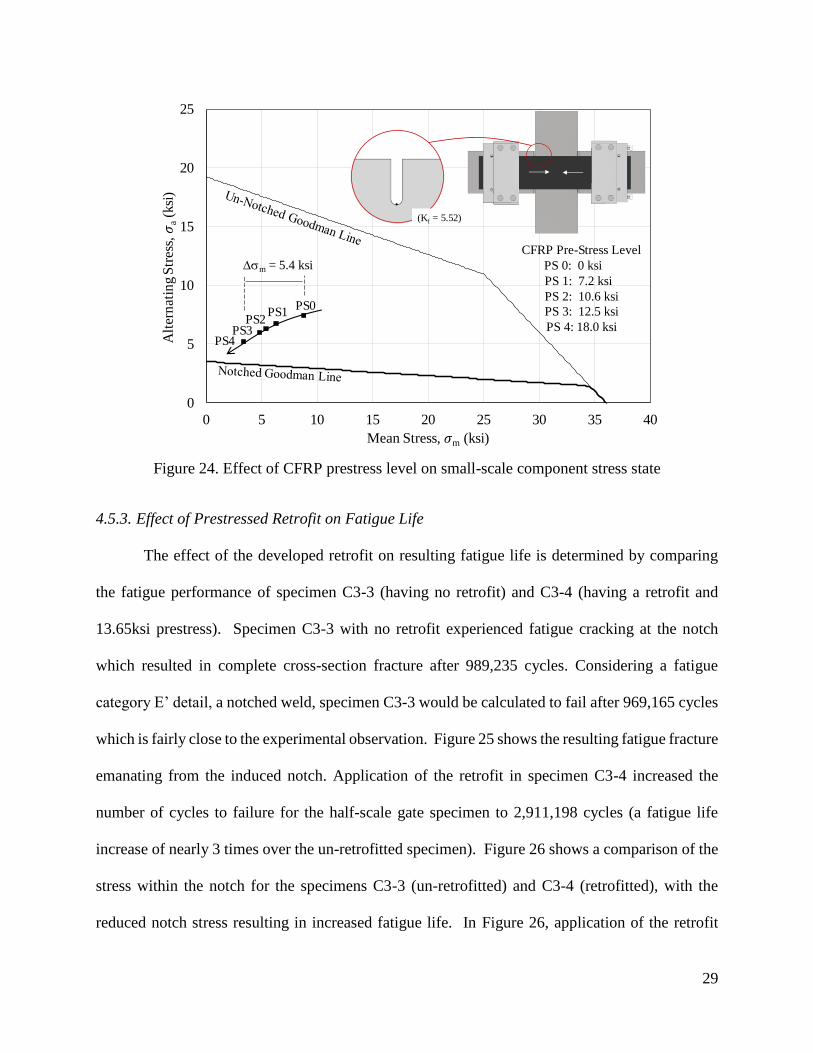
As the specimen notch stress is reduced, the stress-state moves closer to the infinite life
region. For the full-scale and half-scale experiment, the resulting shift in notch stress state relative
to the notched Goodman criterion is shown in Figure 23 and Figure 24 respectively. As shown in
Figure 23, the 8.3ksi reduction in mean stress at a prestress of 17.3ksi shifts the notch stress-state
near the border of the fatigue threshold line, but remains within the finite life region. This indicates
0
5
10
15
20
25
30
0 0.5 1 1.5 2 2.5
Notc
h S
tress
(ksi
)
Time (sec)
Increasing CFRP pre-stress level
PS0
PS1
PS2
PS3
PS0 = 0ksi
PS1 = 7.3ksi
PS2 = 14.8ksi
PS3 = 17.3ksi
28
that a fatigue life improvement is likely made; however, the component will eventually be subject
to fatigue cracking. Similar results were noticed for the half-scale specimens which remained
within the finite life region after achieving a mean-stress shift of 5.4ksi at 18ksi prestress. The
following section quantifies the effect of this mean stress shift on the resulting half-scale
component fatigue life.
Figure 23. Effect of CFRP prestress level on full-scale component stress state
0
5
10
15
20
25
0 5 10 15 20 25 30 35 40
Alt
ern
atin
g S
tres
s,
a(k
si)
Mean Stress, m (ksi)
(Kf = 4.54)
CFRP Pre-Stress Level
PS 0: 0 ksi .
PS 1: 7.3 ksi..
PS 2: 14.7 ksi
PS 3: 17.3 ksiPS0
PS1PS2
PS3
Dsm = 8.3 ksi
29
Figure 24. Effect of CFRP prestress level on small-scale component stress state
4.5.3. Effect of Prestressed Retrofit on Fatigue Life
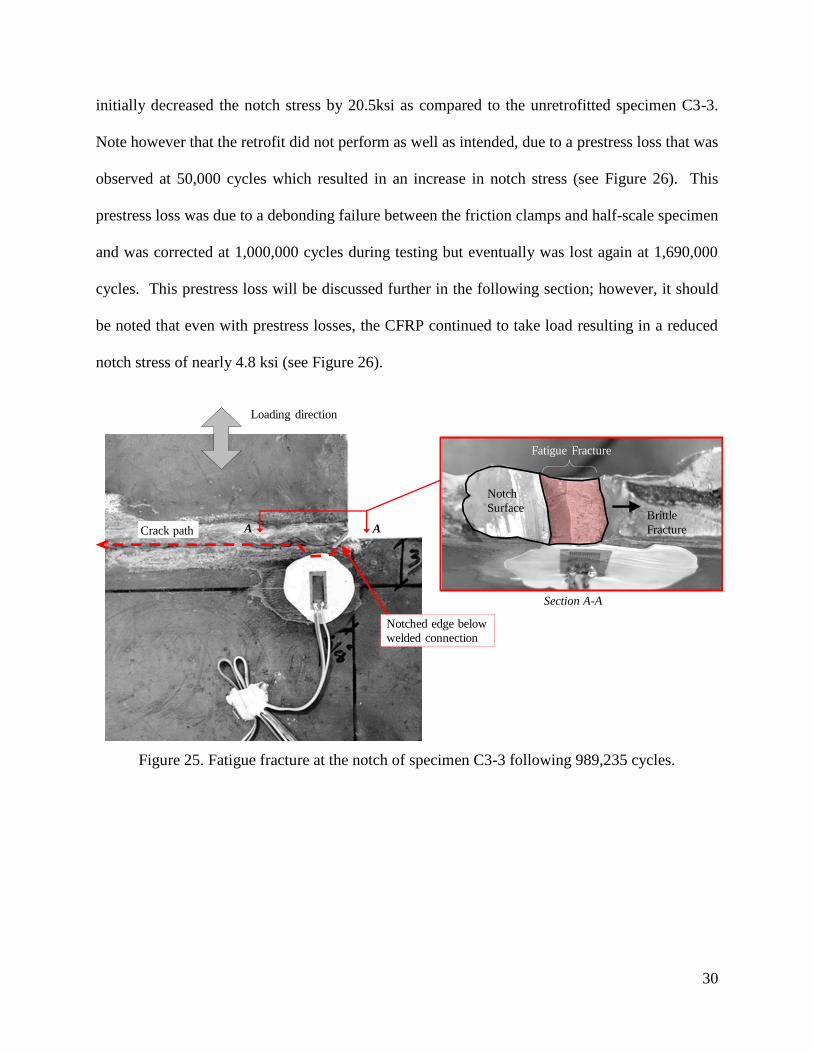
The effect of the developed retrofit on resulting fatigue life is determined by comparing
the fatigue performance of specimen C3-3 (having no retrofit) and C3-4 (having a retrofit and
13.65ksi prestress). Specimen C3-3 with no retrofit experienced fatigue cracking at the notch
which resulted in complete cross-section fracture after 989,235 cycles. Considering a fatigue
category E’ detail, a notched weld, specimen C3-3 would be calculated to fail after 969,165 cycles
which is fairly close to the experimental observation. Figure 25 shows the resulting fatigue fracture
emanating from the induced notch. Application of the retrofit in specimen C3-4 increased the
number of cycles to failure for the half-scale gate specimen to 2,911,198 cycles (a fatigue life
increase of nearly 3 times over the un-retrofitted specimen). Figure 26 shows a comparison of the
stress within the notch for the specimens C3-3 (un-retrofitted) and C3-4 (retrofitted), with the
reduced notch stress resulting in increased fatigue life. In Figure 26, application of the retrofit
0
5
10
15
20
25
0 5 10 15 20 25 30 35 40
Alt
ern
atin
g S
tres
s,
a(k
si)
Mean Stress, m (ksi)
(Kf = 5.52)
CFRP Pre-Stress Level
PS 0: 0 ksi .
PS 1: 7.2 ksi..
PS 2: 10.6 ksi
PS 3: 12.5 ksi
PS 4: 18.0 ksi
PS0PS1
PS2PS3
PS4
Dsm = 5.4 ksi
30
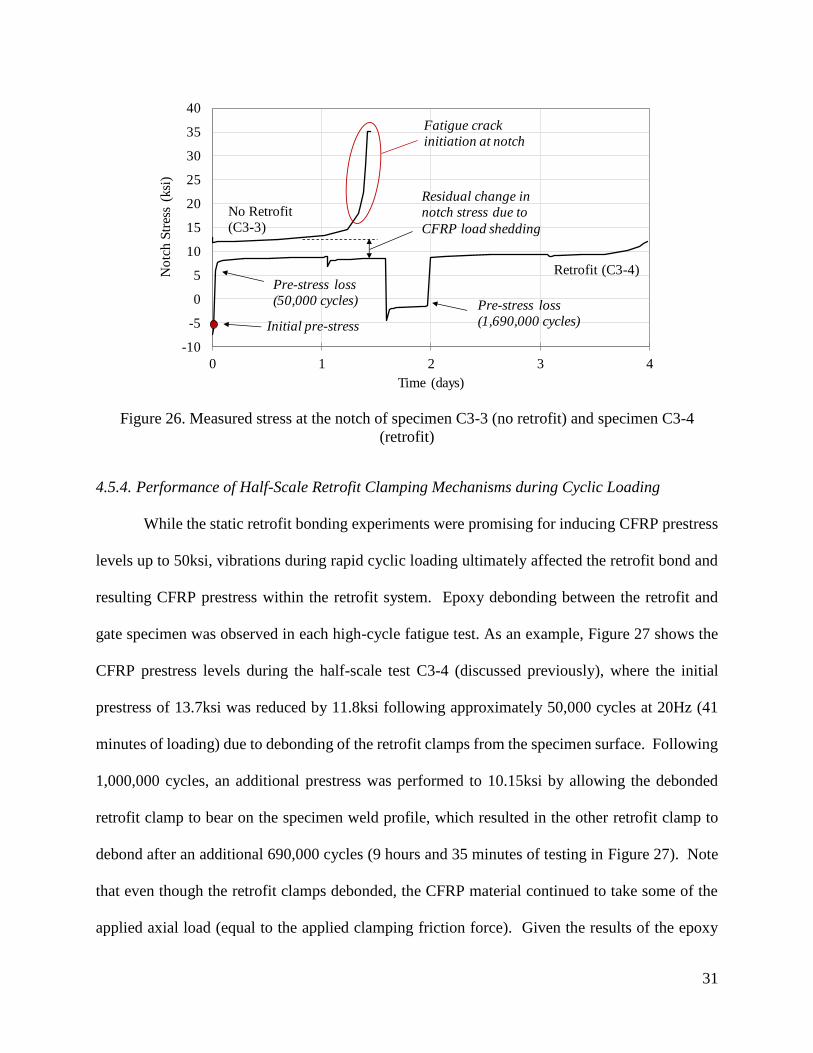
initially decreased the notch stress by 20.5ksi as compared to the unretrofitted specimen C3-3.
Note however that the retrofit did not perform as well as intended, due to a prestress loss that was
observed at 50,000 cycles which resulted in an increase in notch stress (see Figure 26). This
prestress loss was due to a debonding failure between the friction clamps and half-scale specimen
and was corrected at 1,000,000 cycles during testing but eventually was lost again at 1,690,000
cycles. This prestress loss will be discussed further in the following section; however, it should
be noted that even with prestress losses, the CFRP continued to take load resulting in a reduced
notch stress of nearly 4.8 ksi (see Figure 26).
Figure 25. Fatigue fracture at the notch of specimen C3-3 following 989,235 cycles.
Fatigue Fracture
Notch
SurfaceBrittle
Fracture AA
Section A-A
Notched edge below
welded connection
Crack path
Loading direction
31
Figure 26. Measured stress at the notch of specimen C3-3 (no retrofit) and specimen C3-4
(retrofit)
4.5.4. Performance of Half-Scale Retrofit Clamping Mechanisms during Cyclic Loading
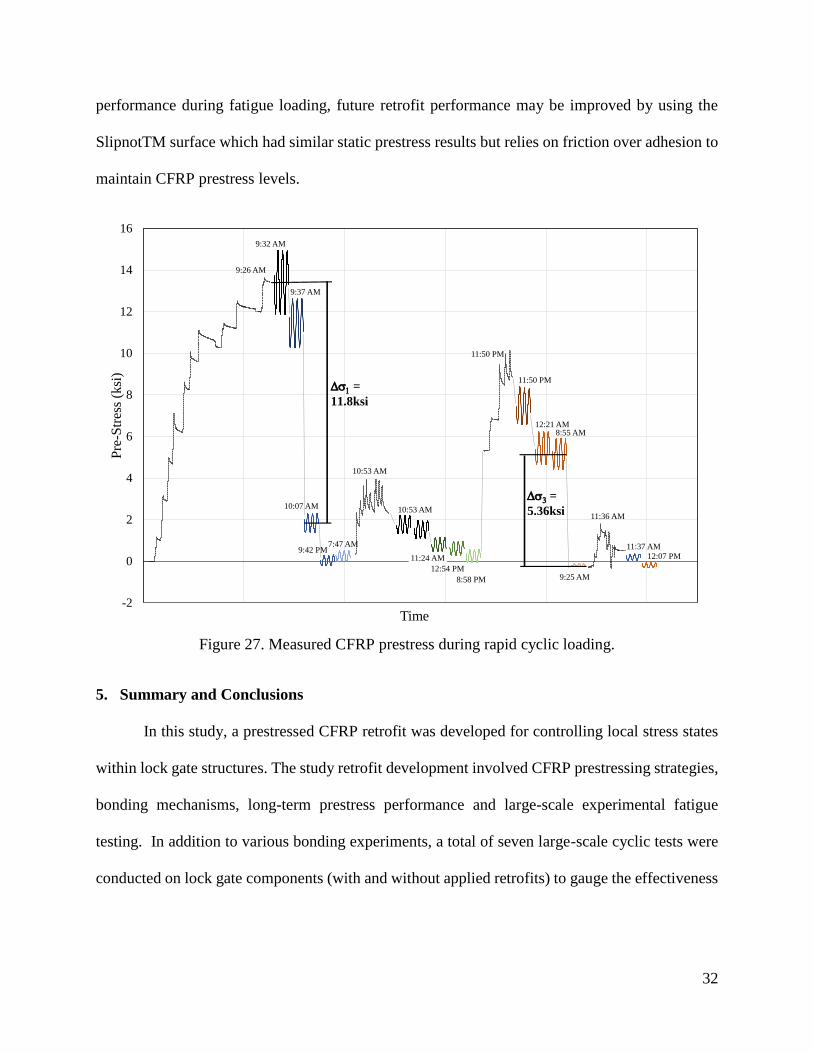
While the static retrofit bonding experiments were promising for inducing CFRP prestress
levels up to 50ksi, vibrations during rapid cyclic loading ultimately affected the retrofit bond and
resulting CFRP prestress within the retrofit system. Epoxy debonding between the retrofit and
gate specimen was observed in each high-cycle fatigue test. As an example, Figure 27 shows the
CFRP prestress levels during the half-scale test C3-4 (discussed previously), where the initial
prestress of 13.7ksi was reduced by 11.8ksi following approximately 50,000 cycles at 20Hz (41
minutes of loading) due to debonding of the retrofit clamps from the specimen surface. Following
1,000,000 cycles, an additional prestress was performed to 10.15ksi by allowing the debonded
retrofit clamp to bear on the specimen weld profile, which resulted in the other retrofit clamp to
debond after an additional 690,000 cycles (9 hours and 35 minutes of testing in Figure 27). Note
that even though the retrofit clamps debonded, the CFRP material continued to take some of the
applied axial load (equal to the applied clamping friction force). Given the results of the epoxy
-10
-5
0
5
10
15
20
25
30
35
40
0 1 2 3 4
No
tch S
tres
s (k
si)
Time (days)
Initial pre-stress
Pre-stress loss
(1,690,000 cycles)
Residual change in
notch stress due to
CFRP load shedding
Fatigue crack
initiation at notch
No Retrofit
(C3-3)
Retrofit (C3-4)Pre-stress loss
(50,000 cycles)
32
performance during fatigue loading, future retrofit performance may be improved by using the
SlipnotTM surface which had similar static prestress results but relies on friction over adhesion to
maintain CFRP prestress levels.
Figure 27. Measured CFRP prestress during rapid cyclic loading.
5. Summary and Conclusions
In this study, a prestressed CFRP retrofit was developed for controlling local stress states
within lock gate structures. The study retrofit development involved CFRP prestressing strategies,
bonding mechanisms, long-term prestress performance and large-scale experimental fatigue
testing. In addition to various bonding experiments, a total of seven large-scale cyclic tests were
conducted on lock gate components (with and without applied retrofits) to gauge the effectiveness
9:26 AM
10:53 AM
11:50 PM
11:36 AM
9:32 AM
9:37 AM
10:07 AM
9:42 PM7:47 AM
10:53 AM
11:24 AM
12:54 PM
8:58 PM
11:50 PM
12:21 AM8:55 AM
9:25 AM
11:37 AM
12:07 PM
-2
0
2
4
6
8
10
12
14
16
Pre
-Str
ess
(ksi
)
Time
Ds1 =
11.8ksi
Ds3 =
5.36ksi
33
of the developed prestressing strategies. The following conclusions were found from the
experimental testing:
• Application of the prestressed retrofit on the notched half-scale specimen increased
the fatigue life by more than 1.9 million cycles (a fatigue life increase of nearly 3
times over the un-retrofitted specimen).
• Prestressing strategies considering friction alone can achieve CFRP prestress levels
similar to those with epoxy adhesives. The SlipnotTM high friction coating and
epoxy bonded CFRP both achieved similar prestress levels prior to slip at slightly
more than 50ksi of CFRP prestress.
• Creep and relaxation within the prestressing system contributed to minor prestress
losses. The full-scale epoxy-bonded CFRP specimen converged to approximately
10% prestress loss after 14 days.
• The applied CFRP prestress is capable of reducing the local stress felt at the notch
of both the full-scale and half-scale specimens; however, prestress loss did occur
due to epoxy adhesive debonding during rapid cyclic loading.
• Load shedding into the CFRP, even without significant prestress applied,
contributed to reductions in component notch stresses. Even after debonding, the
applied CFRP clamping force was able to provide enough force transfer to the
CFRP to reduce the notch local stresses (see again Figure 26).
34
6. References
[1] USACE (2014). "Lock characteristics general report," US Army Corps of Engineers,
Navigation Data Center.
[2] ASCE (2013). "Report card for America's infrastructure," American Society of Civil
Engineers.
[3] ASCE (2017). "Infrastructure report card," American Society of Civil Engineers.
[4] ASCE (2018), "What makes a grade?," American Society of Civil Engineers.
[5] D. V. Grier (2017), "The Declining Reliability of the U.S. Inland Waterway System,"
Homeland Security Digital Library.
[6] P. Glass. (2012). “Head Lock”. Work Boat, Accessed July 2, 2018 from:
https://www.workboat.com/archive/head-lock/
[7] The Navigation Economic Technologies Program (2005), "McAlpine Lock Closure in
August 2004," US Army Corps of Engineers, IWR Report 05-NETS-R-08.
[8] J. Brinckman (2009), "Dam's lock closure hurts Northwest shippers but could have been
far worse," in The Oregonian, Accessed June 13, 2018 from:
https://www.oregonlive.com/business/index.ssf/2009/10/post_1.html
[9] B. Chapman (2010), "LRD's Lock Gate Replacement Program," in Briefing to Inland
Waterways User Board, US Army Corps of Engineers.
[10] Federal Highway Administration (2013), "Manual for Repair and Retrofit of Fatigue
Cracks in Steel Bridges," US Department of Transportation.
[11] R. Prince (2018), “Fiber Reinforced Polymers Characteristics and Behaviors,” Build on
Prince, Accessed June 15, 2018 from: https://www.build-on-prince.com/fiber-reinforced-
polymers.html
[12] B. M. Phares, T. J. Wipf, F. W. Klaiber, A. Abu-Hawash, and Y.-S. Lee (2003),
"Strengthening of steel girder bridges using FRP," presented at the Proc. 2003 Mid-
Continent Transportation Research Symposium, Ames, IA Aug. 21-22.
[13] F. Matta, C. Aquino, A. Nanni, and J. Giancaspro (2007), "Unbonded CFRP Bar System
for External Post-Tensioning," presented at the American Composites Manufacturers
Association, Tampa, FL USA.
[14] M. Tavakkolizadeh and H. Saadatmanesh (2003), "Fatigue Strength of Steel Girders
Strengthened with Carbon Fiber Reinforced Polymer Patch," Journal of Structural
Engineering, vol. 129, pp. 186-196.
35
[15] P. P. Bansal, R. Sharma, and A. Mehta (2016), "Retrofitting of RC girders using
prestressed CFRP sheets," Steel and Composite Structures, vol. 20, pp. 833-849.
[16] Y. Huawen, C. Konig, T. Ummenhofer, Q. Shizhong, and R. Plum (2010), "Fatigue
Performance of Tension Steel Plates Strengthened with Prestressed CFRP Laminates,"
Journal of Composites for Construction, vol. 14, pp. 609-615.
[17] H. K. Nordin and B. R. Taljsten (2006), "Concrete Beams Strengthened with Prestressed
Near Surface Mounted CFRP," Journal of Composites for Construction, vol. 10, pp. 60-
68.
[18] B. R. Taljsten, C. S. Hansen, and J. W. Schmidt (2009), "Strengthening of old metallic
structures in fatigue with prestressed and non-prestressed CFRP laminates," Construction
and Building Materials, vol. 23, pp. 1665-1677.
[19] E. Ghafoori and M. Motavalli (2015), "Lateral-torsional buckling of steel I-beams
retrofitted by bonded and un-bonded CFRP laminates with different prestress levels:
Experimental and numerical study," Construction and Building Materials, vol. 76, pp.
194-206.
[20] A. Lenwari, T. Thepchatri, and P. Albrecht (2006), "Debonding Strength of Steel Beams
Strengthened with CFRP Plates," Journal of Composites for Construction, vol. 10, pp.
69-78.
[21] P. Colombi, A. Bassetti, and A. Nussbaumer (2003), "Analysis of cracked steel members
reinforced by prestress composite patch," Fatigue & Fracture of Engineering Materials
& Structures, vol. 26, pp. 59-66.
[22] F. Kianmofrad, E. Ghafoori, M. M. Elyasi, M. Motavalli, and M. Rahimian (2017),
"Strengthening of metallic beams with different types of prestressed un-bonded retrofit
systems," Composite Structures, vol. 159, pp. 81-95.
[23] F. M. Mohee and A. Al-Mayah (2017), "Development of an innovative prestressing
CFRP plate anchor: Numerical modelling and parametric study," Composite Structures,
vol. 177, pp. 1-12.
[24] S. Hong and S.-K. Park (2017), "Concrete Beams Strengthened With Prestressed
Unbonded Carbon-Fiber-Reinforced Polymer Plates: An Experimental Study," Polymer
Composites, vol. 38, pp. 2459-2471.
[25] H. Ye, C. Li, S. Pei, T. Ummenhofer, and H. Qu (2018), "Fatigue Performance Analysis
of Damaged Steel Beams Strengthened with Prestressed Unbonded CFRP Plates,"
Journal of Bridge Engineering, vol. 23, pp. 1-12.
[26] J. Li, Y. Wang, J. Deng, and Y. Jia (2018), "Experimental study on the flexural behavior
of notched steel beams strengthened by prestressed CFRP plate with an end plate
anchorage system," Engineering Structures, vol. 171, pp. 29-39.
36
[27] E. Ghafoori, M. Motavalli, A. Nussbaumer, A. Herwig, G. S. Prinz, and M. Fontana
(2015), "Design criterion for fatigue strengthening of riveted beams in a 120-year-old
railway metallic bridge using prestressed CFRP plates," Composites: Part B, vol. 68, pp.
1-13.
[28] E. Ghafoori, M. Motavalli, A. Nussbaumer, A. Herwig, G. S. Prinz, and M. Fontana
(2016), "Fatigue strengthening of riveted girders in a historic railway metallic bridge in
Switzerland using prestressed un-bonded CFRP laminates," Proc. of the 8th Int. Conf. on
Bridge Maintenance, Safety and Management, pp. 1-8.
[29] C. M. Lozano (2017), "Development of Prestressed Retrofit Strategies for Mitigating
Fatigue Cracking in Steel Waterway Lock Gate Components," M.S. Thesis, University of
Arkansas, Fayetteville, AR.
[30] AASHTO (2012), "AASHTO LRFD bridge design specifications (6th edition),"
American Association of State Highway and Transportation Officials, pp. Washington,
DC.
[31] W. D. Pilkey (2005), "Stress Concentration," in Formulas for Stress, Strain, and
Structural Matrices, ed: John Wiley & Sons, pp. 255-305.