Graham Power Personal Testimony Video Graham Power Personal Testimony Video.
Testimony of
GENE KIMMELMAN
On behalf of
CONSUMERS UNION and
CONSUMER FEDERATION OF AMERICA
Before the Senate Committee on Commerce, Science and Transportation
on Escalating Cable Rates: Causes and Solutions
March 25, 2004

Consumers Union1 and Consumer Federation of America2 believe that cable television's continuous upward pricing spiral reflects a major failure of market forces and public oversight since Congress launched cable deregulation in 1996.3 In that time, cable rates have ballooned nearly three times faster than the rate of inflation. Indeed, according to the Bureau of Labor Statistics which measures cable rate increases and adjusts cable price increases by crediting the industry when it adds channels rates have shot up a staggering 56% since January 1996, while inflation increased by only 21% over that same period.4
One major explanation for these extreme price increases is the lack of competition facing cable companies. The fact is large cable operators simply do not compete with one another. Not one of the incumbent cable operators has ever expanded its infrastructure into an already-wired community and competed head-to-head. Instead, the major cable operators have through mergers and acquisitions become national firms, operating in regional clusters. These regionally dominant firms are positioned to keep out the few potential competitors who consider entering the cable arena.5 In markets where 98 percent of Americans live, a single cable operator dominates multi-channel video distribution with a market share exceeding 80 percent. (See Appendix A for a thorough analysis of cable’s excess market power.)
Another contributor to soaring cable rates is the inability of satellite television to provide the pressure needed to keep cable rates down. Satellite has yet to emerge as an effective competitor to cable despite its growth in reaching more consumers and congressional efforts to help make satellite more competitive with cable. The General Accounting Office recently found that the presence of a second cable operator to compete head-to-head leads to consumers saving 15-41 percent6 off their bills, or an
1 Consumers Union is a nonprofit membership organization chartered in 1936 under the laws of the state of New York to provide consumers with information, education and counsel about goods, services, health and personal finance, and to initiate and cooperate with individual and group efforts to maintain and enhance the quality of life for consumers. Consumers Union's income is solely derived from the sale of Consumer Reports, its other publications and from noncommercial contributions, grants and fees. In addition to reports on Consumers Union's own product testing, Consumer Reports with more than 4 million paid circulation, regularly, carries articles on health, product safety, marketplace economics and legislative, judicial and regulatory actions which affect consumer welfare. Consumers Union's publications carry no advertising and receive no commercial support. 2 The Consumer Federation of America is the nation’s largest consumer advocacy group, composed of over 280 state and local affiliates representing consumer, senior, citizen, low-income, labor, farm, public power an cooperative organizations, with more than 50 million individual members. 3 Public Law 104-104, The Telecommunications Act of 1996. 4 Bureau of Labor Statistics, Consumer Price Index (March 2004). From 1996 until March 2004, CPI increased 20.6% while cable prices rose 56%, 2.7 times faster than inflation. 5 For example, in Philadelphia, where Comcast has used “terrestrial bypass” to deny must-have sports programming such as the Philadelphia Flyers and the 76ers from satellite competitors, satellite penetration is 3.7 percent, compared to 10 percent of TV-viewing households nationwide. See Patricia Horn, “As Competition Lags for Cable TV, Prices Continue to Rise,” Philadelphia Inquirer, June 3, 2001, page C01. 6 General Accounting Office, “Wire-Based Competition Benefited Consumers in Selected Markets”: GAO-04-241,

average of over $5.00 per month.7 In contrast, the presence of satellite had almost no effect on prices, lowering rates an average of only about 20¢ per month.8 If we had head-to-head competition nationwide, consumers could save more than $5 billion a year on those bills.9
Satellite's growth as an effective competitor to cable has been hampered by
technological constraints. For instance, satellite has so far failed to provide local TV channels in many areas, subscribers' homes must have unobstructed south-facing views to pick up signals, and satellite often requires more expensive equipment than cable. Also, cable has a competitive edge because it can offer consumers the advantage of television programming and a high-speed Internet service bundled together that delivers more capacity at a lower cost per megabit.
Unfortunately, just as satellite seemed positioned to begin to discipline cable pricing, the News Corp./DirecTV merger eliminated DirecTV’s incentives to drive down cable prices, leaving EchoStar with virtually no capability to check cable price increases. This merger created a behemoth that has the power to raise prices across the board. News Corp's Chairman and CEO Rupert Murdoch publicly confessed this strategy after the purchase when he said, “we’re not going into a price war with anyone.”10
While the Federal Communications Commission (FCC) appropriately imposed
merger conditions that prevent News Corp. from discriminating against cable and satellite providers, or unfairly bundling their most popular channels, the Commission failed to address News Corp. incentives to charge itself and all other distributors inflated prices for News Corp.’s programming.
In this transaction, the largest satellite provider has combined with one of the
largest programming providers to create an unmatched vertical conglomerate. Even if News Corp. has to bargain with cable, it has every incentive to drive up the price it charges to itself, to its cable competitors, and to EchoStar using programming as its
February, 2004, pg. 4. 7 General Accounting Office, “Issues Related to Competition and Subscriber Rates in the Cable Television Industry,” GAO-04-8, October 2003, Appendix IV, p. 60. 8 Id., pp. 60-61. 9 While we hope that satellite will ultimately have a price disciplining effect in those communities where satellite offers local broadcast stations, it is clear that the single most important variable in cable prices is whether there is a cable over builder in a particular community. Wire-to-wire competition does hold down cable rates and satellite does not seem to do the trick. The U.S. General Accounting Office describes this phenomenon:
Our model results do not indicate that the provision of local broadcast channels by DBS companies is associated with lower cable prices. In contrast, the presence of a second cable franchise (known as an overbuilder) does appear to constrain cable prices. In franchise areas with a second cable provider, cable prices are approximately 17 percent lower than in comparable areas without a second cable provider.
In other words, where there are two satellite providers and one cable operator in a market, prices are 17 percent higher than where there are two cable companies and two satellite providers in a market. 10 Ronald Grover, “Direct Talk about DirecTV.” Business Week, January 19, 2004, pg. 61.

profit center. Mr. Murdoch is able to maximize his profits by raising programming prices for the more than 80 million potential cable/satellite viewers, rather than drive down prices to slowly grow his 12 million DirecTV customer base (which he controls, but reaps about 30 cents for every dollar of DirecTV profits). By charging DirecTV a high price for News Corp. programming, he is able to establish a price floor for programming that the rest of the cable industry and EchoStar will have to pay to obtain those same channels.
To make matters worse, the proposed merger between Comcast and Disney signals where the market as a whole is moving—towards significant vertical consolidation, where each big multichannel distribution system owns popular programming channels. Whether Comcast is eventually successful in a bid for Disney or not, cable and satellite distributors have plotted a course towards owning the most popular programming entities. For example, Comcast wants to own the most popular marquee programming, which will put the company in the driver’s seat for and give them a cut of the prices it charges for ESPN, the ABC network, the Disney Channel, A&E, Lifetime, the History Channel, and ABC Family.
What’s next? There are currently only about four companies logically positioned to combine with a cable distributor to create this kind of vertical firepower: GE/NBC, Time Warner, Viacom/CBS, and Disney/ABC. It seems that now the vertical genie has popped out of the bottle, there can only be greater pressure to combine programming and distribution assets. Collectively, these deals are likely to result in an arms race of cable programming price increases. Each vertically integrated media giant will have the same incentives to get top dollar for their programming. Will one of these giants refuse to pay top dollar for the other’s channels, running the risk that other will retaliated in kind? Not likely. We believe it is much more probable that each media giant will pay high prices for each other’s channels, knowing that all cable and satellite providers will have to pay as much or more for the same programming. The result: prices will keep spiraling upward for cable and satellite customers.
What is to be done? We urge Congress to intervene aggressively and force the FCC to do its job to ensure cable competition. The FCC has turned a blind eye to these obvious problems, failing to impose meaningful horizontal or vertical constraints that would keep these trends in check. But even if the agency reversed course today, it could not change fundamental market problems overnight. In the interim, we urge Congress to help empower consumers so they can begin to lower their cable bills by allowing them choose and pay for only those channels they watch.
By requiring that cable operators offer “a la carte” programming in conjunction
with any other packages they wish to offer-- the market power of the consumer's pocket book can be unleashed to begin to help lower programming costs, increase incentives for programmers to provide quality fare to consumers, and give viewers the opportunity to not pay for content they find objectionable or too expensive.11 11 Consumers Union also believes that programmers should be required under a new set of nondiscrimination requirements to sell their channels to cable and satellite operators on a similar individual basis as we pointed out to

Although cable operators vastly overstate the role of programming costs as a cause of rising cable rates, programming costs are a part of the problem. Cable operators have proven unwilling or incapable of bargaining down programming costs. As discussed earlier, this reflects the fact that they own a significant part of the most popular and expensive programming and they do not face effective competition from subscribers. Therefore, ownership weakens their interest in controlling these costs and they know they can always pass them through to consumers in the basic or expanded basic tiers. The best way to introduce discipline into the market is to let consumers vote with their feet (and their pocketbooks) by refusing to pay for channels they think are too expensive.
Few people regularly watch all the channels they must buy on cable. To purchase the small number of channels that consumers watch most, they must buy large service tiers from cable operators, ranging from 40, 50 to 75 channels or more. As the GAO cited, recent Nielsen Media Research data show the average consumer watches about 17 channels regularly12, with the top 20 channels accounting for approximately three-quarters of all viewing.13 Unless cable companies charge outrageous prices for each channel, many consumers could save significant money on their monthly cable bill by selecting only the channels they actually watch. As Appendix B demonstrates, most of the channels consumers watch today are the very channels they watched years ago.
Giving consumers the choice to select only those channels they want also provides a unique solution to the growing public concern about violent and indecent programming. While technology such as the V-Chip allows consumers to block distasteful programming, many consumers find it insulting to have to pay for the very programming they find offensive. Instead of forcing consumers to buy service tiers that include programs they never watch or channels they find objectionable, policymakers should require cable operators to let people pick and pay for only those channels they want.
Some cable operators might argue that technology prevents them from offering a la carte programming. While cable operators likely will have to make software adjustments inside the cable network to offer a la carte, systems that have been upgraded for digital cable would not require new technology in consumers' homes. And as cable operators will have to build in functionality to fight piracy (i.e. the plug-and-play proceeding at the FCC) in the next year, now is the right time to consider enabling equipment to handle a la carte options. In Canada, a number of cable companies already offer consumers a la carte options.14 the Committee in testimony last year. See written and oral statement of Gene Kimmelman before the Senate Committee on Commerce, Senate Commerce, Science, and Transportation Committee, Cable Television and the Dangers of Deregulation, May 6, 2003. 12 GAO-04-08 Issues Related to Competition and Subscriber Rates in the Cable Television Industry, October 2003 13 Consumer Federation of America and Consumers Union, The Continuing Abuse Of Market Power By The Cable Industry: Rising Prices, Denial Of Consumer Choice, And Discrimination In Access, p. 24 14 A quick Internet search shows many Canadian cable operators—from the largest (Rogers) to some of the smallest

Cable operators have voiced concerns that they will have diminished advertising
revenues if consumers are permitted to choose the cable channels they want to pay for and watch. However, advertising is based on total television viewership. Those who claim more choice in cable television programming means fewer advertising dollars are saying, in effect, that a la carte means people will watch less television. In fact, the opposite may be true; as consumers choose from a wider palette of options that will better cater to individual tastes, more TV viewership may be the result. People will simply be watching and paying for the programs they want.
Furthermore, the use of a la carte selection would enable advertisers to know
more about their audiences, allowing the possibility of enhanced revenues from more targeted demographic information. Programmers should be able to charge more and advertisers should be willing to pay more for access to the viewers, because of the preference indicated by a willingness to pay for the programming. This will be a win-win situation because advertising will be more efficient at reaching a targeted audience.
We would also like to allay some of the concerns that may be raised about
certain cable channels suffering in an a la carte world. Appendix C shows that the most popular national cable channels are financially backed by broadcast networks or large cable companies. These entities need no special bundling “subsidy” to launch their programming. And Appendix D shows a sample of national channels launched by independent companies. Since most of these channels find it hard, if not impossible to be carried in cable’s expanded basic tiers, it is difficult to imagine that they would be worse off under an a la carte system. Rather than allowing each and every spurious argument raised now by some cable operators to delay action on this issue, we urge Congress to instead listen carefully to what the industry itself said about a la carte pricing little more than a year ago. In testimony before this Committee in 2003, cable operators big and small endorsed pricing cable channels a la carte. James Gleason, President and Chief Operation Officer of CableDirect, a small cable operator serving just 20,000 customers in the Midwest said, “To give customers choice and allow the market to determine what gets on TV, programmers should be required to make their services available as part of a separate programming tier. One solution might be to offer the expensive programming in tiers or a la carte.”15 Charles Dolan, Chairman of Cablevision, one of the largest cable operators with over 4 million homes in the Northeast, told this panel: “Cablevision, as a policy, wants its customers to be able to pick and choose among its services, selecting what appeals to them, rejecting what does not, determining for themselves how much they will spend, just as they do every day in the supermarket or shopping mall.” He continued with an (Northern Cablevision and Whistler Cable)—offer a la carte programming. 15 Testimony of James Gleason, Hearing on Media Ownership, Committee on Commerce, Science and Transportation, May 6, 2003, p.53.

analogy I’ve heard repeated since then, “To help the dairy industry, I ask, would the government insist that all customers be required to buy a dozen eggs and a quart of milk before they can purchase their bread?”16 If the FCC can force manufacturers to rebuild entire classes of technology to fight piracy and adhere to the Plug and Play specifications, and if the FCC can plant a Broadcast Flag to expedite the transition to digital television, surely policymakers can also give consumers more choice in cable programming. It is time for Congress and the FCC to put consumers’ interest on equal footing with industry goals, and let market forces begin to provide much needed discipline on exorbitant cable rates. And it is also time for policymakers to empower consumers to keep distasteful programming out of their homes.
16 Testimony of Charles Dolan, Hearing on Media Ownership, Committee on Commerce Science and Transportation, May 6, 2003, p. 56.

APPPENDIX A
THE CONTINUING ABUSE OF MARKET POWER BY THE
CABLE INDUSTRY: RISING PRICES, DENIAL OF CONSUMER CHOICE, AND
DISCRIMINATORY ACCESS TO CONTENT
February 2004

APPPENDIX A
TABLE OF CONTENTS
Contents IV. EXECUTIVE SUMMARY……………………………………………………… i
I. INTRODUCTION……………………………………………………………………. 1 A. PURPOSE……………………………………………………………………………… 1 B. THE FCC’S FAILURE TO ASK THE HARD QUESTIONS……………………………… 1 II. THE SUPPLY SIDE………………………………………………………………… 3 A. MARKET POWER 101………………………………………………………………… 5 B. GAO’S VIDEO MARKET STRUCTURE ANALYSIS.…………………………………… 5 1. Horizontal Market Power…………………………………………………………… 5 2. Vertical Market Power………………………………………………………………. 5 C. HIGH-SPEED INTERNET………………………………………………………………. 8 D. CASH FLOW ANALYSIS………………………………………………………………..10 1. All Revenues, All Costs……………………………………………………………….11 2. Cash Flow for Traditional Video
Services…………………………………………..14 III. THE DEMAND-SIDE………………………………………………………………18 A. ESTIMATION OF QUANTITY ADJUSTED PRICE CHANGES……………………………18 B. BUNDLING, THE DEMAND CURVE AND CONSUMER SURPLUS………………………..20 IV. LONG-TERM TRENDS……………………………………………………………22 A. PRICE…………………………………………………………………………………..22 B. QUANTITY……………….………………………...………………………………………………..25 V. CONCLUSION……………………………………………………………………….25 ENDNOTES………………………………………………………………………………27

i
THE CONTINUING ABUSE OF MARKET POWER BY THE
CABLE INDUSTRY: RISING PRICES, DENIAL OF CONSUMER CHOICE, AND
DISCRIMINATION IN ACCESS
EXECUTIVE SUMMARY Eight years after the passage of the Telecommunications Act of 1996, which deregulated cable prices, this
study shows that cable operators still possess market power in the multichannel video market. The result is price increases that far exceed the rate of inflation – almost three times faster than inflation in recent years –and the continued restriction of consumer choice to a small number of ever larger, ever more expensive bundles. The cost imposed on consumers by this abuse of market power is between $4.5 and $6 billion per year, compared to what prices would be in a competitive market.
Cable operators attempt to obscure the existence and abuse of market power with two arguments. First
they claim that programming costs explain the massive increase in the price of basic and expanded basic service. Second, they claim that consumers are getting much greater value for their dollar; so that quality adjusted prices have declined. Neither claim stands up to close scrutiny. EXERCISE OF MARKET POWER ON THE SUPPLY SIDE Prices
Econometric studies by the General Accounting Office and the Federal Communications Commission show that where cable faces direct head-to-head overbuilder competition the price of cable service is much lower.
• A recent GAO report found that in situations where cable faces competition overbuilders, prices are 15% lower. Econometric analyses have consistently found this result of a decade. Unfortunately, less than two percent of cable customers enjoy the benefits of that competition.
• A recent GAO analysis found that a cable system owned by a large national operator has prices that are
over 5 percent higher than if it is not. FCC econometric models show even larger effects.
• When the FCC models add in a specific variable for regional clustering, a dramatic trend in the industry, they find that clustering has an added effect of further raising price.
• The vast majority of cable subscribers are now served by one of a handful of huge-multiple system
operators that have expanded their grip on the industry through mergers and clustering, who adds as much as an additional 8 percent to the consumers bill.

ii
Market Structure Cable’s market power stems from a lack of effective competition. Even at the national level, the multichannel video market has become concentrated; the problem is much greater at the local level.
• In markets where 98 percent of Americans live, a single cable operator dominates multichannel video distribution with a market share that exceeds 80 percent.
The largest cable operators never compete with one another. Instead they have grown to huge national
firms through mergers using swaps of systems to create regional clusters that undermine the ability of overbuilders to launch competition. Large operators and clustered systems have more muscle to thwart competition and impose price increases.
• They can distribute programming terrestrially and refuse to make it available to competing distribution systems. This is becoming increasingly important as vertically integrated companies dominate “must have” regional sports programming.
• They can extract exclusivity deals from independent programmers, thereby denying programming to
competing distribution media.
• They have more leverage over local governments to obstruct the entry of overbuilders
Direct Broadcast Satellite does not have a significant or substantial ability to discipline cable pricing abuse. Satellite is a niche product that has had its greatest success in areas where cable was unavailable or among customers who wanted high quality digital services with large numbers of channels (before cable could offer such a package).
• Cable has surpasses satellite in the number of subscribers to digital video service. • It is bundling high-speed Internet and basic cable service to further erode the ability of satellite to
compete.
Discrimination in Access Cable operators discriminate against unaffiliated service providers in both the video and the high-speed
Internet product space. Cable operators are 64 percent more likely to carry networks that they own, than the networks provided by others. Broadcasters have used their retransmission rights to also gain preferential carriage deals for their shows. As a result, independent programmers are placed at a severe disadvantage.
Cable operators dominate the residential market for advanced high-speed Internet access, with an 83 percent market share. By refusing to allow unaffiliated Internet Service Providers to compete for Internet access customers over the cable modem platform, cable operators have foreclosed a critical high-end market, which dramatically reduces competition for Internet service. Virtually no voluntary carriage agreements have been signed by cable operators. Cash Flow A close look at cable’s financial operations shows that rising costs cannot explain the rising price of traditional video services.
• In the aggregate, price increases far exceed the increase in programming costs. • An allocation of non-programming operating costs based on historical patterns shows that operating cash
flow from traditional video services has increased by approximately 70 percent on a per subscriber basis since the passage of the Telecommunications Act.
Sale of advanced services, digital tiers and high speed Internet, which were the motivation behind the

iii
recent system upgrades, has skyrocketed. The upgrades are paying for themselves.
• High-speed Internet is now the second largest income stream and digital tiers are the third largest streams of income for the cable operators, bringing in a combined $10 billion per year.
The Shape of Market Power on the Demand Side Cable operators claim that adding more channels to their bundles increases the value of he package. Unfortunately, consumers are not given a choice of which channels to purchase. They must take nothing, almost nothing (basic) or almost everything (expanded basic). With the addition of the digital tier, they have another option, but cable operators have been moving popular channels (like HBO) to the digital tier to drive consumer bills up even farther.
Because the cable operators restrict consumer choice to this small set of bundles, it is impossible to know how consumer welfare has changed and wrong to claim that every show adds equally to consumer value.
• The average consumer watches about 17 channels regularly, but the bundles have four times that number.
• The top twenty shows account for approximately three quarters of all viewing.
• Almost nobody watches the bottom 30 channels in the bundle. Only about one out of every 250
households where these shows are available watches them on any given day. The economics literature has long recognized that bundling by firms possessing market power can be anti-
consumer and anticompetitive. When different consumers have strong preferences for different channels, putting them into bundles forces each consumer to pay for many channels he or she does not want in order to get the channels he or she does want.
A detailed analysis of one of the most popular and expensive channels, ESPN, which has been a focal point
of controversy, shows that approximately four-fifths of cable subscribers would not pay the price of ESPN if they were given a choice. By forcing consumers to pay for the show in a bundle, wealth is transferred from consumers to cable operators (and the programmer).
A recent analysis that claims that the BLS over states price increase and that prices have fallen on a quality
adjusted basis is riddled with analytic and measurement errors. The analysis double counts the quantity of programming and vastly overvalues the shift from viewing over the air to viewing cable. Watching an hour rerun of the same show on cable, instead of a broadcast station is assumed to increase consumer value by one hour, even though the exact same show is watched. Correcting these errors shows that the BLS cable price index yields, at best a lower limit on the quality adjusted price increases.
• In contrast to the 15 percent real decline that the NCTA analysis claims, the BLS shows a 27 percent increase. The actual quality adjusted price increase could be as high as 40 percent.
The embedded base of excess prices and the entrenched market power of the cable operators, reinforced
against satellite and extending into the high-speed Internet, confront policy makers with a critical problem. After two decades of abuse, and eight years after the Telecom Act of 1996, it is clear that policymakers made a mistake in deregulating cable. It is time for policymakers to take steps to promote real competition and protect consumers from further abuse.

APPPENDIX A
I. INTRODUCTION A. PURPOSE Proceedings at the Federal Communications Commission (FCC),i a series of General Accounting Office (GAO) reportsii and contract negotiations between cable operators and programmersiii have stimulated an unprecedented round of finger pointing and release of data about the cable television industry. The goal is to justify and/or place blame for the dramatically increasing price of cable service.iv Cable operators claim the programmers made them do it. Programmers have fired back, suggesting that basic rates have been increasing to support the rollout of advanced video and new, non-video services. The finger pointing drives home a simple point: consumers are paying a dramatically higher price for their monthly cable service. Or, are they? Several of the existing industry studies are framed as responses to consumer analyses that have documented the abuse of market power by cable operators. Comcastv and the National Cable Telecommunications Association (NCTA)vi assert that when consumer advocates complain about the total price of cable service, they are failing to take into account that the monthly bill includes more networks and are confusing real prices with nominal prices. NCTA goes so far as to offer a new approach to indexing cable prices as an alternative to the Bureau of Labor Statistics (BLS) cable Consumer Price Index (CPI). The FCC’s Tenth Annual Report (In the Matter of Annual Assessment of the Status of Competition in the Market for the Delivery of Video Programming) cites this analysis as further support for its conclusion that competition in the multichannel video market is robust and repeats the industry arguments.vii This paper shows that the most frequent complaint voiced by consumer advocates – that cable “rates have risen and continue to rise almost three-times faster than inflation,”viii – is correct. The consumer advocate comparison of cable rates to inflation states the numerator and the denominator of the real fraction in a fashion that is more meaningful to consumers and policymakers because it gives the reference points. Moreover, the paper argues that, if anything, the BLS cable price index is more likely to be understating price increases than overstating them. The bottom line is that the market power-based abuse of consumers by cable operators has been growing since the passage of the Telecommunications Act of 1996. After two decades of blatant abusive pricing, cable operators have begun to encounter some resistance, so increases may slow, but that does not mean the abuse will be reduced or eliminated. In response to criticism, the cable operators have simply launched new bundling strategies that shift the focal point of price increases and anticompetitive harm to other areas. B. THE FCC’S FAILURE TO ASK THE HARD QUESTIONS The FCC’s Annual Reports have steadfastly refused to address the serious questions raised about the cable market in a rigorous manner, but the Tenth Annual Report sinks to new lows. The FCC cannot even figure out how many cable subscribers there are. The two sources on which it relies for data (it never generates its own independent data) disagree by almost five million subscribers. In response, the FCC takes a most remarkable approach – it uses both sets of numbers – the lower figure for its financial analysis and the higher figure for its assessment of competing technologies (contrast Tables 1 and 4 to Table B-1). The Ninth Annual Report used the higher figure for both the financial and the competitive assessment analyses. As with most analyses at the Commission these days, slipping the lower figure into this report may be strategically motivated. If the FCC uses the higher figure and growth persists at the rate implicit in those figures, by this time next year cable will be well above 70 percent of the TV market. This is a threshold that would trigger petitions to the FCC to regulate cable. If the FCC shifts to the lower figure, or claims the conflict between the two creates uncertainty, the regulation trigger would be put off several years. Here, as elsewhere, the failure of the FCC to

5
develop solid independent data may harm consumers substantially. The FCC recognizes the dramatic increase in cable prices, but, like the industry, it emphasizes that “concurrently with these rate increases, however, the number of video and non-video services increased, including a substantial increase in the number of video channels, increased use of cable (as measured by a substantial increase in cable viewership), and the addition of advanced service offerings which, of course, are paid for separately by consumers.”ix Unfortunately, the FCC admits that its approach to measuring prices cannot address the fundamental issue, since it is based on an assumption that this paper shows to be doubtful – “Per channel rates, however, value all additional channels the same even if consumers do not want new channels that are added to cable systems.”x This paper shows that such an assumption is contradicted by consumer behavior. The cable video industry’s bundling harms consumers. The FCC regurgitates the industry claim that rising programming costs have driven basic rate increases, but does not examine the contradictory evidence embedded in its own numbers. For example, it notes that programming costs went from $7.5 billion in 1998 and will exceed $9 billion in 2003. xi It later cites a figure of $9.2 billion for 2002.xii Over the 1998-2003 period, revenues for basic and expanded basic services increased by $7.3 billion. Thus, three quarters of the price increases cannot be explained by rising programming costs. Price increases exceeded programming cost increases by more than $5 billion. The challenge of explaining away the excessive rate increase for basic and expanded basic service is made all the more difficult in light of the dramatic increase in revenues from advanced services. The FCC notes that dramatic rise of advanced service revenues citing “Kagan World Media reports it was high-margin, high-speed-data services that drove operating cash flow growth in 2002.”xiii Moreover, it notes that Kagan sees this trend growing in 2003, since “they expect high-speed data service ‘to contribute 12.4% to total residential revenue, the largest piece of the revenue pie after basic service.”xiv Digital tier services are the third largest revenue stream for cable operators, having surpassed local advertising for the first time in 2003.xv The fact that these two advanced services now bring in $10 billion in revenue should force the Commission to challenge the claim that basic and expanded basic prices had to rise to pay for the upgrade of the system. This issue, which the Commission has never addressed, is a central theme of this report. The FCC’s report goes on to claim that the bundling of advanced services with basic service “may provide some discount on basic or expanded basic,”xvi a proposition it does not even attempt to analyze, let alone prove. This paper shows that this bundling is anti-competitive. The FCC notes several cable industry milestones in this report, but fails to follow up on them. For example, it notes that the national Multichannel Video Programming Distribution (MVPD) market exceeds the threshold for a moderately concentrated market as defined by the Department of Justice/Federal Trade Commission Merger Guidelines. The FCC hastens to add that “it is unclear whether this is a potential competitive problem, because the delivery market is local, not national and because the main competitors to cable in both the upstream and downstream markets continue to grow in size.”xvii This observation is not comforting for several reasons. As has traditionally been the case, the FCC makes no effort to assess the level of concentration in the local market. If it did so, it would find that local MVPD markets are generally six times as concentrated as the national market on which it focuses.xviii Here the FCC encounters another contradiction. It continues to maintain that the clustering strategies of large multiple system operators might benefit consumers,xix even though the Commission’s own analysis has consistently shown that clustering results in higher prices.xx While it is true that the MVPD market is expanding, the FCC fails to note that its competitive assessment analysis shows that cable operators added more subscribers than all the other MVPD

6
competitors combined.xxi (Of course, the FCC may erase this observation by switching the numbers next year.) Moreover, the FCC fails to note that cable surpassed satellite in the number of digital subscribers for the first time in 2003.xxii Thus, the competitive threat from satellite that the FCC claims should ease our concern about concentration in the cable market may be subsiding, if it ever existed. In fact, this paper reviews the evidence that satellite has failed to discipline cable’s pricing abuse. The FCC’s simplistic parroting of the industry arguments and failure to conduct rigorous, independent analysis continues to disserve consumers. As cable prices mount and the industry extends its market power into new areas, “congress and American consumers deserve a better effort from the FCC.”xxiii II. THE SUPPLY SIDE A. MARKET POWER 101 All of the industry studies, as well as the FCC report, ignore the fundamental public policy issues raised by the consumer analysis. Simply put, every dog has his day and every monopolist has his profit-maximizing price. Unlike the hapless canine, however, who goes back to a dog’s life when his day is done, when the monopolist hits his profit-maximizing price, he goes on collecting excess profits. The abuse of consumers persists. What the cable industry economists have done in their recent papers defending cable industry prices is to focus on the scraps of consumer surplus left on the table by cable operators and ignore the submerged danger, the transfer of wealth and deadweight efficiency loss that result from the abuse of market power.xxiv Launching from the simple observation that every monopolist leaves a little surplus in consumers’ pockets, the cable industry analyzes the tip of the market power iceberg (see Exhibit 1a).xxv The shaded area in Exhibit 1a is the focal point of the NCTA paper. Consumer surplus (or

7
8
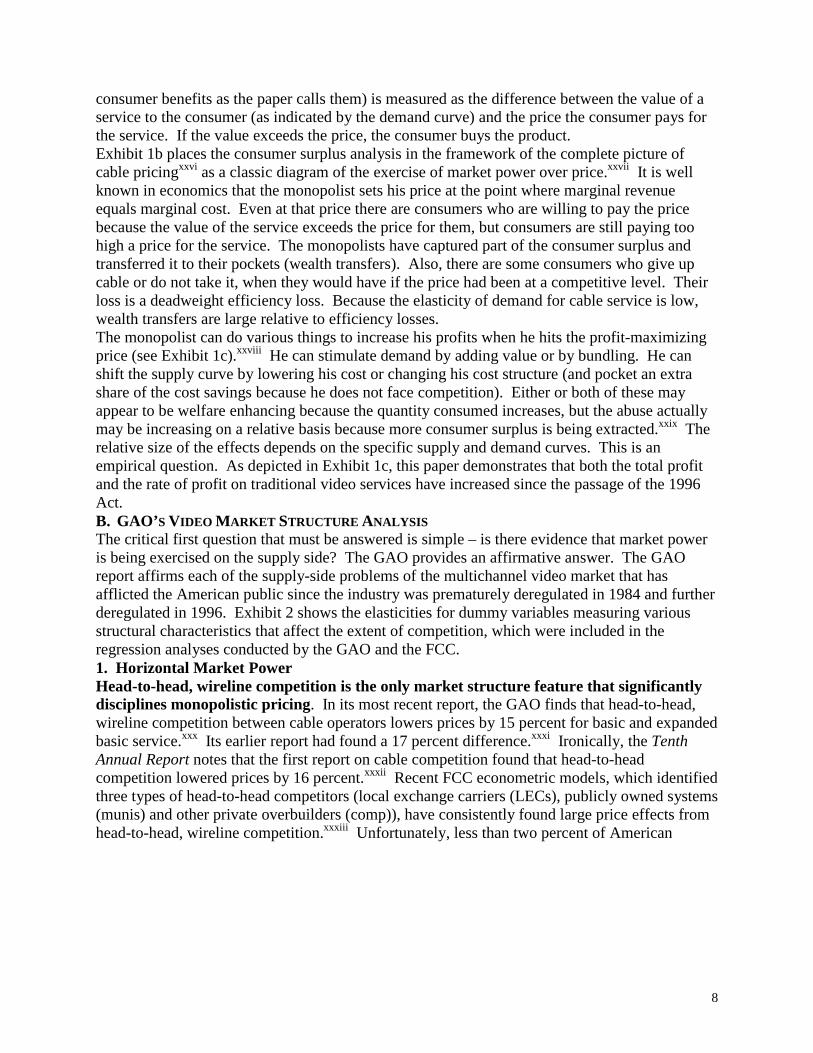
consumer benefits as the paper calls them) is measured as the difference between the value of a service to the consumer (as indicated by the demand curve) and the price the consumer pays for the service. If the value exceeds the price, the consumer buys the product. Exhibit 1b places the consumer surplus analysis in the framework of the complete picture of cable pricingxxvi as a classic diagram of the exercise of market power over price.xxvii It is well known in economics that the monopolist sets his price at the point where marginal revenue equals marginal cost. Even at that price there are consumers who are willing to pay the price because the value of the service exceeds the price for them, but consumers are still paying too high a price for the service. The monopolists have captured part of the consumer surplus and transferred it to their pockets (wealth transfers). Also, there are some consumers who give up cable or do not take it, when they would have if the price had been at a competitive level. Their loss is a deadweight efficiency loss. Because the elasticity of demand for cable service is low, wealth transfers are large relative to efficiency losses. The monopolist can do various things to increase his profits when he hits the profit-maximizing price (see Exhibit 1c).xxviii He can stimulate demand by adding value or by bundling. He can shift the supply curve by lowering his cost or changing his cost structure (and pocket an extra share of the cost savings because he does not face competition). Either or both of these may appear to be welfare enhancing because the quantity consumed increases, but the abuse actually may be increasing on a relative basis because more consumer surplus is being extracted.xxix The relative size of the effects depends on the specific supply and demand curves. This is an empirical question. As depicted in Exhibit 1c, this paper demonstrates that both the total profit and the rate of profit on traditional video services have increased since the passage of the 1996 Act. B. GAO’S VIDEO MARKET STRUCTURE ANALYSIS The critical first question that must be answered is simple – is there evidence that market power is being exercised on the supply side? The GAO provides an affirmative answer. The GAO report affirms each of the supply-side problems of the multichannel video market that has afflicted the American public since the industry was prematurely deregulated in 1984 and further deregulated in 1996. Exhibit 2 shows the elasticities for dummy variables measuring various structural characteristics that affect the extent of competition, which were included in the regression analyses conducted by the GAO and the FCC. 1. Horizontal Market Power Head-to-head, wireline competition is the only market structure feature that significantly disciplines monopolistic pricing. In its most recent report, the GAO finds that head-to-head, wireline competition between cable operators lowers prices by 15 percent for basic and expanded basic service.xxx Its earlier report had found a 17 percent difference.xxxi Ironically, the Tenth Annual Report notes that the first report on cable competition found that head-to-head competition lowered prices by 16 percent.xxxii Recent FCC econometric models, which identified three types of head-to-head competitors (local exchange carriers (LECs), publicly owned systems (munis) and other private overbuilders (comp)), have consistently found large price effects from head-to-head, wireline competition.xxxiii Unfortunately, less than two percent of American

9
EXHIBIT 2:
Impact Of Market Structure Characteristics On Monthly Rates (Regression Coefficients, dummy variables)
-0.4
-0.3
-0.2
-0.1
0
0.1
0.2
GAO COMP
FCC LEC
FCC MUNI
FCC COMP
GAO MSO
FCC MSO
FCC CLUSTER
GAO DBS
FCC DBS
ELA
STIC
ITY
Sources: Federal Communications Commission, Report on Cable Prices, April 4, 2002, Attachment D-1; General Accounting Office, Issues Related to Competition and Subscriber Rates in the Cable Television Industry, October 2003, Appendix IV, Table 3.

10
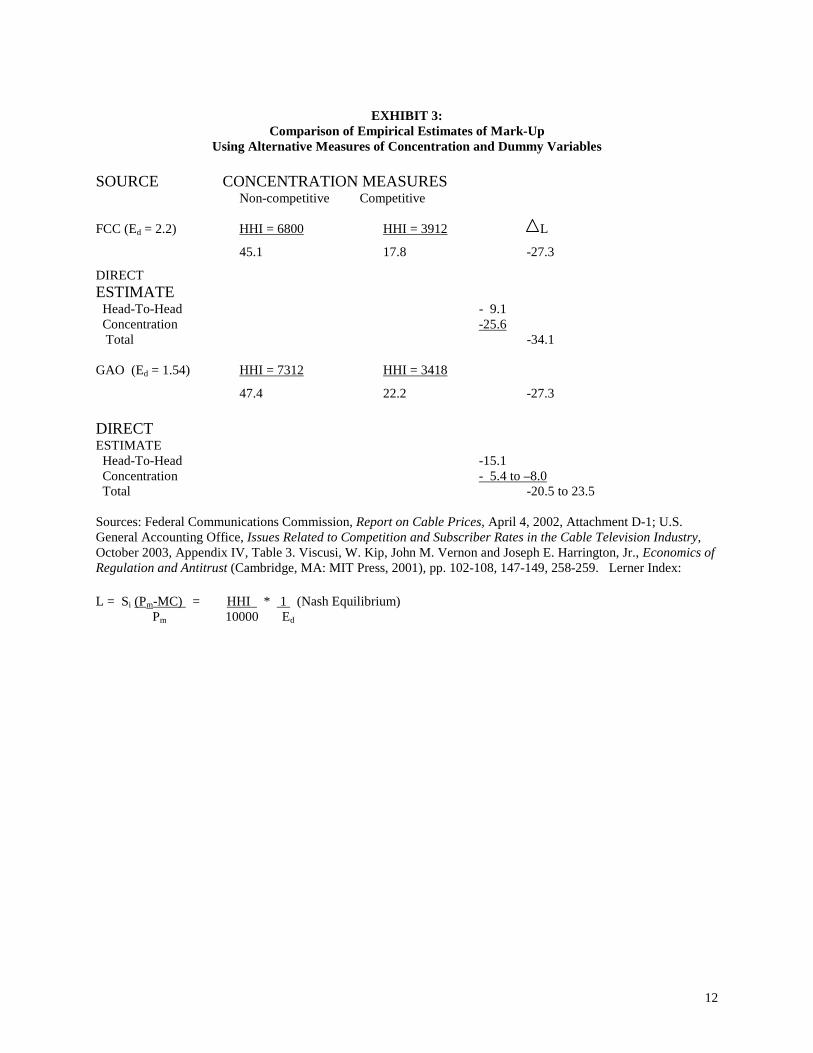
households enjoy the benefit of head-to-head, wireline competition.xxxiv The result is an abuse of market power that costs the American public about $4.5 billion per year in cable rates alone.xxxv Bigger monopolies are worse when it comes to consumer prices. In the GAO analysis, if a cable system is part of a large national operator, its prices are 5.4 percent higher than if it is not.xxxvi The GAO called this horizontal concentration. FCC econometric models have been finding this to be the case for several years, with even larger effects of being part of a multiple system operator (MSO).xxxvii When the FCC models add in a specific variable for regional clustering, a dramatic trend in the industry, they find that clustering has an added effect of further raising price.xxxviii Being served by one of the mega-multiple system operators, who have been expanding their grip on the industry through mergers and clustering, drives prices higher by more than 5 percent and perhaps as much as 8 percent. Thus, there could be as much as an additional $1.5 billion in consumer savings that could be wrung out of the cable market if it were deconcentrated. The important implication is that the theory used to allow large cable operators to become larger is not supported by the empirical evidence.xxxix That theory claimed that the combination of larger, clustered systems would create efficiency-based cost savings that would be passed on to the public because one big monopolist is no worse that two, contiguous smaller ones. Since large incumbents never overbuild one-another and compete, this theory claimed there was little to be lost. The econometric evidence suggests that there is considerable harm. It turns out that large operators and clustered systems have more muscle to thwart competition and impose price increases. They can distribute programming terrestrially and extract exclusivity deals from independent programmers, thereby denying programming to competing distribution media (overbuilders and satellite). They have more leverage over local governments to obstruct the entry of overbuilders. The large incumbent cable operators never competed by overbuilding a neighbor, they grow by merger. Policymakers surrendered to the cable urge to merge too easily. If cable operators knew they could not grow through mergers and really cared about size, they might compete by overbuilding one another.xl Intermodal competition – between cable and satellite – does not effectively discipline cable’s pricing power. In contrast to head-to-head, wireline competition, which lowers cable bills by $5 per month, competition from satellite lowers bills by a mere $.15, according to the GAO.xli In other words, head-to-head, wireline competition is almost 40 times as effective as intermodal competition when it comes to price. In fact, in the GAO report, even satellite’s very modest pricing effect is not statistically significant by traditional standards. It fails at the 5 percent level of significance. The FCC’s econometric analysis does not find even this small price effect. It finds a statistically significant effect in the opposite direction.xlii To the extent that satellite has any competitive effect, it drives cable operators to offer more channels, but this effect stems from the decision of satellite to offer local programming. Where satellite offers local programming, cable operators offer about 5.4 percent more cable channels. Thus, satellite appears as a niche product that cannot discipline cable pricing abuse for the vast majority of cable subscribers who take only basic and expanded basic.xliii Exhibit 3 explores the implications of the most recent econometric findings on horizontal market power. Using the traditional measure of market power and the standard measure of the pricing abuse that results – the Lerner Index – it explores the relationship between the number and size of firms in cable markets and the mark-up of price over cost. A more advanced approach uses the level of concentration in the market (as measured by the HHI) in the Lerner Index instead of the simple number of firms. The mark-up of price above cost is inversely related to the extent of
11
competition and the market elasticity of demand. The more competitive the market and the more elastic the demand, the less the ability to increase price. The analysis uses the econometric estimate of the elasticity of demand and the implicit levels of concentration The econometric estimate of a 20 percent mark-up from a lack of head-to-head competition and horizontal concentration is consistent with, even a conservative estimate of, the pricing power suggested by the market structural conditions (demand elasticity and market shares) implicit in both the GAO and the FCC analyses. 2. Vertical Market Power Vertical relationships are exploited by cable operators. GAO finds that cable operators are majority owners of one-fifth of the top 90 national networks. The GAO does not find price discrimination but it does find discrimination in carriage. That is, cable operators do not pay themselves more for their own shows, but they are much more likely to air them. The effect is quite large. Cable operators are 64 percent more likely to carry the programming in which they have a majority ownership stake. Cable operators who have a stake in programming also carry fewer channels overall. This result is consistent with prior academic studies.xliv A one-fifth share of the most popular programs is a very substantial stake in the programming market and it blunts cable operators’ incentive to resist price increases. Cable operators own minority stakes in other networks. With their market power at the point-of-sale, cable operators know that they can pass costs through to consumers and they can assure that their own programs are carried much more frequently than those of others, thereby gaining a disproportionate share of the overall increase in programming costs. While no cable operator had pricing power in the programming market until recently, Comcast appears to have gained pricing power as a large purchaser of programming. Having achieved a large enough market share, it now has monopsony power over sellers of programming. Comcast is squeezing programmers to lower their fees at the same time it is announcing price increases for basic and expanded basic. It is both reallocating rents from programmers to itself xlv and increasing the rents collected from consumers.xlvi Rights of carriage matter a great deal in the cable industry. The decision of Congress to give broadcasters must carry/retransmission rights has enabled the broadcasters to gain a significant advantage for their programming, in terms of carriage. Programs owned by broadcasters are 41 percent more likely to be carried by cable operators. Clearly, independent programmers are at a severe disadvantage, as has been demonstrated time and again. Although the GAO report concludes that 38% of the cable networks are majority owned by non-cable, non-broadcast firms, a much smaller percentage, less than 20 percent, do not have a least some minority ownership of broadcasters or cable operators.
12
EXHIBIT 3:
Comparison of Empirical Estimates of Mark-Up Using Alternative Measures of Concentration and Dummy Variables
SOURCE CONCENTRATION MEASURES
Non-competitive Competitive FCC (Ed = 2.2) HHI = 6800 HHI = 3912 L
45.1 17.8 -27.3
DIRECT ESTIMATE Head-To-Head - 9.1 Concentration -25.6 Total -34.1 GAO (Ed = 1.54) HHI = 7312 HHI = 3418
47.4 22.2 -27.3 DIRECT ESTIMATE Head-To-Head -15.1 Concentration - 5.4 to –8.0 Total -20.5 to 23.5 Sources: Federal Communications Commission, Report on Cable Prices, April 4, 2002, Attachment D-1; U.S. General Accounting Office, Issues Related to Competition and Subscriber Rates in the Cable Television Industry, October 2003, Appendix IV, Table 3. Viscusi, W. Kip, John M. Vernon and Joseph E. Harrington, Jr., Economics of Regulation and Antitrust (Cambridge, MA: MIT Press, 2001), pp. 102-108, 147-149, 258-259. Lerner Index:
L = Si (Pm-MC) = HHI * 1 (Nash Equilibrium) Pm 10000 Ed

13
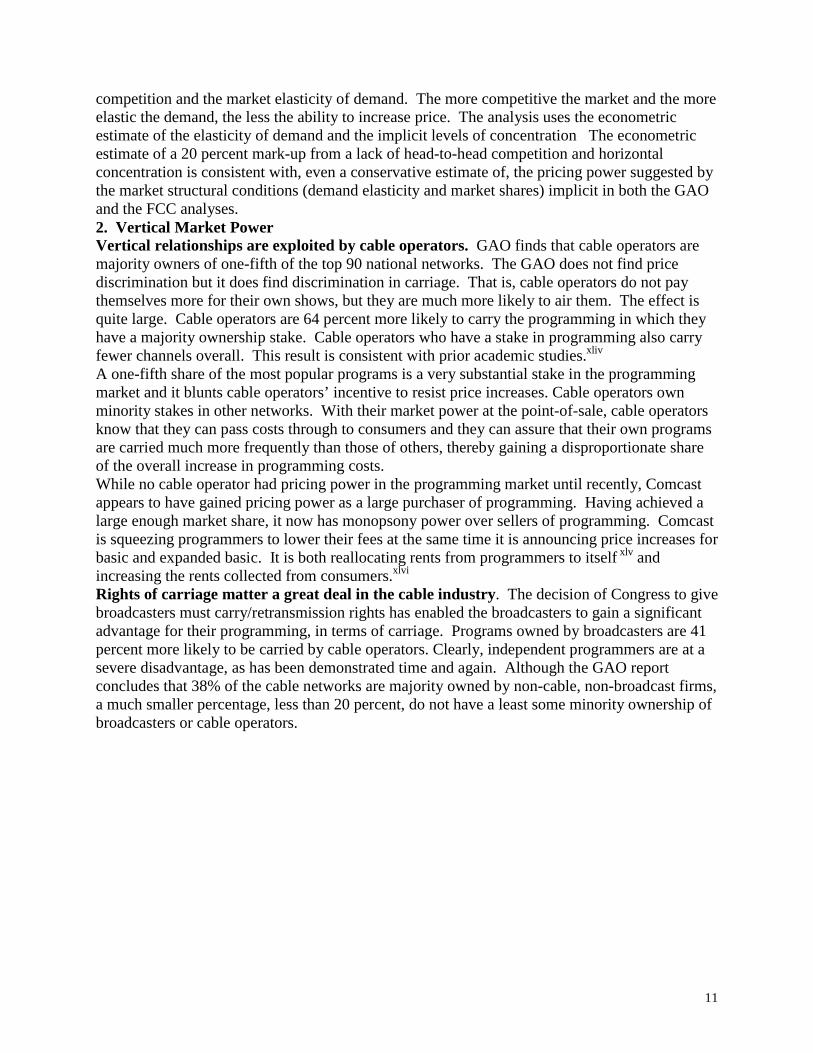
While discrimination in carriage has implications for the pricing issue that is the central concern of this paper, it has much broader implications for public policy in the multichannel video market. Public policy has expressed a concern about promoting independent production and ensuring a diversity of content for decades. Two pending proceedings at the FCC directly involve the question of how concentration of ownership and the exercise of market power in the form of discriminatory access to distribution affect the content available to the public. In the horizontal limits proceeding, the FCC is charged with setting a limit on the market reach of a single cable operator.xlvii Similarly, in several of the media ownership proceedings the market reach of broadcasters (and the availability of cable as a distribution technology) is a central concern. The conclusion is overwhelmingly clear. Those who have Congressionally mandated rights of carriage are able to have their shows aired, those who do not have almost no chance of success. C. HIGH-SPEED INTERNET Although high-speed Internet raises many important issues, from the point of view of video services pricing, it plays two important roles. First, it is cited by the industry and analyses as one of the causes for the increase in cable prices. Since the plant upgrade supports other streams of revenue, the GAO cautions, “[f]irst, depreciation expenses (and therefore infrastructure investment) represent a joint (or common) expense for both video-based and Internet-based services. Because these expenses are associated with more than one service, it is unclear how much of this cost should be attributed to video-based services. Second, cable operators are enjoying increased revenues from these non-video sources.”xlviii The same is true for operating expenses. A large part of the increased expense is associated with the selling and servicing of advanced video, Internet and telephone service that “have been spread across the entire revenue base – i.e. they are reflected in the prices paid by basic cable subscribers.”xlix Looking at a short period, 1999 to 2002, the GAO finds that revenues from Internet services alone are already almost equal to the increased depreciation expense of the cable plant upgrade. The GAO estimates that capital costs (depreciation expenses) have increased by $80 per subscriber, while Internet-only revenues increased by $74.l Second, cable operators have rapidly achieved positive cash flow from high-speed Internet services because of weak competitive forces. Cable operators are aggressively bundling high-speed Internet with video services to gain competitive leverage. Their market power over high-speed Internet access gives them an important anticompetitive tool. Cable has foreclosed competition for Internet access service over its platform.li Controlling the platform diminishes the potential competition from video streaming over the Internetlii and becomes a lever against competition from other distribution technologies. Cable has an 83 percent market share of the residential advanced high-speed Internet market.liii Moreover, cable provides overwhelmingly (87 percent) advanced service, while DSL is overwhelmingly (67 percent) not advanced. Discrimination was even more brutal in the Internet space as cable operators applied their business model to high-speed Internet access. Only a consent decree forced Time Warner to allow modest access, and intense scrutiny forced AT&T to make some minor concessions, but the recent AOL/AT&T carriage agreement is thoroughly anticompetitive.liv AOL has been unable to actually execute any carriage agreements with cable companies.lv Cable operators do not sell ISP services outside of their service territories where they have the leverage of their market power over cable facilities. With intramodal competition foreclosed, cable faces only weak intermodal competition. Cable has scoffed at the modest discounting efforts of the telecommunications-based DSL service

14
providers.lvi In fact, Comcast raised the price of stand-alone high-speed Internet on its newly acquired AT&T systems. The reason cable can ignore intermodal competition is simple; those discounted services are substantially more expensive on a megabit basis (see Exhibit 4). The cable operators ignore DSL pricing moves and harp on speed superiority in their advertising. Exhibit 4 also shows why dial up is not a substitute for high-speed access. It is far more expensive on a megabit basis. Moreover, dial-up lacks the other key feature of high-speed service -- it is not always on. This distinction led the Justice Department to declare early on that high-speed Internet is a separate product from dial-up.lvii Satellite lacks the ability to offer a bundle of video and high-speed Internet to compete effectively with cable. Cable recognizes this and is aggressively bundling high-speed Internet with basic cable service – offering a 25 percent discount on a bundle of basic cable and Internet compared to stand alone Internet service.lviii Looking carefully at specific product and geographic markets reveals little competitive overlap of different facilities (see Exhibit 5).lix Intermodal competition is weak at best. Technological differences give different facilities an edge in different customer and geographic markets.lx Cable dominates the advanced residential high-speed Internet market, with a 75 percent market share for residential market of speeds of greater than 200kbps in both directions.lxi DSL, as deployed, is ill suited to multimedia video applications,lxii but DSL dominates the non-residential market with a 95 percent market share because businesses are disinclined to use cable.lxiii For the next generation telephone network technologies, “most experts agree that the VDSL business case isn’t for everyone and won’tlxiv realize its full revenue potential for decades.”lxv However, cable operators devote less than two percent of the capacity of their systems to cable modem service. They could easily expand that if they so desired. This gives them an immense advantage over telephone companies.lxvi D. CASH FLOW ANALYSIS 1. All Revenues, All Costs
To assess whether the rate increases of recent years have been abusive, I analyze cash flow. I use 1995 as the base year, since the Telecommunications Act of 1996 was signed in early February. For several reasons, it is important to capture this whole period. Industry analyses, including that of the GAO, choose a very short time frame, 1999 to 2002, and miss critical factors.lxvii

15
EXHIBIT 4: The Price of High-Speed Internet Service
Bundled Cable
Stand alone Cable
DSL
Discount DSL
Accelerated Dial Up
Dial-up
0
25
50
75
100
125
150
175
200
0 0.2 0.4 0.6 0.8 1 1.2 1.4 1.6
Megabits
Cos
t Per
Meg
abit
Per
Mon
th
Source: Calculated by author from web site visits.
Satellite

16
EXHIBIT 5: Market Segmentation Of Services Between Technologies
Source: Federal Communications Commission, In the Matter of Annual Assessment of the Status of Competition in Markets for the Delivery of Video Programming, Fifth Annual Report, December 23, 1998, Table B-7; Ninth Annual Report, December 2002, Table Appendix B. High-Speed Services for Internet Access, December 2003, Table 1, 2 and 4; Local Telephone Competition: Status as of December 31, 2002, June 2003, Tables 1, 13; NCTA, Overview 2003: Mid-Year, p. 1. First, the upgrade of the cable plant began well before 1999, as did the post-1996 Act rate increases. By 1999, the cable industry had already upgraded one-third of its plant. Rates for basic + expanded service had already increased by 50 percent and net operating income (operating revenue minus operating costs) had increased by over 25 percent. In fact, just one year after the passage of the Telecommunications Act of 1996 the issue of cable rate increases had already arisen. The FCC’s January 1997 cable price report noted that “the Cable CPI
0
10
20
30
40
50
60
70
80
90
100
Res. AdvancedInternet
Bus. AdvancedInternet
Multichannel Video
Perc
ent o
f Mar
ket
WIRELESS COPPER HFC
17
increased at a 3.7% compound annual rate from January 1995 to December 1995, and at a 8.5% compound annual rate for the eleven months from January 1996 to November 1996.”lxviii The song and dance about the causes of the increases had already begun, when the Commission declared:
we note from anecdotal evidence reported in both the trade press and the general news media that cable operators have attributed the recent increases in cable rates to higher programming costs, system upgrades which provide additional channels, and the pass through of the effects of general inflation on operators’ costs.lxix
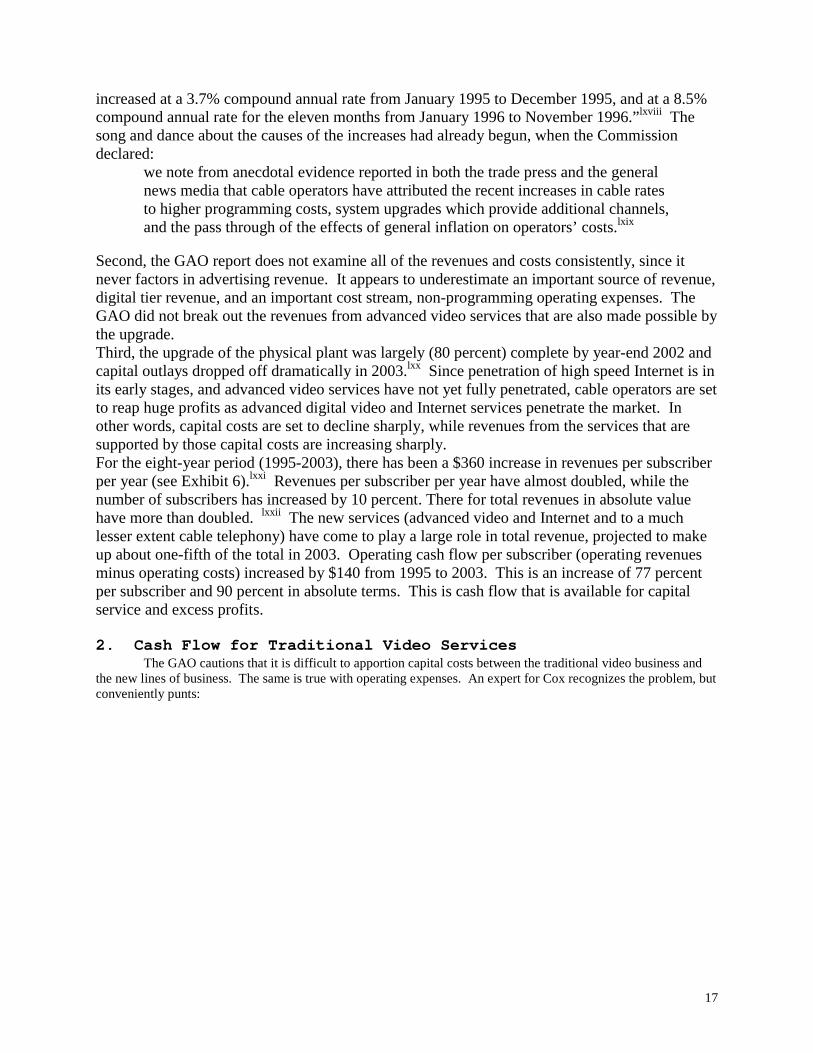
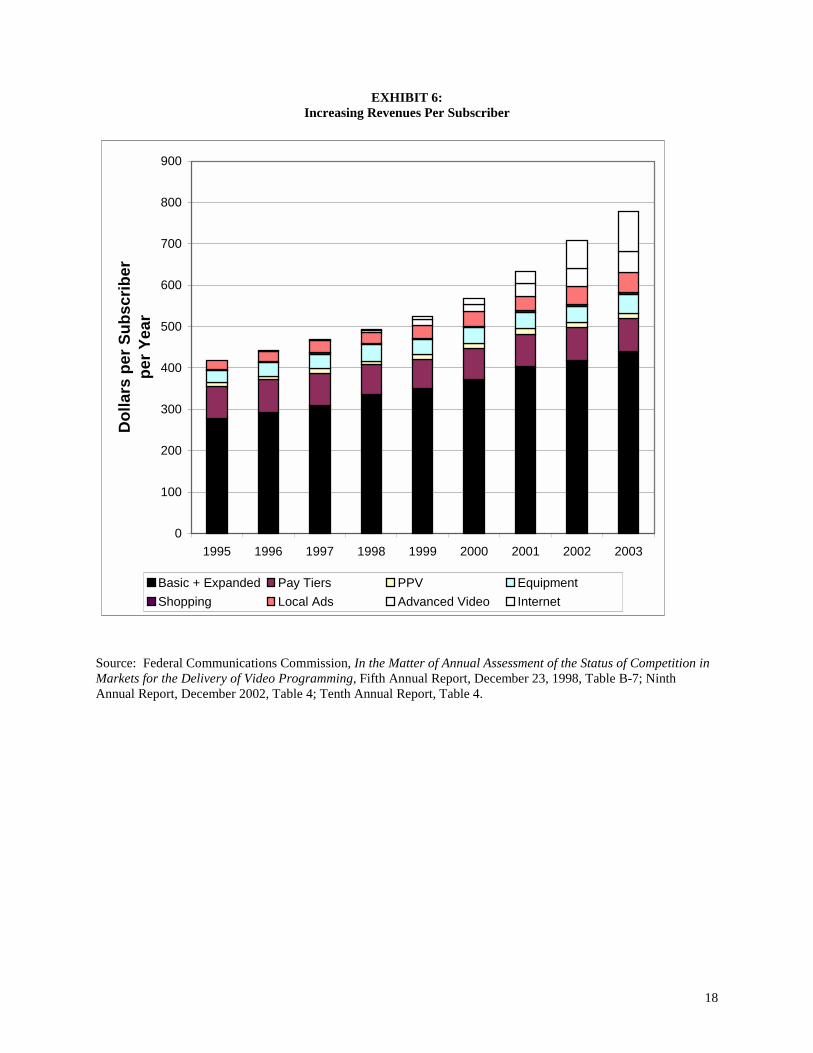
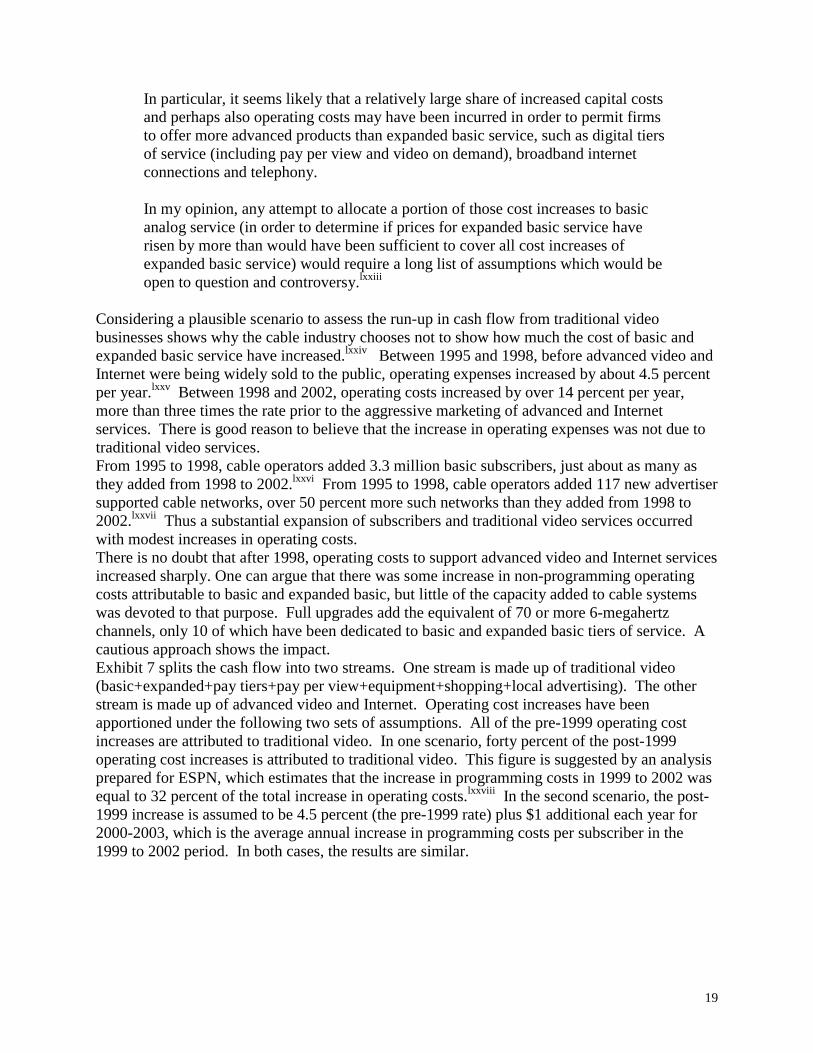
Second, the GAO report does not examine all of the revenues and costs consistently, since it never factors in advertising revenue. It appears to underestimate an important source of revenue, digital tier revenue, and an important cost stream, non-programming operating expenses. The GAO did not break out the revenues from advanced video services that are also made possible by the upgrade. Third, the upgrade of the physical plant was largely (80 percent) complete by year-end 2002 and capital outlays dropped off dramatically in 2003.lxx Since penetration of high speed Internet is in its early stages, and advanced video services have not yet fully penetrated, cable operators are set to reap huge profits as advanced digital video and Internet services penetrate the market. In other words, capital costs are set to decline sharply, while revenues from the services that are supported by those capital costs are increasing sharply. For the eight-year period (1995-2003), there has been a $360 increase in revenues per subscriber per year (see Exhibit 6).lxxi Revenues per subscriber per year have almost doubled, while the number of subscribers has increased by 10 percent. There for total revenues in absolute value have more than doubled. lxxii The new services (advanced video and Internet and to a much lesser extent cable telephony) have come to play a large role in total revenue, projected to make up about one-fifth of the total in 2003. Operating cash flow per subscriber (operating revenues minus operating costs) increased by $140 from 1995 to 2003. This is an increase of 77 percent per subscriber and 90 percent in absolute terms. This is cash flow that is available for capital service and excess profits. 2. Cash Flow for Traditional Video Services
The GAO cautions that it is difficult to apportion capital costs between the traditional video business and the new lines of business. The same is true with operating expenses. An expert for Cox recognizes the problem, but conveniently punts:
18
EXHIBIT 6: Increasing Revenues Per Subscriber
Source: Federal Communications Commission, In the Matter of Annual Assessment of the Status of Competition in Markets for the Delivery of Video Programming, Fifth Annual Report, December 23, 1998, Table B-7; Ninth Annual Report, December 2002, Table 4; Tenth Annual Report, Table 4.
0
100
200
300
400
500
600
700
800
900
1995 1996 1997 1998 1999 2000 2001 2002 2003
Dol
lars
per
Sub
scrib
er
per Y
ear
Basic + Expanded Pay Tiers PPV EquipmentShopping Local Ads Advanced Video Internet
19
In particular, it seems likely that a relatively large share of increased capital costs and perhaps also operating costs may have been incurred in order to permit firms to offer more advanced products than expanded basic service, such as digital tiers of service (including pay per view and video on demand), broadband internet connections and telephony. In my opinion, any attempt to allocate a portion of those cost increases to basic analog service (in order to determine if prices for expanded basic service have risen by more than would have been sufficient to cover all cost increases of expanded basic service) would require a long list of assumptions which would be open to question and controversy.lxxiii
Considering a plausible scenario to assess the run-up in cash flow from traditional video businesses shows why the cable industry chooses not to show how much the cost of basic and expanded basic service have increased.lxxiv Between 1995 and 1998, before advanced video and Internet were being widely sold to the public, operating expenses increased by about 4.5 percent per year.lxxv Between 1998 and 2002, operating costs increased by over 14 percent per year, more than three times the rate prior to the aggressive marketing of advanced and Internet services. There is good reason to believe that the increase in operating expenses was not due to traditional video services. From 1995 to 1998, cable operators added 3.3 million basic subscribers, just about as many as they added from 1998 to 2002.lxxvi From 1995 to 1998, cable operators added 117 new advertiser supported cable networks, over 50 percent more such networks than they added from 1998 to 2002.lxxvii Thus a substantial expansion of subscribers and traditional video services occurred with modest increases in operating costs. There is no doubt that after 1998, operating costs to support advanced video and Internet services increased sharply. One can argue that there was some increase in non-programming operating costs attributable to basic and expanded basic, but little of the capacity added to cable systems was devoted to that purpose. Full upgrades add the equivalent of 70 or more 6-megahertz channels, only 10 of which have been dedicated to basic and expanded basic tiers of service. A cautious approach shows the impact. Exhibit 7 splits the cash flow into two streams. One stream is made up of traditional video (basic+expanded+pay tiers+pay per view+equipment+shopping+local advertising). The other stream is made up of advanced video and Internet. Operating cost increases have been apportioned under the following two sets of assumptions. All of the pre-1999 operating cost increases are attributed to traditional video. In one scenario, forty percent of the post-1999 operating cost increases is attributed to traditional video. This figure is suggested by an analysis prepared for ESPN, which estimates that the increase in programming costs in 1999 to 2002 was equal to 32 percent of the total increase in operating costs.lxxviii In the second scenario, the post-1999 increase is assumed to be 4.5 percent (the pre-1999 rate) plus $1 additional each year for 2000-2003, which is the average annual increase in programming costs per subscriber in the 1999 to 2002 period. In both cases, the results are similar.

20
-40
-20
0
20
40
60
80
100
120
1996 1997 1998 1999 2000 2001 2002 2003
Dol
lars
Per
Sub
scrib
er
Per Y
ear
Total Traditional Video Advanced Video + InternetSeries1 Series4
EXHIBIT 7: Cumulative Increases in Cash Flow Per Subscriber
From Traditional and Advanced Cable Services Source: Federal Communications Commission, In the Matter of Annual Assessment of the Status of Competition in Markets for the Delivery of Video Programming, Fifth Annual Report, December 23, 1998, Table B-7; Ninth Annual Report, December 2002, Table 4; Seventh Annual Report, p. 102. Tenth Annual Report, Table 4. See text for assumptions.
Traditional Video
Advanced Services

21
Cash flow grew sharply from traditional video service through 2001 and then leveled out at a very high level. The leveling is due to a combination of increasing programming costs and continually mounting non-programming operating costs attributed to traditional video. Non-programming operating expenses for traditional video are not likely to continue to rise at the assumed rate, certainly not for traditional video services. Therefore, the increase in the cash flow is likely to be permanent. Cash flow from traditional services increased as a percentage of revenue from those services. Cash flow from advanced video and Internet services was slightly positive early. It became negative with the major roll out of Internet services, but became sharply positive in 2003. The market structure and financial analysis in this section present a strong case that the conceptualization of the supply-side of the market in Exhibit 1 is correct. There is a continuing exercise of market power over traditional video services. Both the absolute size and the rate of profits on traditional video services appear to have increased over the period. In this sense, the consumer complaint about rising cable rates is fully justified. III. THE DEMAND-SIDE If consumer surplus is also growing rapidly, however, then that might blunt the public policy concern. NCTA seeks to demonstrate that there was a substantial increase in consumer surplus by claiming that the real price of quality-adjusted service has declined. Thomas Hazlett makes a similar claim, based primarily on the growth of subscribers and channels.lxxix In this section, I demonstrate that this basic claim is incorrect and the whole welfare improvement argument overstated. A. ESTIMATION OF QUANTITY ADJUSTED PRICE CHANGES The cable industry estimates involve a series of analytic errors of commission and omission and the general claims of increases in consumer welfare have several fundamental flaws. First, there is a misspecification of the units of analysis. Referring to Exhibit 1, the quantity of cable consumed (measured on the X-axis) is counted by NCTA as the total number of viewing hours. Since the X-axis is the total amount of consumption, the amount paid (measured on the Y-axis) should be the total amount paid for the products consumed. However, for the Y-axis in their welfare calculation, NCTA uses the BLS consumer price index for services. NCTA recognizes, however, that the BLS index has already been adjusted downward for increases in the quantity of channels available and other factors. Therefore, the NCTA double counts quantity changes. In the analysis below, I use the actual price paid for the total bundle of programs.lxxx Second, NCTA chooses to start its analysis eighteen months after the passage of the Telecommunications Act of 1996, conveniently excluding eighteen months of the most rapid rate increases in the history of the industry. Third, there would also appear to be a mismatch between the estimate of increased viewing and the estimate of declining prices. Since viewing numbers are seasonal and January is roughly the mid-point of the season, I use January prices.lxxxi The cable industry estimates that in the 1995/1996 season, the average cable household watched 23.4 hours of advertiser supported cable networks per week (see Exhibit 8). I estimate

22
EXHIBIT 8:
Cost of Viewing, 1996 & 2003 Market Condition Viewing Monthly Cost/ Cost/ Hours Cost Viewing Viewing Hour Hour Nominal Real 1/1/96 Noncompetitive 23.4 $22.60 $.966 $.966 1/1/03 Noncompetitive 34.7 41.60 1.198 1.019 switching has full value % Increase in Viewing Cost Nominal 1/1/96 Noncompetitive 23.4 $22.60 $.966 } 48.2 1/1/03 Noncompetitive 29.05 41.60 1.432 switching valued ½ at the margin 1/1/96 Noncompetitive 23.4 $22.60 $.966
} 1.66 1/1/03 Noncompetitive 26.0 41.60 1.60 switching valued ¼ at the margin BLS INCREASE (1/1/96 to 1/1/03) 48.5 Source: For hours of viewing, Cable TV Advertising, Weekly Viewing of Ad-Supported Cable per Cable Household, and Source: NCTA, Steven S., Assessing Quality Adjusted Changes in the Real Price of Basic Cable Service, attached to Comments of the National Cable Telecommunications Association, in Federal Communications Commission, In Re: The Annual Assessment of the Status of Competition in the Market for the Delivery of Video Programming, MB Docket No. 03-172, September 11, 2003, p. 12. Cable prices for noncompetitive systems from Federal Communications Commission, Report on Cable Prices, January 2, 1997, p. 12, May 7, 1999, p. 9; June 15, 2000, p. 9; Feb 14, 2001; 9; April 4, 2002, p. 8; July 8, 2003, p. 10; General Price increases from Bureau of Labor Statistics, Consumer Price Index.

23
that in January 1996, which coincidentally is the month before the 1996 Telecommunications Act was signed, the average monthly bill was $22.60. The average cost per weekly viewing hour to the consumer was $.966. The cable industry estimates that in the 2002/2003 season, the average cable household watched 34.7 hours of advertiser supported cable networks per week. I estimate the average price in January 2003 to be $41.60 per month. The average cost per weekly viewing hour was $1.199. That is a nominal increase of 24 percent. Inflation over the period was 17.7 percent, so the real increase was 5.5 percent. This is a very different picture than the 15 percent decline that NCTA claims by double counting quality improvements. B. BUNDLING, THE DEMAND CURVE AND CONSUMER SURPLUS These simple math problems are compounded by conceptual issues. Bundling is the central character in the current drama surrounding cable prices and this wreaks havoc with the NCTA estimate of consumer welfare. The failure of cable operators to offer cable channels on an unbundled basis makes it difficult to divine the demand curve for individual channels. NCTA mentions, in passing, that viewing is not evenly distributed, but that does not influence its calculation. NCTA assumes (or at least uses in every example and hypothetical case) that demand is linear and that elasticity does not change over time. Both of these assumptions are dubious at best. Cox assumes demand is linear, equal and uncorrelated across individual channels to work its example of consumer benefit from bundling.lxxxii This, too, is dubious, at best. At least Cox recognizes that there are conditions under which bundling results in consumer harm. The conditions are:
related to a firm’s motivation to try to charge different consumers different prices for the same product depending upon what they are willing to pay for it. The essential idea is that when there is some negative correlation between individual consumers’ valuation of different products, that firm can sometimes charge higher prices to everyone by bundling goods together.lxxxiii
Although Cox notes that: “it is easy to create examples where bundling can make consumers worse off but equally easy to create examples where bundling makes consumers better off,” it ignores the problem.lxxxiv Bundling demands greater attention. Comcast’s approach provides a useful starting point. It presents cable bundling as a greengrocer who sells tomatoes for $2 per pound, but who might also sell five pounds for $7.50. The tomatoes are cheaper on a per unit basis in the bundle (a volume discount) although the total bill is greater. The fundamental problem is that greengrocers invariably give the consumer a wide range of choices. The consumer can buy half a pound of tomatoes, or three pounds, or take the five-pound discount, as his or her needs may dictate. Cable operators do not give consumers that much choice. In fact, cable operators give consumers almost no choice. Essentially cable consumers have three choices – take nothing, take almost nothing (basic), or take almost everything (expanded basic). If I really need two pounds of tomatoes for my spaghetti sauce, I have to take all five pounds and most of the other fruits and vegetables, even though the rest of it is of little value to me.lxxxv My next door neighbor, who really needs two pounds of apples for her pie, is forced to buy five pounds of apples and the tomatoes and all the other fruits and vegetables, too. We both end up paying a higher price and, given the nature of the commodity, we cannot recapture the surplus through trade. It is conceivable that we could split the cost, but then I have to have my neighbors in my house all the time. If we buy one subscription and try to run a wire (or a wireless network) between our houses, the cable operators have us arrested for stealing their

24
signal. NCTA’s welfare analysis assumes a full hour of increased welfare when a consumer shifts from watching a broadcast show to watching a cable show. That is, if a consumer watches a rerun of “Law and Order” on USA, instead of NBC, NCTA claims the full hour as an increase in the consumer’s welfare. There may be little welfare gain. If the consumer had shifted from watching “West Wing” to watching “Law and Order,” one could argue that there is a welfare gain, but it is only the marginal difference between the two. Because the shows are all forced into the bundle, we cannot tell what consumers would pay for them on a stand-alone basis. If total hours of viewing had increased as much as cable viewing, the assumption that every hour watched on cable represents a full hour of gained consumer welfare would be more plausible, but that is not the case. The increase in total viewing is considerably less than the increase in cable viewing. In contrast to the 5.7 percent per year increase claimed by cable operators for viewing of advertiser supported cable networks, the FCC cites estimates of less than a 1.5 percent per year increase in viewing over a similar period,lxxxvi while others show less than a one percent per year increase. A well respected industry source that estimates both total TV viewing hours and basic/expanded cable network viewing hours puts the total increase at 25 percent of the cable switching increase.lxxxvii Even if we assume that the entirety of increased TV viewing occurred in cable households, we would still conclude that the net increase in viewing was equal to slightly over one-third of the total increase in cable network viewing. If we assume that the actual increase in consumer welfare is equal to half the total increase in cable viewing (leaving some room for a marginal increase due to switching), the quality-adjusted cost would be $1.432 (see Exhibit 8). The increase in the price over the 1996 – 2003 period would be 48 percent. Interestingly, the quantity and quality adjusted price as reported by the BLS increased by 49 percent over this period. If the increase in value in viewing were equal only to the increase in total viewing (i.e. valued ¼ at the margin), the effective price increase would be 66 percent over this period, almost fifty percent higher. The case against the BLS price index is not convincing. In fact, the BLS may be over-adjusting for quantity and quality because many channels are forced into the bundle that few people are watching. The top 10 cable programs account for 50 percent of all viewing that is significant enough to be registered by Nielsen. The top 20 shows account for 75 percent of all such viewing. The GAO reports that the typical household watches only 17 channels. People are being forced to buy a lot of shows they don’t watch to get the ones they want. Although the bottom 30 shows that register on the Nielsen scale pass an average of just under 70 million homes, only about a quarter of a million households watch them during any given day. For every one household watching, approximately 250 who are forced to pay for it in the bundle are not. For the bottom two shows, the ratio is 1 to 800. Over 250 additional cable networks do not capture enough viewers to even register on the Nielsen scale. lxxxviii A recent study by Deutsche Bank of the Cox – ESPN controversy reinforces the conclusion that bundling leads NCTA to overestimate the welfare gains (see Exhibit 9).lxxxix ESPN is one of the most popular and the most expensive cable networks, yet seventy-eight percent of respondents said that they would not pay $2 per month for it if they were given the choice. Cox confirms this estimate, noting that less than a quarter of its subscribers are “avid sports fans.” There is good reason to believe that the elasticity of demand for ESPN alone is a lot higher than for the bundle and that the bundling of sports programming into the most popular package is harming consumers. The three-quarters of cable viewers who say they would not pay $2 dollars for ESPN, likely the three-quarters who are less than avid sports fans, are paying over $1.5 billion for it in the bundle (at Cox’s cost).xc Exhibit 9 shows the wealth transfers and efficiency

25
losses associated with ESPN. For every one dollar of consumer surplus, there is at least one dollar of wealth transfer. This does not include the wealth transfers associated with the overpricing of ESPN to those who would take it, which may equal another quarter of the consumer surplus. The deadweight efficiency losses are an additional cost associated with this anti-consumer bundling. IV. LONG-TERM TRENDS A. PRICE NCTA’s hours of viewing approach to consumer welfare analysis vastly overstates the gain in welfare and the BLS number of channels approach may well be overstating the quality adjustment. Given this conclusion, it is instructive to note the long-term trends of cable pricing. I have pointed out that the FCC was already being challenged to explain dramatic rate increases in the January 1997 report on cable pricing. In that report, the Commission reproduced a graph it had used to show that rate regulation in the 1993-1995 period had shielded consumers from price increases (see Exhibit 10). The trend line and the price line, extended through September 2003, show that the Commission had squeezed out a small part of the excess profits during the short period of rate regulation, but the 1996 Act launched the industry on a trajectory that not only recaptured what had been lost during the short period of partial regulation, but has gone beyond what it had been extracting in the past. This reaffirms the depiction in Exhibit 1.

26
0
2.5
5
7.5
10
12.5
15
17.5
20
22.5
25
0 20 40 60 80 100Quantity (% of Subs)
Pric
e (W
illin
g to
Pay
)
EXHIBIT 9: Wealth Transfer and Consumer Surplus For ESPN
Source: Deutsche Bank, Walt Disney Company, October 27, 2003, p. 16.
Unbundled Demand
Wealth Transfer for Non-viewers
Consumer Surplus
Dead Weight Loss
Implicit Bundled Demand
Wealth Transfers due to Overpricing to Viewers

27
0
50
100
150
200
250
300
350
1984
1985
1986
1987
1988
1989
1990
1991
1992
1993
1994
1995
1996
1997
1998
1999
2000
2001
2002
2003
BLS CABLE BLS ALLDEREGULATED TREND COMPETITIVE, UNCONCENTRATED
EXHIBIT 10: Long Term Price Trends
Source: Bureau of Labor Statistics, CPI. Deregulated trend is a linear projections of January 1983- April 1993, Competitive, unconcentrated from Exhibit 15.
Price/Cost Gap

28
B. QUANTITY The aggressive bundling of cable programming, across video tiers and now between video and non-video services, complicates the consumer welfare analysis enormously. The claim that regulation hurt consumers is simply wrong. The number of subscribers has grown virtually every year since the inception of the industry (see Exhibit 11).
A model that uses the long-term trend in income growth and price changes to predict cable subscribers explains 96 percent of the variance in cable growth. It suggests that cable subscription performed somewhat better than expected in the early-mid 1990, when rates were regulated momentarily, but somewhat worse than expected since rates were fully deregulated. Adding in competitive satellite (i.e. the number of satellite subscribers who live in areas where cable is available)xci fills the gap somewhat, but at the end of the period, there are fewer households subscribing than projected. This is the deadweight inefficiency we would expect to see as a result of the aggressive price increases and bundling of recent years. It is exactly the opposite of what the cable industry experts claim. V. CONCLUSION The basic comparison that consumer advocates have made to reflect the pain inflicted by cable operators – that cable prices have been rising at almost three times the rate of inflation – is a solid and proper way to state the problem. The complaint that prices are rising too fast is valid – reflected in the increasing cash flow thrown off from traditional video services. There is no doubt that consumers are being harmed by a lack of effective competition for cable. That cable operators have ridden the wave of rising incomes and changing technologies does not demonstrate the positive quality of their pricing/bundling strategy. The claim that deregulation helps consumers because consumer welfare has increased begs the question of whether abuse of consumers has increased even more rapidly. The possibility of anti-consumer bundling has long been recognized in the economics literature. The data suggests that cable operators have pushed prices into the range where there is price resistance (i.e., the more elastic portion of the demand curve). That does not mean the abuse has stopped, it simply means it may not grow as quickly as in the past, but cable operators are aggressively finding ways to keep their producer surplus growing, like rebundling (retiering) programming to drive penetration of digital tiers.xcii The recognition of the possibility of anticompetitive bundling in a dynamic or strategic sense is more recent, but no less important, especially as cable market power is “swung” into the high-speed Internet.xciii Bundling is one of the strategies that monopolists use to extract consumer surplus and the evidence is consistent with such an interpretation in this case. Public policy might attack bundling, but policy that controlled the rents directly would be preferable. Of course, real competition would be better still, but after two decades of failure of competition to develop and with the cable operators extending the anticompetitive, anti-consumer business model to the Internet, the need for action is critical.

29
EXHIBIT 11: Income Growth as a Predictor of Cable Subscription
0
20
40
60
80
100
120
1975
1976
1977
1978
1979
1980
1981
1982
1983
1984
1985
1986
1987
1988
1989
1990
1991
1992
1993
1994
1995
1996
1997
1998
1999
2000
2001
2002
SUB
SCR
IBER
S (M
illio
ns)
Cable Predicted by Income & Price TOTAL MVPD
Sources: Federal Communications Commission, In the Matter of Annual Assessment of the Status of Competition in Markets for the Delivery of Video Programming, Tenth Annual Report, January 5, 2004, Table 1; Ninth Annual Report, December 2002, Table B-1; Sixth Annual Report, Table C-1; for 1995 through 2002; Paul Kagan Associates, History of Cable TV Subscribers and Revenues, 1997, for pre-1995; Income is real, per capita disposable income from Economic Report of the President (February 2003), p. 313.

30
ENDNOTES
i Federal Communications Commission, In Re: The Annual Assessment of the Status of Competition in the Market for the Delivery of Video Programming, MB Docket No. 03-172.
ii U.S. General Accounting Office (U.S. GAO), Issues Related to Competition and Subscriber Rates in the Cable Television Industry, October 2003; Telecommunications: Issues in Providing Cable and Satellite Television Service, October 15, 2003.
iii Fabrikant, Geraldine and Bill Carter, “Cable’s New Giant Flexes His Muscles,” New York Times, October 20, 2003; “Testimony of James O. Robbins,” Senate Commerce Committee, May 6, 2003.
iv Eisenach, Jeffrey A. and Douglas A. Truehart, Rising Cable Rates: Are Programming Costs the Villain?, supported by ESPN, Inc., October 23, 2003 (hereafter ESPN); Economists Inc., Consumer, Operator, and Programmer Benefits from Bundling Cable Networks, July 2002; Rogerson, William P., Cable Program Tiering: A Decision Best and Properly Made by Cable System Operators, Not Government Regulators, November 10, 2003, funded by Cox (hereafter Cox); Correcting the Errors in the ESPN/CAP Analysis Study on Programming Cost Increases, November 11, 2003, prepared for Cox Communications (Cox II).
v Katz, Michael, An Economic Analysis of the Claims made by Dr. Mark Cooper in “Cable Mergers, Monopoly Power and Price Increases,” Commissioned by Comcast Corporation, July 28, 2003 (hereafter Comcast). The target of the Comcast paper is a short study prepared in January 2003 entitled Cable Mergers, Monopoly Power and Price Increases (Washington, DC: Consumer Federation of America and Consumers Union, January 2003). This critique ignores several much longer documents including Consumer Federation of America, “Comments of the Consumer Federation of America, Consumers Union, Center for Digital Democracy, The Office of Communications of the United Church of Christ, Inc., National Association of Telecommunications Officers and Advisors, Association for Independent Video Filmmakers, National Alliance for Media Arts and Culture, and the Alliance for Community Media,” 2002; and “Reply Comments of the Consumer Federation of America, Consumers Union, Center for Digital Democracy, and Media Access Project,” 2003; Federal Communications Commission, In the Matter of Implementation of Section 11 of the Cable Television Consumer Protection and Competition Act of 1992, Implementation of Cable Act Reform Provisions of the Telecommunications Act of 1996, The Commission’s Cable Horizontal and Vertical Ownership Limits and Attribution Rules, Review of the Commission’s Regulations Governing Attribution of Broadcast and Cable/MDS Interests, Review of the Commission’s Regulations and Policies Affecting Investment in the Broadcast Industry, Reexamination of the Commission’s Cross-Interest Policy, CS Docket No. 98-82, CS Docket No. 96-85, MM Docket No. 92-264, MM Docket No. 94-150, MM Docket No. 92-51, MM Docket No. 87-154; and Cooper, Mark, Cable Mergers and Monopolies: Market Power in Digital Communications Networks (Economic Policy Institute, 2002).
vi Wildman, Steven S., Assessing Quality Adjusted Changes in the Real Price of Basic Cable Service, attached to Comments of the National Cable Telecommunications Association, in Federal Communications Commission, In Re: The Annual Assessment of the Status of Competition in the Market for the Delivery of Video Programming, MB Docket No. 03-172, September 11, 2003 (hereafter NCTA).
vii Federal Communications Commission, Tenth Annual Report (In the Matter of Annual Assessment of the Status of Competition in the Market for the Delivery of Video Programming) Washington, DC, January 28, 2004 (hereafter Tenth Annual Report).
viii “Testimony of Gene Kimmelman,” Senate Commerce Committee, May 6, 2003, cited in ESPN, p. 4. ix Tenth Annual Report, para. 10. x Tenth Annual Report, para 139. xi Tenth Annual Report, para 30. xii Tenth Annual Report, para 31. xiii Tenth Annual Report, note 73. xiv Tenth Annual Report, note 203. xv Tenth Annual Report, Table 4.

31
xvi Tenth Annual Report, footnote 11. xvii Tenth Annual Report, para. 140. xviii Cooper, Mark, Media Ownership Democracy in the Digital Information Age (Stanford: Center for
Internet and Society, 2003), Chapter 6. xix Tenth Annual Report, para. 136. xx Tenth Annual Report, para 130-132. xxi See Tenth Annual Report, Table B-1. xxii Compare Tenth Annual Report, para 41 and 65. xxiii Joint Statement of Commissioners Michael J. Copps and Jonathan S. Adelstein, Concurring” January
28, 2004. xxiv The only evidence that the industry paper gives on market power is provided by Comcast, which points
to one indicator of market power, Tobin’s q (the system sales price in comparison to the reproduction cost). Citing numbers from the Federal Communications Commission, Ninth Annual Report, In the Matter of Annual Assessment of the Status of Competition in the Market for the Delivery of Video Programming, MB Docket No. 92-145, December 31, 2002, p. 16), Comcast points out that (p. 19): the “National Average Dollar Value Per Subscriber declined dramatically, falling from a peak of $5755 in 2000 to $2196 in January through June 2002.” This statement fails to take into account the dramatic difference in the nature of the systems being transacted. The average number of subscribers transacted in the peak year Comcast cited was over 250,000 per system in 45 transactions for a total of over $66 billion. The average number of subscribers in the first half of 2002 was only 32,000 in 12 transactions for a total of less than $1 billion. If we compare small systems transacted in 2000 to the small systems transacted in 2002, we get a very different picture; see Federal Communications Commission, Seventh Annual Report, In the Matter of Annual Assessment of the Status of Competition in the Market for the Delivery of Video Programming, CS Docket No. 00-132, January 8, 2001, Table C-5. For example, there were 39 transactions in 2000 for systems with fewer than 100,000 subscribers. The average system price was approximately $2,666 per subscriber. Thus, the system price has declined by about 18 percent, which is modest compared to the stock market declines (see Couper, Elise A, John P. Hejkal, and Alexander L. Wolman, “Boom and Bust In Telecommunications,” Economic Quarterly, Fall 2003. The analysis also does not account for a decline in the reproduction costs, was also evident.
xxv Comcast, p. 14, states the proposition as follows: “As long as the increase in the monthly fee is less than the amount by which consumers value the new programming, they will be better off at the new ‘higher’ price coupled with the additional programs.”
xxvi Scherer, F. M. and David Ross, Industrial Market Structure and Economic Performance (Boston: Houghton Mifflin, 1990), pp. 21 – 29.
xxvii Comcast, pp. 12-13; Cox, Appendix, uses this model as well. xxviii Industry defenders frequently claim that rising prices cannot be caused by market power, since in
frictionless theory the monopolist would immediately ascertain his profit-maximizing price and charge it (Comcast p. 14, Hazlett, Thomas, Cable TV: Has Deregulation Failed?, Manhattan Institute for Policy Research, November 21, 2003). Reality, of course is more complicated than that. Monopolists price politically, searching for what they can get away with before they evoke a reaction, especially in an industry whose rapacious behavior caused it to be reregulated once.
xxix Cox, Appendix, argues that allowing the monopolist to reallocate rents from programmers will increase its rate of profit as well as consumer welfare under some circumstances.
xxx U.S. GAO, 2003, Appendix IV. xxxi U.S. GAO, 2002. xxxii Tenth Annual Report, para. 83, citing First Annual Report, para. 57. xxxiii Federal Communications Commission, Report on Cable Prices, April 4, 2002, Attachment D-1;
February 14, 2001, Attachment D-1; June 2000, Attachment D-1; May 7, 1999, C-1.

32
xxxiv Tenth annual Report, para. 16. xxxv I assume that 98 percent of cable subscribers lack head-to-head competition (Federal Communications
Commission, In the Matter of the Annual Assessment of the Status of Competition in the Market for Delivery of Video Programming: Ninth Annual Report, MB Docket No. 02-145, December 31, 2002, para. 115) and 90 percent of those take expanded basic service (ESPN, p. 2). Therefore, 62 million cable households are the victims of abuse of market power. Their bills could be reduced by $8 per month as a result of genuine head-to-head competition and deconcentration of the industry.
xxxvi U.S. GAO, 2003, Appendix IV. xxxvii FCC, Report on Cable Prices, April 4, 2002, Attachment D-1; February 14, 2001, Attachment D-1;
June 2000, Attachment D-1; May 7, 1999, C-1. xxxviii FCC, Report on Cable Prices, February 14, 2001, Attachment D-1; June 2000, Attachment D-1. xxxix Tent Annual Report, para 132. Comcast once again has failed to notice the consistent empirical
evidence that finds size and clustering increase prices, contradicting their claim that (pp. 18-19) “there is no reason to think that consolidation of cable ownership at the national level will affect actual competition among cable system operators. Ironically, cable industry experts find that mergers of some monopolists matter (John B. Hayes, Jith Jayaratne, and Michael L. Katz, An Empirical Analysis of the Footprint Effects of Mergers Between Large ILECS, April 1, 1999, p. 1; citing “Declaration of Michael L. Katz and Steven C. Salop,” submitted as an attachment to Petition to Deny of Spring Communications Company L.P, in Ameritech Corp. and SBC Communications, Inc., for Consent to Transfer of Control, CC Dkt. No. 98-141 (filed Oct. 15, 1998) and Petition to Deny of Spring Communications Company L.P, in GTE Corporation and Bell Atlantic Corporation for Consent to Transfer of Control, CC Docket. No. 98-184 (filed Nov. 23, 1998)) and that size and alternative distribution opportunities affect bargaining (see Rogerson, William P. “A Further Economic Analysis of the News Corp. Takeover of DirecTV,” In the Matter of General Motors Corporation, Hughes Electronics Corporation, and the News Corporation Limited Application to Transfer Control of FCC Authorizations and Licenses Held by Hughes Electronics Corporation to the News Corporation Limited, MB Docket NO. 03-124, August 4, 2003).
xl Cooper, 2002, Chapter 7. xli U.S. GAO, 2003, Appendix IV. xlii FCC, Report on Cable Prices, April 4, 2002, Attachment D-1. xliii Cooper, 2002, pp. 21-32. xliv See Cooper, 2002, pp. 44-47. xlv Fabricant and Carter. xlvi Cox, Appendix A shows cable profits rising as programming costs fall. xlvii , “Comments of the Consumer Federation of America, et. al , In the Matter of Implementation of
Section 11 of the Cable Television Consumer Protection and Competition Act of 1992, Implementation of Cable Act Reform Provisions of the Telecommunications Act of 1996, The Commission’s Cable Horizontal and Vertical Ownership Limits and Attribution Rules, Review of the Commission’s Regulations Governing Attribution of Broadcast and Cable/MDS Interests, Review of the Commission’s Regulations and Policies Affecting Investment in the Broadcast Industry, Reexamination of the Commission’s Cross-Interest Policy, CS Docket No. 98-82, CS Docket No. 96-85, MM Docket No. 92-264, MM Docket No. 94-150, MM Docket No. 92-51, MM Docket No. 87-154
xlviii U.S. GAO, 2003, p. 27. xlix ESPN, p. 9. l Cox critics ESPN for comparing current revenues to total capital, a criticism that applies to Comcast even
more forcefully, since ESPN at least reports annualized increases in debt costs, whereas Comcast provides no similar calculation. ESPN/s reporting of debt service misses the point, however, since part of the debt was incurred to fund acquisitions, not capital expenditures.
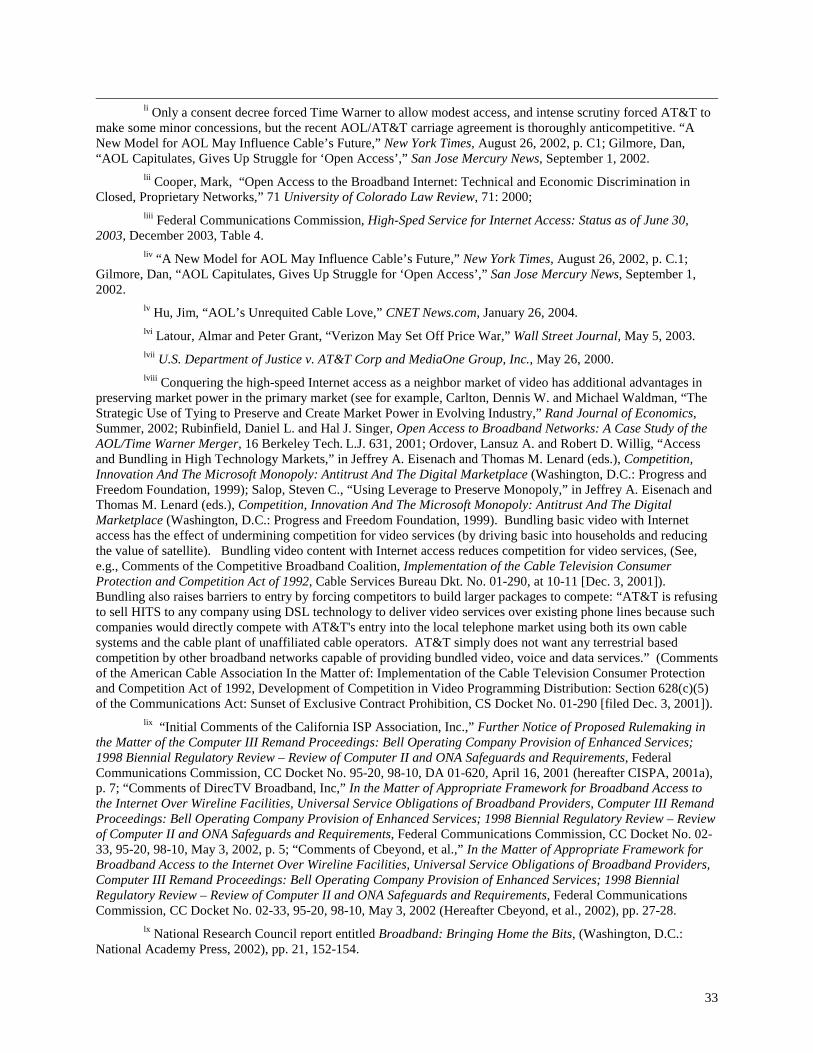
33
li Only a consent decree forced Time Warner to allow modest access, and intense scrutiny forced AT&T to
make some minor concessions, but the recent AOL/AT&T carriage agreement is thoroughly anticompetitive. “A New Model for AOL May Influence Cable’s Future,” New York Times, August 26, 2002, p. C1; Gilmore, Dan, “AOL Capitulates, Gives Up Struggle for ‘Open Access’,” San Jose Mercury News, September 1, 2002.
lii Cooper, Mark, “Open Access to the Broadband Internet: Technical and Economic Discrimination in Closed, Proprietary Networks,” 71 University of Colorado Law Review, 71: 2000;
liii Federal Communications Commission, High-Sped Service for Internet Access: Status as of June 30, 2003, December 2003, Table 4.
liv “A New Model for AOL May Influence Cable’s Future,” New York Times, August 26, 2002, p. C.1; Gilmore, Dan, “AOL Capitulates, Gives Up Struggle for ‘Open Access’,” San Jose Mercury News, September 1, 2002.
lv Hu, Jim, “AOL’s Unrequited Cable Love,” CNET News.com, January 26, 2004. lvi Latour, Almar and Peter Grant, “Verizon May Set Off Price War,” Wall Street Journal, May 5, 2003. lvii U.S. Department of Justice v. AT&T Corp and MediaOne Group, Inc., May 26, 2000. lviii Conquering the high-speed Internet access as a neighbor market of video has additional advantages in
preserving market power in the primary market (see for example, Carlton, Dennis W. and Michael Waldman, “The Strategic Use of Tying to Preserve and Create Market Power in Evolving Industry,” Rand Journal of Economics, Summer, 2002; Rubinfield, Daniel L. and Hal J. Singer, Open Access to Broadband Networks: A Case Study of the AOL/Time Warner Merger, 16 Berkeley Tech. L.J. 631, 2001; Ordover, Lansuz A. and Robert D. Willig, “Access and Bundling in High Technology Markets,” in Jeffrey A. Eisenach and Thomas M. Lenard (eds.), Competition, Innovation And The Microsoft Monopoly: Antitrust And The Digital Marketplace (Washington, D.C.: Progress and Freedom Foundation, 1999); Salop, Steven C., “Using Leverage to Preserve Monopoly,” in Jeffrey A. Eisenach and Thomas M. Lenard (eds.), Competition, Innovation And The Microsoft Monopoly: Antitrust And The Digital Marketplace (Washington, D.C.: Progress and Freedom Foundation, 1999). Bundling basic video with Internet access has the effect of undermining competition for video services (by driving basic into households and reducing the value of satellite). Bundling video content with Internet access reduces competition for video services, (See, e.g., Comments of the Competitive Broadband Coalition, Implementation of the Cable Television Consumer Protection and Competition Act of 1992, Cable Services Bureau Dkt. No. 01-290, at 10-11 [Dec. 3, 2001]). Bundling also raises barriers to entry by forcing competitors to build larger packages to compete: “AT&T is refusing to sell HITS to any company using DSL technology to deliver video services over existing phone lines because such companies would directly compete with AT&T's entry into the local telephone market using both its own cable systems and the cable plant of unaffiliated cable operators. AT&T simply does not want any terrestrial based competition by other broadband networks capable of providing bundled video, voice and data services.” (Comments of the American Cable Association In the Matter of: Implementation of the Cable Television Consumer Protection and Competition Act of 1992, Development of Competition in Video Programming Distribution: Section 628(c)(5) of the Communications Act: Sunset of Exclusive Contract Prohibition, CS Docket No. 01-290 [filed Dec. 3, 2001]).
lix “Initial Comments of the California ISP Association, Inc.,” Further Notice of Proposed Rulemaking in the Matter of the Computer III Remand Proceedings: Bell Operating Company Provision of Enhanced Services; 1998 Biennial Regulatory Review – Review of Computer II and ONA Safeguards and Requirements, Federal Communications Commission, CC Docket No. 95-20, 98-10, DA 01-620, April 16, 2001 (hereafter CISPA, 2001a), p. 7; “Comments of DirecTV Broadband, Inc,” In the Matter of Appropriate Framework for Broadband Access to the Internet Over Wireline Facilities, Universal Service Obligations of Broadband Providers, Computer III Remand Proceedings: Bell Operating Company Provision of Enhanced Services; 1998 Biennial Regulatory Review – Review of Computer II and ONA Safeguards and Requirements, Federal Communications Commission, CC Docket No. 02-33, 95-20, 98-10, May 3, 2002, p. 5; “Comments of Cbeyond, et al.,” In the Matter of Appropriate Framework for Broadband Access to the Internet Over Wireline Facilities, Universal Service Obligations of Broadband Providers, Computer III Remand Proceedings: Bell Operating Company Provision of Enhanced Services; 1998 Biennial Regulatory Review – Review of Computer II and ONA Safeguards and Requirements, Federal Communications Commission, CC Docket No. 02-33, 95-20, 98-10, May 3, 2002 (Hereafter Cbeyond, et al., 2002), pp. 27-28.
lx National Research Council report entitled Broadband: Bringing Home the Bits, (Washington, D.C.: National Academy Press, 2002), pp. 21, 152-154.

34
lxi Federal Communications Commission, High-Speed Services for Internet Access, June 2003, Tables 1, 2;
Local Telephone Competition: Status as of December 31, 2002, June 2003, Tables 1, 13; NCTA, Overview 2003: Mid-Year, p. 1.
lxii Young, Shawn and Peter Grant, “How Phone Firms Lost to Cable in Consumer Broadband Battle,” Wall Street Journal, March 13, 2003. lxiii “Comments of Ad Hoc Telecommunications Users Committee,” In the Matter of Review of Regulatory Requirements for Incumbent LEC Broadband Telecommunications Services, Federal Communications Commission, CC Docket No. 01-337, March 1, 2002, pp. 18-19.
Cable modem service presents serious security and reliability issues that, while present for residential users, are of far greater concern when used to support business applications… In addition, service quality for cable modem service not equivalent to ILEC standards… Additionally cable modem transmission speeds are not consistent, due to the “shared platform” architecture… Finally, cable modem platforms do not offer business customers a sufficient level of security lxiv Cable modem service presents serious security and reliability issues that, while present for residential
users, are of far greater concern when used to support business applications… In addition, service quality for cable modem service is not equivalent to ILEC standards… Additionally cable modem transmission speeds are not consistent, due to the “shared platform” architecture… Finally, cable modem platforms do not offer business customers a sufficient level of security.
lxv Kuhl, Craig, “Writing the Business Case for VDSL,” CED, April 2000. Extensive documentation of the technology difference is provided in Cooper, Mark, Transforming the Information Superhighway into a Private Toll Road (Washington, DC: Consumer Federation of America, October 1999).
lxvi Hazlett, Thomas W. and George Bittlingmayer. The Political Economy of Cable “Open Access.” Joint Center, Working Paper 01-06, May, argue that there is a strategic under allocation of capacity to high-speed Internet.
lxvii Cox, Comcast and ESPN also focus on a short time frame. lxviii Federal Communications Commission, Report on Cable Prices, In the Matter of Implementation of
Section 3 of the Cable Television Consumer Protection Act of 1992, Statistical Report on Average Rates for Basic Service, Cable Programming and Equipment, MM Docket No. 92-226, January 2, 1997, p. 7.
lxix Id., p. 7. lxx U.S. GAO, 2003, p. 26. lxxi Federal Communications Commission, In the Matter of Annual Assessment of the Status of Competition
in Markets for the Delivery of Video Programming, Fifth Annual Report, December 23, 1998, Table B-7; Ninth Annual Report, December 2002, Table 4.
lxxii I report both revenue per subscriber and the total revenue because some costs are not incurred on a per subscriber basis.
lxxiii Cox II, p. 8. lxxiv The GAO cautions that it is difficult to apportion capital costs between the traditional video business
and the new lines of business. The same is true with operating expenses. The expert for Cox, recognizes the problem, but conveniently punts. Cox II, p. 8,
In particular, it seems likely that a relatively large share of increased capital costs and perhaps also operating costs may have been incurred in order to permit firms to offer more advanced products than expanded basic service, such as digital tiers of service (including pay per view and video on demand), broadband internet connections and telephony. In my opinion, any attempt to allocate a portion of those costs increases to basic analog service (in order to determine if prices for expanded basic service have risen by more than would have been sufficient to cover all cost increases of expanded basic service) would require a long list of assumptions which would be open to question and controversy.
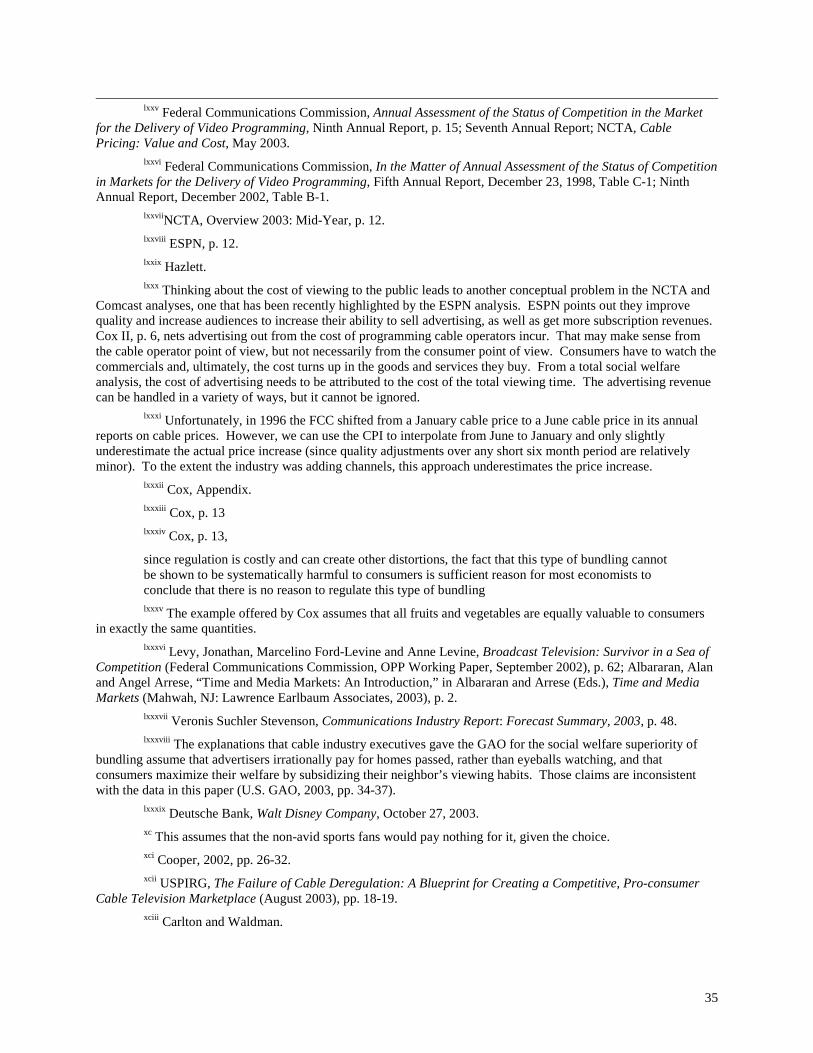
35
lxxv Federal Communications Commission, Annual Assessment of the Status of Competition in the Market
for the Delivery of Video Programming, Ninth Annual Report, p. 15; Seventh Annual Report; NCTA, Cable Pricing: Value and Cost, May 2003.
lxxvi Federal Communications Commission, In the Matter of Annual Assessment of the Status of Competition in Markets for the Delivery of Video Programming, Fifth Annual Report, December 23, 1998, Table C-1; Ninth Annual Report, December 2002, Table B-1.
lxxviiNCTA, Overview 2003: Mid-Year, p. 12. lxxviii ESPN, p. 12. lxxix Hazlett. lxxx Thinking about the cost of viewing to the public leads to another conceptual problem in the NCTA and
Comcast analyses, one that has been recently highlighted by the ESPN analysis. ESPN points out they improve quality and increase audiences to increase their ability to sell advertising, as well as get more subscription revenues. Cox II, p. 6, nets advertising out from the cost of programming cable operators incur. That may make sense from the cable operator point of view, but not necessarily from the consumer point of view. Consumers have to watch the commercials and, ultimately, the cost turns up in the goods and services they buy. From a total social welfare analysis, the cost of advertising needs to be attributed to the cost of the total viewing time. The advertising revenue can be handled in a variety of ways, but it cannot be ignored.
lxxxi Unfortunately, in 1996 the FCC shifted from a January cable price to a June cable price in its annual reports on cable prices. However, we can use the CPI to interpolate from June to January and only slightly underestimate the actual price increase (since quality adjustments over any short six month period are relatively minor). To the extent the industry was adding channels, this approach underestimates the price increase.
lxxxii Cox, Appendix. lxxxiii Cox, p. 13 lxxxiv Cox, p. 13,
since regulation is costly and can create other distortions, the fact that this type of bundling cannot be shown to be systematically harmful to consumers is sufficient reason for most economists to conclude that there is no reason to regulate this type of bundling lxxxv The example offered by Cox assumes that all fruits and vegetables are equally valuable to consumers
in exactly the same quantities. lxxxvi Levy, Jonathan, Marcelino Ford-Levine and Anne Levine, Broadcast Television: Survivor in a Sea of
Competition (Federal Communications Commission, OPP Working Paper, September 2002), p. 62; Albararan, Alan and Angel Arrese, “Time and Media Markets: An Introduction,” in Albararan and Arrese (Eds.), Time and Media Markets (Mahwah, NJ: Lawrence Earlbaum Associates, 2003), p. 2.
lxxxvii Veronis Suchler Stevenson, Communications Industry Report: Forecast Summary, 2003, p. 48. lxxxviii The explanations that cable industry executives gave the GAO for the social welfare superiority of
bundling assume that advertisers irrationally pay for homes passed, rather than eyeballs watching, and that consumers maximize their welfare by subsidizing their neighbor’s viewing habits. Those claims are inconsistent with the data in this paper (U.S. GAO, 2003, pp. 34-37).
lxxxix Deutsche Bank, Walt Disney Company, October 27, 2003. xc This assumes that the non-avid sports fans would pay nothing for it, given the choice. xci Cooper, 2002, pp. 26-32. xcii USPIRG, The Failure of Cable Deregulation: A Blueprint for Creating a Competitive, Pro-consumer
Cable Television Marketplace (August 2003), pp. 18-19. xciii Carlton and Waldman.

Appendix B Top Rated Cable Channels: Then and Now
Compiled by Federal Communications Commission Annual Cable Competition Report
Network 1996 Ranking
(Primetime) 2003 Ranking (Primetime)
A&E 7 8
Cartoon Network 6 6
Discovery 9 10
ESPN 3 14
Lifetime 5 2
Sci-Fi Channel 14 15
TBS 2 5
The Learning Channel 12 12
The Nashville Network (Spike TV) 10 13
TNT 1 1
USA Network 4 7
Channels that moved into Top 15 after 1996 Disney MTV
Fox News Nickelodeon Sources: Federal Communications Commission, MB Docket No. 03-172, Third Annual Assessment of the Status of Competition in the Market for the Delivery of Video Programming at 180. Paul Kagan Associates, Cable TV Programming, Prime-Time Ratings, July 1996, at 10. Kagan World Media, Day Part Ratings Averages, Prime Time (July), Cable Program Investor, Sept.12, 2003, at 16.

Appendix C The Top Cable Channels
By Number of Subscribers and Primetime Ratings Compiled by Federal Communications Commission
For Tenth Annual Cable Competition Report– January 5, 2004
Owners (Independent in Italics) ABC Family Disney–ABC AMC Cablevision A&E Disney–ABC / General Electric–NBC / Hearst Cartoon Network Time Warner – WB CNBC General Electric – NBC CNN Time Warner – WB C–SPAN Cable Consortium Discovery Liberty Media – Fox / Cox Cable Disney Channel Disney – ABC ESPN Disney – ABC ESPN2 Disney – ABC Fox News NewsCorp – Fox Lifetime Disney – ABC / Hearst MTV Viacom – CBS Nickelodeon Viacom – CBS QVC Liberty Media – Fox / Comcast Cable Sci-Fi General Electric – NBC* Spike TV (TNN) Viacom – CBS TBS Time Warner – WB The Weather Channel Landmark Communications TLC Liberty Media – Fox / Cox Cable TNT Time Warner – WB USA Network General Electric – NBC* VH1 Viacom – CBS
* If General Electric/Universal merger is approved as pending Sources: Federal Communications Commission, MB Docket No. 03-172, Tenth Annual Assessment of the Status of Competition in the Market for the Delivery of Video Programming at 141-142. NCTA, Top 20 Cable Networks, Cable Developments 2003, at 39-40. Kagan World Media, Day Part Ratings Averages, Prime Time (July), Cable Program Investor, Sept.12, 2003, at 16.

Appendix D Examples of Independent Cable Channels
Compiled by Federal Communications Commission For Tenth Annual Cable Competition Report– January 5, 2004
Cable Network Owners
ACNTV (America’s Collectibles Network)
America’s Collectibles Network
ANA Television Middle East Broadcasting Centre (MBC) ART (Arab Radio & Television) Arab Media Corporation Bloomberg Television Bloomberg L.P. B Mania B Mania Television Network Canal SUR Canal SUR (Latin American and Mexican TV) China Central Television State Administration of Radio, Television, and
Film – People’s Republic of China Church Channel Trinity Broadcasting Network Classic Arts Showcase The Lloyd E. Rigler -- Lawrence E. Deutsch
Foundation CSTV (College Sports Television)
College Sports Television Deep Dish TV Deep Dish TV Destiny Channel Destiny Channel Do-It-Yourself Channel Scripps Dream TV Network Dreamland Development – Egypt ETWN: Global Catholic Network Eternal World Television Network FamilyNet Southern Baptist Convention Filipino Channel ABS-CBN
Fine Living Scripps Food Network Jones Media Networks Free Speech TV (FSTV) Free Speech TV Galavision Univision GolTV Tenfield --Uruguay Golden Eagle Broadcasting Oral Roberts University Goodlife Television Network Nostalgia Network, Inc. HDNet HDNet HDNet Movies HDNet HGTV (Home and Garden Television) Scripps Horse Racing TV Magna Entertainment Corp. HSN America's Store (Home Shopping Network)
IAC/InterActiveCorp
HTV ITV1 West of Wales Inspirational Life Television (I-LIFETV)
Inspiration Networks Inspirational Network (INSP) Inspiration Networks JCTV Trinity Broadcasting Network La Familia Network Inspiration Networks

Liberty Channel Jerry Falwell Ministries Locomotion Channel Corus Entertainment / Hearst Corporation MBC Network MBC Network MBC America MUNHWA Broadcasting Corporation Mun2 Mun2 NASA Television National Aeronautics and Space Administration National Jewish Television Hineni International Oasis TV Oasis TV TBN Trinity Broadcasting Network UBC Urban Broadcasting Company Univision Univision Video Rola Entretenimiento Satelital Weather Channel Landmark Communications WGN Tribune Company