Test Time Reduction and Predictive Analysis
21
Rockwell Collins Proprietary Information Discovery Summit Amsterdam – March 2016 Test Time Reduction and Predictive Analysis Alain Gautier Pr Subcontracts Program Manager Lean six sigma Black Belt
Transcript of Test Time Reduction and Predictive Analysis

Rockwell Collins Proprietary Information
Discovery Summit Amsterdam – March 2016
Test Time Reduction and Predictive Analysis Alain Gautier Pr Subcontracts Program Manager Lean six sigma Black Belt

© 2016 Rockwell Collins All rights reserved.
Rockwell Collins Proprietary Information 2
Insert pictures into these angled boxes. Height should be 3.44 inches.
Rockwell Collins Today
• Rockwell Collins develops smart and secure communications and advanced aviation electronics solutions for commercial and governmental customers.
• Rockwell Collins is 19,000 employees worldwide (80 locations) • Over 50 years of presence and innovation in EuMEA (Subsidiaries in France,
Germany, the UK and the UAE) with $1B sales & 2000 employees

© 2016 Rockwell Collins All rights reserved.
Rockwell Collins Proprietary Information
Rockwell Collins France
3
Headquarters located in Toulouse-Blagnac since 1978
Headcount: 750 employees (> 250 engineers)
Rockwell Collins France activity:
• Avionics for military transport aircraft & helicopters
• Avionics for commercial solutions
• Communications & Navigation products
• UAV systems

© 2016 Rockwell Collins All rights reserved.
Rockwell Collins Proprietary Information
Context
• Over the last decade, established aeronautic and military product manufacturers saw a rise in competition, putting pressure on production costs.
• While the requirements on quality and reliability cannot be relaxed, testing is a significant share of the production cost.
• In this context, new methods are required to optimise the production test time.
• This study will describe a customised analytical process based on advanced statistical tools available in JMP platforms: – measurement system analysis optimisation using D-optimal design
– gauge Repeatibility & Reproducibility
– principal component analysis
– hierarchical component analysis.
– regression analysis is used to predict tests to be removed
4

© 2016 Rockwell Collins All rights reserved.
Rockwell Collins Proprietary Information
Problem to be solved
Problem Increase the production capacity with the same production
test bench quantity and without any impact on quality and reliability.
On one of our complex equipment, the final production test includes: - 2.500 electrical measurements (test time ~ 4 hours)
- 3.400 additional electrical measurements on 10% of the production (test time ~ 9 hours 40 min)
The cost of a production test bench is higher than 400K$
Solution Apply DMAIC process and analyse data to propose a test
time reduction without any impact on quality and reliability.
Important Notes:
Technical information’s related to the equipment and final application can’t be shared.
All data and graphs are unidentifiable via the anonymize JMP’s menu
5

© 2016 Rockwell Collins All rights reserved.
Rockwell Collins Proprietary Information
Methodology
DEFINE MEASURE ANALYZE IMPROVE CONTROL
Define The
problem Measure
the performance
Implement
and verify
the solution
Find solutions to
Improve the
performance
Monitor the
performance
Challenge N°1:
Optimise Measurement System Analysis and data collection
Challenge N°2:
Analyse table of 106 data
6
DMAIC process
Test Time reduction Flow
Measurement
System Analysis
Statistical regression, correlation and test
removal

© 2016 Rockwell Collins All rights reserved.
Rockwell Collins Proprietary Information
Measurement System Analysis
Definition
Measurement System Analysis (MSA) is a critical first step that should precede any data-based decision making. MSA consist of understanding the variation of the measurement system in term of Repeatability and Reproducibility with a Gage R&R analysis
Gage Repeatability & Reproducibility
The Gage R&R consists to analyse data collected from several reference units tested several times on each measurement systems.
Example: 3 reference units tested 3 times on 3 production test benches with 2 slots each.
7
Problem!
Data collection = 220hours *
9 days full time * Test time ~ 4hrs
Solutions ?
Remove 1 factor from analysis ?
Find a way to
optimise data collection?

© 2016 Rockwell Collins All rights reserved.
Rockwell Collins Proprietary Information
Gage R&R with D-Optimal design
Creation of a D-Optimal design (Design Of Experiment)
The aim of D-Optimal design is to collect less data but keep information's from all factors.
DEMO
Data collection: 220hrs/9d full time
-33%
Representation of a standard Gage R&R design Representation of a D-Optimal Gage R&R design
Data collection: 140hrs/6d full time

© 2016 Rockwell Collins All rights reserved.
Rockwell Collins Proprietary Information
Gage R&R with D-Optimal design
Example of Gage R&R results with D-Optimal design
DEMO
Note: With D-Optimal design, the Gage R&R analysis is focused on main effects

© 2016 Rockwell Collins All rights reserved.
Rockwell Collins Proprietary Information
Gage R&R with D-Optimal design
Benefits
Gage R&R data collection could be optimised by using a D-Optimal Design
Even with long test time, D-Optimal design allows to perform Gage R&R
with all factors
Gage R&R analysis with D-Optimal design is focused on main effects.
D-Optimal and standard designs provide similar results
Data collection and production Test bench availability
have been improved by 33% on our program !
10

© 2016 Rockwell Collins All rights reserved.
Rockwell Collins Proprietary Information
Analysis of a large dataset
After Gage R&R step, the challenge is to identify good correlations between parameters on large dataset
Option 1
Multivarite analysis
(scatterplot matrix)
Option 2
Principal Component Analysis +
Hierarchical clustering analysis +
regression analysis
?
Hard to identify correlations Multi steps analysis helps to identify
good correlations
11

© 2016 Rockwell Collins All rights reserved.
Rockwell Collins Proprietary Information
Principal Component Analysis
Principal Component Analysis (PCA) is a dimension-reduction technique.
The Principal Component Analysis consist of:
- reducing a large dataset into a lower number of independent linear combinations called principal components
- capturing the most of the variability in the original variables
On this example, a PCA is computed on 100 electrical tests.
- 2 dimensions summarise approx. 85% of the dataset information (variance).
- 2 dimensions are plotted on a correlation circle.
12

© 2016 Rockwell Collins All rights reserved.
Rockwell Collins Proprietary Information
Principal Component Analysis
Examples of Principal Component Analysis
DEMO
PCA on test category 1 (100 tests)
85% of the dataset information is summarized by 2 eigenvalues
PCA on test category 2 (65 tests)
98% of the dataset information is summarized by 2 eigenvalues
PCA on test category 3 (650 tests) PCA on test category 4 (105 tests)
80% of the dataset information is summarized by 10 eigenvalues 90% of the dataset information is summarized by 30 eigenvalues

© 2016 Rockwell Collins All rights reserved.
Rockwell Collins Proprietary Information
Hierarchical Clustering Analysis
Hierarchical Clustering Analysis (HCA) is used to
- Find similarity or dissimilarity between each pairs of object in the data set.
- Classify and illustrate clusters arrangement on a Dendrogram
Dendrogram
1 2 3 4 5
Dendrogram
14

© 2016 Rockwell Collins All rights reserved.
Rockwell Collins Proprietary Information
Hierarchical Clustering Analysis
Different types of illustrations of Hierarchical Clustering Analysis
DEMO
5 clusters:
test groups with
“similar” behaviors
(example from
65 electrical
parameters)

© 2016 Rockwell Collins All rights reserved.
Rockwell Collins Proprietary Information
Hierarchical Clustering Analysis
Another use of Hierarchical Clustering Analysis
Cluster #1
(Population A)
Cluster #2
(Population B)
Cluster #3
(Population C)
Cluster #4
(Population D)
Cluster #5
(Population E)
HCA could be used to identify elements
with “similar” behavior.
Benefits in:
reliability analysis
yield improvement
Process flow improvement
16

© 2016 Rockwell Collins All rights reserved.
Rockwell Collins Proprietary Information
Statistical Regression
Statistical Regression is used to explain Y parameter by X parameter and to predict electrical tests that could be removed
The correlation between both tests is very good: r = 0.98 Conclusion: We could predict with a confidence level at 95% test B by measuring only test A
17

© 2016 Rockwell Collins All rights reserved.
Rockwell Collins Proprietary Information
Statistical Regression
Good correlation is not enough for Test Time Reduction !
r = 0.98 r = 0.98
More constraints on test A
Test B could be removed
More constraints on test B
Test B could not be removed
18
© 2016 Rockwell Collins All rights reserved.
Rockwell Collins Proprietary Information
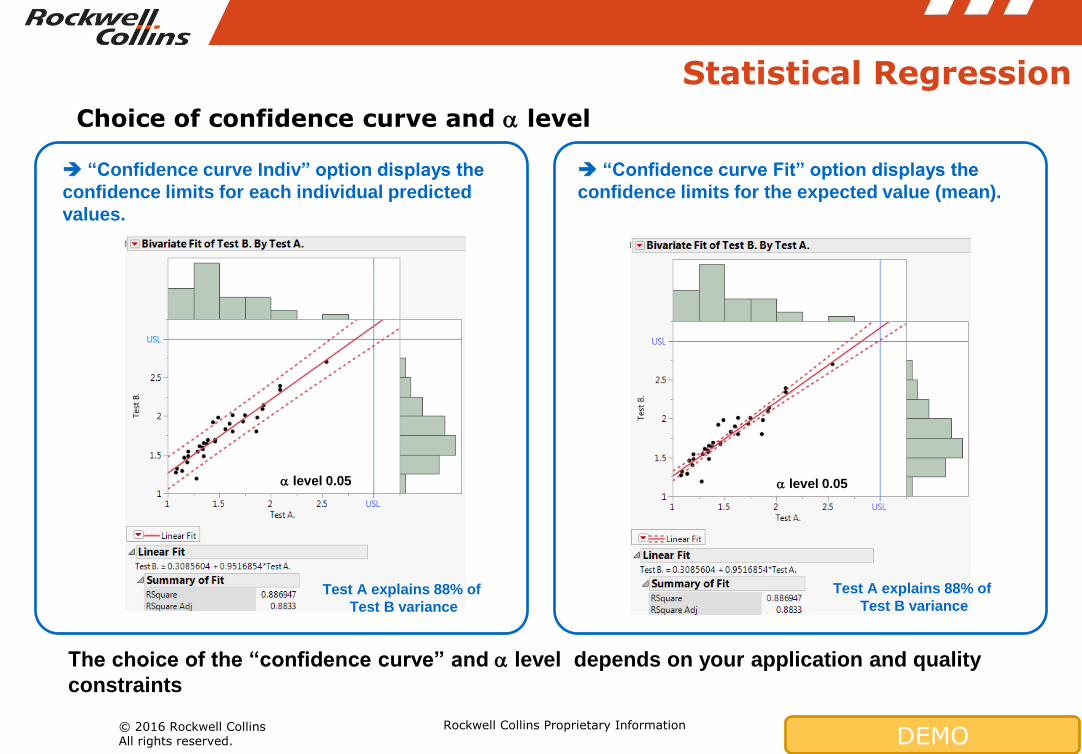
Statistical Regression
Choice of confidence curve and level
19
“Confidence curve Indiv” option displays the
confidence limits for each individual predicted
values.
level 0.05
“Confidence curve Fit” option displays the
confidence limits for the expected value (mean).
level 0.05
DEMO
The choice of the “confidence curve” and level depends on your application and quality
constraints
Test A explains 88% of
Test B variance
Test A explains 88% of
Test B variance

© 2016 Rockwell Collins All rights reserved.
Rockwell Collins Proprietary Information
• Gage R&R data collection’s impact could be reduced by using a D-Optimal Design : Data collection reduced by 33% on our program.
• Principal Components and clustering procedures combined with multivariate techniques are very useful tools for variable reduction.
• Statistical regression combined with confidence interval helps to predicts test behaviors, identify good correlations and reduce production test time with no impact on quality.
20
Take away
Benefits on our program
Test quantity reduced by 40% Test time reduced by 30% No impact on quality New business opportunity due to capacity increase

© 2016 Rockwell Collins All rights reserved.
Rockwell Collins Proprietary Information 21
THANKS for your attention !