Test-Rite International Co., Ltd. and Subsidiaries
64
Test-Rite International Co., Ltd. and Subsidiaries Consolidated Financial Statements for the Years Ended December 31, 2019 and 2018 and Independent Auditors’ Report
Transcript of Test-Rite International Co., Ltd. and Subsidiaries
Test-Rite International Co., Ltd. and Subsidiaries Consolidated Financial Statements for the Years Ended December 31, 2019 and 2018 and Independent Auditors’ Report

- 1 -
INDEPENDENT AUDITORS’ REPORT
The Board of Directors and Shareholders
Test-Rite International Co., Ltd.
Opinion
We have audited the accompanying consolidated financial statements of Test-Rite International Co.,
Ltd. (the “Company”) and its subsidiaries (collectively referred as the “Group”), which comprise
the consolidated balance sheets as of December 31, 2019 and 2018, and the consolidated statements
of comprehensive income, changes in equity and cash flows for the years then ended, and the notes
to the consolidated financial statements, including a summary of significant accounting policies.
In our opinion, the accompanying consolidated financial statements present fairly, in all material
respects, the consolidated financial position of the Group as of December 31, 2019 and 2018, and
its consolidated financial performance and its consolidated cash flows for the years then ended in
accordance with the Regulations Governing the Preparation of Financial Reports by Securities
Issuers, and International Financial Reporting Standards (IFRS), International Accounting
Standards (IAS), IFRIC Interpretations (IFRIC), and SIC Interpretations (SIC) endorsed and issued
into effect by the Financial Supervisory Commission of the Republic of China.
Basis for Opinion
We conducted our audit of the consolidated financial statements for the year ended December 31,
2019 in accordance with the Regulations Governing Auditing and Attestation of Financial
Statements by Certified Public Accountants, Rule No. 1090360805 issued by the Financial
Supervisory Commission of the Republic of China on February 25, 2020 and auditing standards
generally accepted in the Republic of China. We conducted our audit of the consolidated financial
statements for the year ended December 31, 2018 in accordance with the Regulations Governing
Auditing and Attestation of Financial Statements by Certified Public Accountants and auditing
standards generally accepted in the Republic of China. Our responsibilities under those standards
are further described in the Auditors’ Responsibilities for the Audit of the Consolidated Financial
Statements section of our report. We are independent of the Group in accordance with The Norm of
Professional Ethics for Certified Public Accountant of the Republic of China, and we have fulfilled
our other ethical responsibilities in accordance with these requirements. We believe that the audit
evidence we have obtained is sufficient and appropriate to provide a basis for our opinion.
Key Audit Matters
Key audit matters are those matters that, in our professional judgment, were of most significance in
our audit of the consolidated financial statements for the year ended December 31, 2019. These
matters were addressed in the context of our audit of the consolidated financial statements as a
whole, and in forming our opinion thereon, and we do not provide a separate opinion on these
matters.
- 2 -
Key audit matter of the Group’s consolidated financial statements for the year ended December 31,
2019 is as follows:
Existence of Sales Revenue
The Group’s main source of revenues comes from export sales, in which the level of revenue
generated by the export sales to one major customer is significant to the consolidated financial
statements. We therefore considered that the existence of sales revenue from this major customer as
a key audit matter for the year ended December 31, 2019..
Our audit procedures in response to the existence of sales revenue were as follows:
1. We understood the design and implementation of internal controls and tested the operating
effectiveness of controls over sales revenue.
2. We selected samples and tested sales revenue items from this major customer to ensure the
validity of transactions.
3. We obtained the confirmation regarding the ending balance of accounts receivable and
performed tests of subsequent collections from this major customer to verify the occurrence of
transactions.
Other Matter
We have also audited the parent company only financial statements of Test-Rite International Co.,
Ltd. as of and for the years ended December 31, 2019 and 2018 on which we have issued an
unmodified opinion.
Responsibilities of Management and Those Charged with Governance for the Consolidated
Financial Statements
Management is responsible for the preparation and fair presentation of the consolidated financial
statements in accordance with the Regulations Governing the Preparation of Financial Reports by
Securities Issuers, and IFRS, IAS, IFRIC, and SIC endorsed and issued into effect by the Financial
Supervisory Commission of the Republic of China, and for such internal control as management
determines is necessary to enable the preparation of consolidated financial statements that are free
from material misstatement, whether due to fraud or error.
In preparing the consolidated financial statements, management is responsible for assessing the
Group’s ability to continue as a going concern, disclosing, as applicable, matters related to going
concern and using the going concern basis of accounting unless management either intends to
liquidate the Group or to cease operations, or has no realistic alternative but to do so.
Those charged with governance, including the audit committee, are responsible for overseeing the
Group’s financial reporting process.
- 3 -
Auditors’ Responsibilities for the Audit of the Consolidated Financial Statements
Our objectives are to obtain reasonable assurance about whether the consolidated financial
statements as a whole are free from material misstatement, whether due to fraud or error, and to
issue an auditors’ report that includes our opinion. Reasonable assurance is a high level of
assurance, but is not a guarantee that an audit conducted in accordance with the auditing standards
generally accepted in the Republic of China will always detect a material misstatement when it
exists. Misstatements can arise from fraud or error and are considered material if, individually or in
the aggregate, they could reasonably be expected to influence the economic decisions of users
taken on the basis of these consolidated financial statements.
As part of an audit in accordance with the auditing standards generally accepted in the Republic of
China, we exercise professional judgment and maintain professional skepticism throughout the
audit. We also:
1. Identify and assess the risks of material misstatement of the consolidated financial statements,
whether due to fraud or error, design and perform audit procedures responsive to those risks,
and obtain audit evidence that is sufficient and appropriate to provide a basis for our opinion.
The risk of not detecting a material misstatement resulting from fraud is higher than for one
resulting from error, as fraud may involve collusion, forgery, intentional omissions,
misrepresentations, or the override of internal control.
2. Obtain an understanding of internal control relevant to the audit in order to design audit
procedures that are appropriate in the circumstances, but not for the purpose of expressing an
opinion on the effectiveness of the Group’s internal control.
3. Evaluate the appropriateness of accounting policies used and the reasonableness of accounting
estimates and related disclosures made by management.
4. Conclude on the appropriateness of management’s use of the going concern basis of
accounting and, based on the audit evidence obtained, whether a material uncertainty exists
related to events or conditions that may cast significant doubt on the Group’s ability to
continue as a going concern. If we conclude that a material uncertainty exists, we are required
to draw attention in our auditors’ report to the related disclosures in the consolidated financial
statements or, if such disclosures are inadequate, to modify our opinion. Our conclusions are
based on the audit evidence obtained up to the date of our auditors’ report. However, future
events or conditions may cause the Group to cease to continue as a going concern.
5. Evaluate the overall presentation, structure and content of the consolidated financial statements,
including the disclosures, and whether the consolidated financial statements represent the
underlying transactions and events in a manner that achieves fair presentation.
6. Obtain sufficient and appropriate audit evidence regarding the financial information of entities
or business activities within the Group to express an opinion on the consolidated financial
statements. We are responsible for the direction, supervision, and performance of the group
audit. We remain solely responsible for our audit opinion.
We communicate with those charged with governance regarding, among other matters, the planned
scope and timing of the audit and significant audit findings, including any significant deficiencies
in internal control that we identify during our audit.
We also provide those charged with governance with a statement that we have complied with
relevant ethical requirements regarding independence, and to communicate with them all
relationships and other matters that may reasonably be thought to bear on our independence, and
where applicable, related safeguards.

- 4 -
From the matters communicated with those charged with governance, we determine those matters
that were of most significance in the audit of the consolidated financial statements for the year
ended December 31, 2019 and are therefore the key audit matters. We describe these matters in our
auditors’ report unless law or regulation precludes public disclosure about the matter or when, in
extremely rare circumstances, we determine that a matter should not be communicated in our report
because the adverse consequences of doing so would reasonably be expected to outweigh the
public interest benefits of such communication.
The engagement partners on the audit resulting in this independent auditors’ report are Chi-Ming
Hsu and Hung-Bin Yu.
Deloitte & Touche
Taipei, Taiwan
Republic of China
March 25, 2020
Notice to Readers
The accompanying consolidated financial statements are intended only to present the consolidated
financial position, financial performance and cash flows in accordance with accounting principles
and practices generally accepted in the Republic of China and not those of any other jurisdictions.
The standards, procedures and practices to audit such consolidated financial statements are those
generally applied in the Republic of China.
For the convenience of readers, the independent auditors’ report and the accompanying
consolidated financial statements have been translated into English from the original Chinese
version prepared and used in the Republic of China. If there is any conflict between the English
version and the original Chinese version or any difference in the interpretation of the two versions,
the Chinese-language independent auditors’ report and consolidated financial statements shall
prevail.

- 5 -
TEST-RITE INTERNATIONAL CO., LTD. AND SUBSIDIARIES
CONSOLIDATED BALANCE SHEETS
DECEMBER 31, 2019 AND 2018
(In Thousands of New Taiwan Dollars)
2019 2018
ASSETS Amount % Amount %
CURRENT ASSETS
Cash and cash equivalents (Note 6) $ 1,462,426 4 $ 1,995,662 8
Financial assets at fair value through profit or loss - current (Note 7) 620,732 2 303,131 1
Financial assets at amortized cost - current (Notes 4 and 8) 22,937 - 30,810 -
Contract assets - current (Notes 4 and 22) 216,962 1 204,203 1
Notes receivable from unrelated parties (Note 9) 51,707 - 64,925 -
Trade receivables from unrelated parties (Note 9) 4,165,566 12 4,485,420 17
Finance lease receivables 21,544 - - -
Other receivables 101,865 - 127,351 1
Inventories (Note 10) 6,493,270 18 5,779,602 22
Prepayments 367,967 1 317,108 1
Other current financial assets 41,705 - 17,755 -
Other current assets 34,208 - 36,609 -
Total current assets 13,600,889 38 13,362,576 51
NON-CURRENT ASSETS
Financial assets at fair value through other comprehensive income - non-current (Notes 4 and 11) 54,069 - 49,213 -
Financial assets at amortized cost - non-current (Notes 4 and 8) 9,268 - 43,991 -
Property, plant and equipment (Note 13) 6,490,332 18 6,886,512 27
Right-of-use assets (Note 14) 9,606,013 27 - -
Goodwill (Note 15) 2,356,155 7 2,361,198 9
Other intangible assets (Note 16) 220,981 1 229,985 1
Deferred tax assets (Note 4) 1,545,315 4 1,436,403 6
Finance lease receivables - non-current 113,350 - - -
Refundable deposits (Note 6) 1,253,155 4 993,070 4
Other non-current assets (Notes 4 and 20) 426,423 1 635,071 2
Total non-current assets 22,075,061 62 12,635,443 49
TOTAL $ 35,675,950 100 $ 25,998,019 100
LIABILITIES AND EQUITY
CURRENT LIABILITIES
Short-term borrowings (Note 17) $ 1,307,151 4 $ 2,146,783 8
Short-term bills payable (Note 17) 49,978 - 99,966 -
Financial liabilities at fair value through profit or loss - current (Note 7) 321 - 16,017 -
Contract liabilities - current (Notes 4 and 22) 72,066 - 65,816 -
Notes payable to unrelated parties 27,571 - 40,095 -
Trade payables to unrelated parties 6,399,111 18 6,118,110 24
Other payables (Notes 18 and 19) 1,630,551 5 1,621,052 6
Current tax liabilities (Note 4) 77,628 - 122,687 1
Lease liabilities - current (Note 14) 1,721,577 5 - -
Advance receipts 541,394 2 597,015 2
Current portion of long-term borrowings (Note 17) 85,180 - 1,073,571 4
Other current liabilities 124,728 - 151,537 1
Total current liabilities 12,037,256 34 12,052,649 46
NON-CURRENT LIABILITIES
Long-term borrowings (Note 17) 9,424,773 26 6,094,520 23
Deferred tax liabilities (Note 4) 18,218 - 20,907 -
Lease liabilities - non-current (Note 14) 7,348,041 21 - -
Net defined benefit liabilities - non-current (Notes 4 and 20) 154,425 - 130,585 1
Guarantee deposits received 209,262 1 225,527 1
Other non-current liabilities 47,328 - 60,347 -
Total non-current liabilities 17,202,047 48 6,531,886 25
Total liabilities 29,239,303 82 18,584,535 71
EQUITY ATTRIBUTABLE TO OWNERS OF TEST-RITE
Share capital
Ordinary shares (Note 21) 5,098,875 14 5,098,875 20
Capital surplus (Note 21) 353,084 1 647,962 2
Retain earnings (Note 21)
Legal reserve 1,229,705 4 1,189,056 4
Special reserve 241,414 1 180,438 1
Unappropriated earnings 84,233 - 462,938 2
Total retain earnings 1,555,352 5 1,832,432 7
Other equity (Note 21) (396,905) (1) (241,414) (1)
Treasury shares (Note 21) (313,256) (1) - -
Total equity attributable to owners of the Company 6,297,150 18 7,337,855 28
NON-CONTROLLING INTERESTS 139,497 - 75,629 1
Total equity 6,436,647 18 7,413,484 29
TOTAL $ 35,675,950 100 $ 25,998,019 100
The accompanying notes are an integral part of the consolidated financial statements.
- 6 -
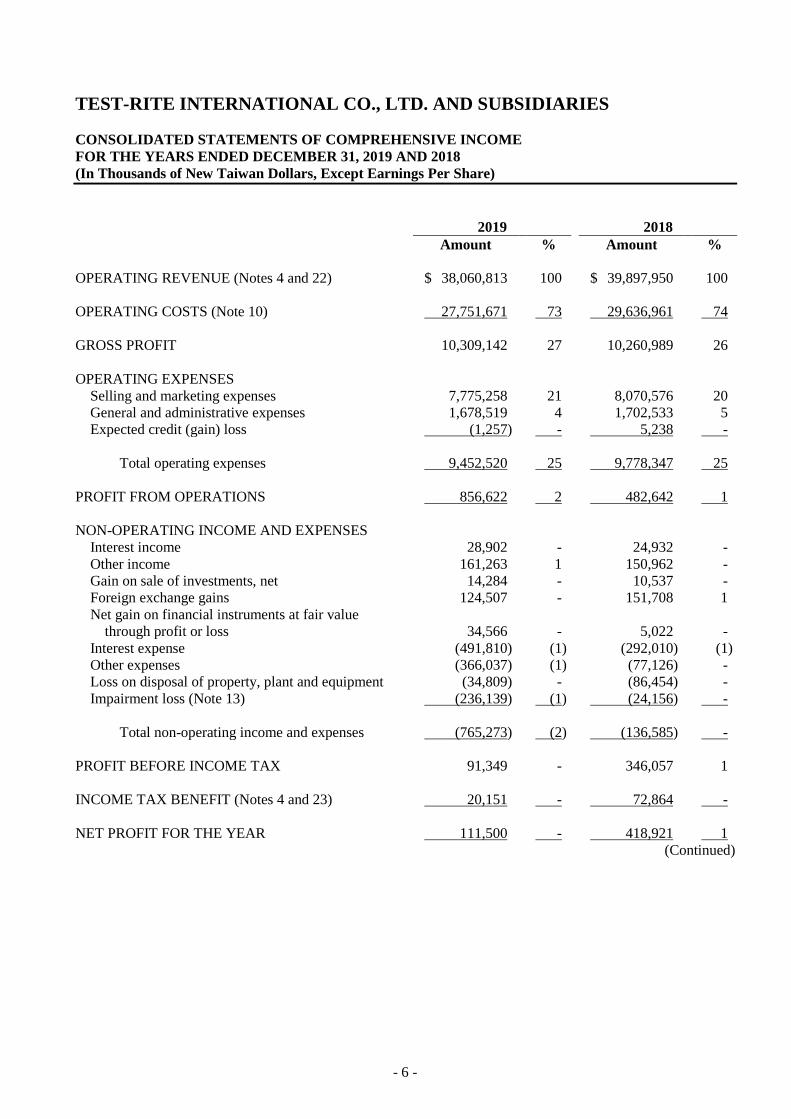
TEST-RITE INTERNATIONAL CO., LTD. AND SUBSIDIARIES
CONSOLIDATED STATEMENTS OF COMPREHENSIVE INCOME
FOR THE YEARS ENDED DECEMBER 31, 2019 AND 2018
(In Thousands of New Taiwan Dollars, Except Earnings Per Share)
2019 2018
Amount % Amount %
OPERATING REVENUE (Notes 4 and 22) $ 38,060,813 100 $ 39,897,950 100
OPERATING COSTS (Note 10) 27,751,671 73 29,636,961 74
GROSS PROFIT 10,309,142 27 10,260,989 26
OPERATING EXPENSES
Selling and marketing expenses 7,775,258 21 8,070,576 20
General and administrative expenses 1,678,519 4 1,702,533 5
Expected credit (gain) loss (1,257) - 5,238 -
Total operating expenses 9,452,520 25 9,778,347 25
PROFIT FROM OPERATIONS 856,622 2 482,642 1
NON-OPERATING INCOME AND EXPENSES
Interest income 28,902 - 24,932 -
Other income 161,263 1 150,962 -
Gain on sale of investments, net 14,284 - 10,537 -
Foreign exchange gains 124,507 - 151,708 1
Net gain on financial instruments at fair value
through profit or loss 34,566 - 5,022 -
Interest expense (491,810) (1) (292,010) (1)
Other expenses (366,037) (1) (77,126) -
Loss on disposal of property, plant and equipment (34,809) - (86,454) -
Impairment loss (Note 13) (236,139) (1) (24,156) -
Total non-operating income and expenses (765,273) (2) (136,585) -
PROFIT BEFORE INCOME TAX 91,349 - 346,057 1
INCOME TAX BENEFIT (Notes 4 and 23) 20,151 - 72,864 -
NET PROFIT FOR THE YEAR 111,500 - 418,921 1
(Continued)

- 7 -
TEST-RITE INTERNATIONAL CO., LTD. AND SUBSIDIARIES
CONSOLIDATED STATEMENTS OF COMPREHENSIVE INCOME
FOR THE YEARS ENDED DECEMBER 31, 2019 AND 2018
(In Thousands of New Taiwan Dollars, Except Earnings Per Share)
2019 2018
Amount % Amount %
OTHER COMPREHENSIVE LOSS
Items that will not be reclassified subsequently to
profit or loss:
Remeasurement of defined benefit plans $ (33,572) - $ (26,221) -
Unrealized loss on investments in equity
instruments at fair value through other
comprehensive income (3,313) - (1,161) -
Items that may be reclassified subsequently to profit
or loss:
Exchange differences on translating the financial
statements of foreign operations (152,262) - (34,193) -
Other comprehensive loss for the year, net of
income tax (189,147) - (61,575) -
TOTAL COMPREHENSIVE(LOSS)INCOME FOR
THE YEAR $ (77,647) - $ 357,346 1
NET PROFIT ATTRIBUTABLE TO:
Owners of the Company $ 100,355 - $ 406,493 1
Non-controlling interests 11,145 - 12,428 -
$ 111,500 - $ 418,921 1
TOTAL COMPREHENSIVE INCOME
ATTRIBUTABLE TO:
Owners of the Company $ (88,775) - $ 344,713 1
Non-controlling interests 11,128 - 12,633 -
$ (77,647) - $ 357,346 1
EARNINGS PER SHARE (Notes 4 and 24)
Basic $ 0.20 $ 0.80
Diluted $ 0.20 $ 0.80
The accompanying notes are an integral part of the consolidated financial statements. (Concluded)
- 8 -
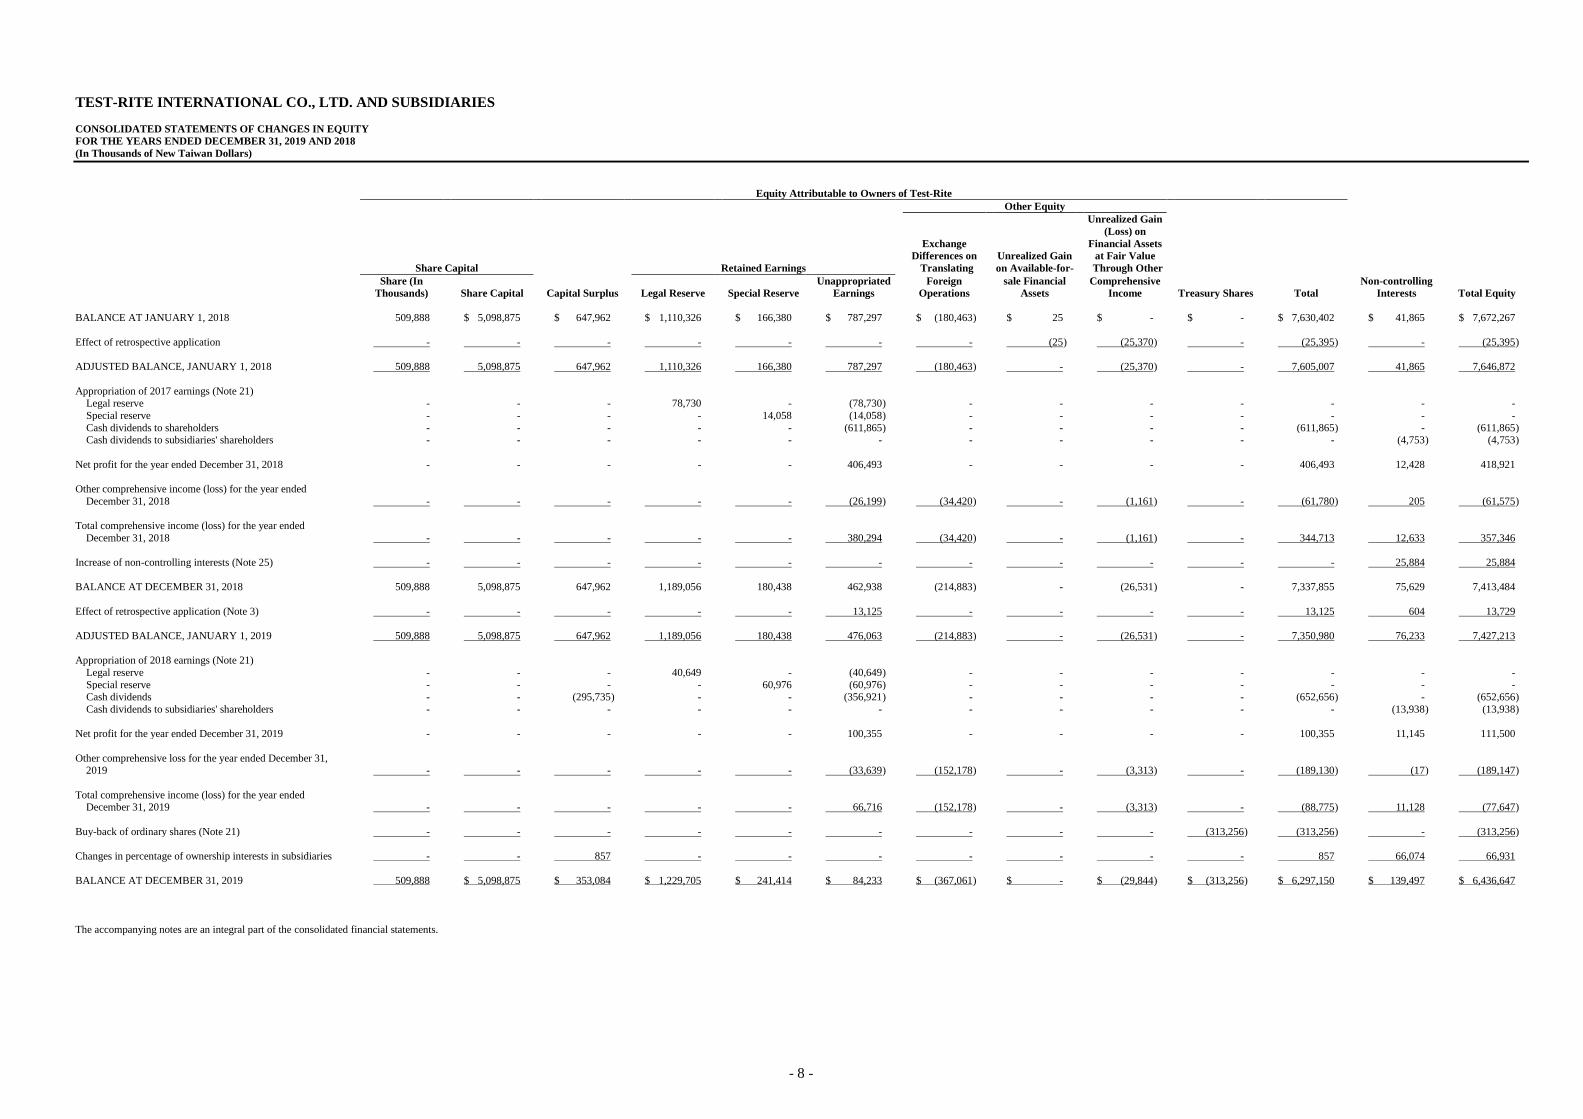
TEST-RITE INTERNATIONAL CO., LTD. AND SUBSIDIARIES
CONSOLIDATED STATEMENTS OF CHANGES IN EQUITY
FOR THE YEARS ENDED DECEMBER 31, 2019 AND 2018
(In Thousands of New Taiwan Dollars)
Equity Attributable to Owners of Test-Rite
Other Equity
Exchange
Differences on Unrealized Gain
Unrealized Gain
(Loss) on
Financial Assets
at Fair Value
Share Capital Retained Earnings Translating on Available-for- Through Other
Share (In Unappropriated Foreign sale Financial Comprehensive Non-controlling
Thousands) Share Capital Capital Surplus Legal Reserve Special Reserve Earnings Operations Assets Income Treasury Shares Total Interests Total Equity
BALANCE AT JANUARY 1, 2018 509,888 $ 5,098,875 $ 647,962 $ 1,110,326 $ 166,380 $ 787,297 $ (180,463 ) $ 25 $ - $ - $ 7,630,402 $ 41,865 $ 7,672,267
Effect of retrospective application - - - - - - - (25 ) (25,370 ) - (25,395 ) - (25,395 )
ADJUSTED BALANCE, JANUARY 1, 2018 509,888 5,098,875 647,962 1,110,326 166,380 787,297 (180,463 ) - (25,370 ) - 7,605,007 41,865 7,646,872
Appropriation of 2017 earnings (Note 21) Legal reserve - - - 78,730 - (78,730 ) - - - - - - -
Special reserve - - - - 14,058 (14,058 ) - - - - - - -
Cash dividends to shareholders - - - - - (611,865 ) - - - - (611,865 ) - (611,865 ) Cash dividends to subsidiaries' shareholders - - - - - - - - - - - (4,753 ) (4,753 )
Net profit for the year ended December 31, 2018 - - - - - 406,493 - - - - 406,493 12,428 418,921
Other comprehensive income (loss) for the year ended
December 31, 2018 - - - - - (26,199 ) (34,420 ) - (1,161 ) - (61,780 ) 205 (61,575 )
Total comprehensive income (loss) for the year ended
December 31, 2018 - - - - - 380,294 (34,420 ) - (1,161 ) - 344,713 12,633 357,346
Increase of non-controlling interests (Note 25) - - - - - - - - - - - 25,884 25,884
BALANCE AT DECEMBER 31, 2018 509,888 5,098,875 647,962 1,189,056 180,438 462,938 (214,883 ) - (26,531 ) - 7,337,855 75,629 7,413,484
Effect of retrospective application (Note 3) - - - - - 13,125 - - - - 13,125 604 13,729
ADJUSTED BALANCE, JANUARY 1, 2019 509,888 5,098,875 647,962 1,189,056 180,438 476,063 (214,883 ) - (26,531 ) - 7,350,980 76,233 7,427,213
Appropriation of 2018 earnings (Note 21)
Legal reserve - - - 40,649 - (40,649 ) - - - - - - -
Special reserve - - - - 60,976 (60,976 ) - - - - - - - Cash dividends - - (295,735 ) - - (356,921 ) - - - - (652,656 ) - (652,656 )
Cash dividends to subsidiaries' shareholders - - - - - - - - - - - (13,938 ) (13,938 )
Net profit for the year ended December 31, 2019 - - - - - 100,355 - - - - 100,355 11,145 111,500
Other comprehensive loss for the year ended December 31, 2019 - - - - - (33,639 ) (152,178 ) - (3,313 ) - (189,130 ) (17 ) (189,147 )
Total comprehensive income (loss) for the year ended December 31, 2019 - - - - - 66,716 (152,178 ) - (3,313 ) - (88,775 ) 11,128 (77,647 )
Buy-back of ordinary shares (Note 21) - - - - - - - - - (313,256 ) (313,256 ) - (313,256 )
Changes in percentage of ownership interests in subsidiaries - - 857 - - - - - - - 857 66,074 66,931
BALANCE AT DECEMBER 31, 2019 509,888 $ 5,098,875 $ 353,084 $ 1,229,705 $ 241,414 $ 84,233 $ (367,061 ) $ - $ (29,844 ) $ (313,256 ) $ 6,297,150 $ 139,497 $ 6,436,647
The accompanying notes are an integral part of the consolidated financial statements.
- 9 -
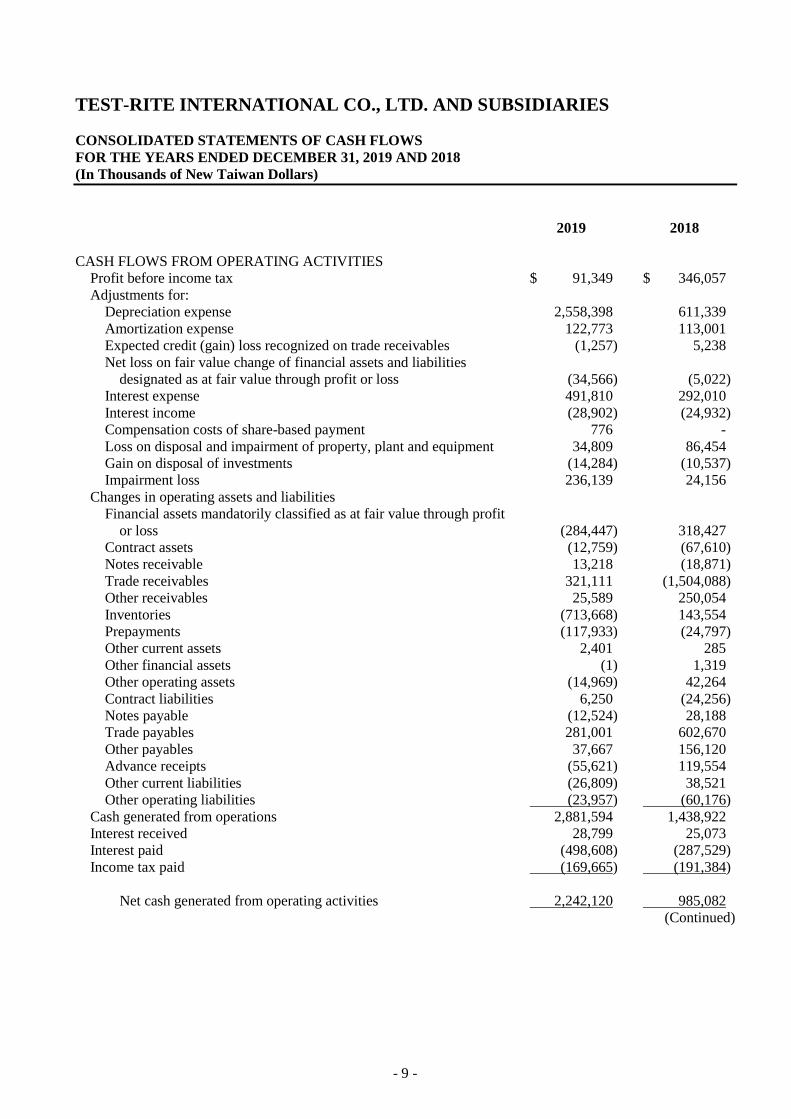
TEST-RITE INTERNATIONAL CO., LTD. AND SUBSIDIARIES
CONSOLIDATED STATEMENTS OF CASH FLOWS
FOR THE YEARS ENDED DECEMBER 31, 2019 AND 2018
(In Thousands of New Taiwan Dollars)
2019 2018
CASH FLOWS FROM OPERATING ACTIVITIES
Profit before income tax $ 91,349 $ 346,057
Adjustments for:
Depreciation expense 2,558,398 611,339
Amortization expense 122,773 113,001
Expected credit (gain) loss recognized on trade receivables (1,257) 5,238
Net loss on fair value change of financial assets and liabilities
designated as at fair value through profit or loss (34,566) (5,022)
Interest expense 491,810 292,010
Interest income (28,902) (24,932)
Compensation costs of share-based payment 776 -
Loss on disposal and impairment of property, plant and equipment 34,809 86,454
Gain on disposal of investments (14,284) (10,537)
Impairment loss 236,139 24,156
Changes in operating assets and liabilities
Financial assets mandatorily classified as at fair value through profit
or loss (284,447) 318,427
Contract assets (12,759) (67,610)
Notes receivable 13,218 (18,871)
Trade receivables 321,111 (1,504,088)
Other receivables 25,589 250,054
Inventories (713,668) 143,554
Prepayments (117,933) (24,797)
Other current assets 2,401 285
Other financial assets (1) 1,319
Other operating assets (14,969) 42,264
Contract liabilities 6,250 (24,256)
Notes payable (12,524) 28,188
Trade payables 281,001 602,670
Other payables 37,667 156,120
Advance receipts (55,621) 119,554
Other current liabilities (26,809) 38,521
Other operating liabilities (23,957) (60,176)
Cash generated from operations 2,881,594 1,438,922
Interest received 28,799 25,073
Interest paid (498,608) (287,529)
Income tax paid (169,665) (191,384)
Net cash generated from operating activities 2,242,120 985,082
(Continued)
- 10 -
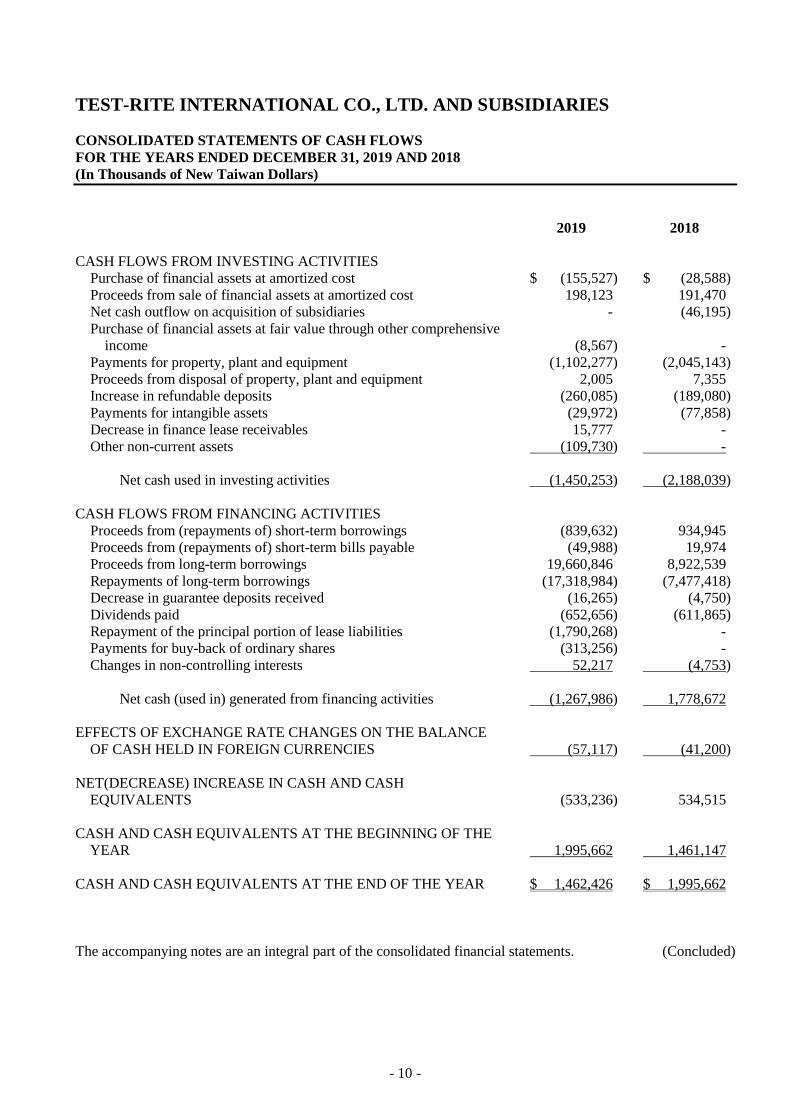
TEST-RITE INTERNATIONAL CO., LTD. AND SUBSIDIARIES
CONSOLIDATED STATEMENTS OF CASH FLOWS
FOR THE YEARS ENDED DECEMBER 31, 2019 AND 2018
(In Thousands of New Taiwan Dollars)
2019 2018
CASH FLOWS FROM INVESTING ACTIVITIES
Purchase of financial assets at amortized cost $ (155,527) $ (28,588)
Proceeds from sale of financial assets at amortized cost 198,123 191,470
Net cash outflow on acquisition of subsidiaries - (46,195)
Purchase of financial assets at fair value through other comprehensive
income (8,567) -
Payments for property, plant and equipment (1,102,277) (2,045,143)
Proceeds from disposal of property, plant and equipment 2,005 7,355
Increase in refundable deposits (260,085) (189,080)
Payments for intangible assets (29,972) (77,858)
Decrease in finance lease receivables 15,777 -
Other non-current assets (109,730) -
Net cash used in investing activities (1,450,253) (2,188,039)
CASH FLOWS FROM FINANCING ACTIVITIES
Proceeds from (repayments of) short-term borrowings (839,632) 934,945
Proceeds from (repayments of) short-term bills payable (49,988) 19,974
Proceeds from long-term borrowings 19,660,846 8,922,539
Repayments of long-term borrowings (17,318,984) (7,477,418)
Decrease in guarantee deposits received (16,265) (4,750)
Dividends paid (652,656) (611,865)
Repayment of the principal portion of lease liabilities (1,790,268) -
Payments for buy-back of ordinary shares (313,256) -
Changes in non-controlling interests 52,217 (4,753)
Net cash (used in) generated from financing activities (1,267,986) 1,778,672
EFFECTS OF EXCHANGE RATE CHANGES ON THE BALANCE
OF CASH HELD IN FOREIGN CURRENCIES (57,117) (41,200)
NET(DECREASE) INCREASE IN CASH AND CASH
EQUIVALENTS (533,236) 534,515
CASH AND CASH EQUIVALENTS AT THE BEGINNING OF THE
YEAR 1,995,662 1,461,147
CASH AND CASH EQUIVALENTS AT THE END OF THE YEAR $ 1,462,426 $ 1,995,662
The accompanying notes are an integral part of the consolidated financial statements. (Concluded)

- 11 -
TEST-RITE INTERNATIONAL CO., LTD. AND SUBSIDIARIES
NOTES TO CONSOLIDATED FINANCIAL STATEMENTS
FOR THE YEARS ENDED DECEMBER 31, 2019 AND 2018
(In Thousands of New Taiwan Dollars, Unless Stated Otherwise)
1. GENERAL INFORMATION
Test-Rite International Co., Ltd. (“Test-Rite” or the “Company”) was established in August 1978.
Test-Rite is engaged mainly in the import and export of hand tools, auto parts, machinery, furniture, and
various home appliances. Test-Rite’s marketplaces are primarily located in the United States of America,
Canada, Great Britain, France, Germany, Australia, etc.
The Taiwan Securities and Futures Commission approved Test-Rite’s application for listing on the Taiwan
Stock Exchange in February 1993.
The consolidated financial statements of Test-Rite and its subsidiaries, hereto forth collectively referred to
as the “Group”, are presented in Test-Rite’s functional currency, the New Taiwan dollar.
2. APPROVAL OF CONSOLIDATED FINANCIAL STATEMENTS
The consolidated financial statements were approved by Test-Rite’s board of directors on March 25, 2020.
3. APPLICATION OF NEW AND REVISED STANDARDS, AMENDMENTS AND
INTERPRETATIONS
a. Initial application of the amendments to the Regulations Governing the Preparation of Financial Reports
by Securities Issuers and the International Financial Reporting Standards (IFRS), International
Accounting Standards (IAS), IFRIC Interpretations (IFRIC), and SIC Interpretations (SIC)
(collectively, the “IFRSs”) endorsed and issued into effect by the Financial Supervisory Commission
(FSC)
Except for the following, the initial application of the amendments to the Regulations Governing the
Preparation of Financial Reports by Securities Issuers and the IFRSs endorsed and issued into effect by
the FSC did not have material impact on the Group’s accounting policies:
IFRS 16 “Leases”
IFRS 16 provides a comprehensive model for the identification of lease arrangements and their
treatment in the financial statements of both lessee and lessor. It supersedes IAS 17 “Leases”,
IFRIC 4 “Determining whether an Arrangement contains a Lease”, and a number of related
interpretations. Refer to Note 4 for information relating to the relevant accounting policies.
Definition of a lease
The Group elects to apply the guidance of IFRS 16 in determining whether contracts are, or contain,
a lease only to contracts entered into (or changed) on or after January 1, 2019. Contracts identified
as containing a lease under IAS 17 and IFRIC 4 are not reassessed and are accounted for in
accordance with the transitional provisions under IFRS 16.

- 12 -
The Group as lessee
The Group recognizes right-of-use assets and lease liabilities for all leases on the consolidated
balance sheets except for those whose payments under low-value asset and short-term leases are
recognized as expenses on a straight-line basis. On the consolidated statements of comprehensive
income, the Group presents the depreciation expense charged on right-of-use assets separately from
the interest expense accrued on lease liabilities; interest is computed using the effective interest
method. On the consolidated statements of cash flows, cash payments for the principal portion of
lease liabilities are classified within financing activities; cash payments for the interest portion are
classified within operating activities. Prior to the application of IFRS 16, payments under operating
lease contracts, were recognized as expenses on a straight-line basis. Cash flows for operating
leases were classified within operating activities on the consolidated statements of cash flows.
Leased assets and finance lease payables were recognized on the consolidated balance sheets for
contracts classified as finance leases.
The Group elected to apply IFRS 16 retrospectively with the cumulative effect of the initial
application of this standard recognized in retained earnings on January 1, 2019. Comparative
information was not restated.
Lease liabilities were recognized on January 1, 2019 for leases previously classified as operating
leases under IAS 17. Lease liabilities were measured at the present value of the remaining lease
payments, discounted using the lessee’s incremental borrowing rate on January 1, 2019.
Right-of-use assets are measured at an amount equal to the lease liabilities, adjusted by the amount
of any prepaid or accrued lease payments, the Group applies IAS 36 to all right-of-use assets.
The Group also applies the following practical expedients:
1) The Group applies a single discount rate to a portfolio of leases with reasonably similar
characteristics to measure lease liabilities.
2) The Group accounts for those leases for which the lease term ends on or before December 31,
2019 as short-term leases.
3) The Group excludes initial direct costs from the measurement of right-of-use assets on January
1, 2019.
4) The Group uses hindsight, such as in determining lease terms, to measure lease liabilities.
The lessee’s weighted average incremental borrowing rate applied to lease liabilities recognized on
January 1, 2019 was 1.69%. The difference between the (i) lease liabilities recognized and (ii)
operating lease commitments disclosed under IAS 17 on December 31, 2018 is explained as
follows:
The future minimum lease payments of non-cancellable operating lease
commitments on December 31, 2018 $ 12,752,156
Less: Recognition exemption for short-term leases (4,607)
Less: Recognition exemption for leases of low-value assets (648)
Undiscounted amounts on January 1, 2019 $ 12,746,901
Discounted amounts using the incremental borrowing rate on January 1, 2019 $ 10,935,552
Lease liabilities recognized on January 1, 2019 $ 10,935,552
- 13 -
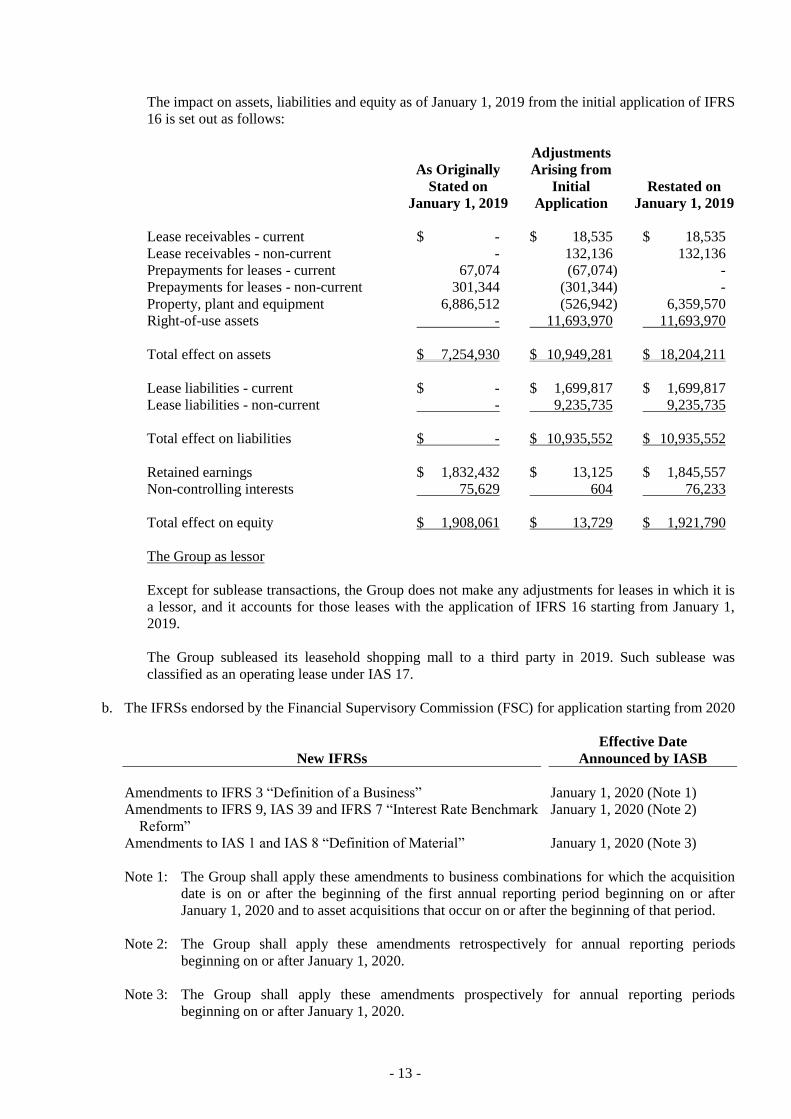
The impact on assets, liabilities and equity as of January 1, 2019 from the initial application of IFRS
16 is set out as follows:
As Originally
Stated on
January 1, 2019
Adjustments
Arising from
Initial
Application
Restated on
January 1, 2019
Lease receivables - current $ - $ 18,535 $ 18,535
Lease receivables - non-current - 132,136 132,136
Prepayments for leases - current 67,074 (67,074) -
Prepayments for leases - non-current 301,344 (301,344) -
Property, plant and equipment 6,886,512 (526,942) 6,359,570
Right-of-use assets - 11,693,970 11,693,970
Total effect on assets $ 7,254,930 $ 10,949,281 $ 18,204,211
Lease liabilities - current $ - $ 1,699,817 $ 1,699,817
Lease liabilities - non-current - 9,235,735 9,235,735
Total effect on liabilities $ - $ 10,935,552 $ 10,935,552
Retained earnings $ 1,832,432 $ 13,125 $ 1,845,557
Non-controlling interests 75,629 604 76,233
Total effect on equity $ 1,908,061 $ 13,729 $ 1,921,790
The Group as lessor
Except for sublease transactions, the Group does not make any adjustments for leases in which it is
a lessor, and it accounts for those leases with the application of IFRS 16 starting from January 1,
2019.
The Group subleased its leasehold shopping mall to a third party in 2019. Such sublease was
classified as an operating lease under IAS 17.
b. The IFRSs endorsed by the Financial Supervisory Commission (FSC) for application starting from 2020
New IFRSs
Effective Date
Announced by IASB
Amendments to IFRS 3 “Definition of a Business” January 1, 2020 (Note 1)
Amendments to IFRS 9, IAS 39 and IFRS 7 “Interest Rate Benchmark
Reform”
January 1, 2020 (Note 2)
Amendments to IAS 1 and IAS 8 “Definition of Material” January 1, 2020 (Note 3)
Note 1: The Group shall apply these amendments to business combinations for which the acquisition
date is on or after the beginning of the first annual reporting period beginning on or after
January 1, 2020 and to asset acquisitions that occur on or after the beginning of that period.
Note 2: The Group shall apply these amendments retrospectively for annual reporting periods
beginning on or after January 1, 2020.
Note 3: The Group shall apply these amendments prospectively for annual reporting periods
beginning on or after January 1, 2020.

- 14 -
As of the date the consolidated financial statements were authorized for issue, the Group is
continuously assessing the possible impact that the application of other standards and interpretations
will have on the Group’s financial position and financial performance and will disclose the relevant
impact when the assessment is completed.
c. New IFRSs in issue but not yet endorsed and issued into effect by the FSC
New IFRSs
Effective Date
Announced by IASB (Note)
Amendments to IFRS 10 and IAS 28 “Sale or Contribution of Assets
between an Investor and its Associate or Joint Venture”
To be determined by IASB
IFRS 17 “Insurance Contracts” January 1, 2021
Amendments to IAS 1 “Classification of Liabilities as Current or
Non-current”
January 1, 2022
Note: Unless stated otherwise, the above New IFRSs are effective for annual reporting periods
beginning on or after their respective effective dates.
As of the date the consolidated financial statements were authorized for issue, the Group is
continuously assessing the possible impact that the application of other standards and interpretations
will have on the Group’s financial position and financial performance and will disclose the relevant
impact when the assessment is completed.
4. SUMMARY OF SIGNIFICANT ACCOUNTING POLICIES
Statement of Compliance
The consolidated financial statements have been prepared in accordance with the Regulations Governing
the Preparation of Financial Reports by Securities Issuers, and IFRSs as endorsed and issued into effect by
the FSC.
Basis of Preparation
The consolidated financial statements have been prepared on the historical cost basis except for financial
instruments which are measured at fair value, and net defined benefit liabilities which are measured at the
present value of the defined benefit obligation less the fair value of plan assets.
The fair value measurements, which are grouped into Levels 1 to 3 based on the degree to which the fair
value measurement inputs are observable and based on the significance of the inputs to the fair value
measurement in its entirety, are described as follows:
a. Level 1 inputs are quoted prices (unadjusted) in active markets for identical assets or liabilities;
b. Level 2 inputs are inputs other than quoted prices included within Level 1 that are observable for an
asset or liability, either directly (i.e. as prices) or indirectly (i.e. derived from prices); and
c. Level 3 inputs are unobservable inputs for the asset or liability.
Classification of Current and Non-current Assets and Liabilities
Current assets include:
a. Assets held primarily for the purpose of trading;
- 15 -
b. Assets expected to be realized within 12 months after the reporting period; and
c. Cash and cash equivalents unless the asset is restricted from being exchanged or used to settle a liability
for at least 12 months after the reporting period.
Current liabilities include:
a. Liabilities held primarily for the purpose of trading;
b. Liabilities due to be settled within 12 months after the reporting period; and
c. Liabilities for which the Group does not have an unconditional right to defer settlement for at least 12
months after the reporting period.
Assets and liabilities that are not classified as current are classified as non-current.
Basis of Consolidation
Principles for preparing consolidated financial statements
The consolidated financial statements incorporate the financial statements of Test-Rite and the entities
controlled by Test-Rite (i.e. its subsidiaries).
Income and expenses of subsidiaries acquired or disposed of during the period are included in the
consolidated statement of profit or loss and other comprehensive income from the effective dates of
acquisition up to the effective dates of disposal, as appropriate.
When necessary, adjustments are made to the financial statements of subsidiaries to bring their accounting
policies into line with those used by the Company.
All intra-group transactions, balances, income and expenses are eliminated in full upon consolidation. Total
comprehensive income of subsidiaries is attributed to the owners of Test-Rite and to the non-controlling
interests even if this results in the non-controlling interests having a deficit balance.
Changes in the Group’s ownership interests in subsidiaries that do not result in the Group losing control
over the subsidiaries are accounted for as equity transactions. The carrying amounts of the interests of the
Group and the non-controlling interests are adjusted to reflect the changes in their relative interests in the
subsidiaries. Any difference between the amount by which the non-controlling interests are adjusted and the
fair value of the consideration paid or received is recognized directly in equity and attributed to the owners
of the Company.
See Note 12 for the detailed information of subsidiaries (including the percentage of ownership and main
business).
Business Combinations
Acquisitions of businesses are accounted for using the acquisition method. Acquisition-related costs are
generally recognized in profit or loss as incurred.
Goodwill is measured as the excess of the sum of the consideration transferred, the amount of any
non-controlling interests in the acquiree, and the fair value of the acquirer’s previously held equity interests
in the acquiree over the net of the acquisition-date amounts of the identifiable assets acquired and the
liabilities assumed. If, after re-assessment, the net of the acquisition date amounts of the identifiable assets
acquired and liabilities assumed exceeds the sum of the consideration transferred, and the fair value of the
acquirer’s previously held interests in the acquiree, the excess is recognized immediately in profit or loss as
a bargain purchase gain.
- 16 -
Foreign Currencies
In preparing the financial statements of each individual group entity, transactions in currencies other than
the entity’s functional currency (i.e. foreign currencies) are recognized at the rates of exchange prevailing at
the dates of the transactions.
At the end of each reporting period, monetary items denominated in foreign currencies are retranslated at
the rates prevailing at that date. Exchange differences on monetary items arising from settlement or
translation are recognized in profit or loss in the period in which they arise.
Non-monetary items measured at fair value that are denominated in foreign currencies are retranslated at
the rates prevailing at the date when the fair value was determined. Exchange differences arising from the
retranslation of non-monetary items are included in profit or loss for the period except for exchange
differences arising from the retranslation of non-monetary items in respect of which gains and losses are
recognized directly in other comprehensive income, and in which case, the exchange differences are also
recognized directly in other comprehensive income.
For the purpose of presenting consolidated financial statements, the functional currencies of the Company
and the Group entities (including subsidiaries in other countries that use currencies which are different from
the currency of the Company) are translated into the presentation currency, the New Taiwan dollar, as
follows: Assets and liabilities are translated at the exchange rates prevailing at the end of the reporting
period; and income and expense items are translated at the average exchange rates for the period. The
resulting currency translation differences are recognized in other comprehensive income (attributed to the
owners of the Company and non-controlling interests as appropriate).
On the disposal of a foreign operation (i.e. a disposal of the Group’s entire interest in a foreign operation, or
a disposal involving the loss of control over a subsidiary that includes a foreign operation), all of the
exchange differences accumulated in equity in respect of that operation attributable to the owners of the
Group are reclassified to profit or loss.
In relation to a partial disposal of a subsidiary that does not result in the Company losing control over the
subsidiary, the proportionate share of accumulated exchange differences is re-attributed to non-controlling
interests of the subsidiary and is not recognized in profit or loss. For all other partial disposals, the
proportionate share of the accumulated exchange differences recognized in other comprehensive income is
reclassified to profit or loss.
Inventories
Inventories are stated at the lower of cost or net realizable value. Inventory write-downs are made by item,
except where it may be appropriate to group similar or related items. The net realizable value is the
estimated selling price of inventories less all estimated costs necessary to make the sale. Inventories are
recorded at the weighted-average cost on the balance sheet date.
Property, Plant and Equipment
Property, plant and equipment are measured at cost less accumulated depreciation and accumulated
impairment loss.
Depreciation of property, plant and equipment is recognized using the straight-line method. Each significant
part is depreciated separately. The estimated useful lives, residual values and depreciation methods are
reviewed at the end of each reporting period, with the effect of any changes in the estimates accounted for
on a prospective basis.
On derecognition of an item of property, plant and equipment, the difference between the sales proceeds
and the carrying amount of the asset is recognized in profit or loss.

- 17 -
Goodwill
Goodwill arising from the acquisition of a business is carried at cost as established at the date of acquisition
of the business less accumulated impairment loss.
For the purposes of impairment testing, goodwill is allocated to each of the Group’s cash-generating units
or groups of cash-generating units (referred to as “cash-generating units”) that is expected to benefit from
the synergies of the combination.
A cash-generating unit to which goodwill has been allocated is tested for impairment annually or more
frequently when there is an indication that the unit may be impaired, by comparing its carrying amount,
including the attributed goodwill, with its recoverable amount. However, if the goodwill allocated to a
cash-generating unit was acquired in a business combination during the current annual period, that unit
shall be tested for impairment before the end of the current annual period. If the recoverable amount of the
cash-generating unit is less than its carrying amount, the impairment loss is allocated first to reduce the
carrying amount of any goodwill allocated to the unit and then pro rata to the other assets of the unit based
on the carrying amount of each asset in the unit. Any impairment loss is recognized directly in profit or
loss. An impairment loss recognized for goodwill is not reversed in subsequent periods.
Intangible Assets
Intangible assets with finite useful lives that are acquired separately are initially measured at cost and
subsequently measured at cost less accumulated amortization and accumulated impairment loss.
Amortization is recognized on a straight-line basis. The estimated useful life, residual value, and
amortization method are reviewed at the end of each reporting period, with the effect of any changes in the
estimates accounted for on a prospective basis.
Intangible assets acquired in a business combination and recognized separately from goodwill are initially
recognized at their fair value at the acquisition date (which is regarded as their cost). Subsequent to initial
recognition, they are measured on the same basis as intangible assets that are acquired separately.
On derecognition of an intangible asset, the difference between the net disposal proceeds and the carrying
amount of the asset is recognized in profit or loss.
Impairment of Tangible and Intangible Assets Other Than Goodwill
At the end of each reporting period, the Group reviews the carrying amounts of its tangible and intangible
assets, excluding goodwill, to determine whether there is any indication that those assets have suffered an
impairment loss. If any such indication exists, the recoverable amount of the asset is estimated in order to
determine the extent of the impairment loss. When it is not possible to estimate the recoverable amount of
an individual asset, the Group estimates the recoverable amount of the cash-generating units to which the
asset belongs. Corporate assets are allocated to the smallest group of cash-generating units on a reasonable
and consistent basis of allocation.
The recoverable amount is the higher of fair value less costs to sell and value in use. If the recoverable
amount of an asset or cash-generating unit is estimated to be less than its carrying amount, the carrying
amount of the asset or cash-generating unit is reduced to its recoverable amount, with the resulting
impairment loss recognized in profit or loss.
When an impairment loss is subsequently reversed, the carrying amount of the asset or cash-generating unit
is increased to the revised estimate of its recoverable amount, but only to the extent of the carrying amount
that would have been determined had no impairment loss been recognized for the asset or cash-generating
unit in prior years. A reversal of an impairment loss is recognized in profit or loss.
- 18 -
Financial Instruments
Financial assets and financial liabilities are recognized when a group entity becomes a party to the
contractual provisions of the instruments.
Financial assets and financial liabilities are initially measured at fair value. Transaction costs that are
directly attributable to the acquisition or issuance of financial assets and financial liabilities (other than
financial assets and financial liabilities at FVTPL) are added to or deducted from the fair value of the
financial assets or financial liabilities, as appropriate, on initial recognition. Transaction costs directly
attributable to the acquisition of financial assets or financial liabilities at FVTPL are recognized
immediately in profit or loss.
a. Financial assets
All regular way purchases or sales of financial assets are recognized and derecognized on a trade date
basis.
1) Measurement categories
Financial assets are classified into the following categories: Financial assets at FVTPL, financial
assets at amortized cost and investments in equity instruments at FVTOCI.
a) Financial assets at FVTPL
Financial assets are classified as at FVTPL when such a financial asset is mandatorily classified
or designated as at FVTPL. Financial assets mandatorily classified as at FVTPL include
investments in equity instruments which are not designated as at FVTOCI.
Financial assets at FVTPL are subsequently measured at fair value, with any gains or losses
arising on remeasurement recognized in profit or loss. The net gain or loss recognized in profit
or loss incorporates any dividends or interest earned on such a financial asset. Fair value is
determined in the manner described in Note 29.
b) Financial assets at amortized cost
Financial assets that meet the following conditions are subsequently measured at amortized
cost:
i. The financial asset is held within a business model whose objective is to hold financial
assets in order to collect contractual cash flows; and
ii. The contractual terms of the financial asset give rise on specified dates to cash flows that are
solely payments of principal and interest on the principal amount outstanding.
Subsequent to initial recognition, financial assets at amortized cost, including cash and cash
equivalents, trade receivables at amortized cost are measured at amortized cost, which equals
the gross carrying amount determined using the effective interest method less any impairment
loss. Exchange differences are recognized in profit or loss.
- 19 -
Interest income is calculated by applying the effective interest rate to the gross carrying amount
of such a financial asset, except for:
i. Purchased or originated credit-impaired financial assets, for which interest income is
calculated by applying the credit adjusted effective interest rate to the amortized cost of such
financial assets; and
ii. Financial assets that are not credit impaired on purchase or origination but have
subsequently become credit impaired, for which interest income is calculated by applying
the effective interest rate to the amortized cost of such financial assets in subsequent
reporting periods.
A financial asset is credit impaired when one or more of the following events have occurred:
i) Significant financial difficulty of the issuer or the borrower;
ii) Breach of contract, such as a default;
iii) It is becoming probable that the borrower will enter bankruptcy or undergo a financial
reorganization; or
iv) The disappearance of an active market for that financial asset because of financial
difficulties.
Cash equivalents include time deposits with original maturities within 3 months from the date of
acquisition, which are highly liquid, readily convertible to a known amount of cash and are
subject to an insignificant risk of changes in value. These cash equivalents are held for the
purpose of meeting short-term cash commitments.
c) Investments in equity instruments at FVTOCI
On initial recognition, the Group may make an irrevocable election to designate investments in
equity instruments as at FVTOCI. Designation as at FVTOCI is not permitted if the equity
investment is held for trading or if it is contingent consideration recognized by an acquirer in a
business combination.
Investments in equity instruments at FVTOCI are subsequently measured at fair value with
gains and losses arising from changes in fair value recognized in other comprehensive income
and accumulated in other equity. The cumulative gain or loss will not be reclassified to profit or
loss on disposal of the equity investments; instead, it will be transferred to retained earnings.
Dividends on these investments in equity instruments are recognized in profit or loss when the
Group’s right to receive the dividends is established, unless the dividends clearly represent a
recovery of part of the cost of the investment.
2) Impairment of financial assets and contract assets
The Group recognizes a loss allowance for expected credit losses on financial assets at amortized
cost (including trade receivables), as well as contract assets.
The Group always recognizes lifetime expected credit losses (ECLs) for trade receivables, lease
receivable and contract assets. For all other financial instruments, the Group recognizes lifetime
ECLs when there has been a significant increase in credit risk since initial recognition. If, on the
other hand, the credit risk on a financial instrument has not increased significantly since initial
recognition, the Group measures the loss allowance for that financial instrument at an amount equal
to 12-month ECLs.

- 20 -
Expected credit losses reflect the weighted average of credit losses with the respective risks of
default occurring as the weights. Lifetime ECLs represent the expected credit losses that will result
from all possible default events over the expected life of a financial instrument. In contrast,
12-month ECLs represent the portion of lifetime ECLs that is expected to result from default events
on a financial instrument that are possible within 12 months after the reporting date.
For internal credit risk management purposes, the Group determines that the following situations
indicate that a financial asset is in default (without taking into account any collateral held by the
Group):
a) Internal or external information show that the debtor is unlikely to pay its creditors.
b) When a financial asset is more than 90 days past due unless the Group has reasonable and
corroborative information to support a more lagged default criterion.
The Group recognizes an impairment gain or loss in profit or loss for all financial instruments with
a corresponding adjustment to their carrying amount through a loss allowance account.
3) Derecognition of financial assets
The Group derecognizes a financial asset only when the contractual rights to the cash flows from
the asset expire, or when it transfers the financial asset and substantially all the risks and rewards of
ownership of the asset to another party.
On derecognition of a financial asset at amortized cost in its entirety, the difference between the
asset’s carrying amount and the sum of the consideration received and receivable is recognized in
profit or loss. On derecognition of an investment in an equity instrument at FVTOCI, the difference
between the asset’s carrying amount and the sum of the consideration received and receivable is
recognized in profit or loss, and the cumulative gain or loss which had been recognized in other
comprehensive income is transferred directly to retained earnings, without recycling through profit
or loss.
b. Financial liabilities
1) Subsequent measurement
Except financial liabilities at FVTPL, all the financial liabilities are measured at amortized cost
using the effective interest method.
Financial liabilities at FVTPL are stated at fair value, with any gains or losses arising on
remeasurement recognized in profit or loss.
2) Derecognition of financial liabilities
The difference between the carrying amount of the financial liability derecognized and the
consideration paid, including any non-cash assets transferred or liabilities assumed, is recognized in
profit or loss.
c. Derivative financial instruments
The Group enters into a variety of derivative financial instruments to manage its exposure to foreign
exchange rate risks, including foreign exchange forward contracts.

- 21 -
Derivatives are initially recognized at fair value at the date on which the derivative contracts are entered
into and are subsequently remeasured to their fair value at the end of each reporting period. The
resulting gain or loss is recognized in profit or loss immediately. When the fair value of a derivative
financial instrument is positive, the derivative is recognized as a financial asset; when the fair value of a
derivative financial instrument is negative, the derivative is recognized as a financial liability.
Provisions
Provisions are measured at the best estimate of the discounted cash flows of the consideration required to
settle the present obligation at the end of the reporting period, taking into account the risks and uncertainties
surrounding the obligation.
Revenue Recognition
The Group identifies contracts with customers, allocates the transaction price to the performance
obligations and recognizes revenue when performance obligations are satisfied.
a. Revenue from the sale of goods
Revenue from the sale of goods comes from sales of furniture and various home appliances. Sales of
furniture and various home appliances are recognized as revenue when the goods are shipped because it
is the time when the customer has full discretion over price to sell the goods, has the primary
responsibility for sales to future customers and bears the risks of obsolescence. Trade receivables are
recognized concurrently.
Under Customer Loyalty Program, the Group offers vouchers which can be used for future purchases
when the customers purchased the products. The voucher provides a material right to the customer. The
transaction price allocated to the voucher is recognized as a contract liability when collected and will be
recognized as revenue when the voucher is redeemed or has expired.
b. Revenue from the rendering of services
Service income is recognized when services are provided.
Revenue from a contract to provide services is recognized with reference to the stage of completion of
the contract.
c. Construction contract revenue
Revenue from the construction in progress is recognized with reference to the stage of completion of
the contract. The Group measures the progress on the basis of costs incurred relative to the total
expected costs as there is a direct relationship between the costs incurred and the progress of satisfying
the performance obligations.
Contract assets are recognized during the construction and are reclassified to trade receivables at the
point at which the customer is invoiced. If the milestone payments exceed the revenue recognized to
date, then the Group recognizes contract liabilities for the difference. Certain payments, which are
retained by the customer as specified in the contract, are intended to ensure that the Group adequately
completes all of its contractual obligations. Such retention receivables are recognized as contract assets
until the Group satisfies its performance obligations.
When the outcome of a construction contract cannot be estimated reliably, contract revenue is
recognized only to the extent of contract costs incurred for which recovery is probable.
- 22 -
Leases
2019
At the inception of a contract, the Group assesses whether the contract is, or contains, a lease.
a. The Group as lessor
Leases are classified as finance leases whenever the terms of a lease transfer substantially all the risks
and rewards of ownership to the lessee. All other leases are classified as operating leases.
When the Group subleases a right-of-use asset, the sublease is classified by reference to the right-of-use
asset arising from the head lease, not with reference to the underlying asset. However, if the head lease
is a short-term lease that the Group, as a lessee, has accounted for applying recognition exemption, the
sublease is classified as an operating lease.
Lease payments from operating leases are recognized as income on a straight-line basis over the terms
of the relevant leases.
b. The Group as lessee
The Group recognizes right-of-use assets and lease liabilities for all leases at the commencement date of
a lease, except for short-term leases and low-value asset leases accounted for applying a recognition
exemption where lease payments are recognized as expenses on a straight-line basis over the lease
terms.
Right-of-use assets are initially measured at cost, which comprises the initial measurement of lease
liabilities adjusted for lease payments made at or before the commencement date, plus any initial direct
costs incurred and an estimate of costs needed to restore the underlying assets, and less any lease
incentives received. Right-of-use assets are subsequently measured at cost less accumulated
depreciation and impairment losses and adjusted for any remeasurement of the lease liabilities.
Right-of-use assets are presented on a separate line in the consolidated balance sheets.
Right-of-use assets are depreciated using the straight-line method from the commencement dates to the
earlier of the end of the useful lives of the right-of-use assets or the end of the lease terms.
Lease liabilities are initially measured at the present value of the lease payments, which comprise fixed
payments. The lease payments are discounted using the interest rate implicit in a lease, if that rate can
be readily determined. If that rate cannot be readily determined, the Group uses the lessee’s incremental
borrowing rate.
Subsequently, lease liabilities are measured at amortized cost using the effective interest method, with
interest expense recognized over the lease terms. When there is a change in a lease term, or a change in
future lease payments resulting from a change in an index or a rate used to determine those payments,
the Group remeasures the lease liabilities with a corresponding adjustment to the right-of-use-assets.
However, if the carrying amount of the right-of-use assets is reduced to zero, any remaining amount of
the remeasurement is recognized in profit or loss. Lease liabilities are presented on a separate line in the
consolidated balance sheets.
2018
Leases are classified as finance leases whenever the terms of a lease transfer substantially all the risks and
rewards of ownership to the lessee. All other leases are classified as operating leases.
- 23 -
a. The Group as lessor
Rental income from operating leases is recognized on a straight-line basis over the term of the relevant
lease.
b. The Group as lessee
Operating lease payments are recognized as an expense on a straight-line basis over the lease term.
Employee Benefits
a. Short-term employee benefits
Liabilities recognized in respect of short-term employee benefits are measured at the undiscounted
amount of the benefits expected to be paid in exchange for the related service.
b. Retirement benefits
Payments to defined contribution retirement benefit plans are recognized as an expense when
employees have rendered service entitling them to the contributions.
Defined benefit costs (including service costs, net interest and remeasurement) under defined benefit
retirement benefit plans are determined using the projected unit credit method. Service costs (including
current service cost) and net interest on the net defined benefit liabilities (assets) are recognized as
employee benefits expenses in the period in which they occur. Remeasurement, comprising actuarial
gains and losses and the return on plan assets (excluding interest), is recognized in other comprehensive
income in the period in which it occurs. Remeasurement recognized in other comprehensive income is
reflected immediately in retained earnings and will not be reclassified to profit or loss.
Net defined benefit liabilities (assets) represent the actual deficit (surplus) in the Group’s defined
benefit plans. Any surplus resulting from this calculation is limited to the present value of any refunds
from the plans or reductions in future contributions to the plans.
Share-based Payment Arrangements
The fair value at the grant date of the employee share options granted to employee that is vesting
immediately is recognized as an expense in full at the grant date, based on the Group’s best estimate of the
number of shares or options that are expected to ultimately vest, with a corresponding increase in capital
surplus - employee share options.
Taxation
Income tax expense represents the sum of the tax currently payable and deferred tax.
a. Current tax
According to the Income Tax Law, an additional tax at 10% of unappropriated earnings is provided for
as income tax in the year the shareholders approve to retain the earnings.
Adjustments of prior years’ tax liabilities are added to or deducted from the current year’s tax provision.

- 24 -
b. Deferred tax
Deferred tax is recognized on temporary differences between the carrying amounts of assets and
liabilities and the corresponding tax bases used in the computation of taxable profit. Deferred tax
liabilities are generally recognized for all taxable temporary differences. Deferred tax assets are
generally recognized for all deductible temporary differences and unused loss carryforward to the extent
that it is probable that taxable profits will be available against which those deductible temporary
differences can be utilized.
The carrying amount of deferred tax assets is reviewed at the end of each reporting period and reduced
to the extent that it is no longer probable that sufficient taxable profits will be available to allow all or
part of the assets to be recovered. A previously unrecognized deferred tax asset is also reviewed at the
end of each reporting period and recognized to the extent that it has become probable that future taxable
profit will allow the deferred tax asset to be recovered.
Deferred tax liabilities and assets are measured at the tax rates that are expected to apply in the period in
which the liabilities are settled or the assets are realized, based on tax rates (and tax laws) that have
been enacted or substantively enacted by the end of the reporting period. The measurement of deferred
tax liabilities and assets reflects the tax consequences that would follow from the manner in which the
Group expects, at the end of the reporting period, to recover or settle the carrying amount of its assets
and liabilities.
5. CRITICAL ACCOUNTING JUDGEMENTS AND KEY SOURCES OF ESTIMATION
UNCERTAINTY
In the application of the Group’s accounting policies, management is required to make judgments,
estimations and assumptions about the carrying amounts of assets and liabilities that are not readily
apparent from other sources. The estimates and associated assumptions are based on historical experience
and other factors that are considered relevant. Actual results may differ from these estimates.
The estimates and underlying assumptions are reviewed on an ongoing basis. Revisions to accounting
estimates are recognized in the period in which the estimates are revised if the revisions affect only that
period, or in the period of the revisions and future periods if the revisions affect both current and future
periods.
6. CASH AND CASH EQUIVALENTS
December 31
2019 2018
Cash on hand $ 57,211 $ 111,466
Checking accounts and demand deposits 1,401,200 1,815,736
Cash equivalents 4,015 68,460
$ 1,462,426 $ 1,995,662
The time deposits with original maturities of more than 3 months were $32,205 thousand and $74,801
thousand as of December 31, 2019 and 2018, respectively, and reclassified to financial assets at amortized
cost (see Note 8).
- 25 -
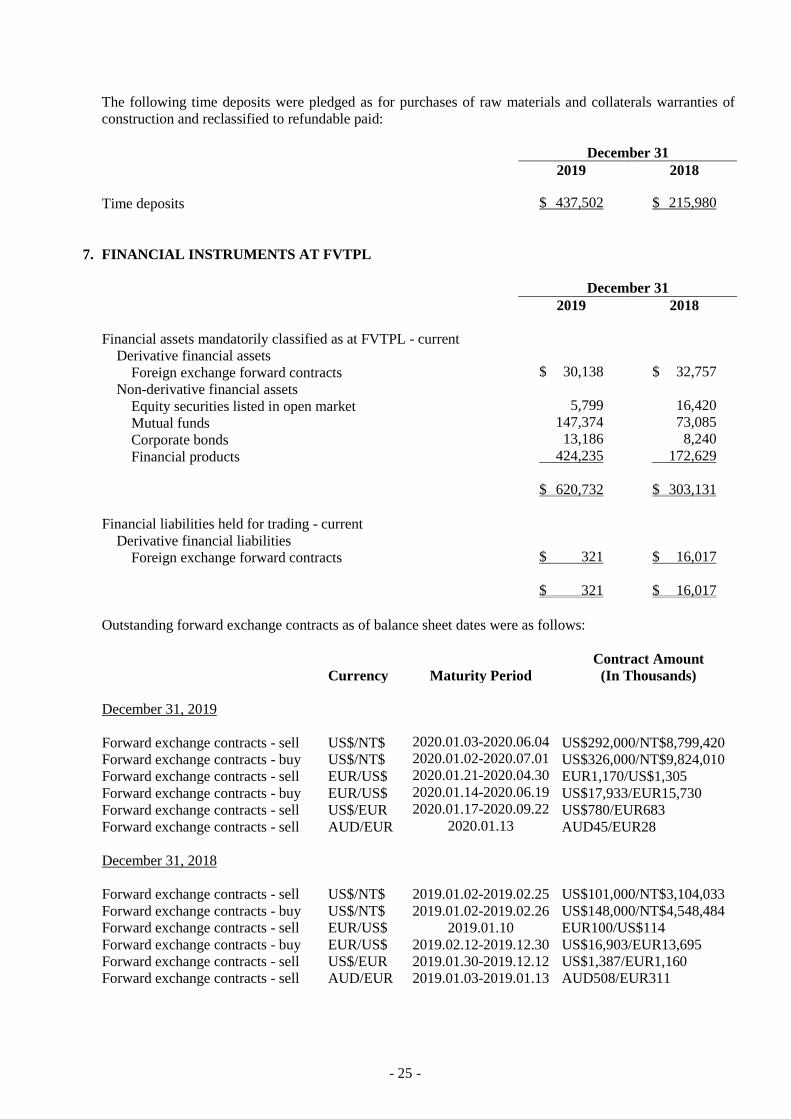
The following time deposits were pledged as for purchases of raw materials and collaterals warranties of
construction and reclassified to refundable paid:
December 31
2019 2018
Time deposits $ 437,502 $ 215,980
7. FINANCIAL INSTRUMENTS AT FVTPL
December 31
2019 2018
Financial assets mandatorily classified as at FVTPL - current
Derivative financial assets
Foreign exchange forward contracts $ 30,138 $ 32,757
Non-derivative financial assets
Equity securities listed in open market 5,799 16,420
Mutual funds 147,374 73,085
Corporate bonds 13,186 8,240
Financial products 424,235 172,629
$ 620,732 $ 303,131
Financial liabilities held for trading - current
Derivative financial liabilities
Foreign exchange forward contracts $ 321 $ 16,017
$ 321 $ 16,017
Outstanding forward exchange contracts as of balance sheet dates were as follows:
Contract Amount
Currency Maturity Period (In Thousands)
December 31, 2019
Forward exchange contracts - sell US$/NT$ 2020.01.03-2020.06.04 US$292,000/NT$8,799,420
Forward exchange contracts - buy US$/NT$ 2020.01.02-2020.07.01 US$326,000/NT$9,824,010
Forward exchange contracts - sell EUR/US$ 2020.01.21-2020.04.30 EUR1,170/US$1,305
Forward exchange contracts - buy EUR/US$ 2020.01.14-2020.06.19 US$17,933/EUR15,730
Forward exchange contracts - sell US$/EUR 2020.01.17-2020.09.22 US$780/EUR683
Forward exchange contracts - sell AUD/EUR 2020.01.13 AUD45/EUR28
December 31, 2018
Forward exchange contracts - sell US$/NT$ 2019.01.02-2019.02.25 US$101,000/NT$3,104,033
Forward exchange contracts - buy US$/NT$ 2019.01.02-2019.02.26 US$148,000/NT$4,548,484
Forward exchange contracts - sell EUR/US$ 2019.01.10 EUR100/US$114
Forward exchange contracts - buy EUR/US$ 2019.02.12-2019.12.30 US$16,903/EUR13,695
Forward exchange contracts - sell US$/EUR 2019.01.30-2019.12.12 US$1,387/EUR1,160
Forward exchange contracts - sell AUD/EUR 2019.01.03-2019.01.13 AUD508/EUR311

- 26 -
The Group entered into derivative contracts to manage exposures to exchange rate fluctuations of
foreign-currency denominated assets and liabilities. However, those contracts did not meet the criteria of
hedge effectiveness and therefore were not accounted for using hedge accounting.
8. FINANCIAL ASSETS AT AMORTIZED COST
December 31
2019 2018
Current
Time deposits with original maturity of more than 3 months
(Note 6) $ 22,937 $ 30,810
Non-current
Time deposits with original maturity of more than 3 months
(Note 6) $ 9,268 $ 43,991
As of December 31, 2019 and 2018, financial assets at amortized cost of $23,944 thousand and $20,660
thousand, respectively, were pledged as collateral for borrowings and for retail channels (see Note 30).
9. NOTES RECEIVABLE, TRADE RECEIVABLES AND OTHER RECEIVABLES
December 31
2019 2018
Notes receivable
At amortized cost
Gross carrying amount $ 51,707 $ 64,925
Less: Allowance for impairment loss - -
51,707 64,925
Trade receivables
At amortized cost
Gross carrying amount 4,032,228 4,157,413
Less: Allowance for impairment loss (5,853) (43,704)
4,026,375 4,113,709
Financial assets at FVTOCI 139,191 371,711
4,165,566 4,485,420
$ 4,217,273 $ 4,550,345
The average credit period of sales of goods was 90 days. No interest was charged on notes receivable or
trade receivables. The Group adopted a policy of only dealing with entities that are rated the equivalent of
investment grade or higher and obtaining sufficient collateral, where appropriate, as a means of mitigating
the risk of financial loss from defaults. Credit rating information is obtained from independent rating
agencies where available or, if not available, the Group uses other publicly available financial information
or its own trading records to rate its major customers. The Group’s exposure and the credit ratings of its
counterparties are continuously monitored and the aggregate value of transactions concluded is spread
amongst approved counterparties. Credit exposure is controlled by counterparty limits that are reviewed and
approved by the risk management committee annually.
- 27 -
In order to minimize credit risk, the management of the Company has delegated a team responsible for
determining credit limits, credit approvals and other monitoring procedures to ensure that follow-up action
is taken to recover overdue debts. In addition, the Group reviews the recoverable amount of each individual
trade debt at the end of the reporting period to ensure that adequate allowance is made for possible
irrecoverable amounts. In this regard, the management believes the Group’s credit risk was significantly
reduced.
The Group measures the loss allowance for notes receivable and trade receivables at an amount equal to
lifetime ECLs. The expected credit losses on notes receivable and trade receivables are estimated by
reference to past default experience of the debtor and an analysis of the debtor’s current financial position.
As the Group’s historical credit loss experience does not show significantly different loss patterns for
different customer segments, the provision for loss allowance based on past due status of notes receivable
and trade receivables.
The Group writes off notes receivable or trade receivables when there is information indicating that the
debtor is in severe financial difficulty and there is no realistic prospect of recovery. For notes receivable or
trade receivables that have been written off, the Group continues to engage in enforcement activity to
attempt to recover the receivables due. Where recoveries are made, these are recognized in profit or loss.
The following table details the loss allowance of notes receivable and trade receivables based on the
Group’s estimation by reference to past default experience of the debtor and an analysis of the debtor’s
current financial position.
December 31, 2019
Not Past Due
Less than 30
Days 31 to 60 Days
61 to 365
Days
Over 365
Days Total
Expected credit loss rate - - - - 95%-100%
Gross carrying amount $ 3,964,527 $ 123,925 $ 44,628 $ 83,553 $ 6,493 $ 4,223,126
Loss allowance (Lifetime
ECLs) - - - - (5,853) (5,853)
Amortized cost $ 3,964,527 $ 123,925 $ 44,628 $ 83,553 $ 640 $ 4,217,273
December 31, 2018
Not Past Due
Less than 30
Days 31 to 60 Days
61 to 365
Days
Over 365
Days Total
Expected credit loss rate - - - - 95%-100% -
Gross carrying amount $ 4,068,507 $ 385,772 $ 35,891 $ 57,680 $ 46,199 $ 4,594,049
Loss allowance (Lifetime
ECLs) - - - - (43,704) (43,704)
Amortized cost $ 4,068,507 $ 385,772 $ 35,891 $ 57,680 $ 2,495 $ 4,550,345
The movements of the loss allowance of trade receivables were as follows:
For the Year Ended December 31
2019 2018
Balance at January 1 $ 43,704 51,191
Add: Net remeasurement of loss allowance - 5,238
Less: Written off (36,497) (13,076)
Less: Net remeasurement of loss allowance (1,257) -
Foreign exchange gains and losses (97) 351
Balance at December 31 $ 5,853 $ 43,704
- 28 -
The trade receivables factoring are summarized as follows:
(Unit: US$ in Dollars; NT$ in Thousands)
Counterparties
Balance at
Beginning of
Year
Factoring
During the
Year
Amounts
Collected
During the
Year
Balance at
End of Year
Balance at End
of Year of
Advances
Received
Interest Rates
on Advances
Received (%)
Retention for
Factoring Credit Line Collateral
2019
Standard
Chartered
$ 1,260
(Note 1)
$ 2,541,087
(Note 2)
$ 2,542,347
(Note 2)
$ - $ - - $ - $ - US$40,200,000 -
KGI Bank $ 1,259
(Note 1)
$ -
$ 1,259
(Note 3)
$ -
$ - - $ - $ - - -
Taishin
International
Bank
$ - $ 155,170
(Note 2)
$ 155,170
(Note 3)
$ - $ - - $ - US$10,000,000 -
(Unit: US$ in Dollars; NT$ in Thousands)
Counterparties
Balance at
Beginning of
Year
Factoring
During the
Year
Amounts
Collected
During the
Year
Balance at
End of Year
Balance at End
of Year of
Advances
Received
Interest Rates
on Advances
Received (%)
Retention for
Factoring Credit Line Collateral
2018
Standard
Chartered
$ - $ 2,116,262
(Note 2)
$ 2,114,977
(Note 3)
$ 1,285
(Note 4)
$ - - $ - US$40,200,000 -
KGI Bank $ 3,988
(Note 1)
$ 11,784
(Note 2)
$ 14,488
(Note 3)
$ 1,284
(Note 4)
$ - - $ - US$ 300,000 -
Test-Rite concluded accounts receivable factoring agreements with Standard Chartered Bank, KGI Bank
and Taishin International Bank. The agreements declared that the banks had no right of further recourse
against Test-Rite. According to the agreement, Test-Rite should only be responsible for loss that resulted
from business disputes. Among them, KGI Bank terminated the agreement in 2019.
Note 1: US$41,809; US$41,785; shown respectively from top to bottom of column.
Note 2: US$84,323,447; US$5,149,171; shown respectively from top to bottom of column.
Note 3: US$84,365,256; US$41,785; US$5,149,171; shown respectively from top to bottom of column.
Note 4: US$129,754.
Note 5: US$68,859,612; US$383,445; shown respectively from top to bottom of column.
Note 6: US$68,817,803; US$471,414; shown respectively from top to bottom of column.
Note 7: US$41,809; US$41,785; shown respectively from top to bottom of column.
The above credit lines may be used on a revolving basis.
10. INVENTORIES
December 31
2019 2018
Merchandise - retail $ 3,685,068 $ 3,856,010
Merchandise - trade 2,359,539 1,804,123
Construction land 316,836 119,469
Buildings and land held for sale 131,827 -
$ 6,493,270 $ 5,779,602
The cost of inventories recognized as operating costs for the years ended December 31, 2019 and 2018 was
$26,654,465 thousand and $27,127,393 thousand, respectively.

- 29 -
The operating costs include reversals of inventory write-downs in the amount $39,483 thousand and a loss
on physical inventory count in the amount of $44,654 thousand for the year ended December 31, 2019. The
operating costs include reversals of inventory write-downs in the amount of $13,547 thousand and a loss on
physical inventory count in the amount of $41,656 thousand for the year ended December 31, 2018.
Previous write-downs have been reversed according to the result of inventory sale.
Merchandise - retail includes the balance of inventories of Test-Rite Retailing Co., Ltd., Test-Rite Retail,
Test-Rite Home Service, Chung Cin Enterprise, Testrite Brand Agency and Test-Rite C&B and U-ME
Enterprise Co., Ltd.
Merchandise - trade includes the balance of inventories of Test-Rite, Test-Rite Pte Ltd., Test-Rite
Development GmbH, Test-Rite International (U.S.) Co., Ltd., Test Cin M&E Engineering, Hand-on
Lighting Co., Ltd. and Test Cin International Co., Ltd.
Construction land and buildings and land held for sale include the balance of inventories of Chung Cin
Enterprise. Construction land pledged as collateral for bank borrowings is set out in Notes 17 and 30 as of
December 31, 2019.
11. FINANCIAL ASSETS AT FVTOCI
December 31
2019 2018
Non-current
Investments in equity instruments at FVTOCI $ 45,427 $ 49,213
Investments in debt instruments at FVTOCI 8,642 -
$ 54,069 $ 49,213
Non-current
Domestic investments - unlisted shares
Grand Cathay Venture Capital II Co., Ltd. $ 42,701 $ 46,518
Taiwan Finance Corporation 2,726 2,695
Foreign investments - unlisted shares
Ningbo Anlian Tejie Supply China Management Co., Ltd. 8,642 -
$ 54,069 $ 49,213
These investments in equity instruments are held for medium to long-term strategic purposes. Accordingly,
the management elected to designate these investments in equity instruments as at FVTOCI as they believe
that recognizing short-term fluctuations in these investments’ fair value in profit or loss would not be
consistent with the Group’s strategy of holding these investments for long-term purposes.
- 30 -
12. SUBSIDIARIES
Subsidiaries included in consolidated financial statements:
% of Ownership
December 31
Investor Subsidiaries Main Businesses 2019 2018 Remark
Test-Rite International Co., Ltd. Fortune Miles Trading Inc. Investment holding company 100.00 100.00
Test-Rite International Co., Ltd. Test-Rite Star Co., Ltd. Investment holding company - 100.00 Note 1
Test-Rite International Co., Ltd. Test-Rite Retailing Co., Ltd. Investment holding company 100.00 100.00
Test-Rite International Co., Ltd. Test-Rite Trading Co., Ltd. Investment holding company 100.00 100.00
Test-Rite International Co., Ltd. Test-Rite Pte. Ltd. Importation and exportation 100.00 100.00
Test-Rite International Co., Ltd. Test-Rite Products (Hong Kong) Limited. Importation and exportation 100.00 100.00
Test-Rite International Co., Ltd. Test-Rite Int’l. (Australia) Pty. Limited. Importation and exportation 100.00 100.00
Test-Rite International Co., Ltd. Test-Rite Int’l. (Canada) Ltd. Importation and exportation 100.00 100.00
Test-Rite International Co., Ltd. Test-Rite (UK) Ltd. Importation and exportation 100.00 100.00
Test-Rite International Co., Ltd. Test-Rite Development GMBH Investment holding company 100.00 100.00
Test-Rite International Co., Ltd. Upmaster International Co., Ltd. Investment holding company 100.00 100.00
Test-Rite International Co., Ltd.
and Upmaster Co., Ltd.
Test-Rite International (U.S.) Co., Ltd. Investment holding company 100.00 100.00
Test-Rite International Co., Ltd. Test-Rite Viet Nam Co., Ltd. Importation and exportation 95.00 95.00 Note 2
Test-Rite International Co., Ltd. Lih Chiou Co., Ltd. Investment holding company 100.00 100.00
Test-Rite International Co., Ltd. Lih Teh International Co., Ltd. Logistics services 100.00 100.00
Test-Rite International Co., Ltd. B&S Link Co., Ltd. Providing information software and
electronic information
100.00 100.00
Test-Rite International Co., Ltd. Fusion International Distribution, Inc. Importation and exportation 100.00 100.00
Test-Rite International Co., Ltd. Chung Cin Enterprise Co., Ltd. Authorized builder to build dwelling,
rental and sale of building
91.67 95.60 Note 3
Test-Rite International Co., Ltd.
and Lih Chiou Co., Ltd.
Test-Rite Retail Co., Ltd. Sale of house decoration hardware and
construction materials
100.00 100.00
Test-Rite International Co., Ltd. International Art Enterprise Co., Ltd. Trading of leisure goods 100.00 100.00
Chung Cin Enterprise Co., Ltd. Tony Construction Co., Ltd. Build and civil engineering 100.00 100.00
Chung Cin Enterprise Co., Ltd. Test Cin M&E Engineering Co., Ltd. Mechanical and electronic engineering 100.00 100.00
Chung Cin Enterprise Co., Ltd. Chung Cin Interior Design Construction Co.,
Ltd.
Interior design 100.00 100.00
Chung Cin Enterprise Co., Ltd. Viet Han Co., Ltd. Importation and exportation 100.00 100.00
Chung Cin Enterprise Co., Ltd. U-ME Enterprise Co., Ltd. Cleaning service and land scape design 60.00 60.00
Chung Cin Enterprise Co., Ltd. Hand-on Lighting Co., Ltd. Sale of electrical appliances 51.00 51.00
Chung Cin Enterprise Co., Ltd. Test Cin International Co., Ltd. Sale of construction material 51.00 51.00
Test-Rite Retail Test-Rite Home Service Co., Ltd. Interior design 100.00 100.00
Test-Rite Retail Hola Homefurnishings Co., Ltd. Sale of furniture, bedclothes, kitchen
equipment and fixtures
100.00 100.00
Test-Rite Retail Testrite Brand Agency Co., Ltd. Sale of furniture, bedclothes, kitchen
equipment and fixtures
100.00 100.00
Test-Rite Retail Test-Rite C&B Co., Ltd. Sale of furniture, bedclothes, kitchen
equipment and fixtures
100.00 100.00
B&S Link Co., Ltd. Home Intelligence Co., Ltd. Other information provision services 100.00 100.00
Note 1: Test Rite Star Co., Ltd. had completed the liquidation in September 2019.
Note 2: Test-Rite Vietnam Co., Ltd. resolved to dissolve in September 2015 and the liquidation date is
September 30, 2015. However, the liquidation procedure has not yet finished as of December 31,
2019.
Note 3: On July 31, 2019, the Company’s ownership percentage of Chung Cin Enterprise Co., Ltd. was
reduced from 95.60% to 91.67% because the Company did not subscribe for all of the additional
new shares issued by Chung Cin Enterprise Co., Ltd.
Note 4: All financial statements of subsidiaries included in the Group’s consolidated financial statements
have been audited for the years ended December 31, 2019 and 2018.

- 31 -
13. PROPERTY, PLANT AND EQUIPMENT
December 31
2019 2018
Land $ 545,512 $ 545,512
Buildings and improvements 3,307,424 3,496,331
Machinery and equipment 23,157 5,250
Transportation equipment 9,193 12,954
Furniture, fixtures and office equipment 70,004 117,459
Leasehold improvements 1,649,249 2,511,210
Molds and tools 17,863 19,296
Other equipment 120,147 145,486
Prepayments for property, plant and equipment 747,783 33,014
$ 6,490,332 $ 6,886,512
Land
Buildings and
Improvements
Machinery and
Equipment
Transportation
Equipment
Furniture,
Fixtures and
Office
Equipment
Leasehold
Improvements
Molds and
Tools
Other
Equipment
Prepayments
for Property,
Plant and
Equipment Total
Cost
Balance at January 1, 2018 $ 545,512 $ 2,541,423 $ 26,751 $ 60,148 $ 834,812 $ 8,592,776 $ 44,129 $ 908,129 $ 38,097 $ 13,591,777
Additions - 1,773,458 - 4,616 34,563 10,960 4,879 14,706 272,895 2,116,077
Disposals - (5,973 ) (37,384 ) (4,907 ) (61,097 ) (623,394 ) (4,276 ) (99,873 ) - (836,904 )
Reclassified - - - 104 2,822 129,912 5,635 11,441 (269,740 ) (119,826 )
Effect of foreign currency
exchange differences - (35,962 ) 38,747 (1,175 ) 3,198 (10,233 ) (2,496 ) (29,489 ) (8,238 ) (45,648 )
Balance at December 31, 2018 $ 545,512 $ 4,272,946 $ 28,114 $ 58,786 $ 814,298 $ 8,100,021 $ 47,871 $ 804,914 $ 33,014 $ 14,705,476
Accumulated depreciation
Balance at January 1, 2018 $ - $ 691,055 $ 24,388 $ 45,238 $ 707,061 $ 5,748,516 $ 24,492 $ 732,668 $ - $ 7,973,418
Depreciation expense - 89,871 1,033 6,762 45,122 403,605 7,520 57,426 - 611,339
Disposals - (5,973 ) (32,009 ) (4,810 ) (53,791 ) (547,291 ) (3,824 ) (95,397 ) - (743,095 )
Reclassified - - 2,648 (378 ) (1,173 ) 2,908 - (14,101 ) - (10,096 )
Effect of foreign currency
exchange differences - 1,662 26,804 (980 ) (379 ) (18,927 ) 387 (21,169 ) - (12,602 )
Balance at December 31, 2018 $ - $ 776,615 $ 22,864 $ 45,832 $ 696,840 $ 5,588,811 $ 28,575 $ 659,427 $ - $ 7,818,964
Carrying amounts at
December 31, 2018 $ 545,512 $ 3,496,331 $ 5,250 $ 12,954 $ 117,458 $ 2,511,210 $ 19,296 $ 145,487 $ 33,014 $ 6,886,512
Cost
Balance at January 1, 2019 $ 545,512 $ 4,272,946 $ 28,114 $ 58,786 $ 814,298 $ 8,100,021 $ 47,871 $ 804,914 $ 33,014 $ 14,705,476
Additions - 233 7,671 2,354 7,649 5,924 5,208 1,956 1,049,912 1,080,907
Disposals - (38,923 ) (27,480 ) (11,941 ) (151,660 ) (885,188 ) (915 ) (90,883 ) - (1,206,990 )
Reclassified - (2,331 ) 63,474 201 14,399 (944,513 ) 1,410 21,874 (316,165 ) (1,161,651 )
Effect of foreign currency
exchange differences -
(62,641 )
(1,958 )
(1,489 )
(2,144 )
(6,813 )
(527 )
(2,627 )
(18,978 )
(97,177 )
Balance at December 31, 2019 $ 545,512 $ 4,169,284 $ 69,821 $ 47,911 $ 682,542 $ 6,269,431 $ 53,047 $ 735,234 $ 747,783 $ 13,320,565
Accumulated depreciation
Balance at January 1, 2019 $ - $ 776,615 $ 22,864 $ 45,832 $ 696,840 $ 5,588,811 $ 28,575 $ 659,427 $ - $ 7,818,964
Depreciation expense - - 125,883 979 5,747 42,623 303,969 8,256 57,418 - 544,875
Disposals - - (38,923 ) (15,443 ) (10,768 ) (138,268 ) (855,746 ) (899 ) (110,129 ) - (1,170,176 )
Reclassified - - 22,294 (1,289 ) 32 (589,266 ) (394 ) (15,498 ) - (584,121 )
Effect of foreign currency
exchange differences -
(1,715 )
(61 )
(1,245 )
(868 )
6,864
(354 )
(679 )
-
1,942
Balance at December 31, 2019 $ - $ 861,860 $ 30,633 $ 38,277 $ 600,359 $ 4,454,632 $ 35,184 $ 590,539 $ - $ 6,611,484
Carrying amounts at
December 31, 2019 $ 545,512
$ 3,307,424
$ 23,157
$ 9,193
$ 70,004
$ 1,649,249
$ 17,863
$ 120,147
$ 747,783
$ 6,490,332
Accumulated impairment
Balance at January 1, 2019 $ - $ - $ - $ - $ - $ - $ - $ - $ - $ -
Impairment losses recognized - - 17,306 476 13,147 178,711 - 26,499 - 236,139
Effect of foreign currency
exchange differences -
-
(1,275 )
(35 )
(968 )
(13,161 )
-
(1,951 )
-
(17,390 )
Balance at December 31, 2019 $ - $ - $ 16,031 $ 441 $ 12,179 $ 165,550 $ - $ 24,548 $ - $ 218,749
Carrying amounts at
December 31, 2019 $ 545,512
$ 3,307,424
$ 23,157
$ 9,193
$ 70,004
$ 1,649,249
$ 17,863
$ 120,147
$ 747,783
$ 6,490,332

- 32 -
The property, plant and equipment of the Group are depreciated on a straight-line basis over the estimated
useful lives of the assets as follows:
Buildings and improvements 35-60 years
Machinery and equipment 2-20 years
Transportation equipment 3-5 years
Furniture, fixtures and office equipment 3-10 years
Leasehold improvements 3-20 years
Molds and tools 2-10 years
Other equipment 3-17 years
In January 2019, Test-Rite International (U.S.) Co., Ltd. signed a purchase agreement with non-related
parties to acquire land for building a warehouse. The amount of the acquisition was US$22,521 thousand.
The purchase price was determined based on a professional appraisal report.
In March 2018, Test-Rite Business Development Co., Ltd. signed a purchase agreement with non-related
parties to acquire buildings and improvements. The amount of the acquisition was $1,797,981 thousand.
The purchase price was determined based on a professional appraisal report.
Hola Shanghai Retail and Trading Ltd., Hola Beijing Retailing and Trading Ltd. and Hola Shanghai Living
Art Retailing Co., Ltd. had closed down a total of 13 retail stores, and the Group recognized an impairment
loss and reorganization expense amounting to RMB82,868 thousand (approximately $378,126 thousand)
which was included in impairment loss and other losses separately.
Information about capitalized interest is as follows:
For the Year
Ended
December 31,
2018
Capitalized interest $ 15,683
Capitalization rate 3.1233%-5.39%
Property, plant and equipment pledged as collateral for bank borrowings is set out in Notes 17 and 30.
14. LEASE ARRANGEMENTS
a. Right-of-use assets - 2019
December 31,
2019
Carrying amounts
Office buildings $ 1,010,833
Stores 8,584,970
Others 10,210
$ 9,606,013

- 33 -
For the Year
Ended
December 31,
2019
Additions to right-of-use assets $ 382,059
Depreciation charge for right-of-use assets
Office buildings $ 286,320
Stores 1,720,845
Others 6,388
$ 2,013,523
b. Lease liabilities - 2019
December 31,
2019
Carrying amounts
Current $ 1,721,577
Non-current $ 7,348,041
Range of discount rate for lease liabilities was as follows:
December 31,
2019
Office buildings 1.30%-5.50%
Stores 1.30%-5.50%
Others 1.30%-4.05%
c. Other lease information
In order to cope with retail demand, the Group entered into a large number of lease arrangements for the
purpose of renting commercial space for the establishment of retail stores. Lease terms are negotiated
by the management of each business segment and include a wide range of payment terms. Variable
payment terms are used for a variety of reasons, including margin control and operational flexibility.
Variable payment terms lead to the incurrence of higher rental costs for stores with higher sales.
However, the use of variable payment terms helps to facilitate the management of margins across the
Group.
Variable rental expenses are expected to continue to represent a similar proportion of retail store sales
in future years.

- 34 -
15. GOODWILL
For the Year Ended December 31
2019 2018
Balance at January 1 $ 2,361,198 $ 2,336,399
Additional amounts recognized from business combinations
occurring during the year (Note 25) - 50,400
Impairment losses recognized - (24,156)
Effect of foreign currency exchange differences (5,043) (1,445)
Balance at December 31 $ 2,356,155 $ 2,361,198
The carrying amount of goodwill was allocated to cash-generating units as follows:
December 31
2019 2018
Retail $ 2,092,938 $ 2,092,938
Trading 193,424 198,467
Others 69,793 69,793
$ 2,356,155 $ 2,361,198
For the years ended December 31, 2019 and 2018, the Group evaluated the recoverable amounts of the
above three cash-generating units, and the recoverable amounts were determined based on the value in use.
The calculation of value in use was based on the cash flow projections in the financial budgets approved by
management covering a 5-year period, and the growth rate used in preparing the budgets was based on the
prediction of related industries.
16. OTHER INTANGIBLE ASSETS
December 31
2019 2018
Computer software $ 166,885 $ 163,068
Others 54,096 66,917
$ 220,981 $ 229,985
Computer
Software Others Total
Cost
Balance at January 1, 2018 $ 656,950 $ 103,356 $ 760,306
Additions 76,408 1,450 77,858
Disposals (187,825) (3,295) (191,120)
Reclassified (60,974) (1,324) (62,298)
Foreign exchange translation differences 296 (1,256) (960)
Balance at December 31, 2018 $ 484,855 $ 98,931 $ 583,786
(Continued)
- 35 -
Computer
Software Others Total
Accumulated amortization and impairment
Balance at January 1, 2018 $ 497,633 $ 27,965 $ 525,598
Amortization expense 94,756 18,245 113,001
Disposals (187,825) (3,295) (191,120)
Reclassified (83,184) (10,479) (93,663)
Foreign exchange translation differences 407 (422) (15)
Balance at December 31, 2018 $ 321,787 $ 32,014 $ 353,801
Carrying amounts at December 31, 2018 $ 163,068 $ 66,917 $ 229,985
Cost
Balance at January 1, 2019 $ 484,855 $ 98,931 $ 583,786
Additions 29,972 - 29,972
Disposals (91) - (91)
Reclassified (9,094) (2,914) (12,008)
Foreign exchange translation differences (521) (3,897) (4,418)
Balance at December 31, 2019 $ 505,121 $ 92,120 $ 597,241
Accumulated amortization and impairment
Balance at January 1, 2019 $ 321,787 $ 32,014 $ 353,801
Amortization expense 109,893 12,880 122,773
Disposals (91) - (91)
Reclassified (93,029) (5,387) (98,416)
Foreign exchange translation differences (324) (1,483) (1,807)
Balance at December 31, 2019 $ 338,236 $ 38,024 $ 376,260
Carrying amounts at December 31, 2019 $ 166,885 $ 54,096 $ 220,981
(Concluded)
Other intangible assets are amortized on a straight-line basis over the estimated useful lives as follows:
Computer software 3-5 years
Customer relationship 7-15 years
Outstanding service contracts 1.5 years
17. BORROWINGS
December 31
2019 2018
Short-term borrowings $ 1,307,151 $ 2,146,783
Short-term bills payable $ 49,978 $ 99,966
Current portion of long-term borrowings $ 85,180 $ 1,073,571
Long-term borrowings $ 9,424,773 $ 6,094,520
- 36 -
a. Short-term borrowings as of December 31, 2019 and 2018 were as follows:
December 31
2019 2018
Unsecured borrowings
Line of credit borrowings $ 1,307,151 $ 2,146,783
The range of weighted average effective interest rate on bank loans was 0.94%-3.25% and
0.92%-4.75% per annum as of December 31, 2019 and 2018, respectively.
b. Short-term bills payable
December 31
2019 2018
Commercial paper $ 50,000 $ 100,000
Less: Unamortized discount on bills payable (22) (34)
$ 49,978 $ 99,966
c. Long-term borrowings
December 31
2019 2018
Interest Rate Amount Amount
First Commercial Bank’s syndicated loan
Unsecured loan from June 17, 2019 to
June 17, 2024. Authorized credit line of
$6,800 million. Principal due on June 17,
2024.
1.7895%-
3.0867%
$ 4,573,375 $ -
Unsecured loan from June 17, 2015 to
June 17, 2020. Authorized credit line of
$4,480 million. On March 26, 2019, the
Company paid the principal in full in
advance.
- - 2,113,718
Unsecured loan from June 24, 2015 to
June 24, 2020. Authorized credit line of
$1,500 million. On March 18, 2019, the
Company paid the principal in full in
advance.
- - 675,000
(Continued)
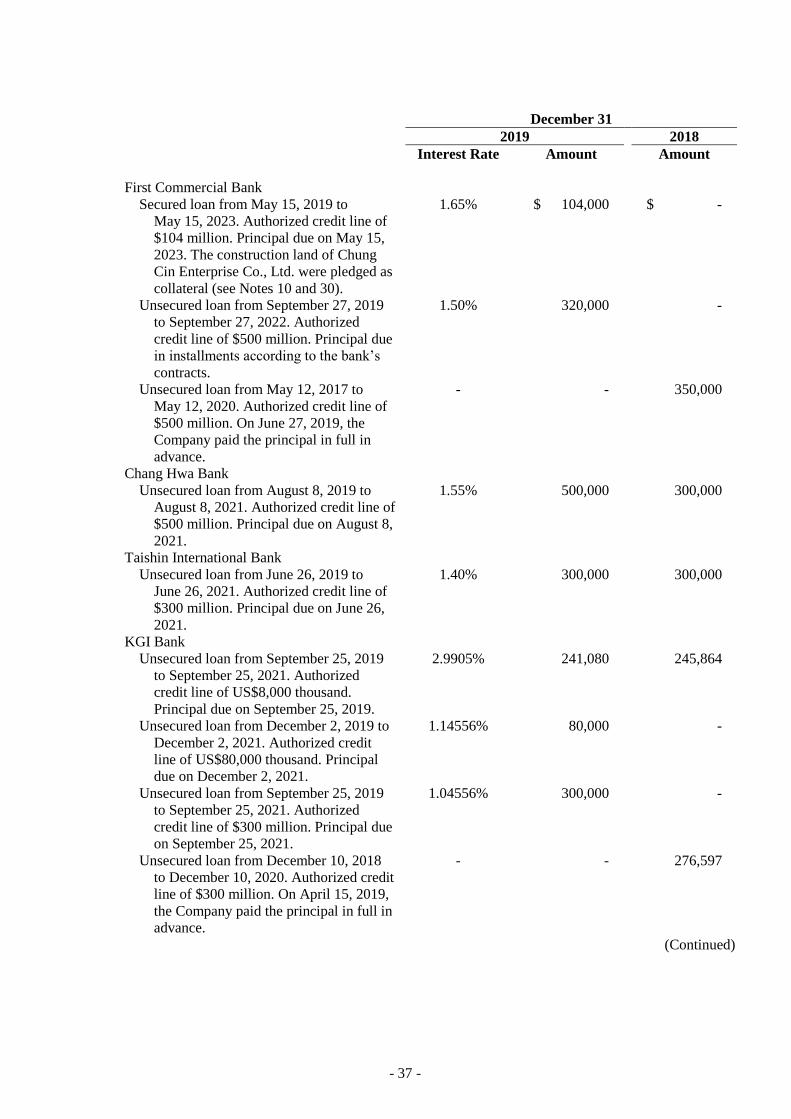
- 37 -
December 31
2019 2018
Interest Rate Amount Amount
First Commercial Bank
Secured loan from May 15, 2019 to
May 15, 2023. Authorized credit line of
$104 million. Principal due on May 15,
2023. The construction land of Chung
Cin Enterprise Co., Ltd. were pledged as
collateral (see Notes 10 and 30).
1.65% $ 104,000 $ -
Unsecured loan from September 27, 2019
to September 27, 2022. Authorized
credit line of $500 million. Principal due
in installments according to the bank’s
contracts.
1.50% 320,000 -
Unsecured loan from May 12, 2017 to
May 12, 2020. Authorized credit line of
$500 million. On June 27, 2019, the
Company paid the principal in full in
advance.
- - 350,000
Chang Hwa Bank
Unsecured loan from August 8, 2019 to
August 8, 2021. Authorized credit line of
$500 million. Principal due on August 8,
2021.
1.55% 500,000 300,000
Taishin International Bank
Unsecured loan from June 26, 2019 to
June 26, 2021. Authorized credit line of
$300 million. Principal due on June 26,
2021.
1.40% 300,000 300,000
KGI Bank
Unsecured loan from September 25, 2019
to September 25, 2021. Authorized
credit line of US$8,000 thousand.
Principal due on September 25, 2019.
2.9905% 241,080 245,864
Unsecured loan from December 2, 2019 to
December 2, 2021. Authorized credit
line of US$80,000 thousand. Principal
due on December 2, 2021.
1.14556% 80,000 -
Unsecured loan from September 25, 2019
to September 25, 2021. Authorized
credit line of $300 million. Principal due
on September 25, 2021.
1.04556% 300,000 -
Unsecured loan from December 10, 2018
to December 10, 2020. Authorized credit
line of $300 million. On April 15, 2019,
the Company paid the principal in full in
advance.
- - 276,597
(Continued)
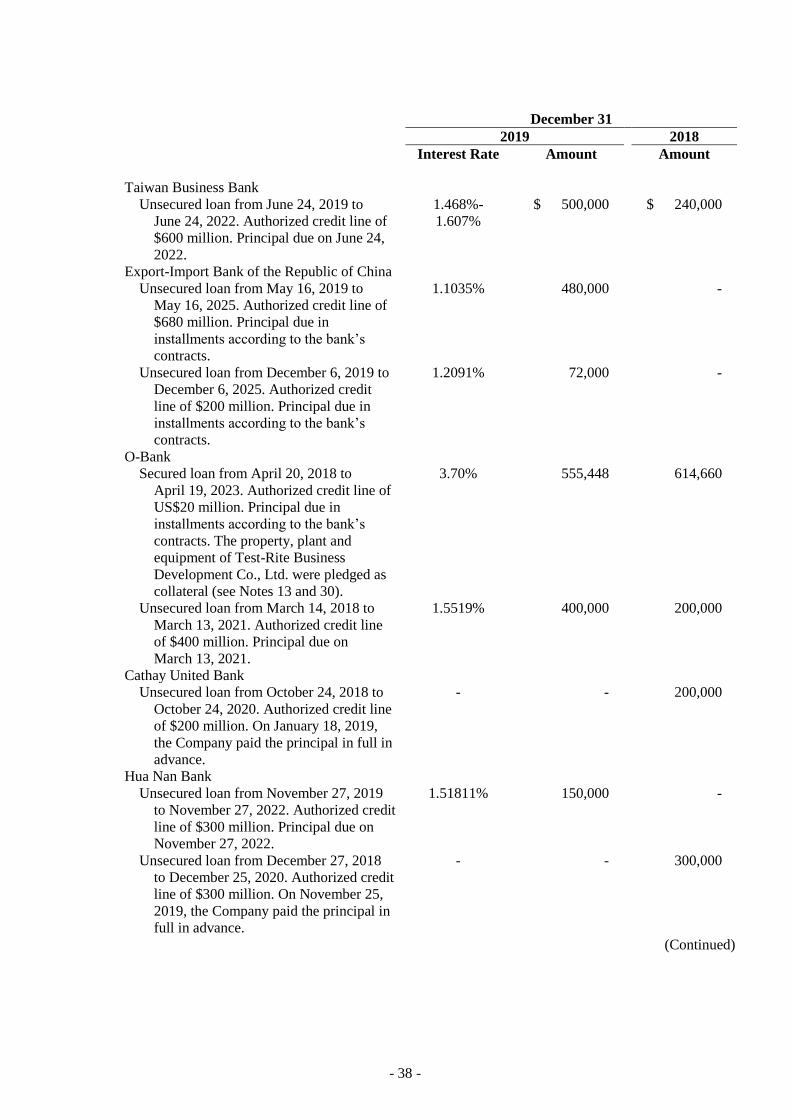
- 38 -
December 31
2019 2018
Interest Rate Amount Amount
Taiwan Business Bank
Unsecured loan from June 24, 2019 to
June 24, 2022. Authorized credit line of
$600 million. Principal due on June 24,
2022.
1.468%-
1.607%
$ 500,000 $ 240,000
Export-Import Bank of the Republic of China
Unsecured loan from May 16, 2019 to
May 16, 2025. Authorized credit line of
$680 million. Principal due in
installments according to the bank’s
contracts.
1.1035% 480,000 -
Unsecured loan from December 6, 2019 to
December 6, 2025. Authorized credit
line of $200 million. Principal due in
installments according to the bank’s
contracts.
1.2091% 72,000 -
O-Bank
Secured loan from April 20, 2018 to
April 19, 2023. Authorized credit line of
US$20 million. Principal due in
installments according to the bank’s
contracts. The property, plant and
equipment of Test-Rite Business
Development Co., Ltd. were pledged as
collateral (see Notes 13 and 30).
3.70% 555,448 614,660
Unsecured loan from March 14, 2018 to
March 13, 2021. Authorized credit line
of $400 million. Principal due on
March 13, 2021.
1.5519% 400,000 200,000
Cathay United Bank
Unsecured loan from October 24, 2018 to
October 24, 2020. Authorized credit line
of $200 million. On January 18, 2019,
the Company paid the principal in full in
advance.
- - 200,000
Hua Nan Bank
Unsecured loan from November 27, 2019
to November 27, 2022. Authorized credit
line of $300 million. Principal due on
November 27, 2022.
1.51811% 150,000 -
Unsecured loan from December 27, 2018
to December 25, 2020. Authorized credit
line of $300 million. On November 25,
2019, the Company paid the principal in
full in advance.
- - 300,000
(Continued)
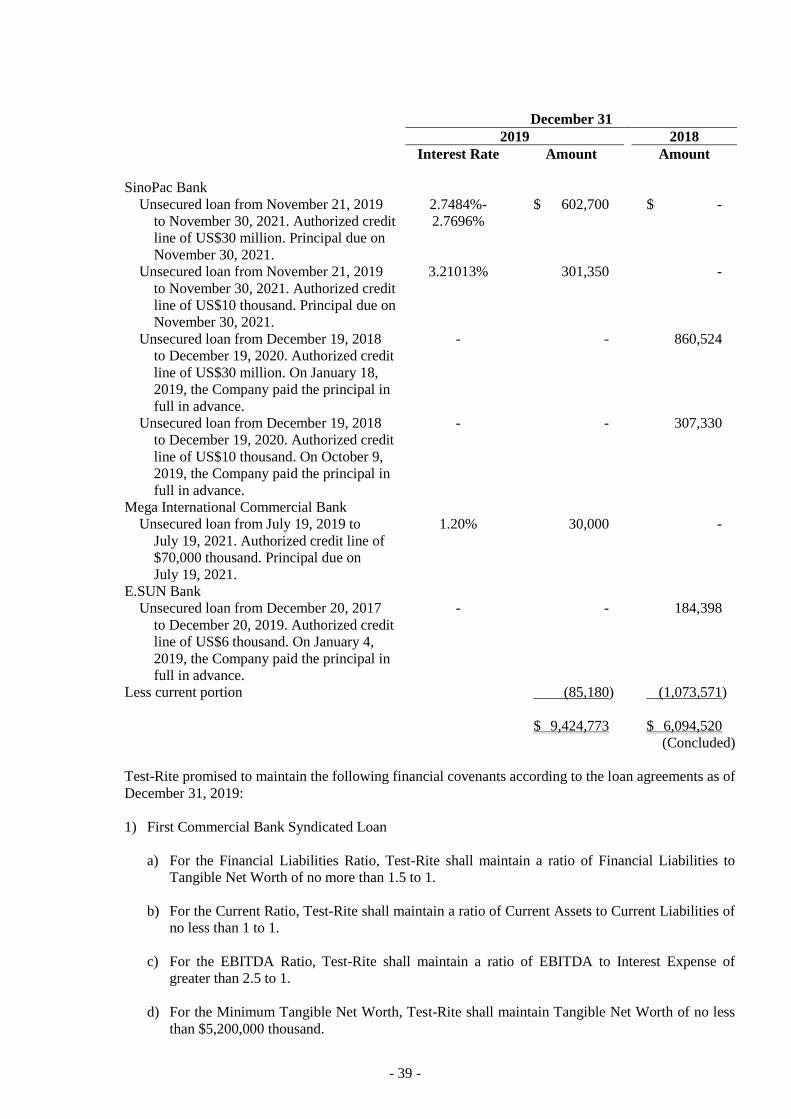
- 39 -
December 31
2019 2018
Interest Rate Amount Amount
SinoPac Bank
Unsecured loan from November 21, 2019
to November 30, 2021. Authorized credit
line of US$30 million. Principal due on
November 30, 2021.
2.7484%-
2.7696%
$ 602,700 $ -
Unsecured loan from November 21, 2019
to November 30, 2021. Authorized credit
line of US$10 thousand. Principal due on
November 30, 2021.
3.21013% 301,350 -
Unsecured loan from December 19, 2018
to December 19, 2020. Authorized credit
line of US$30 million. On January 18,
2019, the Company paid the principal in
full in advance.
- - 860,524
Unsecured loan from December 19, 2018
to December 19, 2020. Authorized credit
line of US$10 thousand. On October 9,
2019, the Company paid the principal in
full in advance.
- - 307,330
Mega International Commercial Bank
Unsecured loan from July 19, 2019 to
July 19, 2021. Authorized credit line of
$70,000 thousand. Principal due on
July 19, 2021.
1.20% 30,000 -
E.SUN Bank
Unsecured loan from December 20, 2017
to December 20, 2019. Authorized credit
line of US$6 thousand. On January 4,
2019, the Company paid the principal in
full in advance.
- - 184,398
Less current portion (85,180) (1,073,571)
$ 9,424,773 $ 6,094,520
(Concluded)
Test-Rite promised to maintain the following financial covenants according to the loan agreements as of
December 31, 2019:
1) First Commercial Bank Syndicated Loan
a) For the Financial Liabilities Ratio, Test-Rite shall maintain a ratio of Financial Liabilities to
Tangible Net Worth of no more than 1.5 to 1.
b) For the Current Ratio, Test-Rite shall maintain a ratio of Current Assets to Current Liabilities of
no less than 1 to 1.
c) For the EBITDA Ratio, Test-Rite shall maintain a ratio of EBITDA to Interest Expense of
greater than 2.5 to 1.
d) For the Minimum Tangible Net Worth, Test-Rite shall maintain Tangible Net Worth of no less
than $5,200,000 thousand.
- 40 -
e) The calculations of the ratios are based on the Company’s stand-alone financial statements for
each year ended December 31.
2) SinoPac Bank Loan
a) For the Financial Liabilities Ratio, Test-Rite shall maintain a ratio of Financial Liabilities to
Tangible Net Worth of no more than 1.5 to 1.
b) For the Current Ratio, Test-Rite shall maintain a ratio of Current Assets to Current Liabilities of
no less than 1 to 1.
c) For the EBITDA Ratio, Test-Rite shall maintain a ratio of EBITDA to Interest Expense of
greater than 2.5 to 1.
d) For the Minimum Tangible Net Worth, Test-Rite shall maintain Tangible Net Worth of no less
than $5,200,000 thousand.
e) The calculations of the ratios are based on the Company’s stand-alone financial statements for
each year ended December 31.
3) Test-Rite Retail promised to maintain the following financial covenants according to the loan
agreements with O-Bank:
a) For the Total Liabilities Ratio, Test-Rite Retail shall maintain a ratio of Liabilities (short-term
borrowings + current portion of long-term borrowings + long-term borrowings) to Tangible Net
Worth of no more than 2 to 1.
b) For the Current Ratio, Test-Rite Retail shall maintain a ratio of Current Assets to Current
Liabilities of no less than 1 to 1.
c) For the EBITDA Ratio, Test-Rite Retail shall maintain a ratio of EBITDA to Interest Expense
of greater than 3 to 1.
d) The calculations of the ratios are based on the stand-alone financial statements of Test-Rite
Retail for each year ended December 31.
4) Test-Rite Retail promised to maintain the following financial covenants according to the loan
agreements with Taishin International Bank:
a) For the Total Liabilities Ratio, Test-Rite Retail shall maintain a ratio of Total Liabilities to Total
Assets of no more than 2 to 1.
b) For the Current Ratio, Test-Rite Retail shall maintain a ratio of Current Assets to Current
Liabilities of no less than 1 to 1.
c) For the EBITDA Ratio, Test-Rite Retail shall maintain a ratio of EBITDA to Interest Expense
of greater than 3 to 1.
d) The calculations of the ratios are based on the stand-alone financial statements of Test-Rite
Retail for each year ended December 31.
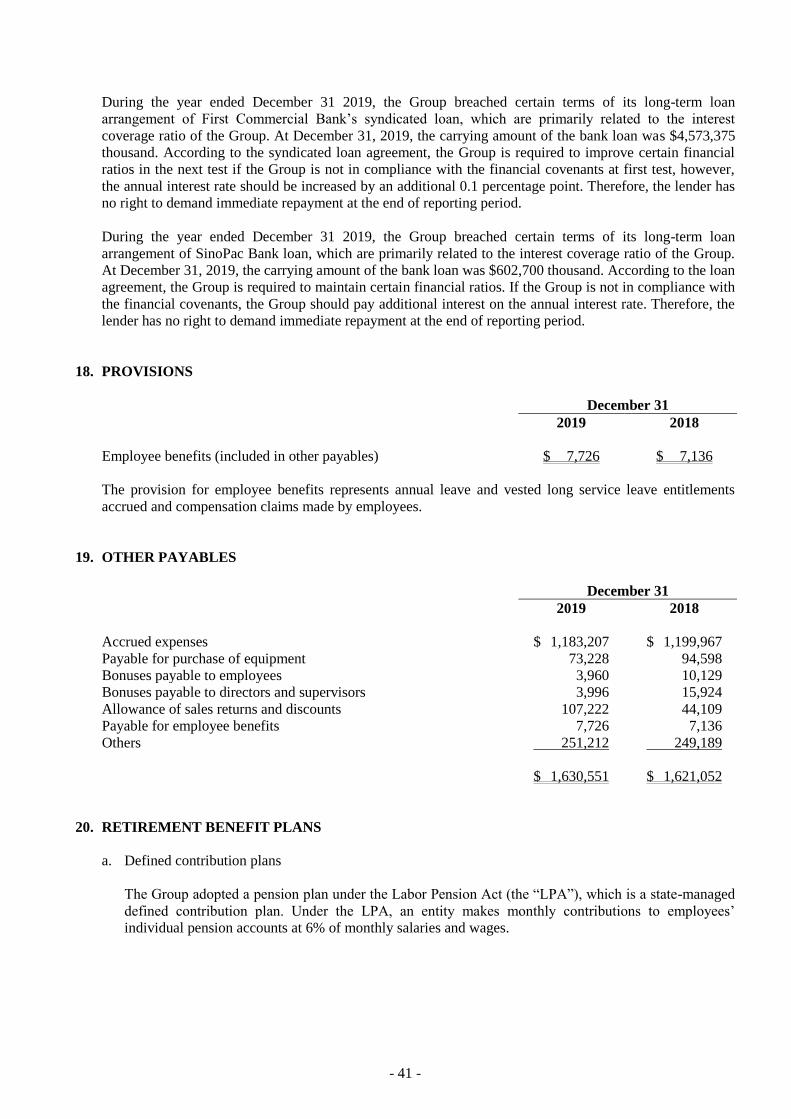
- 41 -
During the year ended December 31 2019, the Group breached certain terms of its long-term loan
arrangement of First Commercial Bank’s syndicated loan, which are primarily related to the interest
coverage ratio of the Group. At December 31, 2019, the carrying amount of the bank loan was $4,573,375
thousand. According to the syndicated loan agreement, the Group is required to improve certain financial
ratios in the next test if the Group is not in compliance with the financial covenants at first test, however,
the annual interest rate should be increased by an additional 0.1 percentage point. Therefore, the lender has
no right to demand immediate repayment at the end of reporting period.
During the year ended December 31 2019, the Group breached certain terms of its long-term loan
arrangement of SinoPac Bank loan, which are primarily related to the interest coverage ratio of the Group.
At December 31, 2019, the carrying amount of the bank loan was $602,700 thousand. According to the loan
agreement, the Group is required to maintain certain financial ratios. If the Group is not in compliance with
the financial covenants, the Group should pay additional interest on the annual interest rate. Therefore, the
lender has no right to demand immediate repayment at the end of reporting period.
18. PROVISIONS
December 31
2019 2018
Employee benefits (included in other payables) $ 7,726 $ 7,136
The provision for employee benefits represents annual leave and vested long service leave entitlements
accrued and compensation claims made by employees.
19. OTHER PAYABLES
December 31
2019 2018
Accrued expenses $ 1,183,207 $ 1,199,967
Payable for purchase of equipment 73,228 94,598
Bonuses payable to employees 3,960 10,129
Bonuses payable to directors and supervisors 3,996 15,924
Allowance of sales returns and discounts 107,222 44,109
Payable for employee benefits 7,726 7,136
Others 251,212 249,189
$ 1,630,551 $ 1,621,052
20. RETIREMENT BENEFIT PLANS
a. Defined contribution plans
The Group adopted a pension plan under the Labor Pension Act (the “LPA”), which is a state-managed
defined contribution plan. Under the LPA, an entity makes monthly contributions to employees’
individual pension accounts at 6% of monthly salaries and wages.
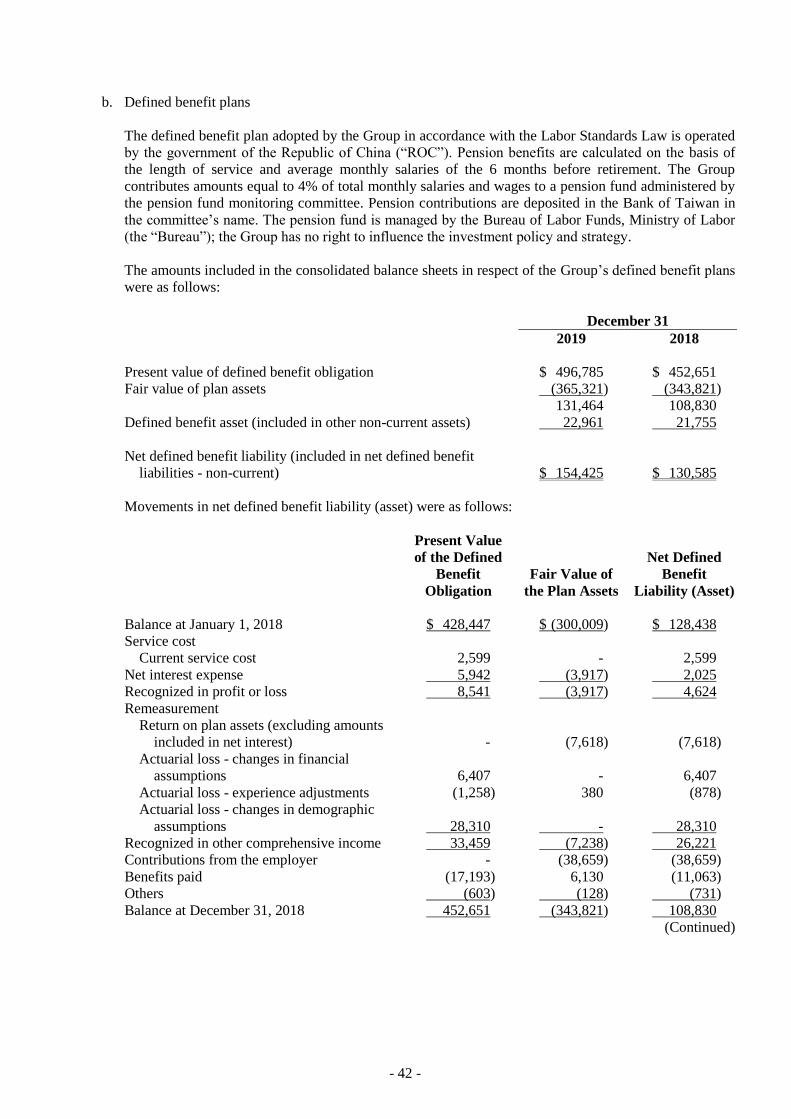
- 42 -
b. Defined benefit plans
The defined benefit plan adopted by the Group in accordance with the Labor Standards Law is operated
by the government of the Republic of China (“ROC”). Pension benefits are calculated on the basis of
the length of service and average monthly salaries of the 6 months before retirement. The Group
contributes amounts equal to 4% of total monthly salaries and wages to a pension fund administered by
the pension fund monitoring committee. Pension contributions are deposited in the Bank of Taiwan in
the committee’s name. The pension fund is managed by the Bureau of Labor Funds, Ministry of Labor
(the “Bureau”); the Group has no right to influence the investment policy and strategy.
The amounts included in the consolidated balance sheets in respect of the Group’s defined benefit plans
were as follows:
December 31
2019 2018
Present value of defined benefit obligation $ 496,785 $ 452,651
Fair value of plan assets (365,321) (343,821)
131,464 108,830
Defined benefit asset (included in other non-current assets) 22,961 21,755
Net defined benefit liability (included in net defined benefit
liabilities - non-current)
$ 154,425 $ 130,585
Movements in net defined benefit liability (asset) were as follows:
Present Value
of the Defined
Benefit
Obligation
Fair Value of
the Plan Assets
Net Defined
Benefit
Liability (Asset)
Balance at January 1, 2018 $ 428,447 $ (300,009) $ 128,438
Service cost
Current service cost 2,599 - 2,599
Net interest expense 5,942 (3,917) 2,025
Recognized in profit or loss 8,541 (3,917) 4,624
Remeasurement
Return on plan assets (excluding amounts
included in net interest) - (7,618) (7,618)
Actuarial loss - changes in financial
assumptions 6,407 - 6,407
Actuarial loss - experience adjustments (1,258) 380 (878)
Actuarial loss - changes in demographic
assumptions 28,310 - 28,310
Recognized in other comprehensive income 33,459 (7,238) 26,221
Contributions from the employer - (38,659) (38,659)
Benefits paid (17,193) 6,130 (11,063)
Others (603) (128) (731)
Balance at December 31, 2018 452,651 (343,821) 108,830
(Continued)

- 43 -
Present Value
of the Defined
Benefit
Obligation
Fair Value of
the Plan Assets
Net Defined
Benefit
Liability (Asset)
Service cost
Current service cost $ 2,494 $ - $ 2,494
Net interest expense 5,761 (3,984) 1,777
Recognized in profit or loss 8,255 (3,984) 4,271
Remeasurement
Return on plan assets (excluding amounts
included in net interest) - (9,743) (9,743)
Actuarial loss - changes in financial
assumptions 29,035 - 29,305
Actuarial loss - experience adjustments 4,083 366 4,449
Actuarial loss - changes in demographic
assumptions 9,561 - 9,561
Recognized in other comprehensive income 42,949 (9,377) 33,572
Contributions from the employer - (14,039) (14,039)
Benefits paid (5,170) 5,170 -
Others (1,900) 730 (1,170)
Balance at December 31, 2019 $ 496,785 $ (365,321) $ 131,464
(Concluded)
An analysis by function of the amounts recognized in profit or loss in respect of the defined benefit
plans is as follows:
For the Year Ended December 31
2019 2018
Operating expenses $ 4,271 $ 4,624
Through the defined benefit plans under the Labor Standards Law, the Group is exposed to the
following risks:
1) Investment risk: The plan assets are invested in domestic and foreign equity and debt securities,
bank deposits, etc. The investment is conducted at the discretion of the Bureau or under the
mandated management. However, in accordance with relevant regulations, the return generated by
plan assets should not be below the interest rate for a 2-year time deposit with local banks.
2) Interest risk: A decrease in the government bond interest rate will increase the present value of the
defined benefit obligation; however, this will be partially offset by an increase in the return on the
plan’s debt investments.
3) Salary risk: The present value of the defined benefit obligation is calculated by reference to the
future salaries of plan participants. As such, an increase in the salary of the plan participants will
increase the present value of the defined benefit obligation.

- 44 -
The actuarial valuations of the present value of the defined benefit obligation were carried out by
qualified actuaries. The significant assumptions used for the purposes of the actuarial valuations were as
follows:
December 31
2019 2018
Discount rate 0.75%-1.87% 1.00%-1.87%
Expected rate of salary increase 0.00%-3.00% 0.00%-3.00%
If possible reasonable change in each of the significant actuarial assumptions will occur and all other
assumptions will remain constant, the present value of the defined benefit obligation would increase
(decrease) as follows:
December 31
2019 2018
Discount rate
0.25%-0.5% increase $ (14,257) $ (13,441)
0.25%-0.5% decrease $ 14,868 $ 14,024
Expected rate of salary increase
0.25%-1% increase $ 16,383 $ 15,703
0.25%-1% decrease $ (15,520) $ (14,841)
The sensitivity analysis presented above may not be representative of the actual change in the present
value of the defined benefit obligation as it is unlikely that the change in assumptions would occur in
isolation of one another as some of the assumptions may be correlated.
December 31
2019 2018
Expected contributions to the plan for the next year $ 10,152 $ 11,190
Average duration of the defined benefit obligation 9.80-19.90 years 10.80-17.80 years
21. EQUITY
a. Share capital
December 31
2019 2018
Number of shares authorized (in thousands) 750,000 750,000
Shares authorized $ 7500,000 $ 7,500,000
Number of shares issued and fully paid (in thousands) 509,888 509,888
Shares issued $ 5,098,875 $ 5,098,875
Fully paid common shares, which have a par value of $10, carry one vote per share and carry a right to
dividends.
As of December 31, 2019, Test-Rite’s outstanding share capital amounted to $5,098,875 thousand.

- 45 -
b. Capital surplus
December 31
2019 2018
May be used to offset a deficit, distributed as cash dividends, or
transferred to share capital (1)
Issuance of ordinary shares $ 352,227 $ 647,962
May only be used to offset a deficit (2)
Changes in percentage of ownership interests in subsidiaries 857 -
$ 353,084 $ 647,962
1) Such capital surplus may be used to offset a deficit; in addition, when the Company has no deficit,
such capital surplus may be distributed as cash dividends or transferred to share capital (limited to a
certain percentage of the Company’s capital surplus and to once a year).
2) Such capital surplus arises from the effects of changes in ownership interests in subsidiaries
resulting from equity transactions other than actual disposals or acquisitions or from changes in
capital surplus of subsidiaries accounted for using the equity method.
c. Retained earnings and dividends policy
Under the dividends policy as set forth in the amended Articles, where the Company made a profit in a
fiscal year, the profit shall be first utilized for paying taxes, offsetting losses of previous years, setting
aside as legal reserve 10% of the remaining profit, setting aside or reversing a special reserve in
accordance with the laws and regulations, and then any remaining profit together with any undistributed
retained earnings shall be used by the Company’s board of directors as the basis for proposing a
distribution plan, which should be resolved in the shareholders’ meeting for the distribution of
dividends and bonuses to shareholders. Above dividends, legal reserve and capital surplus which is
distributed by cash, the Company authorizes the distribution after a resolution has been adopted by a
majority vote at a meeting of the board of directors attended by two-thirds of the total number of
directors; and in addition thereto a report of such distribution shall be submitted to the shareholders’
meeting. For the policies on the distribution of employees’ compensation and remuneration of directors
and supervisors after the amendment, refer to employees’ compensation and remuneration of directors
and supervisors in Note 26-2.
The dividends policy of Test-Rite is as follows:
The Company’s dividends policy shall consider the Company’s business diversification, capital needs
for future operational plan, along with the shareholder’s benefits, and the Company’s long-term
financial plans. The shareholder’s dividends are appropriated based on accumulated distributable
earnings, which shall not be lower than 50% of the distributable earnings for the periods and the cash
dividends shall not be less than 10% of the shareholders dividend. However, if cash dividends per share
are less than $0.1, share dividends could be all distributed instead of cash dividends.
An appropriation of earnings to a legal reserve shall be made until the legal reserve equals the
Company’s paid-in capital. The legal reserve may be used to offset deficits. If the Company has no
deficit and the legal reserve has exceeded 25% of the Company’s paid-in capital, the excess may be
transferred to capital or distributed in cash.
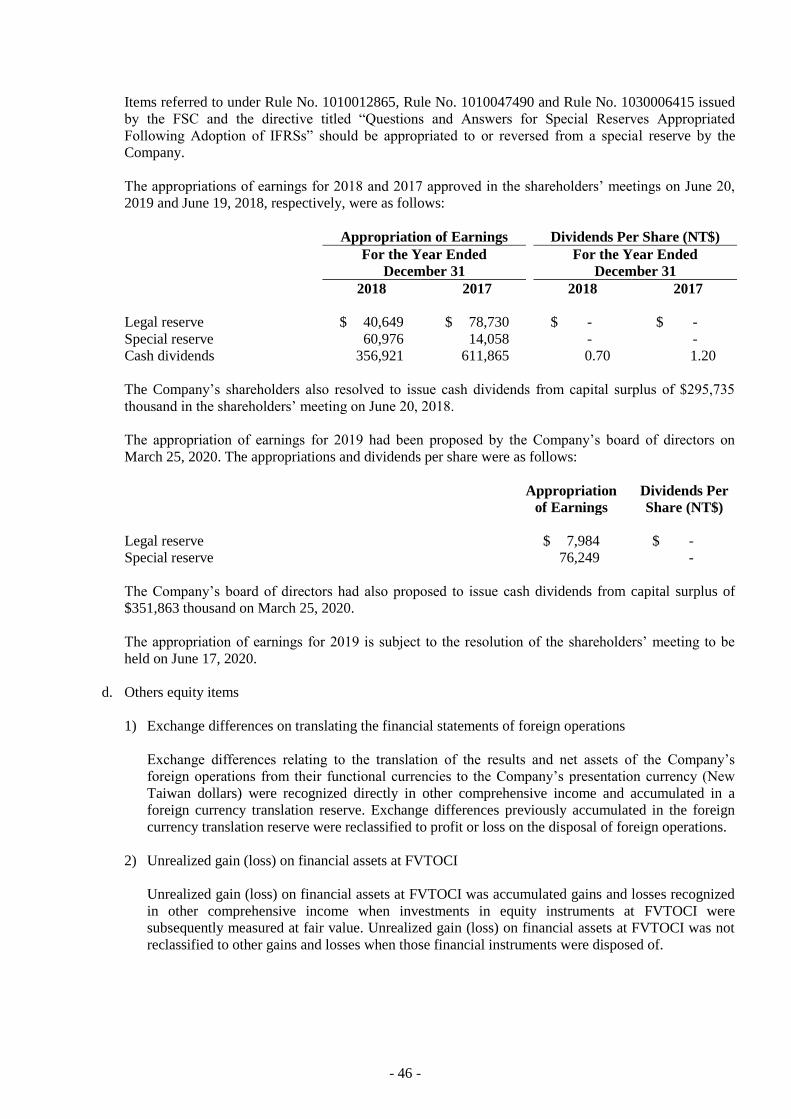
- 46 -
Items referred to under Rule No. 1010012865, Rule No. 1010047490 and Rule No. 1030006415 issued
by the FSC and the directive titled “Questions and Answers for Special Reserves Appropriated
Following Adoption of IFRSs” should be appropriated to or reversed from a special reserve by the
Company.
The appropriations of earnings for 2018 and 2017 approved in the shareholders’ meetings on June 20,
2019 and June 19, 2018, respectively, were as follows:
Appropriation of Earnings Dividends Per Share (NT$)
For the Year Ended
December 31
For the Year Ended
December 31
2018 2017 2018 2017
Legal reserve $ 40,649 $ 78,730 $ - $ -
Special reserve 60,976 14,058 - -
Cash dividends 356,921 611,865 0.70 1.20
The Company’s shareholders also resolved to issue cash dividends from capital surplus of $295,735
thousand in the shareholders’ meeting on June 20, 2018.
The appropriation of earnings for 2019 had been proposed by the Company’s board of directors on
March 25, 2020. The appropriations and dividends per share were as follows:
Appropriation
of Earnings
Dividends Per
Share (NT$)
Legal reserve $ 7,984 $ -
Special reserve 76,249 -
The Company’s board of directors had also proposed to issue cash dividends from capital surplus of
$351,863 thousand on March 25, 2020.
The appropriation of earnings for 2019 is subject to the resolution of the shareholders’ meeting to be
held on June 17, 2020.
d. Others equity items
1) Exchange differences on translating the financial statements of foreign operations
Exchange differences relating to the translation of the results and net assets of the Company’s
foreign operations from their functional currencies to the Company’s presentation currency (New
Taiwan dollars) were recognized directly in other comprehensive income and accumulated in a
foreign currency translation reserve. Exchange differences previously accumulated in the foreign
currency translation reserve were reclassified to profit or loss on the disposal of foreign operations.
2) Unrealized gain (loss) on financial assets at FVTOCI
Unrealized gain (loss) on financial assets at FVTOCI was accumulated gains and losses recognized
in other comprehensive income when investments in equity instruments at FVTOCI were
subsequently measured at fair value. Unrealized gain (loss) on financial assets at FVTOCI was not
reclassified to other gains and losses when those financial instruments were disposed of.

- 47 -
e. Treasury shares
Purpose of Buy-back
Shares
Transferred to
Employees
(In Thousands
of Shares)
Number of shares at January 1, 2019 -
Increased during the year 14,306
Number of shares at December 31, 2019 14,306
Under the Securities and Exchange Act, the Company shall neither pledge treasury shares nor exercise
shareholders’ rights on these shares, such as the rights to dividends and to vote.
22. REVENUE
For the Year Ended December 31
2019 2018
Revenue from contracts with customers
Revenue from sale of goods $ 35,406,950 $ 37,457,384
Construction contract revenue 1,022,954 1,052,665
Rental income 544,499 611,214
Revenue from sales of real estate 7,848 110,867
Other operating revenue 1,078,562 665,820
$ 38,060,813 $ 39,897,950
a. Contract balances
December 31
2019 2018
Contract assets
Properties construction $ 216,962 $ 204,203
Contract liabilities
Properties construction $ 20,901 $ 656
Customer loyalty programs 51,165 65,160
$ 72,066 $ 65,816
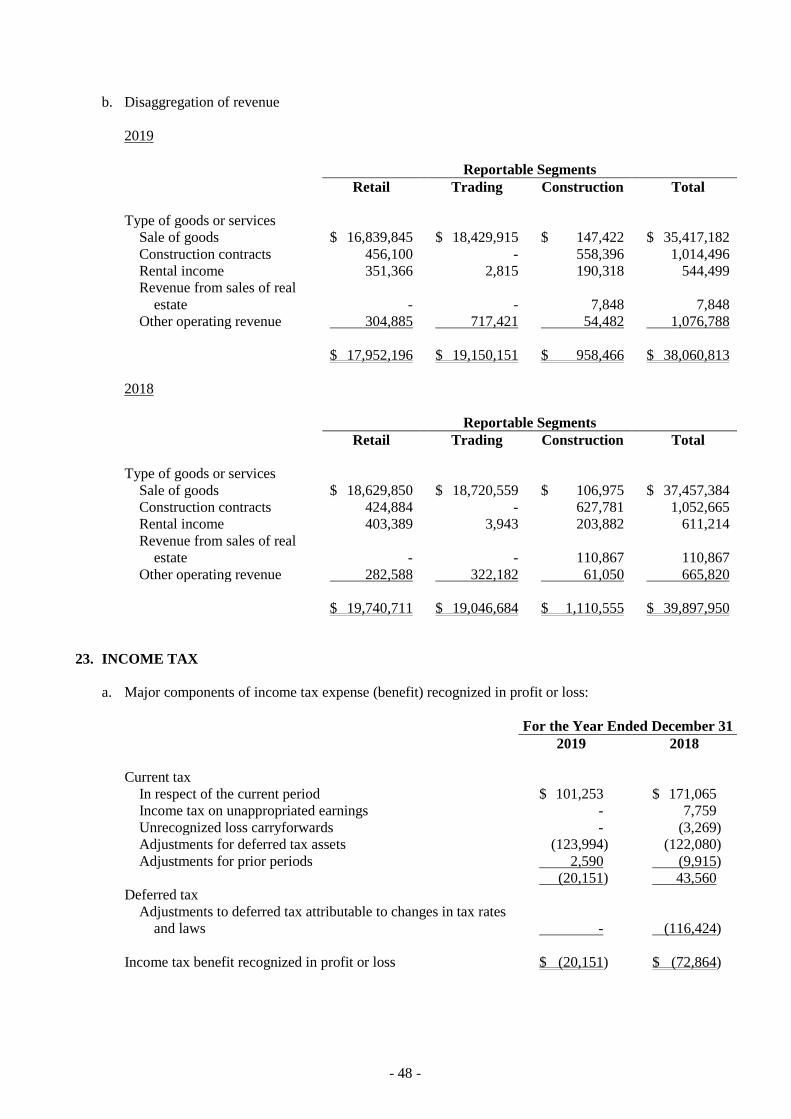
- 48 -
b. Disaggregation of revenue
2019
Reportable Segments
Retail Trading Construction Total
Type of goods or services
Sale of goods $ 16,839,845 $ 18,429,915 $ 147,422 $ 35,417,182
Construction contracts 456,100 - 558,396 1,014,496
Rental income 351,366 2,815 190,318 544,499
Revenue from sales of real
estate - - 7,848 7,848
Other operating revenue 304,885 717,421 54,482 1,076,788
$ 17,952,196 $ 19,150,151 $ 958,466 $ 38,060,813
2018
Reportable Segments
Retail Trading Construction Total
Type of goods or services
Sale of goods $ 18,629,850 $ 18,720,559 $ 106,975 $ 37,457,384
Construction contracts 424,884 - 627,781 1,052,665
Rental income 403,389 3,943 203,882 611,214
Revenue from sales of real
estate - - 110,867 110,867
Other operating revenue 282,588 322,182 61,050 665,820
$ 19,740,711 $ 19,046,684 $ 1,110,555 $ 39,897,950
23. INCOME TAX
a. Major components of income tax expense (benefit) recognized in profit or loss:
For the Year Ended December 31
2019 2018
Current tax
In respect of the current period $ 101,253 $ 171,065
Income tax on unappropriated earnings - 7,759
Unrecognized loss carryforwards - (3,269)
Adjustments for deferred tax assets (123,994) (122,080)
Adjustments for prior periods 2,590 (9,915)
(20,151) 43,560
Deferred tax
Adjustments to deferred tax attributable to changes in tax rates
and laws - (116,424)
Income tax benefit recognized in profit or loss $ (20,151) $ (72,864)

- 49 -
b. A reconciliation of accounting profit and income tax expense is as follows:
For the Year Ended December 31
2019 2018
Profit before tax
Income tax expense calculated at the statutory rate $ 122,847 $ 171,779
Decrease in tax resulting from other adjustments of permanent
differences
Tax-exempt income (21,594) (714)
Adjustments to deferred tax assets (123,994) (122,080)
Income tax on unappropriated earnings - 7,759
Unrecognized loss carryforwards - (3,269)
Adjustments for prior periods 2,590 (9,915)
(20,151) 43,560
Effect of tax rate changes - (116,424)
Income tax benefit recognized in profit or loss $ (20,151) $ (72,864)
The Income Tax Act in the ROC was amended in 2018, and the corporate income tax rate was adjusted
from 17% to 20%. In addition, the rate of the corporate surtax applicable to the 2018 unappropriated
earnings was reduced from 10% to 5%.
c. Deferred tax assets and liabilities
For the Year Ended December 31
2019 2018
Deferred tax assets
Temporary difference
Share of losses of subsidiaries accounted for using the equity
method $ 949,053 $ 702,608
Unrealized warranty reserve 4,989 7,905
Unrealized loss on inventories 27,792 31,620
Allowance for doubtful accounts 12,777 11,865
Allowance for sales returns and discounts 45,554 11,646
Allowance for compensation losses 15,530 11,516
Financial assets at FVTOCI 6,380 5,423
Others 483,240 653,820
$ 1,545,315 $ 1,436,403
Deferred tax liabilities
Temporary difference
Defined benefit obligations $ 2,527 $ 2,465
Intangible assets 15,691 18,442
$ 18,218 $ 20,907
d. Income tax assessments
The income tax returns of Test-Rite for years through 2017 have been examined and approved by the
tax authority.

- 50 -
24. EARNINGS PER SHARE
For the years ended December 31, 2019 and 2018, the amounts of earnings per share were calculated as
follows:
2019
Amounts
(Numerator) EPS (NT$)
Parent Co.
Shareholders
Income After
Tax
Shares
(Denominator)
(In Thousands)
Parent Co.
Shareholders
Income After
Tax
Basic earnings per share
Net income to shareholders of common shares $ 100,355 503,123 $ 0.20
The effects of dilutive potential common shares
Compensation to employees (Note) - -
Diluted earnings per share
Net income to shareholders of common shares
and the effects of potential common shares $ 100,355 503,123 $ 0.20
2018
Amounts
(Numerator) EPS (NT$)
Parent Co.
Shareholders
Income After
Tax
Shares
(Denominator)
(In Thousands)
Parent Co.
Shareholders
Income After
Tax
Basic earnings per share
Net income to shareholders of common shares $ 406,493 509,888 $ 0.80
The effects of dilutive potential common shares
Compensation to employees - 189
Diluted earnings per share
Net income to shareholders of common shares
and the effects of potential common shares $ 406,493 510,077 $ 0.80
If Test-Rite offered to settle the compensation or bonuses paid to employees in cash or shares, Test-Rite
assumed that the entire amount of the compensation or bonuses will be settled in shares, and the resulting
potential shares were included in the weighted average number of shares outstanding used in the
computation of diluted earnings per share, as the effect is dilutive. Such dilutive effect of the potential
shares is included in the computation of diluted earnings per share until the number of shares to be
distributed to employees is resolved in the following year.
Note: Since Test-Rite did not earn profit before tax in 2019, the compensation to employees was not
estimated in 2019.

- 51 -
25. BUSINESS COMBINATIONS
a. Subsidiaries acquired
Subsidiary
Principal
Activity
Date of
Acquisition
Proportion of
Voting Equity
Interests
Acquired (%)
Consideration
Transferred
U-ME Enterprise Co., Ltd. Cleaning
service
January 1, 2018 60 $ 65,000
Hand-On Lighting Co., Ltd. Sale of
electrical
appliances
September 3,
2018 51 $ 5,253
On January 1, 2018, the Group acquired a 60% interest of U-ME Enterprise Co., Ltd., via cash of
$65,000 thousand through a third party in order to continue the expansion of the Group’s business.
On September 3, 2018, the Group acquired a 51% interest of Hand-On Lighting Co., Ltd., via cash of
$5,253 thousand through a third party in order to continue the expansion of the Group’s business.
b. Consideration transferred
U-ME
Enterprise Co.,
Ltd.
Hand-On
Lighting Co.,
Ltd.
Cash $ 65,000 $ 5,253
c. Assets acquired and liabilities assumed at the date of acquisition
U-ME
Enterprise Co.,
Ltd.
Hand-On
Lighting Co.,
Ltd.
Current assets
Cash and cash equivalents $ 834 $ 8,671
Accounts receivable 9,986 9,613
Inventories 4,632 985
Prepayments 10 2,047
Non-current assets
Property, plant and equipment 6,648 620
Refundable deposits 1,488 -
Other intangible assets 5,600 -
Goodwill 50,400 -
Other non-current assets - 4
Current liabilities
Notes payable (1,483) (857)
Accounts payable - (3,869)
Current tax liabilities (144) (22)
Other payables (929) (6,603)
Other current liabilities - (5)
Long-term borrowings (6,042) -
$ 71,000 $ 10,584

- 52 -
d. Non-controlling interests
The non-controlling interest (a 40% ownership interest in U-ME Enterprise Co., Ltd.) recognized at the
acquisition date was measured by reference to the net assets of the non-controlling interest with the
amount of $6,000 thousand.
The non-controlling interest (a 49% ownership interest in Hand-On Lighting Co., Ltd.) recognized at
the acquisition date was measured by reference to the net assets of the non-controlling interest with the
amount of $5,331 thousand.
e. Goodwill recognized on acquisitions
U-ME
Enterprise Co.,
Ltd.
Hand-On
Lighting Co.,
Ltd.
Consideration transferred $ 65,000 $ 5,253
Plus: Non-controlling interests 6,000 5,331
Less: Fair value of identifiable net assets acquired (20,600) (10,880)
Goodwill recognized on acquisitions (gain from bargain
purchase) $ 50,400 $ (296)
The goodwill recognized in the acquisitions of U-ME Enterprise Co., Ltd. mainly represents the control
premium. In addition, the consideration paid for the combinations effectively included amounts
attributed to the benefits of expected synergies, revenue growth, future market development and the
assembled workforces of U-ME Enterprise Co., Ltd. These benefits are not recognized separately
because they do not meet the recognition criteria for identifiable intangible assets.
f. Net cash outflow (inflow) on acquisition of subsidiaries
U-ME
Enterprise Co.,
Ltd.
Hand-On
Lighting Co.,
Ltd.
Consideration paid in cash $ 65,000 $ 5,253
Less: Cash and cash equivalent balances acquired (834) (8,671)
$ 64,166 $ (3,418)
26. PERSONNEL, DEPRECIATION, AND AMORTIZATION EXPENSES
a. Personnel, depreciation, and amortization expenses for the years ended December 31, 2019 and 2018
were summarized as follows:
Function
Expense Item
2019 2018
Operating
Costs
Operating
Expenses Total
Operating
Costs
Operating
Expenses Total
Personnel expenses
Salaries $ 44,807 $ 3,421,744 $ 3,466,551 $ 46,745 $ 3,511,350 $ 3,558,095
Labor insurance and health insurance 4,514 261,547 266,061 4,521 249,396 253,917
Pension cost 2,654 160,925 163,579 2,551 187,881 190,432
Others 5,005 277,885 282,890 4,393 311,385 315,778
Depreciation expenses 335,467 2,222,931 2,558,398 60,769 550,570 611,339
Amortization expenses 68 122,705 122,773 - 113,001 113,001

- 53 -
As of December 31, 2019 and 2018, the Group had 4,916 and 5,539 employees, respectively.
b. Employees’ compensation and remuneration of directors and supervisors
According to the Articles of Incorporation of the Company, the Company accrued employees’
compensation and remuneration of directors and supervisors at rates of no less than 1% and no higher
than 2%, respectively, of net profit before income tax, employees’ compensation, and remuneration of
directors and supervisors. Since the Company did not profit before the tax in 2019, the employees’
compensation and remuneration of directors and supervisors was not estimated in 2019. The
employees’ compensation and remuneration of directors and supervisors for the year ended December
31, 2018, which have been approved by the Company’s board of directors on March 26, 2019, were as
follows:
Accrual rate
For the Year
Ended
December 31,
2019
Employees’ compensation 1.0%
Remuneration of directors and supervisors 1.5%
Amount
For the Year
Ended
December 31
Cash
Employees’ compensation $ 2,345
Remuneration of directors and supervisors 3,517
If there is a change in the amounts after the annual consolidated financial statements are authorized for
issue, the differences are recorded as a change in the accounting estimate.
There is no difference between the actual amounts of employees’ compensation and remuneration of
directors and supervisors paid and the amounts recognized in the consolidated financial statements for
the years ended December 31, 2018 and 2017.
Information on the employees’ compensation and remuneration of directors and supervisors resolved by
the Company’s board of directors in 2020 and 2019 is available at the Market Observation Post System
website of the Taiwan Stock Exchange.
27. CAPITAL MANAGEMENT
The objective of the Company’s capital management is to ensure it has the necessary financial resource and
operational plan so that it can cope with the next twelve months working capital requirements, capital
expenditures and dividends spending.
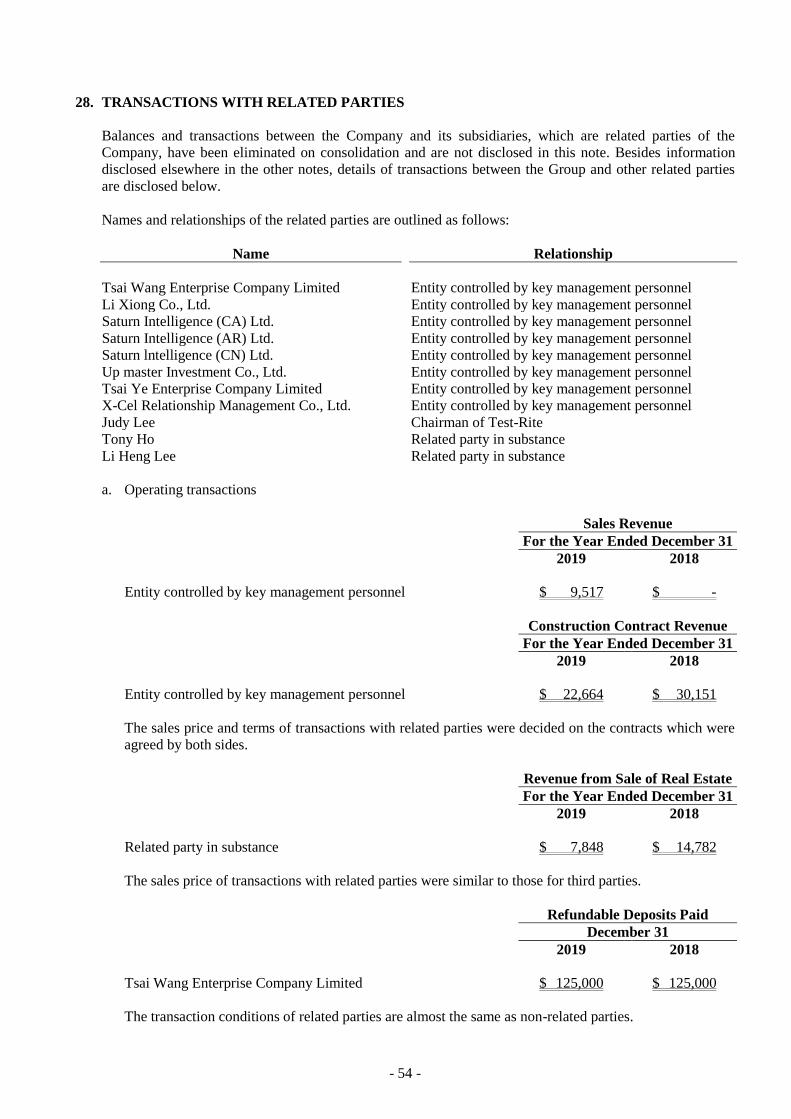
- 54 -
28. TRANSACTIONS WITH RELATED PARTIES
Balances and transactions between the Company and its subsidiaries, which are related parties of the
Company, have been eliminated on consolidation and are not disclosed in this note. Besides information
disclosed elsewhere in the other notes, details of transactions between the Group and other related parties
are disclosed below.
Names and relationships of the related parties are outlined as follows:
Name Relationship
Tsai Wang Enterprise Company Limited Entity controlled by key management personnel
Li Xiong Co., Ltd. Entity controlled by key management personnel
Saturn Intelligence (CA) Ltd. Entity controlled by key management personnel
Saturn Intelligence (AR) Ltd. Entity controlled by key management personnel
Saturn lntelligence (CN) Ltd. Entity controlled by key management personnel
Up master Investment Co., Ltd. Entity controlled by key management personnel
Tsai Ye Enterprise Company Limited Entity controlled by key management personnel
X-Cel Relationship Management Co., Ltd. Entity controlled by key management personnel
Judy Lee Chairman of Test-Rite
Tony Ho Related party in substance
Li Heng Lee Related party in substance
a. Operating transactions
Sales Revenue
For the Year Ended December 31
2019 2018
Entity controlled by key management personnel $ 9,517 $ -
Construction Contract Revenue
For the Year Ended December 31
2019 2018
Entity controlled by key management personnel $ 22,664 $ 30,151
The sales price and terms of transactions with related parties were decided on the contracts which were
agreed by both sides.
Revenue from Sale of Real Estate
For the Year Ended December 31
2019 2018
Related party in substance $ 7,848 $ 14,782
The sales price of transactions with related parties were similar to those for third parties.
Refundable Deposits Paid
December 31
2019 2018
Tsai Wang Enterprise Company Limited $ 125,000 $ 125,000
The transaction conditions of related parties are almost the same as non-related parties.
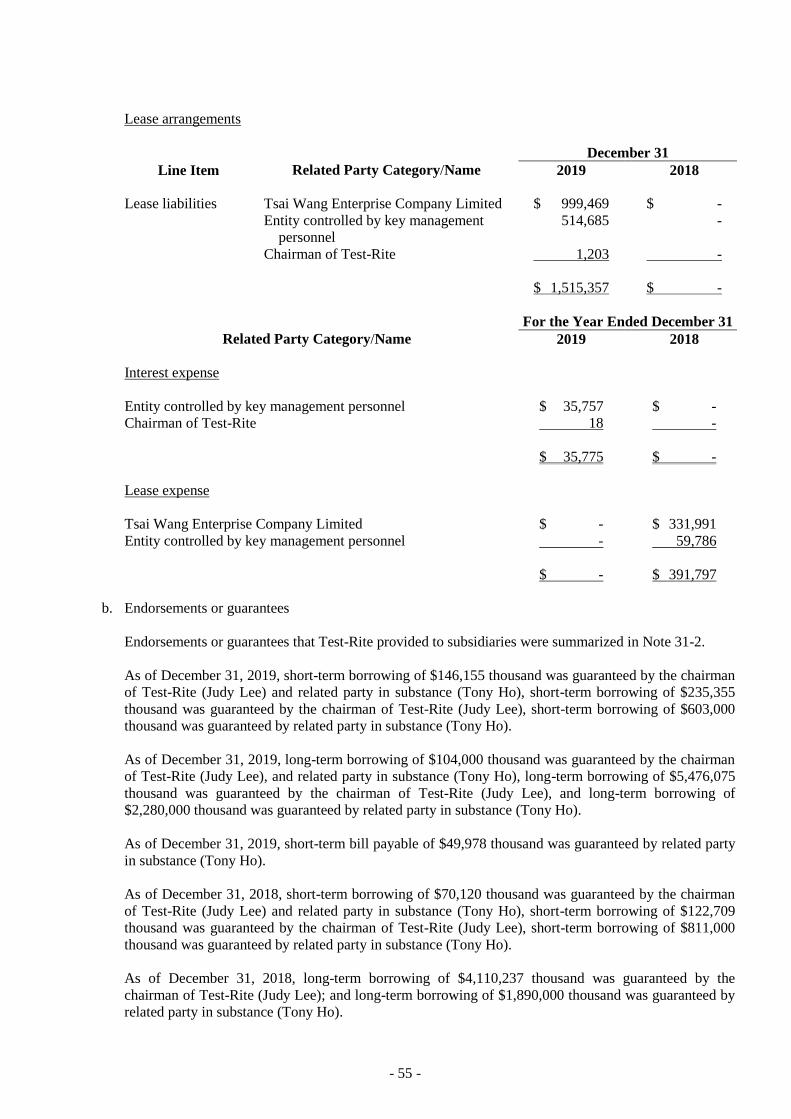
- 55 -
Lease arrangements
December 31
Line Item Related Party Category/Name 2019 2018
Lease liabilities Tsai Wang Enterprise Company Limited $ 999,469 $ -
Entity controlled by key management
personnel
514,685 -
Chairman of Test-Rite 1,203 -
$ 1,515,357 $ -
For the Year Ended December 31
Related Party Category/Name 2019 2018
Interest expense
Entity controlled by key management personnel $ 35,757 $ -
Chairman of Test-Rite 18 -
$ 35,775 $ -
Lease expense
Tsai Wang Enterprise Company Limited $ - $ 331,991
Entity controlled by key management personnel - 59,786
$ - $ 391,797
b. Endorsements or guarantees
Endorsements or guarantees that Test-Rite provided to subsidiaries were summarized in Note 31-2.
As of December 31, 2019, short-term borrowing of $146,155 thousand was guaranteed by the chairman
of Test-Rite (Judy Lee) and related party in substance (Tony Ho), short-term borrowing of $235,355
thousand was guaranteed by the chairman of Test-Rite (Judy Lee), short-term borrowing of $603,000
thousand was guaranteed by related party in substance (Tony Ho).
As of December 31, 2019, long-term borrowing of $104,000 thousand was guaranteed by the chairman
of Test-Rite (Judy Lee), and related party in substance (Tony Ho), long-term borrowing of $5,476,075
thousand was guaranteed by the chairman of Test-Rite (Judy Lee), and long-term borrowing of
$2,280,000 thousand was guaranteed by related party in substance (Tony Ho).
As of December 31, 2019, short-term bill payable of $49,978 thousand was guaranteed by related party
in substance (Tony Ho).
As of December 31, 2018, short-term borrowing of $70,120 thousand was guaranteed by the chairman
of Test-Rite (Judy Lee) and related party in substance (Tony Ho), short-term borrowing of $122,709
thousand was guaranteed by the chairman of Test-Rite (Judy Lee), short-term borrowing of $811,000
thousand was guaranteed by related party in substance (Tony Ho).
As of December 31, 2018, long-term borrowing of $4,110,237 thousand was guaranteed by the
chairman of Test-Rite (Judy Lee); and long-term borrowing of $1,890,000 thousand was guaranteed by
related party in substance (Tony Ho).

- 56 -
As of December 31, 2018, short-term bill payable of $99,966 thousand was guaranteed by related party
in substance (Tony Ho).
c. Compensation of key management personnel
For the Year Ended December 31
2019 2018
Short-term employee benefits $ 151,709 $ 188,674
Post-employment benefits 4,038 12,354
$ 155,747 $ 201,028
The remuneration of directors and key executives was determined by the remuneration committee based
on the performance of individuals and market trends.
29. FINANCIAL INSTRUMENTS
Fair Value of Financial Instruments
a. Fair value of financial instruments not carried at fair value
The management considers that the carrying amounts of financial assets and financial liabilities not
carried at fair value approximate their fair value. As of December 31, 2019 and 2018, the carrying
amounts approximate their fair value.
b. Fair value measurements recognized in the consolidated balance sheets
December 31, 2019
Level 1 Level 2 Level 3 Total
Financial assets at FVTPL
Derivative financial assets $ - $ 30,138 $ - $ 30,138
Non-derivative financial assets $ 590,594 $ - $ - $ 590,594
Financial liabilities at FVTPL
Derivatives financial assets $ - $ 321 $ - $ 321
Financial assets at FVTOCI
Investments in equity instruments $ - $ - $ 54,069 $ 54,069
December 31, 2018
Level 1 Level 2 Level 3 Total
Financial assets at FVTPL
Derivative financial assets $ - $ 32,757 $ - $ 32,757
Non-derivative financial assets $ 270,374 $ - $ - $ 270,374
Financial liabilities at FVTPL
Derivatives financial assets $ - $ 16,017 $ - $ 16,017
Financial assets at FVTOCI
Investments in equity instruments $ - $ - $ 49,213 $ 49,213
There were no transfers between Level 1 and 2 in the current and prior periods.
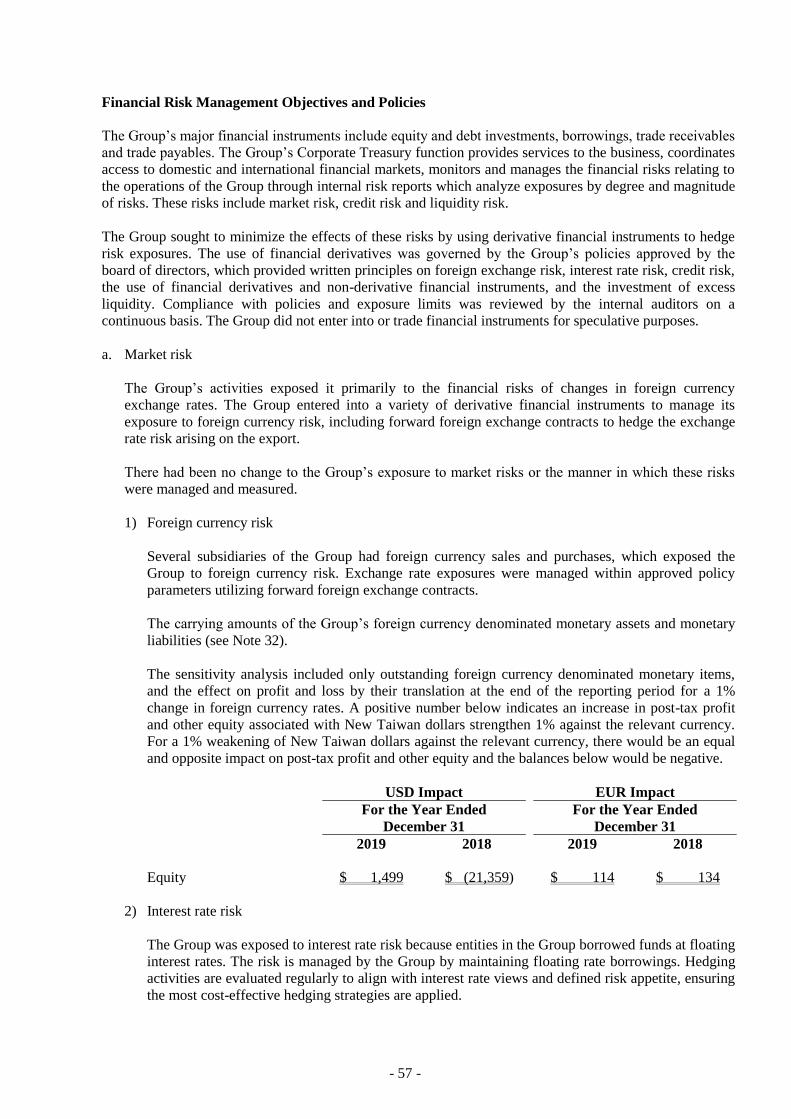
- 57 -
Financial Risk Management Objectives and Policies
The Group’s major financial instruments include equity and debt investments, borrowings, trade receivables
and trade payables. The Group’s Corporate Treasury function provides services to the business, coordinates
access to domestic and international financial markets, monitors and manages the financial risks relating to
the operations of the Group through internal risk reports which analyze exposures by degree and magnitude
of risks. These risks include market risk, credit risk and liquidity risk.
The Group sought to minimize the effects of these risks by using derivative financial instruments to hedge
risk exposures. The use of financial derivatives was governed by the Group’s policies approved by the
board of directors, which provided written principles on foreign exchange risk, interest rate risk, credit risk,
the use of financial derivatives and non-derivative financial instruments, and the investment of excess
liquidity. Compliance with policies and exposure limits was reviewed by the internal auditors on a
continuous basis. The Group did not enter into or trade financial instruments for speculative purposes.
a. Market risk
The Group’s activities exposed it primarily to the financial risks of changes in foreign currency
exchange rates. The Group entered into a variety of derivative financial instruments to manage its
exposure to foreign currency risk, including forward foreign exchange contracts to hedge the exchange
rate risk arising on the export.
There had been no change to the Group’s exposure to market risks or the manner in which these risks
were managed and measured.
1) Foreign currency risk
Several subsidiaries of the Group had foreign currency sales and purchases, which exposed the
Group to foreign currency risk. Exchange rate exposures were managed within approved policy
parameters utilizing forward foreign exchange contracts.
The carrying amounts of the Group’s foreign currency denominated monetary assets and monetary
liabilities (see Note 32).
The sensitivity analysis included only outstanding foreign currency denominated monetary items,
and the effect on profit and loss by their translation at the end of the reporting period for a 1%
change in foreign currency rates. A positive number below indicates an increase in post-tax profit
and other equity associated with New Taiwan dollars strengthen 1% against the relevant currency.
For a 1% weakening of New Taiwan dollars against the relevant currency, there would be an equal
and opposite impact on post-tax profit and other equity and the balances below would be negative.
USD Impact EUR Impact
For the Year Ended
December 31
For the Year Ended
December 31
2019 2018 2019 2018
Equity $ 1,499 $ (21,359) $ 114 $ 134
2) Interest rate risk
The Group was exposed to interest rate risk because entities in the Group borrowed funds at floating
interest rates. The risk is managed by the Group by maintaining floating rate borrowings. Hedging
activities are evaluated regularly to align with interest rate views and defined risk appetite, ensuring
the most cost-effective hedging strategies are applied.

- 58 -
The Group’s interest rate risk arises primarily from fixed revenue investment and floating interest
rate borrowings.
The carrying amount of the Group’s financial assets and financial liabilities with exposure to
interest rates at the end of the reporting period were as follows:
December 31
2019 2018
Cash flow interest rate risk
Financial assets $ 473,722 $ 359,241
Financial liabilities 10,817,104 9,314,874
The sensitivity analyses were calculated by a change in fair value of the fixed interest rates financial
assets and liabilities at the end of the reporting period.
If interest rates at end of the reporting period were higher by 1% and all other variables were held
constant, the Group’s cash outflow for the years ended December 31, 2019 and 2018 would have
been increased by $103,434 thousand and $89,556 thousand, respectively.
b. Credit risk
Credit risk refers to the risk that counterparty will default on its contractual obligations resulting in
financial loss to the Group. As at the end of the reporting period, the Group’s maximum exposure to
credit risk which will cause a financial loss to the Group due to failure of counterparties to discharge an
obligation and financial guarantees provided by the Group could arise from:
1) The carrying amount of the respective recognized financial assets as stated in the balance sheets;
and
2) The amount of contingent liabilities in relation to financial guarantee issued by the Group.
The Group direct against the counterparties which deal with materially to providing sufficient collateral
or other right pledged, so that it could minimize credit risk effectively. Management of the Group has
delegated a team responsible for determining credit limits, credit approvals and other monitoring
procedures to ensure that follow-up action is taken to recover overdue debts. In addition, the Group
reviews the recoverable amount of each individual trade debt at the end of the reporting period to ensure
that adequate allowances are made for irrecoverable amounts. In this regard, management believes the
Group’s credit risk was significantly reduced.
The credit risk on liquid funds and derivatives was limited because the counterparties are banks with
high credit ratings assigned by international credit-rating agencies.
The Group did transactions with a large number of customers among different industries and geography
area. Ongoing credit evaluation is performed on the financial condition of trade receivables and, where
appropriate, credit guarantee insurance cover is purchased.
c. Liquidity risk
The Group manages and contains sufficient working capital to support the operations so there is no
liquidity risk of shortage of funds by the maturity date of implementing obligation to the contracts,
reduce the impact on fluctuation of cash flow.
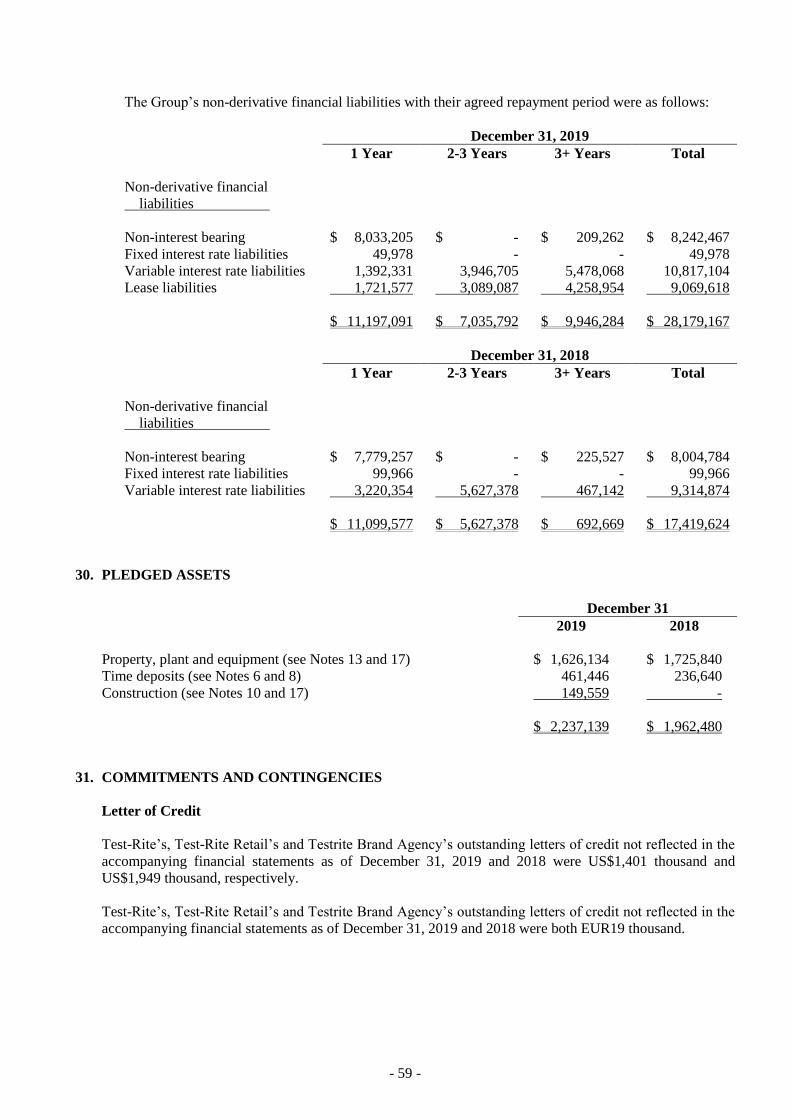
- 59 -
The Group’s non-derivative financial liabilities with their agreed repayment period were as follows:
December 31, 2019
1 Year 2-3 Years 3+ Years Total
Non-derivative financial
liabilities
Non-interest bearing $ 8,033,205 $ - $ 209,262 $ 8,242,467
Fixed interest rate liabilities 49,978 - - 49,978
Variable interest rate liabilities 1,392,331 3,946,705 5,478,068 10,817,104
Lease liabilities 1,721,577 3,089,087 4,258,954 9,069,618
$ 11,197,091 $ 7,035,792 $ 9,946,284 $ 28,179,167
December 31, 2018
1 Year 2-3 Years 3+ Years Total
Non-derivative financial
liabilities
Non-interest bearing $ 7,779,257 $ - $ 225,527 $ 8,004,784
Fixed interest rate liabilities 99,966 - - 99,966
Variable interest rate liabilities 3,220,354 5,627,378 467,142 9,314,874
$ 11,099,577 $ 5,627,378 $ 692,669 $ 17,419,624
30. PLEDGED ASSETS
December 31
2019 2018
Property, plant and equipment (see Notes 13 and 17) $ 1,626,134 $ 1,725,840
Time deposits (see Notes 6 and 8) 461,446 236,640
Construction (see Notes 10 and 17) 149,559 -
$ 2,237,139 $ 1,962,480
31. COMMITMENTS AND CONTINGENCIES
Letter of Credit
Test-Rite’s, Test-Rite Retail’s and Testrite Brand Agency’s outstanding letters of credit not reflected in the
accompanying financial statements as of December 31, 2019 and 2018 were US$1,401 thousand and
US$1,949 thousand, respectively.
Test-Rite’s, Test-Rite Retail’s and Testrite Brand Agency’s outstanding letters of credit not reflected in the
accompanying financial statements as of December 31, 2019 and 2018 were both EUR19 thousand.
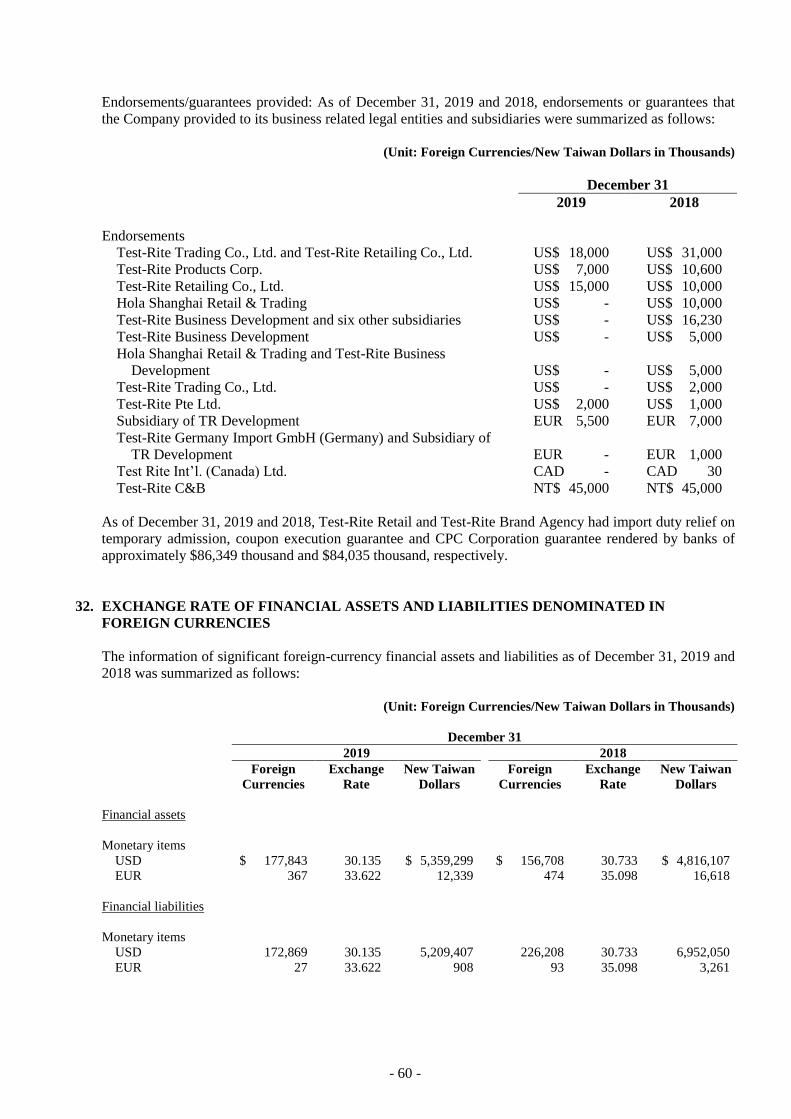
- 60 -
Endorsements/guarantees provided: As of December 31, 2019 and 2018, endorsements or guarantees that
the Company provided to its business related legal entities and subsidiaries were summarized as follows:
(Unit: Foreign Currencies/New Taiwan Dollars in Thousands)
December 31
2019 2018
Endorsements
Test-Rite Trading Co., Ltd. and Test-Rite Retailing Co., Ltd. US$ 18,000 US$ 31,000
Test-Rite Products Corp. US$ 7,000 US$ 10,600
Test-Rite Retailing Co., Ltd. US$ 15,000 US$ 10,000
Hola Shanghai Retail & Trading US$ - US$ 10,000
Test-Rite Business Development and six other subsidiaries US$ - US$ 16,230
Test-Rite Business Development US$ - US$ 5,000
Hola Shanghai Retail & Trading and Test-Rite Business
Development US$ - US$ 5,000
Test-Rite Trading Co., Ltd. US$ - US$ 2,000
Test-Rite Pte Ltd. US$ 2,000 US$ 1,000
Subsidiary of TR Development EUR 5,500 EUR 7,000
Test-Rite Germany Import GmbH (Germany) and Subsidiary of
TR Development EUR - EUR 1,000
Test Rite Int’l. (Canada) Ltd. CAD - CAD 30
Test-Rite C&B NT$ 45,000 NT$ 45,000
As of December 31, 2019 and 2018, Test-Rite Retail and Test-Rite Brand Agency had import duty relief on
temporary admission, coupon execution guarantee and CPC Corporation guarantee rendered by banks of
approximately $86,349 thousand and $84,035 thousand, respectively.
32. EXCHANGE RATE OF FINANCIAL ASSETS AND LIABILITIES DENOMINATED IN
FOREIGN CURRENCIES
The information of significant foreign-currency financial assets and liabilities as of December 31, 2019 and
2018 was summarized as follows:
(Unit: Foreign Currencies/New Taiwan Dollars in Thousands)
December 31
2019 2018
Foreign
Currencies
Exchange
Rate
New Taiwan
Dollars Foreign
Currencies
Exchange
Rate
New Taiwan
Dollars
Financial assets
Monetary items
USD $ 177,843 30.135 $ 5,359,299 $ 156,708 30.733 $ 4,816,107
EUR 367 33.622 12,339 474 35.098 16,618
Financial liabilities
Monetary items
USD 172,869 30.135 5,209,407 226,208 30.733 6,952,050
EUR 27 33.622 908 93 35.098 3,261
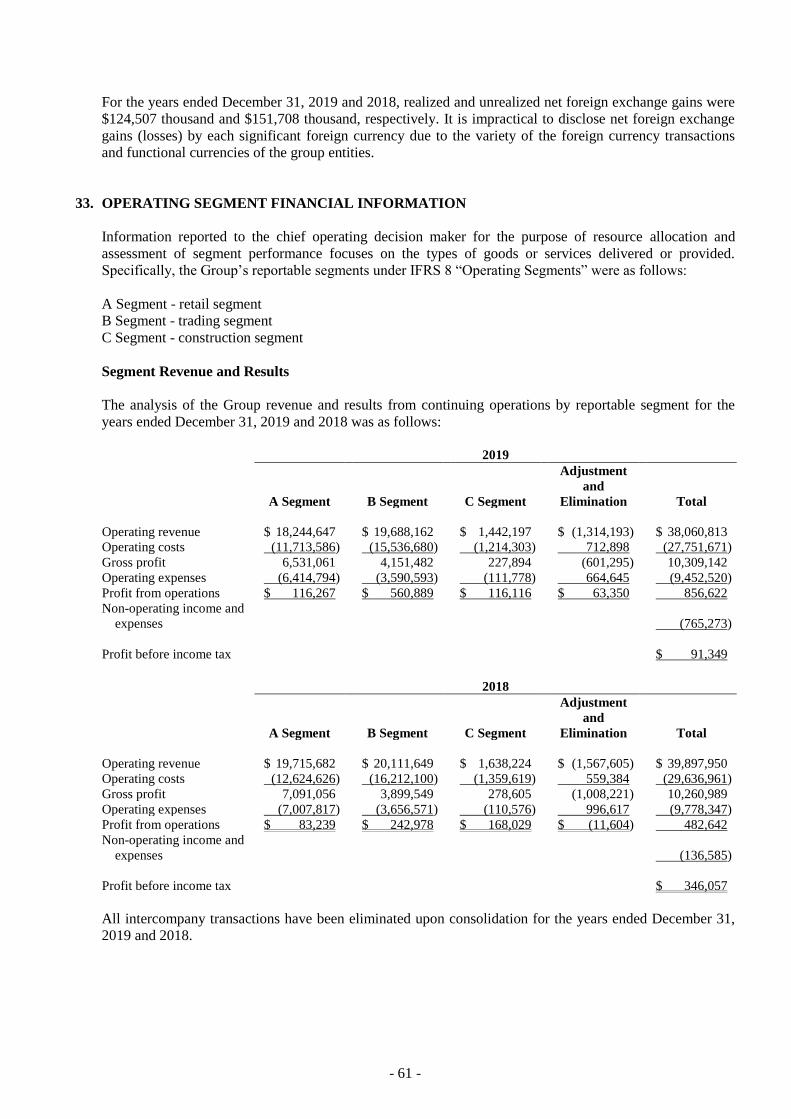
- 61 -
For the years ended December 31, 2019 and 2018, realized and unrealized net foreign exchange gains were
$124,507 thousand and $151,708 thousand, respectively. It is impractical to disclose net foreign exchange
gains (losses) by each significant foreign currency due to the variety of the foreign currency transactions
and functional currencies of the group entities.
33. OPERATING SEGMENT FINANCIAL INFORMATION
Information reported to the chief operating decision maker for the purpose of resource allocation and
assessment of segment performance focuses on the types of goods or services delivered or provided.
Specifically, the Group’s reportable segments under IFRS 8 “Operating Segments” were as follows:
A Segment - retail segment
B Segment - trading segment
C Segment - construction segment
Segment Revenue and Results
The analysis of the Group revenue and results from continuing operations by reportable segment for the
years ended December 31, 2019 and 2018 was as follows:
2019
A Segment B Segment C Segment
Adjustment
and
Elimination Total
Operating revenue $ 18,244,647 $ 19,688,162 $ 1,442,197 $ (1,314,193) $ 38,060,813
Operating costs (11,713,586) (15,536,680) (1,214,303) 712,898 (27,751,671)
Gross profit 6,531,061 4,151,482 227,894 (601,295) 10,309,142
Operating expenses (6,414,794) (3,590,593) (111,778) 664,645 (9,452,520)
Profit from operations $ 116,267 $ 560,889 $ 116,116 $ 63,350 856,622
Non-operating income and
expenses (765,273)
Profit before income tax $ 91,349
2018
A Segment B Segment C Segment
Adjustment
and
Elimination Total
Operating revenue $ 19,715,682 $ 20,111,649 $ 1,638,224 $ (1,567,605) $ 39,897,950
Operating costs (12,624,626) (16,212,100) (1,359,619) 559,384 (29,636,961)
Gross profit 7,091,056 3,899,549 278,605 (1,008,221) 10,260,989
Operating expenses (7,007,817) (3,656,571) (110,576) 996,617 (9,778,347)
Profit from operations $ 83,239 $ 242,978 $ 168,029 $ (11,604) 482,642
Non-operating income and
expenses (136,585)
Profit before income tax $ 346,057
All intercompany transactions have been eliminated upon consolidation for the years ended December 31,
2019 and 2018.
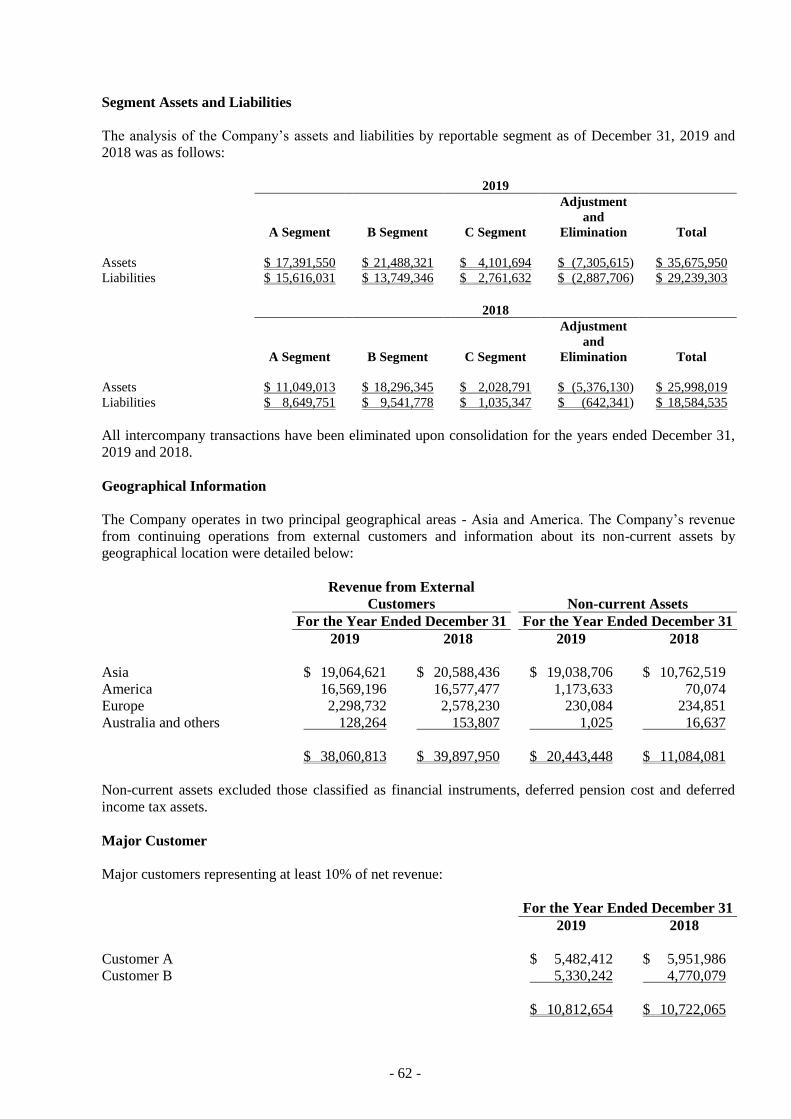
- 62 -
Segment Assets and Liabilities
The analysis of the Company’s assets and liabilities by reportable segment as of December 31, 2019 and
2018 was as follows:
2019
A Segment B Segment C Segment
Adjustment
and
Elimination Total
Assets $ 17,391,550 $ 21,488,321 $ 4,101,694 $ (7,305,615) $ 35,675,950
Liabilities $ 15,616,031 $ 13,749,346 $ 2,761,632 $ (2,887,706) $ 29,239,303
2018
A Segment B Segment C Segment
Adjustment
and
Elimination Total
Assets $ 11,049,013 $ 18,296,345 $ 2,028,791 $ (5,376,130) $ 25,998,019
Liabilities $ 8,649,751 $ 9,541,778 $ 1,035,347 $ (642,341) $ 18,584,535
All intercompany transactions have been eliminated upon consolidation for the years ended December 31,
2019 and 2018.
Geographical Information
The Company operates in two principal geographical areas - Asia and America. The Company’s revenue
from continuing operations from external customers and information about its non-current assets by
geographical location were detailed below:
Revenue from External
Customers Non-current Assets
For the Year Ended December 31 For the Year Ended December 31
2019 2018 2019 2018
Asia $ 19,064,621 $ 20,588,436 $ 19,038,706 $ 10,762,519
America 16,569,196 16,577,477 1,173,633 70,074
Europe 2,298,732 2,578,230 230,084 234,851
Australia and others 128,264 153,807 1,025 16,637
$ 38,060,813 $ 39,897,950 $ 20,443,448 $ 11,084,081
Non-current assets excluded those classified as financial instruments, deferred pension cost and deferred
income tax assets.
Major Customer
Major customers representing at least 10% of net revenue:
For the Year Ended December 31
2019 2018
Customer A $ 5,482,412 $ 5,951,986
Customer B 5,330,242 4,770,079
$ 10,812,654 $ 10,722,065

- 63 -