Test Plan [Revamping Aggregate Property Requirements for ...
37
0-6617-P2 TEST PLAN Authors: Dr. David Fowler Dave Whitney John "Chris" Clement Zachary Stutts TxDOT Project 0-6617: Revamping Aggregate Property Requirements for Portland Cement Concrete AUGUST 2011, PUBLISHED SEPTEMBER 2012 Performing Organization: Center for Transportation Research The University of Texas at Austin 1616 Guadalupe, Suite 4.202 Austin, Texas 78701 Sponsoring Organization: Texas Department of Transportation Research and Technology Implementation Office P.O. Box 5080 Austin, Texas 78763-5080 Performed in cooperation with the Texas Department of Transportation and the Federal Highway Administration.
Transcript of Test Plan [Revamping Aggregate Property Requirements for ...
0-6617-P2
TEST PLAN Authors: Dr. David Fowler Dave Whitney John "Chris" Clement Zachary Stutts
TxDOT Project 0-6617: Revamping Aggregate Property Requirements for Portland Cement Concrete
AUGUST 2011, PUBLISHED SEPTEMBER 2012
Performing Organization: Center for Transportation Research The University of Texas at Austin 1616 Guadalupe, Suite 4.202 Austin, Texas 78701
Sponsoring Organization: Texas Department of Transportation Research and Technology Implementation Office P.O. Box 5080 Austin, Texas 78763-5080
Performed in cooperation with the Texas Department of Transportation and the Federal Highway Administration.

ii

1
P2 Overview
This document contains a summary of the testing to be conducted under TxDOT project 0-6617. A description is provided for all tests, as well as an explanation of the property that is to be measured by each test. Collection status of aggregates and a short-term general testing timeline is also discussed in this document. This document is provided to fulfill the requirements of Task 4 of the project, and represents P2, a short report to summarize the Test Plan for the project.
This document will be incorporated into the final comprehensive report that will be delivered at the end of the project.
Questions or comments concerning this document should be directed to the research team at earliest convenience.

2
Collection of Aggregates
Of the 33 aggregate sources listed in the most recent document provided by TxDOT, the research team has successfully acquired 23 of these sources. The remaining 10 sources have been sampled by producers and are at TxDOT district yards awaiting pick-up. The following tables detail the status of specific sources.
Aggregates Present at the Lab
Source Coarse Fine
Alamo Weir X X
Capitol Austin River X X
TXI Garfield X X
TXI Webberville X X
TXI Webberville ‐ D9 Crushed X
Capitol Brownlee X X
Capitol Marble Falls X X
Hanson Burnet X X
RTI Yearwood X X
Texas Crushed Stone Feld X X
Lone Star Richland X X
Trinity Cottonwood 1204 X X
Cemex McKelligon Dolomite X X
Cemex McKelligon Granite X
Cemex Section 10 X X
TXI Bridgeport X X
Colorado Hunter X X
Hanson Servtex X X
H&B Horseshoe Bend X X
Hanson Whitney X X
Miller Springs Miller X X
Multisources Adamcek X X
Fordyce Murphy X X

3
Aggregates Prepared for Delivery
Source Coarse Fine
Bowles S&G Avalon X X
Martin Marietta Beckman X
Martin Marietta Bird Hill X X
Martin Marietta Solms Road X X
South Texas Chapman X X
Vulcan 1604 X
Vulcan Knippa X X
Aquilla S&G Aquilla X X
Trinity Kopperl X X
TBK Materials Cooke County X X
Project Director Michael Dawidczik recently proposed the addition of six more aggregates of interest. The research team is willing to investigate the properties of the following aggregates.
Additional Sources (Recently Added)
Source Coarse Fine
Armor Aggregates Armor X
RE Janes Woods X X
Smith Buster Byrd* X
Martin Marietta North Troy X X
TXI Mill Creek X X
Hanson Little River* X X
Lattimore Mico #68 X X *coarse aggregates present at lab through another project
To expedite data collection while waiting for aggregate sources to arrive over the past several months, the research team took advantage of the fact that there are several interesting aggregates, both coarse and fine, available at the lab due to ongoing testing by other projects. The following sources are being tested but are not necessarily part of the original list of aggregates.
4
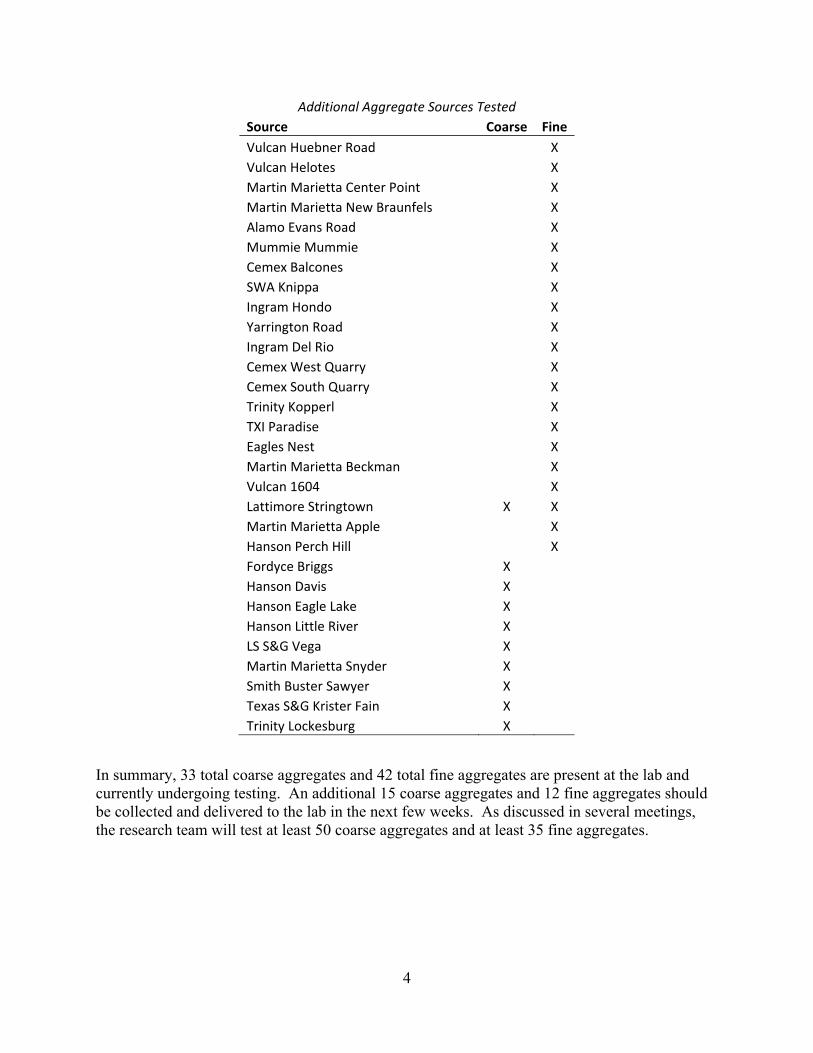
Additional Aggregate Sources Tested
Source Coarse Fine
Vulcan Huebner Road X
Vulcan Helotes X
Martin Marietta Center Point X
Martin Marietta New Braunfels X
Alamo Evans Road X
Mummie Mummie X
Cemex Balcones X
SWA Knippa X
Ingram Hondo X
Yarrington Road X
Ingram Del Rio X
Cemex West Quarry X
Cemex South Quarry X
Trinity Kopperl X
TXI Paradise X
Eagles Nest X
Martin Marietta Beckman X
Vulcan 1604 X
Lattimore Stringtown X X
Martin Marietta Apple X
Hanson Perch Hill X
Fordyce Briggs X
Hanson Davis X
Hanson Eagle Lake X
Hanson Little River X
LS S&G Vega X
Martin Marietta Snyder X
Smith Buster Sawyer X
Texas S&G Krister Fain X
Trinity Lockesburg X
In summary, 33 total coarse aggregates and 42 total fine aggregates are present at the lab and currently undergoing testing. An additional 15 coarse aggregates and 12 fine aggregates should be collected and delivered to the lab in the next few weeks. As discussed in several meetings, the research team will test at least 50 coarse aggregates and at least 35 fine aggregates.
5
Testing Timeline Overview
Based on a rough time estimate performed by the research team, we hope to finish testing of aggregates that we currently have by the end of June.
Thermal conductivity and XRD have not been run yet. Thermal conductivity testing will be a two-stage study to determine the variability, stand deviation, and necessary sample size. Testing for XRD (15 sources) and thermal conductivity (15 sources) will begin in May. The following section (“Aggregate Test Methods”) has further information about the thermal conductivity test method. XRD testing has shown to take 3-4 hours per sample and will be tested as equipment is available at TxDOT.
Aggregate sources that will arrive at the lab in the next few weeks will begin undergoing testing in June. Concrete mixing and testing (10-15 sources) will begin in July. Task 6 (Correlating Laboratory Test Results with Performance) will begin at the end of July.
6
Aggregate Test Methods
Coarse aggregate testing is the main research focus in project 0-6617, and as such, 50-100 samples are to be tested under this project. Fine aggregates are also to be studied, however only 35-50 samples are to be tested in this project. The selection of test methods to be conducted on samples was not to be limited to currently utilized methods; rather, the goal was to identify the aggregate properties most important for producing a quality portland cement concrete and identifying and selecting tests that will best meet this goal. Special attention is to be given to common failures seen by the Texas Department of Transportation (TxDOT) in an attempt to identify the specific property which caused the distress. This action will provide the basis for selecting the best set of tests and corresponding limits to properly screen aggregates in the future. As a result of the Project Workshop summarized in deliverable P1, TxDOT agreed to perform some of the tests that are in current use for aggregate specifications but are not likely to be selected for future use in aggregate selection. A breakdown of the testing selected, based on critical aggregate properties, and a brief description of tests is presented below.
COARSE AGGREGATE TESTS
Coarse aggregate tests were selected based on a review of literature, a review of other state DOT specifications, and a discussion with personnel in industry and academia. Because this research project is funded by TxDOT, TxDOT standards were used when possible. Otherwise, ASTM standards or other widely accepted test methods were used to ensure repeatable and consistent results. Members of the research team were certified on several tests by TxDOT to ensure that standard procedures were followed correctly.
In the following sections, the test methods are listed and followed by a general background, description of procedures, documentation of precision, and comments regarding the approach of the research team for each test.
Micro-Deval Test for Coarse Aggregates
French researchers developed the Micro-Deval test which subjects water, coarse aggregate, and steel charge to approximately 12,000 revolutions in a steel drum via a ball mill roller. Researchers in Canada further modified this test to allow for a larger aggregate sample size and slightly altered dimensions of the steel charge and drum (C. Rogers). Today, most Micro-Deval specifications are based on the standards documented by the Canadian researchers. The standard used by this research project was Tex-461-A (Degradation of Coarse Aggregate by Micro-Deval Abrasion).
The Micro-Deval test requires that the aggregate sample be washed and dried prior to testing. A standard gradation is specified for concrete aggregate for this test and provided in Table 1. The total mass of the sample should be 1500 ± 5-g.
7
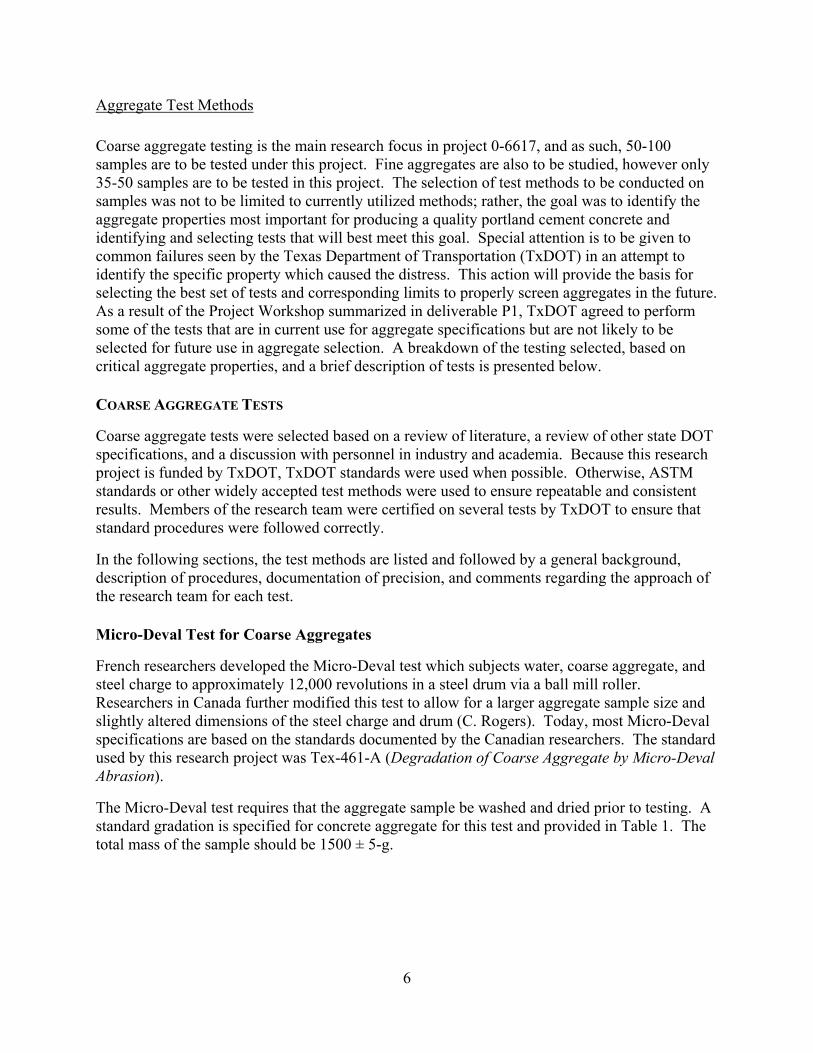
Table 1: Coarse Aggregate Gradation Required for Micro-Deval Test (Tex-461-A)
Sieve Size Target Mass
3/4" - 1/2" 660 ± 5 g
1/2" - 3/8" 330 ± 5 g
3/8" - 1/4" 330 ± 5 g
1/4" – No. 4 180 ± 5 g
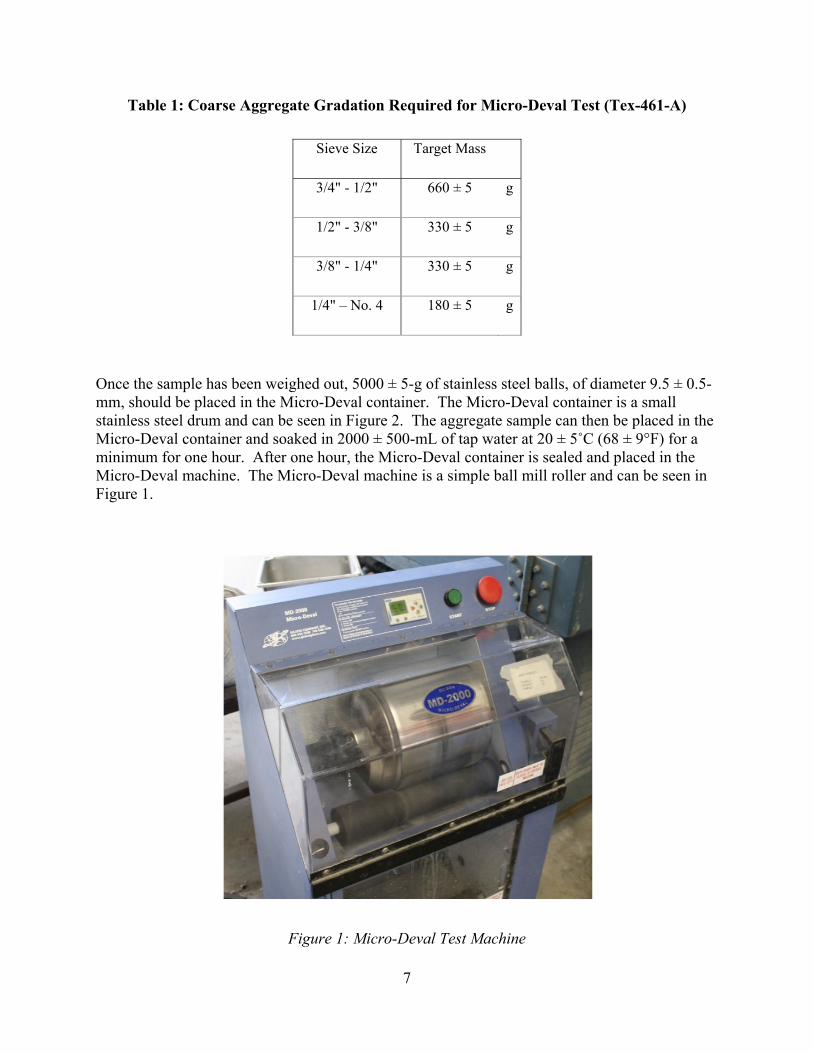
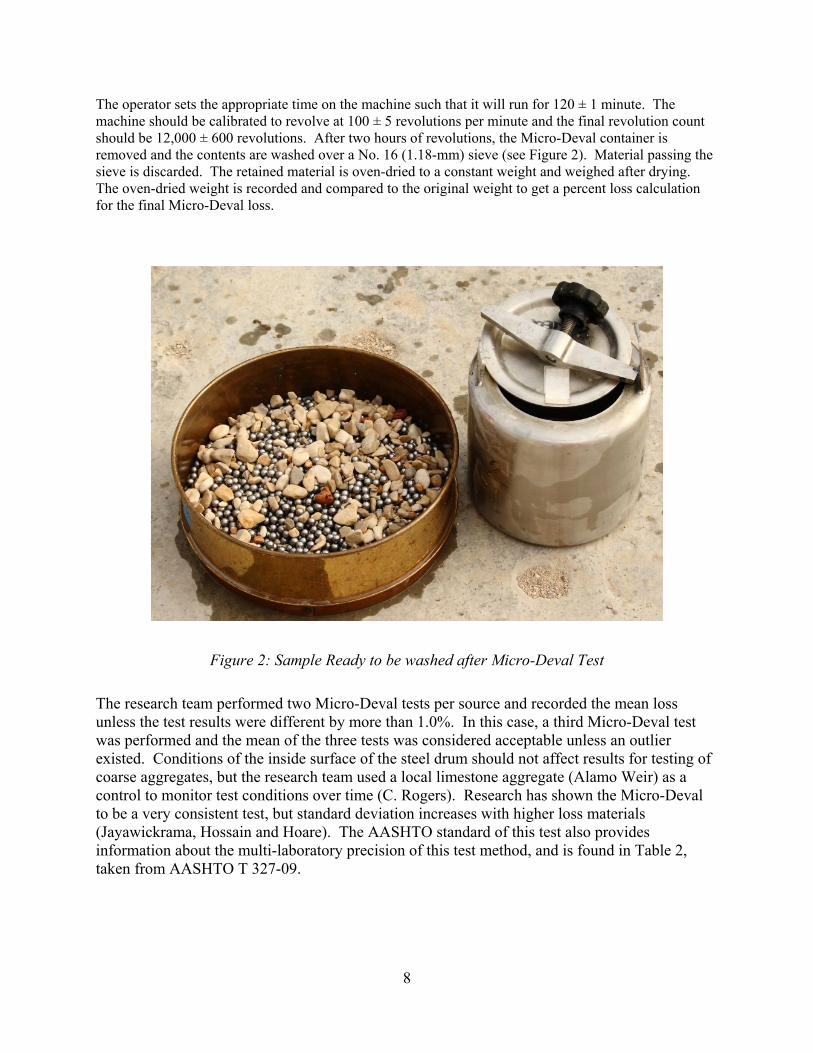
Once the sample has been weighed out, 5000 ± 5-g of stainless steel balls, of diameter 9.5 ± 0.5-mm, should be placed in the Micro-Deval container. The Micro-Deval container is a small stainless steel drum and can be seen in Figure 2. The aggregate sample can then be placed in the Micro-Deval container and soaked in 2000 ± 500-mL of tap water at 20 ± 5˚C (68 ± 9°F) for a minimum for one hour. After one hour, the Micro-Deval container is sealed and placed in the Micro-Deval machine. The Micro-Deval machine is a simple ball mill roller and can be seen in Figure 1.
Figure 1: Micro-Deval Test Machine
8
The operator sets the appropriate time on the machine such that it will run for 120 ± 1 minute. The machine should be calibrated to revolve at 100 ± 5 revolutions per minute and the final revolution count should be 12,000 ± 600 revolutions. After two hours of revolutions, the Micro-Deval container is removed and the contents are washed over a No. 16 (1.18-mm) sieve (see Figure 2). Material passing the sieve is discarded. The retained material is oven-dried to a constant weight and weighed after drying. The oven-dried weight is recorded and compared to the original weight to get a percent loss calculation for the final Micro-Deval loss.
Figure 2: Sample Ready to be washed after Micro-Deval Test
The research team performed two Micro-Deval tests per source and recorded the mean loss unless the test results were different by more than 1.0%. In this case, a third Micro-Deval test was performed and the mean of the three tests was considered acceptable unless an outlier existed. Conditions of the inside surface of the steel drum should not affect results for testing of coarse aggregates, but the research team used a local limestone aggregate (Alamo Weir) as a control to monitor test conditions over time (C. Rogers). Research has shown the Micro-Deval to be a very consistent test, but standard deviation increases with higher loss materials (Jayawickrama, Hossain and Hoare). The AASHTO standard of this test also provides information about the multi-laboratory precision of this test method, and is found in Table 2, taken from AASHTO T 327-09.

9
Table 2: Multi-Laboratory Precision Values for Micro-Deval Testing of Coarse Aggregate (AASHTO T 327-09)
Specific Gravity and Absorption Test for Coarse Aggregates
The specific gravity and absorption test requires that a representative sample of an aggregate be obtained and soaked for 15 to 24 hours, depending on the exact standard used. The aggregate is then dried to saturated surface dry state, weighed in a calibrated pycnometer, and dried to an oven-dry state as described by the following procedures. The standard used by the research team was Tex-403-A (Saturated Surface-Dry Specific Gravity and Absorption of the Aggregates).
After a representative sample of aggregate is obtained, the aggregate is soaked (in a non-metal tub to avoid reaction) to ensure that all permeable pores of the aggregate become filled with water. The water should be at a temperature of 23 ± 2˚C (73 ± 3˚F). After the soaking period, the operator removes the aggregate and places it on a towel or cloth to absorb free moisture. The operator should dry the aggregate with the towel or cloth until no moisture can be seen on the surface of the aggregate particles. At this point, the aggregate has reached the saturated surface dry (SSD) condition where the outside surface of the aggregate has no free water but all internal pores remain filled with water. The aggregate is then placed in a container with a lid so that free evaporation does not remove additional moisture from the aggregate. This step should be repeated until approximately 1500 g (3.31-lb) of aggregate in the SSD state has been obtained and the weight of this sample recorded.
While the SSD aggregate is covered, the mass of a controlled volume of water must be measured. The controlled volume of water is obtained by filling a calibrated pycnometer with water at 23 ± 2˚C (73 ± 3˚F). The pycnometer is a 2000-mL mason jar with a metal pycnometer cap. A rubber bulb or syringe is used to fill the pycnometer with water until a rounded bead of water can be seen on top of the pycnometer cap. The outside of the pycnometer is dried and the pycnometer is weighed and this weight recorded. The pycnometer cap can be removed and the jar can be emptied until about ¼ of the water remains. At this point, the SSD aggregate is placed in the pycnometer. The operator should take extra care in placing aggregate in the pycnometer so that all material is accounted for. The jar is filled with water at 23 ± 2˚C (73 ± 3˚F) until it reaches the brim. The pycnometer should be agitated so that any entrapped air is freed. The pycnometer cap is again placed on the jar and a rubber bulb or syringe is used to fill the pycnometer until a rounded bead of water can be seen on top of the pycnometer cap. The outside of the pycnometer is dried and the pycnometer with aggregate is weighed and this weight recorded.
10
Finally, the aggregate is removed from the pycnometer, placed in a pan, and the pan placed in an oven where the aggregate is dried to constant mass. The weight of the aggregate at SSD, the weight of the pycnometer with water, and the weight of the pycnometer with aggregate are used to calculate the specific gravity and absorption capacity of the aggregate. Specific gravity is typically reported to the nearest 0.01 and absorption to the nearest 0.1% (Texas Department of Transportation).
According to the ASTM standard of this test (ASTM C 127), the standard deviation is 0.007 for SSD specific gravity for single-operator, and 0.011 for SSD specific gravity for multi-laboratory testing. The acceptable range of two results is 0.020 and 0.032 respectively (ASTM International).
Because this test is somewhat variable, the research team ran at least two tests per aggregate source. If the results of these two tests deviated more than the amount dictated by the ASTM C 127-07 standard, a third test was run and an average value taken of all three tests unless one test was determined to be an outlier.
Los Angeles Abrasion and Impact Test
The Los Angeles abrasion and impact test is performed on a sample of approximately 5000 g of aggregate. The aggregate sample, along with several large stainless steel balls, are loaded in the Los Angeles machine (pictured in Figure 3) and rotated approximately 500 times at about 33 rpm. The aggregate sample is then removed and sieved over a No. 12 (1.70-mm) sieve. The mass of material loss is determined as a percentage of the original sample mass to get the final LA abrasion results. The standard used by the research team was Tex-410-A (Abrasion of Coarse Aggregate Using the Los Angeles Machine), which simple refers to procedures described in ASTM C 131 (Resistance to Degradation of Small-Sized Coarse Aggregate by Abrasion and Impact in the Los Angeles Machine) and is described as follows.

11
Figure 3: LA Abrasion Test Setup (Diagram from ASTM C 131)
The Los Angeles machine is a large, rotating steel drum with an inside diameter of 711 ± 5 mm (28 ± 0.2 in.) and inside width of 508 ± 5 mm (20 ± 0.2 in.). The steel walls of the machine are no less than 12.4-mm (0.49-in.) thick. A steel shelf is also located inside the drum and protrudes 89 mm (3.5 in.) into the drum. The function of the steel shelf is to cause the aggregate and steel shot to be lifted and dropped repeatedly as the drum rotates. A steel plate, with handles and a gasket seal, functions as the access point for the drum through which the aggregate and steel shot is placed. The Los Angeles machine should be calibrated to run at 30-33 revolutions per minute. The Los Angeles machine setup is displayed in Figure.
Prior to performing the LA abrasion test, a representative sample of aggregate must be obtained, washed, and oven-dried. The LA abrasion test can be performed on several sample gradations, so the amount of each size fraction necessary will depend on the gradation. This project used ASTM C 131 Grade B, which consists of 2500 ± 10 g of aggregate passing the 19.0-mm (¾-in.)
12
sieve and retained on the 12.5-mm (1/2-in.) sieve, and 2500 ± 10 g of aggregate passing the 12.5-mm (1/2-in.) sieve and retained on the 9.5-mm (3/8-in.) sieve. This grading requires that 11 steel spheres be placed in the Los Angeles machine along with the aggregate. The steel spheres should be approximately 47 mm (1.9 in.) in diameter and weigh between 390 g and 445 g. The total mass of the steel shot should thus be 4584 ± 25-g.
Once the correct mass of aggregate and steel shot is obtained, the operator places both materials in the Los Angeles machine. A counter is set at 500 revolutions and the machine is started. After the prescribed number of revolutions, the operator places a catch pan beneath the machine and removes the contents. The steel spheres are cleaned, removed, and placed aside for the next test. The aggregate sample is then sieved over a No. 12 (1.70-mm) sieve and the finer material is discarded. The remaining aggregate is weighed and this weight is recorded as the final mass. The operator may wet-sieve the material, but this is only necessary if dust remains adhered (and accounts for more than 0.2% of original mass) to the aggregate particles after initial sieving. The final LA abrasion loss is calculated as a percentage of mass lost compared to the original sample.
According to ASTM C 131-06, the single-operator coefficient of variance is approximately 2.0%, and thus two tests run by the same operator should not differ by more than 5.7%. The multi-laboratory coefficient of variance is 4.5% and thus two tests should not differ by more than 12.7% (ASTM International).
To expedite testing, TxDOT construction materials laboratory volunteered to test aggregates for the LA abrasion test and provide results to the research team. Members of the research team prepared samples and delivered samples in batches to the TxDOT laboratory.
Magnesium Sulfate Soundness Test
The sulfate soundness of aggregates can be measured by using a magnesium sulfate solution or a sodium sulfate solution. This test involves cycles (typically five) of soaking an aggregate in a sulfate solution and then drying the aggregate. This test was originally developed in 1828 to simulate freezing of water in stone before refrigeration was controllable and widely available (Rogers, Bailey and Price). The idea was to simulate crystallization pressures of ice formation during freezing and thawing events by causing salt crystals to form during the heating stage of this test (Folliard and Smith). Of the state DOTs that do use the sulfate soundness test, twenty-eight states specify the use the use of sodium sulfate, nine states specify the use of magnesium sulfate, and two states allow the use of either magnesium sulfate or sodium sulfate. Eleven states do not use sulfate soundness testing. The standard method used for this project was Tex-411-A (Soundness of Aggregate Using Sodium Sulfate or Magnesium Sulfate).
Prior to performing the magnesium sulfate soundness test, a representative sample of aggregate must be obtained, washed, and oven-dried. The gradation of the sample to be tested for concrete aggregates is listed in Table 3. The magnesium sulfate solution must also be prepared in advance and allowed to sit for 48 hours prior to testing. The solution is prepared by adding magnesium sulfate in anhydrous or crystalline hydrate form to water at a temperature of at least 25˚C (75˚F) until the solution is beyond saturated (evident by presence of excess crystals). After allowing the solution to sit and cool to room temperature, the specific gravity of the magnesium sulfate solution should be between 1.295 and 1.308.

13
Table 3: Concrete Aggregate Size Fractions for Magnesium Sulfate Soundness Testing (Tex-411-A)
Sieve Size Target Mass
¾-in. - ½-in. 670 ± 10 g
½-in. - 3/8-in. 330 ± 5 g
3/8-in. - ¼-in. 180 ± 5 g
¼-in. - No. 4 120 ± 5 g
After the solution and aggregate sample have been prepared, the operator places each fraction of aggregates in individual containers with holes (to allow for fluid circulation and draining) and submerges the container in the solution for 16 to 18 hours. The solution should be maintained at 20˚C to 24˚C (68˚F to 75˚F). After the submersion period, the sample is removed, drained for 15 min, and dried to constant mass in an oven. After drying, the sample is removed from the oven, allowed to cool to room temperature, and placed back in the magnesium sulfate solution. This process is repeated for a total of five cycles. After the fifth cycle, the sample is removed from the oven, allowed to cool to room temperature, and then washed by circulating hot water through the sample containers. After all salt is removed by washing, the aggregates are again dried in the oven. The aggregates are then sieved over their respective retained sieve sizes and a mass loss is calculated for each fraction size. This information is then used in combination with a normalized aggregate gradation (provided in Tex-411-A) to obtain the final magnesium sulfate loss.
Both sulfate soundness tests have fairly low precision and repeatability. According to the ASTM standard for the sulfate soundness tests, the coefficient of variation for a magnesium sulfate test (with total loss between 9% and 20%) is 25% (ASTM International).
To expedite testing, TxDOT construction materials laboratory volunteered to test aggregates for the magnesium sulfate soundness test and provide results to the research team. Members of the research team prepared samples and delivered samples in batches to the TxDOT laboratory.
Aggregate Impact Value
The aggregate impact value (AIV) is a British standard test method that subjects a confined aggregate sample to a falling impact load. A sample of aggregate, passing the ½-in. (12.5-mm) sieve and retained on the 3/8-in. (9.5-mm) sieve, of approximately 500-g in mass (depending on the density) is placed in a steel cup 38-cm (15-in.) below a steel hammer the same diameter as the inside of the cup. The user drops the steel hammer, guided by vertical rods, and raises it 15 times and the sample is sieved over a No. 8 (2.36-mm) sieve. The mass loss is recorded and the final result of the test is mass loss by percentage of original mass. The specific test method used by this research project was British Standard 812 Part 112 (Methods for Determination of Aggregate Impact Value) and the procedures are described in this section.
14
The required apparatus to operate this test consists of a cylindrical metal base, a cylindrical steel cup, a metal hammer, and a means for raising and dropping the hammer in a controlled manner. The cylindrical metal base should be between 22 and 30-kg (48 and 66-lb) and should be affixed to a concrete block no less than 450-mm (17.7-in.) thick. The cylindrical steel cup should have an internal diameter of 102 ± 0.5-mm (4.0 ± 0.02-in.), a depth of 50 ± 0.25-mm (1.97-in ± 0.01-in.), and should have a thickness of at least 6-mm (0.24-in.) The metal hammer should have a mass between 13.5 and 14.0-kg (29.8 and 30.9-lb) and should fit snugly inside the metal cup. The hammer should be supported such that it may freely slide vertically and drop from a height of 380 ± 5-mm (15.0 ± 0.2-in.). The test setup used by this research project is shown in Figure 4.
To begin the test, an oven-dry sample of aggregate, passing the ½-in. (12.5-mm) sieve and retained on the 3/8-in. (9.5-mm) sieve, of at least 500-g in mass should be obtained and placed in the metal cup. The operator then uses a tamping rod to compact the aggregate by dropping the rod in a controlled manner 25 times at a height of 50-mm (1.97-in.) above the sample. Any aggregate that protrudes above the edge of the cup is removed. The mass should be recorded so that additional tests on the same aggregate source use the same mass. The user then places the cup in the testing apparatus below the hammer. The cup is secured to the testing apparatus and the operator raises and drops the hammer 15 times, waiting at least 1 second between drops. The cup is removed and then the aggregate sample is removed from the cup and sieved over the 2.36-mm (No. 8) sieve. The amount of material passing the 2.36-mm (No. 8) sieve divided by the original mass is the aggregate impact value (BSi).

15
Figure 4: Aggregate Impact Value Test Setup
The aggregate sample may be tested in a dry or SSD condition. The research team tested aggregates in the dry condition and ran the test four times per sample. The mean value of the four tests was recorded as the AIV. Repeatability and reproducibility of this test vary by lithology and can be found in British Standard 812 part 112.
Aggregate Crushing Value
The aggregate crushing value (ACV) test is a British standard that subjects an aggregate sample to confined compression using a machine typically used for compression testing of concrete cylinders. Approximately 2500-g of aggregate passing the ½-in. (12.5-mm) sieve and retained on the 3/8-in. (9.5-mm) sieve is placed in a cylindrical containment apparatus consisting of steel plates and a steel ring. The aggregate is compressed for approximately 10-min. at a constant load rate, until the force has reached 400-kN (90,000-lb). The standard test method used by this research project was British Standard 812 Part 110 (Methods for Determination of Aggregate Crushing Value) and the procedures are described in the following section.
The testing components for the aggregate crushing value include an open-ended steel cylinder, a plunger, and a base plate. The cylinder should have a diameter of 154 ± 0.5-mm (6.06 ± 0.02-in.), a depth of 125 to 140-mm (4.92 to 5.51-in.), and a wall thickness of at least 16.0-mm (0.63-in.). The plunger should have a diameter of 152 ± 0.5-mm (5.98 ± 0.02-in.) and an overall length of 100 to 115-mm (3.94-in. to 4.53-in.). The baseplate should be a square with side lengths of
16
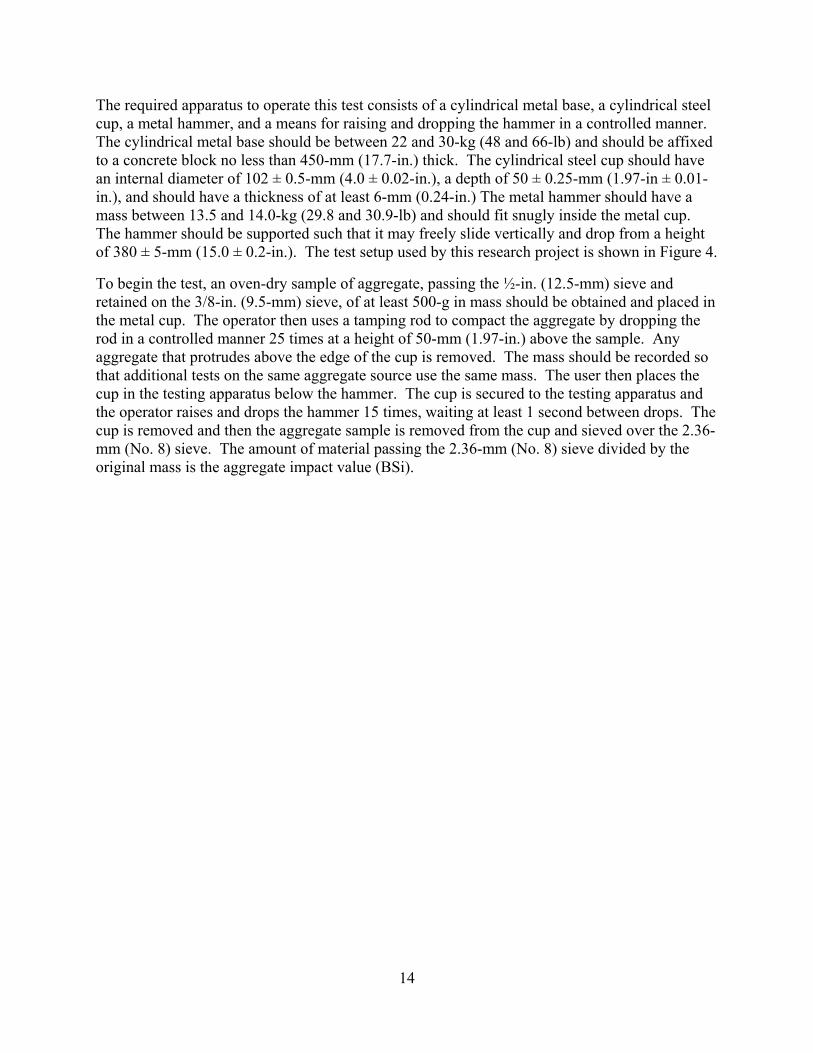
200 to 230-mm (7.87 to 9.06-in.) and a minimum thickness of 10-mm (0.39-in.). These components are pictured in Figure 5.
Figure 5: Equipment Used for Aggregate Crushing Value Test
To begin the test, an oven-dry sample of aggregate, passing the ½-in. (12.5-mm) sieve and retained on the 3/8-in. (9.5-mm) sieve, of at least 1500-g in mass should be obtained. The cylinder should be placed on the base plate and aggregate is placed in the cylinder in three layers, each layer subjected to 25 tamps from a tamping rod. The total depth of the aggregate sample in the cylinder should be about 100-mm (3.9-in) after the three layers are added. The aggregate surface should be leveled and then the plunger is then placed on top of the aggregate. The entire apparatus is loaded into a compression testing machine (as shown in Figure 5) and the aggregate is compressed for 10 ± 0.5 min. at a constant load rate, until the force has reached 400-kN (90,000-lb). The operator then releases the load and removes the testing apparatus. The testing apparatus is disassembled and the aggregate is removed by tapping a rubber mallet on the side of the cylinder. The aggregate sample should be sieved over the 2.36-mm (No. 8) sieve. The amount of material passing the 2.36-mm (No. 8) sieve divided by the original mass is the aggregate crushing value. At least two tests should be performed and the mean recorded (BSi).
The research team performed this test three times per aggregate source and recorded the mean of the three tests as the aggregate crushing value. Repeatability and reproducibility of this test vary by lithology and can be found in British Standard 812 part 110.
17
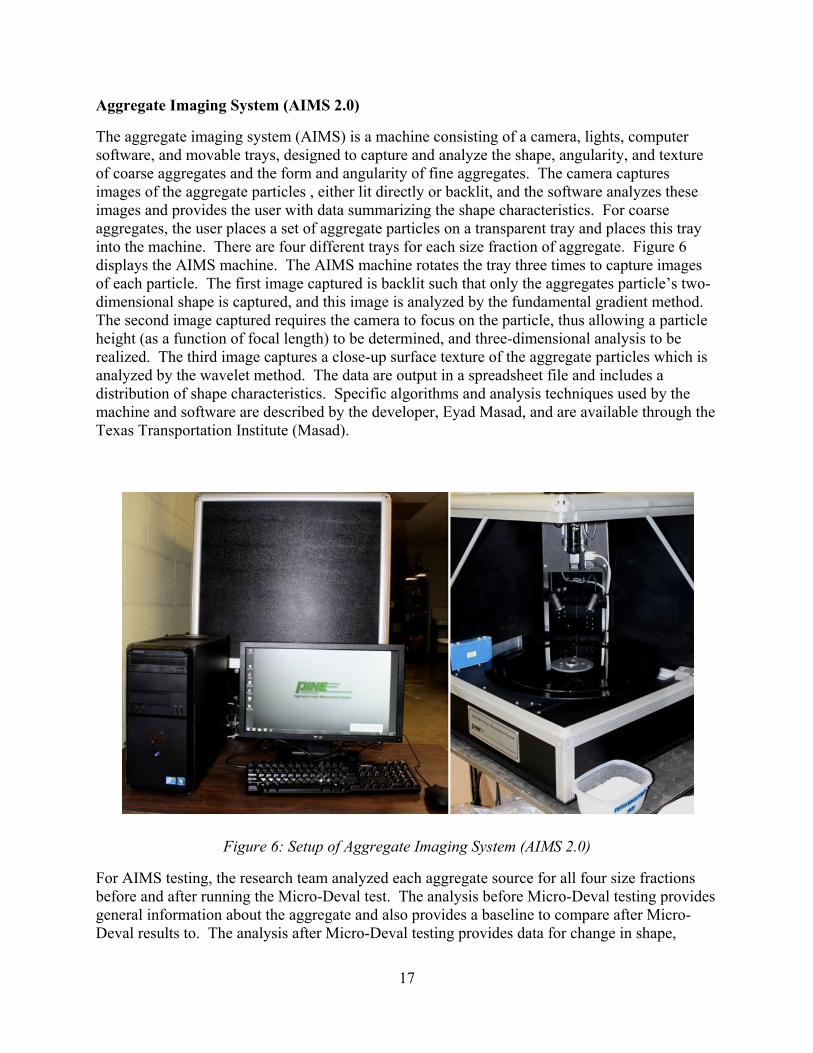
Aggregate Imaging System (AIMS 2.0)
The aggregate imaging system (AIMS) is a machine consisting of a camera, lights, computer software, and movable trays, designed to capture and analyze the shape, angularity, and texture of coarse aggregates and the form and angularity of fine aggregates. The camera captures images of the aggregate particles , either lit directly or backlit, and the software analyzes these images and provides the user with data summarizing the shape characteristics. For coarse aggregates, the user places a set of aggregate particles on a transparent tray and places this tray into the machine. There are four different trays for each size fraction of aggregate. Figure 6 displays the AIMS machine. The AIMS machine rotates the tray three times to capture images of each particle. The first image captured is backlit such that only the aggregates particle’s two-dimensional shape is captured, and this image is analyzed by the fundamental gradient method. The second image captured requires the camera to focus on the particle, thus allowing a particle height (as a function of focal length) to be determined, and three-dimensional analysis to be realized. The third image captures a close-up surface texture of the aggregate particles which is analyzed by the wavelet method. The data are output in a spreadsheet file and includes a distribution of shape characteristics. Specific algorithms and analysis techniques used by the machine and software are described by the developer, Eyad Masad, and are available through the Texas Transportation Institute (Masad).
Figure 6: Setup of Aggregate Imaging System (AIMS 2.0)
For AIMS testing, the research team analyzed each aggregate source for all four size fractions before and after running the Micro-Deval test. The analysis before Micro-Deval testing provides general information about the aggregate and also provides a baseline to compare after Micro-Deval results to. The analysis after Micro-Deval testing provides data for change in shape,
18
angularity, and texture. Some researchers have hypothesized that the change in shape, angularity, and texture will provide useful data for characterizing the abrasion resistance of an aggregate.
Mahmoud et al. (2010) found the AIMS to have a coefficient of variance of 11% for any give source (single operator) and a coefficient of variance of 5% for the same set of aggregates (single operator). Mahmoud et al. (2010) concluded that the effects of random placement of the same aggregate particles in different orientations had minimal effects on the angularity. In experiments with two AIMS machines (single operator) and multiple operators (single AIMS machine), the angularity measurements were found to be highly correlated (R2 = 0.97 and R2 = 0.98 respectively) as were texture measurements (R2 = 0.97 and R2 = 0.92), however slope and intercept for texture was not 1 and 0. Thus, it seems that the texture measurement is not as repeatable as the angularity measurement.
Thermal Conductivity
Thermal properties, such as thermal conductivity, are important in understanding and predicting concrete behavior for applications such as continuously reinforced concrete pavements (CRCP) or mass pours. If thermal properties are not thoroughly understood or accounted for, thermal cracking may occur. Thermal properties are also input parameters for some computer programs such as ConcreteWorks.
There is currently no standard test method for measuring the thermal conductivity of aggregates. However, researchers have determined a method for evaluating the thermal conductivity of aggregate using a Mathis TCi Thermal Conductivity Analyzer. The Mathis TCi Thermal Conductivity Analyzer is a tool for rapid, non-destructive thermal conductivity and effusivity testing which can be used for solids, liquids, powders, and pastes. This machine operates based on the “modified transient place source technique. It uses a one-sided, interfacial, heat reflectance sensor that applies a momentary, constant heat source to the sample” (Mathis Instruments Ltd.). A known current is applied to a heating element and the temperature rise at the sensor-material interface causes a change in voltage. The thermal conductivity of the material being tested is inversely proportional to the change in voltage. This test is completed in a matter of seconds and the thermal conductivity range that can be tested is 0 to 100 W/mK. Software provided with the machine creates output data in the form of a spreadsheet (Mathis Instruments Ltd.).
The minimum sample size required for testing is 0.67-in. (17-mm). The research team plans to obtain large aggregate particles with a 3/4-in. (19-mm) minimum dimension and use a mechanical polisher to get a clean, polished, and even surface. The minimum sample thickness required for testing is 0.02-in. (0.5-mm) but because the calibration material is 3/8-in. (9.5-mm) thick, the research team will attempt to polish aggregates to a thickness of 3/8-in. (9.5-mm). Because aggregates in concrete are effectively saturated, it will be more relevant to test aggregate samples in a saturated state rather than a dry state. Therefore after polishing, aggregates will be soaked for 24 hours prior to testing.
According to the manufacturer, the accuracy of the Mathis TCi Thermal Conductivity Analyzer is better than 5% and the precision is better than 1% (Mathis Instruments Ltd.). Because some aggregate sources, particularly river gravels, are composed of a wide range of minerals, the
19
research team will prepare and test approximately 15 samples per source to ensure that the source is accurately represented.
Petrographic Analysis
Petrographic examination is typically performed by a trained and experienced petrographer, knowledgeable of local geology, following ASTM C 295 (A Guide for Petrographic Examination of Aggregates for Concrete). As part of the petrographic examination, petrographers identify key constituents and proportions of an aggregate sample using a variety of tools including microscopes, cameras, polishing/grinding wheels, and a variety of hand tools.
The petrographic examination of aggregates collected in this research project was performed by a trained TxDOT petrographer. Members of the research team provided a 100-g raw sample of each aggregate to the TxDOT petrographer and analysis results were relayed to the research team.
X-Ray Diffraction
X-ray diffraction (XRD) is an advanced analysis technique that sometimes requires the material of interest to be ground to a fine powder (depending on the exact analysis method). A diffractometer, which fires an incident X-ray beam at the sample and receives the scattered beam, is used to gather data. Output from X-ray diffraction appears as a plot of scattering intensity versus scattering angle. From this plot, peaks can be identified which correspond to individual material components of sample.
The research team will prepare samples for XRD analysis by crushing and pulverizing raw coarse aggregate samples. A representative 2500-g sample will be obtained and crushed to pass the 1/4-in. (6.25-mm) sieve. This material will be reduced to a 100-g sample by splitting the original sample. This 100-g sample will be pulverized to pass the No. 100 (150-μm). The new pulverized sample will be taken to the TxDOT laboratory where it will undergo a final grind to pass the No. 325 (45-μm) sieve. This sample will then be subjected to XRD analysis. Researchers will be trained to use the X-ray diffractometer at the TxDOT laboratory.
Fine Aggregate Tests
Fine aggregate tests were selected based on a review of literature, a review of other state DOT specifications, and a discussion with personnel in industry and academia. Because this research project is funded by TxDOT, TxDOT standards were used when possible. Otherwise, ASTM standards or other widely accepted test methods were used to ensure repeatable and consistent results.
Micro-Deval Test for Fine Aggregates
The Micro-Deval test for fine aggregates is very similar to the Micro-Deval test for coarse aggregates. A standard gradation of sand, ranging from No. 8 (2.36-mm) to No. 200 (75-μm), is placed in the Micro-Deval container along with steel charge and soaked for one hour prior to testing. The Micro-Deval container is then rotated for 15 min at approximately 100 revolutions per minute. The sample material is then removed and washed over a No .200 (75-μm) sieve.

20
The remaining material is oven-dried and weighed and the relative amount of material lost, as a percentage, signifies the final Micro-Deval loss. The standard test method used by the research team was ASTM D 7428 (Resistance of Fine Aggregate to Degradation by Abrasion in the Micro-Deval Apparatus) and is described in the following section.
The Micro-Deval test requires that the sample aggregate be washed over the No. 200 (75-μm) sieve and dried prior to testing. A standard gradation is specified for concrete aggregate for this test and provided in Table 4. The total mass of the sample should be 500 ± 5-g.
Table 4: Fine Aggregate Gradation Required for Micro-Deval Test (ASTM D 7428)
Sieve Size Target Mass
No. 4 – No. 8 50 g
No. 8 – No. 16 125 g
No. 16 – No. 30 125 g
No. 30 – No. 50 100 g
No. 50 – No. 100 75 g
No. 100 – No. 200 25 g
Total 500 ± 5 g
Once the sample has been weighed, 1250 ± 5-g of stainless steel balls, of diameter 9.5 ± 0.5-mm, should be placed in the Micro-Deval container. The Micro-Deval container is a small stainless steel drum and can be seen in Figure 2. The aggregate sample can then be placed in the Micro-Deval container and soaked in 750 ± 50-mL of tap water a temperature of 20 ± 5˚C (68 ± 9°F) for a minimum for one hour. After one hour, the Micro-Deval container is sealed and placed in the Micro-Deval machine. The Micro-Deval machine is a simple ball mill roller and can be seen in Figure 1.
The operator sets the appropriate time on the machine such that it will run for 15 minutes. The machine should be calibrated to revolve at 100 ± 5 revolutions per minute and the final revolution count should be 1500 ± 10 revolutions. After fifteen minutes of revolutions, the Micro-Deval container is removed and the contents are washed over a No. 200 (75-μm) sieve. Material passing the sieve is discarded. The retained material is oven-dried to a constant weight and weighed after drying. The oven-dried weight is recorded and compared to the original weight to get a percent loss calculation for the final Micro-Deval loss.

21
The research team performed two Micro-Deval tests per source and recorded the mean loss, unless the test results were different by more than 1.0%. In this case, a third Micro-Deval test was performed and the mean of the three tests was considered acceptable unless an outlier existed. The inside surface of the stainless steel drum can affect the results of the Micro-Deval test for fine aggregates, so it is recommended that a reference sand be run periodically. Testing of carbonate sands can lead to “polishing” of the steel drum surface which has been shown to affect test results (C. Rogers).
According to the ASTM standard, the single-operator coefficient of variation is approximately 3.4% and the multi-laboratory coefficient of variation in approximately 8.7% (ASTM International).
Specific Gravity and Absorption Test for Fine Aggregates
The specific gravity and absorption test for fine aggregate requires that a representative sample of an aggregate approximately 3000-g in mass and passing the No. 4 (4.75-mm) sieve be obtained and soaked for at least 24 hours. The aggregate is then dried to saturated surface dry state, weighed in a calibrated pycnometer, and dried to an oven-dry state as described by the following procedures. The standard used by the research team was Tex-403-A (Saturated Surface-Dry Specific Gravity and Absorption of the Aggregates).
After a representative sample of aggregate is obtained, the aggregate is soaked (in a non-metal tub to avoid reaction) to ensure that all permeable pores of the aggregate become filled with water. The water should be at a temperature of 23 ± 2˚C (73 ± 3˚F). After the soaking period, the operator removes a sample of the fine aggregate and places it a clean, smooth surface such as a metal pan. The sample is spread out and allowed to air dry for several hours. While drying, the operator should stir the sand periodically to ensure that none of the sample gets drier than the saturated surface dry state. Some standards allow the use of external heat, but the TxDOT test method does not. Drying may take several hours or several days depending on the aggregate sample. A fan may be used to accelerate convection and thus speed the drying time. To determine if the sample is at SSD, the operator places a metal cone (wide end down) on a metal base plate and fills the cone with sand until slightly overflowing. The operator then lightly tamps the sand in the cone 25 times by dropping the tamper about 5-mm (0.2-in.) above the surface of the fine aggregate. The moisture condition of the fine aggregate sample will be evident upon lifting the cone. If the material slumps completely, then it is too dry. If the material maintains its shape completely, then it is too wet. A sample in the SSD condition should slump slightly. Test materials are pictured in Figure 7.

22
Figure 7: Testing a Sand for Specific Gravity and Absorption
At this point, the aggregate has reached the saturated surface dry (SSD) condition. The operator should be obtain and immediately weight approximately 1200-g of aggregate in the SSD. Next, the SSD aggregate is placed in the pycnometer which should be calibrated by the same methods described in Section Specific Gravity and Absorption Test for Coarse Aggregates. The operator should take extra care in placing aggregate in the pycnometer so that all material is accounted for. The jar is filled with water at 23 ± 2˚C (73 ± 3˚F) until it reaches the brim. The pycnometer should be agitated so that any entrapped air is freed. The pycnometer cap is again placed on the jar and a rubber bulb or syringe is used to fill the pycnometer until a rounded bead of water can be seen on top of the pycnometer cap. The outside of the pycnometer is dried and the pycnometer with aggregate is weighed and this weight recorded.
Finally, the aggregate is removed from the pycnometer, placed in a pan, and the pan placed in an oven where the aggregate is dried to constant mass. The weight of the aggregate at SSD, the weight of the pycnometer with water, and the weight of the pycnometer with aggregate are used to calculate the specific gravity and absorption capacity of the aggregate. Specific gravity is typically reported to the nearest 0.01 and absorption to the nearest 0.1% (Texas Department of Transportation).
The research team noticed that allowing the sand to cool to room temperature also allowed an uptake of moisture from the air. A pan of oven-dry sand could easily gain a few tenths of a percent of mass from moisture in the air alone in a matter of minutes, thereby skewing absorption values. Therefore, it is recommended that the sand be weighed immediately after removal from the drying oven.

23
Aggregate Imaging System (AIMS 2.0)
The aggregate imaging system (AIMS) is a machine consisting of a camera, lights, computer software, and movable trays, designed to capture and analyze the shape, angularity, and texture of coarse aggregates and the form and angularity of fine aggregates. The camera captures images of the aggregate particles , either lit directly or backlit, and the software analyzes these images and provides the user with data summarizing the shape characteristics. The camera in the AIMS apparatus is capable of capturing particles as small as 75-μm (retained on the No. 200 sieve).
For fine aggregates, the user places a set of fine aggregate particles (separated by fraction size) on an opaque tray and places this tray into the machine. The AIMS machine analyzes at least 150 particles for analysis for each size fraction. After the AIMS machine has analyzed one size fraction, the user removes the tray, cleans it, and places the next size fraction of fine aggregate on the tray. This process is repeated until all size fractions have been analyzed. Because the fine aggregate particles are so small, many of them touch as they are distributed across the tray by the operator. Fortunately recent advances in the AIMS technology include a touching particle factor (TPF) to eliminate inaccurate angularity analysis of fine aggregates where particles touch or overlap (Mahmoud, Gates and Masad). Output from the AIMS consists of quantified measurements of form and angularity for each particle, and a mean and standard deviation of each value as well. Aggregates typically follow a standard statistical distribution. The research team performed AIMS analysis of fine aggregate before Micro-Deval and after Micro-Deval to determine if a change in form and angularity would provide meaningful data.
Flakiness Sieve
After observing problems in field compact of HMA, Rogers and Gorman in Ontario sought to develop an inexpensive and quick test to determine a measurement of flakey particles in a sand. Past research has demonstrated that sands in excess of 30% flakey particles may have issues during compaction of hot mix asphalt. Rogers and Gorman realized that slotted sieves, traditionally used for seeds and grains, could also be used to evaluate fine aggregate (Rogers and Gorman). There is currently no accepted standard for this flakiness test for fine aggregate, but Rogers and Gorman have provided a description of this test and its procedures in the appendix of their 2008 paper entitled “A Flakiness Test for Fine Aggregates”.
The flakiness sieve test, described by Rogers and Gorman, uses two slotted sieves with slots of 1.8-mm and 1.0-mm respectively. The fine aggregate is sieved and broken down into separate size fractions. The sand retained on the No. 8 (2.36-mm) sieve is placed on the 1.8-mm slotted sieve and agitated. The same is done for the sand retained on the No. 16 (1.18-mm) sieve, except the 1.0-mm slotted sieve is used. The operator uses a set of tweezers to ensure that all flakey particles pass through the slots. All particles passing through the slotted sieves are considered flakey, and the final results are calculated by mass. Rogers and Gorman recommend testing at least 60-g of fine aggregate per fraction size to obtain a representative result. To calculate the final flakiness value, the results from the No. 8 and No. 16 can be averaged, or a weighted average can be calculated based on the gradation of the fine aggregate of interest.
Researchers tested each fine aggregate for flakiness using the test method described by Rogers and Gorman. Slotted grain sieves 200-mm (8-in.) in diameter meeting ISO 5223 were obtained

24
from Endecott. Fine aggregate samples were obtained by first oven-drying and sieving a sample, and then using a mechanical splitter. At least three flakiness tests of 20.0-g each were run per fraction size, thus a total of at least 120.0-g was tested for each fine aggregate source.
Grace Methylene Blue Test
Because there is an inherent degree of subjectivity to the AASHTO methylene blue test (AASHTO TP 57), researchers at W.R. Grace & Co. sought to improve this test method by removing subjectivity and enhancing repeatability and reproducibility. The test developed by Grace is similar to the traditional AASHTO test, but the test is performed on an entire sample of sand (not just the microfines) and uses a UV colorimeter to analyze the color of the final filtered solution sample. The new methylene blue test allows the entire sample to be measured, which is important because all clay in the sand is measured which ensures more representative results.
W.R. Grace & Co. generously supplied the testing equipment and test procedures for their Grace methylene blue test. Testing materials needed for this test include a Hach DR 850 Colorimeter, a micropipette, a portable balance, several plastic and glass test tubes, a plastic weigh boat, a 3-mL syringe with luer-lok adapter, and a 0.2-μm syringe filter. Prior to testing a fine aggregate sample, the concentration of methylene blue solution should be calculated and a correction factor used if the solution concentration differs from 0.50% by weight.
Once the methylene blue solution concentration is confirmed, a slightly moist sample of fine aggregate weighing at least 20-g should be obtained. A sample of 20-g of sand should be weighed and added to a 45-mL plastic test tube with 30-g of methylene blue solution. The tube should be capped and agitated for one minute. A three minute rest period should follow and then the sample should be agitated for an additional minute. Approximately 2-mL of this test solution should be transferred to a 3-mL syringe with a luer-lok filter fitted. The syringe should be depressed such that 0.5 – 1.0-mL of solution is filtered and transferred to a new 1-mL plastic tube. Using the micro-pipette, 130-μL of solution is transferred from the 1-mL plastic tube to a new, empty 45-mL plastic test tube. The 130-μL sample is diluted by adding water to make the total diluted solution 45-g. The 45-mL plastic tube is then capped and mixed. Next, the diluted solution is transferred to a clean 16-mm glass tube and is ready to be measured by the colorimeter. Before measuring the diluted solution, the colorimeter should be zeroed by measuring a sample of water. Finally, the diluted solution can be measured by the colorimeter. The output of the colorimeter is a reading of milligrams of methylene blue per gram of sand. After using the correction factor, the methylene blue value can be divided by 1.60 to obtain an equivalent amount of sodium montmorillonite clay (W.R. Grace & Co.).
The research team performed three Grace methylene blue tests per sample. Researchers at Grace determined that reproducibility and repeatability were comparable to the traditional AASHTO method (Koehler, Jeknavorian and Chun).
When performing this test, researchers noticed that when placing the sand in the initial weigh dish, the entire sample was not successfully transferred to the 45-mL test tube. A small amount of microfines remained adhered to the initial weigh dish or was fine enough to disperse into the air as the sample was being transferred. This error led to changes of up to 0.3% final clay content. As a result, researchers recommend placing the sand sample directly into the 45-mL test tube after tarring the scale appropriately.

25
Organic Impurities
In the organic impurities test, a fine aggregate sample is subjected to a sodium hydroxide solution and allowed to remain undisturbed to react for 24 hours. Any organic material in the sample will react with the sodium hydroxide solution to produce a dark liquid. The operator examines the color of the supernatant liquid and if it is darker than a standardized color, the fine aggregate is subjected to a 7-day mortar cube strength test. The fine aggregate is typically deemed to have an unacceptable amount of organic content if the compressive strength of the mortar cube is less than 90-95% of a control sample. The standard test method used by the research team was Tex-408-A (Organic Impurities in Fine Aggregates for Concrete) and is described in the following section.
Materials needed for this test include small glass bottles with volume of 12 to 16 oz. (355 to 473-mL), a Gardner glass color standard, and 3% sodium hydroxide solution. An air-dried sample of approximately 300-g should be obtained prior to testing. The glass bottle should be filled with the air-dried sand up to the 4.5-oz (133-mL) mark. A small amount of sodium hydroxide (enough to cover the sample) should be added to the glass bottle. The bottle should be capped and shaken. More sodium hydroxide is then added to the 7-oz (207-mL) mark and the bottle is capped and shaken again. The bottle is then placed aside and allowed to sit undisturbed for 24 hours. After the 24-hour resting period, the operator should observe the color of the supernatant liquid and compare it to the Gardner color standard. If the color of the liquid is darker than the Gardner No. 11, the fine aggregate is subjected to a 7-day mortar cube strength test. The fine aggregate is typically deemed to have an unacceptable amount of organic content if the compressive strength of the mortar cube is less than 95% of a control sample (Texas Department of Transportation).
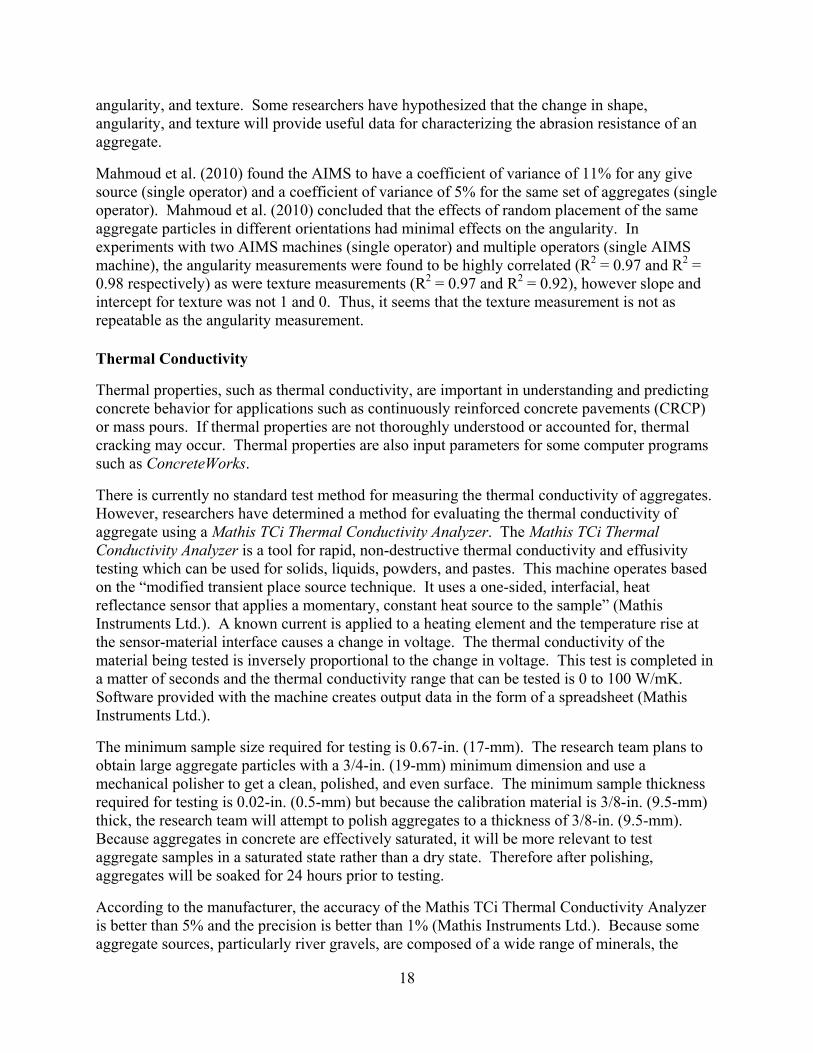
Sand Equivalent
The sand equivalent test is a test method that is used to determine the proportion of “detrimental fine dust of clay-like particles in soils or fine aggregates” (Texas Department of Transportation). This test subjects a fine aggregate sample to a flocculating solution (calcium chloride) in order to separate fine particles from the coarser sand. The higher the sand equivalent value, the cleaner the sand is perceived to be. The standard test method used by researchers for this test was Tex-203-F (Sand Equivalent Test) and it is described in the following section.
Materials needed for this test include calcium chloride solution, a transparent graduated plastic cylinder, rubber stopper, agitator tube, an 85-mL (3-oz.) measuring can, weighted foot assembly, 3.8-L glass bottle, and plastic or rubber tubing. The graduated plastic cylinder should have a 1.25-in. (31.8-mm) inside diameter and a height of approximately 17-in. (432-mm). To prepare the calcium chloride solution, 577-g of ACS calcium chloride dehydrate should be dissolved in a 1.9-L of distilled water. This solution should be further diluted by adding 88-cc of the solution to 3.8-L of distilled water. This final solution is the working calcium chloride solution. All mixing and dilution should be performed at 22 ± 3˚C (72 ± 5˚F). The workstation should be setup such that the calcium chloride solution is located 914 ± 25-mm (3-ft. ± 1-in.) above the work surface and can be siphoned into the graduated plastic cylinder.
Prior to testing, a representative, oven-dried fine aggregate sample of at least 500-g should be obtained. This material should be sieved over the No. 4 (4.75-mm) sieve to remove any coarse
26
material. After obtaining the sample material, the operator siphons calcium chloride solution into the graduated plastic cylinder such that the measurement reading is 101.6 ± 2.5-mm (4 ± 0.1-in.). The operator fills the 85-mL (3-oz.) measuring can with sample material and then slowly scrapes a scapula at a 45˚ angle over the measuring can to remove excess sand and ensure that 85-mL of bulk sand is obtained. The sample is then transferred to the graduated plastic cylinder. The cylinder is then agitated to remove air bubbles and allowed to sit for 10 ± 1 minutes (see Figure 8-A). The operator then stops the cylinder and places it in the mechanical sand equivalent shaker for 45 ± 1 seconds. The stopper is removed and the agitator is forced through the material with a gentle twisting and jabbing motion as the cylinder is rotated about its vertical axis (see Figure 8-B). This process should be continued so that all microfines and clay material are flushed from the coarse material until the level of the liquid reaches 381-mm (15-in.). The cylinder is allowed to sit for 20 ± 0.25-min and then the operator reads the level at the top of the clay layer. This value is recorded as the clay reading. Figure 8-C displays the sand equivalent test at this point for a sand with an unusually high clay reading. The operator then obtains the sand reading by gently dropping the weighted foot assembly into the cylinder until it comes to rest on the sand layer. The sand reading is calculated by subtracting 254-mm (10-in.) from the top indicator level. The final sand equivalent (SE) value is calculated by dividing the sand reading by the clay reading and multiplying by 100.
Figure 8: Sand Equivalent Testing
27
As per the Tex-203-F specification, the researchers performed this test twice per source and calculated the mean value. If the two tests differed by more than four points, a third test is performed and the mean of all three recorded. If the three tests differ by more than four points, the test results are discarded and the test must be performed again. The sand equivalent reading is typically reported to the nearest whole number.
According to the ASTM standard of this test (ASTM D 2419), the single-operator standard deviation is 1.5 for SE values greater than 80 and 2.9 for SE values less than 80. Therefore, two tests should not differ by more than 4.2 for SE values greater than 80 and 8.2 for SE values less than 80 (ASTM International). This precision is reflected by the Tex-203-F test standard which requires discarding results differing by more than 4 points.
Acid Insoluble Residue
The acid insoluble residue test is one way of determining carbonate content of fine aggregate. In this test, a fine aggregate sample is subjected to hydrochloric acid and carbonate aggregates are dissolved by the acid while siliceous aggregates remain. The standard test method used by researchers for this project was Tex-612-J (Acid Insoluble Residue for Fine Aggregate) and the procedures for this test are described in the following section.
Materials needed for this test include a 2000-mLbeaker, a stirring rod, a porcelain filtration apparatus, No. 2 filter paper, plastic tubing, a drying dish, and a hydrochloric acid solution. Prior to testing, a representative, oven-dried fine aggregate sample of at least 500-g should be obtained. From this sample, 25-g of fine aggregate is placed in the 2000-mL beaker. The operator places the beaker in a fume hood and slowly adds hydrochloric acid until reaction ceases. An additional 25-mL of hydrochloric acid is added and stirred to ensure complete reaction. The remaining solution is decanted without loss of any sample material and then the remaining sample and solution is filtered over a No. 2-H filter paper. The filter paper is placed over the porcelain filtration apparatus such that distilled water can be washed over the sample to remove all acid without removing remaining aggregate. The filter paper, with remaining aggregate sample, is then oven-dried for two hours, and the final mass is recorded. The final mass of the sample is compared to the original mass to calculate the acid insoluble residue percentage by weight (Texas Department of Transportation).
The research team performed three tests per source and calculated a mean value to report as the acid insoluble residue for that source.
Petrographic Analysis
Petrographic examination is typically performed by a trained and experienced petrographer, knowledgeable of local geology, following ASTM C 295 (A Guide for Petrographic Examination of Aggregates for Concrete). As part of the petrographic examination, petrographers identify key constituents and proportions of an aggregate sample using a variety of tools including microscopes, cameras, polishing/grinding wheels, and a variety of hand tools.
The petrographic examination of aggregates collected in this research project was performed by a trained TxDOT petrographer. Members of the research team provided a 100-g raw sample of
28
each aggregate to the TxDOT petrographer and analysis results were relayed to the research team.
X-ray Diffraction
X-ray diffraction (XRD) is an advanced analysis technique that sometimes requires the material of interest to be ground to a fine powder (depending on the exact analysis method). A diffractometer, which fires an incident X-ray beam at the sample and receives the scattered beam, is used to gather data. Output from X-ray diffraction appears as a plot of scattering intensity versus scattering angle. From this plot, peaks can be identified which correspond to individual material components of sample.
Samples for XRD analysis will be prepared by crushing and pulverizing raw fine aggregate samples. A representative 100-g sample of fine aggregate will be pulverized to pass the No. 100 (150-μm). The new pulverized sample will be taken to the TxDOT laboratory where it will undergo a final grind to pass the No. 325 (45-μm) sieve. This sample will then be subjected to XRD analysis. Researchers will be trained to use the X-ray diffractometer at the TxDOT laboratory.
Concrete Tests
In order to relate aggregate tests to performance criteria, the research team decided to conduct mechanical concrete tests with the coarse aggregate as the only variable. Ideally, performance histories of aggregates would be available and could be used to rate an aggregate as “good”, “fair”, or “poor”, but unfortunately this information is not always readily available. As a result, researchers will attempt to glean data and interpret results of mechanical concrete tests and their relation to the aggregate tests.
The concrete mixture design was selected such that it is a volume controlled concrete mixture meeting requirements for TxDOT CoTE testing. As such, the concrete mixture will be a Class P pavement mixture with Type I cement from Alamo Cement. No supplementary cementitious materials or admixtures will be used. The fine aggregate will function as a control and is a clean, natural river sand that has been obtained from TXI Webberville.
Researchers hope to begin mixing concrete samples soon and will cast ten 4-in. x 8-in. (100-mm x 200-mm) cylinders and three 4-in. x 4-in. x 14-in. (100-mm x 100-mm x 255-mm) beams per aggregate source. A total of 10 to 15 aggregate sources will be used for mixing and casting concrete.
Compressive Strength
Compressive strength testing of concrete is a common quality control procedure to ensure that the concrete is hydrating properly and that strength is gained at the necessary rate. The research team will cast 4-in. x 8-in. (100-mm x 200-mm) concrete cylinders, and use Tex-418-A (Compressive Strength of Cylindrical Concrete Specimens) to determine the compressive strength of these concrete mixtures. The Tex-418-A standard simply refers users to the ASTM version of this test, which is ASTM C 39 (Compressive Strength of Cylindrical Concrete Specimens). The procedures of this test are discussed in the following section.
29
The compression testing machine available to the research team is a Forney FX-700, more than capable of performing this test within the prescribed constraints. Other necessary equipment such as steel caps and neoprene bearing pads were also available to the research team. After curing the cylindrical concrete specimens for 28 days (± 20 hours), the specimens are removed from the curing room and placed in a 5-gallon bucket full of water so that the specimen remains moist until immediately prior to testing. The operator then takes the steel caps and places the neoprene bearing pads inside the steel caps. After 100 tests, or the first visible sign of cracking, the neoprene pads should be discarded, and replaced with new pads. The operator then removes the concrete specimen from the water and places the caps on both ends of the specimen. The concrete specimen is then placed in the compression machine. The operator should ensure that the surface of the bearing blocks in the machine is free from debris, and that the specimen is centrally placed on the blocks. At this point, the cage or screen on the testing machine is closed and locked for the safety of the test operator. The operator can then begin applying load to the specimen. The load should be applied at a rate of 0.25 ± 0.05 MPa/s (35 ± 7 psi/s) which means that the test may take several minutes, depending on the strength of the specimen. This load rate should be held as constant as possible for the duration of the test. The test is complete when the specimen displays a “well-defined fracture pattern” and supports no additional load. The operator then removes the load from the specimen, notes the fracture pattern, and records the final load. The final load divided by the average cross-sectional area of the specimen is the strength of the specimen (ASTM International).
For 4-in. x 8-in. (100-mm x 200-mm) specimens with strengths between 17 and 32 MPa (2500 and 4700 psi), the coefficient of variation for single-operator use has been found to be 3.2%. Therefore, the acceptable range of individual cylinder strengths is 9.0% for two cylinders or 10.6% for three cylinders (ASTM International). The research team will test the compressive strength of 3 specimens per aggregate source, with testing to be performed at 28 days.
Modulus of Elasticity
The modulus of elasticity is an important property of concrete because it will dictate the stress imposed by a given strain. Strains, caused by thermal expansion for example, will cause higher stresses for concrete with higher elastic modulus of elasticity. Modulus of elasticity in the linear range can be calculated by obtaining two data points of stress and strain in the linear elastic range. The most common test method for measuring modulus of elasticity of concrete in compression is ASTM C 469 (Static Modulus of Elasticity and Poisson’s Ratio of Concrete in Compression). The research team will use ASTM C 469 to determine the modulus of elasticity for several concrete mixtures.
The two main pieces of equipment necessary to perform this test are a compression testing machine and a compressometer. The compressometer is a device that fits around the concrete cylinder and is capable of measuring very precise changes in length between two gauge points. The gauge points should be separated by a distance at least three times the length of the maximum size aggregate. The deformation may be measured by a dial gauge, strain gauge, or by a linear variable transformer. Prior to the test, a matching cylinder should be tested in compression so that the ultimate load can be determined.

30
To begin the test, the operator removes a concrete cylinder from a curing room or bath, attaches the compressometer, and places the assembly in the compression testing machine. The specimen should be loaded twice, such that the first loading is used to correct any errors in the placement of the compressometer. During the second loading, the load rate should be 250 ± 50 kPa/s (35 ± 7 psi/s). The applied load and the longitudinal strain should be recorded when the longitudinal strain reaches 50 millionths and when the applied load reaches 40% of the ultimate load (as determined from the previous test). The modulus of elasticity can then be calculated by determining the slope of the stress-strain curve from a simple equation provided in ASTM C 469 (ASTM International).
Researchers plan on performing two modulus of elasticity tests per coarse aggregate for a total of 10 to 15 sources. Researchers will test one concrete cylinder in compression to obtain the ultimate strength, then test two cylinders for modulus of elasticity, and then test the same two cylinders for compressive strength.
According to ASTM C 469, the results of tests of two cylinders from the same batch should be no more than 5% different (ASTM International).
Flexural Strength
Flexural strength of concrete is important for resistance to tension and cracking. Flexural strength is typically determined by subjecting an unreinforced concrete beam to flexure by imposing one or two point loads in the middle of the span. The TxDOT method used by the research team is Tex-448-A (Flexural Strength of Concrete Using Simple Beam Third-Point Loading) and simply refers the user to ASTM C 78 (Flexural Strength of Concrete).
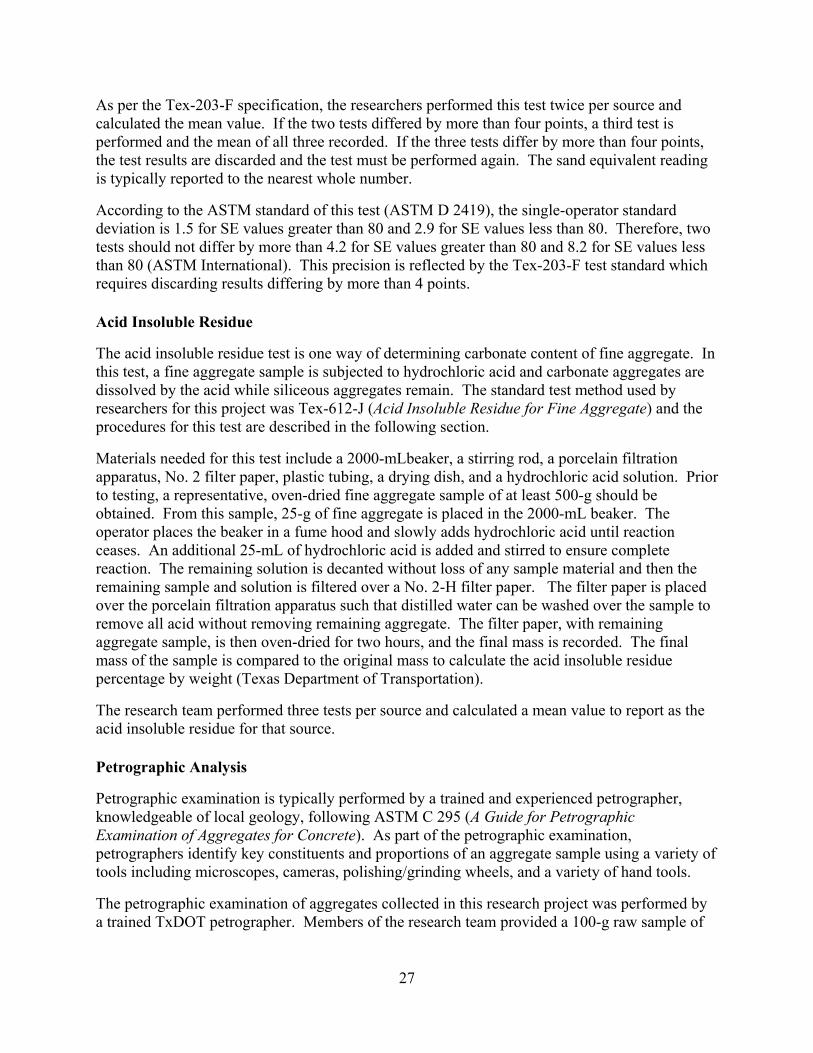
The flexural strength of concrete will be tested at third-point loadings as prescribed by the ASTM standard. The test setup should be similar to that shown in Figure 9. The bearing surfaces for the test specimen should be case-hardened steel and consist of partial cylinders with at least 0.80 radians of curved surface so that rotation is not restricted during loading.
31
Figure 9: Setup of Concrete Flexure Test from ASTM C 78 (ASTM International)
Before placing the prismatic concrete specimen in the test apparatus, it should be placed on its side relative to its casting position. The operator should then center the concrete specimen in the test apparatus while conforming to the ASTM tolerances for position. The operator can then load the specimen up to 6% of ultimate load before again checking the position of the specimen and determining if there is any gap between the specimen and test blocks. Leather shims can be used to eliminate any gaps. The operator can then begin loading the specimen such that the tension face experiences a stress rate of 0.9 to 1.2 MPa/min (125 to 175 psi/min). The ASTM standard provides an equation for calculating the loading rate based on the geometry of the concrete specimen. The concrete specimen is loaded to failure and the operator should note the location of the fracture that initiated failure. If the fracture is located more than 5% outside the middle third of the beam, then the test results must be discarded. Otherwise, the modulus of rupture can be calculated based on simple equations located in ASTM C 78.
Strength of concrete will influence the precision of the test but the ASTM standard provides general information about precision. The single-operator coefficient of variation has been found to be 5.7% and the multilaboratory coefficient of variation has been found to be 7.0% for specimens from the same batch. Therefore, two tests using specimens from the same batch should not differ by more than 16% or 19% respectively (ASTM International).
The research team will create three 4-in. x 4-in. x 14-in. (100-mm x 100-mm x 255-mm) beams per aggregate source. A total of 10 to 15 aggregate sources will be used for mixing and casting concrete. The Tex-448-A standard provides an adjustment factor when beams are tested that are not 6-in. x 6-in. (150-mm x 150-mm) in cross section. However, the standard does not provide the adjustment factor for beams 4-in. x 4-in. in cross-section so researchers will consult with TxDOT laboratory personnel to determine an appropriate adjustment factor.

32
Coefficient of Thermal Expansion
Coefficient of thermal expansion of concrete is a particularly relevant test considering the issues that TxDOT has seen from high CoTE concrete mixtures in CRCP pavements. Researchers will use Tex-428-A (Determining the Coefficient of Thermal Expansion of Concrete) to test for CoTE.
This test requires a water bath, support frame for the cylinder, a measuring device such as an LVDT, and a saw to cut cylinders down to size. The support frame should be made of stainless steel with the exception of the vertical members which should be made of Invar, a material which has low coefficient of thermal expansion. The base plate should be 10-in. (254-mm) in diameter with three equally spaced support buttons to form circles of 2-in. (50-mm) and 3-in. (75-mm) diameter. A measuring device such as a spring loaded submersible LVDT should be attached to the top of the frame to provide expansion measurements.
Prior to testing, the concrete cylinder should be saw-cut such that the length is 6-in. (150-mm) and both ends are plane to within 0.002-in. (0.050-mm). The specimens should be conditioned in a saturated limewater solution at 73 ± 4˚F (23 ± 2˚C) for at least 48 hours. After conditioning, the specimens are removed from the limewater, measured, and the original length recorded with a caliper within 0.004-in. (0.1-mm). The specimens are then placed in the support frame in the water bath with LVDT attached (note that a typical standard water bath can hold two or three support frames with specimens attached). The water bath is set to 50 ± 2˚F (10 ± 1˚C) for an hour. At this point the test has begun and the water temperature and displacement (as measured by the LVDT) should be recorded at one minute intervals for the remainder of the test. The water bath should be heated and cooled again in accordance with Figure 10. After the test cycle is complete, the operator performs a regression analysis on the temperature versus displacement plot for a heating or cooling phase. The slope of the linear regression line divided by the length of the specimen will provide the coefficient of thermal expansion. A correction factor may be added based on the type of support frame used (Texas Department of Transportation). No precision information for this test is available in either the TxDOT or AASHTO standards.
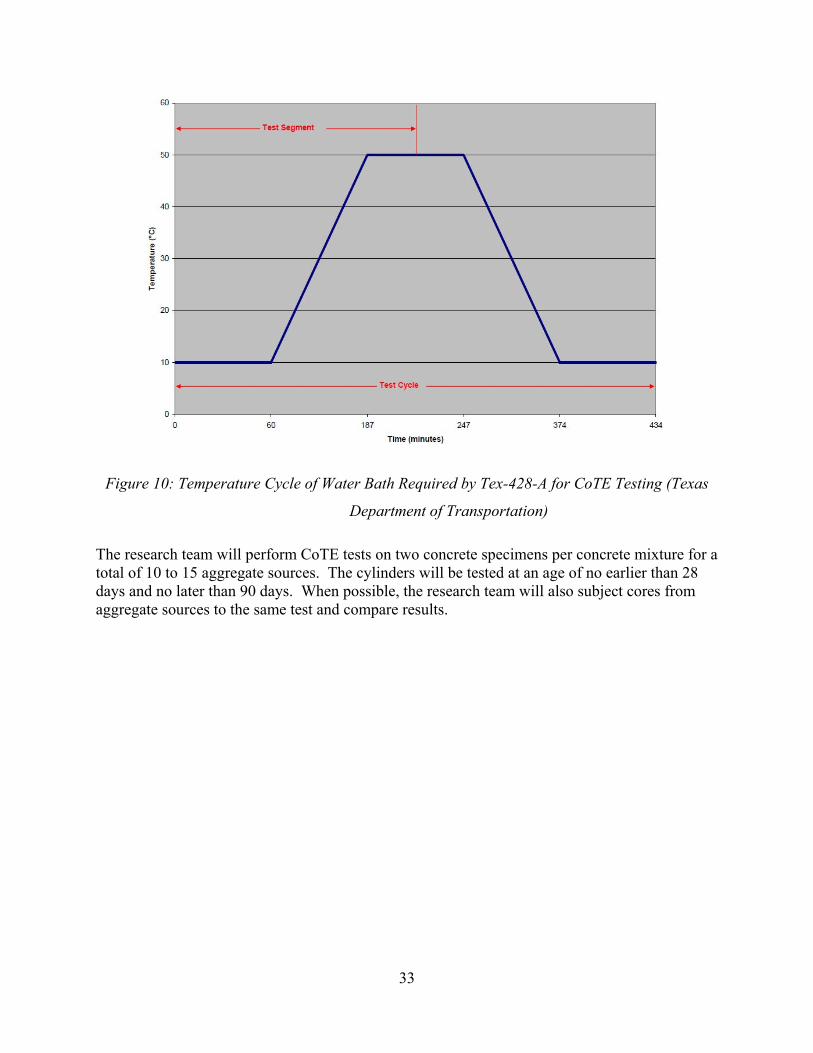
33
Figure 10: Temperature Cycle of Water Bath Required by Tex-428-A for CoTE Testing (Texas
Department of Transportation)
The research team will perform CoTE tests on two concrete specimens per concrete mixture for a total of 10 to 15 aggregate sources. The cylinders will be tested at an age of no earlier than 28 days and no later than 90 days. When possible, the research team will also subject cores from aggregate sources to the same test and compare results.
34
SOURCES
ASTM C 127-07: Density, Relative Density (Specific Gravity), and Absorption of Coarse Aggregate. West Conshohocken: ASTM International, September 2007.
ASTM C 39 / C 39M-12: Compressive Strength of Cylindrical Concrete Specimens. West Conshohocken: ASTM International, February 2012.
ASTM C 469: Static Modulus of Elasticity and Poisson's Ration of Concrete in Compression. West Conshohocken: ASTM International, November 2010.
ASTM C 78-10: Flexural Strength of Concrete (Using Simple Beam with Third-Point Loading). West Conshohocken: ASTM International, September 2010.
ASTM C 88-05: Soundness of Aggregates by Use of Sodium Sulfate or Magnesium Sulfate. West Conshohocken: ASTM International, August 2005.
ASTM C131-06: Resistance to Degradation of Small-Size Coarse Aggregate by Abrasion and Impact in the Los Angeles Machine. West Conshohocken: ASTM International, August 2006.
ASTM D 2419-09: Sand Equivalent Value of Soils and Fine Aggregate. West Conshohocken: ASTM International, July 2009.
ASTM D 4791-10: Flat Particles, Elongated Particles, or Flat and Elongated Particles in Coarse Aggregate. West Conshohocken: ASTM International, October 2010.
ASTM D 7428-08: Resistance of Fine Aggregate to Degradation by Abrasion in the Micro-Deval Apparatus." West Conshohocken: ASTM International, March 2008.
British Standard 812 Part 110: Methods for Determination of Aggregate Crushing Value. BSi, June 1990.
British Standard 812 Part 112 - Methods for Determination of Aggregate Impact Value (AIV). BSi, August 1995.
Folliard, Kevin and Kurt Smith. "NCRHP 4-20C Final Report - Aggregate Tests for Portland Cement Concrete Pavements: State of the Knowledge." 2002.
Jayawickrama, Priyantha W., Shabbir Hossain and Appa Rao Hoare. Long-Term Research on Bituminous Coarse Aggregate: Use of Micro-Deval Test for Project Level Aggregate Quality Control. College Station, Texas: Texas Transportation Institute, 2007.
Koehler, Eric P., et al. "Ensuring Concrete Performance for Various Aggregates." 17th Annual ICAR Symposium. Austin: W.R. Grace & Co., 4-5 May 2009.
Mahmoud, Enad, et al. "Comprehensive Evaluation of AIMS Texture, Angularity, and Dimension Measurements." Journal of Materials in Civil Engineering (2010): 369-379.
Masad, Eyad A. Aggregate Imaging System (AIMS): Basics and Applications. College Station, Texas: Texas Transportation Institute, 2005.
35
Mathis Instruments Ltd. "Mathis TCi: Thermal Conductivity Analyzer." Pennsauken: Setaram Instrumentation Technologies, 2012.
Rogers, C. A., M. L. Bailey and B. Price. "Micro-Deval Test for Evaluating the Quality of Fine Aggregate for Concrete and Asphalt." Transportation Research Record (1991): 68-76.
Rogers, Chris and Bob Gorman. "A Flakiness Test for Fine Aggregate." 16th Annual ICAR Symposium. Austin, Texas: International Center for Aggregates Research, 2008.
Rogers, Chris. "Canadian Experience with Micro-Deval Test for Aggregates." Engineering Geology Special Publications (1998): 139-147.
Tex-203-F: Test Procedure for Sand Equivalent Test. Austin: Texas Department of Transportation, September 2009.
Tex-280-F: Determining Flat and Elongated Particles. Austin: Texas Department of Transportation, February 2005.
Tex-403-A: Saturated Surface-Dry Specific Gravity and Absorption of Aggregates. Austin: Texas Department of Transportation, August 1999.
Tex-408-A: Organic Impurities in Fine Aggregates for Concrete. Austin: Texas Department of Transportation, August 1999.
Tex-428-A: Determining the Coefficient of Thermal Expansion of Concrete. Austin: Texas Department of Transportation, June 2011.
Tex-612-J: Acid Insoluble Residue for Fine Aggregate. Austin: Texas Department of Transportation, June 2000.
W.R. Grace & Co. "Grace Rapid Clay Test Kit: Step-by-Step Procedure." Grace Custom Aggregate Solutiona. Cambridge: W.R. Grace & Co., April 2010.