
Test Pair Selection for Test Case Prioritization in Regression Testing for...
26
To appear in International Journal of Web Services Research (JWSR) 1 Test Pair Selection for Test Case Prioritization in Regression Testing for WS-BPEL Programs Lijun Mei 1 , Yan Cai 2 , Changjiang Jia 2 , Bo Jiang 3† , W.K. Chan 2 , 1 IBM Research - China, Beijing, China 2 City University of Hong Kong, Tat Chee Avenue, Hong Kong 3 School of Computer Science and Engineering, Beihang University, Beijing, China {[email protected], [email protected], [email protected], [email protected], [email protected]} ABSTRACT: Many web services not only communicate through XML-based messages, but also may dynamically modify their behaviors by applying different interpretations on XML messages through updating the associated XML Schemas or XML-based interface specifications. Such artifacts are usually complex, allowing XML-based messages conforming to these specifications structurally complex. Testing should cost-effectively cover all scenarios. Test case prioritization is a dimension of regression testing that assures a program from unintended modifications by reordering the test cases within a test suite. However, many existing test case prioritization techniques for regression testing treat test cases of different complexity generically. In this paper, we exploit the insights on the structural similarity of XML-based artifacts between test cases in both static and dynamic dimensions, and propose a family of test case prioritization techniques that selects pairs of test case without replacement in turn. To the best of our knowledge, it is the first test case prioritization proposal that selects test case pairs for prioritization. We validate our techniques by a suite of benchmarks. The empirical results show that when incorporating all dimensions, some members of our technique family can be more effective than conventional coverage-based techniques. 1 KEY WORDS: XML similarity, pairwise selection, adaption, test case prioritization, service evolution INTRODUCTION A WS-BPEL web service (WS-BPEL Version 2.0, 2007) may interact with other web services that collectively implement a function. Any maintenance or runtime adaptation of the web service may potentially result in faults or cause incompatible interactions between this web service and its belonging composite services. To validate whether an evolved version of the web service conforms to its previously established functional behaviors, a testing agent (which can be a web service) may apply a test suite to check whether the evolved version of the web service correctly handles the test suite. A WS-BPEL web service consists of a WSDL document and a workflow process. A WSDL document (W3C WSDL 1.1, 2001) is an XML-based document. It contains the specifications that define both web service descriptions and message data types specified in XML schemas (Fu, et al. † Correspondence Author
-
Upload
truonghanh -
Category
Documents
-
view
214 -
download
0
Transcript of Test Pair Selection for Test Case Prioritization in Regression Testing for...
To appear in International Journal of Web Services Research (JWSR)
1
Test Pair Selection for Test Case Prioritization in Regression
Testing for WS-BPEL Programs
Lijun Mei1, Yan Cai
2, Changjiang Jia
2, Bo Jiang
3†, W.K. Chan
2,
1 IBM Research - China, Beijing, China
2 City University of Hong Kong, Tat Chee Avenue, Hong Kong
3 School of Computer Science and Engineering, Beihang University, Beijing, China
{[email protected], [email protected], [email protected],
[email protected], [email protected]}
ABSTRACT: Many web services not only communicate through XML-based messages, but also may
dynamically modify their behaviors by applying different interpretations on XML messages
through updating the associated XML Schemas or XML-based interface specifications. Such
artifacts are usually complex, allowing XML-based messages conforming to these specifications
structurally complex. Testing should cost-effectively cover all scenarios. Test case prioritization
is a dimension of regression testing that assures a program from unintended modifications by
reordering the test cases within a test suite. However, many existing test case prioritization
techniques for regression testing treat test cases of different complexity generically. In this paper,
we exploit the insights on the structural similarity of XML-based artifacts between test cases in
both static and dynamic dimensions, and propose a family of test case prioritization techniques
that selects pairs of test case without replacement in turn. To the best of our knowledge, it is the
first test case prioritization proposal that selects test case pairs for prioritization. We validate our
techniques by a suite of benchmarks. The empirical results show that when incorporating all
dimensions, some members of our technique family can be more effective than conventional
coverage-based techniques.1
KEY WORDS: XML similarity, pairwise selection, adaption, test case prioritization, service evolution
INTRODUCTION
A WS-BPEL web service (WS-BPEL Version 2.0, 2007) may interact with other web services
that collectively implement a function. Any maintenance or runtime adaptation of the web service
may potentially result in faults or cause incompatible interactions between this web service and
its belonging composite services. To validate whether an evolved version of the web service
conforms to its previously established functional behaviors, a testing agent (which can be a web
service) may apply a test suite to check whether the evolved version of the web service correctly
handles the test suite.
A WS-BPEL web service consists of a WSDL document and a workflow process. A WSDL
document (W3C WSDL 1.1, 2001) is an XML-based document. It contains the specifications that
define both web service descriptions and message data types specified in XML schemas (Fu, et al.
† Correspondence Author
To appear in International Journal of Web Services Research (JWSR)
2
2004). A web service description provides a locator of a web service, and represents a web service
as a collection of operations. Individual workflow steps in a workflow process may apply
different specifications defined in WSDL (dubbed WSDL specifications) to different portions of
the same or different XML documents. Workflow programs (e.g., a BPEL program) are popular to
be encoded in XML form as well (BPEL Repository, 2006; Oracle BPEL Process Manager 10.1.2,
2007; WS-BPEL Version 2.0, 2007).
However, two XML-based documents sharing the same set of tags may structure these tags in
quite different ways, potentially causing the same web service to produce radically different
results for the two messages (Mei et al. 2011). An XML document can be modeled as an ordered,
labeled tree (Garofalakis et al. 2005; Guha, et al. 2002; Mei et al. 2011). A mathematical property
of such a tree is that a given tree must subsume every sub-tree or any resultant tree generated by
removing any sub-trees from the given tree. We thus observe that the element coverage with
respect to an XML document may not help reveal the coverage characteristics in relation to the
internal structure of an XML document.
A regression testing technique that does not consider these characteristics can be less effective
to assure WS-BPEL web service. For instance, an online hotel booking application may use the
booking service provided by a hotel to handle every room booking request. Without further
manipulation of a message, this application may relay the booking result returned by the hotel
back to the client service. Multiple program executions may simply exercise the same workflow
steps, irrespective to the contents of the returned XML messages (e.g., indicating successful
booking or not), which may require different program logics to handle them.
This paper proposes a suite of similarity-based test case prioritization techniques for the
regression testing of WS-BPEL web services based on the pairwise selection strategy. Pairwise
comparison is a fundamental strategy to examine elements and pick associations between
elements in a finite set. To the best of our knowledge, no existing test case prioritization
techniques formulated directly on top of this type of strategy has been proposed for the regression
testing of web services. Our techniques compute the structural similarity of XML-based artifacts
between test cases. They progressively consider the XML-based artifacts in three levels: WSDL
interface specification, XML-based messages, and BPEL workflow process. Each technique
assigns the execution priorities to the test cases in a regression test suite by assessing the
similarity values of test case pairs. They select test pairs either iteratively or following a heuristic
order. We have conducted an experiment to validate our techniques. The empirical results show
that some of the proposed techniques can achieve higher rates of fault detection, in terms of
APFD, than other studied techniques and random ordering when using all levels of XML-based
artifacts.
The preliminary version (Mei et al. 2013) of this paper has presented the basic idea of our
techniques. In this paper, we propose two new similarity-based techniques (M5 and M6) based on
the iterative similarity strategy, elaborate the design rationale of all proposed test case
prioritization techniques, and strengthen the experiment by conducting more data analysis
including hypothesis testing to validate the observations.
The main contribution of this paper, together with its preliminary version, is twofold: (i) To the
best of our knowledge, this paper is the first work that formulates pairwise test case prioritization
techniques for the regression testing of web services. (ii) We report an experiment that validates
the feasibility of our proposal.
The rest of the paper is organized as follows. The next section reviews the preliminaries. After
that, we discuss the challenges of test case prioritization for WS-BPEL web service through a
motivating example. Our prioritization techniques are then presented, followed by an
experimental evaluation. After the evaluation, we review the related work. Finally, we conclude
To appear in International Journal of Web Services Research (JWSR)
3
this paper and outline the future work.
PRELIMINARIES
This section reviews the technical preliminaries that lay the foundations of our proposal.
Test Case Prioritization
Test case prioritization (Elbaum et al. 2002) is a kind of regression testing technique. Many
previous projects (Li et al. 2007; Krishnamoorthi et al. 2009; Li et al. 2010) show that test case
prioritization is important to regression testing. For instance, improving the rate of fault detection
of a test suite can aid software quality assurance by improving the chance of earlier execution of
failure-causing test cases, providing earlier feedback on the system, and enabling earlier
debugging (Elbaum et al. 2002). The problem of test case prioritization (Elbaum et al. 2002) is
formulated as follows:
Given: T, a test suite; PT, the set of permutations of T; and f, a function from PT to the set of all real numbers.
Problem: To find T’PT such that, ∀T’’PT f (T’) ≥ f (T’’).
XML Distance and XML Set Similarity
This section introduces the XML distance and XML set similarity that measure the distance
between two XML documents and the similarity between two XML document sets. An XML
document can be modeled as an ordered, labeled tree T (Garofalakis et al. 2005; Guha et al.
2002). Given two XML document trees T1 and T2, the tree edit distance (Guha et al. 2002)
between them, denoted by TDIST(T1, T2), is defined as the minimum cost sequence of tree edit
operations (that are, node insertions, deletions, and label substitutions) on single tree nodes that
are required to transform one tree to another.
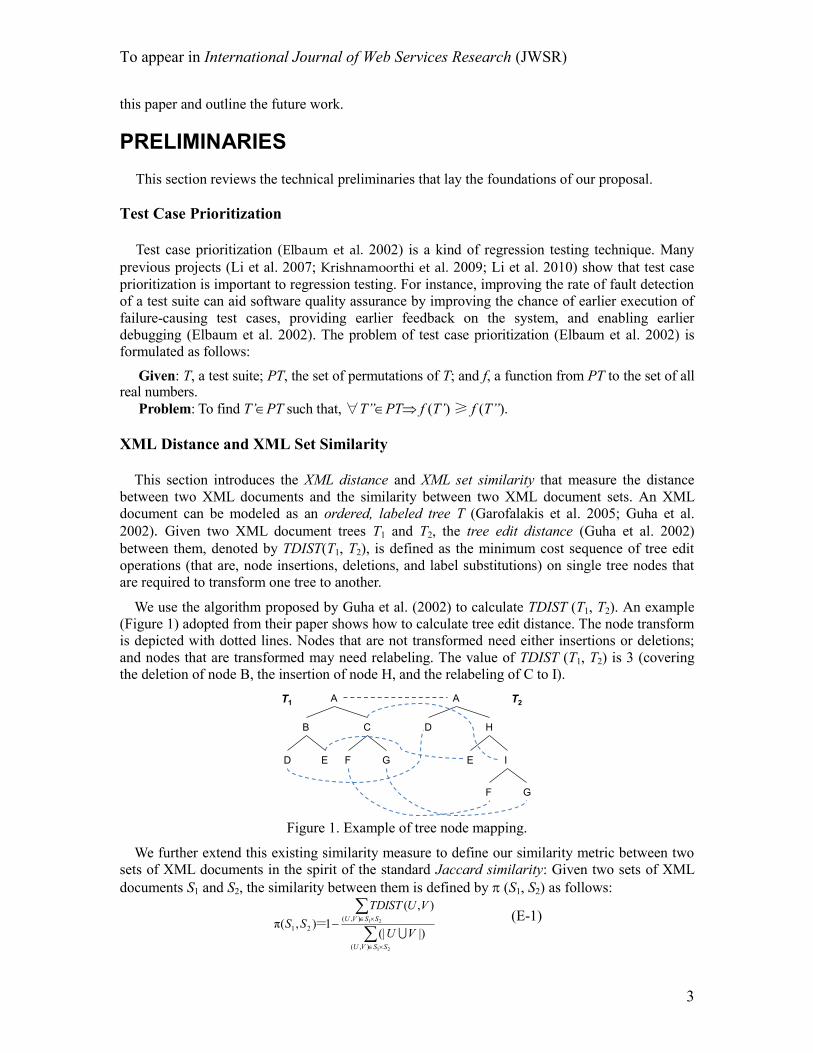
We use the algorithm proposed by Guha et al. (2002) to calculate TDIST (T1, T2). An example
(Figure 1) adopted from their paper shows how to calculate tree edit distance. The node transform
is depicted with dotted lines. Nodes that are not transformed need either insertions or deletions;
and nodes that are transformed may need relabeling. The value of TDIST (T1, T2) is 3 (covering
the deletion of node B, the insertion of node H, and the relabeling of C to I).
A
B C
D E F G
A
D H
E I
F G
T1 T2
Figure 1. Example of tree node mapping.
We further extend this existing similarity measure to define our similarity metric between two
sets of XML documents in the spirit of the standard Jaccard similarity: Given two sets of XML
documents S1 and S2, the similarity between them is defined by (S1, S2) as follows:
21
21
),(
),(
21|)(|
),(
1),(π
SSVU
SSVU
VU
VUTDIST
SS
= (E-1)
To appear in International Journal of Web Services Research (JWSR)
4
Price= XQ(BookRequest, //price/)
Num= XQ(BookRequest, //persons/)
Price= XQ(BookRequest, //price/)
Num= XQ(BookRequest, //persons/)
RoomPrice = XQ(HotelInformation,
//room[@price≤’Price’ and persons≥‘Num’]/price)
if XQ(HotelInformation, //roomno/) ≠ null
&& RoomPrice ≤ Priceif RoomPrice ≥ 0&& RoomPrice ≤ Price
No
RoomPrice = XQ(HotelInformation,
//room[@price≤’Price’ and @persons=‘Num’]/price)
Yes
Input:
RoomPrice
Output:
BookingResult
Input: BookRequest
A5:
Validate
Price
A7: Invoke HotelBookService
A8: Reply BookingResult
Price= XQ(BookRequest, //price/)
Num= XQ(BookRequest, //persons/)
Input: Price
Output: HotelInformation
A1: Receive HotelBookReqest
A2: Assign Price
A3: Invoke HotelPriceService
A4: Assign RoomPrice
(a) Original Program (b) Changed Program - 1 (c) Changed Program - 2
NoInput:
RoomPrice
Output:
BookingResult
if XQ(HotelInformation, //roomno/) ≠ null&& RoomPrice ≥ 0
&& RoomPrice ≤ Price
Input: BookRequest
A5:
Validate
Price
A7: Invoke HotelBookService
A8: Reply BookingResult
Input: Price
Output: HotelInformation
A1: Receive HotelBookReqest
A2: Assign Price
A3: Invoke HotelPriceService
A4: Assign RoomPrice
RoomPrice = XQ(HotelInformation,
//room[@price≤’Price’ or
@persons≥‘Num’]/price)
No YesInput:
RoomPrice
Output:
BookingResult
Input: BookRequest
A5:
Validate
Price
A7: Invoke HotelBookService
A8: Reply BookingResult
Input: Price
Output: HotelInformation
A1: Receive HotelBookReqest
A2: Assign Price
A3: Invoke HotelPriceService
A4: Assign RoomPrice
A6: Fault Handling
A6: Fault Handling
A6: Fault Handling
Yes
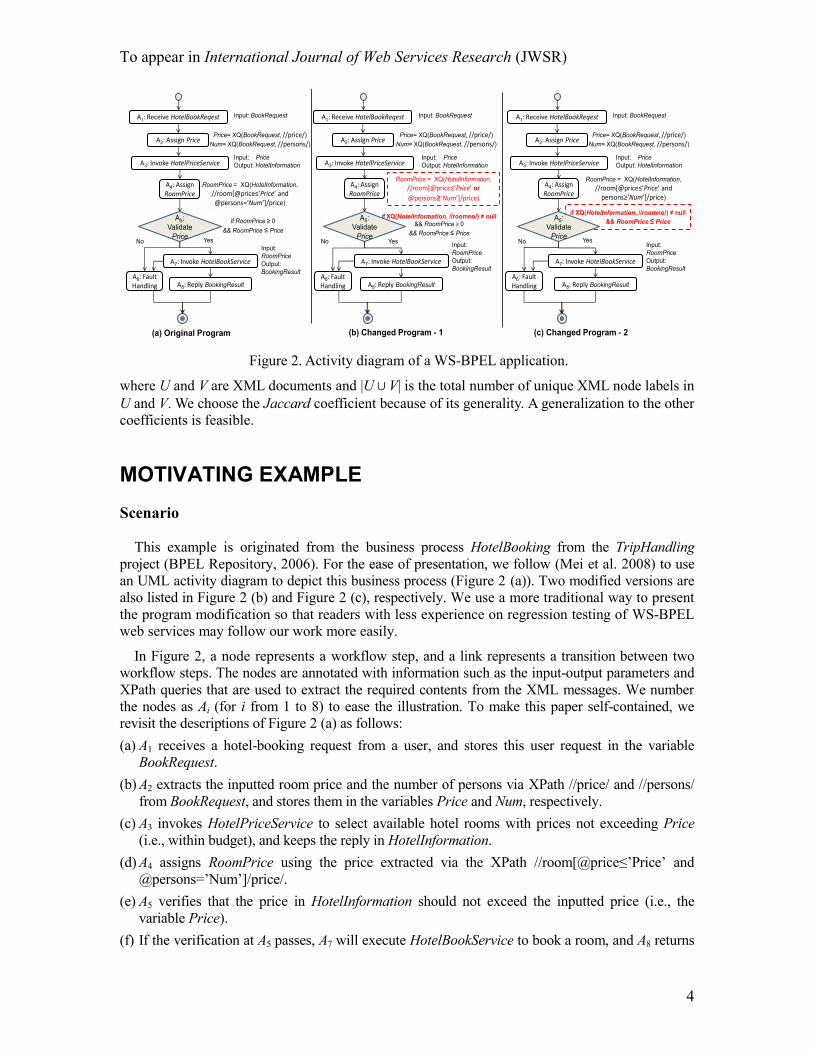
Figure 2. Activity diagram of a WS-BPEL application.
where U and V are XML documents and |U ∪ V| is the total number of unique XML node labels in
U and V. We choose the Jaccard coefficient because of its generality. A generalization to the other
coefficients is feasible.
MOTIVATING EXAMPLE
Scenario
This example is originated from the business process HotelBooking from the TripHandling
project (BPEL Repository, 2006). For the ease of presentation, we follow (Mei et al. 2008) to use
an UML activity diagram to depict this business process (Figure 2 (a)). Two modified versions are
also listed in Figure 2 (b) and Figure 2 (c), respectively. We use a more traditional way to present
the program modification so that readers with less experience on regression testing of WS-BPEL
web services may follow our work more easily.
In Figure 2, a node represents a workflow step, and a link represents a transition between two
workflow steps. The nodes are annotated with information such as the input-output parameters and
XPath queries that are used to extract the required contents from the XML messages. We number
the nodes as Ai (for i from 1 to 8) to ease the illustration. To make this paper self-contained, we
revisit the descriptions of Figure 2 (a) as follows:
(a) A1 receives a hotel-booking request from a user, and stores this user request in the variable
BookRequest.
(b) A2 extracts the inputted room price and the number of persons via XPath //price/ and //persons/
from BookRequest, and stores them in the variables Price and Num, respectively.
(c) A3 invokes HotelPriceService to select available hotel rooms with prices not exceeding Price
(i.e., within budget), and keeps the reply in HotelInformation.
(d) A4 assigns RoomPrice using the price extracted via the XPath //room[@price≤’Price’ and
@persons=’Num’]/price/.
(e) A5 verifies that the price in HotelInformation should not exceed the inputted price (i.e., the
variable Price).
(f) If the verification at A5 passes, A7 will execute HotelBookService to book a room, and A8 returns

To appear in International Journal of Web Services Research (JWSR)
5
the result to the customer.
(g) If RoomPrice is erroneous or HotelBookService (A7) produces a failure, A6 will invoke a fault
handler (i.e., executing A5, A6 and A7, A6, respectively).
Let us consider two regression faults that are introduced during the program modification. First,
suppose a software engineer Andy decides that the precondition at node A4 in Figure 2 (a) should be
changed to that at node A4 in Figure 2 (b), and a validation should be added at node A5 to guarantee
that the room number information (roomno) is non-empty. He attempts to allow customers to select
any room that can provide accommodation for the requested number of people. However, he
wrongly changes the precondition in the XPath (namely, changing “and” to “or”). While he intends
to provide customers more choices, the process does not support his intention. For example, the
process is designed to immediately proceed to book rooms, rather than providing choices for
customers to select. This is the first fault.
Next, suppose another engineer Kathy wants to correct this fault. She plans to change node A4 in
Figure 2 (b) back to that in Figure 2 (a). However, she considers that the precondition at node A5 is
redundant (i.e., no need to require RoomPrice ≥ 0). Therefore, she changes the node A5 in Figure 2
(b) to become the node A5 in Figure 2 (c), and forgets to handle a potential scenario (Price < 0).
After her modification, another fault is brought into the modified program.
We use six test cases (i.e., t1 to t6) to illustrate how different techniques reorder the test set and
apply them to test the modified program. Each test case gives an input of the variable BookRequest
at node A1. To save space, we only show the price value of the variable Price and the value of the
variable Num, rather than the original XML document in full.
Price, Num Price, Num
Test case 1 (t1): 200, 1 Test case 2 (t2): 150, 2
Test case 3 (t3): 125, 3 Test case 4 (t4): 100, 2
Test case 5 (t5): 50, 1 Test case 6 (t6): –1, 1
There are messages sent and received at both nodes A3 and A7. For example, the messages used at
A4 for t1 to t6 are listed in Figure 3. Let us further consider how these messages are used at A3.
<hotel>
<name>Hilton
Hotel</name>
<room>
<roomno>R106</roomno>
<price>105</Price>
<persons>1<persons>
</room>
<room>
<roomno>R101</roomno>
<price>150</price>
<persons>3<persons>
</room>
</hotel >
<hotel>
<name>Hilton
Hotel</name>
<room>
<roomno>R106</roomno>
<price>105</Price>
<persons>1<persons>
</room>
<room>
<roomno>R101</roomno>
<price>150</price>
<persons>3<persons>
</room>
</hotel >
<hotel>
<name>Hilton
Hotel</name>
<room>
<roomno>R106</roomno>
<price>105</Price>
<persons>1<persons>
</room>
</hotel>
Test Case 1 Test Case 2 Test Case 3 <hotel>
<room>
<roomno></roomno>
<price>100</Price>
<persons>2<persons>
</room>
</hotel >
<hotel>
</hotel>
<hotel>
<room>
<price>-1</Price>
<persons>1<persons>
</room>
<error>InvalidPrice<error>
</hotel >
Test Case 4 Test Case 5 Test Case 6
Figure 3. XML messages for XQ(HotelInformation, //room[@price ’Price’ and @persons = ’Num’]/price/).

To appear in International Journal of Web Services Research (JWSR)
6
Let us first present the failure-causing test cases (with respect to either modified program). When
running the first modified version over t1 to t6 (Figure 2 (b)), t1 extracts a right room price; t4 to t6
extract no price value; both t2 and t3 extract the price 105 of the single room, while they indeed aim
to book a double room and a family suite, respectively. We also find that, t2 and t3 can detect the
regression fault in Figure 2 (b). Similarly, for the second modified version (Figure 2 (c)), t1 and t2
extract the right room prices; t3 to t5 extract no price value; t6 extracts a room price –1, however, it
should not represent any realistic price. Among t1 to t6, only t6 can detect the second regression fault
in Figure 2 (c).
1 <xsd:complexType name="hotel">
2 <xsd:element name="name" type="xsd:string"/>
3 <xsd:element name="room" type="xsd:RoomType"/>
4 <xsd:element name="error" type="xsd:string"/>
5 </xsd:complexType>
6 <xsd:complexType name="RoomType">
7 <xsd:element name="roomno" type="xsd:int" />
8 <xsd:element name="price" type="xsd:int"/>
9 <xsd:element name="persons" type="xsd:int"/>
10 </xsd:complexType>
Figure 4. Part of WSDL document: XML schema of hotel.
Figure 4 shows the XML schema that defines the messages replied by the service
HotelPriceService (at A3).
Coverage Analysis and Problems
We summarize the branch coverage achieved by each test case over a preceding version of the
workflow program (Figure 2 (a)). We use a “” to refer to an item covered by the respective test
case. For instance, test case t1 covers six workflow branches (shown as edges in Figure 2 (a)):
A1, A2, A2, A3, A3, A4, A4, A5, A5, A7 and A7, A8.
TABLE 1. WORKFLOW BRANCH COVERAGE FOR t1 TO t6
Branch t1 t2 t3 t4 t5 t6
A1, A2
A2, A3
A3, A4
A4, A5
A5, A6
A5, A7
A7, A6
A7, A8
Total 6 5 5 6 5 5
We observe from Table 1 that the coverage information for test cases t2, t3, t5, and t6 are
identical (test cases t1 and t4 are also identical). For such a tie case, to the best of our knowledge,
many existing test case prioritization techniques simply randomly pick one to resolve it.
To appear in International Journal of Web Services Research (JWSR)
7
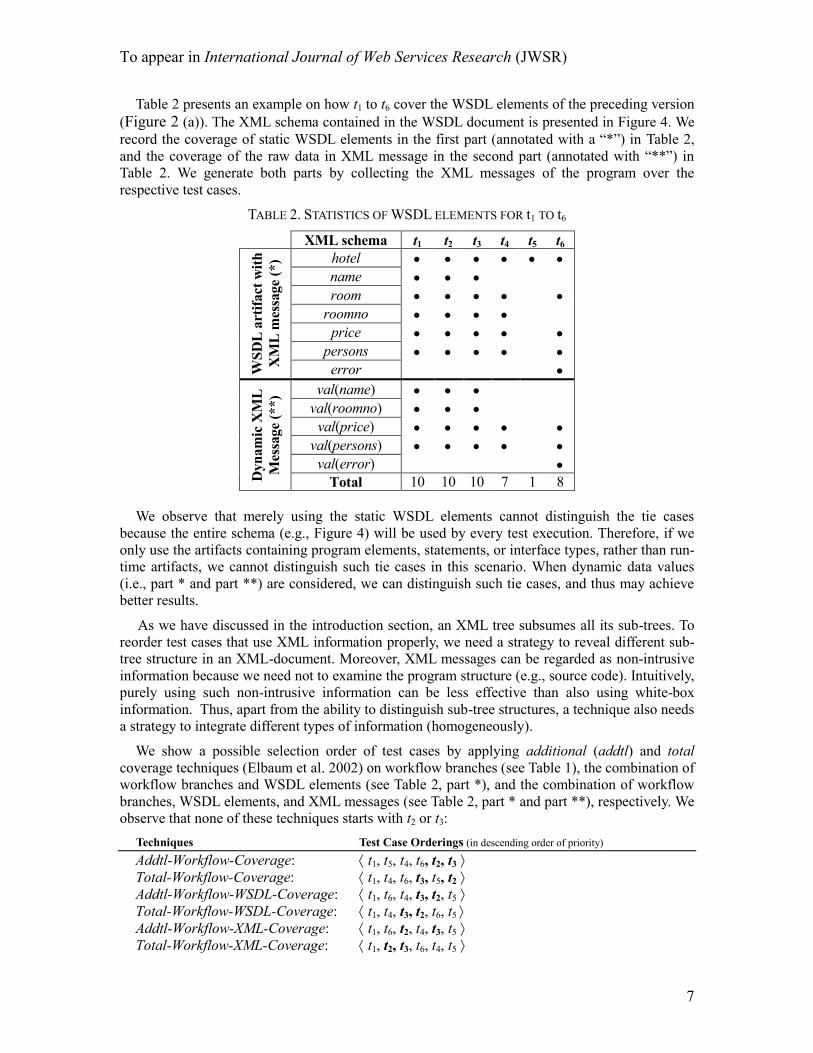
Table 2 presents an example on how t1 to t6 cover the WSDL elements of the preceding version
(Figure 2 (a)). The XML schema contained in the WSDL document is presented in Figure 4. We
record the coverage of static WSDL elements in the first part (annotated with a “*”) in Table 2,
and the coverage of the raw data in XML message in the second part (annotated with “**”) in
Table 2. We generate both parts by collecting the XML messages of the program over the
respective test cases.
TABLE 2. STATISTICS OF WSDL ELEMENTS FOR t1 TO t6
XML schema t1 t2 t3 t4 t5 t6
WS
DL
art
ifact
wit
h
XM
L m
essa
ge
(*) hotel
name
room
roomno
price
persons
error
Dyn
am
ic X
ML
Mes
sage
(**) val(name)
val(roomno)
val(price)
val(persons)
val(error)
Total 10 10 10 7 1 8
We observe that merely using the static WSDL elements cannot distinguish the tie cases
because the entire schema (e.g., Figure 4) will be used by every test execution. Therefore, if we
only use the artifacts containing program elements, statements, or interface types, rather than run-
time artifacts, we cannot distinguish such tie cases in this scenario. When dynamic data values
(i.e., part * and part **) are considered, we can distinguish such tie cases, and thus may achieve
better results.
As we have discussed in the introduction section, an XML tree subsumes all its sub-trees. To
reorder test cases that use XML information properly, we need a strategy to reveal different sub-
tree structure in an XML-document. Moreover, XML messages can be regarded as non-intrusive
information because we need not to examine the program structure (e.g., source code). Intuitively,
purely using such non-intrusive information can be less effective than also using white-box
information. Thus, apart from the ability to distinguish sub-tree structures, a technique also needs
a strategy to integrate different types of information (homogeneously).
We show a possible selection order of test cases by applying additional (addtl) and total
coverage techniques (Elbaum et al. 2002) on workflow branches (see Table 1), the combination of
workflow branches and WSDL elements (see Table 2, part *), and the combination of workflow
branches, WSDL elements, and XML messages (see Table 2, part * and part **), respectively. We
observe that none of these techniques starts with t2 or t3:
Techniques Test Case Orderings (in descending order of priority)
Addtl-Workflow-Coverage: t1, t5, t4, t6, t2, t3
Total-Workflow-Coverage: t1, t4, t6, t3, t5, t2
Addtl-Workflow-WSDL-Coverage: t1, t6, t4, t3, t2, t5
Total-Workflow-WSDL-Coverage: t1, t4, t3, t2, t6, t5
Addtl-Workflow-XML-Coverage: t1, t6, t2, t4, t3, t5
Total-Workflow-XML-Coverage: t1, t2, t3, t6, t4, t5
To appear in International Journal of Web Services Research (JWSR)
8
None of these techniques effectively prioritizes t2 or t3. That is, they rely on their tie breaking strategies instead of the intrinsic ability of such a technique to assign either test case with high priority. The test suite contains quite a number of test cases similar to them. Using a bin counting approach or a traditional test case clustering approach may not help iron out them effectively.
OUR TEST CASE PRIORITIZATION
In this section, we present our family of test case prioritization techniques.
Test Case Similarity
From a test execution on a WS-BPEL web service, one may obtain the coverage information
on service code and WSDL documents, and collect the involved XML messages. Moreover, many
researchers consider that services can be opaque, and thus the service structure (i.e., BPEL code)
may not be available for testing. Therefore, we first use WSDL documents, then add XML
messages, and finally include the BPEL code in case the BPEL code can be available. To ease the
presentation, we define a container (see Definition 1) to hold different kinds of XML documents
used in a test case execution.
Definition 1. W3-Set (or W3S). A W3-Set with respect to a test case t is a set of triples {w1, m1,
b1, w2, m2, b2, …, wN, mN, bN}, where a triple wi, mi, bi is a workflow module bi, an XML message mi, and a WSDL specification wi for the module bi and it defines the type for the message mi. Let W(t)={w1, w2, …, wN}, M(t)={m1, m2, …, mN}, and B(t)={b1, b2, …, bN} represent the set of WSDL specifications, the set of XML messages, and the set of workflow modules, used or exercised in the execution of t, respectively.
A workflow module (such as Ai in Figure 2) may also be encoded in the XML format (BPEL
Repository, 2006; WS-BPEL Version 2.0, 2007). Take the test case t1 in the previous section for example: M (t1) and W (t1) are given in Figures 3 and 4, respectively. B (t1) is {A1, A2, A3, A4, A5, A7, A8}. We call an XML node label in either W (t), M (t), or B (t) an element covered by a test case t. We further define the concept of test case similarity in Definition 2.
Definition 2. Test Case Similarity (or W3-Similarity). We define three levels of similarity metrics
between two test cases ti and tj (namely W3-Similarity). (i) Similarity of WSDL specification (W-I). (ii) Similarity of WSDL specification and WSDL-governed XML message (W-II). (iii) Similarity of WSDL specification, WSDL-governed XML message, and Workflow module (W-III).
For a test case t, we call the set of elements covered by t using W-I, W-II, and W-III as WE-I (t),
WE-II (t), and WE-III (t), respectively. These sets satisfy the equations:
WE-I(t) = W (t)
WE-II(t) = W (t) ∪ M (t)
WE-III(t) = W (t) ∪ M (t) ∪ B (t)
Let the W3-Set of test cases ti and tj be Bi, Wi, Mi and Bj, Wj, Mj, respectively. Let the
similarity between workflow modules, between XML messages, and between WSDL
specifications for ti and tj be (Bi, Bj), (Mi, Mj), and (Wi, Wj), respectively. There are many
ways to define the similarity metrics. In this paper, we use the Geometric Mean (GM) to define
the three metrics of W3-Similarity for ti and tj as follows. (GM is more appropriate than the
arithmetic means to describe the growth of percentage.) In our approach, we use the XML

To appear in International Journal of Web Services Research (JWSR)
9
similarity metric to produce a percentage value of similarity between two sets of XML messages.
In the presented model, there are multiple dimensions to measure such percentages between a pair
of test cases. Thus, we choose to use GM to combine them to produce an integrated similarity
score.
W-I = (Wi, Wj) (E-2)
W-II = √( )
(E-3)
W-III = √( ) ( )
(E-4)
We note that although we illustrate our techniques using three levels, it is not hard to
generalize the above similarity metric to handle more than three levels. We summarize the
similarity values of every two different test cases (t1-t6 in the motivating example) using E-2, E-3,
and E-4 in Tables 3, 4, and 5, respectively.
TABLE 3. TEST CASE SIMILARITY VALUES FOR t1 TO t6 USING E-2
Test Case t1 t2 t3 t4 t5 t6
t1 ━
t2 1.0000 ━
t3 1.0000 1.0000 ━
t4 0.8333 0.8333 0.8333 ━
t5 0.1667 0.1667 0.1667 0.2000 ━
t6 0.5714 0.5714 0.5714 0.6667 0.2000 ━
TABLE 4. TEST CASE SIMILARITY VALUES FOR t1 TO t6 USING E-3
Test Case t1 t2 t3 t4 t5 t6
t1 ━
t2 1.0000 ━
t3 1.0000 1.0000 ━
t4 0.7637 0.7637 0.7637 ━
t5 0.1291 0.1291 0.1291 0.1691 ━
t6 0.5345 0.5345 0.5345 0.6667 0.1581 ━
TABLE 5. TEST CASE SIMILARITY VALUES FOR t1 TO t6 USING E-4
Test Case t1 t2 t3 t4 t5 t6
t1 ━
t2 0.8298 ━
t3 0.8298 1.0000 ━
t4 0.8355 0.6933 0.6933 ━
t5 0.2118 0.2554 0.2554 0.2535 ━
t6 0.5465 0.6586 0.6586 0.6333 0.2924 ━
We observe from Tables 3, 4 and 5 that, the similarity values between pairs of test cases using
the dynamic data are more different from not using them. For example, the similarity of t1, t4 is
0.8333 in Table 3 (which is same as that of t2, t4), and becomes 0.7637 in Table 4, and further
becomes 0.8355 in Table 5, which becomes different from the similarity of t2, t4. (Here is
another example: the pairs of test cases t1, t2, t1, t3 and t2, t3 have the same similarity value
To appear in International Journal of Web Services Research (JWSR)
10
(1.000) in Table 4. Then in Table 5, t1, t2 and t1, t3 have a different similarity value comparing
to t2, t3 (0.8298 vs. 1.000).
The similarity values provide the alternative and useful information to distinguish test cases
that would reveal no difference using conventional coverage-based techniques. Let us use an
example to illustrate how a similarity-based technique differs from the conventional additional
strategy (Elbaum et al. 2002) as well. Suppose that ta, tb, and tc, have covered the same number of
program elements (e.g., branches), that is |ta| = |tb| =|tc|. Moreover, ta and tb cover the same set of
program elements, while ta covers a different set of program elements. When reordering test
cases, our similarity-based technique can achieve the ordering ta, tc, tb or ta, tb, tc; whereas, by
using the additional strategy method, it is infeasible to have the ordering ta, tb, tc, because ta and
tb cover the same set of elements, and thus, an additional strategy should select tc in between ta
and tb. In the next section, we design a family of prioritization techniques using these test case similarity metrics.
Test Case Prioritization Techniques
To study our techniques, we introduce two control techniques: random (C1) and optimal (C2).
We also present two other techniques adopted from conventional total (addtl)-branch techniques
(Elbaum et al. 2002) that use WE-i (i{I, III, III}), which we refer to as C3 and C4, respectively.
Finally, we use W-i (i{I, II, III}) to denote one of the three metrics in W3-Similarity. They all do
not use the pairwise selection strategy.
Benchmark techniques
C1: Random ordering (Elbaum et al. 2002). This technique randomly orders the test cases in a
test suite T.
C2: Optimal prioritization (Elbaum et al. 2002). C2 iteratively selects test case by the ability of
exposing the most faults not yet exposed. C2 repeats such selection until the selected test cases
are able to expose all faults.
As pointed out by many authors (Elabum et al. 2002; Jiang et al. 2009), C2 is only an
approximation to the optimal case. Moreover, C2 is unrealistic because it needs to know which
particular test cases will reveal which particular fault. However, it can be served as a reference of
an upper bound of a test case prioritization technique may achieve in an experiment.
Next, we introduce two “imported” techniques (C3 and C4) that directly make use of W3S
(using WE-I, WE-II, and WE-III). C3 and C4 are adapted from the conventional total-branch and
addlt-branch test case prioritization techniques (Elbaum et al. 2002).
C3: Total WE-i coverage prioritization (Total-WE-Coverage) (adapted from total-branch
proposed by Elabum et al. (2002)). C3 sorts the test cases in the descending order of the total
number of elements that each test case t has covered (i.e., the number of elements in WE-i(t)).
If multiple test cases cover the same number of elements, C3 will order these test cases
randomly.
C4: Additional WE-i coverage prioritization (Addtl-WE-Coverage) (adapted from addtl-
branch proposed by Elabum et al. (2002)). C4 iteratively selects a test case t that yields the
greatest cumulative element coverage with respect to WE-i(t) (if more than one test case has
the same coverage, C4 randomly selects one). After selecting a test case, C4 removes the
covered elements from the coverage information of remaining test cases. Additional iterations

To appear in International Journal of Web Services Research (JWSR)
11
are conducted until all elements have been covered by at least one test case. After that, C4
resets the coverage information of each remaining test case to its initial value, and then
reapplies the same procedure on the remaining test cases.
Our Test Case Prioritization Techniques: XSP
Our techniques use XML, Similarity metric, and Pairs of test cases. We therefore refer our
techniques to as XSP. Figure 5 shows the schematic relationships among XSP (dis)similarity and
their metrics. Intuitively, a larger similarity value between two test cases suggests that they have a
higher chance in covering the same set of XML document structures. For instance, a program
may have higher chance to interpret data by using similar XML Schemas in executing the test
cases of a highly similar pair.
Similarity Metric
<<bind>>
<<generalize>> <<generalize>>
<<invert>>
<<aggregate>>
W-I W-II W-II
Similarity
GroupXSP Similarity
XSP Iterative
Similarity
XSP Iterative
Dissimilarity
1*
<<bind>>
Figure 5. The relations between XSP (dis)similarity and their metrics.
To ease our presentation, we first define an auxiliary function: Let m be the size of test suite T.
We partition all pairs of distinct test cases into K groups, each containing pairs with the same W-i
similarity value. We denote each group by Gk (1 ≤ k ≤ K), where k is known as the group index.
All test case pairs in Gk have a W-i similarity value gk, such that a smaller group index k indicates
a larger W-i similarity value gk. We refer to such handling as the grouping function GF.
We use Tables 6, 7, and 8 to show the result of grouping function and the differences among
techniques (M1 to M6, to be introduced in the rest part of this section) in selecting test case pairs
from these groups. We categorize the 15 test case pairs of t1 to t6 into different groups according
to their similarity values, as shown in the leftmost columns of Table 6, Table 7, and Table 8. The
rightmost columns of these three tables show one possible ordering of test case pairs for each
technique from M1–M6. We show the test case pairs selected by each prioritization technique. We
mark the selection sequence in the “Seq.” columns of these three tables.
We propose M1 that records the most similar test cases to execute first. Turning M1 the other
way round, we also propose M2 that selects the least similar test cases to execute first.
M1: Maximum W-i Similarity prioritization (XPS-Total-Similarity). The technique invokes the
grouping function GF using W-i. The technique selects a pair of test cases with the greatest
similarity value (i.e., g1) using W-i, and randomly chooses one test case t in this pair. The
technique continues to select all pairs of test cases containing t from the same group. If
multiple test case pairs contain t, the technique randomly selects one pair to break the tie. M1
discards any test case in a selected pair if the test case has been included by a previously
selected pair. M1 repeats the above selection process first for the group, and once all test cases
in the group have been selected, then among the remaining groups in the ascending order of
the group index (i.e., from G2 to GM) until every unique test case has been selected.

To appear in International Journal of Web Services Research (JWSR)
12
TABLE 6. STATISTICS OF TEST CASE SIMILARITIES (W-I)
Similarity Group Selected Test Pairs in Order
Index Test Case Pairs Seq. M1 M2 M3 M4 M5 M6
1.000 G1 (t1, t2), (t1, t3), (t2, t3) 1
2
(t1, t2)
(t1, t3)
(t1, t5)
(t2, t5)
(t1, t5)
(t4, t5)
(t1, t2)
(t2, t4)
(t1, t5)
(t4, t5)
(t1, t2)
(t2, t4)
0.833 G2 (t1, t4), (t2, t4), (t3, t4) 3
4
(t2, t3)
(t1, t4)
(t3, t5)
(t5, t6)
(t1, t6)
(t4, t6)
(t4, t6)
(t3, t6)
(t1, t6)
(t1, t4)
(t1, t6)
(t2, t5)
0.667 G3 (t4, t6) 5 (t2, t4), (t4, t5) (t3, t4) (t5, t6) (t1, t2) (t1, t3)
0.571 G4 (t1, t6), (t2, t6), (t3, t6) 6
7
(t3, t4)
(t4, t6)
(t2, t3)
(t3, t5)
0.200 G5 (t4, t5), (t5, t6) 8 (t1, t6)
0.167 G6 (t1, t5), (t2, t5), (t3, t5)
9 (t2, t6)
10
11
(t3, t6)
(t4, t5)
TABLE 7. STATISTICS OF TEST CASE SIMILARITIES (W-II)
Similarity Group Selected Test Pairs in Order
Index Test Case Pairs Seq. M1 M2 M3 M4 M5 M6
1.00 G1 (t1, t2), (t1, t3),
(t2, t3)
1
2
(t1, t2)
(t1, t3)
(t1, t5)
(t2, t5)
(t1, t5)
(t5, t6)
(t1, t2)
(t2, t4)
(t1, t5)
(t5, t6)
(t1, t2)
(t2, t4)
0.76 G2 (t1, t4), (t2, t4),
(t3, t4)
3
4
(t2, t3)
(t3, t4)
(t3, t5)
(t5, t6)
(t4, t5)
(t2, t6)
(t4, t6)
(t3, t6)
(t1, t6)
(t1, t4)
(t1, t6)
(t2, t5)
0.67 G3 (t4, t6) 5 (t2, t4) (t4, t5) (t4, t6) (t4, t5) (t1, t3) (t2, t3)
0.53 G4 (t1, t6), (t2, t6),
(t3, t6)
6
7
(t1, t4)
(t4, t6)
(t3, t4)
(t2, t5)
0.17 G5 (t4, t5) 8 (t1, t6)
0.16 G6 (t5, t6) 9 (t2, t6)
0.13 G7 (t1, t5), (t2, t5),
(t3, t5)
10
11
(t3, t6)
(t4, t5)
TABLE 8. STATISTICS OF TEST CASE SIMILARITIES (W-III)
Similarity Group Selected Test Pairs in Order
Index Test Case Pairs Seq. M1 M2 M3 M4 M5 M6
1.00 G1 (t2, t3) 1 (t2, t3) (t1, t5) (t1, t5) (t2, t3) (t1, t5) (t2, t3)
0.84 G2 (t1, t4) 2 (t1, t4) (t4, t5) (t4, t5) (t1, t4) (t4, t5) (t1, t2)
0.83 G3 (t1, t2), (t1, t3) 3 (t1, t2) (t2, t5) (t2, t5) (t1, t2) (t2, t5) (t2, t4)
0.69 G4 (t2, t4), (t3, t4) 4 (t1, t3) (t3, t5) (t5, t6) (t2, t4) (t5, t6) (t2, t6)
0.66 G5 (t2, t6), (t3, t6) 5 (t3, t4) (t5, t6) (t1, t6) (t3, t6) (t1, t3) (t2, t5)
0.63 G6 (t4, t6) 6 (t2, t4) (t4, t6) (t4, t6)
0.55 G7 (t1, t6) 7 (t3, t6) (t3, t6) (t1, t6)
0.29 G8 (t5, t6) 8 (t2, t6) (t5, t6)
0.26 G9 (t2, t5), (t3, t5) 9 (t4, t6)
0.25 G10 (t4, t5) 10 (t1, t6)
0.21 G11 (t1, t5) 11 (t5, t6)
To appear in International Journal of Web Services Research (JWSR)
13
M2: Minimum W-i similarity prioritization (XPS-Total-Dissimilarity). This technique is the
same as M1 except that it first selects a pair of test cases with the minimum similarity value
using W-i (rather than the maximum W-i similarity value according to M1), and M2 repeats the
selection process among the remaining groups in ascending order of the group index.
We further propose M3 and M4, each of which selects one test case pair from each group in
turn until the group has been exhausted. M3 and M4 sample the groups in ascending and
descending orders (i.e., from G1 to GM, and from GM to G1), respectively, of the group index.
M3: Ascending W-i similarity prioritization (XPS-Iterative-Dissimilarity). The technique
invokes the grouping function GF using W-i. Then the technique samples all groups G1, …,
Gk, …, GM in ascending order of the group index k by selecting one pair of test cases, if any,
from each group in turn. The technique discards any test case in a selected pair if the test case
has been selected. The technique then removes the selected pair from the group. M3 repeats
the selection process among the non-empty groups until all the test cases have been selected.
M4: Descending W-i similarity prioritization (XPS-Iterative-Similarity). This technique is the
same as M3 except that it samples the groups GM, …, Gk, …, G1 in descending order of the
group index k, rather than in ascending order.
We further observe that there are no relations between two consecutive test pairs selected by
M1-M4. Therefore, we propose M5 and M6 to study the impact of the test pair relations, as a
refinement of M3 and M4.
M5: Refined ascending W-i similarity prioritization (XPS-Refined-Iterative-Dissimilarity).
The technique invokes the grouping function GF using W-i. Afterwards, the technique samples
the group G1 by selecting one pair of test cases (ta, tb), and then samples all the remaining
groups G2, …, Gk, …, GM in ascending order of the group index k by selecting one pair of test
cases that contain either ta or tb, if any, from each group in turn. The technique discards any
test case in a selected pair if the test case has been selected. The technique then removes the
selected pair from the group. M5 repeats the selection process among the non-empty groups
until all the test cases have been selected.
M6: Refined descending W-i similarity prioritization (XPS-Refined-Iterative-Similarity). This
technique is the same as M5 except that it first samples the group GM, and then samples the
remaining groups GM-1, …, Gk, …, G1 in descending order of the group index k, rather than in
ascending order.
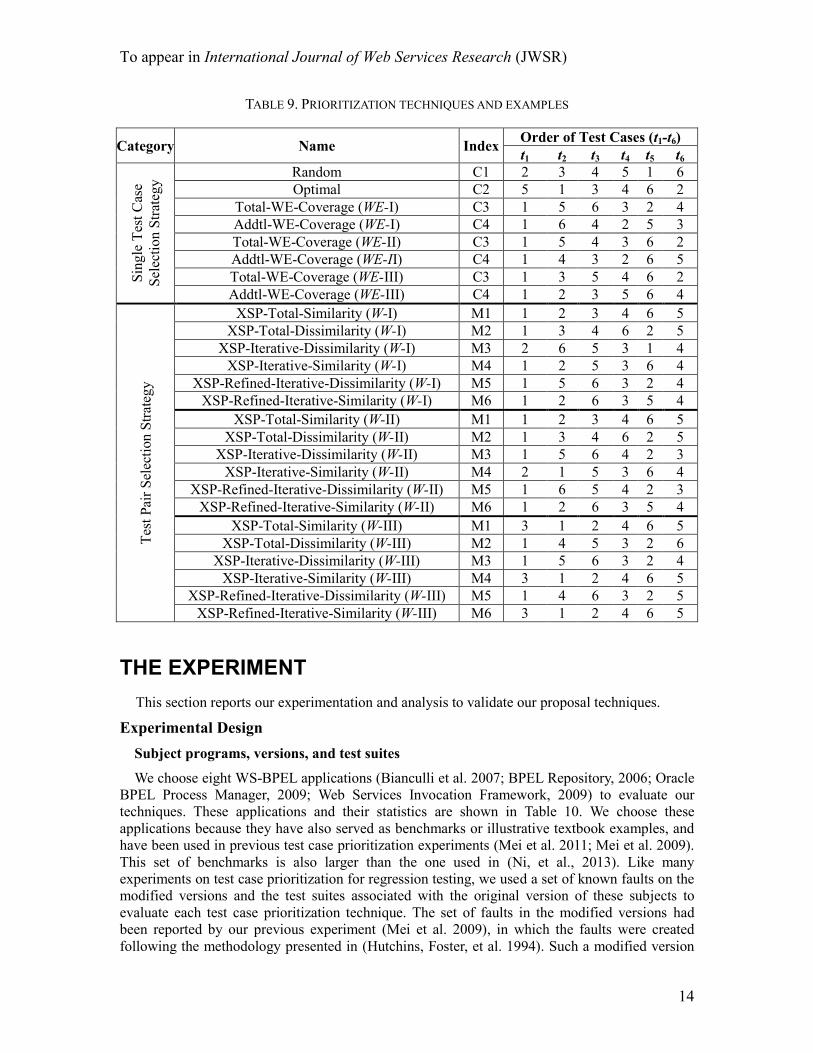
In addition to Tables 6-8, we also summarize the above techniques and examples in Table 9.
In this table, we provide a legitimate test case ordering for each technique. For C3 and C4, we
apply three coverage metrics (i.e., WE-I, WE-II, and WE-III) to generate the test case orders. For
each technique of M1 to M6, we apply the three similarity metrics (i.e., W-I, W-II, and W-III) to
generate the orders. These orderings of test cases can also be generated using the sequences of
test case pairs provided in Table 6, Table 7, and Table 8.
To appear in International Journal of Web Services Research (JWSR)
14
TABLE 9. PRIORITIZATION TECHNIQUES AND EXAMPLES
Category Name Index Order of Test Cases (t1-t6)
t1 t2 t3 t4 t5 t6
Sin
gle
Tes
t C
ase
Sel
ecti
on
Str
ateg
y Random C1 2 3 4 5 1 6
Optimal C2 5 1 3 4 6 2
Total-WE-Coverage (WE-I) C3 1 5 6 3 2 4
Addtl-WE-Coverage (WE-I) C4 1 6 4 2 5 3
Total-WE-Coverage (WE-II) C3 1 5 4 3 6 2
Addtl-WE-Coverage (WE-II) C4 1 4 3 2 6 5
Total-WE-Coverage (WE-III) C3 1 3 5 4 6 2
Addtl-WE-Coverage (WE-III) C4 1 2 3 5 6 4
Tes
t P
air
Sel
ecti
on S
trat
egy
XSP-Total-Similarity (W-I) M1 1 2 3 4 6 5
XSP-Total-Dissimilarity (W-I) M2 1 3 4 6 2 5
XSP-Iterative-Dissimilarity (W-I) M3 2 6 5 3 1 4
XSP-Iterative-Similarity (W-I) M4 1 2 5 3 6 4
XSP-Refined-Iterative-Dissimilarity (W-I) M5 1 5 6 3 2 4
XSP-Refined-Iterative-Similarity (W-I) M6 1 2 6 3 5 4
XSP-Total-Similarity (W-II) M1 1 2 3 4 6 5
XSP-Total-Dissimilarity (W-II) M2 1 3 4 6 2 5
XSP-Iterative-Dissimilarity (W-II) M3 1 5 6 4 2 3
XSP-Iterative-Similarity (W-II) M4 2 1 5 3 6 4
XSP-Refined-Iterative-Dissimilarity (W-II) M5 1 6 5 4 2 3
XSP-Refined-Iterative-Similarity (W-II) M6 1 2 6 3 5 4
XSP-Total-Similarity (W-III) M1 3 1 2 4 6 5
XSP-Total-Dissimilarity (W-III) M2 1 4 5 3 2 6
XSP-Iterative-Dissimilarity (W-III) M3 1 5 6 3 2 4
XSP-Iterative-Similarity (W-III) M4 3 1 2 4 6 5
XSP-Refined-Iterative-Dissimilarity (W-III) M5 1 4 6 3 2 5
XSP-Refined-Iterative-Similarity (W-III) M6 3 1 2 4 6 5
THE EXPERIMENT This section reports our experimentation and analysis to validate our proposal techniques.
Experimental Design
Subject programs, versions, and test suites
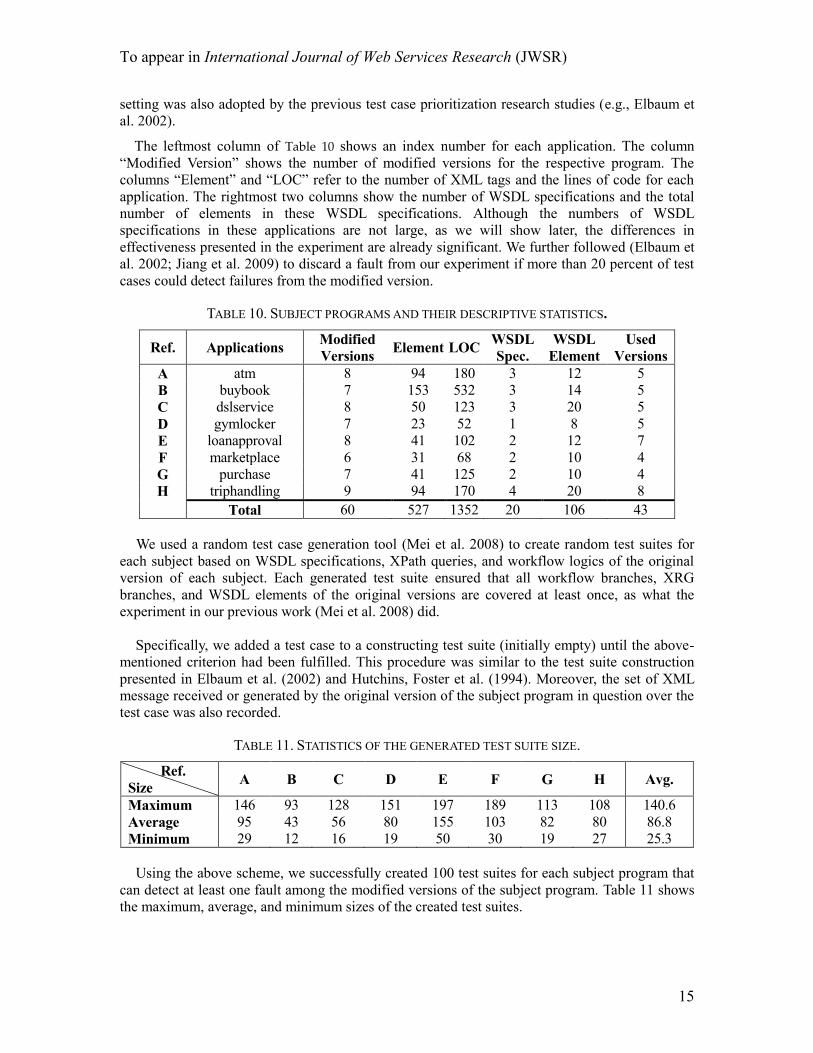
We choose eight WS-BPEL applications (Bianculli et al. 2007; BPEL Repository, 2006; Oracle
BPEL Process Manager, 2009; Web Services Invocation Framework, 2009) to evaluate our
techniques. These applications and their statistics are shown in Table 10. We choose these
applications because they have also served as benchmarks or illustrative textbook examples, and
have been used in previous test case prioritization experiments (Mei et al. 2011; Mei et al. 2009).
This set of benchmarks is also larger than the one used in (Ni, et al., 2013). Like many
experiments on test case prioritization for regression testing, we used a set of known faults on the
modified versions and the test suites associated with the original version of these subjects to
evaluate each test case prioritization technique. The set of faults in the modified versions had
been reported by our previous experiment (Mei et al. 2009), in which the faults were created
following the methodology presented in (Hutchins, Foster, et al. 1994). Such a modified version
To appear in International Journal of Web Services Research (JWSR)
15
setting was also adopted by the previous test case prioritization research studies (e.g., Elbaum et
al. 2002).
The leftmost column of Table 10 shows an index number for each application. The column
“Modified Version” shows the number of modified versions for the respective program. The
columns “Element” and “LOC” refer to the number of XML tags and the lines of code for each
application. The rightmost two columns show the number of WSDL specifications and the total
number of elements in these WSDL specifications. Although the numbers of WSDL
specifications in these applications are not large, as we will show later, the differences in
effectiveness presented in the experiment are already significant. We further followed (Elbaum et
al. 2002; Jiang et al. 2009) to discard a fault from our experiment if more than 20 percent of test
cases could detect failures from the modified version.
TABLE 10. SUBJECT PROGRAMS AND THEIR DESCRIPTIVE STATISTICS.
Ref. Applications Modified
Versions Element LOC
WSDL
Spec.
WSDL
Element
Used
Versions
A atm 8 94 180 3 12 5
B buybook 7 153 532 3 14 5
C dslservice 8 50 123 3 20 5
D gymlocker 7 23 52 1 8 5
E loanapproval 8 41 102 2 12 7
F marketplace 6 31 68 2 10 4
G purchase 7 41 125 2 10 4
H triphandling 9 94 170 4 20 8
Total 60 527 1352 20 106 43
We used a random test case generation tool (Mei et al. 2008) to create random test suites for
each subject based on WSDL specifications, XPath queries, and workflow logics of the original
version of each subject. Each generated test suite ensured that all workflow branches, XRG
branches, and WSDL elements of the original versions are covered at least once, as what the
experiment in our previous work (Mei et al. 2008) did.
Specifically, we added a test case to a constructing test suite (initially empty) until the above-
mentioned criterion had been fulfilled. This procedure was similar to the test suite construction
presented in Elbaum et al. (2002) and Hutchins, Foster et al. (1994). Moreover, the set of XML
message received or generated by the original version of the subject program in question over the
test case was also recorded.
TABLE 11. STATISTICS OF THE GENERATED TEST SUITE SIZE.
Ref.
Size A B C D E F G H Avg.
Maximum 146 93 128 151 197 189 113 108 140.6
Average 95 43 56 80 155 103 82 80 86.8
Minimum 29 12 16 19 50 30 19 27 25.3
Using the above scheme, we successfully created 100 test suites for each subject program that
can detect at least one fault among the modified versions of the subject program. Table 11 shows
the maximum, average, and minimum sizes of the created test suites.

To appear in International Journal of Web Services Research (JWSR)
16
Effectiveness measure
The metric “average percentage of faults detected” (APFD) (Elbaum et al. 2002) has been
widely adopted in evaluating test case prioritization techniques. We chose to use APFD because it
matches our objective to verify whether a technique supports service evolution.
Let T be a test suite containing n test cases, F be a set of m faults revealed by T, and TFi be the
first test case index in the reordered test suite T’ of T that reveals fault i. The following equation
gives the APFD value for a test suite T’.
nnm
TFTFTFAPFD m
2
1...1 21
(E-5)
Procedure
Our tool applied C1C4 and M1M6 to prioritize each constructed test suite for each subject
program. For C3C4, we used the three levels of information WE-i (for i = I, II, and III) in turn.
For M1M6, we used the three similarity metrics W-i (for i = I, II, and III) in turn.
We executed the reordered test suite on each modified version of the subject and collected each
TFi value for i-th fault (if the k-th test case in the reordered test suite is the first test case that can
detect the i-th fault, then TFi is set to k). We finally calculated the APFD value of this reordered
test suite (by E-5).
Data analysis
To ease the view of differences of these techniques, we summarize the results using the box
plots for each technique in Figure 6. Figure 6 shows that M3-M6 generally show an upward trend
(in terms of APFD) when the similarity metrics changes from W-I to W-II and from W-II to W-III.
On the contrary, M1-M2 shows a downward trend when the similarity metrics changes from W-I
to W-II, and from W-II to W-III. C3 and C4 only show a small change in different coverage
metrics in terms of the median APFD value.
C3 C4 M1 M2 M3 M4 M5 M6
0.76
0.78
0.8
0.82
0.84
0.86
0.88
0.9
0.92
0.94
0.96
0.98
1
C1 C2 C3-I C3-II
C3-III
C4-I C4-II
C4-III
M1-I M1-II
M1-III
M2-I M2-II
M2-III
M3-I M3-II
M3-III
M4-I M4-II
M4-III
M5-I M5-II
M5-III
M6-I M6-II
M6-III
Figure 6. Average effectiveness of C1-C4 and M1-M6
The insensitiveness of C3-C4 and M1-M2 to a mixture of static and dynamic information is
quite surprising. It warrants further research. (On the other hand, we are interested in M3–M6,

To appear in International Journal of Web Services Research (JWSR)
17
and thus, the in-depth study of C3-C4 and M1-M2 is not within the scope of this paper.) The
observations also show that the better results (in terms of APFD) cannot be achieved through
directly adopting traditional techniques to make use of test case similarity.
To further find the relative merits on individual techniques, we compute the difference in
effectiveness (by comparing the value TFi of each test suite on each fault version) between C1
and M3-M6. The result is shown in Table 12.
Take the cell in column “M3−C1” (W-I) and row “>5%” as an example. It shows that, for 17%
of all the detected faulty versions, using M3 (W-I) to reveal a fault uses less test cases than that of
C1 by more than 5% (test suite size). Similarly, the row “<-5%” shows that, for only 0% of all the
detected faulty versions, using M3 (W-I) to reveal a fault uses more test cases than that of C1 by
more than 5% (test suite size). For 83% of the faulty versions, the effectiveness between M3 and
C1 cannot be distinguished at the 5% level.
We select three levels of difference (1%, 5%, and 10%) for comparison. Since Figure 6 already
shows that M1 and M2 using all three levels of similarity metrics are not better (or even worse)
than C1, we only compare M3-M6 with C1. We observe that, at both 1% and 5% levels, the
probability of M3-M6 using all three levels of similarity metrics are performing better than C1.
The experimental result shows that the probability of M3-M6 performing better than C1 is
consistently higher than that for the other way round.
TABLE 12. STATISTICS OF DIFFERENCE IN FAULT DETECTION
Technique
(x, y)
W-I (%) W-II (%) W-III (%)
M3-C
1
M4-C
1
M5-C
1
M6-C
1
M3-C
1
M4-C
1
M5-C
1
M6-C
1
M3-C
1
M4-C
1
M5-C
1
M6-C
1
<-1% 2 2 2 1 2 2 1 1 2 2 1 1 -1% to 1% 41 43 41 40 40 43 43 39 41 40 40 39
>1% 57 55 57 59 58 55 56 60 57 58 59 60
<-5% 0 0 0 0 0 0 0 0 0 0 0 0 -5% to 5% 83 83 83 83 83 84 83 83 83 82 82 83
>5% 17 17 17 17 17 16 17 17 17 18 18 17
<-10% 0 0 0 0 0 0 0 0 0 0 0 0 -10% to 10% 96 95 95 95 96 96 96 96 96 95 95 96
>10% 4 5 5 5 4 4 4 4 4 5 5 4
To verify the robustness of our techniques, we simulate some scenarios when the small
percentages (5%, 10%, and 20%) of XML messages have been lost (which are randomly chosen).
We also list the result achieved when there is no message lost (i.e., 0%) for comparison.
TABLE 13. MEAN APFDS OF DIFFERENT PERCENTAGES OF LOST MESSAGES
Percents M3 M4 M5 M6
W-II
0.00 0.859 0.865 0.859 0.866
0.05 0.866 0.865 0.858 0.868
0.10 0.867 0.869 0.864 0.867
0.20 0.869 0.879 0.869 0.871
W-III
0.00 0.901 0.903 0.899 0.900
0.05 0.901 0.901 0.904 0.904
0.10 0.904 0.906 0.904 0.905
0.20 0.904 0.909 0.903 0.907
To appear in International Journal of Web Services Research (JWSR)
18
0.8 0.81 0.82 0.83 0.84 0.85 0.86 0.87 0.88
M6
M5
M4
M3
M2
M1
C4
C3
C1
0.8 0.81 0.82 0.83 0.84 0.85 0.86 0.87 0.88
M6
M5
M4
M3
M2
M1
C4
C3
C1
0.8 0.81 0.82 0.83 0.84 0.85 0.86 0.87 0.88
M6
M5
M4
M3
M2
M1
C4
C3
C1
0.8 0.81 0.82 0.83 0.84 0.85 0.86 0.87 0.88
M6
M5
M4
M3
M2
M1
C4
C3
C1
(a) Compared with M3 (b) Compared with M4 (c) Compared with M5 (d) Compared with M6
0.8 0.81 0.82 0.83 0.84 0.85 0.86 0.87 0.88
M6
M5
M4
M3
M2
M1
C4
C3
C1
0.8 0.81 0.82 0.83 0.84 0.85 0.86 0.87 0.88
M6
M5
M4
M3
M2
M1
C4
C3
C1
0.8 0.81 0.82 0.83 0.84 0.85 0.86 0.87 0.88
M6
M5
M4
M3
M2
M1
C4
C3
C1
0.8 0.81 0.82 0.83 0.84 0.85 0.86 0.87 0.88
M6
M5
M4
M3
M2
M1
C4
C3
C1
0.8 0.81 0.82 0.83 0.84 0.85 0.86 0.87 0.88
M6
M5
M4
M3
M2
M1
C4
C3
C1
Figure 7. Multiple Comparisons of C1, C3, C4, M1-M4 using WE-I/W-I metrics (x-axis is the APFD value, y-axis is test pair selection strategies)
c
0.8 0.81 0.82 0.83 0.84 0.85 0.86 0.87 0.88
M6
M5
M4
M3
M2
M1
C4
C3
C1
0.8 0.81 0.82 0.83 0.84 0.85 0.86 0.87 0.88
M6
M5
M4
M3
M2
M1
C4
C3
C1
0.8 0.81 0.82 0.83 0.84 0.85 0.86 0.87 0.88
M6
M5
M4
M3
M2
M1
C4
C3
C1
0.8 0.81 0.82 0.83 0.84 0.85 0.86 0.87 0.88
M6
M5
M4
M3
M2
M1
C4
C3
C1
(a) Compared with M3 (b) Compared with M4 (c) Compared with M5 (d) Compared with M6
0.8 0.81 0.82 0.83 0.84 0.85 0.86 0.87 0.88
M6
M5
M4
M3
M2
M1
C4
C3
C1
0.8 0.81 0.82 0.83 0.84 0.85 0.86 0.87 0.88
M6
M5
M4
M3
M2
M1
C4
C3
C1
0.8 0.81 0.82 0.83 0.84 0.85 0.86 0.87 0.88
M6
M5
M4
M3
M2
M1
C4
C3
C1
0.8 0.81 0.82 0.83 0.84 0.85 0.86 0.87 0.88
M6
M5
M4
M3
M2
M1
C4
C3
C1
0.8 0.81 0.82 0.83 0.84 0.85 0.86 0.87 0.88
M6
M5
M4
M3
M2
M1
C4
C3
C1
Figure 8. Multiple Comparisons of C1, C3, C4, M1-M4 using WE-II/W-II metrics (x-axis is the APFD value, y-axis is test pair selection strategies)
0.65 0.7 0.75 0.8 0.85 0.9 0.95 1
M6
M5
M4
M3
M2
M1
C4
C3
C1
0.65 0.7 0.75 0.8 0.85 0.9 0.95 1
M6
M5
M4
M3
M2
M1
C4
C3
C1
0.65 0.7 0.75 0.8 0.85 0.9 0.95 1
M6
M5
M4
M3
M2
M1
C4
C3
C1
0.65 0.7 0.75 0.8 0.85 0.9 0.95 1
M6
M5
M4
M3
M2
M1
C4
C3
C1
(a) Compared with M3 (b) Compared with M4 (c) Compared with M5 (d) Compared with M6
Figure 9. Multiple Comparisons of C1, C3, C4, M1-M4 using WE-III/W-III metrics (x-axis is the APFD value, y-axis is test pair selection strategies)
Since W-I does not include the information on XML messages, we only show the results for the
other two coverage/ similarity metrics in Table 13. Moreover, since M1-M2 have reported no
better (or even worse) results than C1, and thus we only include M3-M6. Table 13 shows that
when there are a small number of messages lost, the result does not change much. The results
show that our techniques are robust when there are small percentages of message lost.
We further refer to (Li et al. 2007; Jiang et al. 2009) and adopt hypothesis testing to study the
differences between the above techniques. We perform the one-way ANOVA analysis using
MATLAB with the default alpha correction setting to find out whether the means of the APFD
distributions for different techniques (including each technique in M3–M6 on all three similarity
metrics) differ significantly. Since the optimal technique is unrealistic, we omit the comparison
with the optimal technique in the hypothesis testing.
The null hypothesis is that the means of APFD values for C1, C3–C4, and M1-M6 (when using
each metrics) are equal. To decide whether to accept or reject the null hypothesis, we set the

To appear in International Journal of Web Services Research (JWSR)
19
significance level to 0.05. If the significance is smaller than 0.05, the difference among the
techniques is statistically significant. The ANOVA analysis returns a p-value that is much less than
0.05, which successfully rejects the null hypothesis at the 5% significance level.
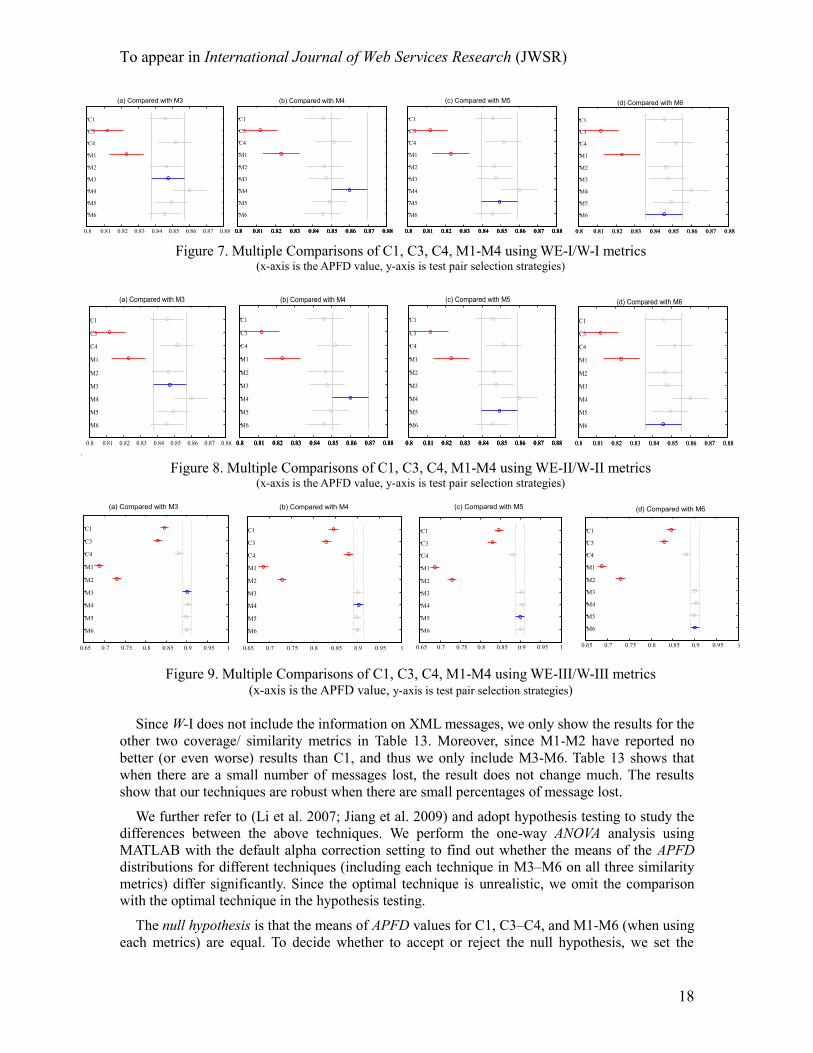
Following (Jiang et al. 2009), we further conduct multiple comparison procedure to study the
means of which test case prioritization techniques differ significantly from each other at the 5%
significance level. We follow (Jiang et al. 2009) to present the multiple comparison results in
Figures 7-9. In these figures, the blue line represents the target technique that we want to compare
with other techniques. The red lines represent the techniques whose means differ significantly
from the target technique, and the grey lines represents techniques comparable to the target
technique.
We use M3-M6 using the similarity metrics W-I, W-II, and W-III as the target technique in
Figure 7(a)-(d), Figure 8(a)-(d), and Figure 9(a)-(d), respectively. We find that M3-M6 using all
three similarity metrics can significantly outperform C3 and M1, which are two total techniques
(Total-WE-Coverage and XPS-Total-Similarity). M3-M6 using W-III are all better than the
random testing. However, there is no significant differences between M3-M6 using W-I or W-II
and the random testing. These observations align with previous test case prioritization studies that
the code coverage information is important in test case prioritization.
M4 using W-III shows much better results than C1, C3-C4, and M1-M2. M3, M5-M6 shows
better results than C1, C3, and M1-M2. It is good to find that M4 can significantly outperform C4,
which has been reported to be an effective technique in (Elbaum et al. 2002). This finding shows
that the strategy of pairwise selection in test case prioritization can make our techniques more
effective (in terms of APFD) than conventional techniques.
Through comparing Figures 7-9 from W-I to W-III, we also find that each of M3–M6 is
increasingly more effective compared to C3-C4 or M1-M2. We also observe that C4 outperforms
C3 at the same coverage level, and M2 outperforms M1 at the same similarity level. The results
show that our techniques can be promising in scheduling test cases to reveal faults early. It also
shows that incorporating both static and run-time data (XML messages in our case) to facilitate
test case prioritization to conduct regression testing has good impacts on test suite effectiveness to
detect faults in a more cost-effective manner.
There are no significant differences between M3-M6 using all the three similarity metrics. The
results indicate that the same similarity metrics may have different effects on the various
prioritization techniques.
We further wonder if there is any significant difference between the same technique using
different similarity metrics. Therefore, we show the pairwise comparison results of the techniques
M1M6 using different similarity metrics in Table 14 (the significance level is also set as 0.05).
We use “” to indicate that there is no significant difference between two techniques, and use
“x<y” or “x>y” to indicate that y is significantly better or worse than x.
TABLE 14. PAIRWISE COMPARISONS (between W-I, W-II and W-III using Mi, i = 1 to 6)
Technique (x, y) W-I (x) vs. W-II (y) W-I (x) vs. W-III (y) W-II (x) vs. W-III (y)
M1, M1 x>y x>y x>y
M2, M2 x>y x>y
M3, M3 x<y x<y
M4, M4 x<y x<y
M5, M6 x<y x<y
M6, M6 x<y x<y x<y
To appear in International Journal of Web Services Research (JWSR)
20
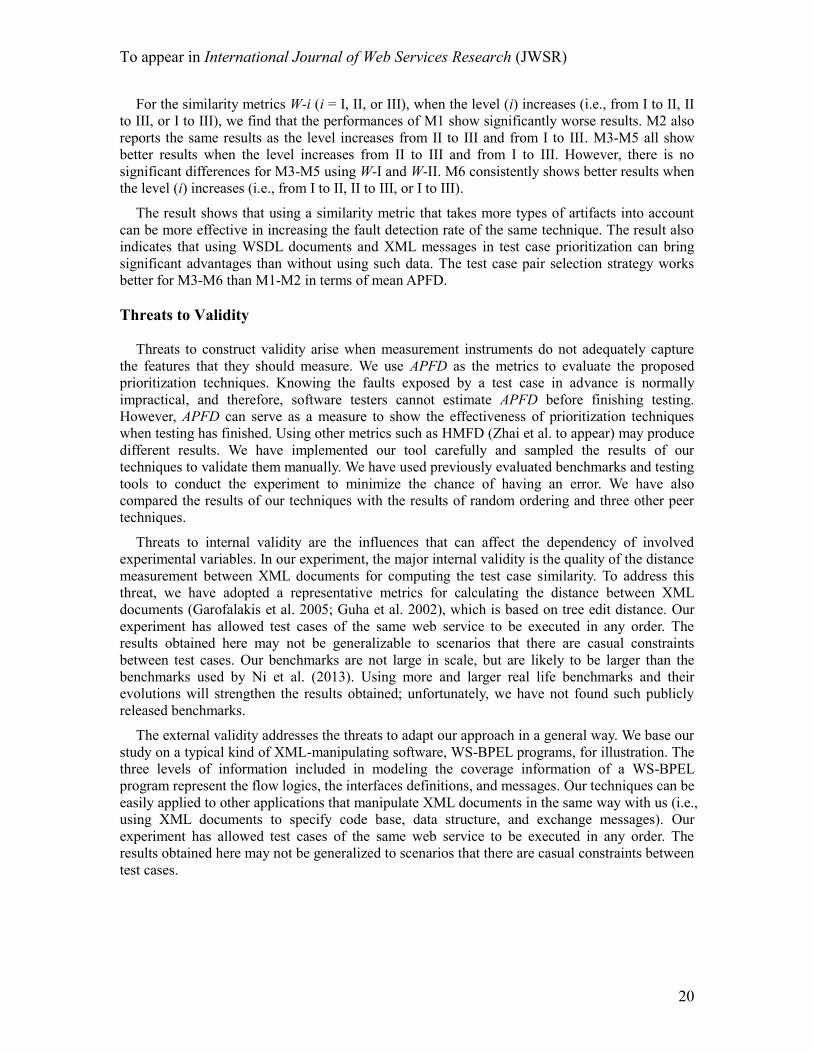
For the similarity metrics W-i (i = I, II, or III), when the level (i) increases (i.e., from I to II, II
to III, or I to III), we find that the performances of M1 show significantly worse results. M2 also
reports the same results as the level increases from II to III and from I to III. M3-M5 all show
better results when the level increases from II to III and from I to III. However, there is no
significant differences for M3-M5 using W-I and W-II. M6 consistently shows better results when
the level (i) increases (i.e., from I to II, II to III, or I to III).
The result shows that using a similarity metric that takes more types of artifacts into account
can be more effective in increasing the fault detection rate of the same technique. The result also
indicates that using WSDL documents and XML messages in test case prioritization can bring
significant advantages than without using such data. The test case pair selection strategy works
better for M3-M6 than M1-M2 in terms of mean APFD.
Threats to Validity
Threats to construct validity arise when measurement instruments do not adequately capture
the features that they should measure. We use APFD as the metrics to evaluate the proposed
prioritization techniques. Knowing the faults exposed by a test case in advance is normally
impractical, and therefore, software testers cannot estimate APFD before finishing testing.
However, APFD can serve as a measure to show the effectiveness of prioritization techniques
when testing has finished. Using other metrics such as HMFD (Zhai et al. to appear) may produce
different results. We have implemented our tool carefully and sampled the results of our
techniques to validate them manually. We have used previously evaluated benchmarks and testing
tools to conduct the experiment to minimize the chance of having an error. We have also
compared the results of our techniques with the results of random ordering and three other peer
techniques.
Threats to internal validity are the influences that can affect the dependency of involved
experimental variables. In our experiment, the major internal validity is the quality of the distance
measurement between XML documents for computing the test case similarity. To address this
threat, we have adopted a representative metrics for calculating the distance between XML
documents (Garofalakis et al. 2005; Guha et al. 2002), which is based on tree edit distance. Our
experiment has allowed test cases of the same web service to be executed in any order. The
results obtained here may not be generalizable to scenarios that there are casual constraints
between test cases. Our benchmarks are not large in scale, but are likely to be larger than the
benchmarks used by Ni et al. (2013). Using more and larger real life benchmarks and their
evolutions will strengthen the results obtained; unfortunately, we have not found such publicly
released benchmarks.
The external validity addresses the threats to adapt our approach in a general way. We base our
study on a typical kind of XML-manipulating software, WS-BPEL programs, for illustration. The
three levels of information included in modeling the coverage information of a WS-BPEL
program represent the flow logics, the interfaces definitions, and messages. Our techniques can be
easily applied to other applications that manipulate XML documents in the same way with us (i.e.,
using XML documents to specify code base, data structure, and exchange messages). Our
experiment has allowed test cases of the same web service to be executed in any order. The
results obtained here may not be generalized to scenarios that there are casual constraints between
test cases.
To appear in International Journal of Web Services Research (JWSR)
21
RELATED WORK
Firstly, we review service modeling in brief. Zhang et al. (2004) have proposed to use a Petri-
net based specification model for web services to facilitate verification and monitoring of web
service integration. Bianculli et al. (2007) have presented an approach based on the software
model checker Bogor, which can support the modeling of all BPEL4WS constructs. They aim to
verify the workflows described in BPEL4WS. Nitto et al. (2008) analyzed the possible ways to
build the highly dynamic and self-adaptive systems using services. Ni et al. (2011) proposed to
model the WS-BPEL program under test as a message-sequence graph (MSG). Message
sequences are further generated based on MSG to capture the order relationship in a message
sequence and the constraints on correlated messages imposed by WS-BPEL’s routing mechanism.
In this paper, we focus on modeling the interactions between individual workflow steps and XML
documents used in these workflow steps via WSDL specifications.
We further review the testing approaches that relate to services and service-oriented
applications. Wasikon et al. (2012) reviewed the current testing approaches for Semantic Web
Services based on semantic specification. Zhang (2004) proposed a mobile agent-based approach
to select the reliable web services components. Her approach can facilitate the testing of
reliability and interoperability of web services. Alsmadi and Alda (2012) proposed several
approaches for test case selection in regression testing of web services. They developed a pre-test
execution component to evaluate the generated test cases and optimize the test case selection.
They also proposed to utilize the historical usage sessions to direct and optimize test case
generation and execution. However, these approaches are not concerned with workflow logics.
Bai et al. (2008) had proposed an ontology-based approach for testing web services. They
defined a test ontology model to specify the test concepts, relationships, and semantics, and
discussed how to generate the sub-domains for input partition testing with the ontology
information. We use different levels of program information, rather than the ontology model.
Yu and Lau (2012) proposed the notion of fault-based test case prioritization. Their technique
directly utilizes the theoretical knowledge of the fault-detecting ability of test cases, and the
relationships among the test cases and the faults in the prescribed fault model, which is used to
generate test cases. Comparing to their technique, our techniques make use of source codes.
Zhai et al. (2010) have observed that that locations captured in the inputs and the expected
outputs of test cases are physically correlated by the LBS-enabled services, which heuristically
use estimated and imprecise locations for their computations. As such, these services tend to treat
locations in close proximity homogenously. Based on their observation, they have proposed
input-guided techniques and point-of-interest aware test case prioritization techniques.
Furthermore, Zhai et al. (to appear) further extensively examined the effectiveness of different
test case prioritization with respect to different category of service faults. In this paper, we do not
use location information.
Li et al. (2007) proposes search algorithms for test case prioritizations. Li et al. (2010) studied
five search algorithms for test case prioritization and compared the performance of these
algorithms via a simulation experiment.
You et al. (2011) considered the criteria of statement coverage and fault detection for time-
aware test case prioritization. They investigated that whether the time cost of each test case
affects the effectiveness of prioritization techniques, in terms of the rate of statement coverage
and the rate of fault detection. Our test case prioritization techniques are not time-aware, but can
be extended to time-aware techniques in the same way.
To appear in International Journal of Web Services Research (JWSR)
22
Mei et al. (2008) tackle the complexity of XPath in integrating individual workflow steps in
service-oriented workflow applications. They propose to use the mathematical definitions of
XPath as rewriting rules, and develop a new data structure to record the intermediate rewriting
results and the final rewritten forms. They also develop an algorithm to compute such data
structures and propose a family of adequacy criteria for unit test. In this paper, we focus on
analyzing the WSDL specifications and XML messages, rather than XPath queries.
Chan et al. (2007) proposed a metamorphic testing technique for on-line service testing to
alleviate the test oracle problem of service testing. They use off-line testing to determine a set of
successful test cases and then construct their corresponding follow-up test cases for the online
testing. Sun et al. (2012) further proposed a metamorphic relation-based approach to testing
service without oracles. Different from Chan’s work, they take into account the unique features of
SOA to automate the testing framework. They also performed three case studies for evaluation. In
contract, our work uses the results of previous program versions as the test oracle, which is
readily available in regression testing scenario.
Becker et al. (2011) proposed an approach to automatic determination of compatibility in
evolving services. They describe a method to determine when two service descriptions are
backward compatible. Based on the compatibility information, developers can assess, control, and
validate the service evolutions.
Let us continue to review the dynamic nature of services in services testing. Bai et al. (2007)
studied the dynamic configuration management for testing services, and they developed a tool to
enable test agents to bind dynamically to each other and build up the runtime collaborations. They
also proposed adaptive techniques for facilitate services testing (Bai et al. 2007). Since such
changes may also affect WSDL specifications and XML messages, our techniques can also be
used for detecting potential faults.
Next, we review the clustering techniques for test case prioritization. (Carlson et al. 2011)
proposed to utilize code coverage, code complexity, and history data on real faults to incorporate
a clustering approach in prioritization. (Yoo et al. 2009) studied the use of clustering in enabling
the application of the interactive prioritization technique (AHP). They utilized dynamic execution
traces of each test case as the base to compute the test case similarity. They further proposed an
AHP-based prioritization technique. Our techniques focus on studying the extensive use of XML
in test case prioritization.
Finally, we review related approaches on test case prioritization for services. Conventional
coverage-based test case prioritization techniques (Elbaum et al. 2002) have been reviewed in
Section 2. Wang et al. (2010) proposed to vary the combination weights to achieve cost-effective
combinatorial test case prioritization. Mei et al. develop two families of test case prioritization
techniques (Mei et al. 2009; 2011). One family (Mei et al. 2009) is built on top of their earlier
model (Mei et al. 2008), and another family (Mei et al. 2011) is built to recognize the importance
of XML messages. None of them has explored the pairwise selection strategy. Chen et al.
proposed a dependence analysis based test case prioritization technique for regression testing of
services (Chen et al. 2010). They analyze the data- and control- flow information within an
orchestration language, perform impact analysis on weighted graph, and prioritize the test cases
to cover more modification-affected elements in the graph. Nguyen et al. proposed an information
retrieval based test case prioritization technique for audit testing of evolving web services
(Nguyen et al. 2011). Their approach matches a service change description with the code
executed by the relevant test cases, and prioritizes the test cases based on their relevance to the
service modification.

To appear in International Journal of Web Services Research (JWSR)
23
CONCLUSION
Pairwise selection is a fundamental strategy to compare elements and pick associations
between elements in a finite set. Using the notion of structural similarity is attractive to spot the
differences in semi-structural artifacts like XML documents. In this paper, we have proposed test
case prioritization techniques based on this strategy for the regression testing of WS-BPEL web
services. Our techniques consider the structural relationships among workflow modules, WSDL
specifications, and XML messages associated with each pair of test cases. Based on such
quantification, we have developed a family of new prioritization techniques to reorder test cases.
Our techniques use not only the coverage information of design-time artifacts, but also the
dynamic coverage information of run-time data generated by such web service. We have
empirically demonstrated that our techniques are feasible, and some of them can be more
effective than existing techniques or random ordering in terms of APFD.
In terms of pairwise comparison, our techniques give an exact solution, but are NP-complete.
A further optimization such as the use of an approximation approach can be further developed.
Another extension is to study the n-way selection strategy. Our work only deals with a part of the
self-adaptation cycle needed for web service evolution. A more comprehensive study that deals
with self-adaptation is necessary.
AKNOWLEGMENT
This research is supported in part by grants of the Research Grants Council of Hong Kong (project
nos. 111410, 123512, 716612, 717811, and 717308) and the National Natural Science Foundation
of China (project no. 61202077).
REFERENCES
Alsmadi, I., Alda, S. (2012). Test cases reduction and selection optimization in testing web services. In
Proceedings of I.J. Information Engineering and Electronic Business, 4(5):1–8.
Bai, X., Chen, Y., Shao, Z. (2007). Adaptive Web Services Testing. In Proceedings of COMPSAC 2007,
(2): 233–236.
Bai, X., Lee, S., Tsai, W.-T., Chen, Y. (2008). Ontology-Based Test Modeling and Partition Testing of
Web Services. In Proceeding of ICWS 2008, pages 465–472.
Bai, X., Xu, D., Dai, G. (2007). Dynamic reconfigurable testing of service-oriented architecture. In
Proceedings of COMPSAC 2007, (1): 368–378.
Becker, K., Pruyne, J., Singhal, S., Lopes, A., & Milojicic, D. (2011). Automatic Determination of
Compatibility in Evolving Services. International Journal of Web Services Research (IJWSR), 8(1), 21-40.
Bianculli, D., Ghezzi, C., Spoletini, P. (2007). A model checking approach to verify BPEL4WS workflows.
In Proceedings of SOCA 2007, pages 13–20.
BPEL Repository. IBM, 2006. Available at http://www.alphaworks.ibm.com/tech/bpelrepository.
Carlson, R., Hyunsook, D., Denton, A. (2011). A clustering approach to improving test case prioritization:
An industrial case study. In Proceedings of ICSM 2011, pages 382–391.
Chan, W. K., Cheung, S. C., and Leung, K. R. (2007). A Metamorphic Testing Approach for Online
Testing of Service-Oriented Software Applications. International Journal of Web Services Research
(IJWSR), 4(2), 61-81.
To appear in International Journal of Web Services Research (JWSR)
24
Chen, L., Wang Z., Xu, L., Lu H., Xu, B. (2010). Test Case Prioritization for Web Service Regression
Testing. In Proceedings of SOSE 2010, pages 173-178.
Elbaum, S., Malishevsky, A.G., Rothermel, G. (2002). Test case prioritization: A family of empirical
studies. IEEE Transactions on Software Engineering (IEEE TSE), 28(2): 159-182.
Fu, X., Bultan, T., Su, J. (2004). Model checking XML manipulating software. In Proceedings of ISSTA
2004, pages 252–262.
Garofalakis, M., Kumar, A. (2005). XML stream processing using tree-edit distance embeddings. ACM
Transactions on Database Systems (TODS), 30(1): 279–332.
Guha, S., Jagadish, H.V., Koudas, N., Srivastava, D., Yu, T. (2002). Approximate XML Joins. In
Proceedings of the 2002 ACM SIGMOD International Conference on Management of Data, pages 287–
298.
Hutchins, M., Foster, H., Goradia, T., Ostrand, T. (1994). Experiments on the effectiveness of dataflow-
and controlflow-based test adequacy criteria. In Proceedings ICSE 1994, pages 191–200.
Jaccard Index. Available at http://en.wikipedia.org/wiki/Jaccard_index. (Last access on May 5, 2013)
Jiang, B., Zhang, Z., Chan, W.K., Tse, T.H. (2009). Adaptive random test case prioritization. In
Proceedings ASE 2009, pages 233–244.
Krishnamoorthi, R., Mary, S.A. (2009). Regression test suite prioritization using genetic algorithms.
International Journal of Hybrid Information Technology, 2(3):35–52.
Li, S., Bian, N., Chen, Z., You, D., He, Y. (2010). A simulation study on some search algorithms for
regression test case prioritization. In Proceedings of QSIC 2010, 72–81.
Li, Z., Harman, M., Hierons, R.M. (2007). Search algorithms for regression test case prioritization. Test
case prioritization. IEEE TSE, 33(4):225–237.
Mei, L., Chan, W.K., Tse, T.H. (2008). Data flow testing of service-oriented workflow applications. In
Proceedings of ICSE 2008, pages 371–380.
Mei, L., Chan, W.K., Tse, T.H., Merkel, R. G. (2011). XML-manipulating test case prioritization for XML-
manipulating services. Journal of Systems and Software 84(4): 603–619.
Mei, L., Zhang, Z., Chan, W.K., Tse, T.H. (2009). Test case prioritization for regression testing of service-
oriented business applications. In Proceedings of WWW 2009, pages 901–910.
Mei, L., Cai, Y., Jia, C., Jiang, B., Chan, W.K. (2013). Prioritizing Structurally Complex Test Pairs for
Validating WS-BPEL Evolutions. In Proceedings of ICWS 2013, forthcoming.
Nguyen, C.D., Marchetto, A., Tonella, P., Test Case Prioritization for Audit Testing of Evolving Web
Services Using Information Retrieval Techniques. In Proceedings of ICWS 2011, pages 636-643.
Ni, Y., Hou, S., Zhang, L., Zhu, J., Li, Z., Lan, Q., Mei, H., Sun, J. (2013). Effective message-sequence
generation for testing BPEL programs. IEEE Transactions on Services Computing, 6(1):7-19.
Nitto, E.D., Ghezzi, C., Metzger, A., Papazoglou, M.P., and Pohl, K. (2008). A journey to highly dynamic,
self-adaptive service-based applications. Automated Software Engineering, 15(3-4): 313–341.
Oracle BPEL Process Manager 10.1.2 (2007). Oracle Technology Network. Available at
http://www.oracle.com/technology/products/ias/bpel/. (Last access on May 5, 2013)
Sun, C., Wang, G., Mu, B., Liu, H., Wang, Z., and Chen, T. Y. (2012). A Metamorphic Relation-Based
Approach to Testing Web Services Without Oracles. International Journal of Web Services Research
(IJWSR), 9(1), 51-73.
W3C. Web Services Description Language (WSDL) 1.1. 2001. Available at http://www.w3.org/TR/wsdl.
Wang, Z., Xu, B., Chen, L., Chen, Z. (2010). Cost-effective combinatorial test case prioritization for
varying combination weights. In Proceedings of SEKE 2010, 273–278.

To appear in International Journal of Web Services Research (JWSR)
25
Wasikon, S.M., Kadir, W.M.N.W, Ghani, I. (2012). Semantic specification-based of web services testing –
a review. Information Technology & Computer Science. 1:869–875.
Web Services Business Process Execution Language Version 2.0 (2007). Available at http://www.oasis-
open.org/committees/ wsbpel/.
Web Services Invocation Framework: DSL provider sample application. Apache Software Foundation.
2006. Available at http://ws.apache.org/wsif/wsif_samples/index.html.
World Wide Web Consortium (2007). XML Path Language (XPath) Recommendation. Available at
http://www.w3.org/ TR/xpath20/.
Yang, M. S., Wu, K.L. (2004). A similarity-based robust clustering method. IEEE Transactions on Pattern
Analysis and Machine Intelligence (IEEE PAMI), 26(4): 434–448.
Yeung, D.S., Wang, X.Z. (2002). Improving performance of similarity-based clustering by feature weight
learning. IEEE PAMI, 24(4): 556–561.
Yoo, S., Harman, M., Tonella, P., Susi, A. (2009). Clustering test cases to achieve effective and scalable
prioritization incorporating expert knowledge. In Proceedings of ISSTA 2009, pages 201–212.
You, D., Chen, Z., Xu, B., Luo, B., Zhang, C. (2011). An empirical study on the effectiveness of time-
aware test case prioritization techniques. In Proceedings of SAC 2011, pages 1451–1456.
Yu, Y.T., Lau M.F. (2012). Fault-based test suite prioritization for specification-based testing. Information
& Software Technology, 54(2): 179–202.
Zhai, K., Jiang, B., Chan, W.K., and Tse T.H., Taking Advantages of Service Selection: A Study on the
Testing of Location-Based Web Services through Test Case Prioritization, In Proceedings of the 8th IEEE
International Conference on Web Services (ICWS 2010), pages 211-218.
Zhai, K., Jiang, B., and Chan, W.K. (to appear). Prioritizing test cases for regression testing of location-
based services: metrics, techniques and case study. IEEE Transactions on Services Computing.
Zhang, J. (2004). An approach to facilitate reliability testing of web services components. In Proceedings
of ISSRE 2004, pages 210–218.
Zhang, J., Chang, C.K., Chung, J.Y., Kim, S.W. (2004). WS-Net: a Petri-net based specification model for
Web services. In Proceedings of ICWS 2004, pages 420–427.

To appear in International Journal of Web Services Research (JWSR)
26
ABOUT THE AUTHORS
Lijun Mei is a staff researcher at IBM Research – China. He obtained his PhD from The University of
Hong Kong. His research interest is to address the issues of program testing and testing management in the
business environment. He has conducted extensive research in testing service-based applications.
Yan Cai is a PhD student at Department of Computer Science, City University of Hong Kong. He received
his BEng degree in Computer Science and Technology from Shandong University, China, in 2009. His
research interest is software testing, concurrency bug detection and reproduction in multithreaded or
distributed systems, especially for large-scale applications.
Changjiang Jia is a PhD candidate at Department of Computer Science, City University of Hong Kong.
He received his BSc and MSc degrees from National University of Defense Technology, China. His
research interests are program analysis and failure diagnosis.
Bo Jiang is an assistant professor at Institute of Computer Architecture, School of Computer Science and
Engineering, Beihang University. He got his Ph.D. from Department of Computer Science of The
University of Hong Kong. His current research interests are software engineering in general, and embedded
software testing as well as program debugging in particular. Home Page: http://bojiang.buaa.edu.cn.
W.K. Chan is an assistant professor at City University of Hong Kong. His current main research interests
are program analysis and testing for concurrent software and systems. He is on the editorial board of the
Journal of Systems and Software. His research results have been reported in many international venues
such as TOSEM, TSE, TPDS, TSC, CACM, Computer, ICSE, FSE, ISSTA, ASE, WWW, ICWS, and
ICDCS.


![Coverage Testing of Deep Learning Models using Dataset ... · (4) Pair-wise boundary conditioning: Measure for each pair ... VGG-19 [24], LeNet [11], and ResNet-20 [8]. ... Test dataset](https://static.fdocuments.in/doc/165x107/5e464a803f0c977a863e2e12/coverage-testing-of-deep-learning-models-using-dataset-4-pair-wise-boundary.jpg)


