Test Administration Technical Report · 2015–2016 Program Year May 2017 Prepared for: Center for...
81
Copyright © 2017 Pearson Education, Inc. or its affiliate(s). All rights reserved. Evaluation Systems, Pearson, P.O. Box 226, Amherst, MA 01004 Pearson and its logo are trademarks, in the U.S. and/or other countries, of Pearson Education, Inc. or its affiliate(s) Test Administration Technical Report 2015–2016 Program Year May 2017 Prepared for: Center for the Teaching Profession Ohio Department of Education 25 South Front Street, MS 505 Columbus, OH 43215-4183
Transcript of Test Administration Technical Report · 2015–2016 Program Year May 2017 Prepared for: Center for...

Copyright © 2017 Pearson Education, Inc. or its affiliate(s). All rights reserved. Evaluation Systems, Pearson, P.O. Box 226, Amherst, MA 01004
Pearson and its logo are trademarks, in the U.S. and/or other countries, of Pearson Education, Inc. or its affiliate(s)
Test Administration Technical Report
2015–2016 Program Year
May 2017
Prepared for: Center for the Teaching Profession
Ohio Department of Education 25 South Front Street, MS 505
Columbus, OH 43215-4183

Copyright © 2017 Pearson Education, Inc. or its affiliate(s). All rights reserved.
i
Contents
Preface ........................................................................................................ ii Purpose of the Ohio Assessments for Educators (OAE) Program................. 1
Introduction ......................................................................................................... 1 Composition of the OAE Program............................................................................. 1
Technical Properties of the OAE Program .................................................... 3 Scoring ................................................................................................................ 3 Item Analyses ....................................................................................................... 4 Test Equating ....................................................................................................... 5 Scaled Scores ....................................................................................................... 6 Reliability ............................................................................................................. 7 Validity .............................................................................................................. 10
Score Reporting ........................................................................................ 12 Candidate Score Reports ...................................................................................... 12 Other Score Recipients ......................................................................................... 12 Test Statistics Reports ......................................................................................... 13 Total Scaled Score Distribution by Test Field .......................................................... 14 Title II Reporting ................................................................................................. 14
References ................................................................................................ 16 Appendices ............................................................................................... 17

Copyright © 2017 Pearson Education, Inc. or its affiliate(s). All rights reserved.
ii
Preface
This test administration technical report provides information on the technical characteristics of the tests and score reporting for the Ohio Assessments for Educators (OAE) for the 2015–2016 program year.

Copyright © 2017 Pearson Education, Inc. or its affiliate(s). All rights reserved.
1
Purpose of the Ohio Assessments for Educators (OAE) Program
Introduction
The Ohio Assessments for Educators (OAE): For candidates seeking initial licensure in a subject area (OAE: Initial Licensure) program assesses the content-area and professional (pedagogical) knowledge of candidates who are either seeking initial Ohio educator licensure or adding a new licensure area. The OAE program, administered by Pearson, includes 39 content-area assessments and four professional (pedagogical) knowledge assessments. Five OAE assessments include two separate tests each (i.e., Subtest I and Subtest II) for a total of 48 unique tests. The OAE tests are aligned with Ohio Educational Preparation Standards, Ohio Standards for the Teaching profession, and Ohio Student Standards.
Each test was validated for use in Ohio in accordance with the practices recommended by the Standards for Educational and Psychological Testing (AERA, APA, & NCME, 2014). The Standards require a clear definition of content domain and a rationale to support a claim that the knowledge, skills, and abilities being assessed in a licensure test are required for credential-worthy performance. Educators, educator preparation faculty, and administrators from across Ohio were involved in reviewing the test materials for content, job-relatedness, and prevention of bias; validating their appropriateness for use in Ohio; and making recommendations for the passing score for each test. In addition, in accordance with State of Ohio requirements, assessment materials, where available, were to have been previously administered to educator licensure candidates in states other than Ohio.
The OAE tests are computer-based and delivered through a national network of Pearson computer-based testing centers. Most tests are available year round by appointment.
The OAE program offers several web-based resources to help candidates prepare for the tests. These resources include online study guides, practice tests, detailed score reports, and computer-based testing tutorials. In addition, a suite of faculty resources and interactive worksheets are available to assist in candidate preparation. The Ohio Department of Education and educator preparation programs have access to an interactive, electronic database that allows them to create customized reports of candidate test results, institution performance, or perform customized data queries.
Composition of the OAE Program
Currently, 48 OAE tests are available for test administration. The OAE program includes four professional (pedagogy) knowledge tests that are matched to Ohio licensure grade bands (Early Childhood, Middle Childhood, Adolescence to Young Adult, and Multi-Age). Content-area tests match Ohio license types. Thirty-two OAE tests have been operational since September 3, 2013; 12 OAE tests have been operational since January 21, 2014; two OAE tests have been operational since September 2, 2014; two new OAE tests, Dance and Foundations of Reading, have been operational since August 29, 2016, and December 19, 2016, accordingly.

Copyright © 2017 Pearson Education, Inc. or its affiliate(s). All rights reserved.
2
Ohio Assessments for Educators (OAE)
Pedagogical Knowledge Assessments 001 Assessment of Professional Knowledge: Early Childhood (PK–3) 002 Assessment of Professional Knowledge: Middle Childhood (4–9) 003 Assessment of Professional Knowledge: Adolescence to Young Adult (7–12) 004 Assessment of Professional Knowledge: Multi-Age (PK–12) Content Knowledge Assessments 005 Agriscience 006 Art 007 Biology 008 Business Education 009 Chemistry 010 Computer Information Science 011 Dance 012 Early Childhood Education 013 Early Childhood Special Education 014 Earth and Space Science 015 Educational Leadership 016 Computer/Technology (Subtest I) 017 Computer/Technology (Subtest II) 018 Elementary Education (Subtest I) 019 Elementary Education (Subtest II) 020 English Language Arts 021 English to Speakers of Other Languages 022 Family and Consumer Sciences 090 Foundations of Reading (FOR) 023 Health 024 Integrated Science 025 Integrated Social Studies 026 Marketing 027 Mathematics 028 Middle Grades English Language Arts 029 Middle Grades Science 030 Middle Grades Mathematics 031 Middle Grades Social Studies 032 Music 034 Physical Education 035 Physics 036 Prekindergarten (Subtest I) 037 Prekindergarten (Subtest II) 038 Reading (Subtest I) 039 Reading (Subtest II) 040 School Counselor 041 School Library Media Specialist 042 School Psychologist 043 Special Education 044 Special Education Specialist: Deaf/Hard of Hearing 045 Special Education Specialist: Visually Impaired 046 Technology Education (Subtest I) 047 Technology Education (Subtest II) 048 Theater

Copyright © 2017 Pearson Education, Inc. or its affiliate(s). All rights reserved.
3
Technical Properties of the OAE Program
The Standards for Educational and Psychological Testing require that testing agencies provide relevant technical information about the assessments so that test users and reviewers have sufficient information to make judgments about the quality of the test, the resulting scores, and interpretations based on test scores (AERA, APA, & NCME, 2014). This information can ultimately assist test users and reviewers in determining the appropriateness of the test for its intended purpose (AERA, APA, & NCME, 2014).
Scoring
The OAE includes tests consisting of multiple-choice items only as well as tests consisting of both multiple-choice and constructed-response items. The scoring procedures for the program are carefully documented for both multiple-choice and constructed-response items. Additionally, performance monitoring is conducted to check the accuracy of scoring and reporting for the constructed-response items.
Scoring Multiple-Choice Items
Answer keys for multiple-choice items are prepared during the construction of test forms. These keys are reviewed and checked at several points during development and production. Automated technology at computer-based testing centers compare these answer keys to candidate responses immediately following the conclusion of testing. This technology allows for on-site unofficial test results to be generated at the testing centers, which can then be provided to candidates. These results are provided to the candidates only for the OAE assessments that do not include constructed-response items.
Multiple-choice items are dichotomously scored, meaning a single point is awarded for each correct response, and no points are awarded for an incorrect response. For tests composed of multiple-choice items only, the final raw score is the total number of correct responses on the test. The raw scores are transformed and reported on a scale ranging from 100 to 300 with a scaled passing score of 220.
Each test form for all OAE fields includes both scorable and nonscorable multiple-choice items. Scorable items are those that are used to compute candidates’ scores. Nonscorable items are those that are included on a test form to collect additional psychometric information (to support pilot testing) and to support test form equating methodologies but do not contribute to candidates’ scores.
Scoring Constructed-Response Items
Some OAE tests include constructed-response items in addition to multiple-choice items. Candidate responses to constructed-response items are scored using a focused holistic scoring methodology. In this method, scorers judge the overall effectiveness of each response using a set of characteristics that have been defined as important to help inform the overall score. The score is holistic in that each score is based on the overall effectiveness of these characteristics working together, focusing on the response as a whole.
The Special Education Specialist: Visually Impaired constructed-response item is scored differently. This item requires candidates to transcribe a passage into braille, and the score provided is based on the number of errors made in the transcription.

Copyright © 2017 Pearson Education, Inc. or its affiliate(s). All rights reserved.
4
Scoring Components. Candidate responses are scored on a scale. Some tests use a four-point score scale; other tests use a three-point score scale. A score of 1 represents little or no command of the characteristics, and 3 or 4 represents a strong command of the characteristics. Each constructed response is independently scored by two scorers, and these scores are summed for a total possible score range of 2 to 6 for three-point score scales or 2 to 8 for four-point score scales.
To participate in the holistic scoring process, scorers must meet specific qualifications such as:
A state teaching certificate/license;
Teaching experience in public schools; and/or
Experience as a college educator responsible for preparing prospective teachers.
Scorer Training. Prior to scoring, each scorer receives training and orientation by a Chief Reader who trains each scorer to evaluate responses to a variety of teacher licensure examinations. The Chief Reader provides each scorer with the background of the OAE tests, the context of the scoring task, the tasks they will perform, the procedures they will follow, the scoring scale, and the characteristics that will guide their scoring judgments. The scorers are also oriented to the prompt-specific rubrics that apply the characteristics and scoring scale to the constructed-response item(s) used on test forms for the current test administration. The Chief Reader identifies and develops orientation materials, leads scoring sessions, conducts calibration orientation, and monitors the progress of the scoring session.
Scorers receive practice using training sets of responses to which scores have already been assigned, including marker responses (i.e., exemplar responses of each score point on the score scale). The training emphasizes equity and fair application of the score scale. Once scorers have been trained, they have to prove their ability to score accurately by completing a calibration exercise. Each response is read independently and scored by two scorers. If the two scores are not identical or adjacent, additional scoring is conducted to resolve the discrepancy.
Performance Monitoring of Scorers
Pearson monitors the performance of scorers throughout the scoring process. Specific areas monitored include a scorers’ ability to understand and apply the established scoring scale, the consistency of the scores assigned in comparison with those assigned by the second scorer, and the scorers’ consistency over time. At points in the holistic scoring process, scorers are recalibrated to the scale, typically through discussions of specific questions. Scorers must demonstrate continued scoring accuracy on the responses. If scorers fail to demonstrate accuracy, they receive additional, individual reorientation before proceeding with scoring.
Item Analyses
Item analyses are conducted on multiple-choice items to assess the accuracy and psychometric quality of the items. Additionally, data from constructed-response items are reviewed to confirm that items in the item bank for each field are comparable in terms of difficulty and score distribution.

Copyright © 2017 Pearson Education, Inc. or its affiliate(s). All rights reserved.
5
Item Analysis for Multiple-Choice Items
The purpose of item analysis for multiple-choice items is to verify the accuracy of the answer key for each administered test form and as an additional quality assurance check before providing final results and before official candidate score reports are produced. Data are collected on each item, allowing for the empirical consideration of item difficulty, item discrimination, content accuracy, and the plausibility of distractors. These item statistics are calculated and evaluated for the current administration and cumulatively (i.e., using combined statistics for previous operational test administrations).
The item statistics calculated and evaluated for each multiple-choice item include:
Item difficulty (p-value);
Distribution of responses (percentages of participants selecting each response option);
Item-to-total test point biserial correlation (correlation of performance on the item to performance on the total test); and
Mean score by response choice (average score on the total multiple-choice set achieved by all participants selecting each response option).
Those items that do not perform within defined statistical parameters are flagged and reviewed. Flagged items are reviewed by content specialists, test development specialists, psychometricians, and editors. Reviewed items are deleted or revised and subjected to additional pilot testing. The review confirms that the wording on the test forms matches the wording validated by the CACs. During the review, there is a check of content, topicality, and correct answer.
Item Review for Constructed-Response Items
Constructed-response item data are regularly reviewed to monitor the difficulty of the items across administrations. Throughout the scoring process, monitor reports containing mean scores and standard deviations are reviewed. The monitor reports also contain distribution of scores assigned by the first two scorers, distribution of score differences, and distribution of score combinations assigned by the first two scorers.
Test Equating
Each OAE test consists of multiple forms. Multiple forms are utilized within and across test administrations to address issues of item exposure and security. Statistical adjustment (equating) is implemented to adjust for small differences in difficulty across forms.
Purpose of Equating
According to the Standards for Educational and Psychological Testing, equating refers to the process of placing scores from alternate, parallel, or equivalent forms of a test on a common scale (AERA, APA, & NCME, 2014). The central purpose of statistical equating methods is to compensate statistically for possible variability in the characteristics of test forms that may affect candidates’ scores (e.g., differences in the overall difficulty of a new test form compared to a previous test form). Statistical equating methods ensure that a candidate’s scaled score is adjusted for the relative difficulty of the particular test form that was taken. Equating thus allows test developers to attribute differences in scores across test forms to differences in knowledge or skills, and not differences in the

Copyright © 2017 Pearson Education, Inc. or its affiliate(s). All rights reserved.
6
tests. Equating helps to ensure that different test forms are comparable and that test scores from multiple test forms can be used interchangeably.
Equating Design
A single-group equating design is utilized for the OAE tests. In a single-group design, the same group of candidates is scored on two alternative forms of the same test. The two forms are defined by designating two alternative subsets of items on the full test form as scorable, so that each alternative contains a set of common scorable items plus a set of scorable items unique to the form. The two alternative forms are then statistically equated.
To equate the two test forms, a linear equating method was implemented for the OAE. In linear equating, two scores are equivalent if they are the same number of standard deviation units above or below the mean for some group of candidates (Angoff, 1984). A linear equation is used to relate the scores from the two forms by setting standard deviation scores, or z-scores, to be equal on the two test forms (Kolen & Brennan, 2004).
This design is used for the OAE tests because of the need to pre-equate the test forms, enabling candidates to receive unofficial test results at the testing center immediately after the conclusion of their test administration (for multiple-choice only OAE tests). With pre-equating, the passing score for a new test form is established prior to operational administration.
Scaled Scores
The Standards for Educational and Psychological Testing state that scaled scores may aid in interpretation of the test. Specifically, scaled scores allow scores to be easily comparable regardless of test form or administration (AERA, APA, & NCME, 2014). Scaled score reporting is preferred to raw score reporting due to the confusion that may occur as a result of some changes in raw cut scores across test forms. Therefore, the use of scaled scores helps to support the communication of the OAE program results in the following ways:
Candidates, institutions of higher education, and stakeholders will be able to interpret scores from the different OAE tests in a similar manner, regardless of the test taken.
The meaning of the scaled passing scores will be consistent over time making it possible to compare performance from one test administration to the next.
Scaled Score Range for the OAE
Raw test scores, including the number correct for multiple-choice items, and holistic scores for constructed-response items are transformed to a standard scale ranging from 100 to 300. This scale is used to communicate OAE scores across all tests within the program. For each OAE test, 220 represents the passing score. By using a standard scale across all tests, test scores and feedback are provided in an easy-to-understand format for candidates, institutions of higher education, the ODE, and other stakeholders.
Calculation of Scaled Scores
For tests containing only multiple-choice items, a simple linear transformation is applied to the raw scores to compute the associated scaled score. The scaled score is derived

Copyright © 2017 Pearson Education, Inc. or its affiliate(s). All rights reserved.
7
from the candidate’s raw score, the raw cut score, and the maximum possible raw score. Candidates who perform at the raw score that is equivalent to the passing score achieve a scaled score of 220, while those who achieve the maximum possible raw score will receive a scaled score of 300.
For the OAE tests that contain both multiple-choice and constructed-response items, the multiple-choice and constructed-response test sections are each scaled separately. These multiple-choice and constructed-response scaled scores are then combined in accordance with the following weightings.
OAE Test Multiple-Choice Weight
Constructed-Response Weight
Assessment of Professional Knowledge: Early Childhood (PK-3)
80% 20%
Assessment of Professional Knowledge: Middle Childhood (4-9)
80% 20%
Assessment of Professional Knowledge: Adolescence to Young Adult (7-12)
80% 20%
Assessment of Professional Knowledge: Multi-Age (PK-12)
80% 20%
Computer Information Science 85% 15%
Computer Technology (Subtest I) 70% 30%
Computer Technology (Subtest II) 70% 30%
Educational Leadership 60% 40%
Foundations of Reading (FOR) 80% 20%
Pre-Kindergarten (Subtest I) 80% 20%
Pre-Kindergarten (Subtest II) 80% 20%
Reading (Subtest I) 80% 20%
Reading (Subtest II) 80% 20%
School Psychologist 85% 15%
Special Education: Visually Impaired 80% 20%
Technology Education (Subtest I) 70% 30%
Technology Education (Subtest II) 70% 30%
Theater 80% 20%
Reliability
The Standards for Educational and Psychological Testing refers to reliability as the consistency of test scores for a group of candidates across administrations (AERA, APA &

Copyright © 2017 Pearson Education, Inc. or its affiliate(s). All rights reserved.
8
NCME, 2014). There are many common reasons for individual scores to fluctuate over time. Score fluctuation from one testing occasion to another has an impact on reliability. Some factors that affect reliability include:
Number of candidates. The number of candidates whose test scores contribute to a statistical estimate of reliability affects the stability of the estimate. In general, reliability estimates based on larger numbers of candidates are more stable than estimates based on smaller numbers. For this reason, reliability estimates are calculated for tests that are taken by one hundred or more candidates.
Self-selection of candidates by test administration date. Typically, candidates can decide when to take a particular test. OAE tests are administered throughout the year, and candidates can select when to take and retake the tests. This self-selection can affect the composition, ability level, and variability of the group taking a particular test at a given test administration.
Variability of the group tested. In general, the larger the true variance or true spread of the scores of the candidate group (i.e., the greater the individual differences in the true level of knowledge, skills, and abilities of the candidates in the particular group taking a test on a particular occasion), the greater will be the reliability coefficient. Reliability estimates tend to be higher if candidates in the group have widely varying levels of knowledge, and lower if they tend to have similar levels of knowledge.
Test length. Statistical estimates of reliability are typically higher for tests with greater numbers of questions. A more reliable estimate of a person's knowledge is obtained by asking more questions.
Test content. Reliability estimates are typically higher for tests that cover narrow, homogeneous content than for tests (such as many used for educator licensure) that cover a broad range of content. Tests for educator licensure must typically test a broad base of knowledge, skills, and abilities that pertain to licenses that will apply in a wide range of educational settings, grade levels, and teaching assignments.
Because the tests included in the OAE program are used to make high-stakes decisions, several indicators of decision consistency (that is the degree to which the same decisions are made from two tests) and measures that indicate score reliability (consistency of scores across administrations) are calculated. Statistics presented not only consider the reliability of the test scores, but also indicate the reliability of the decisions made using the test results.
Several measures are employed to assess the reliability of each test in the OAE program. These measures are described below.
Livingston-Lewis estimate of decision consistency. For a test used to make licensure requirement decisions such as the OAE, the consistency of such decisions becomes a primary focus (Crocker & Algina, 1986). Decision consistency refers to the degree to which the same decisions are made from two tests. For the OAE program, the Livingston and Lewis (1995) estimate of decision consistency is used. This multi-stage method calculates decision consistency and accuracy using four types of input including: distribution of scores on one form, the minimum and maximum possible scores, the cut points used for classification, and the reliability coefficient (Livingston & Lewis, 1995).

Copyright © 2017 Pearson Education, Inc. or its affiliate(s). All rights reserved.
9
Decision consistency is reported in the range of 0 to 1, with estimates close to 1 indicating more consistent or reliable decisions.
Kuder-Richardson formula 20 (KR20). The Kuder-Richardson index of item homogeneity (KR20) is an overall test consistency (reliability) estimate based on a single test administration (Kuder & Richardson, 1937). It is applicable to the multiple-choice section of tests. KR20 is reported in the range 0 to 1, with a higher number indicating a greater level of consistency (reliability). Homogeneity refers to the degree to which the items on the test are consistent with one another. For the OAE, KR20 is computed for tests composed of multiple-choice items only as well as for multiple-choice sections of tests that also include constructed-response items.
Stratified coefficient alpha. Stratified coefficient alpha is an estimate of total test score reliability for a test containing a mixture of item types (e.g., multiple-choice and constructed-response) (Qualls, 1995). Each item type component of the test is treated as a subtest. Internal consistency estimates for the separate subtests are combined to compute stratified coefficient alpha. Stratified coefficient alpha is reported in the range 0 to 1, with a higher number indicating a greater level of consistency (reliability). This statistical estimate was deemed most appropriate for estimating total reliability of tests with both multiple-choice and constructed-response items for the OAE because it takes into account differences in test length and variance of the two item types.
Standard error of measurement. The Standards for Educational and Psychological Testing define the standard error of measurement as the estimate of the difference between observed scores and estimated true scores by estimating the variability of measurement errors. This statistic speaks to the reliability of test scores, with smaller standard errors of measurement indicating more reliable test scores (AERA, APA, & NCME, 2014).
Generalizability coefficient (G). The Generalizability (G) coefficient is a measure of the percent of total score variance that is attributable to persons (i.e., factors within the candidate, such as subject matter knowledge). It reflects the proportion of variability in individuals' scores that is attributable to true score variability rather than to measurement error (Brennan, 2001). It is reported in the range 0 to 1, with a higher number indicating a greater level of generalizability. The G-coefficient is applicable to test sections composed of constructed-response items. It gauges the degree to which the results from one test form of the constructed-response items are generalizable to other forms, or other test administrations.
Scorer Agreement. Scorer agreement is the degree of agreement between constructed-response scores assigned by independent scorers. Independent scorers are in agreement if the scores they award are either exact or adjacent. The scorers are not in agreement if the scores awarded differ by more than one point. The percent of cases in which the first two independent scorers are in agreement is computed as a measure of scorer agreement (reliability). The following scorer agreement statistics are reported:
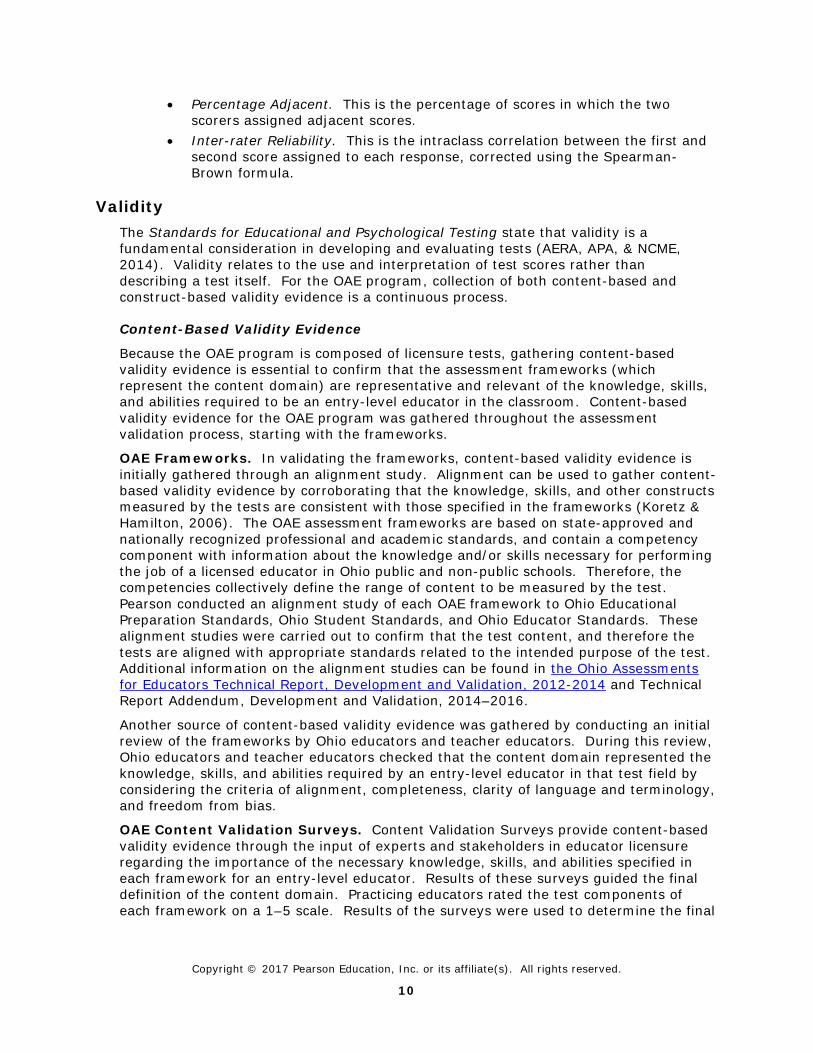
• Percent Agreement. Overall agreement determined by summing exact and adjacent agreement.
• Percent Exact. This is the percentage of scores in which the first two scorers were in exact agreement.
Copyright © 2017 Pearson Education, Inc. or its affiliate(s). All rights reserved.
10
• Percentage Adjacent. This is the percentage of scores in which the twoscorers assigned adjacent scores.
• Inter-rater Reliability. This is the intraclass correlation between the first andsecond score assigned to each response, corrected using the Spearman-Brown formula.
Validity
The Standards for Educational and Psychological Testing state that validity is a fundamental consideration in developing and evaluating tests (AERA, APA, & NCME, 2014). Validity relates to the use and interpretation of test scores rather than describing a test itself. For the OAE program, collection of both content-based and construct-based validity evidence is a continuous process.
Content-Based Validity Evidence
Because the OAE program is composed of licensure tests, gathering content-based validity evidence is essential to confirm that the assessment frameworks (which represent the content domain) are representative and relevant of the knowledge, skills, and abilities required to be an entry-level educator in the classroom. Content-based validity evidence for the OAE program was gathered throughout the assessment validation process, starting with the frameworks.
OAE Frameworks. In validating the frameworks, content-based validity evidence is initially gathered through an alignment study. Alignment can be used to gather content-based validity evidence by corroborating that the knowledge, skills, and other constructs measured by the tests are consistent with those specified in the frameworks (Koretz & Hamilton, 2006). The OAE assessment frameworks are based on state-approved and nationally recognized professional and academic standards, and contain a competency component with information about the knowledge and/or skills necessary for performing the job of a licensed educator in Ohio public and non-public schools. Therefore, the competencies collectively define the range of content to be measured by the test. Pearson conducted an alignment study of each OAE framework to Ohio Educational Preparation Standards, Ohio Student Standards, and Ohio Educator Standards. These alignment studies were carried out to confirm that the test content, and therefore the tests are aligned with appropriate standards related to the intended purpose of the test. Additional information on the alignment studies can be found in the Ohio Assessments for Educators Technical Report, Development and Validation, 2012-2014 and Technical Report Addendum, Development and Validation, 2014–2016.
Another source of content-based validity evidence was gathered by conducting an initial review of the frameworks by Ohio educators and teacher educators. During this review, Ohio educators and teacher educators checked that the content domain represented the knowledge, skills, and abilities required by an entry-level educator in that test field by considering the criteria of alignment, completeness, clarity of language and terminology, and freedom from bias.
OAE Content Validation Surveys. Content Validation Surveys provide content-based validity evidence through the input of experts and stakeholders in educator licensure regarding the importance of the necessary knowledge, skills, and abilities specified in each framework for an entry-level educator. Results of these surveys guided the final definition of the content domain. Practicing educators rated the test components of each framework on a 1–5 scale. Results of the surveys were used to determine the final

Copyright © 2017 Pearson Education, Inc. or its affiliate(s). All rights reserved.
11
status of all of the assessment framework components. Results of the content validation surveys for the OAE indicated that across test fields, almost all competencies and descriptive statements achieved a rating of at least 4.0, representing “great importance.” Additional information on the content validation surveys is included in the Ohio Assessments for Educators Technical Report, Development and Validation, 2012-2014.
OAE Test Items. As described in the Ohio Assessments for Educators Technical Report, Development and Validation, 2012-2014, the item validation activities by the Bias Review Committee (BRC) and Content Advisory Committees (CACs) provided additional content-based validity evidence. The BRC validated that the items were free from bias in content, language, offensiveness, and stereotypes, and that the items were fair and represented the diversity of the Ohio population. The CACs validated items to indicate that they matched the test competency or content domain to which they were written and were accurate, free from bias, and job-related. Any items that were judged to be problematic were eliminated.
Construct-Based Validity Evidence
The Standards for Educational and Psychological Testing refer to construct validity as the degree to which scores from an assessment can be interpreted as indicating the candidate’s standing on the knowledge, skills, and abilities assessed by the test (AERA, APA, & NCME, 2014). Some threats to construct validity include construct irrelevance and construct underrepresentation. Construct irrelevance is “variance in test-taker scores that is attributable to extraneous factors that distort the meaning of the scores and thereby decrease the validity of the proposed interpretation” (AERA, APA, & NCME, 2014, p 217). Construct underrepresentation is defined as “the extent to which a test fails to capture important aspects of the construct domain that the test is intended to measure” (AERA, APA, & NCME, 2014, p. 217).
OAE Content Validation Surveys. For the OAE program, Pearson conducted content validation surveys that were aimed at gathering evidence to show that each assessment framework adequately reflects the knowledge, skills, and abilities necessary for an entry-level educator in Ohio. Survey participants were asked to rate the importance of the knowledge, skills, and abilities described by each competency and accompanying descriptive statements. The third item on the survey asked participants to rate a set of competencies in terms of how well they represented important aspects of the knowledge, skills, and abilities required for performing the job of an entry-level educator. Results showed that the set of competencies for each test adequately represent the knowledge, skills, and abilities the test is intended to measure.
OAE Test Items. The item validation activities by the BRC and CACs provided additional construct-based validity evidence. The BRC validated that the items were free from bias in content, language, offensiveness, and stereotypes and that the items were fair and represented the diversity of the Ohio population. The CACs validated items to indicate that they matched the test competency or content domain to which they were written and were accurate, free from bias, and job-related. Any items that were judged to be problematic were eliminated.

Copyright © 2017 Pearson Education, Inc. or its affiliate(s). All rights reserved.
12
Score Reporting
After administration of the OAE tests, score reports are provided to candidates to inform them of their passing status and performance on the test. Score reports are also provided to the Ohio Department of Education (ODE) and to institutions, as designated by the candidate, to communicate passing status of individual candidates for educator licensure.
Candidate Score Reports
Candidates receive unofficial test results (reported as pass or not pass) on-site following the administration of multiple-choice-only tests. For tests that contain constructed-response items, candidates receive a receipt of completion on-site following the test administration. All candidates may request that a score report be e-mailed to the address provided during the registration process on the score report date published on the program website. Score reports are posted to the candidate’s online account for 2 years as PDF documents, which a candidate may view, print, and save for their records. After the 2 year period, candidates may request a copy of their scores through their online account.
Score reports include the following information:
The date the candidate took the test
The candidate’s overall scaled score based on the number of items answered correctly converted to a scale ranging from 100 to 300
The candidate’s passing status based on the state-approved passing standard
Details of candidate performance on each content domain assessed by the test for both multiple-choice and constructed-response sections
Candidates who do not pass a test are also provided with a Detailed Performance Summary that includes more detailed information about the candidate’s performance on each test competency and constructed-response item, if applicable.
A sample candidate score report can be found in Appendix A. Score reports are accompanied by an interpretive guide to help candidates understand the reports. Additional information on how to read the score report can be found on the OAE program website (http://www.oh.nesinc.com/Content/Docs/OAE_ScoreReportBacker.pdf).
Other Score Recipients
Candidate scores are sent to the Ohio Department of Education (ODE) and institutions as designated by the candidate. These scores are delivered electronically through Pearson’s secure web-based score-reporting system. Through this system, the ODE and institutions also have access to a web-based tool called ResultsAnalyzer®. This tool is interactive and allows ODE and institutions to view, analyze, reorganize, download, and print reports based on test data and generate customized reports of their choice.
ResultsAnalyzer® can support the needs of institutions of higher education through the following features:
Create relevant and timely reports on candidate results
Filter reports by candidate demographics, specific tests, or testing year

Copyright © 2017 Pearson Education, Inc. or its affiliate(s). All rights reserved.
13
Organize data into customized tables and graphs
Customize data queries to align with institution goals and areas of interest
Aggregate performance data across testing program years
Export data to Microsoft® Excel or other report software and print graphics
Analyze candidate data for numerous purposes, including Title II reporting, institutional research, program evaluation, and curriculum improvement
ResultsAnalyzer® also allows ODE to generate reports based on its needs and areas of focus using the features previously mentioned. In addition, ResultsAnalyzer® can create reports and filter results by institution, as well as support the analysis of institutional data. These data can assist ODE in assessing the performance of institutions across the state and help in future statewide policy decisions.
Test Statistics Reports
This document provides statistical reports for each test and reports on candidate performance for OAE tests administered during the 2015-2016 program year. Test statistics reports consist of test form and field statistics reports that outline statistical characteristics of multiple-choice only tests as well as tests composed of both multiple-choice and constructed-response items administered during the program year. Total scaled score distributions also are provided. Specific details of each report are outlined below.
Test Form Statistics Reports
The Test Form Statistics Report provided in Appendix B provides selected statistics for test forms administered to at least 100 candidates during the program year. This report includes the following information:
Test Field Code and Name
Form Designation
Number of Tests Taken. Scores are included in the analyses for this report for candidates who attempted at least one multiple-choice item and provided scorable responses to the constructed-response items, if applicable. In the cases in which the same test forms were administered at more than one test administration during the reporting period and candidates took the same test form at more than one test administration, both scores for those candidates’ several attempts are included in the analyses.
Mean. The mean of the total test scaled scores achieved by the candidates taking the test form.
Standard Error of Measurement (SEM). The standard error of measurement of the total test scaled scores is reported.
Decision Consistency. The Livingston Lewis estimate of decision consistency is based on all administrations of a test form during the program year. Test forms are considered to be identical if they contain identical sets of scorable multiple-choice items, regardless of the order of the items.
Stratified Alpha. This statistic provides an estimate of total test score reliability for a test containing multiple item types (e.g., multiple-choice, constructed-response items) (Qualls, 1995).
Test Length. The number of scorable items of the multiple-choice section.

Copyright © 2017 Pearson Education, Inc. or its affiliate(s). All rights reserved.
14
Kuder-Richardson formula 20 (KR20)
A second Test Form Statistics Report is provided in Appendix C. This report contains the total test scaled score mean and the number of scorable multiple-choice items for test forms that were administered to fewer than 100 candidates during the 2015-2016 program year. Statistical indices such as the SEM or reliability coefficients cannot be confidently interpreted when computed using data from small groups of candidates; therefore, such analyses were omitted for test forms administered to fewer than 100 candidates in the reporting period.
Test Field Statistics Report
The Test Statistics Report by Test Field shown in Appendix D provides selected statistics for test fields comprised of constructed-response items administered to at least 100 candidates during the program year. This report includes the following information:
Scorer Agreement. Measures of scorer agreement reported are:
• Percent Agreement. Overall agreement determined by summing exact andadjacent agreement.
• Percent Exact. This is the percentage of scores in which the first two scorerswere in exact agreement.
• Percentage Adjacent. This is the percentage of scores in which the twoscorers assigned adjacent scores.
• Inter-rater Reliability. This is the intraclass correlation between the first andsecond score assigned to each response, corrected using the Spearman-Brown formula.
Total Scaled Score Distribution by Test Field
The Total Scaled Score Distribution by Test field shown in Appendix E provides information about the scaled score distributions associated with all test fields taken by 10 or more candidates. For the OAE, results are reported on a scale ranging from 100 to 300. A scaled score of 220 represents the passing standard for each test.
The scale score distributions include the following information:
Total Scaled Score: the inclusive list of observed total test scaled scores, in intervals of five scale-score points.
N: the number of scores observed within each interval.
N at or above: the number of scores observed at or above each scale score interval.
Percent: the percent of scores observed within each interval.
Percent at or above: the percent of scores observed at or above each scaled score interval.
Title II Reporting
The federal government requires that states submit annual reports on the quality of their teacher preparation programs for accountability purposes. The data are intended to inform stakeholders on the quality of teacher preparation.
Pearson helps Ohio meet Title II requirements by working with both ODE and institutions of higher education to produce the reports. The Title II reporting system allows the

Copyright © 2017 Pearson Education, Inc. or its affiliate(s). All rights reserved.
15
submission, review, and transmission of data that supports collaboration among institutions and ODE. Pearson supports the reporting needs and requirements through the following actions:
producing Test Pass Rates Tables and Summary Pass Rates Tables for Title II Reporting.
providing web-based training to institutions of higher education on the purpose and process for data collection.
maintaining a secure, password-accessible website for data collection.

Copyright © 2017 Pearson Education, Inc. or its affiliate(s). All rights reserved.
16
References
American Educational Research Association, American Psychological Association, and National Council on Measurement in Education (2014). Standards for Educational and Psychological Testing. Washington, D.C.: American Educational Research Association.
Angoff, W. H. (1984). Scales, Norms and Equivalent Scores. Princeton, NJ: Educational Testing Service.
Brennan, R. L. (2001). Generalizability Theory. New York, NY: Springer-Verlag.
Crocker, L., and J. Algina. (1986). Introduction to Classical and Modern Test Theory. Belmont, CA: Wadsworth Group.
Kolen, M. J. and Brennan, R. L. (2004). Test equating, scaling, and linking: Methods and practices (2nd Ed.). New York, NY: Springer Science and Business Media, LLC.
Koretz, D. M. and Hamilton, L. S. (2006). Testing for accountability in K–12. In R. L. Brennan (Ed.), Educational Measurement (4th ed.) (pp. 531–578). Westport, CT: American Council on Education and Praeger Publishers.
Kuder, G. F. and Richardson, M. W. (1937). The theory of the estimation of test reliability. Psychometrika 2:151–160.
Livingston, S. A., and Lewis, C. (1995). Estimating the consistency and accuracy of classifications based on test scores. Journal of Educational Measurement 32(2):179–197.
Qualls, L. A. (1995). Estimating the reliability of a test containing multiple item formats. Applied Measurement in Education 8(2):111–120.
Copyright © 2017 Pearson Education, Inc. or its affiliate(s). All rights reserved.
17
Appendices
Appendix A: Sample OAE Candidate Score Report
Appendix B: Test Form Statistics Report for Test Fields with More than 100 Tests Taken
Appendix C: Test Form Statistics Report for Test Fields with Fewer than 100 Tests Taken
Appendix D: Test Field Statistics Report
Appendix E: Total Scaled Score Distribution by Test Field

Appendix A: Sample OAE Candidate Score Report

FirstName LastName300 Venture WaySample City, OH XXXXX
Assessment of Professional Knowledge: Early Childhood (PK-3) 001Minimum Passing Score: 220
Assessment Date: August 20, 2014
Domain Performance Index
Status: Pass Your Score: 231
Examinee Name: FirstName LastName Social Security Number: XXX-XX-XXXX����������������������������������������������������������������������������������������������������������������������� ��������� ������������������������������������������������� �������������������������� �������� ����������������������� ����������������������� ����� ���������������������������������������������������������������������������������������������������������������������������������������������������������������������������������������������������������������� ���� ����� ����� ����� ����� ����� ����� ����� ����� ����� ������������������������������������������������������������������������������������������������������������������������������������������������������������������������������������������������������������������ ����� ����� ����� ����� ����� ����� ����� ����� ����� ����������������������������������������������������������������������������������������������������������������������������������������������������������������������������������������������������������������� �� ����� ����� ����� ����� ����� ����� ����� ����� ����� ������� ��������������������������������������������������������������������������������������������������������������������������������������������������������������������������������������������������������������� ����� ����� ����� ����� ����� ����� ����� ����� ����� ������������������������������������������������������������������������������������������������������������������������������������������������������������������������������������� �������������������� ����� ����� ����� ����� ����� ����� ����� ����� ����� ����� ����������������������������������������������������������������������������������������������������������������������������������������������������������������������������������������� ��������������������������� ��� ����� ����� ����� ����� ����� ����� ����� ����� ����� ��������������������������������������������������������������������������������������������������������� ��������������������������������������������������������������������������� ������������������������������ ����� ����� ����� ����� ����� ��������� ���������������� ������� ����������������������������������������� ������������������������������������������������������������������ ������������������������ ������������������������� ������������������������������������������� ���������������������������� ������ ������������������������������������������������������������������������������������������������������������������� ��������������������������������������������� ������� ���������������������������������������� �������������������������������������������������������������������������������������������� ����������������������������
This barcode contains unique candidate information.
Copyright © 2013 Pearson Education, Inc. or its affiliate(s). All rights reserved. Evaluation Systems, Pearson, P.O. Box 226, Amherst, MA 01004
Student Development and LearningAssessment, Instruction, and the Learning EnvironmentThe Professional EnvironmentConstructed Response Assignments
+++++++++++

Copyright © 2013 Pearson Education, Inc. or its affiliate(s). All rights reserved. Evaluation Systems, Pearson, P.O. Box 226, Amherst, MA 01004
Pearson and its logo are trademarks, in the U.S. and/or other countries, of Pearson Education, Inc. or its affiliate(s).
HOW TO READ YOUR SCORE REPORT
Overview. This score report provides your assessment results for the Ohio Assessments for Educators (OAE) that you took on the assessment date indicated on the report. The purpose of the OAE is to assess the knowledge and skills of a prospective Ohio educator. The OAE program helps the Ohio Department of Education and the State Board of Education of Ohio meet their goal of ensuring that candidates have the knowledge and skills needed to perform the job of an educator in Ohio schools.
Assessment Score. Your total assessment score is a scaled score. A scaled score is a combination of the number of scorable questions you answered correctly on the multiple-choice section of the assessment and the scores you received on any constructed-response assignments (if applicable) converted to a scale from 100 to 300, with a score of 220 representing the passing score for the assessment. The number of questions per competency may vary by test form. The total number of questions needed to pass the assessment may also vary across test forms as a result of variations in question difficulty. The conversion of raw scores to scaled scores takes such differences into account. The passing score for each assessment is established by the State Board of Education of Ohio and is based on the professional judgments and recommendations of Ohio educators. "Pass" or "Did Not Pass" status is based on your total score for each assessment.
Performance Indices. Performance indices are provided for each domain of the assessment. These indices can help you understand your areas of strength and weakness. This information should be interpreted with caution, since different domains contain different numbers of assessment questions. For each domain, your performance is reported according to the following performance indices:
Performance Indices: Multiple-Choice Questions
++++ Performance on the competency is well above the level represented by the minimum passing score.
+++ Performance on the competency is just at or above the level represented by the minimum passing score.
++ Performance on the competency is just below the level represented by the minimum passing score. + Performance on the competency is well below the level represented by the minimum passing
score.
Performance Indices: Constructed-Response Assignments
Constructed-Response Assignments (Assessments with a 4-Point Scoring Scale*)
Constructed-Response Assignments (Assessments with a 3-Point Scoring Scale*)
++++ Response reflects a thorough understanding
+++ Response reflects a thorough understanding
+++ Response reflects a general understanding
++ Response reflects a general understanding
++ Response reflects a limited understanding
+ Response reflects limited or no understanding
+ Response reflects little or no understanding
*See study guides at www.oh.nesinc.com

Copyright © 2013 Pearson Education, Inc. or its affiliate(s). All rights reserved. Evaluation Systems, Pearson, P.O. Box 226, Amherst, MA 01004
Each assessment framework describes the content knowledge assessed by the OAE. You may view, print, or download the framework for any OAE assessment by selecting "Assessment Frameworks" in the “Prepare” section of the OAE website at www.oh.nesinc.com.
If a response to a constructed-response assignment is designated "Blank" or "Unscorable," you will see one of the following codes:
Codes for Blank/Unscorable Responses
B Response was blank U-1 Response was unrelated to assigned topic U-2 Response was unintelligible U-3 Response was not primarily in English U-4 Response lacked sufficient amount of original work
Summary Report for Assessments with Two Subtests. Some OAE assessments are comprised of two subtests. If you took a two-subtest assessment, your score report will include an assessment summary. The assessment summary lists passing status information for each subtest within the assessment and includes the date on which you passed each subtest. Please note that for assessments composed of more than one subtest, you must pass both subtests for that assessment to meet Ohio certification requirements.
Reporting of Scores. Your scores are reported directly to the Ohio Department of Education and the Ohio educator preparation institution(s) you indicated during the registration process. This score report is for your information only. Keep a copy for your permanent records.
ADDITIONAL INFORMATION Retaking the Assessment. You may retake an OAE assessment by following the same registration procedures you completed for previous assessment administrations. For information about retake policies, visit www.oh.nesinc.com.
Assessment Preparation Materials. Assessment preparation materials are available through the website you used to register for this assessment.

Appendix B: Test Form Statistics Report for Test Fields with
More than 100 Tests Taken

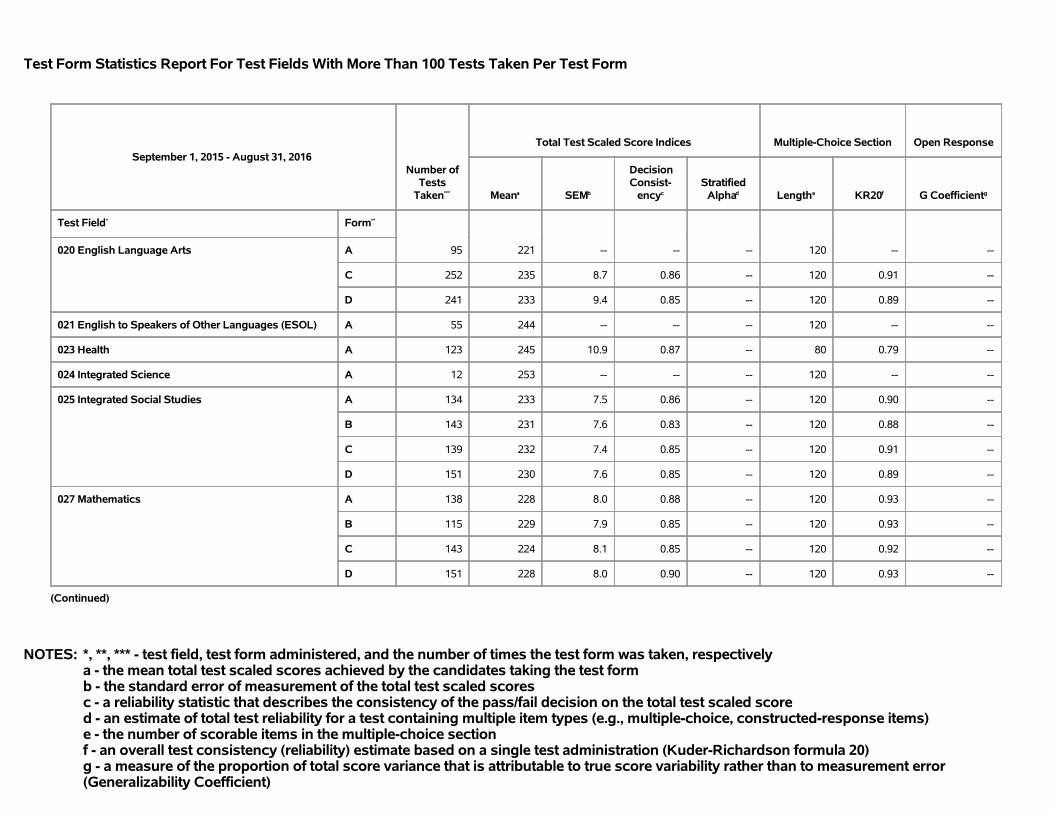
NOTES: *, **, *** - test field, test form administered, and the number of times the test form was taken, respectivelya - the mean total test scaled scores achieved by the candidates taking the test formb - the standard error of measurement of the total test scaled scoresc - a reliability statistic that describes the consistency of the pass/fail decision on the total test scaled scored - an estimate of total test reliability for a test containing multiple item types (e.g., multiple-choice, constructed-response items)e - the number of scorable items in the multiple-choice sectionf - an overall test consistency (reliability) estimate based on a single test administration (Kuder-Richardson formula 20)g - a measure of the proportion of total score variance that is attributable to true score variability rather than to measurement error(Generalizability Coefficient)
Test Form Statistics Report For Test Fields With More Than 100 Tests Taken Per Test Form
September 1, 2015 - August 31, 2016Number of
TestsTaken***
Total Test Scaled Score Indices Multiple-Choice Section Open Response
Meana SEMb
DecisionConsist-
encyc
StratifiedAlphad Lengthe KR20f G Coefficientg
Test Field* Form**
001 Assessment of Professional Knowledge: EarlyChildhood (PK-3)
A701 242 12.7 0.89 0.79 80 0.80 0.29
B 692 242 12.8 0.90 0.79 80 0.80 0.31
C 608 240 12.8 0.90 0.82 80 0.84 0.28
D 577 238 12.9 0.89 0.81 80 0.83 0.24
002 Assessment of Professional Knowledge: MiddleChildhood (4-9)
A52 238 -- -- -- 80 -- --
C 454 239 14.8 0.88 0.78 80 0.78 0.34
D 400 239 14.9 0.86 0.71 80 0.72 0.32
003 Assessment of Professional Knowledge:Adolescence to Young Adult (7-12)
A69 252 -- -- -- 80 -- --
C 589 251 11.9 0.96 0.78 80 0.76 0.40
D 595 252 11.9 0.96 0.80 80 0.79 0.47
(Continued)

NOTES: *, **, *** - test field, test form administered, and the number of times the test form was taken, respectivelya - the mean total test scaled scores achieved by the candidates taking the test formb - the standard error of measurement of the total test scaled scoresc - a reliability statistic that describes the consistency of the pass/fail decision on the total test scaled scored - an estimate of total test reliability for a test containing multiple item types (e.g., multiple-choice, constructed-response items)e - the number of scorable items in the multiple-choice sectionf - an overall test consistency (reliability) estimate based on a single test administration (Kuder-Richardson formula 20)g - a measure of the proportion of total score variance that is attributable to true score variability rather than to measurement error(Generalizability Coefficient)
Test Form Statistics Report For Test Fields With More Than 100 Tests Taken Per Test Form
September 1, 2015 - August 31, 2016Number of
TestsTaken***
Total Test Scaled Score Indices Multiple-Choice Section Open Response
Meana SEMb
DecisionConsist-
encyc
StratifiedAlphad Lengthe KR20f G Coefficientg
Test Field* Form**
004 Assessment of Professional Knowledge: Multi-Age(PK-12)
A96 238 -- -- -- 80 -- --
B 102 244 14.0 0.92 0.82 80 0.84 0.33
C 961 241 13.7 0.90 0.82 80 0.82 0.35
D 962 241 13.5 0.91 0.82 80 0.82 0.45
006 Art A 111 232 10.5 0.87 -- 120 0.87 --
B 115 227 10.7 0.87 -- 120 0.85 --
007 Biology A 115 220 10.3 0.84 -- 120 0.90 --
B 104 220 10.6 0.84 -- 120 0.90 --
012 Early Childhood Education A 358 244 8.4 0.91 -- 120 0.84 --
B 306 244 8.5 0.89 -- 120 0.83 --
C 320 245 8.2 0.93 -- 120 0.84 --
D 272 244 8.4 0.92 -- 120 0.86 --
E 565 243 8.2 0.90 -- 120 0.84 --
F 509 245 8.1 0.92 -- 120 0.88 --
(Continued)

NOTES: *, **, *** - test field, test form administered, and the number of times the test form was taken, respectivelya - the mean total test scaled scores achieved by the candidates taking the test formb - the standard error of measurement of the total test scaled scoresc - a reliability statistic that describes the consistency of the pass/fail decision on the total test scaled scored - an estimate of total test reliability for a test containing multiple item types (e.g., multiple-choice, constructed-response items)e - the number of scorable items in the multiple-choice sectionf - an overall test consistency (reliability) estimate based on a single test administration (Kuder-Richardson formula 20)g - a measure of the proportion of total score variance that is attributable to true score variability rather than to measurement error(Generalizability Coefficient)
Test Form Statistics Report For Test Fields With More Than 100 Tests Taken Per Test Form
September 1, 2015 - August 31, 2016Number of
TestsTaken***
Total Test Scaled Score Indices Multiple-Choice Section Open Response
Meana SEMb
DecisionConsist-
encyc
StratifiedAlphad Lengthe KR20f G Coefficientg
Test Field* Form**
013 Early Childhood Special Education A 45 209 -- -- -- 80 -- --
C 203 232 11.3 0.79 -- 80 0.69 --
D 179 233 11.3 0.80 -- 80 0.73 --
015 Educational Leadership A 88 218 -- -- -- 60 -- --
C 519 224 10.5 0.83 0.73 60 0.69 0.57
D 521 227 10.5 0.84 0.76 60 0.71 0.61
018 Elementary Education Subtest I A 206 239 12.2 0.79 -- 60 0.77 --
B 218 238 12.4 0.82 -- 60 0.74 --
C 193 239 11.8 0.86 -- 60 0.73 --
D 211 237 11.9 0.82 -- 60 0.75 --
019 Elementary Education Subtest II A 73 227 -- -- -- 60 -- --
C 392 229 13.2 0.80 -- 60 0.82 --
D 402 228 13.2 0.84 -- 60 0.84 --
(Continued)
NOTES: *, **, *** - test field, test form administered, and the number of times the test form was taken, respectivelya - the mean total test scaled scores achieved by the candidates taking the test formb - the standard error of measurement of the total test scaled scoresc - a reliability statistic that describes the consistency of the pass/fail decision on the total test scaled scored - an estimate of total test reliability for a test containing multiple item types (e.g., multiple-choice, constructed-response items)e - the number of scorable items in the multiple-choice sectionf - an overall test consistency (reliability) estimate based on a single test administration (Kuder-Richardson formula 20)g - a measure of the proportion of total score variance that is attributable to true score variability rather than to measurement error(Generalizability Coefficient)
Test Form Statistics Report For Test Fields With More Than 100 Tests Taken Per Test Form
September 1, 2015 - August 31, 2016Number of
TestsTaken***
Total Test Scaled Score Indices Multiple-Choice Section Open Response
Meana SEMb
DecisionConsist-
encyc
StratifiedAlphad Lengthe KR20f G Coefficientg
Test Field* Form**
020 English Language Arts A 95 221 -- -- -- 120 -- --
C 252 235 8.7 0.86 -- 120 0.91 --
D 241 233 9.4 0.85 -- 120 0.89 --
021 English to Speakers of Other Languages (ESOL) A 55 244 -- -- -- 120 -- --
023 Health A 123 245 10.9 0.87 -- 80 0.79 --
024 Integrated Science A 12 253 -- -- -- 120 -- --
025 Integrated Social Studies A 134 233 7.5 0.86 -- 120 0.90 --
B 143 231 7.6 0.83 -- 120 0.88 --
C 139 232 7.4 0.85 -- 120 0.91 --
D 151 230 7.6 0.85 -- 120 0.89 --
027 Mathematics A 138 228 8.0 0.88 -- 120 0.93 --
B 115 229 7.9 0.85 -- 120 0.93 --
C 143 224 8.1 0.85 -- 120 0.92 --
D 151 228 8.0 0.90 -- 120 0.93 --
(Continued)

NOTES: *, **, *** - test field, test form administered, and the number of times the test form was taken, respectivelya - the mean total test scaled scores achieved by the candidates taking the test formb - the standard error of measurement of the total test scaled scoresc - a reliability statistic that describes the consistency of the pass/fail decision on the total test scaled scored - an estimate of total test reliability for a test containing multiple item types (e.g., multiple-choice, constructed-response items)e - the number of scorable items in the multiple-choice sectionf - an overall test consistency (reliability) estimate based on a single test administration (Kuder-Richardson formula 20)g - a measure of the proportion of total score variance that is attributable to true score variability rather than to measurement error(Generalizability Coefficient)
Test Form Statistics Report For Test Fields With More Than 100 Tests Taken Per Test Form
September 1, 2015 - August 31, 2016Number of
TestsTaken***
Total Test Scaled Score Indices Multiple-Choice Section Open Response
Meana SEMb
DecisionConsist-
encyc
StratifiedAlphad Lengthe KR20f G Coefficientg
Test Field* Form**
028 Middle Grades English Language Arts A 69 229 -- -- -- 120 -- --
C 292 226 10.4 0.81 -- 120 0.85 --
D 262 226 10.9 0.84 -- 120 0.87 --
029 Middle Grades Science A 64 225 -- -- -- 120 -- --
C 260 224 8.1 0.83 -- 120 0.90 --
D 267 226 7.9 0.81 -- 120 0.89 --
030 Middle Grades Mathematics A 243 221 7.9 0.87 -- 120 0.90 --
B 256 225 7.8 0.88 -- 120 0.90 --
C 149 221 7.8 0.88 -- 120 0.91 --
D 164 220 8.1 0.85 -- 120 0.87 --
031 Middle Grades Social Studies A 76 225 -- -- -- 120 -- --
C 284 218 8.3 0.84 -- 120 0.86 --
D 301 220 8.2 0.84 -- 120 0.87 --
(Continued)

NOTES: *, **, *** - test field, test form administered, and the number of times the test form was taken, respectivelya - the mean total test scaled scores achieved by the candidates taking the test formb - the standard error of measurement of the total test scaled scoresc - a reliability statistic that describes the consistency of the pass/fail decision on the total test scaled scored - an estimate of total test reliability for a test containing multiple item types (e.g., multiple-choice, constructed-response items)e - the number of scorable items in the multiple-choice sectionf - an overall test consistency (reliability) estimate based on a single test administration (Kuder-Richardson formula 20)g - a measure of the proportion of total score variance that is attributable to true score variability rather than to measurement error(Generalizability Coefficient)
Test Form Statistics Report For Test Fields With More Than 100 Tests Taken Per Test Form
September 1, 2015 - August 31, 2016Number of
TestsTaken***
Total Test Scaled Score Indices Multiple-Choice Section Open Response
Meana SEMb
DecisionConsist-
encyc
StratifiedAlphad Lengthe KR20f G Coefficientg
Test Field* Form**
032 Music A 174 237 11.0 0.82 -- 120 0.80 --
B 189 237 11.0 0.87 -- 120 0.84 --
034 Physical Education A 104 229 9.5 0.78 -- 120 0.85 --
B 105 226 9.6 0.86 -- 120 0.87 --
038 Reading Subtest I A 90 243 -- -- -- 54 -- --
C 496 241 14.6 0.87 0.75 54 0.77 0.14
D 460 244 14.5 0.89 0.78 54 0.80 0.23
039 Reading Subtest II A 81 242 -- -- -- 54 -- --
C 460 244 14.5 0.89 0.74 54 0.73 0.38
D 460 246 14.5 0.90 0.75 54 0.74 0.40
040 School Counselor A 142 231 11.0 0.78 -- 120 0.80 --
B 137 233 10.9 0.87 -- 120 0.80 --
(Continued)

NOTES: *, **, *** - test field, test form administered, and the number of times the test form was taken, respectivelya - the mean total test scaled scores achieved by the candidates taking the test formb - the standard error of measurement of the total test scaled scoresc - a reliability statistic that describes the consistency of the pass/fail decision on the total test scaled scored - an estimate of total test reliability for a test containing multiple item types (e.g., multiple-choice, constructed-response items)e - the number of scorable items in the multiple-choice sectionf - an overall test consistency (reliability) estimate based on a single test administration (Kuder-Richardson formula 20)g - a measure of the proportion of total score variance that is attributable to true score variability rather than to measurement error(Generalizability Coefficient)
Test Form Statistics Report For Test Fields With More Than 100 Tests Taken Per Test Form
September 1, 2015 - August 31, 2016Number of
TestsTaken***
Total Test Scaled Score Indices Multiple-Choice Section Open Response
Meana SEMb
DecisionConsist-
encyc
StratifiedAlphad Lengthe KR20f G Coefficientg
Test Field* Form**
043 Special Education A 389 230 9.8 0.85 -- 120 0.88 --
B 437 232 9.8 0.84 -- 120 0.88 --
C 548 232 9.6 0.88 -- 120 0.89 --
D 532 231 9.8 0.83 -- 120 0.88 --
Appendix C: Test Form Statistics Report for Test Fields with
Fewer than 100 Tests Taken

NOTES: *, **, *** - test field, test form administered, and the number of times the test form was taken, respectivelya - the mean total test scaled scores achieved by the candidates taking the test formb - the number of scorable items in the multiple-choice section
Test Form Statistics Report For Test Fields With Fewer Than 100 Tests Taken Per Test Form
September 1, 2015 - August 31, 2016Number of
TestsTaken***
Total TestScaledScoreMeana
Multiple-Choice
SectionLengthb
Test Field* Form**
002 Assessment of Professional Knowledge: Middle Childhood (4-9) B 45 233 80
003 Assessment of Professional Knowledge: Adolescence to Young Adult (7-12) B 58 251 80
005 Agriscience A 15 235 80
008 Business Education A 59 229 120
B 27 235 120
009 Chemistry A 79 229 120
010 Computer Information Science A 14 240 64
013 Early Childhood Special Education B 52 216 80
E 83 236 80
F 83 245 80
014 Earth and Space Science A 24 227 120
015 Educational Leadership B 87 218 60
016 Computer/Technology Subtest I A 90 256 56
017 Computer/Technology Subtest II A 89 249 32
019 Elementary Education Subtest II B 73 229 60
020 English Language Arts B 86 218 120
021 English to Speakers of Other Languages (ESOL) B 66 250 120
C 68 253 120
(Continued)

NOTES: *, **, *** - test field, test form administered, and the number of times the test form was taken, respectivelya - the mean total test scaled scores achieved by the candidates taking the test formb - the number of scorable items in the multiple-choice section
Test Form Statistics Report For Test Fields With Fewer Than 100 Tests Taken Per Test Form
September 1, 2015 - August 31, 2016Number of
TestsTaken***
Total TestScaledScoreMeana
Multiple-Choice
SectionLengthb
Test Field* Form**
022 Family and Consumer Sciences A 11 209 120
B 6 -- 120
024 Integrated Science B 78 245 120
C 96 244 120
026 Marketing A 9 -- 80
028 Middle Grades English Language Arts B 86 227 120
029 Middle Grades Science B 64 226 120
031 Middle Grades Social Studies B 77 218 120
035 Physics A 24 255 120
036 Prekindergarten Subtest I A 55 238 54
037 Prekindergarten Subtest II A 56 236 54
038 Reading Subtest I B 95 244 54
039 Reading Subtest II B 92 247 54
041 School Library Media Specialist A 38 226 120
042 School Psychologist A 1 -- 64
B 1 -- 64
044 Special Education Specialist: Deaf/Hard of Hearing A 6 -- 80
B 3 -- 80
C 3 -- 80
(Continued)

NOTES: *, **, *** - test field, test form administered, and the number of times the test form was taken, respectivelya - the mean total test scaled scores achieved by the candidates taking the test formb - the number of scorable items in the multiple-choice section
Test Form Statistics Report For Test Fields With Fewer Than 100 Tests Taken Per Test Form
September 1, 2015 - August 31, 2016Number of
TestsTaken***
Total TestScaledScoreMeana
Multiple-Choice
SectionLengthb
Test Field* Form**
045 Special Education Specialist: Visually Impaired A 5 -- 64
B 9 -- 64
046 Technology Education Subtest I A 7 -- 36
B 2 -- 36
047 Technology Education Subtest II A 7 -- 60
B 2 -- 60
048 Theater A 12 237 85

Appendix D: Test Field Statistics Report

NOTES: a - the number of times the test was takenb - overall agreement determined by summing exact and adjacent agreementc - the percentage of scores in which the first two scorers were in exact agreementd - the percentage of scores in which the two scorers assigned adjacent scorese - the intraclass correlation between the first and second score assigned to each response, corrected using the Spearman-Brownformula
Test Field Statistics Report For Test Fields With Open-Response Items
Sep 1, 2015 - Aug 31, 2016
Numberof
TestsTakena
Open-Response Prompts
Item 1 of 4 Item 2 of 4
Scorer Agreement
Inter-raterReliabilitye
Scorer Agreement
Inter-raterReliabilitye
PercentAgreementb
PercentExactc
PercentAdjacentd
PercentAgreementb
PercentExactc
PercentAdjacentd
001 Assessment of ProfessionalKnowledge: Early Childhood (PK-3) 2,578 96.8 56.0 40.8 0.59 97.4 60.2 37.3 0.80
002 Assessment of ProfessionalKnowledge: Middle Childhood (4-9) 951 97.8 58.1 39.6 0.71 97.0 61.3 35.8 0.80
003 Assessment of ProfessionalKnowledge: Adolescence to YoungAdult (7-12) 1,311 96.4 56.0 40.5 0.63 97.7 55.8 41.9 0.64
004 Assessment of ProfessionalKnowledge: Multi-Age (PK-12) 2,121 96.3 55.1 41.1 0.67 96.9 58.4 38.5 0.82
015 Educational Leadership 1,215 95.3 52.8 42.6 0.63 95.7 56.9 38.8 0.67
038 Reading Subtest I 1,141 98.8 67.0 31.8 0.79 98.1 63.2 34.9 0.72
039 Reading Subtest II 1,093 98.6 60.8 37.8 0.70 98.0 60.0 38.0 0.64

NOTES: a - the number of times the test was takenb - overall agreement determined by summing exact and adjacent agreementc - the percentage of scores in which the first two scorers were in exact agreementd - the percentage of scores in which the two scorers assigned adjacent scorese - the intraclass correlation between the first and second score assigned to each response, corrected using the Spearman-Brownformula
Test Field Statistics Report For Test Fields With Open-Response Items
Sep 1, 2015 - Aug 31, 2016
Open-Response Prompts
Item 3 of 4 Item 4 of 4
Scorer Agreement
Inter-raterReliabilitye
Scorer Agreement
Inter-raterReliabilitye
PercentAgreementb
PercentExactc
PercentAdjacentd
PercentAgreementb
PercentExactc
PercentAdjacentd
001 Assessment of ProfessionalKnowledge: Early Childhood (PK-3) -- -- -- -- -- -- -- --
002 Assessment of ProfessionalKnowledge: Middle Childhood (4-9) -- -- -- -- -- -- -- --
003 Assessment of ProfessionalKnowledge: Adolescence to YoungAdult (7-12) -- -- -- -- -- -- -- --
004 Assessment of ProfessionalKnowledge: Multi-Age (PK-12) -- -- -- -- -- -- -- --
015 Educational Leadership 94.1 52.7 41.3 0.57 95.9 53.5 42.4 0.58
038 Reading Subtest I -- -- -- -- -- -- -- --
039 Reading Subtest II -- -- -- -- -- -- -- --

Appendix E: Total Scaled Score Distribution by Test Field

Candidate Performance Statistical ReportSeptember 1, 2015 - August 31, 2016
Test Field=001 Assessment of Professional Knowledge: Early Childhood (PK-3)
NN at orabove %
% at orabove
1 1 0.04 0.04
2 3 0.08 0.12
7 10 0.27 0.39
34 44 1.32 1.71
71 115 2.75 4.46
104 219 4.03 8.49
157 376 6.09 14.58
193 569 7.49 22.07
201 770 7.80 29.87
230 1000 8.92 38.79
234 1234 9.08 47.87
198 1432 7.68 55.55
205 1637 7.95 63.50
176 1813 6.83 70.33
157 1970 6.09 76.42
139 2109 5.39 81.81
123 2232 4.77 86.58
104 2336 4.03 90.61
66 2402 2.56 93.17
62 2464 2.40 95.58
20 2484 0.78 96.35
30 2514 1.16 97.52
16 2530 0.62 98.14
15 2545 0.58 98.72
12 2557 0.47 99.19
9 2566 0.35 99.53
4 2570 0.16 99.69
1 2571 0.04 99.73
5 2576 0.19 99.92
0 2576 0.00 99.92
1 2577 0.04 99.96
0 2577 0.00 99.96
1 2578 0.04 100.00
0 2578 0.00 100.00
0 2578 0.00 100.00
0 2578 0.00 100.00
0 2578 0.00 100.00
0 2578 0.00 100.00
0 2578 0.00 100.00
0 2578 0.00 100.00
Total Scaled Score
100-104
105-109
110-114
115-119
120-124
125-129
130-134
135-139
140-144
145-149
150-154
155-159
160-164
165-169
170-174
175-179
180-184
185-189
190-194
195-199
200-204
205-209
210-214
215-219
Passing==> 220-224
225-229
230-234
235-239
240-244
245-249
250-254
255-259
260-264
265-269
270-274
275-279
280-284
285-289
290-294
295-300
0 100 200 300

Candidate Performance Statistical ReportSeptember 1, 2015 - August 31, 2016
Test Field=002 Assessment of Professional Knowledge: Middle Childhood (4-9)
NN at orabove %
% at orabove
0 0 0.00 0.00
5 5 0.53 0.53
4 9 0.42 0.95
10 19 1.05 2.00
24 43 2.52 4.52
44 87 4.63 9.15
49 136 5.15 14.30
58 194 6.10 20.40
59 253 6.20 26.60
78 331 8.20 34.81
77 408 8.10 42.90
101 509 10.62 53.52
78 587 8.20 61.72
61 648 6.41 68.14
64 712 6.73 74.87
43 755 4.52 79.39
46 801 4.84 84.23
25 826 2.63 86.86
34 860 3.58 90.43
23 883 2.42 92.85
19 902 2.00 94.85
14 916 1.47 96.32
12 928 1.26 97.58
5 933 0.53 98.11
7 940 0.74 98.84
3 943 0.32 99.16
2 945 0.21 99.37
2 947 0.21 99.58
0 947 0.00 99.58
2 949 0.21 99.79
0 949 0.00 99.79
1 950 0.11 99.89
1 951 0.11 100.00
0 951 0.00 100.00
0 951 0.00 100.00
0 951 0.00 100.00
0 951 0.00 100.00
0 951 0.00 100.00
0 951 0.00 100.00
0 951 0.00 100.00
Total Scaled Score
100-104
105-109
110-114
115-119
120-124
125-129
130-134
135-139
140-144
145-149
150-154
155-159
160-164
165-169
170-174
175-179
180-184
185-189
190-194
195-199
200-204
205-209
210-214
215-219
Passing==> 220-224
225-229
230-234
235-239
240-244
245-249
250-254
255-259
260-264
265-269
270-274
275-279
280-284
285-289
290-294
295-300
0 10 20 30 40 50 60 70 80 90 100 110

Candidate Performance Statistical ReportSeptember 1, 2015 - August 31, 2016
Test Field=003 Assessment of Professional Knowledge: Adolescence to Young Adult (7-12)
NN at orabove %
% at orabove
1 1 0.08 0.08
6 7 0.46 0.53
20 27 1.53 2.06
40 67 3.05 5.11
75 142 5.72 10.83
92 234 7.02 17.85
117 351 8.92 26.77
141 492 10.76 37.53
150 642 11.44 48.97
127 769 9.69 58.66
116 885 8.85 67.51
103 988 7.86 75.36
95 1083 7.25 82.61
64 1147 4.88 87.49
44 1191 3.36 90.85
34 1225 2.59 93.44
24 1249 1.83 95.27
18 1267 1.37 96.64
11 1278 0.84 97.48
8 1286 0.61 98.09
9 1295 0.69 98.78
8 1303 0.61 99.39
2 1305 0.15 99.54
1 1306 0.08 99.62
2 1308 0.15 99.77
0 1308 0.00 99.77
1 1309 0.08 99.85
1 1310 0.08 99.92
0 1310 0.00 99.92
1 1311 0.08 100.00
0 1311 0.00 100.00
0 1311 0.00 100.00
0 1311 0.00 100.00
0 1311 0.00 100.00
0 1311 0.00 100.00
0 1311 0.00 100.00
0 1311 0.00 100.00
0 1311 0.00 100.00
0 1311 0.00 100.00
0 1311 0.00 100.00
Total Scaled Score
100-104
105-109
110-114
115-119
120-124
125-129
130-134
135-139
140-144
145-149
150-154
155-159
160-164
165-169
170-174
175-179
180-184
185-189
190-194
195-199
200-204
205-209
210-214
215-219
Passing==> 220-224
225-229
230-234
235-239
240-244
245-249
250-254
255-259
260-264
265-269
270-274
275-279
280-284
285-289
290-294
295-300
0 20 40 60 80 100 120 140 160
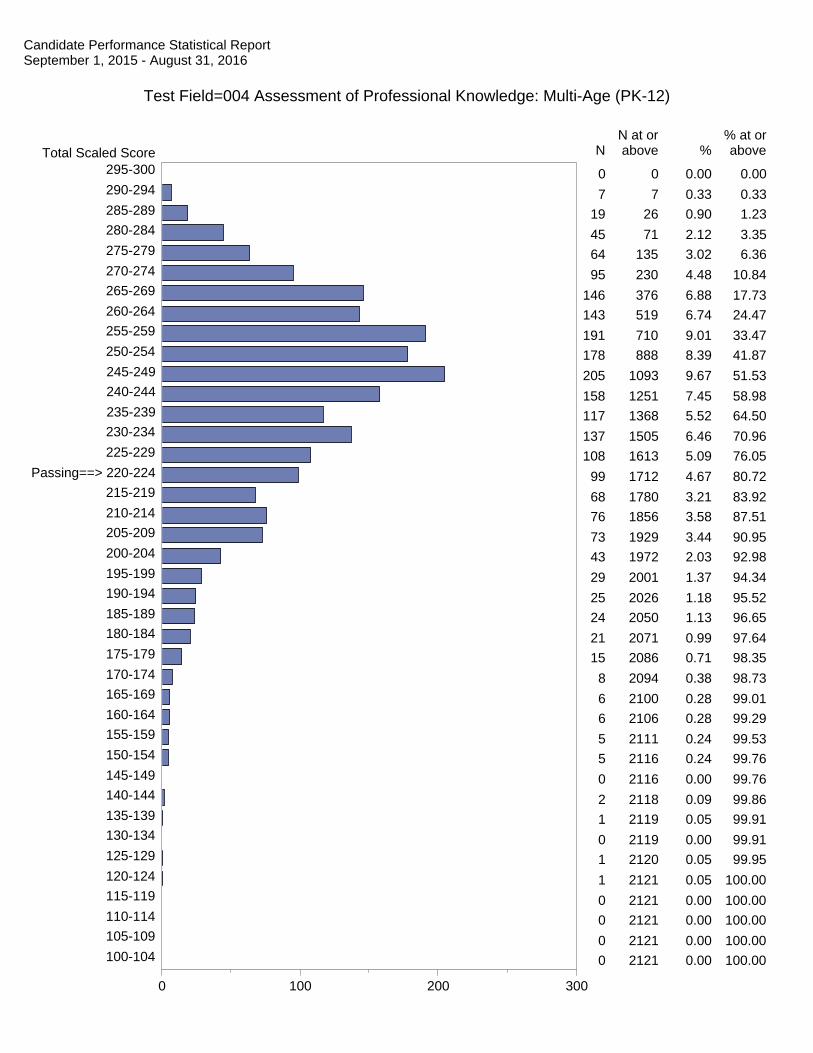
Candidate Performance Statistical ReportSeptember 1, 2015 - August 31, 2016
Test Field=004 Assessment of Professional Knowledge: Multi-Age (PK-12)
NN at orabove %
% at orabove
0 0 0.00 0.00
7 7 0.33 0.33
19 26 0.90 1.23
45 71 2.12 3.35
64 135 3.02 6.36
95 230 4.48 10.84
146 376 6.88 17.73
143 519 6.74 24.47
191 710 9.01 33.47
178 888 8.39 41.87
205 1093 9.67 51.53
158 1251 7.45 58.98
117 1368 5.52 64.50
137 1505 6.46 70.96
108 1613 5.09 76.05
99 1712 4.67 80.72
68 1780 3.21 83.92
76 1856 3.58 87.51
73 1929 3.44 90.95
43 1972 2.03 92.98
29 2001 1.37 94.34
25 2026 1.18 95.52
24 2050 1.13 96.65
21 2071 0.99 97.64
15 2086 0.71 98.35
8 2094 0.38 98.73
6 2100 0.28 99.01
6 2106 0.28 99.29
5 2111 0.24 99.53
5 2116 0.24 99.76
0 2116 0.00 99.76
2 2118 0.09 99.86
1 2119 0.05 99.91
0 2119 0.00 99.91
1 2120 0.05 99.95
1 2121 0.05 100.00
0 2121 0.00 100.00
0 2121 0.00 100.00
0 2121 0.00 100.00
0 2121 0.00 100.00
Total Scaled Score
100-104
105-109
110-114
115-119
120-124
125-129
130-134
135-139
140-144
145-149
150-154
155-159
160-164
165-169
170-174
175-179
180-184
185-189
190-194
195-199
200-204
205-209
210-214
215-219
Passing==> 220-224
225-229
230-234
235-239
240-244
245-249
250-254
255-259
260-264
265-269
270-274
275-279
280-284
285-289
290-294
295-300
0 100 200 300

Candidate Performance Statistical ReportSeptember 1, 2015 - August 31, 2016
Test Field=005 Agriscience
NN at orabove %
% at orabove
0 0 0.00 0.00
0 0 0.00 0.00
0 0 0.00 0.00
0 0 0.00 0.00
0 0 0.00 0.00
1 1 6.67 6.67
0 1 0.00 6.67
1 2 6.67 13.33
2 4 13.33 26.67
0 4 0.00 26.67
1 5 6.67 33.33
0 5 0.00 33.33
3 8 20.00 53.33
2 10 13.33 66.67
1 11 6.67 73.33
0 11 0.00 73.33
0 11 0.00 73.33
0 11 0.00 73.33
1 12 6.67 80.00
3 15 20.00 100.00
0 15 0.00 100.00
0 15 0.00 100.00
0 15 0.00 100.00
0 15 0.00 100.00
0 15 0.00 100.00
0 15 0.00 100.00
0 15 0.00 100.00
0 15 0.00 100.00
0 15 0.00 100.00
0 15 0.00 100.00
0 15 0.00 100.00
0 15 0.00 100.00
0 15 0.00 100.00
0 15 0.00 100.00
0 15 0.00 100.00
0 15 0.00 100.00
0 15 0.00 100.00
0 15 0.00 100.00
0 15 0.00 100.00
0 15 0.00 100.00
Total Scaled Score
100-104
105-109
110-114
115-119
120-124
125-129
130-134
135-139
140-144
145-149
150-154
155-159
160-164
165-169
170-174
175-179
180-184
185-189
190-194
195-199
200-204
205-209
210-214
215-219
Passing==> 220-224
225-229
230-234
235-239
240-244
245-249
250-254
255-259
260-264
265-269
270-274
275-279
280-284
285-289
290-294
295-300
0 1 2 3

Candidate Performance Statistical ReportSeptember 1, 2015 - August 31, 2016
Test Field=006 Art
NN at orabove %
% at orabove
0 0 0.00 0.00
1 1 0.44 0.44
1 2 0.44 0.88
3 5 1.33 2.21
4 9 1.77 3.98
3 12 1.33 5.31
7 19 3.10 8.41
18 37 7.96 16.37
16 53 7.08 23.45
10 63 4.42 27.88
18 81 7.96 35.84
12 93 5.31 41.15
10 103 4.42 45.58
7 110 3.10 48.67
20 130 8.85 57.52
15 145 6.64 64.16
15 160 6.64 70.80
10 170 4.42 75.22
16 186 7.08 82.30
7 193 3.10 85.40
10 203 4.42 89.82
4 207 1.77 91.59
3 210 1.33 92.92
3 213 1.33 94.25
6 219 2.65 96.90
3 222 1.33 98.23
1 223 0.44 98.67
1 224 0.44 99.12
1 225 0.44 99.56
1 226 0.44 100.00
0 226 0.00 100.00
0 226 0.00 100.00
0 226 0.00 100.00
0 226 0.00 100.00
0 226 0.00 100.00
0 226 0.00 100.00
0 226 0.00 100.00
0 226 0.00 100.00
0 226 0.00 100.00
0 226 0.00 100.00
Total Scaled Score
100-104
105-109
110-114
115-119
120-124
125-129
130-134
135-139
140-144
145-149
150-154
155-159
160-164
165-169
170-174
175-179
180-184
185-189
190-194
195-199
200-204
205-209
210-214
215-219
Passing==> 220-224
225-229
230-234
235-239
240-244
245-249
250-254
255-259
260-264
265-269
270-274
275-279
280-284
285-289
290-294
295-300
0 10 20

Candidate Performance Statistical ReportSeptember 1, 2015 - August 31, 2016
Test Field=007 Biology
NN at orabove %
% at orabove
0 0 0.00 0.00
2 2 0.91 0.91
1 3 0.46 1.37
3 6 1.37 2.74
3 9 1.37 4.11
2 11 0.91 5.02
6 17 2.74 7.76
10 27 4.57 12.33
8 35 3.65 15.98
7 42 3.20 19.18
5 47 2.28 21.46
12 59 5.48 26.94
10 69 4.57 31.51
11 80 5.02 36.53
21 101 9.59 46.12
13 114 5.94 52.05
16 130 7.31 59.36
16 146 7.31 66.67
10 156 4.57 71.23
6 162 2.74 73.97
15 177 6.85 80.82
4 181 1.83 82.65
7 188 3.20 85.84
5 193 2.28 88.13
3 196 1.37 89.50
6 202 2.74 92.24
5 207 2.28 94.52
2 209 0.91 95.43
1 210 0.46 95.89
4 214 1.83 97.72
2 216 0.91 98.63
0 216 0.00 98.63
1 217 0.46 99.09
0 217 0.00 99.09
1 218 0.46 99.54
1 219 0.46 100.00
0 219 0.00 100.00
0 219 0.00 100.00
0 219 0.00 100.00
0 219 0.00 100.00
Total Scaled Score
100-104
105-109
110-114
115-119
120-124
125-129
130-134
135-139
140-144
145-149
150-154
155-159
160-164
165-169
170-174
175-179
180-184
185-189
190-194
195-199
200-204
205-209
210-214
215-219
Passing==> 220-224
225-229
230-234
235-239
240-244
245-249
250-254
255-259
260-264
265-269
270-274
275-279
280-284
285-289
290-294
295-300
0 10 20 30

Candidate Performance Statistical ReportSeptember 1, 2015 - August 31, 2016
Test Field=008 Business Education
NN at orabove %
% at orabove
0 0 0.00 0.00
0 0 0.00 0.00
0 0 0.00 0.00
3 3 3.49 3.49
3 6 3.49 6.98
2 8 2.33 9.30
3 11 3.49 12.79
7 18 8.14 20.93
3 21 3.49 24.42
2 23 2.33 26.74
8 31 9.30 36.05
7 38 8.14 44.19
3 41 3.49 47.67
5 46 5.81 53.49
3 49 3.49 56.98
6 55 6.98 63.95
7 62 8.14 72.09
3 65 3.49 75.58
2 67 2.33 77.91
4 71 4.65 82.56
4 75 4.65 87.21
4 79 4.65 91.86
2 81 2.33 94.19
1 82 1.16 95.35
2 84 2.33 97.67
2 86 2.33 100.00
0 86 0.00 100.00
0 86 0.00 100.00
0 86 0.00 100.00
0 86 0.00 100.00
0 86 0.00 100.00
0 86 0.00 100.00
0 86 0.00 100.00
0 86 0.00 100.00
0 86 0.00 100.00
0 86 0.00 100.00
0 86 0.00 100.00
0 86 0.00 100.00
0 86 0.00 100.00
0 86 0.00 100.00
Total Scaled Score
100-104
105-109
110-114
115-119
120-124
125-129
130-134
135-139
140-144
145-149
150-154
155-159
160-164
165-169
170-174
175-179
180-184
185-189
190-194
195-199
200-204
205-209
210-214
215-219
Passing==> 220-224
225-229
230-234
235-239
240-244
245-249
250-254
255-259
260-264
265-269
270-274
275-279
280-284
285-289
290-294
295-300
0 1 2 3 4 5 6 7 8

Candidate Performance Statistical ReportSeptember 1, 2015 - August 31, 2016
Test Field=009 Chemistry
NN at orabove %
% at orabove
0 0 0.00 0.00
0 0 0.00 0.00
1 1 1.27 1.27
4 5 5.06 6.33
3 8 3.80 10.13
2 10 2.53 12.66
2 12 2.53 15.19
3 15 3.80 18.99
5 20 6.33 25.32
1 21 1.27 26.58
7 28 8.86 35.44
2 30 2.53 37.97
2 32 2.53 40.51
7 39 8.86 49.37
3 42 3.80 53.16
9 51 11.39 64.56
3 54 3.80 68.35
3 57 3.80 72.15
3 60 3.80 75.95
3 63 3.80 79.75
4 67 5.06 84.81
0 67 0.00 84.81
5 72 6.33 91.14
1 73 1.27 92.41
3 76 3.80 96.20
0 76 0.00 96.20
2 78 2.53 98.73
0 78 0.00 98.73
0 78 0.00 98.73
1 79 1.27 100.00
0 79 0.00 100.00
0 79 0.00 100.00
0 79 0.00 100.00
0 79 0.00 100.00
0 79 0.00 100.00
0 79 0.00 100.00
0 79 0.00 100.00
0 79 0.00 100.00
0 79 0.00 100.00
0 79 0.00 100.00
Total Scaled Score
100-104
105-109
110-114
115-119
120-124
125-129
130-134
135-139
140-144
145-149
150-154
155-159
160-164
165-169
170-174
175-179
180-184
185-189
190-194
195-199
200-204
205-209
210-214
215-219
Passing==> 220-224
225-229
230-234
235-239
240-244
245-249
250-254
255-259
260-264
265-269
270-274
275-279
280-284
285-289
290-294
295-300
0 1 2 3 4 5 6 7 8 9

Candidate Performance Statistical ReportSeptember 1, 2015 - August 31, 2016
Test Field=010 Computer Information Science
NN at orabove %
% at orabove
0 0 0.00 0.00
0 0 0.00 0.00
0 0 0.00 0.00
1 1 7.14 7.14
3 4 21.43 28.57
1 5 7.14 35.71
0 5 0.00 35.71
1 6 7.14 42.86
0 6 0.00 42.86
0 6 0.00 42.86
3 9 21.43 64.29
0 9 0.00 64.29
0 9 0.00 64.29
0 9 0.00 64.29
1 10 7.14 71.43
1 11 7.14 78.57
0 11 0.00 78.57
0 11 0.00 78.57
0 11 0.00 78.57
0 11 0.00 78.57
1 12 7.14 85.71
0 12 0.00 85.71
0 12 0.00 85.71
0 12 0.00 85.71
1 13 7.14 92.86
0 13 0.00 92.86
0 13 0.00 92.86
0 13 0.00 92.86
0 13 0.00 92.86
0 13 0.00 92.86
0 13 0.00 92.86
1 14 7.14 100.00
0 14 0.00 100.00
0 14 0.00 100.00
0 14 0.00 100.00
0 14 0.00 100.00
0 14 0.00 100.00
0 14 0.00 100.00
0 14 0.00 100.00
0 14 0.00 100.00
Total Scaled Score
100-104
105-109
110-114
115-119
120-124
125-129
130-134
135-139
140-144
145-149
150-154
155-159
160-164
165-169
170-174
175-179
180-184
185-189
190-194
195-199
200-204
205-209
210-214
215-219
Passing==> 220-224
225-229
230-234
235-239
240-244
245-249
250-254
255-259
260-264
265-269
270-274
275-279
280-284
285-289
290-294
295-300
0 1 2 3

Candidate Performance Statistical ReportSeptember 1, 2015 - August 31, 2016
Test Field=012 Early Childhood Education
NN at orabove %
% at orabove
0 0 0.00 0.00
2 2 0.09 0.09
17 19 0.73 0.82
27 46 1.16 1.97
68 114 2.92 4.89
105 219 4.51 9.40
157 376 6.74 16.14
247 623 10.60 26.74
195 818 8.37 35.11
213 1031 9.14 44.25
232 1263 9.96 54.21
185 1448 7.94 62.15
161 1609 6.91 69.06
201 1810 8.63 77.68
104 1914 4.46 82.15
121 2035 5.19 87.34
67 2102 2.88 90.21
70 2172 3.00 93.22
49 2221 2.10 95.32
36 2257 1.55 96.87
30 2287 1.29 98.15
16 2303 0.69 98.84
6 2309 0.26 99.10
4 2313 0.17 99.27
7 2320 0.30 99.57
2 2322 0.09 99.66
3 2325 0.13 99.79
2 2327 0.09 99.87
1 2328 0.04 99.91
0 2328 0.00 99.91
0 2328 0.00 99.91
0 2328 0.00 99.91
1 2329 0.04 99.96
1 2330 0.04 100.00
0 2330 0.00 100.00
0 2330 0.00 100.00
0 2330 0.00 100.00
0 2330 0.00 100.00
0 2330 0.00 100.00
0 2330 0.00 100.00
Total Scaled Score
100-104
105-109
110-114
115-119
120-124
125-129
130-134
135-139
140-144
145-149
150-154
155-159
160-164
165-169
170-174
175-179
180-184
185-189
190-194
195-199
200-204
205-209
210-214
215-219
Passing==> 220-224
225-229
230-234
235-239
240-244
245-249
250-254
255-259
260-264
265-269
270-274
275-279
280-284
285-289
290-294
295-300
0 100 200 300

Candidate Performance Statistical ReportSeptember 1, 2015 - August 31, 2016
Test Field=013 Early Childhood Special Education
NN at orabove %
% at orabove
0 0 0.00 0.00
1 1 0.16 0.16
3 4 0.47 0.62
7 11 1.09 1.71
4 15 0.62 2.33
18 33 2.79 5.12
30 63 4.65 9.77
20 83 3.10 12.87
40 123 6.20 19.07
28 151 4.34 23.41
54 205 8.37 31.78
23 228 3.57 35.35
59 287 9.15 44.50
85 372 13.18 57.67
28 400 4.34 62.02
58 458 8.99 71.01
23 481 3.57 74.57
47 528 7.29 81.86
37 565 5.74 87.60
21 586 3.26 90.85
6 592 0.93 91.78
26 618 4.03 95.81
11 629 1.71 97.52
5 634 0.78 98.29
2 636 0.31 98.60
4 640 0.62 99.22
1 641 0.16 99.38
3 644 0.47 99.84
0 644 0.00 99.84
0 644 0.00 99.84
0 644 0.00 99.84
1 645 0.16 100.00
0 645 0.00 100.00
0 645 0.00 100.00
0 645 0.00 100.00
0 645 0.00 100.00
0 645 0.00 100.00
0 645 0.00 100.00
0 645 0.00 100.00
0 645 0.00 100.00
Total Scaled Score
100-104
105-109
110-114
115-119
120-124
125-129
130-134
135-139
140-144
145-149
150-154
155-159
160-164
165-169
170-174
175-179
180-184
185-189
190-194
195-199
200-204
205-209
210-214
215-219
Passing==> 220-224
225-229
230-234
235-239
240-244
245-249
250-254
255-259
260-264
265-269
270-274
275-279
280-284
285-289
290-294
295-300
0 10 20 30 40 50 60 70 80 90

Candidate Performance Statistical ReportSeptember 1, 2015 - August 31, 2016
Test Field=014 Earth and Space Science
NN at orabove %
% at orabove
0 0 0.00 0.00
0 0 0.00 0.00
0 0 0.00 0.00
1 1 4.17 4.17
0 1 0.00 4.17
1 2 4.17 8.33
1 3 4.17 12.50
0 3 0.00 12.50
0 3 0.00 12.50
0 3 0.00 12.50
1 4 4.17 16.67
2 6 8.33 25.00
3 9 12.50 37.50
1 10 4.17 41.67
2 12 8.33 50.00
4 16 16.67 66.67
3 19 12.50 79.17
1 20 4.17 83.33
0 20 0.00 83.33
0 20 0.00 83.33
1 21 4.17 87.50
1 22 4.17 91.67
1 23 4.17 95.83
0 23 0.00 95.83
0 23 0.00 95.83
1 24 4.17 100.00
0 24 0.00 100.00
0 24 0.00 100.00
0 24 0.00 100.00
0 24 0.00 100.00
0 24 0.00 100.00
0 24 0.00 100.00
0 24 0.00 100.00
0 24 0.00 100.00
0 24 0.00 100.00
0 24 0.00 100.00
0 24 0.00 100.00
0 24 0.00 100.00
0 24 0.00 100.00
0 24 0.00 100.00
Total Scaled Score
100-104
105-109
110-114
115-119
120-124
125-129
130-134
135-139
140-144
145-149
150-154
155-159
160-164
165-169
170-174
175-179
180-184
185-189
190-194
195-199
200-204
205-209
210-214
215-219
Passing==> 220-224
225-229
230-234
235-239
240-244
245-249
250-254
255-259
260-264
265-269
270-274
275-279
280-284
285-289
290-294
295-300
0 1 2 3 4

Candidate Performance Statistical ReportSeptember 1, 2015 - August 31, 2016
Test Field=015 Educational Leadership
NN at orabove %
% at orabove
0 0 0.00 0.00
0 0 0.00 0.00
0 0 0.00 0.00
1 1 0.08 0.08
4 5 0.33 0.41
7 12 0.58 0.99
16 28 1.32 2.30
25 53 2.06 4.36
49 102 4.03 8.40
56 158 4.61 13.00
90 248 7.41 20.41
66 314 5.43 25.84
88 402 7.24 33.09
123 525 10.12 43.21
135 660 11.11 54.32
67 727 5.51 59.84
106 833 8.72 68.56
92 925 7.57 76.13
59 984 4.86 80.99
54 1038 4.44 85.43
48 1086 3.95 89.38
28 1114 2.30 91.69
29 1143 2.39 94.07
24 1167 1.98 96.05
24 1191 1.98 98.02
8 1199 0.66 98.68
8 1207 0.66 99.34
5 1212 0.41 99.75
0 1212 0.00 99.75
1 1213 0.08 99.84
2 1215 0.16 100.00
0 1215 0.00 100.00
0 1215 0.00 100.00
0 1215 0.00 100.00
0 1215 0.00 100.00
0 1215 0.00 100.00
0 1215 0.00 100.00
0 1215 0.00 100.00
0 1215 0.00 100.00
0 1215 0.00 100.00
Total Scaled Score
100-104
105-109
110-114
115-119
120-124
125-129
130-134
135-139
140-144
145-149
150-154
155-159
160-164
165-169
170-174
175-179
180-184
185-189
190-194
195-199
200-204
205-209
210-214
215-219
Passing==> 220-224
225-229
230-234
235-239
240-244
245-249
250-254
255-259
260-264
265-269
270-274
275-279
280-284
285-289
290-294
295-300
0 10 20 30 40 50 60 70 80 90 100 110 120 130 140

Candidate Performance Statistical ReportSeptember 1, 2015 - August 31, 2016
Test Field=016 Computer/Technology Subtest I
NN at orabove %
% at orabove
1 1 1.11 1.11
5 6 5.56 6.67
4 10 4.44 11.11
3 13 3.33 14.44
13 26 14.44 28.89
8 34 8.89 37.78
7 41 7.78 45.56
6 47 6.67 52.22
10 57 11.11 63.33
4 61 4.44 67.78
4 65 4.44 72.22
4 69 4.44 76.67
1 70 1.11 77.78
5 75 5.56 83.33
2 77 2.22 85.56
3 80 3.33 88.89
1 81 1.11 90.00
5 86 5.56 95.56
1 87 1.11 96.67
0 87 0.00 96.67
2 89 2.22 98.89
1 90 1.11 100.00
0 90 0.00 100.00
0 90 0.00 100.00
0 90 0.00 100.00
0 90 0.00 100.00
0 90 0.00 100.00
0 90 0.00 100.00
0 90 0.00 100.00
0 90 0.00 100.00
0 90 0.00 100.00
0 90 0.00 100.00
0 90 0.00 100.00
0 90 0.00 100.00
0 90 0.00 100.00
0 90 0.00 100.00
0 90 0.00 100.00
0 90 0.00 100.00
0 90 0.00 100.00
0 90 0.00 100.00
Total Scaled Score
100-104
105-109
110-114
115-119
120-124
125-129
130-134
135-139
140-144
145-149
150-154
155-159
160-164
165-169
170-174
175-179
180-184
185-189
190-194
195-199
200-204
205-209
210-214
215-219
Passing==> 220-224
225-229
230-234
235-239
240-244
245-249
250-254
255-259
260-264
265-269
270-274
275-279
280-284
285-289
290-294
295-300
0 1 2 3 4 5 6 7 8 9 10 11 12 13

Candidate Performance Statistical ReportSeptember 1, 2015 - August 31, 2016
Test Field=017 Computer/Technology Subtest II
NN at orabove %
% at orabove
0 0 0.00 0.00
3 3 3.37 3.37
2 5 2.25 5.62
5 10 5.62 11.24
6 16 6.74 17.98
8 24 8.99 26.97
3 27 3.37 30.34
3 30 3.37 33.71
4 34 4.49 38.20
8 42 8.99 47.19
8 50 8.99 56.18
12 62 13.48 69.66
4 66 4.49 74.16
7 73 7.87 82.02
2 75 2.25 84.27
2 77 2.25 86.52
2 79 2.25 88.76
4 83 4.49 93.26
2 85 2.25 95.51
1 86 1.12 96.63
1 87 1.12 97.75
0 87 0.00 97.75
0 87 0.00 97.75
0 87 0.00 97.75
1 88 1.12 98.88
1 89 1.12 100.00
0 89 0.00 100.00
0 89 0.00 100.00
0 89 0.00 100.00
0 89 0.00 100.00
0 89 0.00 100.00
0 89 0.00 100.00
0 89 0.00 100.00
0 89 0.00 100.00
0 89 0.00 100.00
0 89 0.00 100.00
0 89 0.00 100.00
0 89 0.00 100.00
0 89 0.00 100.00
0 89 0.00 100.00
Total Scaled Score
100-104
105-109
110-114
115-119
120-124
125-129
130-134
135-139
140-144
145-149
150-154
155-159
160-164
165-169
170-174
175-179
180-184
185-189
190-194
195-199
200-204
205-209
210-214
215-219
Passing==> 220-224
225-229
230-234
235-239
240-244
245-249
250-254
255-259
260-264
265-269
270-274
275-279
280-284
285-289
290-294
295-300
0 1 2 3 4 5 6 7 8 9 10 11 12

Candidate Performance Statistical ReportSeptember 1, 2015 - August 31, 2016
Test Field=018 Elementary Education Subtest I
NN at orabove %
% at orabove
1 1 0.12 0.12
2 3 0.24 0.36
10 13 1.21 1.57
16 29 1.93 3.50
16 45 1.93 5.43
42 87 5.07 10.51
35 122 4.23 14.73
67 189 8.09 22.83
39 228 4.71 27.54
60 288 7.25 34.78
53 341 6.40 41.18
64 405 7.73 48.91
64 469 7.73 56.64
57 526 6.88 63.53
43 569 5.19 68.72
80 649 9.66 78.38
48 697 5.80 84.18
28 725 3.38 87.56
29 754 3.50 91.06
24 778 2.90 93.96
17 795 2.05 96.01
12 807 1.45 97.46
5 812 0.60 98.07
10 822 1.21 99.28
2 824 0.24 99.52
4 828 0.48 100.00
0 828 0.00 100.00
0 828 0.00 100.00
0 828 0.00 100.00
0 828 0.00 100.00
0 828 0.00 100.00
0 828 0.00 100.00
0 828 0.00 100.00
0 828 0.00 100.00
0 828 0.00 100.00
0 828 0.00 100.00
0 828 0.00 100.00
0 828 0.00 100.00
0 828 0.00 100.00
0 828 0.00 100.00
Total Scaled Score
100-104
105-109
110-114
115-119
120-124
125-129
130-134
135-139
140-144
145-149
150-154
155-159
160-164
165-169
170-174
175-179
180-184
185-189
190-194
195-199
200-204
205-209
210-214
215-219
Passing==> 220-224
225-229
230-234
235-239
240-244
245-249
250-254
255-259
260-264
265-269
270-274
275-279
280-284
285-289
290-294
295-300
0 10 20 30 40 50 60 70 80

Candidate Performance Statistical ReportSeptember 1, 2015 - August 31, 2016
Test Field=019 Elementary Education Subtest II
NN at orabove %
% at orabove
7 7 0.74 0.74
6 13 0.64 1.38
13 26 1.38 2.77
13 39 1.38 4.15
39 78 4.15 8.30
26 104 2.77 11.06
36 140 3.83 14.89
36 176 3.83 18.72
41 217 4.36 23.09
31 248 3.30 26.38
77 325 8.19 34.57
43 368 4.57 39.15
35 403 3.72 42.87
40 443 4.26 47.13
58 501 6.17 53.30
86 587 9.15 62.45
31 618 3.30 65.74
46 664 4.89 70.64
40 704 4.26 74.89
33 737 3.51 78.40
59 796 6.28 84.68
37 833 3.94 88.62
24 857 2.55 91.17
19 876 2.02 93.19
19 895 2.02 95.21
11 906 1.17 96.38
19 925 2.02 98.40
6 931 0.64 99.04
3 934 0.32 99.36
3 937 0.32 99.68
0 937 0.00 99.68
2 939 0.21 99.89
0 939 0.00 99.89
0 939 0.00 99.89
1 940 0.11 100.00
0 940 0.00 100.00
0 940 0.00 100.00
0 940 0.00 100.00
0 940 0.00 100.00
0 940 0.00 100.00
Total Scaled Score
100-104
105-109
110-114
115-119
120-124
125-129
130-134
135-139
140-144
145-149
150-154
155-159
160-164
165-169
170-174
175-179
180-184
185-189
190-194
195-199
200-204
205-209
210-214
215-219
Passing==> 220-224
225-229
230-234
235-239
240-244
245-249
250-254
255-259
260-264
265-269
270-274
275-279
280-284
285-289
290-294
295-300
0 10 20 30 40 50 60 70 80 90

Candidate Performance Statistical ReportSeptember 1, 2015 - August 31, 2016
Test Field=020 English Language Arts
NN at orabove %
% at orabove
0 0 0.00 0.00
1 1 0.15 0.15
7 8 1.04 1.19
7 15 1.04 2.23
15 30 2.23 4.45
28 58 4.15 8.61
33 91 4.90 13.50
20 111 2.97 16.47
40 151 5.93 22.40
41 192 6.08 28.49
30 222 4.45 32.94
31 253 4.60 37.54
63 316 9.35 46.88
45 361 6.68 53.56
34 395 5.04 58.61
58 453 8.61 67.21
39 492 5.79 73.00
31 523 4.60 77.60
38 561 5.64 83.23
23 584 3.41 86.65
22 606 3.26 89.91
15 621 2.23 92.14
10 631 1.48 93.62
7 638 1.04 94.66
10 648 1.48 96.14
5 653 0.74 96.88
3 656 0.45 97.33
4 660 0.59 97.92
2 662 0.30 98.22
2 664 0.30 98.52
2 666 0.30 98.81
2 668 0.30 99.11
2 670 0.30 99.41
1 671 0.15 99.55
1 672 0.15 99.70
0 672 0.00 99.70
0 672 0.00 99.70
0 672 0.00 99.70
0 672 0.00 99.70
2 674 0.30 100.00
Total Scaled Score
100-104
105-109
110-114
115-119
120-124
125-129
130-134
135-139
140-144
145-149
150-154
155-159
160-164
165-169
170-174
175-179
180-184
185-189
190-194
195-199
200-204
205-209
210-214
215-219
Passing==> 220-224
225-229
230-234
235-239
240-244
245-249
250-254
255-259
260-264
265-269
270-274
275-279
280-284
285-289
290-294
295-300
0 10 20 30 40 50 60 70

Candidate Performance Statistical ReportSeptember 1, 2015 - August 31, 2016
Test Field=021 English to Speakers of Other Languages (ESOL)
NN at orabove %
% at orabove
0 0 0.00 0.00
1 1 0.53 0.53
4 5 2.12 2.65
5 10 2.65 5.29
10 20 5.29 10.58
16 36 8.47 19.05
20 56 10.58 29.63
18 74 9.52 39.15
20 94 10.58 49.74
14 108 7.41 57.14
16 124 8.47 65.61
13 137 6.88 72.49
10 147 5.29 77.78
10 157 5.29 83.07
4 161 2.12 85.19
4 165 2.12 87.30
7 172 3.70 91.01
4 176 2.12 93.12
6 182 3.17 96.30
0 182 0.00 96.30
3 185 1.59 97.88
0 185 0.00 97.88
1 186 0.53 98.41
1 187 0.53 98.94
0 187 0.00 98.94
1 188 0.53 99.47
0 188 0.00 99.47
0 188 0.00 99.47
0 188 0.00 99.47
1 189 0.53 100.00
0 189 0.00 100.00
0 189 0.00 100.00
0 189 0.00 100.00
0 189 0.00 100.00
0 189 0.00 100.00
0 189 0.00 100.00
0 189 0.00 100.00
0 189 0.00 100.00
0 189 0.00 100.00
0 189 0.00 100.00
Total Scaled Score
100-104
105-109
110-114
115-119
120-124
125-129
130-134
135-139
140-144
145-149
150-154
155-159
160-164
165-169
170-174
175-179
180-184
185-189
190-194
195-199
200-204
205-209
210-214
215-219
Passing==> 220-224
225-229
230-234
235-239
240-244
245-249
250-254
255-259
260-264
265-269
270-274
275-279
280-284
285-289
290-294
295-300
0 10 20

Candidate Performance Statistical ReportSeptember 1, 2015 - August 31, 2016
Test Field=022 Family and Consumer Sciences
NN at orabove %
% at orabove
0 0 0.00 0.00
0 0 0.00 0.00
0 0 0.00 0.00
0 0 0.00 0.00
0 0 0.00 0.00
0 0 0.00 0.00
1 1 5.88 5.88
1 2 5.88 11.76
1 3 5.88 17.65
0 3 0.00 17.65
1 4 5.88 23.53
2 6 11.76 35.29
0 6 0.00 35.29
1 7 5.88 41.18
0 7 0.00 41.18
1 8 5.88 47.06
0 8 0.00 47.06
0 8 0.00 47.06
0 8 0.00 47.06
1 9 5.88 52.94
1 10 5.88 58.82
4 14 23.53 82.35
0 14 0.00 82.35
2 16 11.76 94.12
0 16 0.00 94.12
0 16 0.00 94.12
1 17 5.88 100.00
0 17 0.00 100.00
0 17 0.00 100.00
0 17 0.00 100.00
0 17 0.00 100.00
0 17 0.00 100.00
0 17 0.00 100.00
0 17 0.00 100.00
0 17 0.00 100.00
0 17 0.00 100.00
0 17 0.00 100.00
0 17 0.00 100.00
0 17 0.00 100.00
0 17 0.00 100.00
Total Scaled Score
100-104
105-109
110-114
115-119
120-124
125-129
130-134
135-139
140-144
145-149
150-154
155-159
160-164
165-169
170-174
175-179
180-184
185-189
190-194
195-199
200-204
205-209
210-214
215-219
Passing==> 220-224
225-229
230-234
235-239
240-244
245-249
250-254
255-259
260-264
265-269
270-274
275-279
280-284
285-289
290-294
295-300
0 1 2 3 4
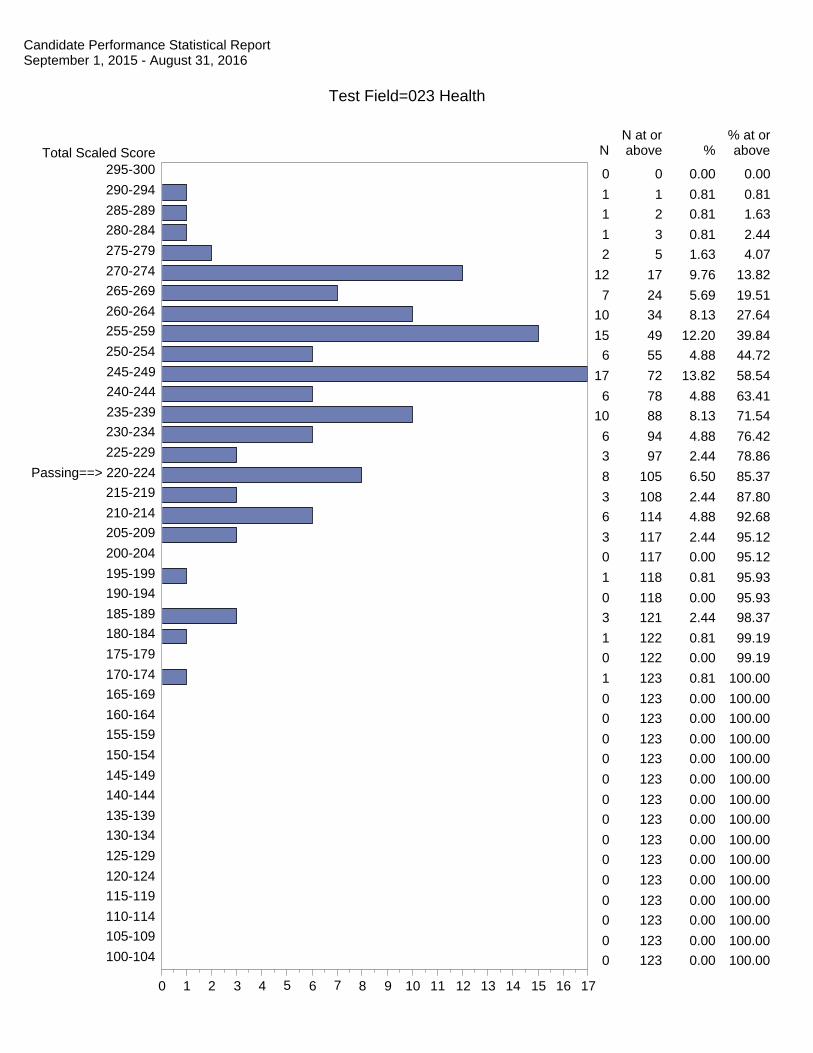
Candidate Performance Statistical ReportSeptember 1, 2015 - August 31, 2016
Test Field=023 Health
NN at orabove %
% at orabove
0 0 0.00 0.00
1 1 0.81 0.81
1 2 0.81 1.63
1 3 0.81 2.44
2 5 1.63 4.07
12 17 9.76 13.82
7 24 5.69 19.51
10 34 8.13 27.64
15 49 12.20 39.84
6 55 4.88 44.72
17 72 13.82 58.54
6 78 4.88 63.41
10 88 8.13 71.54
6 94 4.88 76.42
3 97 2.44 78.86
8 105 6.50 85.37
3 108 2.44 87.80
6 114 4.88 92.68
3 117 2.44 95.12
0 117 0.00 95.12
1 118 0.81 95.93
0 118 0.00 95.93
3 121 2.44 98.37
1 122 0.81 99.19
0 122 0.00 99.19
1 123 0.81 100.00
0 123 0.00 100.00
0 123 0.00 100.00
0 123 0.00 100.00
0 123 0.00 100.00
0 123 0.00 100.00
0 123 0.00 100.00
0 123 0.00 100.00
0 123 0.00 100.00
0 123 0.00 100.00
0 123 0.00 100.00
0 123 0.00 100.00
0 123 0.00 100.00
0 123 0.00 100.00
0 123 0.00 100.00
Total Scaled Score
100-104
105-109
110-114
115-119
120-124
125-129
130-134
135-139
140-144
145-149
150-154
155-159
160-164
165-169
170-174
175-179
180-184
185-189
190-194
195-199
200-204
205-209
210-214
215-219
Passing==> 220-224
225-229
230-234
235-239
240-244
245-249
250-254
255-259
260-264
265-269
270-274
275-279
280-284
285-289
290-294
295-300
0 1 2 3 4 5 6 7 8 9 10 11 12 13 14 15 16 17

Candidate Performance Statistical ReportSeptember 1, 2015 - August 31, 2016
Test Field=024 Integrated Science
NN at orabove %
% at orabove
0 0 0.00 0.00
0 0 0.00 0.00
2 2 1.08 1.08
5 7 2.69 3.76
13 20 6.99 10.75
15 35 8.06 18.82
9 44 4.84 23.66
16 60 8.60 32.26
11 71 5.91 38.17
15 86 8.06 46.24
15 101 8.06 54.30
15 116 8.06 62.37
7 123 3.76 66.13
10 133 5.38 71.51
8 141 4.30 75.81
11 152 5.91 81.72
13 165 6.99 88.71
11 176 5.91 94.62
3 179 1.61 96.24
4 183 2.15 98.39
2 185 1.08 99.46
0 185 0.00 99.46
1 186 0.54 100.00
0 186 0.00 100.00
0 186 0.00 100.00
0 186 0.00 100.00
0 186 0.00 100.00
0 186 0.00 100.00
0 186 0.00 100.00
0 186 0.00 100.00
0 186 0.00 100.00
0 186 0.00 100.00
0 186 0.00 100.00
0 186 0.00 100.00
0 186 0.00 100.00
0 186 0.00 100.00
0 186 0.00 100.00
0 186 0.00 100.00
0 186 0.00 100.00
0 186 0.00 100.00
Total Scaled Score
100-104
105-109
110-114
115-119
120-124
125-129
130-134
135-139
140-144
145-149
150-154
155-159
160-164
165-169
170-174
175-179
180-184
185-189
190-194
195-199
200-204
205-209
210-214
215-219
Passing==> 220-224
225-229
230-234
235-239
240-244
245-249
250-254
255-259
260-264
265-269
270-274
275-279
280-284
285-289
290-294
295-300
0 1 2 3 4 5 6 7 8 9 10 11 12 13 14 15 16

Candidate Performance Statistical ReportSeptember 1, 2015 - August 31, 2016
Test Field=025 Integrated Social Studies
NN at orabove %
% at orabove
0 0 0.00 0.00
1 1 0.18 0.18
1 2 0.18 0.35
5 7 0.88 1.23
11 18 1.94 3.17
14 32 2.47 5.64
19 51 3.35 8.99
28 79 4.94 13.93
39 118 6.88 20.81
28 146 4.94 25.75
35 181 6.17 31.92
34 215 6.00 37.92
34 249 6.00 43.92
33 282 5.82 49.74
49 331 8.64 58.38
33 364 5.82 64.20
49 413 8.64 72.84
46 459 8.11 80.95
38 497 6.70 87.65
21 518 3.70 91.36
22 540 3.88 95.24
15 555 2.65 97.88
7 562 1.23 99.12
4 566 0.71 99.82
0 566 0.00 99.82
1 567 0.18 100.00
0 567 0.00 100.00
0 567 0.00 100.00
0 567 0.00 100.00
0 567 0.00 100.00
0 567 0.00 100.00
0 567 0.00 100.00
0 567 0.00 100.00
0 567 0.00 100.00
0 567 0.00 100.00
0 567 0.00 100.00
0 567 0.00 100.00
0 567 0.00 100.00
0 567 0.00 100.00
0 567 0.00 100.00
Total Scaled Score
100-104
105-109
110-114
115-119
120-124
125-129
130-134
135-139
140-144
145-149
150-154
155-159
160-164
165-169
170-174
175-179
180-184
185-189
190-194
195-199
200-204
205-209
210-214
215-219
Passing==> 220-224
225-229
230-234
235-239
240-244
245-249
250-254
255-259
260-264
265-269
270-274
275-279
280-284
285-289
290-294
295-300
0 10 20 30 40 50

Candidate Performance Statistical ReportSeptember 1, 2015 - August 31, 2016
Test Field=027 Mathematics
NN at orabove %
% at orabove
2 2 0.37 0.37
4 6 0.73 1.10
9 15 1.65 2.74
12 27 2.19 4.94
18 45 3.29 8.23
13 58 2.38 10.60
11 69 2.01 12.61
21 90 3.84 16.45
23 113 4.20 20.66
11 124 2.01 22.67
19 143 3.47 26.14
28 171 5.12 31.26
32 203 5.85 37.11
36 239 6.58 43.69
40 279 7.31 51.01
32 311 5.85 56.86
47 358 8.59 65.45
34 392 6.22 71.66
38 430 6.95 78.61
28 458 5.12 83.73
22 480 4.02 87.75
13 493 2.38 90.13
18 511 3.29 93.42
8 519 1.46 94.88
8 527 1.46 96.34
5 532 0.91 97.26
7 539 1.28 98.54
4 543 0.73 99.27
1 544 0.18 99.45
2 546 0.37 99.82
0 546 0.00 99.82
1 547 0.18 100.00
0 547 0.00 100.00
0 547 0.00 100.00
0 547 0.00 100.00
0 547 0.00 100.00
0 547 0.00 100.00
0 547 0.00 100.00
0 547 0.00 100.00
0 547 0.00 100.00
Total Scaled Score
100-104
105-109
110-114
115-119
120-124
125-129
130-134
135-139
140-144
145-149
150-154
155-159
160-164
165-169
170-174
175-179
180-184
185-189
190-194
195-199
200-204
205-209
210-214
215-219
Passing==> 220-224
225-229
230-234
235-239
240-244
245-249
250-254
255-259
260-264
265-269
270-274
275-279
280-284
285-289
290-294
295-300
0 10 20 30 40 50

Candidate Performance Statistical ReportSeptember 1, 2015 - August 31, 2016
Test Field=028 Middle Grades English Language Arts
NN at orabove %
% at orabove
0 0 0.00 0.00
2 2 0.28 0.28
0 2 0.00 0.28
6 8 0.85 1.13
15 23 2.12 3.24
14 37 1.97 5.22
22 59 3.10 8.32
32 91 4.51 12.83
33 124 4.65 17.49
42 166 5.92 23.41
38 204 5.36 28.77
42 246 5.92 34.70
44 290 6.21 40.90
35 325 4.94 45.84
63 388 8.89 54.72
50 438 7.05 61.78
47 485 6.63 68.41
38 523 5.36 73.77
39 562 5.50 79.27
26 588 3.67 82.93
24 612 3.39 86.32
25 637 3.53 89.84
14 651 1.97 91.82
12 663 1.69 93.51
19 682 2.68 96.19
7 689 0.99 97.18
6 695 0.85 98.03
3 698 0.42 98.45
3 701 0.42 98.87
3 704 0.42 99.29
2 706 0.28 99.58
2 708 0.28 99.86
1 709 0.14 100.00
0 709 0.00 100.00
0 709 0.00 100.00
0 709 0.00 100.00
0 709 0.00 100.00
0 709 0.00 100.00
0 709 0.00 100.00
0 709 0.00 100.00
Total Scaled Score
100-104
105-109
110-114
115-119
120-124
125-129
130-134
135-139
140-144
145-149
150-154
155-159
160-164
165-169
170-174
175-179
180-184
185-189
190-194
195-199
200-204
205-209
210-214
215-219
Passing==> 220-224
225-229
230-234
235-239
240-244
245-249
250-254
255-259
260-264
265-269
270-274
275-279
280-284
285-289
290-294
295-300
0 10 20 30 40 50 60 70
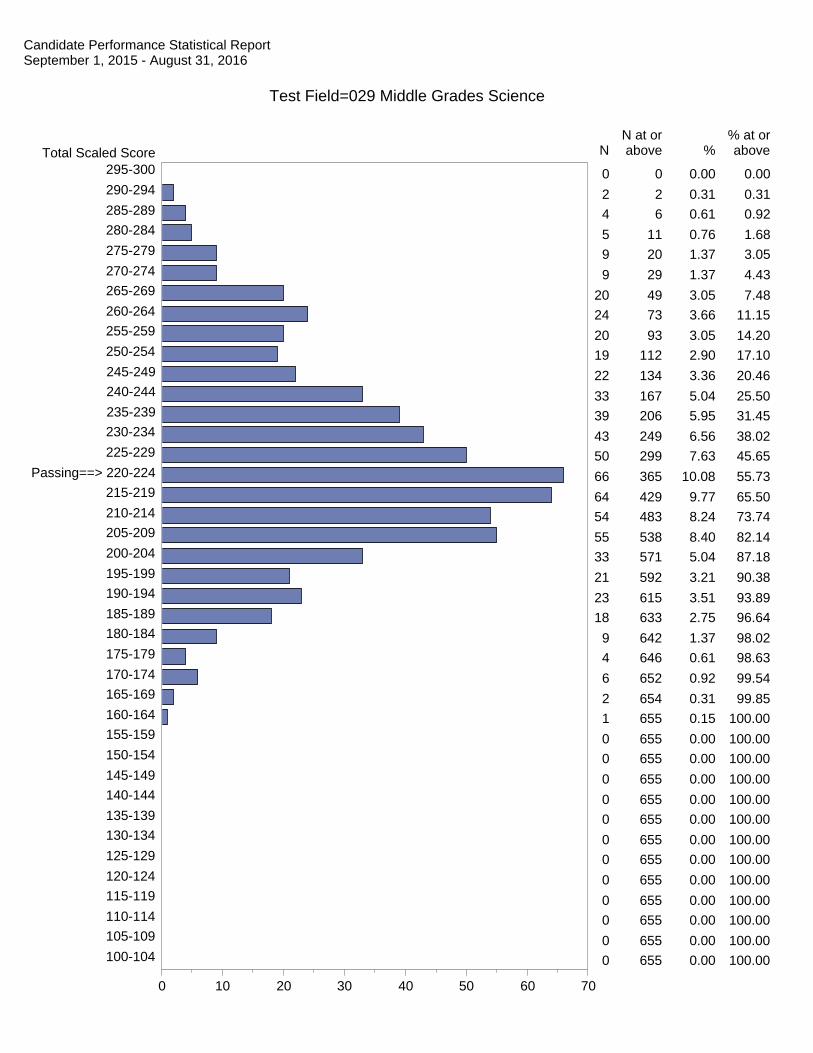
Candidate Performance Statistical ReportSeptember 1, 2015 - August 31, 2016
Test Field=029 Middle Grades Science
NN at orabove %
% at orabove
0 0 0.00 0.00
2 2 0.31 0.31
4 6 0.61 0.92
5 11 0.76 1.68
9 20 1.37 3.05
9 29 1.37 4.43
20 49 3.05 7.48
24 73 3.66 11.15
20 93 3.05 14.20
19 112 2.90 17.10
22 134 3.36 20.46
33 167 5.04 25.50
39 206 5.95 31.45
43 249 6.56 38.02
50 299 7.63 45.65
66 365 10.08 55.73
64 429 9.77 65.50
54 483 8.24 73.74
55 538 8.40 82.14
33 571 5.04 87.18
21 592 3.21 90.38
23 615 3.51 93.89
18 633 2.75 96.64
9 642 1.37 98.02
4 646 0.61 98.63
6 652 0.92 99.54
2 654 0.31 99.85
1 655 0.15 100.00
0 655 0.00 100.00
0 655 0.00 100.00
0 655 0.00 100.00
0 655 0.00 100.00
0 655 0.00 100.00
0 655 0.00 100.00
0 655 0.00 100.00
0 655 0.00 100.00
0 655 0.00 100.00
0 655 0.00 100.00
0 655 0.00 100.00
0 655 0.00 100.00
Total Scaled Score
100-104
105-109
110-114
115-119
120-124
125-129
130-134
135-139
140-144
145-149
150-154
155-159
160-164
165-169
170-174
175-179
180-184
185-189
190-194
195-199
200-204
205-209
210-214
215-219
Passing==> 220-224
225-229
230-234
235-239
240-244
245-249
250-254
255-259
260-264
265-269
270-274
275-279
280-284
285-289
290-294
295-300
0 10 20 30 40 50 60 70
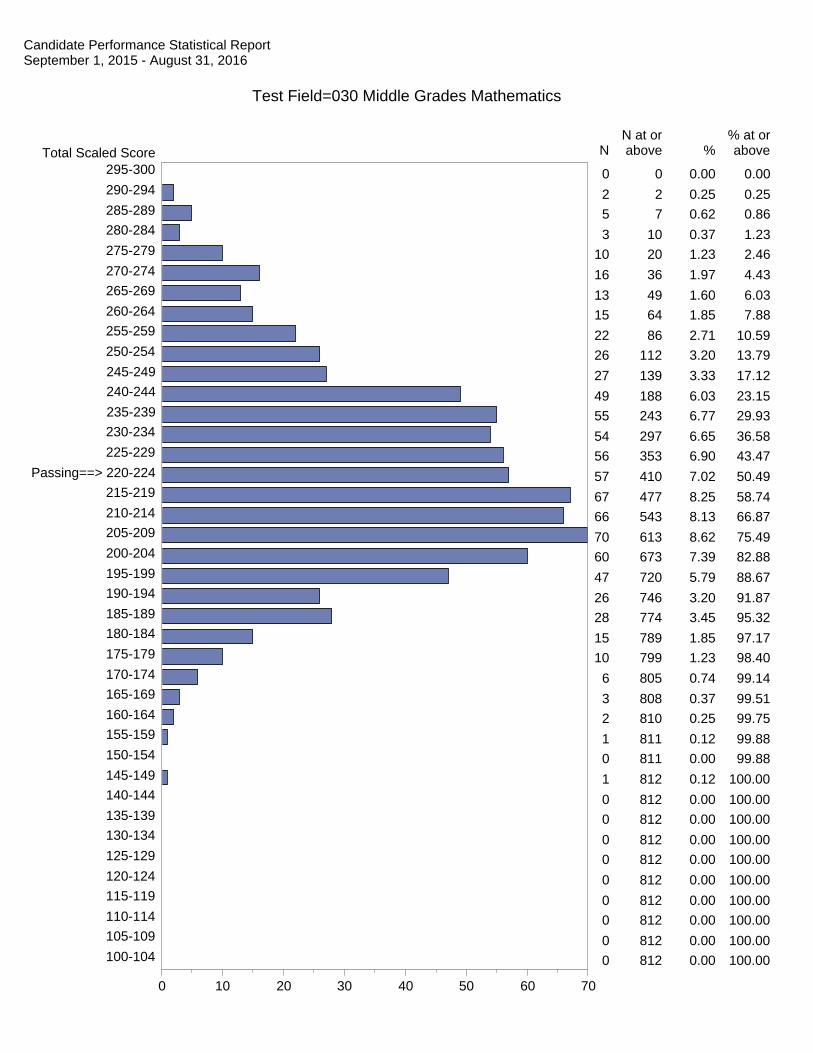
Candidate Performance Statistical ReportSeptember 1, 2015 - August 31, 2016
Test Field=030 Middle Grades Mathematics
NN at orabove %
% at orabove
0 0 0.00 0.00
2 2 0.25 0.25
5 7 0.62 0.86
3 10 0.37 1.23
10 20 1.23 2.46
16 36 1.97 4.43
13 49 1.60 6.03
15 64 1.85 7.88
22 86 2.71 10.59
26 112 3.20 13.79
27 139 3.33 17.12
49 188 6.03 23.15
55 243 6.77 29.93
54 297 6.65 36.58
56 353 6.90 43.47
57 410 7.02 50.49
67 477 8.25 58.74
66 543 8.13 66.87
70 613 8.62 75.49
60 673 7.39 82.88
47 720 5.79 88.67
26 746 3.20 91.87
28 774 3.45 95.32
15 789 1.85 97.17
10 799 1.23 98.40
6 805 0.74 99.14
3 808 0.37 99.51
2 810 0.25 99.75
1 811 0.12 99.88
0 811 0.00 99.88
1 812 0.12 100.00
0 812 0.00 100.00
0 812 0.00 100.00
0 812 0.00 100.00
0 812 0.00 100.00
0 812 0.00 100.00
0 812 0.00 100.00
0 812 0.00 100.00
0 812 0.00 100.00
0 812 0.00 100.00
Total Scaled Score
100-104
105-109
110-114
115-119
120-124
125-129
130-134
135-139
140-144
145-149
150-154
155-159
160-164
165-169
170-174
175-179
180-184
185-189
190-194
195-199
200-204
205-209
210-214
215-219
Passing==> 220-224
225-229
230-234
235-239
240-244
245-249
250-254
255-259
260-264
265-269
270-274
275-279
280-284
285-289
290-294
295-300
0 10 20 30 40 50 60 70

Candidate Performance Statistical ReportSeptember 1, 2015 - August 31, 2016
Test Field=031 Middle Grades Social Studies
NN at orabove %
% at orabove
0 0 0.00 0.00
0 0 0.00 0.00
2 2 0.27 0.27
5 7 0.68 0.95
3 10 0.41 1.36
7 17 0.95 2.30
8 25 1.08 3.39
11 36 1.49 4.88
16 52 2.17 7.05
27 79 3.66 10.70
33 112 4.47 15.18
23 135 3.12 18.29
27 162 3.66 21.95
55 217 7.45 29.40
63 280 8.54 37.94
69 349 9.35 47.29
68 417 9.21 56.50
70 487 9.49 65.99
64 551 8.67 74.66
56 607 7.59 82.25
28 635 3.79 86.04
38 673 5.15 91.19
28 701 3.79 94.99
16 717 2.17 97.15
9 726 1.22 98.37
7 733 0.95 99.32
2 735 0.27 99.59
2 737 0.27 99.86
1 738 0.14 100.00
0 738 0.00 100.00
0 738 0.00 100.00
0 738 0.00 100.00
0 738 0.00 100.00
0 738 0.00 100.00
0 738 0.00 100.00
0 738 0.00 100.00
0 738 0.00 100.00
0 738 0.00 100.00
0 738 0.00 100.00
0 738 0.00 100.00
Total Scaled Score
100-104
105-109
110-114
115-119
120-124
125-129
130-134
135-139
140-144
145-149
150-154
155-159
160-164
165-169
170-174
175-179
180-184
185-189
190-194
195-199
200-204
205-209
210-214
215-219
Passing==> 220-224
225-229
230-234
235-239
240-244
245-249
250-254
255-259
260-264
265-269
270-274
275-279
280-284
285-289
290-294
295-300
0 10 20 30 40 50 60 70

Candidate Performance Statistical ReportSeptember 1, 2015 - August 31, 2016
Test Field=032 Music
NN at orabove %
% at orabove
1 1 0.28 0.28
0 1 0.00 0.28
0 1 0.00 0.28
6 7 1.65 1.93
2 9 0.55 2.48
19 28 5.23 7.71
25 53 6.89 14.60
31 84 8.54 23.14
13 97 3.58 26.72
30 127 8.26 34.99
27 154 7.44 42.42
34 188 9.37 51.79
15 203 4.13 55.92
23 226 6.34 62.26
25 251 6.89 69.15
27 278 7.44 76.58
12 290 3.31 79.89
16 306 4.41 84.30
18 324 4.96 89.26
12 336 3.31 92.56
6 342 1.65 94.21
7 349 1.93 96.14
4 353 1.10 97.25
0 353 0.00 97.25
2 355 0.55 97.80
2 357 0.55 98.35
2 359 0.55 98.90
1 360 0.28 99.17
0 360 0.00 99.17
1 361 0.28 99.45
0 361 0.00 99.45
1 362 0.28 99.72
0 362 0.00 99.72
1 363 0.28 100.00
0 363 0.00 100.00
0 363 0.00 100.00
0 363 0.00 100.00
0 363 0.00 100.00
0 363 0.00 100.00
0 363 0.00 100.00
Total Scaled Score
100-104
105-109
110-114
115-119
120-124
125-129
130-134
135-139
140-144
145-149
150-154
155-159
160-164
165-169
170-174
175-179
180-184
185-189
190-194
195-199
200-204
205-209
210-214
215-219
Passing==> 220-224
225-229
230-234
235-239
240-244
245-249
250-254
255-259
260-264
265-269
270-274
275-279
280-284
285-289
290-294
295-300
0 10 20 30 40

Candidate Performance Statistical ReportSeptember 1, 2015 - August 31, 2016
Test Field=034 Physical Education
NN at orabove %
% at orabove
0 0 0.00 0.00
0 0 0.00 0.00
0 0 0.00 0.00
1 1 0.48 0.48
2 3 0.96 1.44
4 7 1.91 3.35
4 11 1.91 5.26
10 21 4.78 10.05
8 29 3.83 13.88
11 40 5.26 19.14
9 49 4.31 23.44
10 59 4.78 28.23
25 84 11.96 40.19
22 106 10.53 50.72
17 123 8.13 58.85
16 139 7.66 66.51
15 154 7.18 73.68
14 168 6.70 80.38
9 177 4.31 84.69
10 187 4.78 89.47
5 192 2.39 91.87
2 194 0.96 92.82
2 196 0.96 93.78
3 199 1.44 95.22
3 202 1.44 96.65
1 203 0.48 97.13
0 203 0.00 97.13
1 204 0.48 97.61
1 205 0.48 98.09
2 207 0.96 99.04
0 207 0.00 99.04
1 208 0.48 99.52
1 209 0.48 100.00
0 209 0.00 100.00
0 209 0.00 100.00
0 209 0.00 100.00
0 209 0.00 100.00
0 209 0.00 100.00
0 209 0.00 100.00
0 209 0.00 100.00
Total Scaled Score
100-104
105-109
110-114
115-119
120-124
125-129
130-134
135-139
140-144
145-149
150-154
155-159
160-164
165-169
170-174
175-179
180-184
185-189
190-194
195-199
200-204
205-209
210-214
215-219
Passing==> 220-224
225-229
230-234
235-239
240-244
245-249
250-254
255-259
260-264
265-269
270-274
275-279
280-284
285-289
290-294
295-300
0 10 20 30

Candidate Performance Statistical ReportSeptember 1, 2015 - August 31, 2016
Test Field=035 Physics
NN at orabove %
% at orabove
1 1 4.17 4.17
1 2 4.17 8.33
2 4 8.33 16.67
1 5 4.17 20.83
2 7 8.33 29.17
2 9 8.33 37.50
3 12 12.50 50.00
2 14 8.33 58.33
0 14 0.00 58.33
0 14 0.00 58.33
1 15 4.17 62.50
0 15 0.00 62.50
1 16 4.17 66.67
2 18 8.33 75.00
1 19 4.17 79.17
2 21 8.33 87.50
0 21 0.00 87.50
2 23 8.33 95.83
1 24 4.17 100.00
0 24 0.00 100.00
0 24 0.00 100.00
0 24 0.00 100.00
0 24 0.00 100.00
0 24 0.00 100.00
0 24 0.00 100.00
0 24 0.00 100.00
0 24 0.00 100.00
0 24 0.00 100.00
0 24 0.00 100.00
0 24 0.00 100.00
0 24 0.00 100.00
0 24 0.00 100.00
0 24 0.00 100.00
0 24 0.00 100.00
0 24 0.00 100.00
0 24 0.00 100.00
0 24 0.00 100.00
0 24 0.00 100.00
0 24 0.00 100.00
0 24 0.00 100.00
Total Scaled Score
100-104
105-109
110-114
115-119
120-124
125-129
130-134
135-139
140-144
145-149
150-154
155-159
160-164
165-169
170-174
175-179
180-184
185-189
190-194
195-199
200-204
205-209
210-214
215-219
Passing==> 220-224
225-229
230-234
235-239
240-244
245-249
250-254
255-259
260-264
265-269
270-274
275-279
280-284
285-289
290-294
295-300
0 1 2 3

Candidate Performance Statistical ReportSeptember 1, 2015 - August 31, 2016
Test Field=036 Prekindergarten Subtest I
NN at orabove %
% at orabove
0 0 0.00 0.00
0 0 0.00 0.00
0 0 0.00 0.00
1 1 1.82 1.82
2 3 3.64 5.45
1 4 1.82 7.27
3 7 5.45 12.73
1 8 1.82 14.55
0 8 0.00 14.55
4 12 7.27 21.82
8 20 14.55 36.36
3 23 5.45 41.82
4 27 7.27 49.09
10 37 18.18 67.27
4 41 7.27 74.55
5 46 9.09 83.64
4 50 7.27 90.91
3 53 5.45 96.36
1 54 1.82 98.18
1 55 1.82 100.00
0 55 0.00 100.00
0 55 0.00 100.00
0 55 0.00 100.00
0 55 0.00 100.00
0 55 0.00 100.00
0 55 0.00 100.00
0 55 0.00 100.00
0 55 0.00 100.00
0 55 0.00 100.00
0 55 0.00 100.00
0 55 0.00 100.00
0 55 0.00 100.00
0 55 0.00 100.00
0 55 0.00 100.00
0 55 0.00 100.00
0 55 0.00 100.00
0 55 0.00 100.00
0 55 0.00 100.00
0 55 0.00 100.00
0 55 0.00 100.00
Total Scaled Score
100-104
105-109
110-114
115-119
120-124
125-129
130-134
135-139
140-144
145-149
150-154
155-159
160-164
165-169
170-174
175-179
180-184
185-189
190-194
195-199
200-204
205-209
210-214
215-219
Passing==> 220-224
225-229
230-234
235-239
240-244
245-249
250-254
255-259
260-264
265-269
270-274
275-279
280-284
285-289
290-294
295-300
0 1 2 3 4 5 6 7 8 9 10

Candidate Performance Statistical ReportSeptember 1, 2015 - August 31, 2016
Test Field=037 Prekindergarten Subtest II
NN at orabove %
% at orabove
0 0 0.00 0.00
0 0 0.00 0.00
0 0 0.00 0.00
0 0 0.00 0.00
0 0 0.00 0.00
1 1 1.79 1.79
1 2 1.79 3.57
4 6 7.14 10.71
4 10 7.14 17.86
6 16 10.71 28.57
7 23 12.50 41.07
3 26 5.36 46.43
3 29 5.36 51.79
9 38 16.07 67.86
1 39 1.79 69.64
7 46 12.50 82.14
2 48 3.57 85.71
3 51 5.36 91.07
3 54 5.36 96.43
1 55 1.79 98.21
0 55 0.00 98.21
0 55 0.00 98.21
1 56 1.79 100.00
0 56 0.00 100.00
0 56 0.00 100.00
0 56 0.00 100.00
0 56 0.00 100.00
0 56 0.00 100.00
0 56 0.00 100.00
0 56 0.00 100.00
0 56 0.00 100.00
0 56 0.00 100.00
0 56 0.00 100.00
0 56 0.00 100.00
0 56 0.00 100.00
0 56 0.00 100.00
0 56 0.00 100.00
0 56 0.00 100.00
0 56 0.00 100.00
0 56 0.00 100.00
Total Scaled Score
100-104
105-109
110-114
115-119
120-124
125-129
130-134
135-139
140-144
145-149
150-154
155-159
160-164
165-169
170-174
175-179
180-184
185-189
190-194
195-199
200-204
205-209
210-214
215-219
Passing==> 220-224
225-229
230-234
235-239
240-244
245-249
250-254
255-259
260-264
265-269
270-274
275-279
280-284
285-289
290-294
295-300
0 1 2 3 4 5 6 7 8 9

Candidate Performance Statistical ReportSeptember 1, 2015 - August 31, 2016
Test Field=038 Reading Subtest I
NN at orabove %
% at orabove
1 1 0.09 0.09
8 9 0.70 0.79
8 17 0.70 1.49
27 44 2.37 3.86
42 86 3.68 7.54
59 145 5.17 12.71
74 219 6.49 19.19
72 291 6.31 25.50
82 373 7.19 32.69
105 478 9.20 41.89
75 553 6.57 48.47
83 636 7.27 55.74
106 742 9.29 65.03
72 814 6.31 71.34
69 883 6.05 77.39
66 949 5.78 83.17
50 999 4.38 87.55
33 1032 2.89 90.45
37 1069 3.24 93.69
19 1088 1.67 95.35
21 1109 1.84 97.20
16 1125 1.40 98.60
10 1135 0.88 99.47
3 1138 0.26 99.74
3 1141 0.26 100.00
0 1141 0.00 100.00
0 1141 0.00 100.00
0 1141 0.00 100.00
0 1141 0.00 100.00
0 1141 0.00 100.00
0 1141 0.00 100.00
0 1141 0.00 100.00
0 1141 0.00 100.00
0 1141 0.00 100.00
0 1141 0.00 100.00
0 1141 0.00 100.00
0 1141 0.00 100.00
0 1141 0.00 100.00
0 1141 0.00 100.00
0 1141 0.00 100.00
Total Scaled Score
100-104
105-109
110-114
115-119
120-124
125-129
130-134
135-139
140-144
145-149
150-154
155-159
160-164
165-169
170-174
175-179
180-184
185-189
190-194
195-199
200-204
205-209
210-214
215-219
Passing==> 220-224
225-229
230-234
235-239
240-244
245-249
250-254
255-259
260-264
265-269
270-274
275-279
280-284
285-289
290-294
295-300
0 10 20 30 40 50 60 70 80 90 100 110

Candidate Performance Statistical ReportSeptember 1, 2015 - August 31, 2016
Test Field=039 Reading Subtest II
NN at orabove %
% at orabove
1 1 0.09 0.09
2 3 0.18 0.27
14 17 1.28 1.56
23 40 2.10 3.66
51 91 4.67 8.33
43 134 3.93 12.26
64 198 5.86 18.12
100 298 9.15 27.26
75 373 6.86 34.13
129 502 11.80 45.93
73 575 6.68 52.61
119 694 10.89 63.49
82 776 7.50 71.00
57 833 5.22 76.21
63 896 5.76 81.98
46 942 4.21 86.18
42 984 3.84 90.03
42 1026 3.84 93.87
25 1051 2.29 96.16
15 1066 1.37 97.53
10 1076 0.91 98.44
6 1082 0.55 98.99
6 1088 0.55 99.54
1 1089 0.09 99.63
3 1092 0.27 99.91
1 1093 0.09 100.00
0 1093 0.00 100.00
0 1093 0.00 100.00
0 1093 0.00 100.00
0 1093 0.00 100.00
0 1093 0.00 100.00
0 1093 0.00 100.00
0 1093 0.00 100.00
0 1093 0.00 100.00
0 1093 0.00 100.00
0 1093 0.00 100.00
0 1093 0.00 100.00
0 1093 0.00 100.00
0 1093 0.00 100.00
0 1093 0.00 100.00
Total Scaled Score
100-104
105-109
110-114
115-119
120-124
125-129
130-134
135-139
140-144
145-149
150-154
155-159
160-164
165-169
170-174
175-179
180-184
185-189
190-194
195-199
200-204
205-209
210-214
215-219
Passing==> 220-224
225-229
230-234
235-239
240-244
245-249
250-254
255-259
260-264
265-269
270-274
275-279
280-284
285-289
290-294
295-300
0 10 20 30 40 50 60 70 80 90 100 110 120 130

Candidate Performance Statistical ReportSeptember 1, 2015 - August 31, 2016
Test Field=040 School Counselor
NN at orabove %
% at orabove
0 0 0.00 0.00
0 0 0.00 0.00
0 0 0.00 0.00
0 0 0.00 0.00
4 4 1.43 1.43
5 9 1.79 3.23
9 18 3.23 6.45
11 29 3.94 10.39
28 57 10.04 20.43
18 75 6.45 26.88
17 92 6.09 32.97
24 116 8.60 41.58
32 148 11.47 53.05
17 165 6.09 59.14
20 185 7.17 66.31
21 206 7.53 73.84
12 218 4.30 78.14
6 224 2.15 80.29
17 241 6.09 86.38
12 253 4.30 90.68
9 262 3.23 93.91
3 265 1.08 94.98
3 268 1.08 96.06
3 271 1.08 97.13
0 271 0.00 97.13
1 272 0.36 97.49
2 274 0.72 98.21
0 274 0.00 98.21
2 276 0.72 98.92
2 278 0.72 99.64
1 279 0.36 100.00
0 279 0.00 100.00
0 279 0.00 100.00
0 279 0.00 100.00
0 279 0.00 100.00
0 279 0.00 100.00
0 279 0.00 100.00
0 279 0.00 100.00
0 279 0.00 100.00
0 279 0.00 100.00
Total Scaled Score
100-104
105-109
110-114
115-119
120-124
125-129
130-134
135-139
140-144
145-149
150-154
155-159
160-164
165-169
170-174
175-179
180-184
185-189
190-194
195-199
200-204
205-209
210-214
215-219
Passing==> 220-224
225-229
230-234
235-239
240-244
245-249
250-254
255-259
260-264
265-269
270-274
275-279
280-284
285-289
290-294
295-300
0 10 20 30 40

Candidate Performance Statistical ReportSeptember 1, 2015 - August 31, 2016
Test Field=041 School Library Media Specialist
NN at orabove %
% at orabove
0 0 0.00 0.00
0 0 0.00 0.00
1 1 2.63 2.63
2 3 5.26 7.89
1 4 2.63 10.53
0 4 0.00 10.53
0 4 0.00 10.53
3 7 7.89 18.42
3 10 7.89 26.32
1 11 2.63 28.95
3 14 7.89 36.84
1 15 2.63 39.47
3 18 7.89 47.37
2 20 5.26 52.63
1 21 2.63 55.26
4 25 10.53 65.79
0 25 0.00 65.79
2 27 5.26 71.05
2 29 5.26 76.32
1 30 2.63 78.95
1 31 2.63 81.58
0 31 0.00 81.58
0 31 0.00 81.58
1 32 2.63 84.21
1 33 2.63 86.84
1 34 2.63 89.47
1 35 2.63 92.11
0 35 0.00 92.11
1 36 2.63 94.74
1 37 2.63 97.37
0 37 0.00 97.37
0 37 0.00 97.37
1 38 2.63 100.00
0 38 0.00 100.00
0 38 0.00 100.00
0 38 0.00 100.00
0 38 0.00 100.00
0 38 0.00 100.00
0 38 0.00 100.00
0 38 0.00 100.00
Total Scaled Score
100-104
105-109
110-114
115-119
120-124
125-129
130-134
135-139
140-144
145-149
150-154
155-159
160-164
165-169
170-174
175-179
180-184
185-189
190-194
195-199
200-204
205-209
210-214
215-219
Passing==> 220-224
225-229
230-234
235-239
240-244
245-249
250-254
255-259
260-264
265-269
270-274
275-279
280-284
285-289
290-294
295-300
0 1 2 3 4

Candidate Performance Statistical ReportSeptember 1, 2015 - August 31, 2016
Test Field=043 Special Education
NN at orabove %
% at orabove
0 0 0.00 0.00
5 5 0.26 0.26
9 14 0.47 0.73
26 40 1.36 2.10
48 88 2.52 4.62
61 149 3.20 7.82
73 222 3.83 11.65
101 323 5.30 16.95
107 430 5.61 22.56
115 545 6.03 28.59
119 664 6.24 34.84
135 799 7.08 41.92
129 928 6.77 48.69
110 1038 5.77 54.46
139 1177 7.29 61.75
144 1321 7.56 69.31
91 1412 4.77 74.08
85 1497 4.46 78.54
74 1571 3.88 82.42
84 1655 4.41 86.83
51 1706 2.68 89.51
51 1757 2.68 92.18
35 1792 1.84 94.02
28 1820 1.47 95.49
21 1841 1.10 96.59
20 1861 1.05 97.64
12 1873 0.63 98.27
12 1885 0.63 98.90
4 1889 0.21 99.11
4 1893 0.21 99.32
7 1900 0.37 99.69
1 1901 0.05 99.74
0 1901 0.00 99.74
0 1901 0.00 99.74
2 1903 0.10 99.84
3 1906 0.16 100.00
0 1906 0.00 100.00
0 1906 0.00 100.00
0 1906 0.00 100.00
0 1906 0.00 100.00
Total Scaled Score
100-104
105-109
110-114
115-119
120-124
125-129
130-134
135-139
140-144
145-149
150-154
155-159
160-164
165-169
170-174
175-179
180-184
185-189
190-194
195-199
200-204
205-209
210-214
215-219
Passing==> 220-224
225-229
230-234
235-239
240-244
245-249
250-254
255-259
260-264
265-269
270-274
275-279
280-284
285-289
290-294
295-300
0 20 40 60 80 100 120 140 160

Candidate Performance Statistical ReportSeptember 1, 2015 - August 31, 2016
Test Field=048 Theater
NN at orabove %
% at orabove
0 0 0.00 0.00
0 0 0.00 0.00
0 0 0.00 0.00
0 0 0.00 0.00
1 1 8.33 8.33
0 1 0.00 8.33
0 1 0.00 8.33
1 2 8.33 16.67
0 2 0.00 16.67
3 5 25.00 41.67
0 5 0.00 41.67
1 6 8.33 50.00
1 7 8.33 58.33
0 7 0.00 58.33
0 7 0.00 58.33
0 7 0.00 58.33
2 9 16.67 75.00
2 11 16.67 91.67
0 11 0.00 91.67
1 12 8.33 100.00
0 12 0.00 100.00
0 12 0.00 100.00
0 12 0.00 100.00
0 12 0.00 100.00
0 12 0.00 100.00
0 12 0.00 100.00
0 12 0.00 100.00
0 12 0.00 100.00
0 12 0.00 100.00
0 12 0.00 100.00
0 12 0.00 100.00
0 12 0.00 100.00
0 12 0.00 100.00
0 12 0.00 100.00
0 12 0.00 100.00
0 12 0.00 100.00
0 12 0.00 100.00
0 12 0.00 100.00
0 12 0.00 100.00
0 12 0.00 100.00
Total Scaled Score
100-104
105-109
110-114
115-119
120-124
125-129
130-134
135-139
140-144
145-149
150-154
155-159
160-164
165-169
170-174
175-179
180-184
185-189
190-194
195-199
200-204
205-209
210-214
215-219
Passing==> 220-224
225-229
230-234
235-239
240-244
245-249
250-254
255-259
260-264
265-269
270-274
275-279
280-284
285-289
290-294
295-300
0 1 2 3

Developed and Produced by
Evaluation Systems
P.O. Box 226
Amherst, Massachusetts 01004