Tesmec Group Presentation
35
European Midcap event Tesmec Group Presentation
Transcript of Tesmec Group Presentation

European Midcap event
Tesmec Group Presentation

2.
3.
4.
1. Strategic overview
Outlook
2021.Q1 Results
ANNEX
Index
0. Tesmec Group at a glance

Tesmec Group at a glance0.

4
To be a technological partner in a changing world
Integrated Solutions Provider for Energy and Data transport
To operate in the market of infrastructure for the transport of energy, data and material (oil and derivatives, gas, water).
To supply added-value integrated solutions for our customers
▪ Innovation
▪ Integration
▪ Internationalization
Vision Mission Value proposition Strategy
ENERGY AND DATA
TRANSPORT
Consolidate the position as a solution provider in the reference markets driven by the trends of energy transition, digitalization, and sustainability.
PURPOSE

2021 | Corporate Presentation 5
Tesmec Group at a glance
+135choose Tesmec
COUNTRIES
75%EXPORT
of experience
YEARS
70PEOPLE
+900MANUFACTURING
PLANTS
10
▪Solutions for power lines construction & maintenance
▪Advanced methodologies for automating jobsite
▪Zero emissions machines
ENERGY - STRINGING
▪Telecommunications solutions for HV Grids
▪Grid Management: protection and metering solutions
▪Advanced sensors for fault passage indication, protection and monitoring
ENERGY - AUTOMATION
▪Catenary lines construction & maintenance
▪Diagnostic vehicles and systems
▪ Integrated platform for safe infrastructure
▪Telecom networks, FTTH & long distance, power cable installation
▪Oil & Gas, Water pipelines
▪Bulk excavation, Quarries & Surfaces mining
RAILWAY
TRENCHER
5

▪ SOLUTIONS FOR POWER LINES CONSTRUCTION & MAINTENANCE
▪ ADVANCED METHODOLOGIES FOR AUTOMATING JOBSITE
▪ ZERO EMISSIONS MACHINES
Energy Stringing
6
T&D POWER LINES

▪ PROTECTION & MONITORING
▪ REMOTE CONTROL
▪ SERVICE TELECOMMUNICATIONS
▪ SMART METERING
Energy Automation - Fields of application
7
SMART GRIDS

▪ TELECOM NETWORKS, FTTH & LONG DISTANCE
▪ POWER CABLE INSTALLATION & RENEWABLES ENERGIES
▪ BULK EXCAVATION, QUARRIES & SURFACES MINING
▪ OIL & GAS, WATER PIPELINES
Trenchers - Fields of application
8
UNDERGROUND INFRASTRUCTURES

▪ CATENARY INSTALLATION
▪ MAINTENANCE OF RAILWAY LINES
▪ DIAGNOSTIC OF RAILWAY INFRASTRUCTURES
▪ SMART PLATFORMS FOR BIG DATA MANAGEMENT
Railway - Fields of application
9
RAILWAY LINES

10
History of Innovation
ENERGY TRANSITION
DIGITALIZATION
SUSTAINABILITY
Edison patent for
the new tension
stringing system
1960
PIONEER in
STRINGING
solutions
Entry in the
Italian
Stock
Exchange
(STAR
segment)
2010
From
FAMILY
Company
to PUBLIC
Company
2012Leasing of
AMC2 S.r.l
(Monopoli -
Italy)
Expansion
strategy in
the
RAILWAY
business
Establishment
of Tesmec USA
Inc. in Texas,
USA
1984
TRENCHER
product line
development
Acquisition of
the French
Group Marais
2015
BUSINESS
MODEL
INTEGRATION
solutions &
service
provider
Tesmec
Automation as
a single
Company
2017
Investments &
acquisitions to
complete the
portfolio for
SMART GRIDS
4Service, a
Company
dedicated to
the rental
business
Change in
share Capital
2020
Strengthening
the Service and
Rental Business
2021
Establishment of
“CRF -Officina
Meccanica di
Precisione”
1951
Opening of the
new Tesmec Rail
s.r.l. production
site (Monopoli –
Italy)
2018
Investments in
R&D and
DIAGNOSTICS

Strategic overview1.

2010 - 2019
Corporate strategy
2020-2023
THE NEXT DEVELOPMENTS
12
New Business Model
▪ INTEGRATED SYSTEMS
▪ DIGITAL SOLUTIONS
▪ WIDE RANGE OF SERVICES
to meet customers' needs
to increase recurring revenue streams
Equipment manufacturer
Investment and
diversification phase

13
Innovation-driven strategy
RIDING THE WAVE OF SUSTAINABLE & DIGITAL TECHNOLOGIES
POSITIVE IMPACT OF STIMULUS PACKAGES ON TESMEC BUSINESS
ENERGY RAILINFRASTRUCTURES
Strategic drivers
▪ DIGITALIZATION: Digital transformation leading to new solution portfolio and business models
▪ SUSTAINABILITY: Focus on green approach, electric/hybrid power units, renewables interconnection projects, zero-emission plans
▪ ENERGY TRANSITION: Global transformation of the energy sector (distributed generation, smart grids, renewables and more)

DIG
ITA
LIZ
AT
ION
Sustainability as key strategic driver
MARKET
DRIVERS PRIORITY TOPICSSDGs
PEOPLE
PLANET
PROFIT
SU
STA
INA
BIL
ITY
EN
ER
GY
TR
AN
SIT
ION
Green & digital
solutions
Climate Change
and environmental protection
Development of local
communities and areas
Dignity and future
for the new generations
Enhancement and protection
of employees
Solution provider & system
integrator
STRATEGIC PILLARS
Business model
diversification
Effective and efficient
organization
Consolidation
of investment streams
2020-2023 BUSINESS PLAN & SUSTAINABILITY PLAN INTEGRATION
14
In progress the preparation of a Sustainability plan with the identification of commitments and goals, integrated in the 2020-2023 Business Plan

Outlook2.

16
Outlook
MACROECONOMIC SCENARIO
▪ Positive impact of recovery plans on reference markets of the Group:
▪ ITALY: strong push to business thanks to incentives, especially in Southern Italy▪ EUROPE: important stimulus packages to boost the recovery▪ USA: focus on Clean Energy and big high speed railway projects
▪ Momentum of economic recovery, stimulus to the vitality of market, booming of specific geographic areas
▪ Inflation speed up▪ Increase of raw materials & commodities costs and freight & logistic costs▪ Shortage of materials & longer delivery time
▪ Stronger foreign currencies (USD..) and stable interest rates
BUSINESS -BACK TO NORMAL
▪ Homogeneous and regular overall business growth
▪ Growing trend in Energy business confirmed
▪ Consolidation of Trencher business results
▪ Increasing performances of Railway business

17
Outlook 2021
Source: IEA (International Energy Agency), WEO (World Economic Outlook), 2019
SMART GRID market
CAGR 11.8% (2020-2023)
SURFACE MINING market
CAGR 1.5% (2020-2023)
TELECOM market
CAGR 5% (2020-2025)
RAILWAY market
CAGR 2.2% (2019-2025)
▪ Strategic positioning in key and growing sectors: telecommunication, smart grids,
renewable energy, mining, railway
▪ Expected positive outlook driven by "Green Deal” on key markets such as US,
Western Europe & Australia
KEY POINTS

18
Outlook 2021
Strong growth perspective based on high visibility of backlog for Energy and Rail activities
Focus on recurring revenues through different rental options, specialistic advisory and after sales services
Profitability improvement coming from product mix and economies of scale
Portfolio rationalization & industrial planning for stock reduction
1-3Q: possible increase of working capital to face the supply chain issue of
the post-COVID situation. 4Q: normalization expected
Higher efficiency thanks to the go-live of the new ERP system
MAIN ACTIONS
to supportthe growth

TURNOVER
EBITDA
NFP
~ 220 M€ 275 290 M€
>16% 53 58 M€
improvement
2021 2023
>> Better mix of products & systems,
premium price policy, impact of new high margin
activities such as rental and hi-tech solutions
>> Rationalization and standardization of the
products portfolio
>> Broadly stable fixed costs
>> Significant performance of the Energy
Automation segment; Stringing segment back to
historical performances
>> Focus on recurring revenues (rental &
services)
>> Growth in each business line
>> Net working capital improvement and
efficiency actions on inventory
>> Optimization of credit management policies
>> 2020-2023: Cumulated Capex in 4 years 60M€,
progressive reduction to 5% of the
CAPEX/Revenues
2019pf
199.6
M€
30,0
M€
130,0
M€
~
~cagr19-23:
8.5%~10.0%
cagr19-23: 17.0%~18.0%
2020-2023 Business Plan guidelines - Confirmed
2020pf
172.8
M€
22,9
M€
104,4
M€improvement
19

2021.Q1 Results3.

2021.Q1 Closing
21
(1) Revenues: back to the sales & growth by the
relaunch of activities in the strategic sectors in
which the Group operates compared to 2020.Q1
impacted by the spread of the Covid-19 pandemic
(2) EBITDA: positive impact by the TRS and Energy
performance, in particularly the Energy Automation
Segment
(3) EBITDA: improve thanks to
rental/project/services activities with high
margin and costs saving activities
(4) Impacted by 4service’s fleet depreciation
(5) The exchange differences are positive (USD &
related currencies), compared to the 2020.Q1 and
the closing of 2020.
(6) NFP increase due to the change in NWC,
necessary to support the growth expected in the
second half of the year and to face tensions in the
supplying and shipment activities
REVENUES (1) 49,0 31,8 53,9%
EBITDA (2) (3) 7,1 2,5 187,3%
% on Revenues 14,5% 7,8%
EBIT (4) 1,4 (1,7)
% on Revenues 2,9% -5,4%
Differences in Exchange (5) 1,9 (1,4)
% on Revenues 3,8% -4,4%
PROFIT (LOSS) BEFORE TAX 2,0 (4,1)
% on Revenues 4,0% -12,9%
NET INCOME/(LOSS) 1,1 (3,0)
% on Revenues 2,2% -9,4%
NFP ante IFRS 16 95,5 82,3 -15,9%
NFP post IFRS 16 117,7 104,4 -12,7%
GROUP (€ mln) 2020.Q1Delta
vs.20
GROUP (€ mln) 2020Delta
vs.20
2021.Q1
2021.Q1

2021.Q1 Closing – Business Breakdown
22
> Rebound compared to 2020.Q1 (Covid driven) and lead by
the Energy industry trend
> EBITDA: impacted by Energy Automation performance
and the first improvement of the Stringing segment after years
of product range transition
> The confirmed order backlog was Euro 87,0 million of
which Euro 64,0 million from the Energy Automation
> Back to the sales but slowdown of the USA market, due to
political transition of the presidential election
> Better % EBITDA thanks to the integration of the rental and
services activities
> The confirmed order backlog was Euro 84,9 million
> Less impacted by the lock down 2020.Q1. The revenues are
related to the medium-long term contracts
> EBITDA: substantially in line with 2020.Q1
> The confirmed order backlog was Euro 114,4 million
10,8
1,7
7,4
0,7
Revenues EBITDA
Energy
2021.Q1 2020.Q1
7,2
1,0
7,6
1,1
Revenues EBITDA
Rail
2021.Q1 2020.Q1
31,0
4,4
16,9
0,7
Revenues EBITDA
Trencher
2021.Q1 2020.Q1
+45,9%
+145,7%
+83,7%
+525,0%
-5,2%
-6,0%
+15,8% +9,3%
% on revenues
+14,1% +4,2%
% on revenues
+14,1% +14,2%
% on revenues
(€ mln)

BACKLOG
Trencher
Energy
Railway
Total
BACKLOG
Sales 2021.Q1
10,8
49,0
7,2
31,0
21,6
31,3
Intake 2021.Q1
Euro/mln
52,9
87,0
286,3
114,4
84,9
31/03/2021(1) Of which Euro 64
million by Energy Automation
(2) Restart of the activities in the TRS Business and the investments
(3) Delay in the tender acquisition but the opportunities still higher than previous year
(1)
0,0
23
76,2
282,4
121,6
84,6
31/12/2020
(3)
(2)

24
2021.Q1 Revenues: sales spread over different geographical area
Italy21,5%
Europe23,4%
Middle East10,3%
Africa7,5%
North & Central America18,1%
BRIC &Others19,3%
REVENUE BY GEOGRAPHY 2021
Italy18,7%
Europe26,1%
Middle East4,1%
Africa5,5%
North & Central America24,4%
BRIC &Others21,2%
REVENUE BY GEOGRAPHY 2020
ITALY: railway & energy automation impact
USA&EU: trencher and railway impact
BRICS: trencher and stringing impact
25
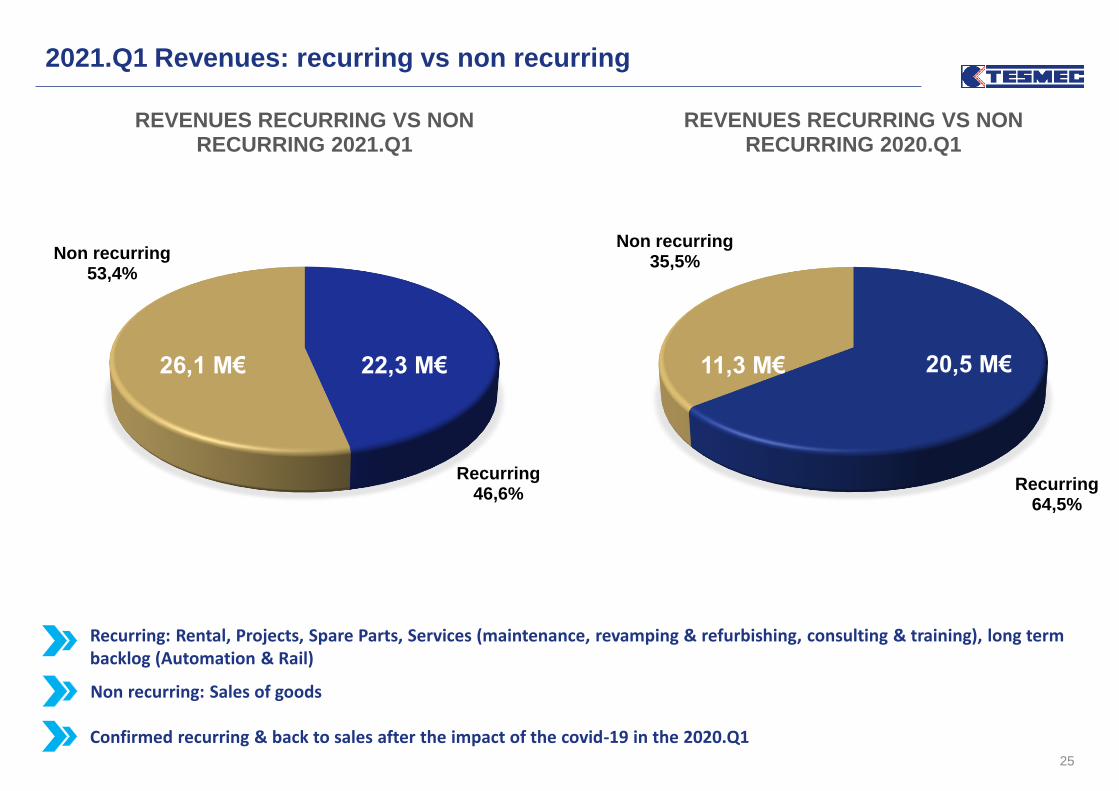
2021.Q1 Revenues: recurring vs non recurring
Recurring46,6%
Non recurring53,4%
REVENUES RECURRING VS NON RECURRING 2021.Q1
Recurring64,5%
Non recurring35,5%
REVENUES RECURRING VS NON RECURRING 2020.Q1
Recurring: Rental, Projects, Spare Parts, Services (maintenance, revamping & refurbishing, consulting & training), long term backlog (Automation & Rail)
Confirmed recurring & back to sales after the impact of the covid-19 in the 2020.Q1
26,1 M€ 22,3 M€ 11,3 M€ 20,5 M€
Non recurring: Sales of goods

1,0
3,7 (0,1)
0,0
1,0
2,0
3,0
4,0
5,0
6,0
7,0
8,0
2020.Q1 Energy Trencher Railway 2021.Q1
2,5
7,1
€ mln
2020.Q1Impacted from the increase of
TRS and Energy sales in the Q12021.Q1
2021.Q1 EBITDA
26

2021.Q1 2020
86,5 64,3
74,1 76,7
21,8 22,8
7,1 10,0
189,5 173,8
95,4 82,3
Lease liability - IFRS 16/IAS 17 22,3 22,1
71,8 69,4
189,5 173,8
Net Invested Capital
Net Financial Indebtness
Equity
Total Sources of Financing
Financial Information (€ mln)
Net Working Capital
Non Current assets
Other Long Term assets/liabilities
Right of use - IFRS 16/IAS 17
2021.Q1Increase of the NWC due to stock and receivables 2020
2021.Q1 Financial Results
27

2021.Q1 2020.FY2021.Q1 2020.FY
72,9 60,4 119 126
78,7 74,4 129 155
17,0 11,2 28 23
(60,1) (61,4) -98 -128
(22,0) (20,4) -36 -42
86,5 64,3Net Working Capital
€ Mln
Trade Receivables
Inventories
Trade Payables
Other Current Assets/(Liabilities)
Work in progress contracts
€ 60,8 mln
The increase of NWC is related to support the growth of the 2nd half, to
counterbalance the impact in the supplying market and logistic tensions
and to perform the Railways projects
2020
€ 64,3 mln
2021.Q1
€ 86,5 mln
64,3
86,5
4,35,8
12,5 1,3 (1,6)
0102030405060708090
2020Net Working
capital
Inventories WIP TradeReceivables
TradePayables
Othercurrent
ass. / liab.
2021.Q1Net Working
capital
2021.Q1 Working Capital evolution
28
€ mln

2021 | Corporate Presentation 29
• 1H IN LINE WITH QUARTELY DISTRIBUTION COMMENTED WITH FY 2019 AND 1Q RESULTS
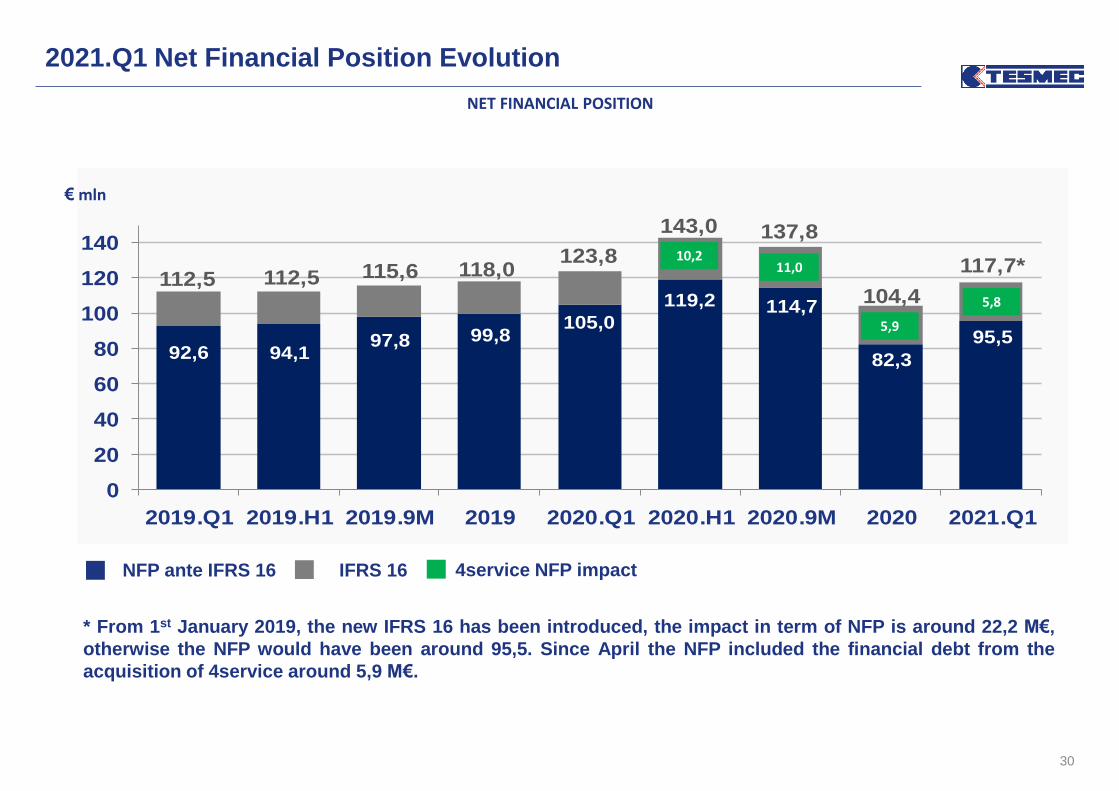
2021.Q1 Net Financial Position Evolution
104,4
82,3
95,5
117,7
22,1 22,3 1,0 (9,1)
22,2
60,0
70,0
80,0
90,0
100,0
110,0
120,0
2020 IFRS 16 Net debt2020
NWC Capex OFCF Net debt2021
IFRS 16 2021.Q1
Net Financial Position
2020Impacted by the huge increase of NWC to support the 2nd half,
mitigated by operating cash generation 2020.Q1
€ mln
NET FINANCIAL POSITION
* From 1st January 2019, the new IFRS 16 has been introduced, the impact in term of NFP is around 22,2 M€,
otherwise the NFP would have been around 95,5. Since April the NFP included the financial debt from the
acquisition of 4service around 5,9 M€.
92,6 94,197,8 99,8
105,0
119,2 114,7
82,3
95,5
112,5 112,5 115,6 118,0123,8
143,0 137,8
104,4
117,7*
0
20
40
60
80
100
120
140
2019.Q1 2019.H1 2019.9M 2019 2020.Q1 2020.H1 2020.9M 2020 2021.Q1
€ mln
10,211,0
NFP ante IFRS 16 IFRS 16 4service NFP impact
2021.Q1 Net Financial Position Evolution
5,9
30
5,8

ANNEX4.

Summary 2021.Q1 Profit & Loss statement - Appendix A
Profit & Loss Account (Euro mln) 2021.Q1 2020.Q1Delta vs
2020Delta %
Net Revenues 49,0 31,8 17,1 53,8%
Raw materials costs (-) (21,5) (10,0) (11,5) 115,8%
Cost for services (-) (6,8) (6,9) 0,1 -1,6%
Personnel Costs (-) (13,3) (12,1) (1,2) 10,0%
Other operating revenues/costs (+ /-) (1,5) (1,4) (0,0) 3,5%
Non recurring revenues/costs (+ /-) - - 0,0 na
Portion of gain/(losses)
from equity investments evaluated
using the equity method
(0,2) 0,0 (0,3) -977,8%
Capitalized R&D expenses 1,5 1,0 0,5 47,3%
Total operating costs (41,9) (29,4) (12,5) 42,5%
% on Net Revenues (86%) (92%)
EBITDA 7,1 2,5 4,6 187,3%
% on Net Revenues 14% 8%
Depreciation, amortization (-) (5,7) (4,2) (1,5) 36,2%
EBIT 1,4 -1,7 3,1 -181,7%
% on Net Revenues 3% -5%
Net Financial Income/Expenses (+ /-) 0,6 (2,4) 3,0 -124,4%
Taxes (-) (0,9) 1,1 (2,0) -179,0%
Minorities (0,0) (0,0) (0,0)
Group Net Income (Loss) 1,1 (3,0) 4,1 n/a
% on Net Revenues 2,2% -9,4% 32

Summary 2021.Q1.FY Balance Sheet - Appendix B
33
Inventory 78,7 74,2
Work in progress contracts 17,0 11,2
Accounts receivable 72,9 60,7
Accounts payable (-) (60,1) (61,4)
Op. working capital 108,5 84,7
Other current assets (liabilities) (22,0) (20,4)
Net working capital 86,5 64,3
Tangible assets 47,0 49,8
Right of use - IFRS 16/IAS 17 21,8 22,8
Intangible assets 22,8 22,5
Financial assets 4,4 4,4
Fixed assets 95,9 99,5
Net long term liabilities 7,1 10,0
Net invested capital 189,5 173,8
Cash & near cash items (-) (53,6) (70,4)
Short term financial assets (-) (17,1) (13,8)
Lease liability - IFRS 16/IAS 17 22,2 22,1
Short term borrowing 78,6 85,8
Medium-long term borrowing 87,6 80,7
Net financial position 117,7 104,4
Equity 71,8 69,4
Funds 189,5 173,8
Balance Sheet (€ mln) 2021.Q1 2020

Notes
The pro-forma results were prepared for illustrative purposes only, and were obtained by making appropriate pro-forma adjustments to the historical data to retroactively
highlight the effects of the 4Service Group's transaction, as if this transaction had occurred on 1st January 2020, instead of on 23 April 2020. The pro-forma results therefore
include the result of the 4Service Group on the half-year basis, instead of just the results achieved within the perimeter of the Tesmec Group from the date of first consolidation
(April 23, 2020).
Considering the uncertainty linked to the spread of the COVID-19 virus and the impacts on the global economy, the targets set by the Management may be susceptible to
changes. These targets are set in the assumption that the pandemic situation remains stable and / or better in Europe and that it does not get worse in other areas of the world,
such as the United States and Latin America
Disclaimer
The manager responsible for the preparation of the corporate accounting documents, Marco Paredi, declares, pursuant to article 154-bis, paragraph 2, of Legislative Decree No.
58/1998 ("Consolidated Law on Finance") that the information contained in this press release corresponds to the document results, books and accounting records. Note that in
this press release, in addition to financial indicators required by IFRS, there are also some alternative performance indicators (e.g. EBITDA) in order to allow a better
understanding of the economic and financial management. These indicators are calculated according to the usual market practice.
This press release contains some forward looking statements that reflect the current opinion of the Tesmec Group management on future events and financial and operational
results of the Company and of its subsidiaries, as well as other aspects of the Group's activities and strategies. These forward looking statements are based on current
expectations and assessments of the Tesmec Group regarding future events, as well as on the Group's intentions and beliefs. Considering that these forward looking statements
are subject to risk and uncertainty, the actual future results may considerably differ from what is indicated in the above forward looking statements as these differences may
arise from several factors, many of which lie beyond the Tesmec Group’s ability to accurately check and estimate them. Amongst these - including but not limited to - there are
potential changes in the regulatory framework, future developments in the market, price fluctuations and other risks. Therefore, the reader is asked to not fully rely on the
content of the forecasts provided as the final results could significantly differ from those contained in these forecasts for the reasons indicated above. They have been included
only with reference up to the date of the above-mentioned press release. The prospective data are, in fact, forecasts or strategic targets established within the corporate
planning.
The Tesmec Group does not assume any obligation to publicly disclose updates or amendments of the forecasts included regarding events or future circumstances that occur
after the date of the above-mentioned press release. The information contained in this press release is not meant to provide a thorough analysis and has not been independently
verified by any third party. This press release does not constitute a recommendation for investment on the Company’s financial instruments. Furthermore, this press release does
not constitute an offer of sale or an invitation to purchase financial instruments issued by the Company or by its subsidiaries.

www.tesmec.com