Tesla Presentation v2
6
CONFIDENTIAL AND PROPRIETARY Tesla Motors Forecasting and Valuation
-
Upload
westcoastbadger -
Category
Documents
-
view
222 -
download
0
Transcript of Tesla Presentation v2

8/12/2019 Tesla Presentation v2
http://slidepdf.com/reader/full/tesla-presentation-v2 1/6
CONFIDENTIAL AND PROPRIETARY
Tesla Motors
Forecasting and Valuation

8/12/2019 Tesla Presentation v2
http://slidepdf.com/reader/full/tesla-presentation-v2 2/6
| 1
Forecast and Valuation Summary
In the analysis of Tesla, we identified three critical assumptions:
Revenue
Cost of goods sold
Capital expenditures
Based on our analysis we valued Tesla at $191.58 a share
1
2

8/12/2019 Tesla Presentation v2
http://slidepdf.com/reader/full/tesla-presentation-v2 3/6
| 2
Revenue Overview We projected revenue by vehicle over the next 10 years
- Ramp in Model X units equivalent to Model S levels within 2 years
- Introduction of economical Generation III model ramping to 100,000 units by 2019
- Utilizing Generation III platform, introduction of Generation IV in 2020
Pricing of vehicles
- Assumed customers would purchase upgrades to base Model S & X ($60k-$120k) less
government tax credits
- Assumed Gen III and Gen IV would sell for $35,000 as battery prices decrease
8/12/2019 Tesla Presentation v2
http://slidepdf.com/reader/full/tesla-presentation-v2 4/6| 3
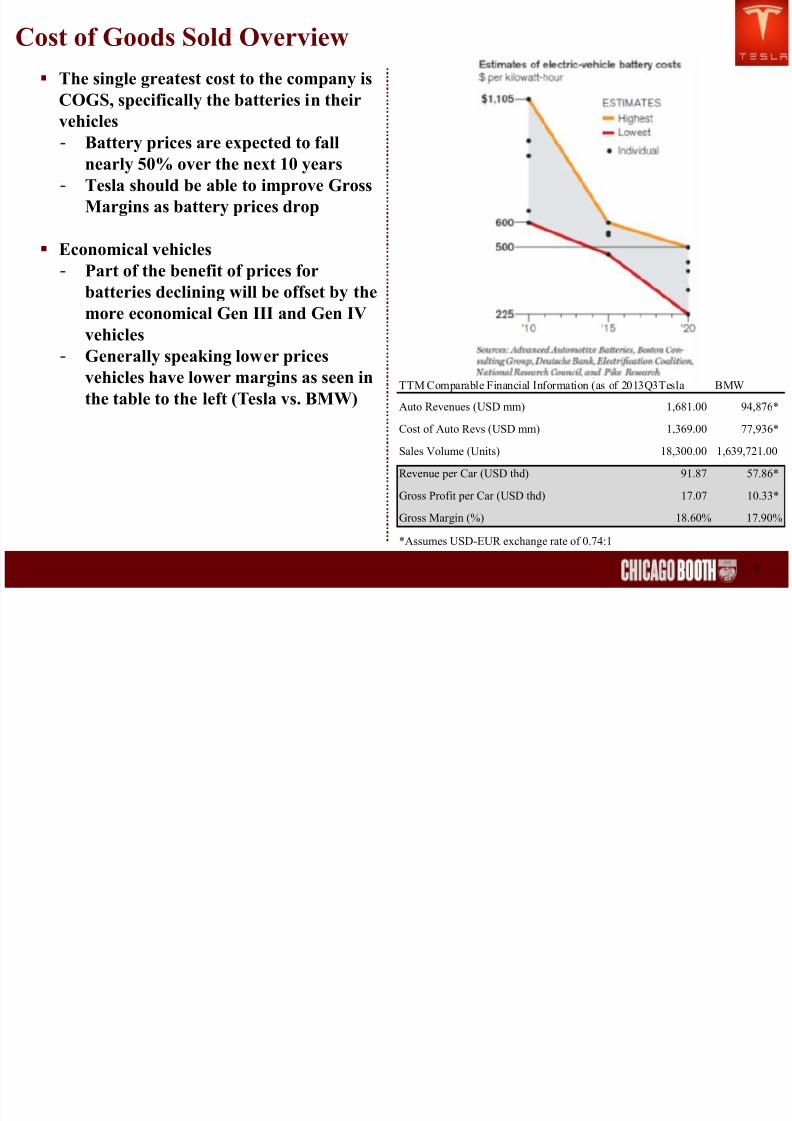
Cost of Goods Sold Overview
TTM Comparable Financial Information (as of 2013Q3Tesla BMW
Auto Revenues (USD mm) 1,681.00 94,876*
Cost of Auto Revs (USD mm) 1,369.00 77,936*
Sales Volume (Units) 18,300.00 1,639,721.00
Revenue per Car (USD thd) 91.87 57.86*
Gross Profit per Car (USD thd) 17.07 10.33*
Gross Margin (%) 18.60% 17.90%
*Assumes USD-EUR exchange rate of 0.74:1
The single greatest cost to the company is
COGS, specifically the batteries in their
vehicles
- Battery prices are expected to fallnearly 50% over the next 10 years
- Tesla should be able to improve Gross
Margins as battery prices drop
Economical vehicles
- Part of the benefit of prices forbatteries declining will be offset by the
more economical Gen III and Gen IV
vehicles
- Generally speaking lower prices
vehicles have lower margins as seen in
the table to the left (Tesla vs. BMW)
8/12/2019 Tesla Presentation v2
http://slidepdf.com/reader/full/tesla-presentation-v2 5/6| 4
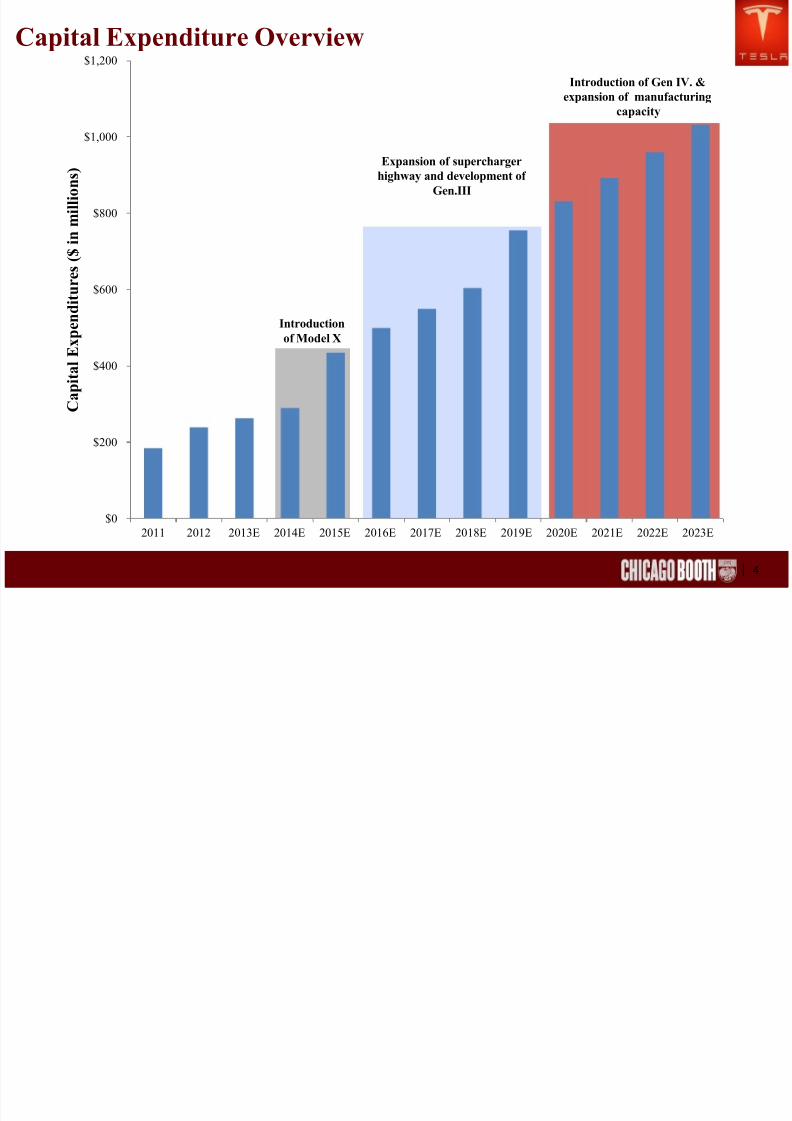
Capital Expenditure Overview
$0
$200
$400
$600
$800
$1,000
$1,200
2011 2012 2013E 2014E 2015E 2016E 2017E 2018E 2019E 2020E 2021E 2022E 2023E
C a p i t a l E x p e n d i t u r e
s ( $ i n m i l l i o n s )
Introduction
of Model X
Expansion of supercharger
highway and development of
Gen.III
Introduction of Gen IV. &
expansion of manufacturing
capacity

8/12/2019 Tesla Presentation v2
http://slidepdf.com/reader/full/tesla-presentation-v2 6/6| 5
Valuation
To determine the value of Tesla’s share we began by calculating WACC
- Beta – variances in Beta have a significant impact on the price of Tesla’s shares
- Cost of Equity: 7.56%
- Cost of Debt: ~3.0%-4.0% determined by utilizing revolver at 2.5% and notes of 1.5%- WACC: 7.37%
Utilizing various valuation models:
- We have priced Tesla’s shares at $191.58
- Large variance in Tesla’s shares based on discount rate and terminal growth rate: $97.82 -
$556.15
Valuation:
Free Cash Flow for Common Equity
1 2 3 4 5 6 7 8 9 10 11
2013 2014 2015 2016 2017 2018 2019 2020 2021 2022 2023
Net CFs from Ops. & Investing ($290.0) ($50.7) ($82.1) $299.6 $526.0 $695.2 $797.3 $973.0 $1,160.7 $1,356.8 $2,165.5
+/- Investment in operating cash 0.0 0.0 0.0 0.0 0.0 0.0 0.0 0.0 0.0 0.0 (329.9)
+/- Cash Flows from/to Debt 290.0 50.7 82.1 0.0 0.0 (401.5) 0.0 0.0 0.0 0.0 14.2
Net Free Cash Flows 0.0 0.0 0.0 299.6 526.0 293.7 797.3 973.0 1,160.7 1,356.8 1,849.9
Present Value Factors 0.930 0.864 0.804 0.747 0.695 0.646 0.600 0.558 0.519 0.482 0.046PV Cash Flows 0.0 0.0 0.0 223.8 365.3 189.7 478.7 543.1 602.4 654.6 40,567.4
Sum of PV Cash Flows 3,057.6 0.482
PV of Continuing Cash Flows 19,573.5 Discount 19,573.5
Total PV Cash Flows 22,631.2 Rates: Terminal Year Growth Assumption
Adjust to midyear 1.038 191.58 1.00% 1.75% 2.50% 3.25% 4.00% 4.75% 5.50%
PV of Equity 23,486.6 7.00% $159.19 $178.10 $203.30 $238.58 $291.51 $379.73 $556.15
7.50% $142.85 $158.09 $177.90 $204.71 $243.01 $302.20 $405.78
Shares Outstanding 122.594 8.00% $128.98 $141.44 $157.30 $178.17 $206.86 $248.80 $315.89
Estimated Value per Share $191.58 8.50% $117.09 $127.39 $140.28 $156.84 $178.93 $209.85 $256.24
Relative difference from market price 33.04% 9.00% $106.80 $115.41 $126.01 $139.38 $156.75 $180.26 $213.84
9.50% $97.82 $105.08 $113.90 $124.83 $138.75 $157.06 $182.23