Terry Hungle CFO - s1.q4cdn.coms1.q4cdn.com/350838982/files/doc_presentations/MVNR_Feb2015.pdf ·...
45
Private & Confidential February 2015 Transforming Mobile Networks to 4G LTE Terry Hungle CFO
Transcript of Terry Hungle CFO - s1.q4cdn.coms1.q4cdn.com/350838982/files/doc_presentations/MVNR_Feb2015.pdf ·...

Private & Confidential February 2015
Transforming Mobile Networks to 4G LTE
Terry Hungle
CFO

2Private & Confidential February 2015
Forward-Looking Statements
This presentation has been prepared by Mavenir Systems, Inc. (“Mavenir”) solely for informational purposes.
Mavenir has filed a registration statement (including a prospectus) with the U.S. Securities and Exchange
Commission (the “SEC”) for the offering to which this presentation relates. Before you invest, you should read
the prospectus for more complete information about Mavenir and this offering.
Statements in this presentation that are not historical fact are forward-looking statements. Some of the forward-
looking statements contained in this presentation can be identified by the use of forward-looking words such as
“anticipate,” “believe,” “could,” “expect,” “should,” “plan,” “intend,” “estimate” and “potential,” among others.
Forward-looking statements include, but are not limited to, statements regarding our intent, belief or current
expectations with respect to matters such as future industry trends, capital expenditures by mobile service
providers, the adoption of 4G LTE technology by mobile service providers and users, and our expected
financial performance subsequent to our most recently released financial results. Forward-looking statements
are based on our management’s beliefs and assumptions and on information currently available to our
management. Such statements are subject to risks and uncertainties, and actual results may differ materially
from those expressed or implied in the forward-looking statements due to various factors. Investors should
review factors described in our filings with the SEC, including under the heading “Risk Factors” in such
filings. Forward-looking statements speak only as of the date they are made, and we do not undertake any
obligation to update them in light of new information or future developments or to release publicly any revisions
to these statements in order to reflect later events or circumstances or to reflect the occurrence of
unanticipated events.

3Private & Confidential February 2015
Customers include 12 of top 20
operators globally; Top 4 US
operators & 4 of top 5 in Europe
First mover advantage with several
world’s first commercial
deployments of 4G LTE solutions
Capitalizing on two key network
trends: 4G All-IP and software-
based cloud deployments
1172 employees
959 across
eng/ops
Founded in 2005 with a
vision to lead the
transformation to 4G LTE
A leading provider of converged voice,
video, messaging and mobile core
network solutions
Disruptive, virtualized
software platform with
>30 products
Company Highlights
$101M 2013 Rev
37% YoY Growth
30% YoY Growth
$96.1M 9mo Rev

4Private & Confidential February 2015
Investment Highlights
Strong competitive position in a large and rapidly growing market
Disruptive software-based mobile networking solutions provider
Capitalizing on two major trends: 4G all-IP & cloud networks
Solid foundation of deployments into Tier-1 carriers
Attractive financial model with proven track record of execution

5Private & Confidential February 2015
Investment Highlights
Mavenir is
• Wireless Pure Play networking solutions provider
• Disruptive software-based mobile approach
• Capitalizing on two major trends: 4G all-IP & cloud networks
• Strong competitive position in a large and rapidly growing market
• Solid foundation of deployments into Tier-1 carriers
• Attractive financial model with proven track record of execution
6Private & Confidential February 2015
Strong Execution Since IPO
5th successive quarter exceeding top/bottom line expectations;
increased guidance
Revenue growth of 30% (YTD 2014)
Increased investment in product development and trials
Several new customer wins/expansions globally
Multiple new product launches
Significant VoLTE launches & announcements
Strong Business and Financial Performance Since IPO

7Private & Confidential February 2015
Mavenir Global Presence
Richardson
Head Office
Architecture Devt
Americas Ops
Sales/BD Sales
EMEA Ops
Shanghai
Platform &
Protocal
Development
Bangalore
Application Dev
Asia Pack Ops
Support
Global Call Center
Reading

8Private & Confidential February 2015
Speed
up to 15x
faster
Services
more
revenue
Savings
less
cost
Spectrum
up to 10x
better
Why 4G LTE is a Necessity

9Private & Confidential February 2015
Phase 1 Phase 2
4G LTE
HighSpeed
Data
2G/3G
CircuitSwitched
Voice
4G LTE
Better VoiceHigh Speed DataRich, New Services
First Phase of LTE is “Data Only”…
Two Networks for Voice & Data
Next Phase of LTE is “Unified”…
One Network for Voice and Data
Reallocate Spectrum from 2G/3G
to spectrally efficient 4G LTE
4G LTE Network Evolution Phases
10Private & Confidential February 2015
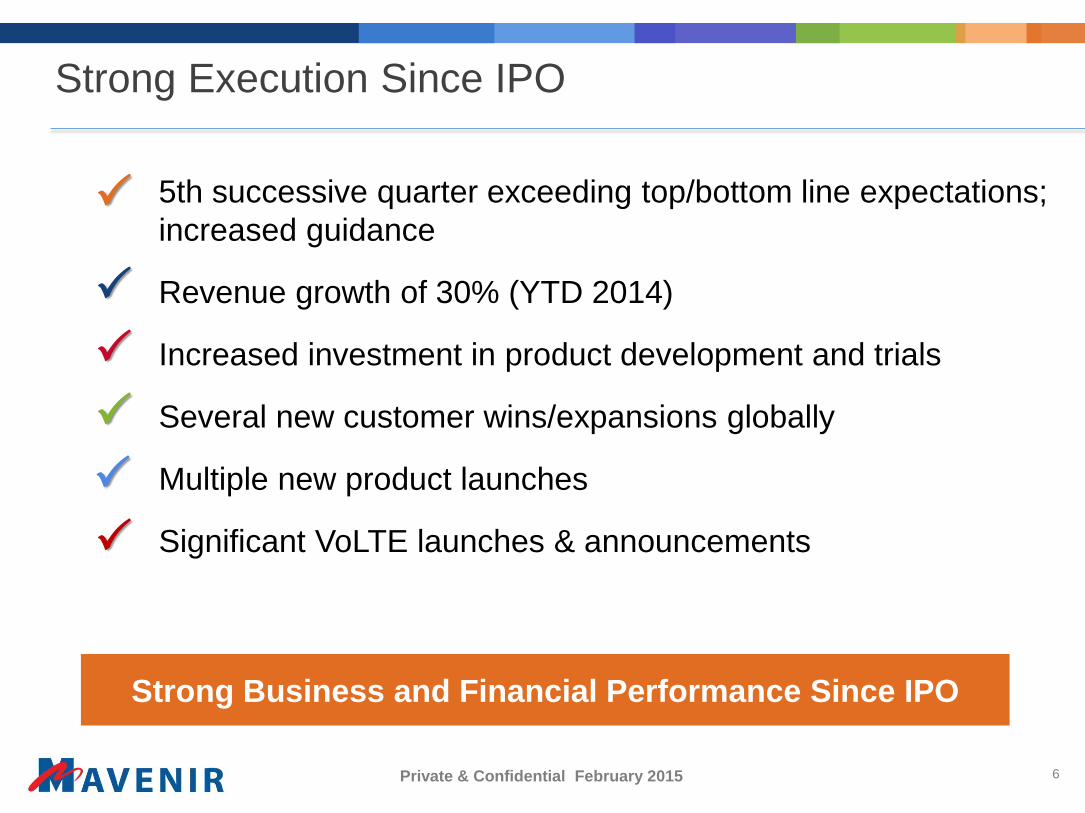
Software Based
Transition to Software Networks
2G/3G 4G LTE
Hardware Based
INTEGRATED SOFTWARE ON
SPECIALIZED HARDWARE
VIRTUALIZED SOFTWARE ON
GENERAL PURPOSE HARDWARE
11Private & Confidential February 2015
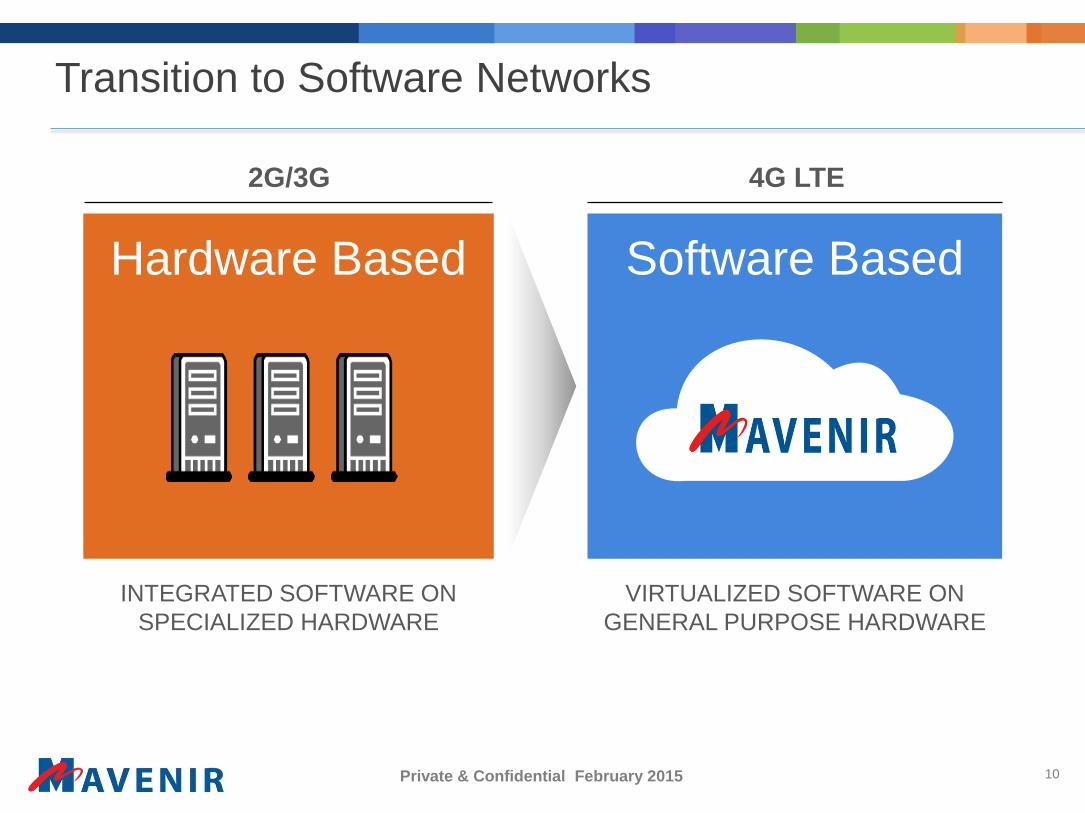
Mavenir’s 4G Solutions Addressing the Opportunity
Best-in-Breed Wireless Applications & Services
Fully Virtualized Software Product Portfolio
High Performance Media Handling Architecture
1
2
3
Session
Control
Session Border
Controller
Voice & Video
IMS-PBX
IMS Core Network
IMS Centralized
Services GW
Rich Message
Server
Presence
Server
Telephony
Server
Mobility
Management
Entity
SAE Gateways
Evolved Packet Core Network
Evolved Packet
Data Gateway
Optimized E2E LTE Architecture for Voice (R4)4
Enhanced Messaging
Access Network
CableLTE Wi-Fi FixedOSS
OSS/BSS
Billing
NMS
SLA
CRM

12Private & Confidential February 2015
Key Differentiators
VoLTE RCSIMSEPC
SERVICE PARITY
CONVERGEDMESSAGING
SCALE & FLEXIBILITY
VIRTUALIZED & EFFICIENT
• Integrated IN
• MCS Equivalency
• Deployment Flexibility
• Convergence (FMC, VoWi-Fi)
• First Mover Advantage (Metro)
• Investment Protection (RMS)
• Solution Breadth (full RCS 5)
• Next Gen IP Leadership (CPM)
• First Mover Advantage (Metro)
• Designed for Wireless
• Optimized for large scale deployments
• Unique Next Gen SW-based SBC
• ICS GW for CS Replacement
mONE® SOFTWARE PLATFORM
• Unique Distributed Architecture
• Lower TCO Thru SW Performance
• R4 Architectural Optimization of LTE
• Enhanced with M2M Features

13Private & Confidential February 2015
4G Network Connectivity & Topology
Public
Internet
SGWSEG
PGW
ePDG
MME
A-SBC
P-CSCF
DRAATGW
ATCF I-SBC
LTE Backhaul Wi-Fi Access
Data Services
Carrier
Networks
IMS Service
Interoperability
2G/3G CS Core
I-CSCF
CSCF
DSCMGW
MGCF HSS
IMS
Co
ntr
ol
IMS
Bo
rder
EP
C
PSTN
Networks
Legacy Voice
Interworking
mStore™
RMS
XDMSMRF
TAS PRS
IMS
Ap
ps &
Serv
ices
Voice
Handover
Bearer Plane
Control Plane
3rd Party Component
PCRF
IMS-PBX
IMS/LTE Policy
Control

14Private & Confidential February 2015
4G LTE Progress
Operators globally
1000+
801 invested in LTE
<5%
445 launched
Connections on LTE
Source: GSMA, February 2015

15Private & Confidential February 2015
4G LTE Investment Cycle and Opportunity
Launch
Voice
over LTE
Launch
4G LTE
Data
Coverage Capacity
Launch
New
Services
Global 4G LTE CAPEX
Source: Gartner - January 2015.
2018
$13.9B
$34.8B
2014
26%
CAGR

16Private & Confidential February 2015
2014/2015 VoLTE – Industry Profile
Launches Planned
OperatorsLaunched
OperatorsTrialing
DevicesAvailable
2014 2015
13 50 20 146
Source: GSMA, GSA – January 2015.

17Private & Confidential February 2015
VoLTE Total Market Forecast
50m
VoLTE subscriptions in
2014
1200m
VoLTE subscriptions in
2019
Source: Mavenir, ABI Research June 2014
82%CAGR
18Private & Confidential February 2015
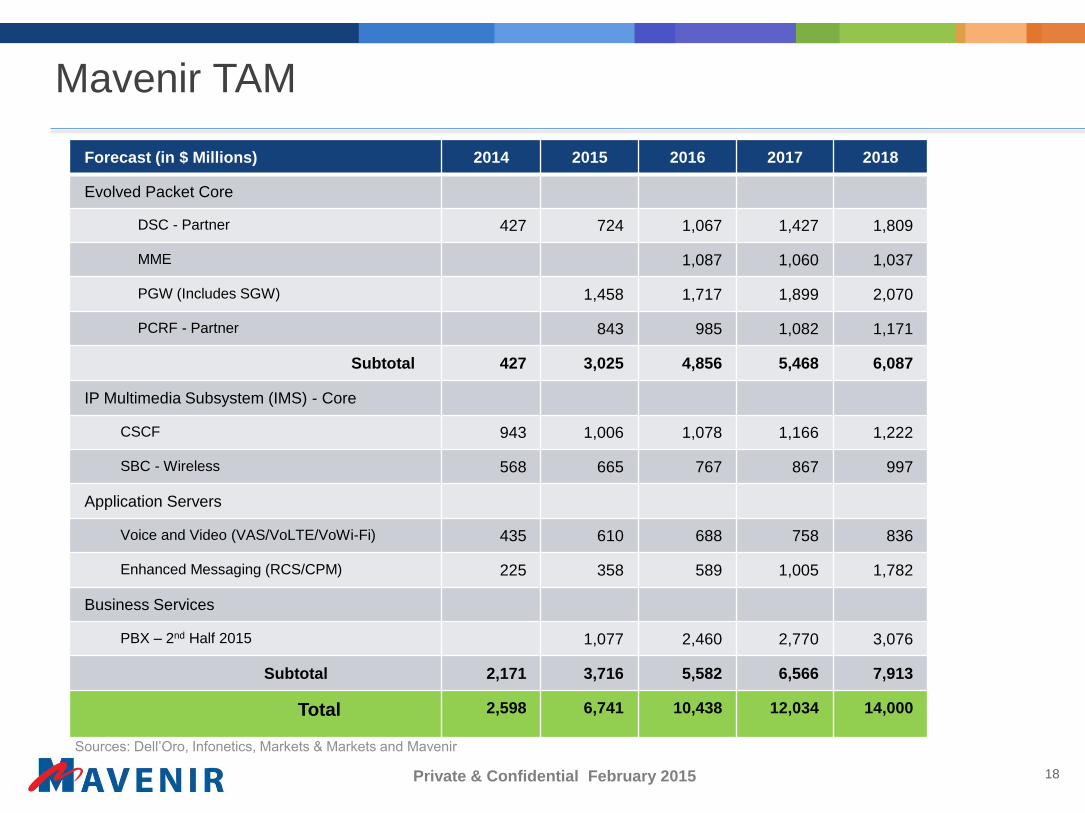
Mavenir TAM
Forecast (in $ Millions) 2014 2015 2016 2017 2018
Evolved Packet Core
DSC - Partner 427 724 1,067 1,427 1,809
MME 1,087 1,060 1,037
PGW (Includes SGW) 1,458 1,717 1,899 2,070
PCRF - Partner 843 985 1,082 1,171
Subtotal 427 3,025 4,856 5,468 6,087
IP Multimedia Subsystem (IMS) - Core
CSCF 943 1,006 1,078 1,166 1,222
SBC - Wireless 568 665 767 867 997
Application Servers
Voice and Video (VAS/VoLTE/VoWi-Fi) 435 610 688 758 836
Enhanced Messaging (RCS/CPM) 225 358 589 1,005 1,782
Business Services
PBX – 2nd Half 2015 1,077 2,460 2,770 3,076
Subtotal 2,171 3,716 5,582 6,566 7,913
Total 2,598 6,741 10,438 12,034 14,000
Sources: Dell’Oro, Infonetics, Markets & Markets and Mavenir
19Private & Confidential February 2015
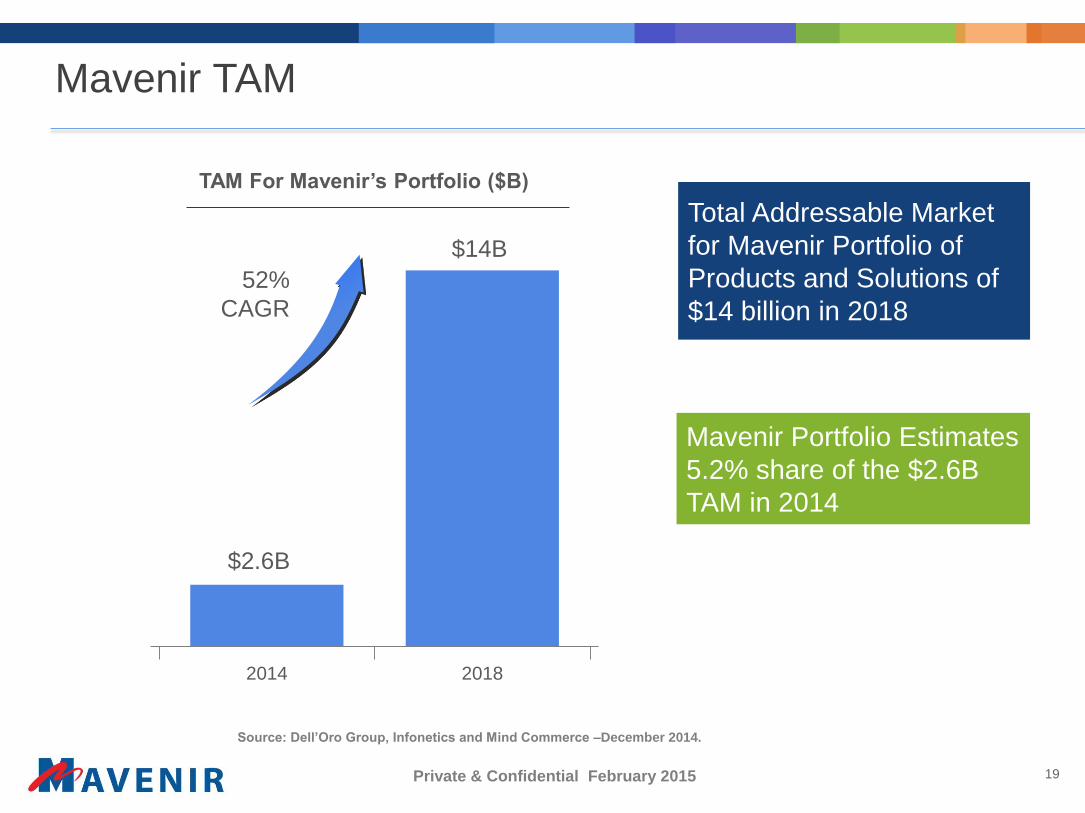
Mavenir TAM
TAM For Mavenir’s Portfolio ($B)
Total Addressable Market
for Mavenir Portfolio of
Products and Solutions of
$14 billion in 2018
Mavenir Portfolio Estimates
5.2% share of the $2.6B
TAM in 2014
2018
$2.6B
$14B
2014
52%
CAGR
Source: Dell’Oro Group, Infonetics and Mind Commerce –December 2014.
20Private & Confidential February 2015
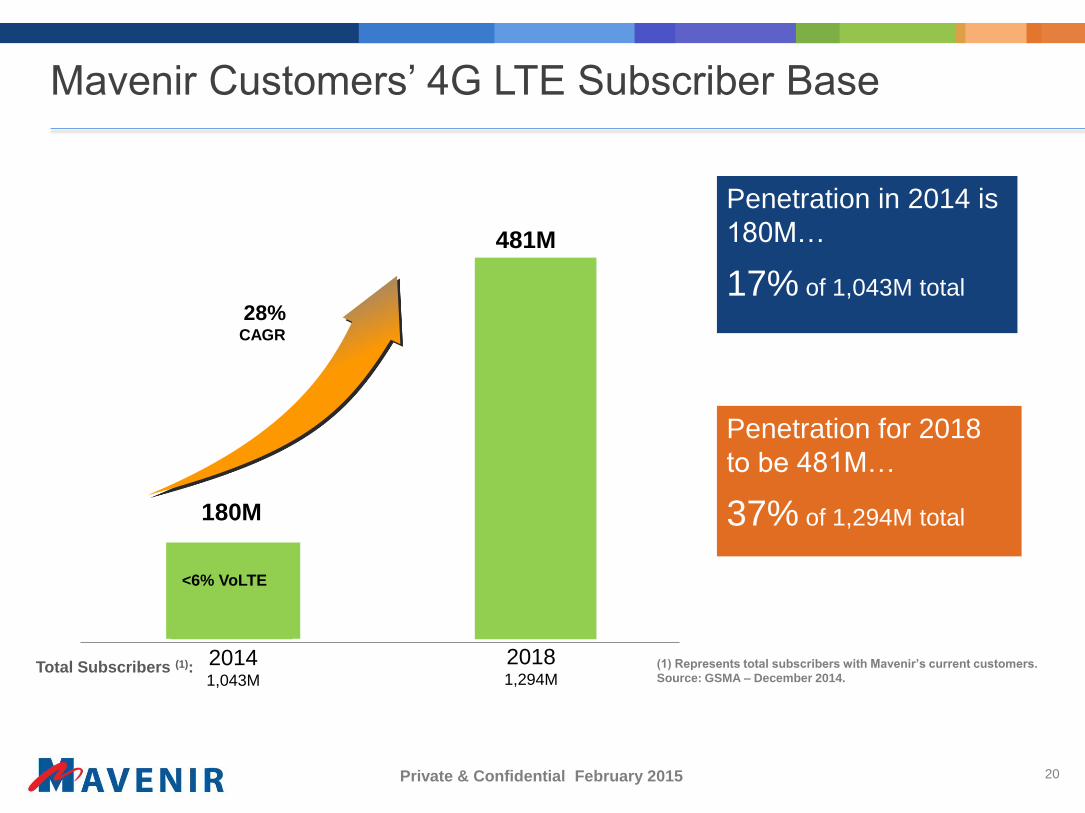
Mavenir Customers’ 4G LTE Subscriber Base
28%CAGR
<6% VoLTE
481M
Penetration in 2014 is
180M…
17% of 1,043M total
20181,294M
180M
20141,043M
Penetration for 2018
to be 481M…
37% of 1,294M total
(1) Represents total subscribers with Mavenir’s current customers.
Source: GSMA – December 2014.Total Subscribers (1):
21Private & Confidential February 2015
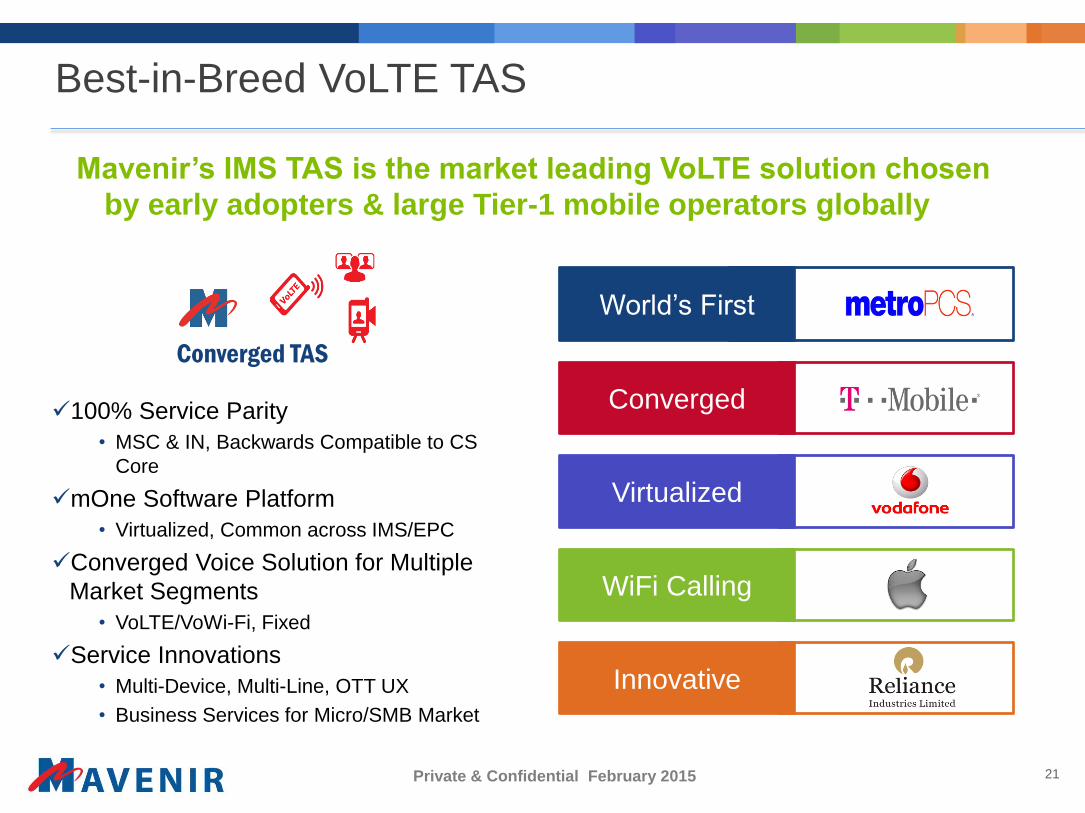
Best-in-Breed VoLTE TAS
Mavenir’s IMS TAS is the market leading VoLTE solution chosen
by early adopters & large Tier-1 mobile operators globally
100% Service Parity
• MSC & IN, Backwards Compatible to CS
Core
mOne Software Platform
• Virtualized, Common across IMS/EPC
Converged Voice Solution for Multiple
Market Segments
• VoLTE/VoWi-Fi, Fixed
Service Innovations
• Multi-Device, Multi-Line, OTT UX
• Business Services for Micro/SMB Market
Converged TAS
World’s First
Converged
Virtualized
WiFi Calling
Innovative
22Private & Confidential February 2015
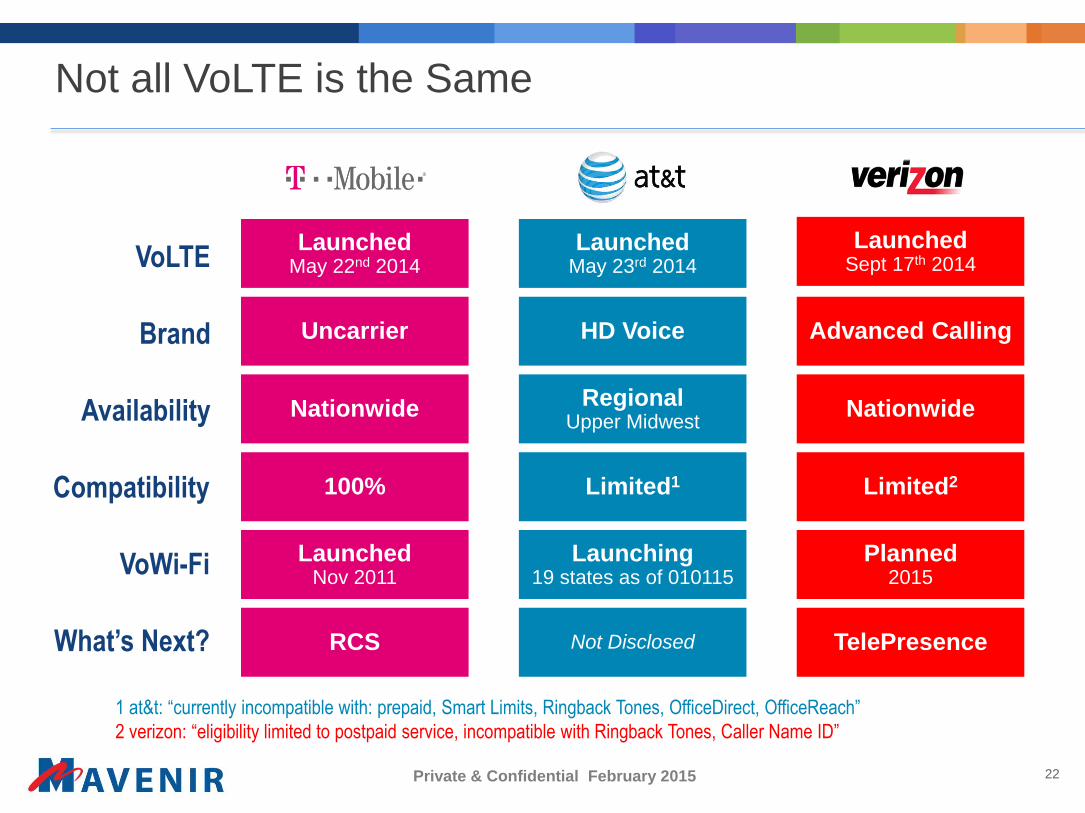
Not all VoLTE is the Same
LaunchedMay 22nd 2014
LaunchedNov 2011
Nationwide
100%
LaunchedSept 17th 2014
Planned2015
Nationwide
Limited2
LaunchedMay 23rd 2014
Launching19 states as of 010115
RegionalUpper Midwest
VoLTE
Availability
Compatibility Limited1
VoWi-Fi
RCS TelePresenceNot DisclosedWhat’s Next?
1 at&t: “currently incompatible with: prepaid, Smart Limits, Ringback Tones, OfficeDirect, OfficeReach”
2 verizon: “eligibility limited to postpaid service, incompatible with Ringback Tones, Caller Name ID”
Uncarrier Advanced CallingHD VoiceBrand
23Private & Confidential February 2015
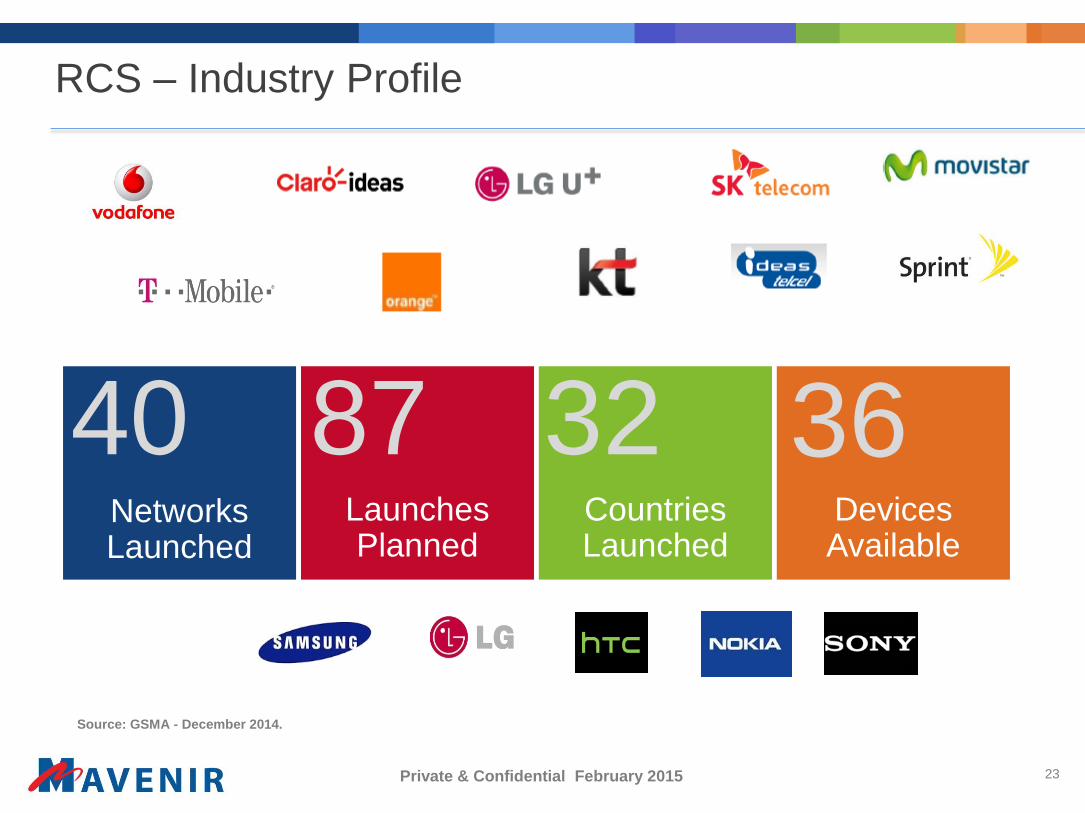
RCS – Industry Profile
Launches Planned
NetworksLaunched
Countries Launched
DevicesAvailable
40 87 32 36
Source: GSMA - December 2014.
24Private & Confidential February 2015
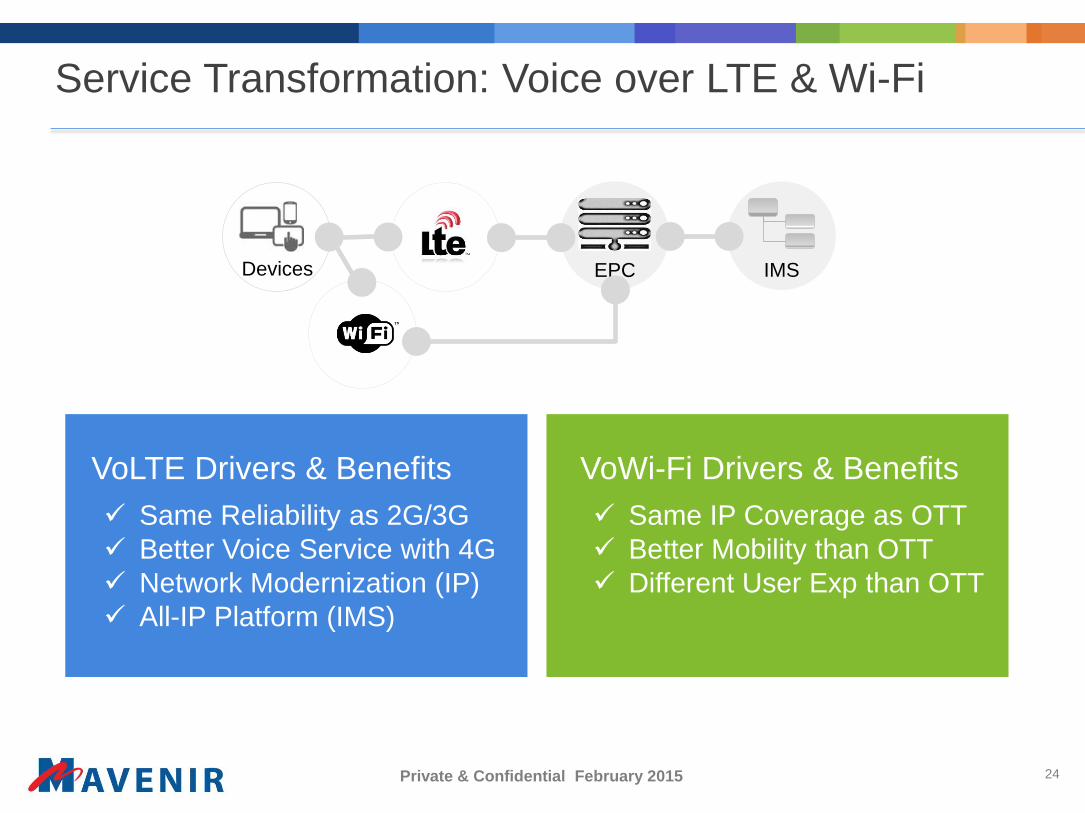
Service Transformation: Voice over LTE & Wi-Fi
EPC IMSDevices
Same Reliability as 2G/3G
Better Voice Service with 4G
Network Modernization (IP)
All-IP Platform (IMS)
VoLTE Drivers & Benefits VoWi-Fi Drivers & Benefits
Same IP Coverage as OTT
Better Mobility than OTT
Different User Exp than OTT

25Private & Confidential February 2015
EPC IMSDevicesCloud Store
Identity
Mgmt.
Internet
RCS
Service Transformation: RCS & Multi-Device
RCS & Multi-Device Drivers & Benefits
LTE Device Ecosystem
User Experience & Demand
OTT/Apple UX
Service Extensions - RCS
Single Mobile Identity
Interoperable Ecosystem

26Private & Confidential February 2015
Business Transformation: Adjacent Markets
Mobile
Consumer
Devices
Markets
Fixed / CableEnterprise
FMC IMS-PBX
VoLTERCS
Residential
Voice
Hosted
PBX / UC
27Private & Confidential February 2015
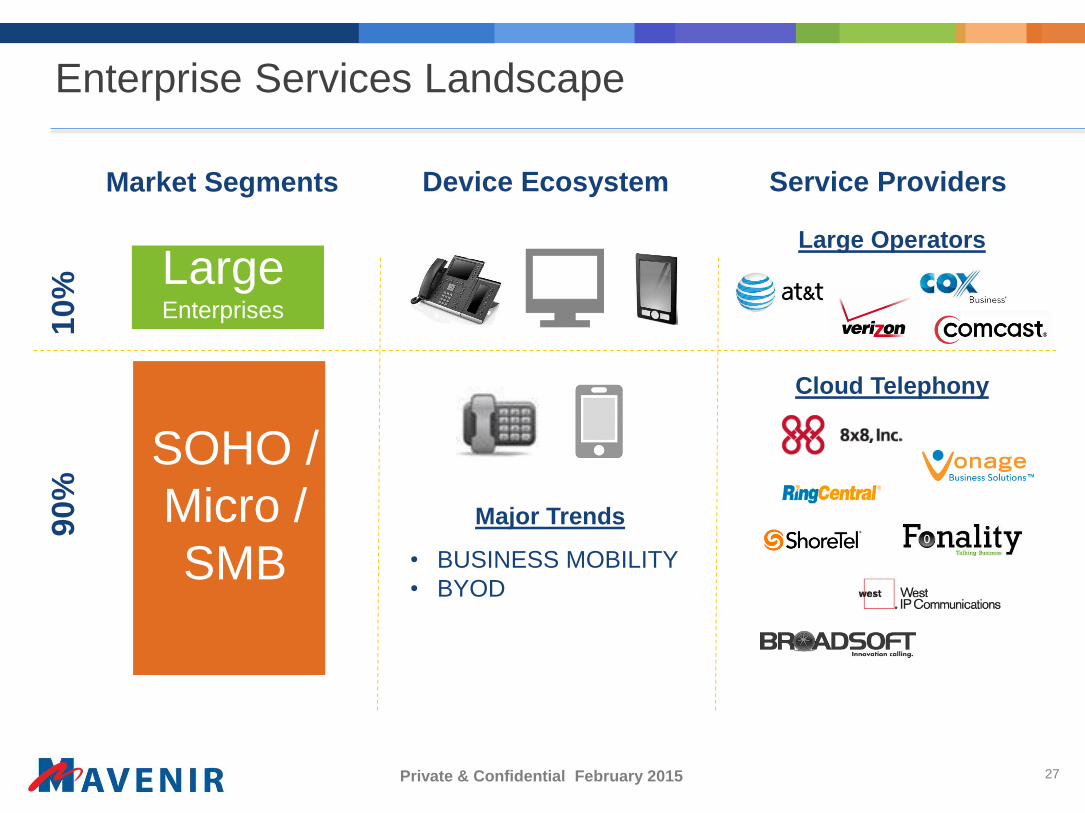
Enterprise Services Landscape
SOHO /
Micro /
SMB
LargeEnterprises
10
%
• BUSINESS MOBILITY
• BYOD
Market Segments
90
%
Device Ecosystem
Major Trends
Service Providers
Large Operators
Cloud Telephony

28Private & Confidential February 2015
IMS-PBX Solution Targeting Micro SMB Segments
Personal#
Personal
Work
Family
2.5G 3G 4G
Work#Family#
Multi-Lines Handling Personas
Multi-Device Extending Reach
Integrated UC for Collaboration
Custom Service Personalization

29Private & Confidential February 2015
Complete Portfolio of 4G LTE Services
Multiple Services
Delivered across
multiple networks
Services
VoiceVoIP • VoLTE • VoWi-Fi
VideoMobile Video
Video Calling/Conferencing
MessagingCPM • IP-SM-GW
RCS • Web
Platforms
Next Gen NetworksLTE • Wi-Fi • HSPA • FIXED
Multi-Device
DevicesLandline Smartphone Computer Tablet TV
Better Voice & Video New Services More Efficient Networks
30Private & Confidential February 2015
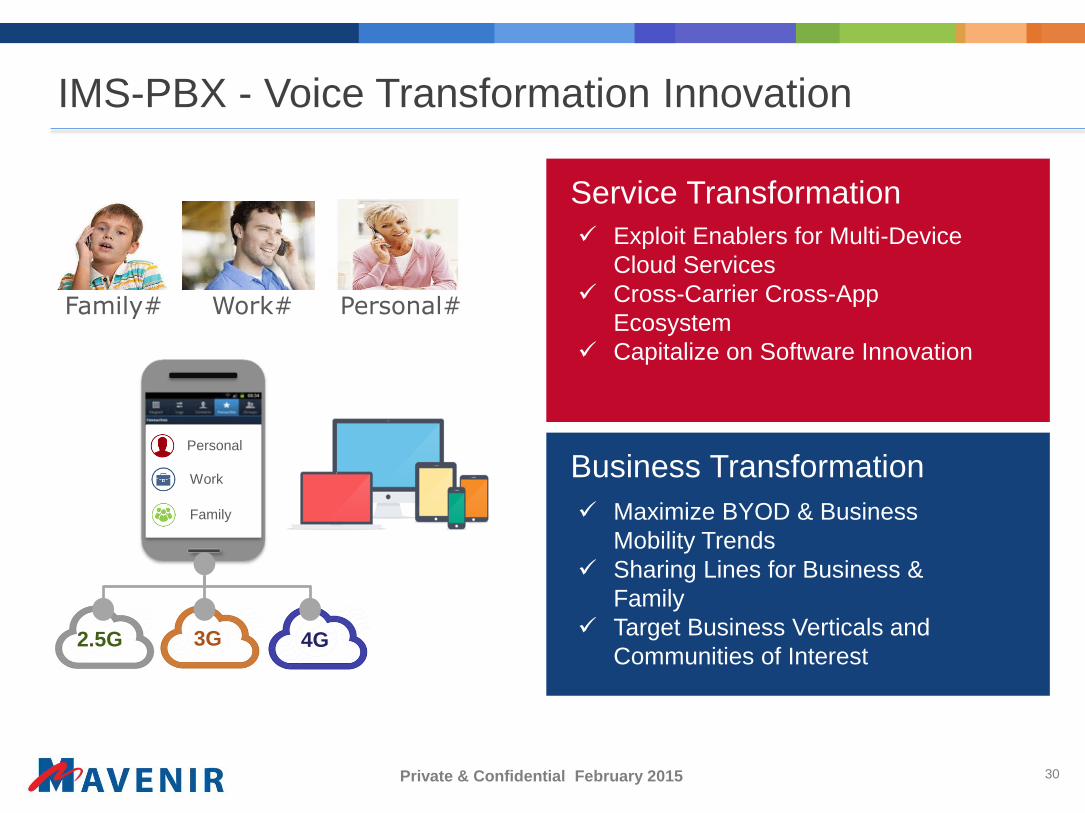
IMS-PBX - Voice Transformation Innovation
Personal#
Personal
Work
Family
2.5G 3G 4G
Work#Family#
Service Transformation
Business Transformation
Maximize BYOD & Business
Mobility Trends
Sharing Lines for Business &
Family
Target Business Verticals and
Communities of Interest
Exploit Enablers for Multi-Device
Cloud Services
Cross-Carrier Cross-App
Ecosystem
Capitalize on Software Innovation

31Private & Confidential February 2015
Competitive Landscape
End to End
(proprietary H/W)
Point S/W-based
Solutions
Complete S/W Portfolio

32Private & Confidential February 2015
Customer Highlights
VoLTE/WiFi
17RCS
17CORE
23 Growing Roster of Blue Chip 4G Customers
• Top 4 operators in the US; 3 of top 4 operators in Europe
Diversified 4G Customer Base• Geographically diverse, as well across product lines
Strong 2G/3G Customer Base • 12 of top 20 operators globally
2G/3G/4G120+
Based on Mavenir 2Q2014 data

33Private & Confidential February 2015
Reasons Why We Win
Flexibility
Innovation
Technology
Experience
• Customer First attitude
• Adapting products to existing networks
• Lower Total Cost of Ownership
• Accelerate Time To Market
• Disruptive SW platform
• Best-in-breed wireless applications
• First Mover Advantage
• Passionate and knowledgeable workforce
Vision• Mobile network transformation
• Evolution to the cloud

34Private & Confidential February 2015
Business Drivers for Mavenir’s Growth
Pure-play vendor focused on 4G LTE infrastructure with
industry spending forecast to grow 30% through 2018
Leverage
Technology to
Enable
Software
Based
Networks
Innovate to
Extend
Technology
Advantage
Selectively
Pursue
Strategic
Relationships
Expand into
Emerging
Markets
Source: Gartner – October 2014.

Private & Confidential February 2015
Transforming Mobile Networks to 4G LTE
36Private & Confidential February 2015
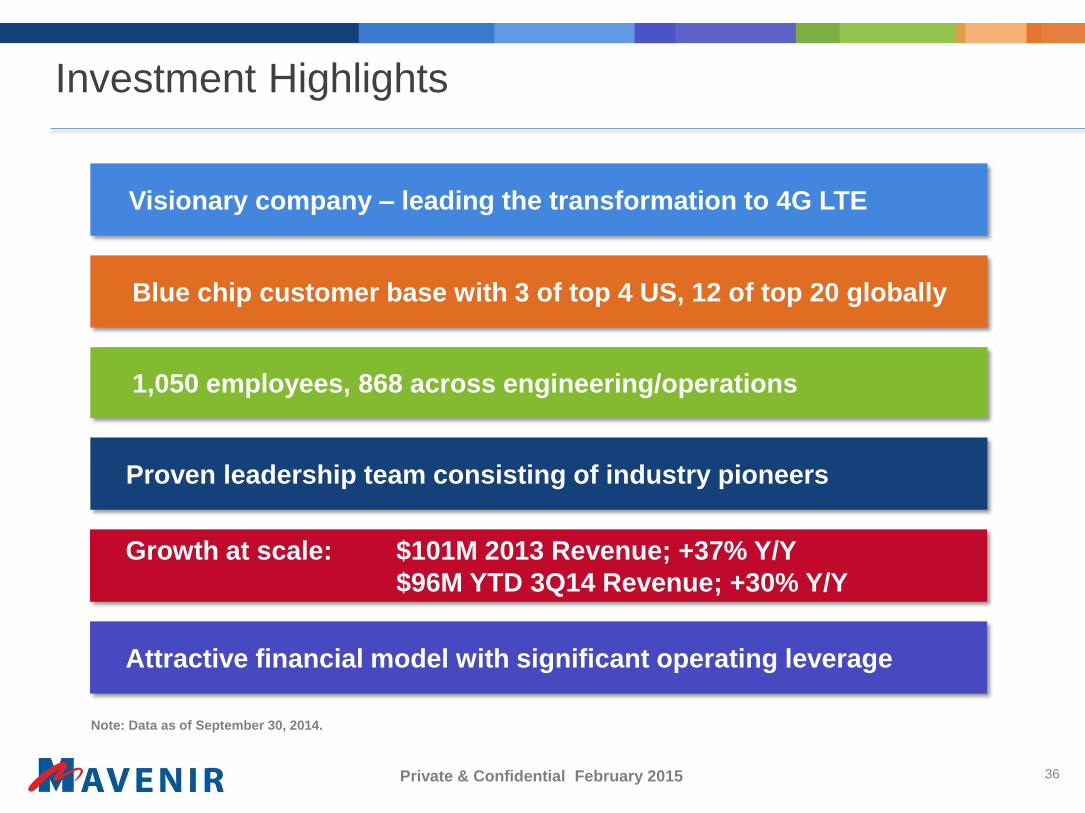
Investment Highlights
1,050 employees, 868 across engineering/operations
Visionary company – leading the transformation to 4G LTE
Blue chip customer base with 3 of top 4 US, 12 of top 20 globally
Proven leadership team consisting of industry pioneers
Growth at scale: $101M 2013 Revenue; +37% Y/Y
$96M YTD 3Q14 Revenue; +30% Y/Y
Attractive financial model with significant operating leverage
Note: Data as of September 30, 2014.
37Private & Confidential February 2015
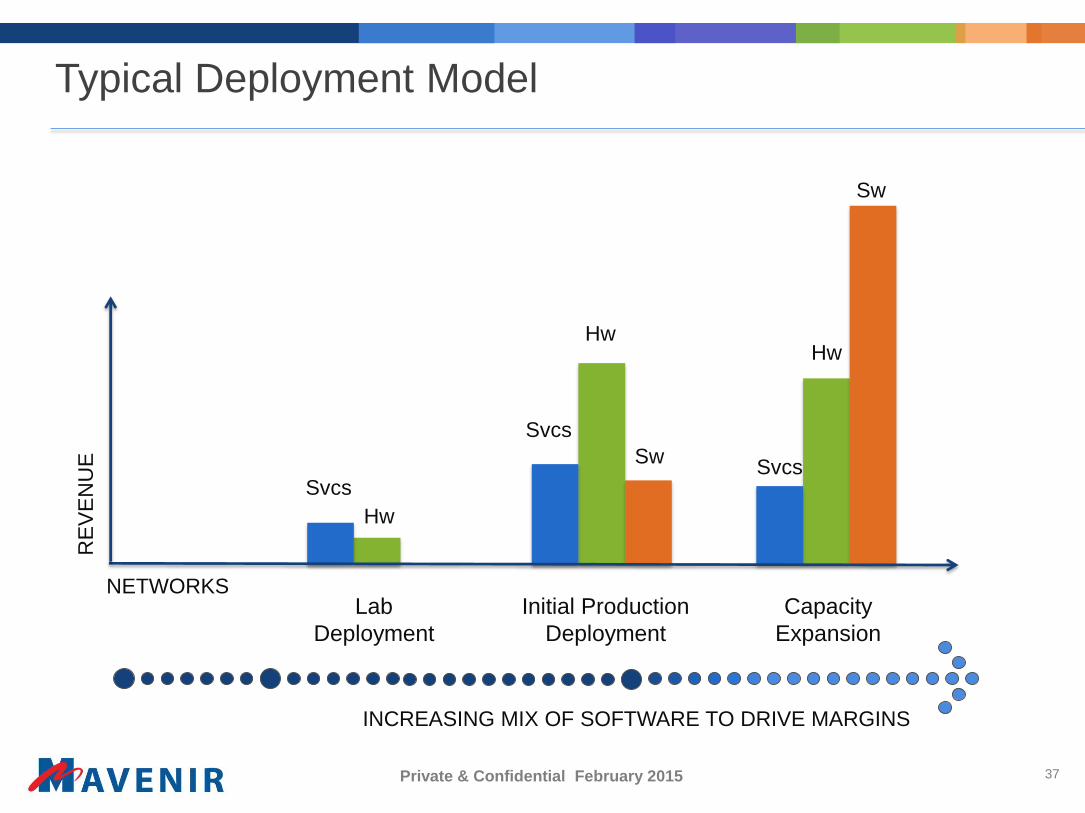
Typical Deployment Model
Svcs
Hw
Svcs
Hw
Sw
Lab
Deployment
Initial Production
Deployment
Capacity
Expansion
NETWORKS
RE
VE
NU
E
Svcs
Hw
Sw
INCREASING MIX OF SOFTWARE TO DRIVE MARGINS

38Private & Confidential February 2015
Pricing Structure
Messaging
• PRS/XDMS
• mStore
• RCS, IPSM GW
• SMSC, MMSC
• Video/Voice Mail
IP Core
• I/S/P-CSCF
• EIR, HSS, AG
• SBC/ICS GW
• WebRTC GW
• EPC, SEG, DRA
$2.95/sub $9.00/sub
Voice & Video
• TAS/MRF
• SCC/VCC
• IWF/CSFB
• CCPS/Client
• IMS-PBX
• Per Project
• Per Customer
• $/Unit
Hardware
Professional
• Day Rates
Maintenance
• Annual
• 10-15%
Optional$2.65/sub Variable
ServicesSoftware (Standard SW Discount)
Funnels into Average Sales Price per Subscriber
$1.75 $0.50$2.25 $4.50 =
39Private & Confidential February 2015
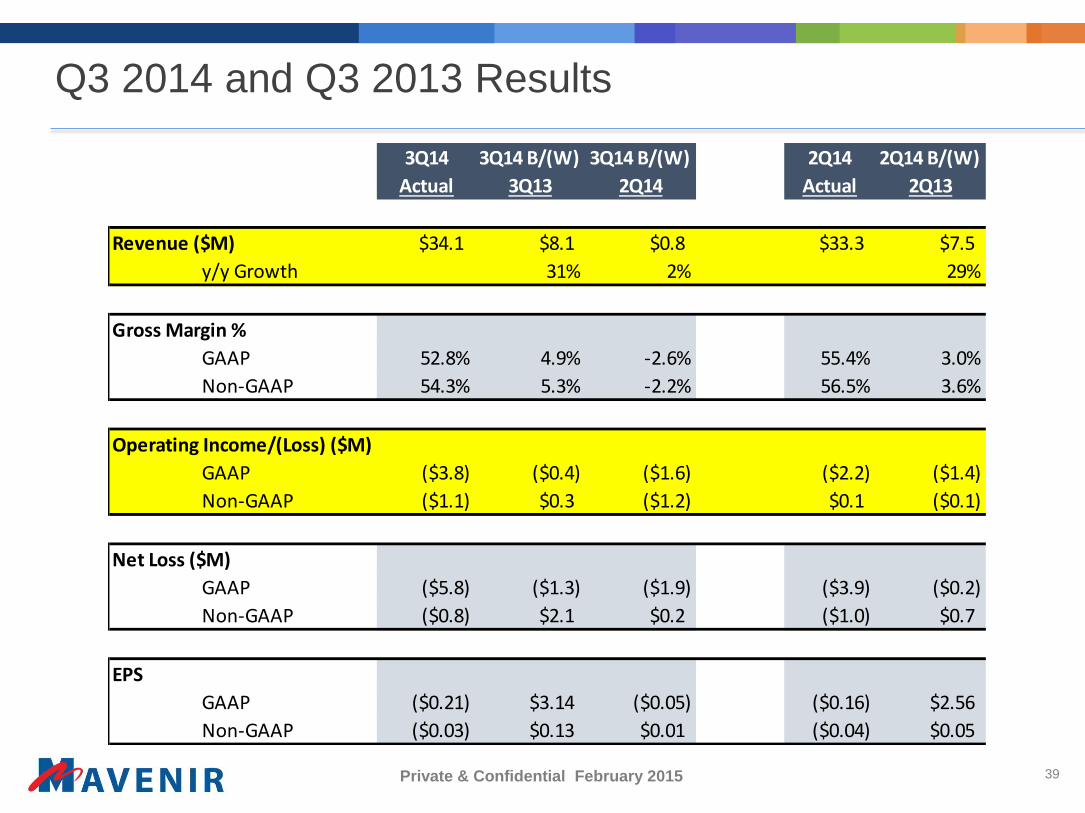
Q3 2014 and Q3 2013 Results
3Q14 3Q14 B/(W) 3Q14 B/(W) 2Q14 2Q14 B/(W)
Actual 3Q13 2Q14 Actual 2Q13
Revenue ($M) $34.1 $8.1 $0.8 $33.3 $7.5
y/y Growth 31% 2% 29%
Gross Margin %
GAAP 52.8% 4.9% -2.6% 55.4% 3.0%
Non-GAAP 54.3% 5.3% -2.2% 56.5% 3.6%
Operating Income/(Loss) ($M)
GAAP ($3.8) ($0.4) ($1.6) ($2.2) ($1.4)
Non-GAAP ($1.1) $0.3 ($1.2) $0.1 ($0.1)
Net Loss ($M)
GAAP ($5.8) ($1.3) ($1.9) ($3.9) ($0.2)
Non-GAAP ($0.8) $2.1 $0.2 ($1.0) $0.7
EPS
GAAP ($0.21) $3.14 ($0.05) ($0.16) $2.56
Non-GAAP ($0.03) $0.13 $0.01 ($0.04) $0.05

40Private & Confidential February 2015
Highly Diversified Revenue Profile
Americas47%EMEA
38%
Asia15%
REVENUE PROFILEBY REGION 2013
SW Products78%
Maint. Services
22%
REVENUE PROFILEBY COMPONENT 2013
Direct 48%
Channel Partners
52%
REVENUE PROFILEBY SOURCE 2013
Voice& Video
34%Enhanced Messaging
66%
REVENUE PROFILEBY PRODUCT 2013
Americas52%
EMEA35%
Asia13%
YTD 3Q14
SW Products
81%
Maint.Services
19%
YTD 3Q14
Voice& Video
69%
EnhancedMessaging
31%
YTD 3Q14
Direct68%
ChannelPartners
32%
YTD 3Q14
41Private & Confidential February 2015
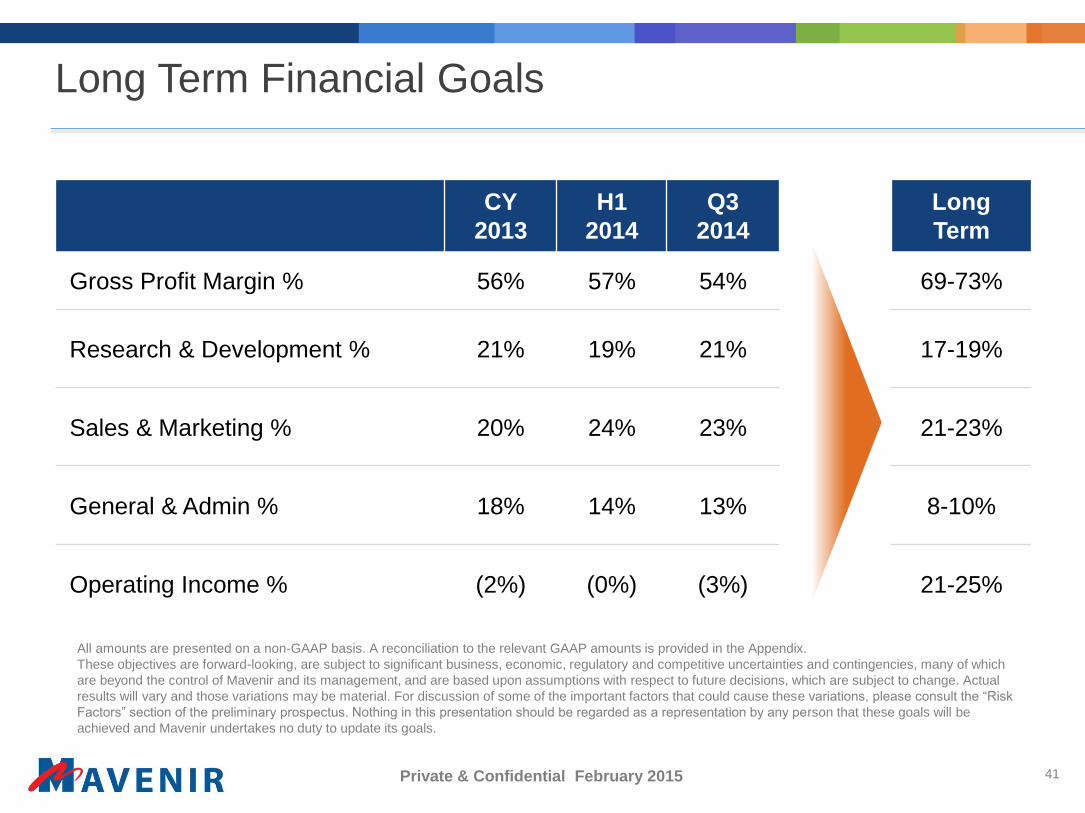
Long Term Financial Goals
CY
2013
H1
2014
Q3
2014
Long
Term
Gross Profit Margin % 56% 57% 54% 69-73%
Research & Development % 21% 19% 21% 17-19%
Sales & Marketing % 20% 24% 23% 21-23%
General & Admin % 18% 14% 13% 8-10%
Operating Income % (2%) (0%) (3%) 21-25%
All amounts are presented on a non-GAAP basis. A reconciliation to the relevant GAAP amounts is provided in the Appendix.
These objectives are forward-looking, are subject to significant business, economic, regulatory and competitive uncertainties and contingencies, many of which
are beyond the control of Mavenir and its management, and are based upon assumptions with respect to future decisions, which are subject to change. Actual
results will vary and those variations may be material. For discussion of some of the important factors that could cause these variations, please consult the “Risk
Factors” section of the preliminary prospectus. Nothing in this presentation should be regarded as a representation by any person that these goals will be
achieved and Mavenir undertakes no duty to update its goals.

Private & Confidential February 2015
Transforming Mobile Networks from 2G/3G to 4G LTE
Appendix

43Private & Confidential February 2015
Broad 4G Product Portfolio
Subscriber Data
HSS HLR UDR
Accounting
Online Offline
Service Platforms
SCPs OSA/Parlay Web 2.0
Policy
Anti-Spam Anti-Virus
Legacy Networks
SMS MMS Email
RMSTAS PRS
Session ControlMGCF
IBCF
XDMS
Oauth
Mavenir Product
DRA
Session Border
EATF E-CSCF ATCF
P-CSCF ATGW
CCF
Voice
HSS/ENUM FE
LRF
IBCF
PCRF
3rd Party Partner
Existing Equipment
I-CSCF S-CSCF BGCFE-CSCF
LI MF
Evolved Packet Core
SGW PGW ePDG
EIR
VoLTE IWF
SR-VCC CSFB IM-SSF VVM
PS RLS SMSC HNR
MMSCRCS
IPSM-GW
MRF
UDR
HLR
AAA
ENUM
NP
MME
mStore™
IMAPVVM
AG
A-SBC
WebRTC
EATF LRF
VCCMMTELSCC
IPX Proxy
HSS
44Private & Confidential February 2015
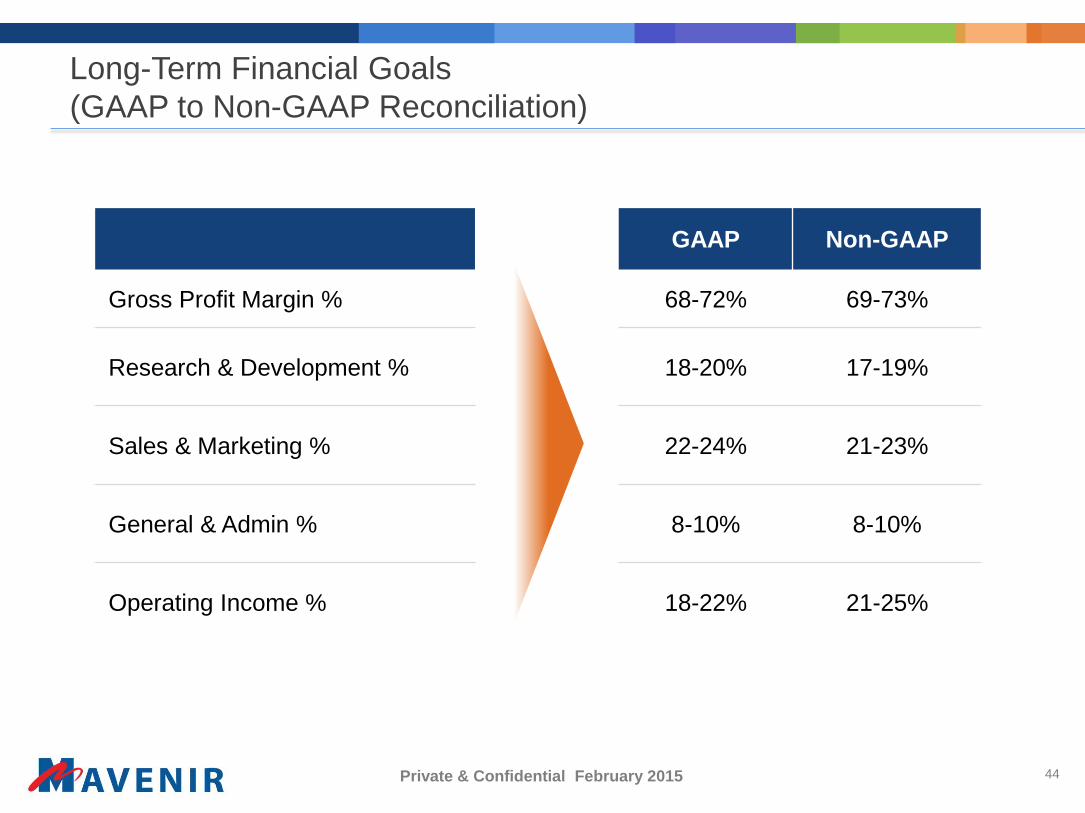
Long-Term Financial Goals
(GAAP to Non-GAAP Reconciliation)
GAAP Non-GAAP
Gross Profit Margin % 68-72% 69-73%
Research & Development % 18-20% 17-19%
Sales & Marketing % 22-24% 21-23%
General & Admin % 8-10% 8-10%
Operating Income % 18-22% 21-25%

45Private & Confidential February 2015
Q3 2014 Results
(Non-GAAP Net Loss Reconciliation)
*(Note: 000’s USD except share and per share data)
Three Months Ended
30-Sep-14
Total Revenue $34,052
Gross Profit (GAAP) $17,982
Amortization and Depreciation 279
Stock Based Compensation 221
Gross Profit (Non-GAAP) $18,482
Operating Income (GAAP) ($3,837)
Amortization and Depreciation 1,336
Stock Based Compensation 1,357
Operating Income (Non-GAAP) ($1,144)
Net Interest $404
Pre-Tax Income ($1,548)
Income Taxes (GAAP) ($657)
Adjustment for Uncertain Tax Provisions (102)
Net Loss (Non-GAAP) ($789)
Adjusted weighted average common shares outstanding 27,392,000
Non-GAAP Net Loss Per Share ($0.03)