TERR–14 MULE DEER - SCE · Each observer was equipped with binoculars and the person at the...
32
Copyright 2003 by Southern California Edison Company TERR-14-1 September 2003 TERR–14 MULE DEER 1.0 EXECUTIVE SUMMARY In 2001 and 2002, the literature review, a camera feasibility study, the Mammoth Pool migration study (observation study, boat survey, and remote camera study), and a hunter access study were completed. A map of known mule deer summer and winter ranges, migration corridors, and holding areas was created based on the literature review. The camera feasibility study was conducted in the fall of 2001 to test the remote camera system for the spring 2002 remote camera study. The cameras were successful at capturing photographs of 82 animals, including photographs of six deer, during this testing period. The Mammoth Pool migration study consisted of an observation study, boat survey, and remote camera study. The study focused on documenting key migration routes across the reservoir and relative use, identifying potential migration barriers, and documenting any deer mortality in the reservoir. The observation study consisted of two observers positioned with binoculars at two observation points on Mammoth Pool at dusk and dawn in order to observe migrating deer. There were no observations of deer using the dam road. Two observations of deer were made out of a total of 51 observation periods. One observation consisted of a single deer that swam from the Windy Point Boat Launch area to the Mammoth Pool Boat Launch area. The other observation was of one group of five adult deer approaching the reservoir near the observation point by the Mammoth Pool Boat Launch, but turning back up the hill. There was no sign of difficulty in the deer swimming or exiting the reservoir and no obvious disturbance to the deer that turned back. Four boat surveys were conducted to detect potential migration routes upstream of the observation points where it was inaccessible except by boat. Many tracks were detected along the shoreline. However, it was difficult to determine if the tracks were made by deer in all cases and if the deer were moving towards or away from the water, if they were migrating across the lake, or if they were foraging near the shoreline. One deer was observed swimming the reservoir in the vicinity of Mill Creek from west to east during the boat survey. No difficulty in swimming or exiting the reservoir was observed. There were no carcasses or migration barriers detected. Three remote cameras (Photoscout and Photohunter from Highlander Sports, Inc., Huntsville, Alabama) were placed along the road over Mammoth Pool Dam in order to detect deer using the road. A total of 231 photographs were obtained. Twenty- four of these photographs were of deer. All of the deer were adults. One deer was identified as male. The others were of unknown sex. Fourteen of the photographs had deer heading east with the migration, while four photographs had deer heading west. The majority of photographs were in the morning or evening. Therefore, these observations indicate that deer use the dam road during the migration period.
Transcript of TERR–14 MULE DEER - SCE · Each observer was equipped with binoculars and the person at the...
Copyright 2003 by Southern California Edison Company TERR-14-1 September 2003
TERR–14 MULE DEER
1.0 EXECUTIVE SUMMARY
In 2001 and 2002, the literature review, a camera feasibility study, the Mammoth Poolmigration study (observation study, boat survey, and remote camera study), and ahunter access study were completed. A map of known mule deer summer and winterranges, migration corridors, and holding areas was created based on the literaturereview.
The camera feasibility study was conducted in the fall of 2001 to test the remotecamera system for the spring 2002 remote camera study. The cameras weresuccessful at capturing photographs of 82 animals, including photographs of six deer,during this testing period.
The Mammoth Pool migration study consisted of an observation study, boat survey,and remote camera study. The study focused on documenting key migration routesacross the reservoir and relative use, identifying potential migration barriers, anddocumenting any deer mortality in the reservoir. The observation study consisted oftwo observers positioned with binoculars at two observation points on Mammoth Poolat dusk and dawn in order to observe migrating deer. There were no observations ofdeer using the dam road. Two observations of deer were made out of a total of 51observation periods. One observation consisted of a single deer that swam from theWindy Point Boat Launch area to the Mammoth Pool Boat Launch area. The otherobservation was of one group of five adult deer approaching the reservoir near theobservation point by the Mammoth Pool Boat Launch, but turning back up the hill.There was no sign of difficulty in the deer swimming or exiting the reservoir and noobvious disturbance to the deer that turned back.
Four boat surveys were conducted to detect potential migration routes upstream ofthe observation points where it was inaccessible except by boat. Many tracks weredetected along the shoreline. However, it was difficult to determine if the tracks weremade by deer in all cases and if the deer were moving towards or away from thewater, if they were migrating across the lake, or if they were foraging near theshoreline. One deer was observed swimming the reservoir in the vicinity of MillCreek from west to east during the boat survey. No difficulty in swimming or exitingthe reservoir was observed. There were no carcasses or migration barriers detected.
Three remote cameras (Photoscout and Photohunter from Highlander Sports, Inc.,Huntsville, Alabama) were placed along the road over Mammoth Pool Dam in orderto detect deer using the road. A total of 231 photographs were obtained. Twenty-four of these photographs were of deer. All of the deer were adults. One deer wasidentified as male. The others were of unknown sex. Fourteen of the photographshad deer heading east with the migration, while four photographs had deer headingwest. The majority of photographs were in the morning or evening. Therefore, theseobservations indicate that deer use the dam road during the migration period.
Terrestrial Resources TERR-14 Mule Deer
Copyright 2003 by Southern California Edison Company TERR-14-2 September 2003
The hunter access study information is included in REC-12, Hunting.
2.0 STUDY OBJECTIVES
• Determine the location of deer holding areas, summer and winter habitat areas,and migration routes. Identify and characterize areas of deer mortality at Projectfacilities (i.e., Mammoth Pool) during migration.
3.0 STUDY IMPLEMENTATION
3.1 STUDY ELEMENTS COMPLETED
• Compiled information on mule deer holding areas, key winter and summerranges, and migration corridors based on a review of existing literature anddatabases and through agency consultation. Mapped these important deer areasand incorporated into a GIS database.
• Collected information on mule deer migration (timing, numbers, barriers, andmortality) along key migration routes near Project facilities, bypass and flow-augmented reaches, and recreational facilities through literature review andagency consultation.
• Monitored mule deer migration at Mammoth Pool Reservoir in the field todocument deer survival when migrating across the reservoir. Conducted focuseddeer migration studies, consisting of observation studies, boat surveys, andremote camera surveys, at Mammoth Pool. Recorded incidental observations ofmule deer during other field surveys conducted for the Big Creek ALP.
• Assessed SCE’s and CDFG’s existing mitigation measures for deer at MammothPool Reservoir to determine current status and adequacy.
• Created a GIS map depicting important deer areas and ALP Project roads andtransmission lines in order to address the potential for increased deer harvestassociated with Project facilities. Determined areas of concern based on overlapof these layers. Visited each area of concern in the fall of 2002 to assessvulnerability of migrating deer.
3.2 OUTSTANDING STUDY ELEMENTS
• Evaluate existing deer mitigation measures, implemented for the construction ofthe Balsam Meadows (Eastwood Power Station) Project, on SCE-owned landsaround Shaver Lake.
• Assess the potential effect on migrating deer of any proposed controlled flowreleases by SCE (i.e., whitewater boating releases) necessary to completerelicensing studies in the Big Creek Study Area.
Terrestrial Resources TERR-14 Mule Deer
Copyright 2003 by Southern California Edison Company TERR-14-3 September 2003
4.0 STUDY METHODOLOGY
4.1 REVIEW OF EXISTING INFORMATION
During 2001 and 2002, a literature review was conducted. Appendix A provides acomplete list of literature reviewed for this study plan. Information on mule deermigration (e.g., timing, numbers, barriers, and mortality) along key migration routesnear Project facilities, bypass and flow-augmented reaches, and recreational facilitieswere collected from existing literature and through agency consultation. Importantmule deer areas (i.e., summer and winter ranges, holding areas, and migrationcorridors) identified from the literature review were mapped and incorporated into aGIS database (Figure TERR-14-1).
4.2 CAMERA FEASIBILITY STUDY
During the fall of 2001, a feasibility study was conducted to test the multiple remotecamera systems proposed for monitoring deer migration at Mammoth Pool Reservoir.Information from this feasibility study was used to assist in the design andimplementation for the deer migration study at Mammoth Pool reservoir in spring2002. In the fall of 2001, three cameras were provided by USDA-FS and consisted oftwo Photoscout models and one Photohunter model (Highlander Sports, Inc.,Huntsville, Alabama). Locations for the cameras were selected and approved by theTerrestrial Resources Working Group (Figure TERR-14-2a through b). One camerawas located east of the dam, one camera was placed between the dam and thespillway, and one camera was west of the spillway. The cameras were placed inthese locations in order to attempt to discern whether deer were using the dam roadto cross the reservoir. Cameras were placed among vegetation on the roadside onMammoth Pool Dam Road in areas where the road was wide and vegetation waspresent on both sides of the road to prevent startling deer into jumping off the road.Cameras were installed on October 11, 2001; checked on October 16 to replace film,change batteries, and make repairs if necessary; and removed on October 23.
4.3 MAMMOTH POOL RESERVOIR MIGRATION STUDY
Deer migration at Mammoth Pool Reservoir was studied during the spring migrationperiod in 2002. The study focused on documenting key migration routes across thereservoir and relative use; identifying potential migration barriers in the reservoir oralong the shoreline; and documenting any deer mortality in the reservoir. Threetypes of surveys were completed to characterize deer migration at Mammoth Pool,including observations from fixed locations, observations during boat surveys alongthe perimeter of the reservoir, and photographs of migrating deer collected fromremote cameras. The following describes each of these surveys.
OBSERVATION STUDY
An observation study was conducted in order to collect information on deer migratingacross the reservoir, to document any observed difficulty in crossing, entering, or
Terrestrial Resources TERR-14 Mule Deer
Copyright 2003 by Southern California Edison Company TERR-14-4 September 2003
exiting the reservoir, and to document any observed drowning. During deer migrationstudies at Mammoth Pool, observations of migrating deer were conducted in two, 1.5-hour blocks, at dawn and dusk from April 15 to June 10, 2002. The initial surveys,beginning in April, were conducted three days a week. Surveys continued at thatfrequency through the week of May 12 when peak migration was anticipated basedon higher frequency of incidental deer encounters in the Mammoth Pool vicinity.Survey frequency then increased to four days per week for the next two weeks, andthen tapered from four to three to two to one day per week until the week of June 9.Dusk observations were conducted from approximately 19:00 – 20:30 hours (hrs),and dawn observation periods were conducted from approximately 05:30 – 07:00hrs.
During each survey, one observer was stationed at the Mammoth Pool Boat Launchand a second observer was stationed at the Windy Point Boat Launch (Figure TERR-14-2a through b). The Mammoth Pool Boat Launch was selected and approved bythe Terrestrial Resources Working Group as an observation point because it affordedthe widest view of the reservoir, of all the sites accessible, and provided a view of theroad across the dam from a distance. This limited the potential for disturbance todeer crossing the dam. The Windy Point Boat Launch was selected and approved bythe Terrestrial Resources Working Group as an observation point because it waseasily accessible and provided a wide view of the reservoir, including an areadocumented to be a key migration route for deer in a previous deer study at thereservoir (Peabody et al. 1978). This location is not visible from the Mammoth PoolBoat Launch.
Each observer was equipped with binoculars and the person at the Mammoth PoolBoat Launch was also equipped with a spotting scope to remotely monitor deermigration from a distance to reduce disturbance. At each location, the observersrecorded the time and number of deer crossing, the age-class and sex of migratingdeer (if possible), the paths they took to cross (e.g., use of the road that crosses thecrest of the dam or swimming across the reservoir), temperature, qualitative windspeed and direction, and any observed difficulty in crossing or in entering and exitingthe reservoir.
BOAT SURVEY
Boat surveys were conducted in order to identify key migration trails and relative use(based on tracks), to identify any migration barriers, and to document any deercarcasses. Four boat surveys were conducted on May 1, May 7, May 15, and May21, 2002, along the entire shoreline of Mammoth Pool to identify key deer migrationtrails and relative use (based on tracks). Surveys were conducted between 10:00and 14:00 hrs, when deer are less active, to create the least disturbance for migratingdeer. The entire shoreline of the reservoir was slowly boated by two biologists whoexamined the shoreline with binoculars. When evidence of tracks was detected, theboat was docked and the biologists examined the tracks to determine if they werefrom deer and if they were approaching or leaving the water. In general, tracks weredifficult to identify to species and difficult to determine if they were approaching or
Terrestrial Resources TERR-14 Mule Deer
Copyright 2003 by Southern California Edison Company TERR-14-5 September 2003
leaving the reservoir because of the coarse, loose sand that was present along manyareas of the shoreline. All tracks observed were recorded during each surveyregardless of whether they were counted during a previous survey due to thedifficulty in erasing tracks so they would not be recounted. Therefore, tracks wererecounted on subsequent visits. Data collected included GPS coordinates, numberof tracks, entry or exit, slope of bank, substrate, and any deer access problems. Thelocation of any migration barriers along the shoreline or in the reservoir was noted.During these surveys, the location and number of any deer carcasses were recorded.All key deer migration trails, migration barriers, and deer carcasses observed duringthe survey were mapped on a 7.5-minute quadrangle USGS map and incorporatedinto a GIS layer (Figure TERR-14-3a through d).
REMOTE CAMERA STUDY
A remote camera study was conducted to obtain information on deer using the roadon the crest of the dam. Three remotely-triggered, infrared beam cameras obtainedphotographs of deer using the road on the crest of the dam during the spring 2002migration period. Cameras were provided by USDA-FS and consisted of thePhotoscout model (Highlander Sports, Inc., Huntsville, Alabama). For a short time,a Trailmaster TM500 Passive Infrared Trail Monitor (Goodson and Associates, Inc.,Lenexa, Kansas) was also used when one of the Photoscout models was inoperable.One camera was set up east of the dam, one camera was located between the damand the spillway, and the third camera was west of the spillway (Figure TERR-14-2athrough b). Three cameras were set up in order to capture deer traveling the lengthof the road. It appeared that, on at least one occasion, the same deer wasphotographed in multiple cameras as he traveled the road in the fall camerafeasibility study. However, the deer are unmarked, and such observations are basedon the appearance of the antlers on males. In the spring study, males do not havewell-developed antlers. Therefore, it was not known whether the same deer werephotographed multiple times. The cameras were placed among vegetation on theroadside in areas where the road was wide and vegetation was present on both sidesof the road to prevent startling deer into jumping off the road. Cameras were set upon April 16, 2002. Cameras were checked approximately twice a week to replacefilm, change batteries, and make repairs, if necessary. Cameras were removed onJune 5. Information on the timing, number, age-class, and sex (if possible) of deermigrating across the dam road was documented.
4.4 EVALUATION OF DEER MITIGATION MEASURES AT MAMMOTH POOL
SCE maintains existing mitigation measures for deer in the Mammoth Pool Damarea. The background on development of these mitigation measures is providedbelow.
Deer migration was monitored intermittently from 1958 to 1975 by CDFG, USDA-FS,and SCE to document deer losses, problems, and behavior associated with theconstruction of Mammoth Pool Reservoir (Peabody et al. 1978). It was determinedthat spring deer migration across Mammoth Pool Reservoir is usually in progress by
Terrestrial Resources TERR-14 Mule Deer
Copyright 2003 by Southern California Edison Company TERR-14-6 September 2003
the first of May, with peak numbers crossing from May 15 to June 15. In the fall,there is usually movement across Mammoth Pool Reservoir by late October. Formost years, migration was found to be well underway before heavy snow occurred.The major river crossings found to be used by deer in this area include: 1)Chawanakee, often fording Dam No. 6; 2) below the junction of the San JoaquinRiver and Rock Creek; 3) the confluence of Shake Flat Creek and the San JoaquinRiver; 4) the old Mammoth Pool area, which is the present reservoir site; and 5) theChina Bar area at the confluence of Jackass Creek and the river, which is also part ofthe present reservoir.
Significant losses occurred at the diversion tunnel during construction and at thespillway after construction during the spring when deer were migrating through thearea. Deer mortality was also determined to be caused by the Daulton Creekdiversion, trash buildup at points where deer were trying to swim the reservoir, andharassment from recreational activities on the reservoir. Boating on the reservoir isnow closed until mid-June, when most deer have migrated through the area. Anoverhanging barrel line and a fence that continues down to the reservoir have forceddeer to either cross at the bridge or swim outside of the barrel line, rather thancrossing in front of the spillway (Peabody et al. 1978).
SCE implemented agency-recommended measures to mitigate for the loss of deer atMammoth Pool Reservoir when the reservoir was constructed. These measuresinclude fencing, buoys, bridges, and sand placement on the dam to aid in deercrossing, which are described below in the results. During the focused deermigration studies described above, the numbers, response, and behavior for anydeer observed at these facilities was documented. This information was used toevaluate the effectiveness of these mitigation measures. The facilities were alsoexamined to determine if they are being maintained.
4.5 DEER HUNTER ACCESS STUDY
To address the potential for increased deer harvest associated with Project facilitiesand bypass and flow-augmented reaches, a GIS map was produced depicting keydeer migration corridors, Project transmission line corridors, and Project roads.Areas of overlap were identified based on these layers. At each area of overlap, asite visit was conducted from September 23 to 24, 2002, to assess vulnerability ofmigrating deer, including documentation of vegetation screening along the roadwayand the presence of adjacent parking areas. Refer to REC-12, Hunting, for a moredetailed methodology.
5.0 STUDY RESULTS AND ANALYSIS
5.1 REVIEW OF EXISTING INFORMATION
Mule deer are a Sierra National Forest Management Indicator Species. A map ofknown mule deer summer and winter ranges, migration corridors, and holding areaswas created based on the literature review. Figure TERR-14-1 provides the
Terrestrial Resources TERR-14 Mule Deer
Copyright 2003 by Southern California Edison Company TERR-14-7 September 2003
comprehensive map, and Figures TERR-14-2a through b, TERR-14-3a through d,TERR-14-4a through c, and TERR-14-5a through c present the information fromeach data source for clarity. In the central Sierra, mule deer inhabit winter ranges atelevations of 1,200 to 3,600 feet from early October through mid-May (Holl et al.1979). In the spring, they remain at their winter ranges at an average elevation of3,400 feet until mid-May, and then begin a gradual upward movement, depending onsnow pack (Loft et al. 1989). During the summer, mule deer are commonly found at6,000 to 10,000 feet from late May to early November (Holl et al. 1979). The SanJoaquin deer herd, the herd in the Big Creek ALP Project vicinity, ranges from about2,000 feet along the San Joaquin River up to about 12,000 feet along the crest of theSierra. They are commonly found in the summer from 6,500 to 8000 feet, whereoptimum habitat occurs. Deer commonly spend winter at 1,500 to 4,500 feet (CDFG1983). A large number of deer using the summer range in Fresno County, winter onthe north side of the San Joaquin River in Madera County. This indicates that atleast half of the population must cross the San Joaquin River while migratingbetween summer and winter ranges (Peabody et al. 1978).
Population estimates for the San Joaquin deer herd ranged from 1,901 to 11,480from 1953 to 1981. Population estimates were highest during the 1950’s and lowestduring the early to mid-1970’s (CDFG 1983). The San Joaquin deer herd is dividedinto two population segments: the Huntington and South Fork segments. Populationgoals for the Huntington segment are to maintain 800 to 1,500 animals, andpopulation goals for the South Fork segment are to maintain a population of 2,000 to3,000 animals (CDFG 2000). There has been a steady reduction in the number ofbucks harvested in the South Fork segment, which may indicate that deer numbershave dropped significantly in this area (CDFG 2000). The Huntington segmentappears to be increasing in population (CDFG 2000).
The San Joaquin deer herd falls within the D7 deer hunting zone. The huntingseason for this zone begins the third weekend in September and lasts for 44consecutive days. There were 9,000 available tags in this zone, and the bag andpossession limit is one buck with a forked horn or better per tag. CDFG (2002)estimated hunter success at 10 percent for the D7 zone in 2001. In the South Forksegment, estimated number of bucks killed per year from 1990 to 1999 ranged from22 to 62, with an average of 44. In the Huntington segment, estimated number ofbucks killed per year from 1990 to 1999 ranged from 37 to 90, with an average of 50.
5.2 CAMERA FEASIBILITY STUDY
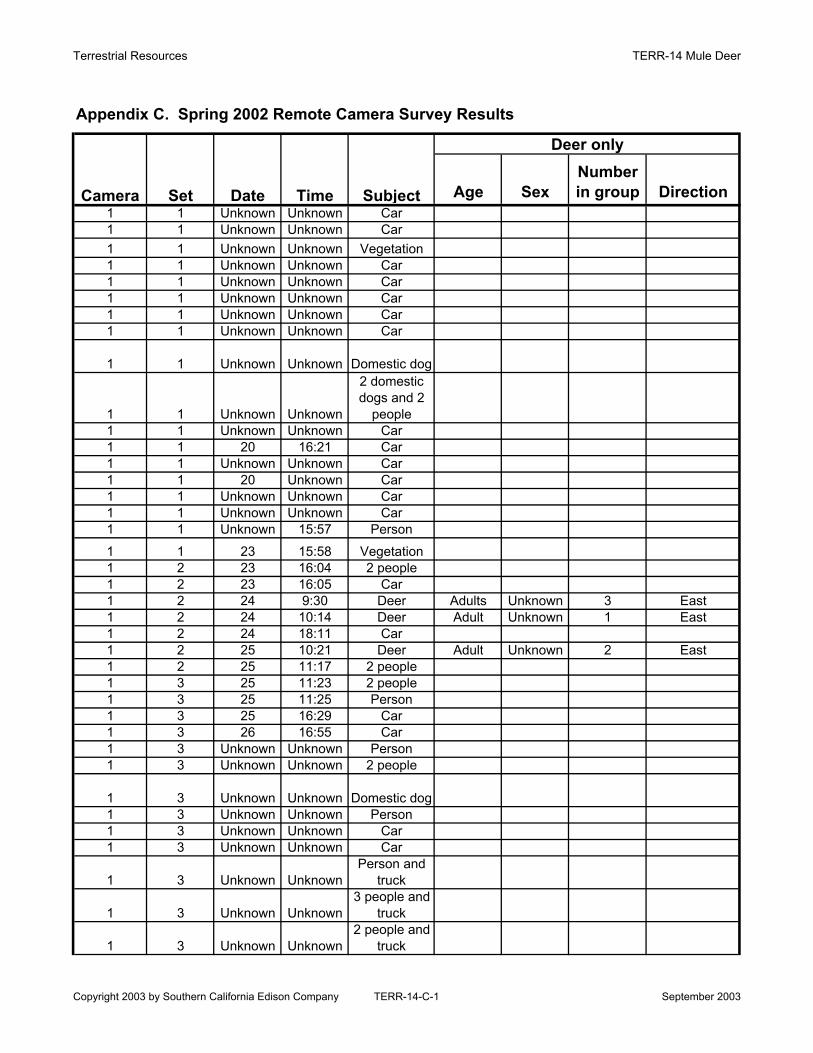
The cameras were successful at capturing photographs of animals using the damroad in the fall of 2001. There were a total of 29 photographs taken in Camera One,30 in Camera Two, and 23 in Camera Three. Camera One had one photograph of adeer (single male), 20 of cars, five of people, one of a domestic dog, and two ofvegetation. Camera Two had three photographs of deer (two of lone males and oneof a group of three does), two of gray fox (Urocyon cineroargenteus), one ofmountain lion (Felis concolor), two of black bear (Ursus americanus), one of western
Terrestrial Resources TERR-14 Mule Deer
Copyright 2003 by Southern California Edison Company TERR-14-8 September 2003
scrub jay (Aphelocoma californica), 20 of cars, and one of vegetation. Camera Threehad 23 photographs of cars. All of the deer photographs were taken at night.
Occasionally, vegetation moving in the wind would break the camera’s infrared beamand trigger a photograph. No problems were encountered with the cameras with theexception of a high number of cars. This should not be a problem for the springstudy when the road is closed. The cameras were reliable at obtaining photographs.The locations for the cameras were successful and suitable for the spring 2002 study.Cameras were checked only once a week during this feasibility study andoccasionally the film was empty upon checking. Frequency for camera checksshould be higher (at least twice a week) for the spring 2002 study based on thefeasibility study.
5.3 MAMMOTH POOL RESERVOIR MIGRATION STUDY
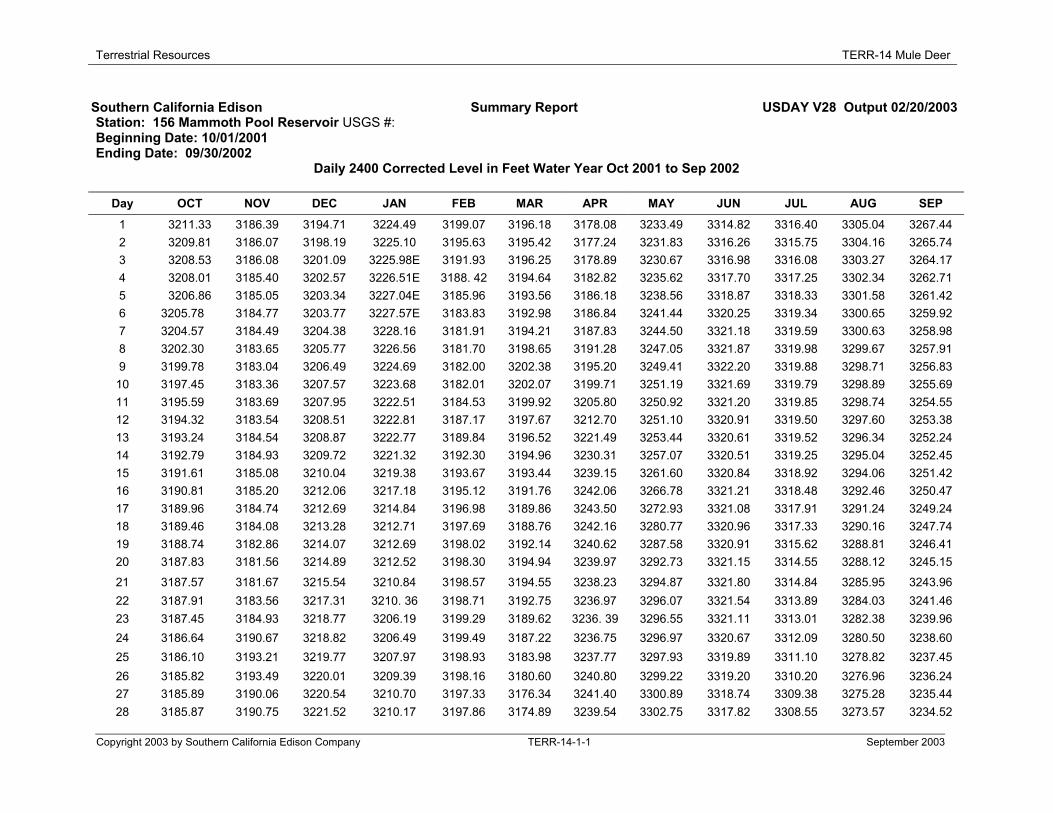
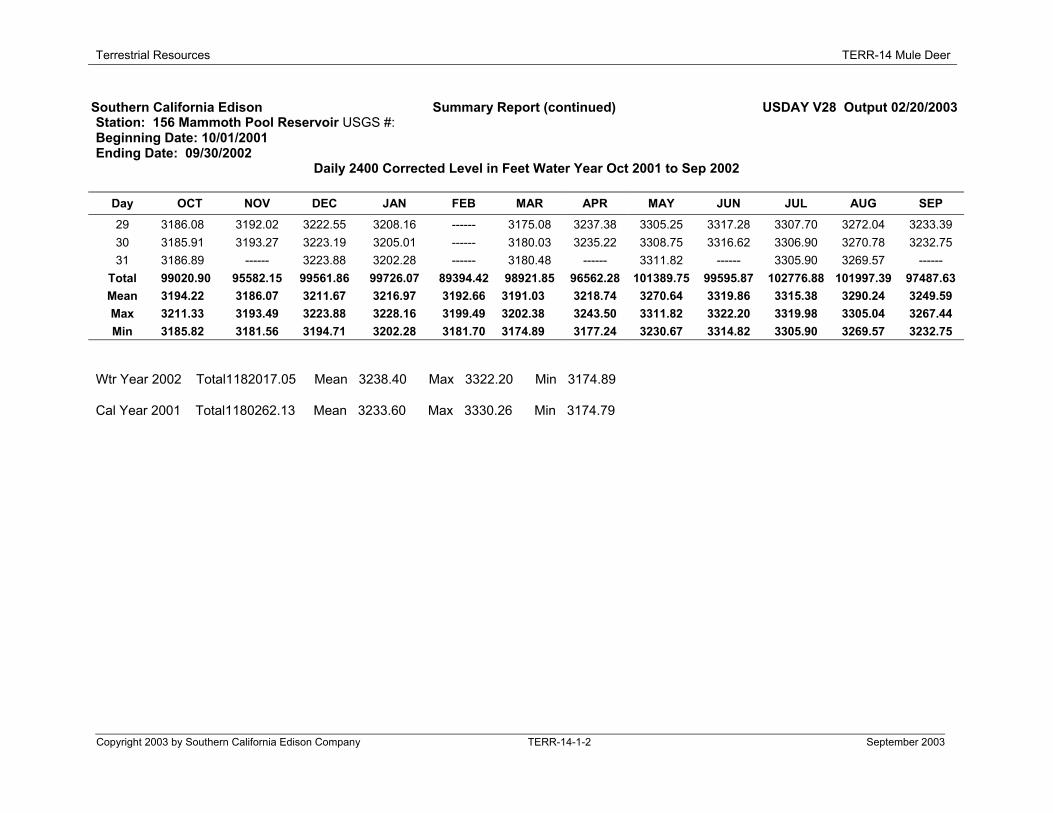
The Mammoth Pool Reservoir migration study was conducted from April 15 to June10, 2002. The reservoir elevation at Mammoth Pool during the study ranged from3,230 ft to 3,322 ft (Table TERR-14-1). The dam did not spill due to the low wateryear.
OBSERVATION STUDY
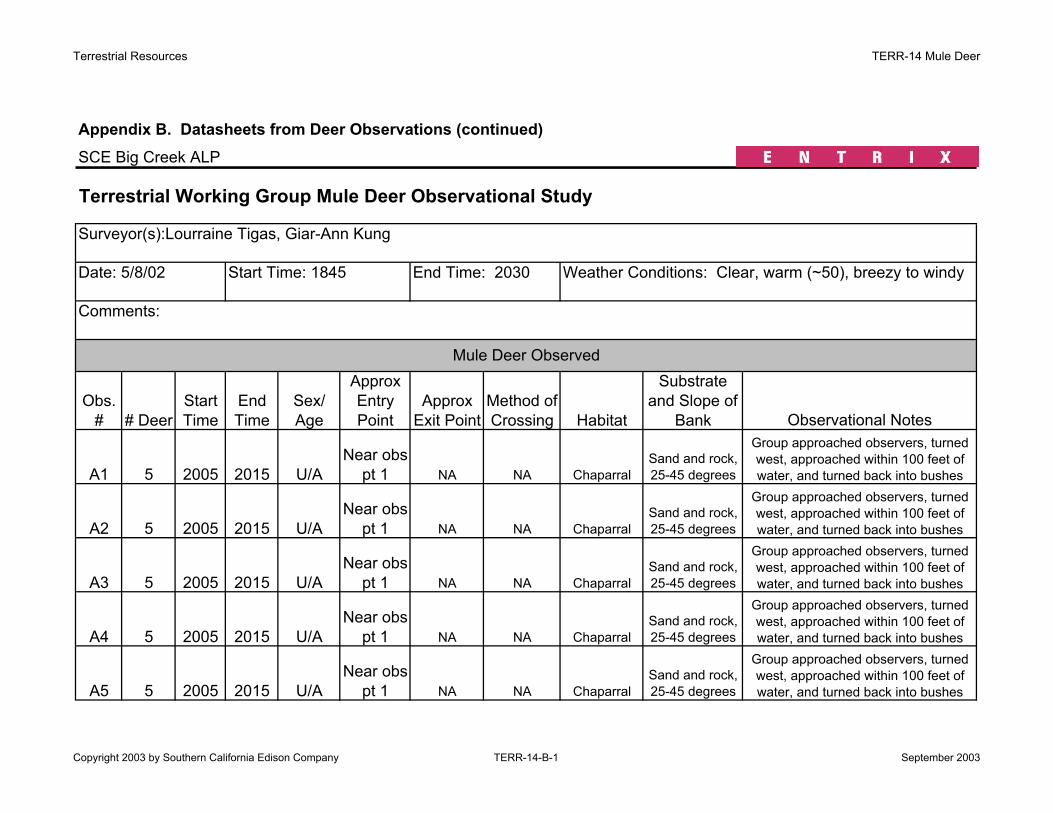
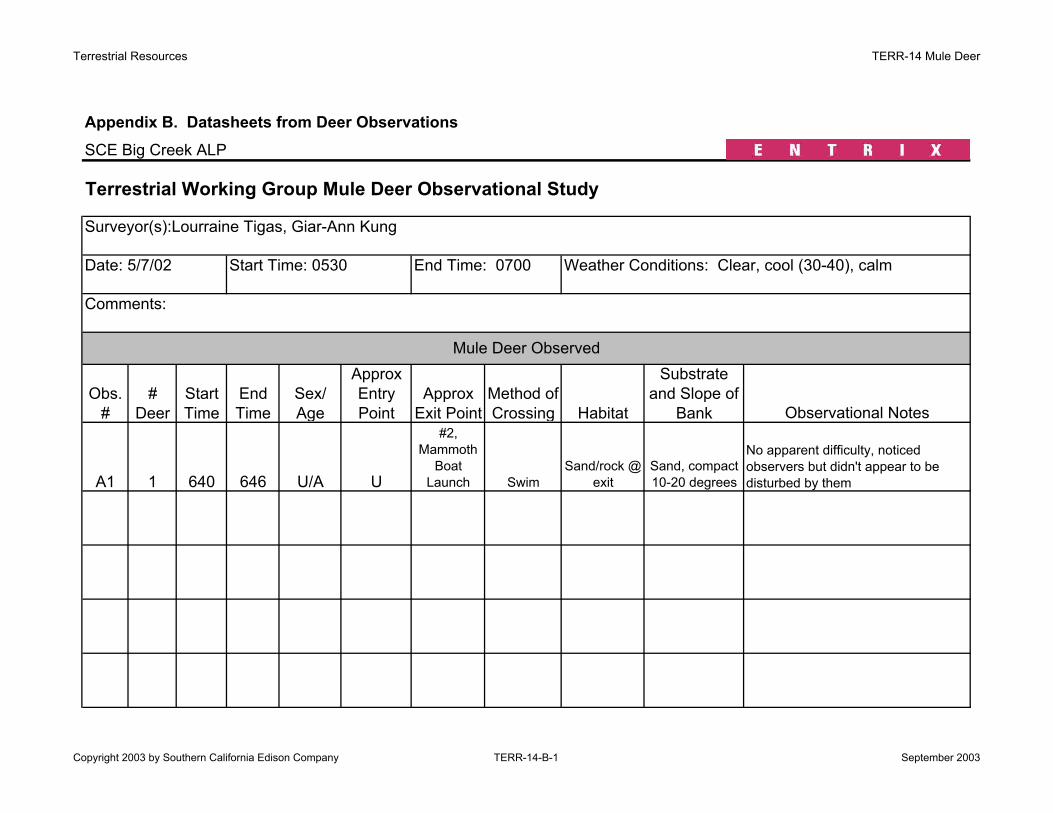
There were a total of 51 observation periods and two observations of deer in spring2002 (Appendix B). On May 7, 2002, at 06:40 hr, one deer, an adult of unknown sex,was observed swimming the reservoir from Windy Point Boat Launch to MammothPool Boat Launch (Figure TERR-14-2a through b). No difficulty in swimming orexiting the water was observed. Swim time was approximately 5 minutes. On May 8,2002, at 20:05, one group of five adult deer of unknown sex was observedapproaching the reservoir near Observation Point One, by the Mammoth Pool BoatLaunch, but turning back up the hill. There was no obvious disturbance to the deer.No deer were observed using the dam road during the observation study.
BOAT SURVEY
There were many tracks observed near the water’s edge during the spring 2002 boatsurvey (Figure TERR-14-3a through d). It was too difficult to erase the tracks and notrecount the same tracks. Instead, all tracks were recorded for each survey.Therefore, it is likely that some tracks were recounted during subsequent visits.Some tracks may be from deer watering and foraging and not necessarily migratingacross the lake. For example, we observed a group of deer foraging on plants on theshoreline. It was also difficult to positively identify the tracks to species and todetermine whether they were traveling to or from the water due to the coarse, loosesand. Best estimates were made, but much of this data was unknown.
There were hundreds of tracks detected. There were high concentrations of trackson both shores in the area of China Bar Campground and Fuller Meadow and acrossthe lake from the dam. During the boat survey, biologists observed a group of sevenadult deer foraging at the shoreline near the northernmost part of the reservoir. They
Terrestrial Resources TERR-14 Mule Deer
Copyright 2003 by Southern California Edison Company TERR-14-9 September 2003
also observed one deer swimming the reservoir in the vicinity of Mill Creek from westto east. No difficulty in swimming or exiting the reservoir was observed. There wereno deer carcasses, migration barriers, or areas with significant debris buildupdetected.
REMOTE CAMERA STUDY
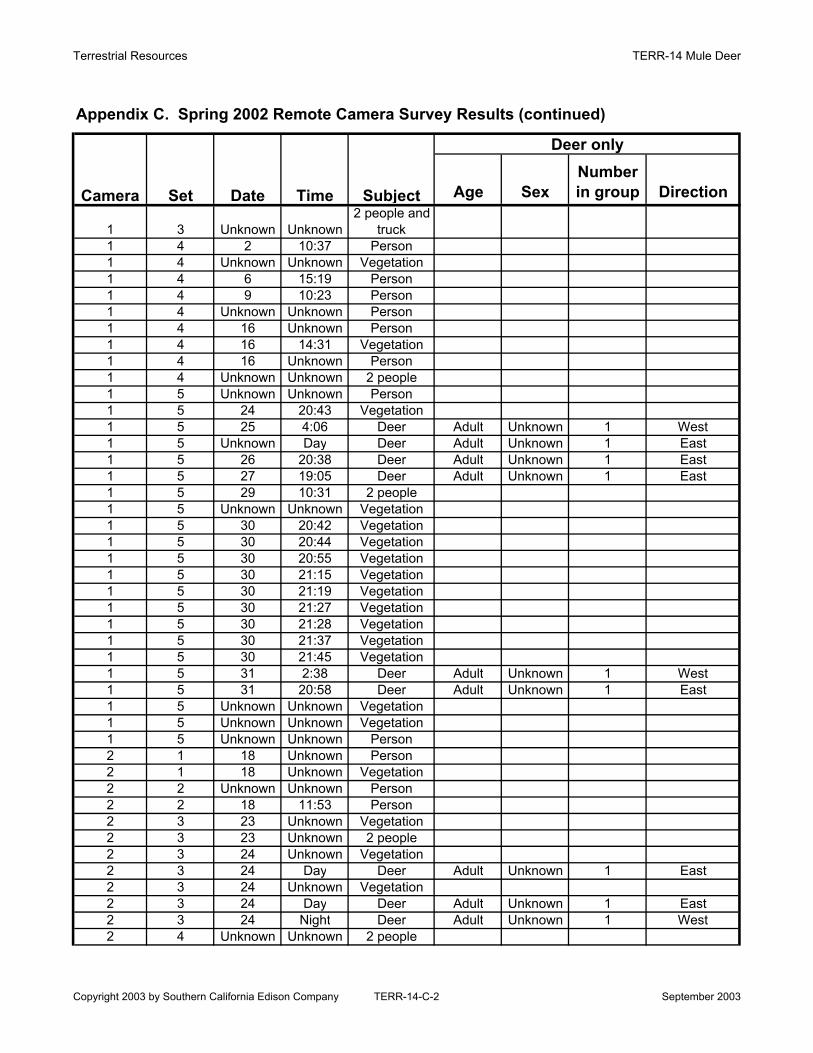
A total of 231 photographs were taken (Appendix C). Nineteen photographs of 24deer, all adults of mostly unknown sex, were obtained. Fourteen of the photographshad deer heading east with the migration, while four photographs had deer headingwest. The majority of the photographs were in the morning or evening. Therefore, itappears that deer do use the dam road during the migration period.
Camera One (east of the dam) had nine photographs of deer, 23 photographs ofcars, 17 of vegetation, two of domestic dog, and 19 of people for a total of 70photographs. All of the deer photographed were adults. Sex was unknown due tolack of antlers. Seven photographs were of single deer, one photograph contained agroup of three deer, and one photograph contained a group of two deer. All of thephotographs contained deer heading east with the migration, except for twophotographs of single deer heading west. Five photographs of deer were obtainedduring day hours (0700-1800 hrs) and four were obtained during night hours (1800-0700 hrs).
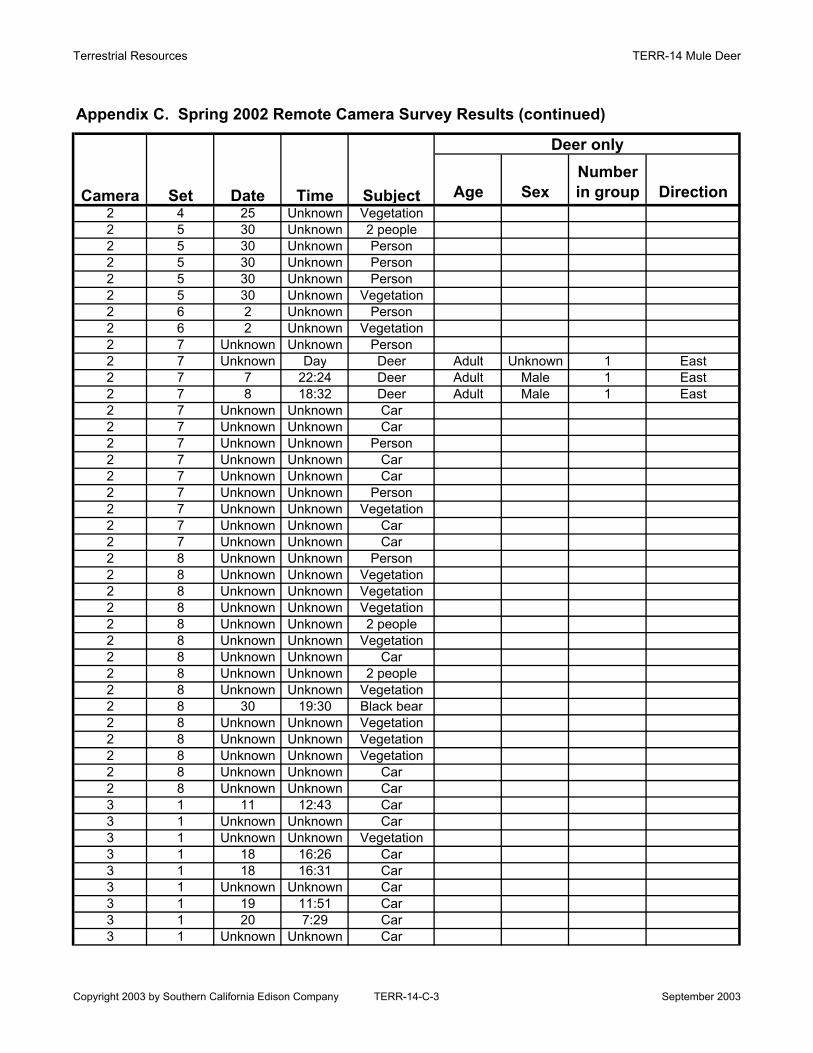
Camera Two (between the dam and the spillway) had six photographs of deer, one ofblack bear, nine of cars, 16 of vegetation, and 16 of people for a total of 48photographs. All of the deer photographed were adults. Four of the six deerphotographed were of unknown sex. Two deer were identified as males based onpresence of antlers. All of the photographs were of single deer. All but one of thedeer were heading east with the migration. Three deer photographs were obtainedduring the day, while three photographs were obtained at night.
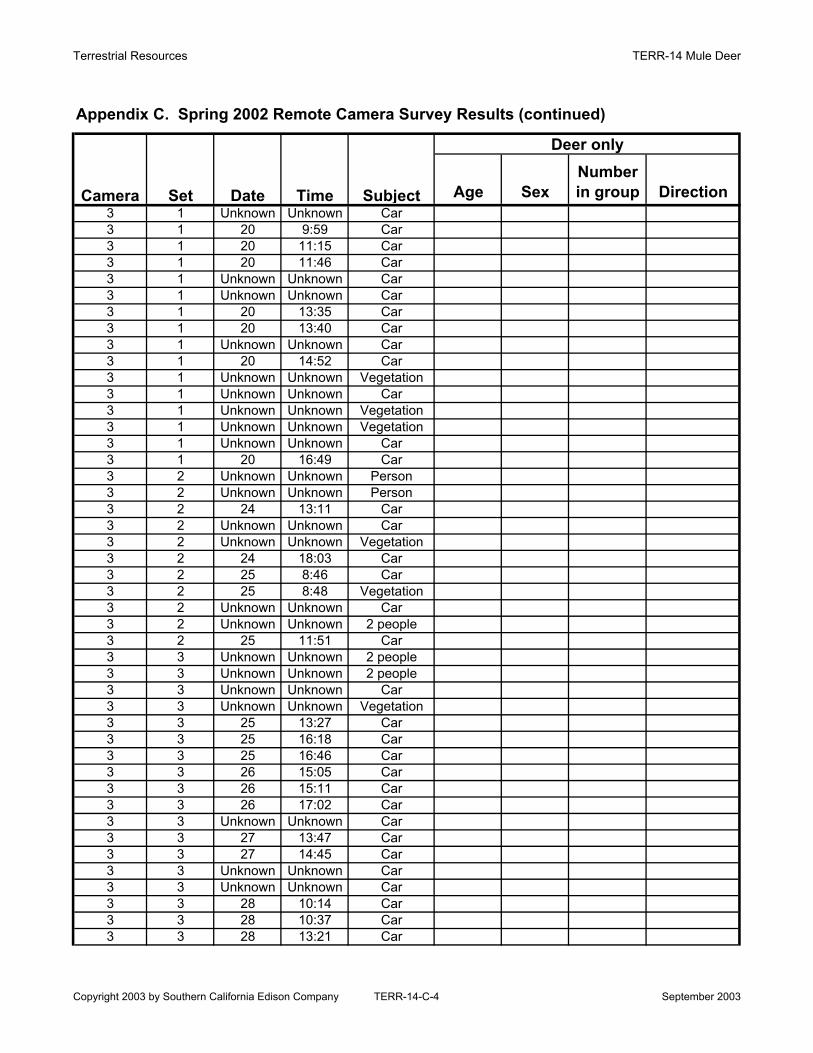
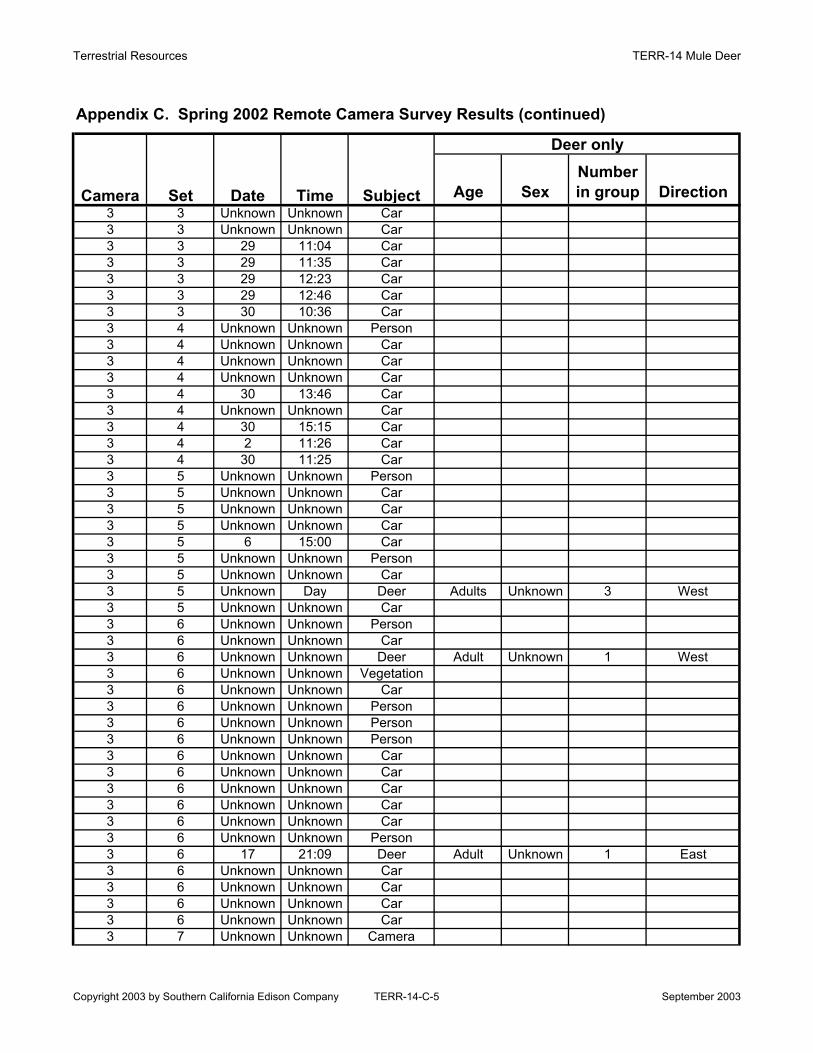
Camera Three (west of the spillway) had four photographs of deer, 84 of cars, eightof vegetation, one of the camera system, and 16 of people for a total of 110photographs. All of the deer photographed were adults of unknown sex. Onephotograph contained a group of three deer, while the other photographs were ofsingle deer. Two of the single deer were heading east with the migration, while thegroup of three deer and one single deer were heading west against the migration.Two photographs were obtained during the day, and two photographs were obtainedat night.
Deer detected in the cameras may or may not have been using the road in order tomigrate through the area. Some deer may have been on daily movements acrossthe road instead. This may be evidenced by the number of photographs of deertraveling east to west, against the migration direction for the spring. However,because of the timing (during the migration period) and the higher numbers of deercrossing west to east (the appropriate migration direction for the spring), it appearsthat some deer are using the road for migration.
Terrestrial Resources TERR-14 Mule Deer
Copyright 2003 by Southern California Edison Company TERR-14-10 September 2003
Several photographs of people and cars were obtained although the road was closedfor the majority of the study. These photographs were obtained before the road wasclosed or were photographs of SCE employees conducting regular maintenance orENTRIX employees conducting the ALP field studies. ENTRIX minimized its use ofthe road during the closure period as much as possible and limited use of the road tothe middle of the day when the deer were less likely to be using the road.
5.4 MITIGATION MEASURE EVALUATION
FENCING AND SAND PLACEMENT ON THE SPILLWAY
When Mammoth Pool was first constructed, there were reports of deer losses fromdeer jumping into the spillway after being frightened by cars or people (Peabody etal. 1978). SCE and USDA-FS began closing the road to Mammoth Pool Dam toprevent such impacts to the deer. SCE also installed fencing along the west side ofthe spillway in order to prevent deer from jumping into the spillway. Three inches ofsand were also placed on the bridge over the spillway to promote deer use in 1963.Peabody et al. (1978) reported that the fencing “seemed to be effective.” The fencingand sand placement are still well maintained by SCE. One deer was observed usingthe spillway in the middle of the day during the deer migration study when biologistswere checking the cameras along the road. This was the only deer observed in thearea of the spillway or dam.
LOG BOOM, BARREL LINE, AND FENCING BY SPILLWAY
When Mammoth Pool was first created, there were reports of deer trying to swim themouth of the spillway and being pulled into the spillway by the current when thereservoir was spilling (Peabody et al. 1978). Mammoth pool spilled for the first timein 1962. The Reservoir spilled for 69 days (May 3 to July 10). Recommendationswere made to move the log boom, which had been installed across the intake of thespillway for public safety, downstream below the migration trail. Losses still occurredduring a heavy runoff year in 1967, In the 1967 water year Mammoth Pool spilled fora total of 112 days (December 29 to February 3) probably due to a rain on snowevent and the generating units being offline. Mammoth Pool also spilled from May 22to August 4. SCE installed a barrel line attached to an underwater cable and builtanother fence blocking the trail west of the spillway. The fence was later continueddown into the water in the spring of 1968 and the barrel line was hung from a cableabove the spillway with each barrel on an individual line. Mammoth Pool did not spillin 2002. Therefore, there was no opportunity to observe deer near the mouth of thespillway while it was spilling. However, the fencing and the barrel line are still wellmaintained by SCE. There are no other records of lost deer to SCE’s knowledge.Mammoth Pool spills in approximately 50 percent of the years.
BRIDGE ON DAULTON CREEK
During the construction of Mammoth Pool, the lower portion of Daulton Creek wasdiverted so that its water could be stored in the reservoir and would not affect the
Terrestrial Resources TERR-14 Mule Deer
Copyright 2003 by Southern California Edison Company TERR-14-11 September 2003
integrity of the dam. This created a section of creek bed that was steep-sided andhazardous for deer to cross during high water flows (Peabody et al. 1978). A bridgewas constructed across the creek to aid in deer migration. Sand was place on thebridge in order to make it more acceptable for deer use. Peabody et al. (1978)reports little use of this bridge by deer. The bridge was repaired in the early spring of2002 and is in excellent condition. New sand was placed on the bridge during theearly spring as well. There were no deer observed using the bridge. Tracks wereobserved in the sand on the bridge. However, the tracks were not distinguishable tospecies in the coarse, loose sand.
DEBRIS BUILDUP
Trash buildup especially around the spillway area has caused deer losses due todrownings when deer were trapped in the debris. Peabody et al. (1978)recommended removal of trash buildup. SCE does not regularly remove large debrisfrom Mammoth Pool. It has not been a significant problem because usually whateverenters the reservoir is flushed during spill years, which average about 50 percent ofthe years. Debris buildup was not significant in 2002 since it was a low water year.Therefore, observations of deer near debris buildup could not be obtained.
RECREATION
Recreational activities in the Mammoth Pool area, particularly boating in the reservoirand cars and people on the dam road, have caused disturbance to deer in the past(Peabody et al. 1978). Disturbance from cars and people have forced deer to jumpinto the spillway before the fence was installed. This impact has been greatlyreduced by closing the reservoir to boating and by closing the road to the dam duringthe peak migration period (May 1 to June 15). USDA-FS is responsible for closingthe roads and boat launches every year. During 2002, the roads were closed ontime. No deer were observed while boats were in the water before the closureperiod. One deer was observed on the spillway while ENTRIX biologists drove theclosed road in the middle of the day. The deer crossed the spillway bridge and wentup a hill on the other side.
5.5 DEER HUNTER ACCESS STUDY
The deer hunter access study results are located in REC-12, Hunting.
Terrestrial Resources TERR-14 Mule Deer
Copyright 2003 by Southern California Edison Company TERR-14-12 September 2003
6.0 LITERATURE CITED
California Department of Fish and Game (CDFG). 1983. San Joaquin Deer HerdManagement Plan.
California Department of Fish and Game (CDFG). 2000. San Joaquin Deer HerdProgress Report (Fresno County Segments).
California Department of Fish and Game (CDFG). 2002. Big Game Hunting.
Holl, S.A., H. Salwasser, and B. Browning. 1979. The Diet Composition and EnergyReserves of California Mule Deer During Pregnancy. California Fish andGame 65(2): 68-79.
Loft, E.R., R.C. Bertram, and D.L. Bowman. 1989. Migration Patterns of Mule Deerin the Central Sierra Nevada. California Fish and Game 75(1): 11-19.
Peabody, E.A., W.W. Stewart, P.W. Shields, and N. Alstot. 1978. Deer Migrationand the Mammoth Pool Reservoir in Fresno and Madera Counties. CaliforniaDepartment of Fish and Game, Region 4.

TABL E
Terrestrial Resources TERR-14 Mule Deer
Copyright 2003 by Southern California Edison Company TERR-14-1-1 September 2003
Southern California Edison Summary Report USDAY V28 Output 02/20/2003Station: 156 Mammoth Pool Reservoir USGS #:Beginning Date: 10/01/2001Ending Date: 09/30/2002
Daily 2400 Corrected Level in Feet Water Year Oct 2001 to Sep 2002
Day OCT NOV DEC JAN FEB MAR APR MAY JUN JUL AUG SEP1 3211.33 3186.39 3194.71 3224.49 3199.07 3196.18 3178.08 3233.49 3314.82 3316.40 3305.04 3267.442 3209.81 3186.07 3198.19 3225.10 3195.63 3195.42 3177.24 3231.83 3316.26 3315.75 3304.16 3265.743 3208.53 3186.08 3201.09 3225.98E 3191.93 3196.25 3178.89 3230.67 3316.98 3316.08 3303.27 3264.174 3208.01 3185.40 3202.57 3226.51E 3188. 42 3194.64 3182.82 3235.62 3317.70 3317.25 3302.34 3262.715 3206.86 3185.05 3203.34 3227.04E 3185.96 3193.56 3186.18 3238.56 3318.87 3318.33 3301.58 3261.426 3205.78 3184.77 3203.77 3227.57E 3183.83 3192.98 3186.84 3241.44 3320.25 3319.34 3300.65 3259.927 3204.57 3184.49 3204.38 3228.16 3181.91 3194.21 3187.83 3244.50 3321.18 3319.59 3300.63 3258.988 3202.30 3183.65 3205.77 3226.56 3181.70 3198.65 3191.28 3247.05 3321.87 3319.98 3299.67 3257.919 3199.78 3183.04 3206.49 3224.69 3182.00 3202.38 3195.20 3249.41 3322.20 3319.88 3298.71 3256.8310 3197.45 3183.36 3207.57 3223.68 3182.01 3202.07 3199.71 3251.19 3321.69 3319.79 3298.89 3255.6911 3195.59 3183.69 3207.95 3222.51 3184.53 3199.92 3205.80 3250.92 3321.20 3319.85 3298.74 3254.5512 3194.32 3183.54 3208.51 3222.81 3187.17 3197.67 3212.70 3251.10 3320.91 3319.50 3297.60 3253.3813 3193.24 3184.54 3208.87 3222.77 3189.84 3196.52 3221.49 3253.44 3320.61 3319.52 3296.34 3252.2414 3192.79 3184.93 3209.72 3221.32 3192.30 3194.96 3230.31 3257.07 3320.51 3319.25 3295.04 3252.4515 3191.61 3185.08 3210.04 3219.38 3193.67 3193.44 3239.15 3261.60 3320.84 3318.92 3294.06 3251.4216 3190.81 3185.20 3212.06 3217.18 3195.12 3191.76 3242.06 3266.78 3321.21 3318.48 3292.46 3250.4717 3189.96 3184.74 3212.69 3214.84 3196.98 3189.86 3243.50 3272.93 3321.08 3317.91 3291.24 3249.2418 3189.46 3184.08 3213.28 3212.71 3197.69 3188.76 3242.16 3280.77 3320.96 3317.33 3290.16 3247.7419 3188.74 3182.86 3214.07 3212.69 3198.02 3192.14 3240.62 3287.58 3320.91 3315.62 3288.81 3246.4120 3187.83 3181.56 3214.89 3212.52 3198.30 3194.94 3239.97 3292.73 3321.15 3314.55 3288.12 3245.1521 3187.57 3181.67 3215.54 3210.84 3198.57 3194.55 3238.23 3294.87 3321.80 3314.84 3285.95 3243.9622 3187.91 3183.56 3217.31 3210. 36 3198.71 3192.75 3236.97 3296.07 3321.54 3313.89 3284.03 3241.4623 3187.45 3184.93 3218.77 3206.19 3199.29 3189.62 3236. 39 3296.55 3321.11 3313.01 3282.38 3239.9624 3186.64 3190.67 3218.82 3206.49 3199.49 3187.22 3236.75 3296.97 3320.67 3312.09 3280.50 3238.6025 3186.10 3193.21 3219.77 3207.97 3198.93 3183.98 3237.77 3297.93 3319.89 3311.10 3278.82 3237.4526 3185.82 3193.49 3220.01 3209.39 3198.16 3180.60 3240.80 3299.22 3319.20 3310.20 3276.96 3236.2427 3185.89 3190.06 3220.54 3210.70 3197.33 3176.34 3241.40 3300.89 3318.74 3309.38 3275.28 3235.4428 3185.87 3190.75 3221.52 3210.17 3197.86 3174.89 3239.54 3302.75 3317.82 3308.55 3273.57 3234.52
Terrestrial Resources TERR-14 Mule Deer
Copyright 2003 by Southern California Edison Company TERR-14-1-2 September 2003
Southern California Edison Summary Report (continued) USDAY V28 Output 02/20/2003Station: 156 Mammoth Pool Reservoir USGS #:Beginning Date: 10/01/2001Ending Date: 09/30/2002
Daily 2400 Corrected Level in Feet Water Year Oct 2001 to Sep 2002
Day OCT NOV DEC JAN FEB MAR APR MAY JUN JUL AUG SEP29 3186.08 3192.02 3222.55 3208.16 ------ 3175.08 3237.38 3305.25 3317.28 3307.70 3272.04 3233.3930 3185.91 3193.27 3223.19 3205.01 ------ 3180.03 3235.22 3308.75 3316.62 3306.90 3270.78 3232.7531 3186.89 ------ 3223.88 3202.28 ------ 3180.48 ------ 3311.82 ------ 3305.90 3269.57 ------
Total 99020.90 95582.15 99561.86 99726.07 89394.42 98921.85 96562.28 101389.75 99595.87 102776.88 101997.39 97487.63Mean 3194.22 3186.07 3211.67 3216.97 3192.66 3191.03 3218.74 3270.64 3319.86 3315.38 3290.24 3249.59Max 3211.33 3193.49 3223.88 3228.16 3199.49 3202.38 3243.50 3311.82 3322.20 3319.98 3305.04 3267.44Min 3185.82 3181.56 3194.71 3202.28 3181.70 3174.89 3177.24 3230.67 3314.82 3305.90 3269.57 3232.75
Wtr Year 2002 Total1182017.05 Mean 3238.40 Max 3322.20 Min 3174.89
Cal Year 2001 Total1180262.13 Mean 3233.60 Max 3330.26 Min 3174.79

FIGURES

Placeholder for Figures
Non-Internet Public Information
These Figures have been removed in accordance with the Commission regulationsat 18 CFR Section 388.112.These Figures are considered Non-Internet Public information and should not beposted on the Internet. This information is provided in Volume 4 of the Applicationfor New License and is identified as “Non-Internet Public” information. Thisinformation may be accessed from the FERC’s Public Reference Room, but is notexpected to be posted on the Commission’s electronic library, except as anindexed item.
APPENDIX A
Mule Deer Literature Review
Terrestrial Resources TERR-14 Mule Deer
Copyright 2003 by Southern California Edison Company TERR-14-A-1 September 2003
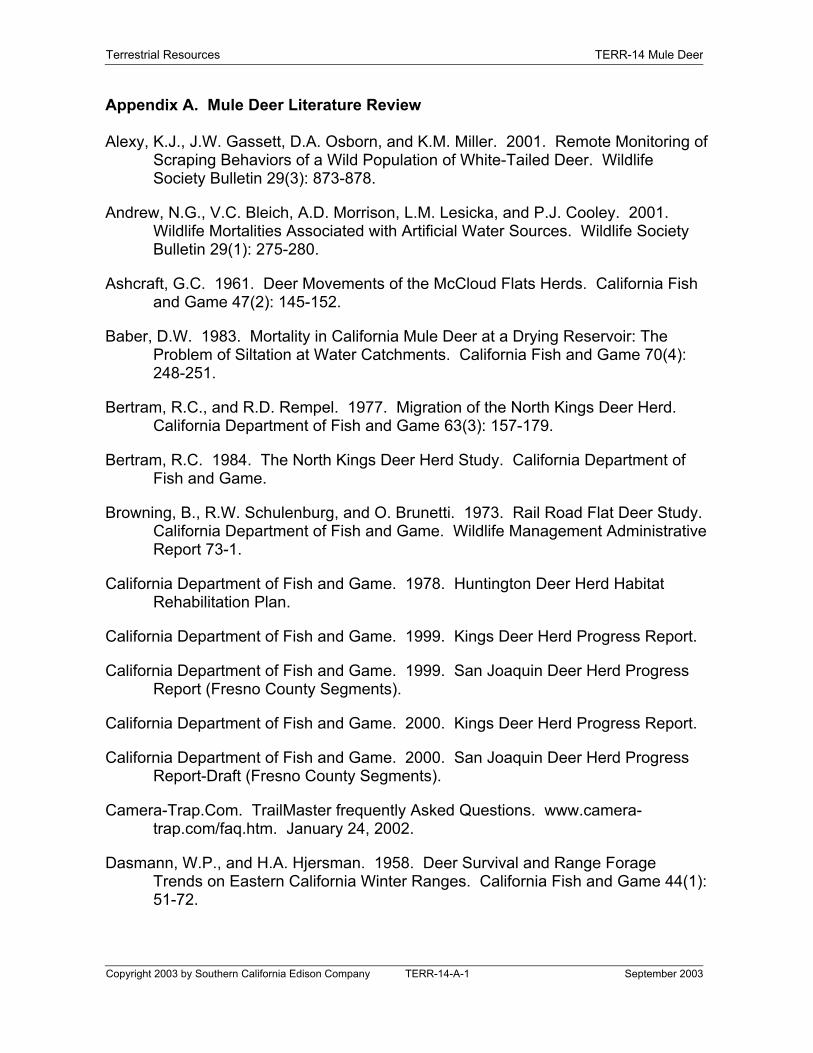
Appendix A. Mule Deer Literature Review
Alexy, K.J., J.W. Gassett, D.A. Osborn, and K.M. Miller. 2001. Remote Monitoring ofScraping Behaviors of a Wild Population of White-Tailed Deer. WildlifeSociety Bulletin 29(3): 873-878.
Andrew, N.G., V.C. Bleich, A.D. Morrison, L.M. Lesicka, and P.J. Cooley. 2001.Wildlife Mortalities Associated with Artificial Water Sources. Wildlife SocietyBulletin 29(1): 275-280.
Ashcraft, G.C. 1961. Deer Movements of the McCloud Flats Herds. California Fishand Game 47(2): 145-152.
Baber, D.W. 1983. Mortality in California Mule Deer at a Drying Reservoir: TheProblem of Siltation at Water Catchments. California Fish and Game 70(4):248-251.
Bertram, R.C., and R.D. Rempel. 1977. Migration of the North Kings Deer Herd.California Department of Fish and Game 63(3): 157-179.
Bertram, R.C. 1984. The North Kings Deer Herd Study. California Department ofFish and Game.
Browning, B., R.W. Schulenburg, and O. Brunetti. 1973. Rail Road Flat Deer Study.California Department of Fish and Game. Wildlife Management AdministrativeReport 73-1.
California Department of Fish and Game. 1978. Huntington Deer Herd HabitatRehabilitation Plan.
California Department of Fish and Game. 1999. Kings Deer Herd Progress Report.
California Department of Fish and Game. 1999. San Joaquin Deer Herd ProgressReport (Fresno County Segments).
California Department of Fish and Game. 2000. Kings Deer Herd Progress Report.
California Department of Fish and Game. 2000. San Joaquin Deer Herd ProgressReport-Draft (Fresno County Segments).
Camera-Trap.Com. TrailMaster frequently Asked Questions. www.camera-trap.com/faq.htm. January 24, 2002.
Dasmann, W.P., and H.A. Hjersman. 1958. Deer Survival and Range ForageTrends on Eastern California Winter Ranges. California Fish and Game 44(1):51-72.
Terrestrial Resources TERR-14 Mule Deer
Copyright 2003 by Southern California Edison Company TERR-14-A-2 September 2003
Appendix A. Mule Deer Literature Review (continued)
Fotoinfo.Com. Infrared Photography. www.fotoinfo.com/techniques/ir.html. January24, 2002
Garrot, R.A., White, G.C. White, R.M. Bartmann, L.H. Carpenter, and A.W. Alldredge.1987. Movements of Female Mule Deer in Northwest Colorado. Journal ofWildlife Management 51(3): 634-643.
Grinnell, J., and T.I. Storer. 1924. Animal Life in the Yosemite. An Account of theMammals, Birds, Reptiles, and Amphibians in a Cross-Section of the SierraNevada. University of California Press, Berkeley, California.
Grinnell, J., J. Dixon, and J.M. Linsdale. 1930. Vertebrate Natural History of aSection of Northern California Through the Lassen Peak Region. University ofCalifornia Press, Berkeley, California.
Gruell, G.E., and N.J. Papez. 1963. Movements of Mule Deer in NortheasternNevada. Journal of Wildlife Management 27(3): 414-422.
Higley, J. 2000. Guide to Hunting Deer in California. California Department of Fishand Game, Wildlife Programs Branch.
Holl, S.A., H. Salwasser, and B. Browning. 1979. The Diet Composition and EnergyReserves of California Mule Deer during Pregnancy. California Fish andGame 65(2): 68-79.
Jacobson, H.A., J.C. Kroll, R.W. Browning, B.H. Koerth, and M.H. Conway. 1997.Infrared-Triggered Cameras for Censusing White-Tailed Deer. Wildlife SocietyBulletin 25(2): 547-556.
Kie, J.G., J.W. Menke, J.R. David, and W.M. Longhurst. 1980. Mitigating the Effectsof Reservoir Development on Black-Tailed Deer in Trinity County, California.California-Nevada Wildlife Transactions 27-40.
Kie, J.G., T.S. Burton, and J.W. Menke. 1982. Deer Populations and ReservoirConstruction in Trinity County, California. California Fish and Game 68(2):109-117.
Kie, J.G., T.S. Burton, and J.W. Menke. 1984. Comparative Condition of Black-Tailed Deer, Odocoileus hemionus columbianus, in two herds in TrinityCounty, California. California Fish and Game 70(2): 78-88.
Kie, J.G., T.S. Burton, J.W. Menke, and W.E. Grenfell, Jr. 1984. Food Habits ofBlack-Tailed Deer, Odocoileus hemionus columbianus, in Trinity County,California. California Fish and Game 170: 183-186.
Terrestrial Resources TERR-14 Mule Deer
Copyright 2003 by Southern California Edison Company TERR-14-A-3 September 2003
Appendix A. Mule Deer Literature Review (continued)
Krausman, P.R. 1995. Response of Desert Ungulates to a Water Project in Arizona.Journal of Wildlife Management 59(2): 292-300.
Krausman, P.R., B.D. Leopold, K.R. Rautenstrauch, J.R. Morgart, and R.C.Etchberger. 1992. Desert Mule Deer Mortality and the Central ArizonaProject. The Biology of Deer, R.D. Brown, Editor. Springer-Verlag, New York.
Koerth, B.H., and J.C. Kroll. 2000. Bait Type and Timing for Deer Counts UsingCameras Triggered by Infrared Monitors. Wildlife Society Bulletin 28(3): 630-635.
Kucera, T.E., and R.C. Etchberger. 1992. Influences of Sex and Weather onMigration of Mule Deer in California. Great Basin Naturalist 52(2): 122-130.
Loft, E.R., J.W. Menke, and T.S. Burton. 1984. Seasonal Movements and SummerHabitats of Female Black-Tailed Deer. Journal of Wildlife Management 48(4):1317-1325.
Loft, E.R., R.C. Bertram, and D.L. Bowman. 1989. Migration Patterns of Mule Deerin the Central Sierra Nevada. California Fish and Game 75(1): 11-19.
Longhurst, W.M., A.S. Leopold, and R.F. Dasmann. 1952. A Survey of CaliforniaDeer Herds. Their Ranges and Management Problems. CaliforniaDepartment of Fish and Game, Bureau of Game Conservation. Game BulletinNo. 6.
McCullough, D.R. 1964. Relationship of Weather to Migratory Movements of Black-Tailed Deer. Ecology 45(2): 249-256.
Merril, E.H., T.P. Hemker, K.P. Woodruff, and L. Kuck. 1994. Impacts of MiningFacilities on Fall Migration of Mule Deer. Wildlife Society Bulletin 22: 68-73.
Nicholson, M.C., R.T. Bowyer,, and J.G. Kie. 1997. Habitat Selection and Survivalof Mule Deer: Tradeoffs Associated with Migration. Journal of Mammalogy78(2): 483-504.
Peabody, E.A., W.W. Stewart, P.W. Shields, and N. Alstot. 1978. Deer Migrationand the Mammoth Pool Reservoir in Fresno and Madera Counties. CaliforniaDepartment of Fish and Game, Region 4.
Peabody, E.A., M. LeFevre, and J. Tanski. 1983. Management Plan for the SanJoaquin Deer Herd. California Department of Fish and Game and UnitedStates Forest Service.
Robinette, W.L. 1966. Mule Deer Home Range and Dispersal in Utah. Journal ofWildlife Management 30(2): 335-349.
Terrestrial Resources TERR-14 Mule Deer
Copyright 2003 by Southern California Edison Company TERR-14-A-4 September 2003
Appendix A. Mule Deer Literature Review (continued)
Russell, C.P. 1932. Seasonal Migration of Mule Deer. Ecological Monographs 2(1):1-46.
Sunquist, F. Caught in the Trap! Remote Cameras with Electronic Beams are theNewest Tools for Biologists Investigating Mysteries in the Wild. NationalWildlife Federation. www.nwf.org/internationalwildlife/camptrap.html. January24, 2002.
APPENDIX B
Mule Deer Observation StudyDatasheets from Deer Observations
Terrestrial Resources TERR-14 Mule Deer
SCE Big Creek ALP
Terrestrial Working Group Mule Deer Observational Study
Obs. # # Deer
Start Time
End Time
Sex/ Age
Approx Entry Point
Approx Exit Point
Method of Crossing Habitat
Substrate and Slope of
Bank
A1 5 2005 2015 U/ANear obs
pt 1 NA NA ChaparralSand and rock, 25-45 degrees
A2 5 2005 2015 U/ANear obs
pt 1 NA NA ChaparralSand and rock, 25-45 degrees
A3 5 2005 2015 U/ANear obs
pt 1 NA NA ChaparralSand and rock, 25-45 degrees
A4 5 2005 2015 U/ANear obs
pt 1 NA NA ChaparralSand and rock, 25-45 degrees
A5 5 2005 2015 U/ANear obs
pt 1 NA NA ChaparralSand and rock, 25-45 degrees
Group approached observers, turned west, approached within 100 feet of water, and turned back into bushes
Surveyor(s):Lourraine Tigas, Giar-Ann Kung
Weather Conditions: Clear, warm (~50), breezy to windy
Mule Deer Observed
End Time: 2030
Appendix B. Datasheets from Deer Observations (continued)
Group approached observers, turned west, approached within 100 feet of water, and turned back into bushes
Observational Notes
Comments:
Start Time: 1845Date: 5/8/02
Group approached observers, turned west, approached within 100 feet of water, and turned back into bushes
Group approached observers, turned west, approached within 100 feet of water, and turned back into bushes
Group approached observers, turned west, approached within 100 feet of water, and turned back into bushes
Copyright 2003 by Southern California Edison Company TERR-14-B-1 September 2003
Terrestrial Resources TERR-14 Mule Deer
SCE Big Creek ALP
Terrestrial Working Group Mule Deer Observational Study
Obs. #
# Deer
Start Time
End Time
Sex/ Age
Approx Entry Point
Approx Exit Point
Method of Crossing Habitat
Substrate and Slope of
Bank
A1 1 640 646 U/A U
#2, Mammoth
Boat Launch Swim
Sand/rock @ exit
Sand, compact 10-20 degrees
Appendix B. Datasheets from Deer Observations
Surveyor(s):Lourraine Tigas, Giar-Ann Kung
Weather Conditions: Clear, cool (30-40), calm
Mule Deer Observed
End Time: 0700
Observational Notes
Comments:
Start Time: 0530Date: 5/7/02
No apparent difficulty, noticed observers but didn't appear to be disturbed by them
Copyright 2003 by Southern California Edison Company TERR-14-B-1 September 2003
APPENDIX C
Spring 2002 Remote Camera Study Results
Terrestrial Resources TERR-14 Mule Deer
Age SexNumber in group Direction
1 1 Unknown Unknown Car1 1 Unknown Unknown Car1 1 Unknown Unknown Vegetation1 1 Unknown Unknown Car1 1 Unknown Unknown Car1 1 Unknown Unknown Car1 1 Unknown Unknown Car1 1 Unknown Unknown Car
1 1 Unknown Unknown Domestic dog
1 1 Unknown Unknown
2 domestic dogs and 2
people1 1 Unknown Unknown Car1 1 20 16:21 Car1 1 Unknown Unknown Car1 1 20 Unknown Car1 1 Unknown Unknown Car1 1 Unknown Unknown Car1 1 Unknown 15:57 Person1 1 23 15:58 Vegetation1 2 23 16:04 2 people1 2 23 16:05 Car1 2 24 9:30 Deer Adults Unknown 3 East1 2 24 10:14 Deer Adult Unknown 1 East1 2 24 18:11 Car1 2 25 10:21 Deer Adult Unknown 2 East1 2 25 11:17 2 people1 3 25 11:23 2 people1 3 25 11:25 Person1 3 25 16:29 Car1 3 26 16:55 Car1 3 Unknown Unknown Person1 3 Unknown Unknown 2 people
1 3 Unknown Unknown Domestic dog1 3 Unknown Unknown Person1 3 Unknown Unknown Car1 3 Unknown Unknown Car
1 3 Unknown UnknownPerson and
truck
1 3 Unknown Unknown3 people and
truck
1 3 Unknown Unknown2 people and
truck
Time SubjectCamera Set
Appendix C. Spring 2002 Remote Camera Survey Results
Deer only
Date
Copyright 2003 by Southern California Edison Company TERR-14-C-1 September 2003
Terrestrial Resources TERR-14 Mule Deer
Age SexNumber in group Direction
1 3 Unknown Unknown2 people and
truck1 4 2 10:37 Person1 4 Unknown Unknown Vegetation1 4 6 15:19 Person1 4 9 10:23 Person1 4 Unknown Unknown Person1 4 16 Unknown Person1 4 16 14:31 Vegetation1 4 16 Unknown Person1 4 Unknown Unknown 2 people1 5 Unknown Unknown Person1 5 24 20:43 Vegetation1 5 25 4:06 Deer Adult Unknown 1 West1 5 Unknown Day Deer Adult Unknown 1 East1 5 26 20:38 Deer Adult Unknown 1 East1 5 27 19:05 Deer Adult Unknown 1 East1 5 29 10:31 2 people1 5 Unknown Unknown Vegetation1 5 30 20:42 Vegetation1 5 30 20:44 Vegetation1 5 30 20:55 Vegetation1 5 30 21:15 Vegetation1 5 30 21:19 Vegetation1 5 30 21:27 Vegetation1 5 30 21:28 Vegetation1 5 30 21:37 Vegetation1 5 30 21:45 Vegetation1 5 31 2:38 Deer Adult Unknown 1 West1 5 31 20:58 Deer Adult Unknown 1 East1 5 Unknown Unknown Vegetation1 5 Unknown Unknown Vegetation1 5 Unknown Unknown Person2 1 18 Unknown Person2 1 18 Unknown Vegetation2 2 Unknown Unknown Person2 2 18 11:53 Person2 3 23 Unknown Vegetation2 3 23 Unknown 2 people2 3 24 Unknown Vegetation2 3 24 Day Deer Adult Unknown 1 East2 3 24 Unknown Vegetation2 3 24 Day Deer Adult Unknown 1 East2 3 24 Night Deer Adult Unknown 1 West2 4 Unknown Unknown 2 people
Appendix C. Spring 2002 Remote Camera Survey Results (continued)
Camera Set Date Time Subject
Deer only
Copyright 2003 by Southern California Edison Company TERR-14-C-2 September 2003
Terrestrial Resources TERR-14 Mule Deer
Age SexNumber in group Direction
2 4 25 Unknown Vegetation2 5 30 Unknown 2 people2 5 30 Unknown Person2 5 30 Unknown Person2 5 30 Unknown Person2 5 30 Unknown Vegetation2 6 2 Unknown Person2 6 2 Unknown Vegetation2 7 Unknown Unknown Person2 7 Unknown Day Deer Adult Unknown 1 East2 7 7 22:24 Deer Adult Male 1 East2 7 8 18:32 Deer Adult Male 1 East2 7 Unknown Unknown Car2 7 Unknown Unknown Car2 7 Unknown Unknown Person2 7 Unknown Unknown Car2 7 Unknown Unknown Car2 7 Unknown Unknown Person2 7 Unknown Unknown Vegetation2 7 Unknown Unknown Car2 7 Unknown Unknown Car2 8 Unknown Unknown Person2 8 Unknown Unknown Vegetation2 8 Unknown Unknown Vegetation2 8 Unknown Unknown Vegetation2 8 Unknown Unknown 2 people2 8 Unknown Unknown Vegetation2 8 Unknown Unknown Car2 8 Unknown Unknown 2 people2 8 Unknown Unknown Vegetation2 8 30 19:30 Black bear2 8 Unknown Unknown Vegetation2 8 Unknown Unknown Vegetation2 8 Unknown Unknown Vegetation2 8 Unknown Unknown Car2 8 Unknown Unknown Car3 1 11 12:43 Car3 1 Unknown Unknown Car3 1 Unknown Unknown Vegetation3 1 18 16:26 Car3 1 18 16:31 Car3 1 Unknown Unknown Car3 1 19 11:51 Car3 1 20 7:29 Car3 1 Unknown Unknown Car
Camera Set
Appendix C. Spring 2002 Remote Camera Survey Results (continued)
Date Time Subject
Deer only
Copyright 2003 by Southern California Edison Company TERR-14-C-3 September 2003
Terrestrial Resources TERR-14 Mule Deer
Age SexNumber in group Direction
3 1 Unknown Unknown Car3 1 20 9:59 Car3 1 20 11:15 Car3 1 20 11:46 Car3 1 Unknown Unknown Car3 1 Unknown Unknown Car3 1 20 13:35 Car3 1 20 13:40 Car3 1 Unknown Unknown Car3 1 20 14:52 Car3 1 Unknown Unknown Vegetation3 1 Unknown Unknown Car3 1 Unknown Unknown Vegetation3 1 Unknown Unknown Vegetation3 1 Unknown Unknown Car3 1 20 16:49 Car3 2 Unknown Unknown Person3 2 Unknown Unknown Person3 2 24 13:11 Car3 2 Unknown Unknown Car3 2 Unknown Unknown Vegetation3 2 24 18:03 Car3 2 25 8:46 Car3 2 25 8:48 Vegetation3 2 Unknown Unknown Car3 2 Unknown Unknown 2 people3 2 25 11:51 Car3 3 Unknown Unknown 2 people3 3 Unknown Unknown 2 people3 3 Unknown Unknown Car3 3 Unknown Unknown Vegetation3 3 25 13:27 Car3 3 25 16:18 Car3 3 25 16:46 Car3 3 26 15:05 Car3 3 26 15:11 Car3 3 26 17:02 Car3 3 Unknown Unknown Car3 3 27 13:47 Car3 3 27 14:45 Car3 3 Unknown Unknown Car3 3 Unknown Unknown Car3 3 28 10:14 Car3 3 28 10:37 Car3 3 28 13:21 Car
Appendix C. Spring 2002 Remote Camera Survey Results (continued)
Camera Set Date Time Subject
Deer only
Copyright 2003 by Southern California Edison Company TERR-14-C-4 September 2003
Terrestrial Resources TERR-14 Mule Deer
Age SexNumber in group Direction
3 3 Unknown Unknown Car3 3 Unknown Unknown Car3 3 29 11:04 Car3 3 29 11:35 Car3 3 29 12:23 Car3 3 29 12:46 Car3 3 30 10:36 Car3 4 Unknown Unknown Person3 4 Unknown Unknown Car3 4 Unknown Unknown Car3 4 Unknown Unknown Car3 4 30 13:46 Car3 4 Unknown Unknown Car3 4 30 15:15 Car3 4 2 11:26 Car3 4 30 11:25 Car3 5 Unknown Unknown Person3 5 Unknown Unknown Car3 5 Unknown Unknown Car3 5 Unknown Unknown Car3 5 6 15:00 Car3 5 Unknown Unknown Person3 5 Unknown Unknown Car3 5 Unknown Day Deer Adults Unknown 3 West3 5 Unknown Unknown Car3 6 Unknown Unknown Person3 6 Unknown Unknown Car3 6 Unknown Unknown Deer Adult Unknown 1 West3 6 Unknown Unknown Vegetation3 6 Unknown Unknown Car3 6 Unknown Unknown Person3 6 Unknown Unknown Person3 6 Unknown Unknown Person3 6 Unknown Unknown Car3 6 Unknown Unknown Car3 6 Unknown Unknown Car3 6 Unknown Unknown Car3 6 Unknown Unknown Car3 6 Unknown Unknown Person3 6 17 21:09 Deer Adult Unknown 1 East3 6 Unknown Unknown Car3 6 Unknown Unknown Car3 6 Unknown Unknown Car3 6 Unknown Unknown Car3 7 Unknown Unknown Camera
Appendix C. Spring 2002 Remote Camera Survey Results (continued)
Camera Set Date Time Subject
Deer only
Copyright 2003 by Southern California Edison Company TERR-14-C-5 September 2003
Terrestrial Resources TERR-14 Mule Deer
Age SexNumber in group Direction
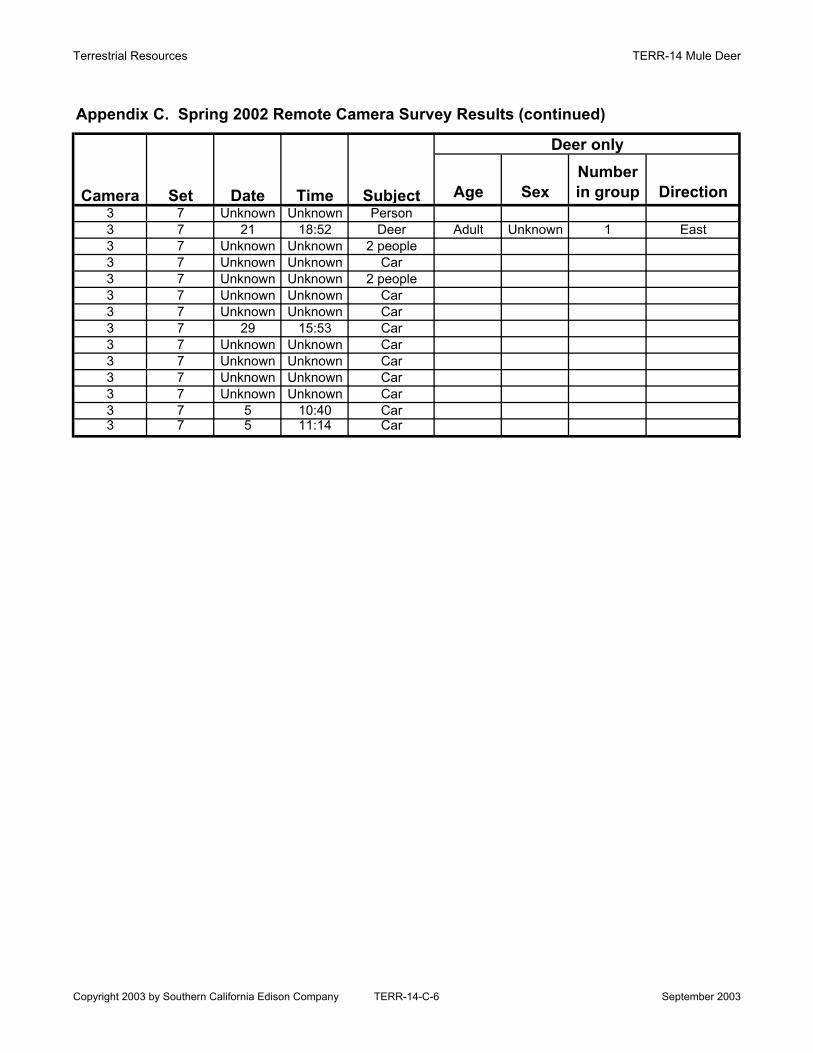
3 7 Unknown Unknown Person3 7 21 18:52 Deer Adult Unknown 1 East3 7 Unknown Unknown 2 people3 7 Unknown Unknown Car3 7 Unknown Unknown 2 people3 7 Unknown Unknown Car3 7 Unknown Unknown Car3 7 29 15:53 Car3 7 Unknown Unknown Car3 7 Unknown Unknown Car3 7 Unknown Unknown Car3 7 Unknown Unknown Car3 7 5 10:40 Car3 7 5 11:14 Car
Appendix C. Spring 2002 Remote Camera Survey Results (continued)
Camera Set Date Time Subject
Deer only
Copyright 2003 by Southern California Edison Company TERR-14-C-6 September 2003