Terms of trade and Russian economic development
23
Russian Journal of Economics 2 (2016) 279–301 Available online at www.sciencedirect.com www.rujec.org Terms of trade and Russian economic development ✩ Georgy Idrisov a, *, Yury Ponomarev b , Sergey Sinelnikov-Murylev c a Gaidar Institute for Economic Policy, Moscow, Russia b Russian Presidential Academy of National Economy and Public Administration, Moscow, Russia c Russian Foreign Trade Academy, Moscow, Russia Abstract The paper discusses economic development trends in Russia in late 2014 and 2015 and re- views the basic mechanisms of how changes in the terms of trade affect the economic develop- ment of countries from a historical perspective and with a particular focus on those changes in the Russian economy that occurred in late 2014 and 2015. The authors demonstrate that structural reforms aimed at diversification of production and exports are necessary for sustain- able economic development, for social stability and for reducing the impact of variability in the terms of trade on the Russian economy. During periods of instability in the government agenda’s measures for the real and financial sectors, it is necessary not only to compensate economic agents losses caused by changes in the terms of trade but also to improve the eco- nomic structure and to develop and enhance the stability of the financial markets. © 2016 Non-profit partnership “Voprosy Ekonomiki”. Hosting by Elsevier B.V. All rights reserved. JEL: E0, O1, O4, F1. Keywords: economic development, terms of trade, GDP, GDI. 1. Introduction: Volatility of the terms of trade and economic development Terms of trade 1 have historically been one of the most important factors in economic development (see Broadberry and O’Rourke, 2013). With the emer- ✩ The updated English version of the article published in Russian in Ekonomicheskaya Politika, 2015, No. 5, pp. 7–37. * Corresponding author, E-mail address: [email protected] Peer review under responsibility of Voprosy Ekonomiki. 1 Terms of trade are normally defined as the ratio of an index of a country’s export prices to an index of its import prices. In a simplified case, if a country exports one commodity and imports another one, its terms of trade can be described by a simple ratio of export prices to import prices. In a model that involves many coun- tries partnering in trade — and multiple exported and imported items — the terms of trade for a given country are described as the ratio of its per unit value of exports to that of imports (see, e.g., Obstfeld et al., 1996). http://dx.doi.org/10.1016/j.ruje.2016.09.002 2405-4739/© 2016 Non-profit partnership “Voprosy Ekonomiki”. Hosting by Elsevier B.V. All rights reserved.
Transcript of Terms of trade and Russian economic development

Russian Journal of Economics 2 (2016) 279–301
Available online at www.sciencedirect.com
www.rujec.org
Terms of trade and Russian economic development ✩
Georgy Idrisov a,*, Yury Ponomarev b, Sergey Sinelnikov-Murylev c
a Gaidar Institute for Economic Policy, Moscow, Russiab Russian Presidential Academy of National Economy and Public Administration, Moscow, Russia
c Russian Foreign Trade Academy, Moscow, Russia
Abstract
The paper discusses economic development trends in Russia in late 2014 and 2015 and re-views the basic mechanisms of how changes in the terms of trade affect the economic develop-ment of countries from a historical perspective and with a particular focus on those changes in the Russian economy that occurred in late 2014 and 2015. The authors demonstrate that structural reforms aimed at diversification of production and exports are necessary for sustain-able economic development, for social stability and for reducing the impact of variability in the terms of trade on the Russian economy. During periods of instability in the government agenda’s measures for the real and financial sectors, it is necessary not only to compensate economic agents losses caused by changes in the terms of trade but also to improve the eco-nomic structure and to develop and enhance the stability of the financial markets.© 2016 Non-profit partnership “Voprosy Ekonomiki”. Hosting by Elsevier B.V. All rights reserved.
JEL: E0, O1, O4, F1.Keywords: economic development, terms of trade, GDP, GDI.
1. Introduction: Volatility of the terms of trade and economic development
Terms of trade1 have historically been one of the most important factors in economic development (see Broadberry and O’Rourke, 2013). With the emer-
✩ The updated English version of the article published in Russian in Ekonomicheskaya Politika, 2015, No. 5, pp. 7–37. * Corresponding author, E-mail address: [email protected] Peer review under responsibility of Voprosy Ekonomiki. 1 Terms of trade are normally defined as the ratio of an index of a country’s export prices to an index of its import prices. In a simplified case, if a country exports one commodity and imports another one, its terms of trade can be described by a simple ratio of export prices to import prices. In a model that involves many coun-tries partnering in trade — and multiple exported and imported items — the terms of trade for a given country are described as the ratio of its per unit value of exports to that of imports (see, e.g., Obstfeld et al., 1996).
http://dx.doi.org/10.1016/j.ruje.2016.09.002 2405-4739/© 2016 Non-profit partnership “Voprosy Ekonomiki”. Hosting by Elsevier B.V. All rights reserved.

280 G. Idrisov et al. / Russian Journal of Economics 2 (2016) 279−301
gence of modern statistical methods in the 20th century, these regularities be-came the focus of many in-depth studies (Basu and McLeod, 1991; Mendoza, 1997; Bleaney and Greenaway, 2001; Bernstein, 2009). Thus, the high growth rates in world prices for Canada’s top exports (non-ferrous metals, cereal grains) over the period spanning the 1940s to the 1970s led to that country’s econom-ic rise (Baldwin and Macdonald, 2012), whereas plummeting coffee prices in the 1930s are considered a major cause of the crisis that Brazil’s economy took nearly a decade to overcome (Baer, 2014). Australia’s improving terms of trade over several periods (including rising prices of wool and cereal grains over the 1922–1925 period, rising prices for wool and agricultural products over the 1944–1951 period, and rising prices for iron ore and coal in 2004–2011) resulted in economic growth at an impressive rate during each period (Atkin et al., 2014).
Importantly, even if changes in terms of trade per se neither improve nor worsen a country’s macrodynamics, they represent one of the strongest exter-nal factors that can accelerate transformational shifts in a country’s secto ral structure and change the course of political and institutional reforms. Thus, the drop in world oil prices in the early and mid-1980s was the major trigger of the subsequent chain of events in the USSR,2 whereas the steady deteriora-tion of China’s terms of trade in both the 1990s and 2010s led that country to search for a new economic growth model oriented more toward the domestic market than to exports (Sinelnikov, 1995; Gaidar, 2006). The principal mecha-nism whereby a country’s terms of trade can yield such a strong impact on the level and rate of economic development is primarily linked to production. As has vividly been illustrated in many classic academic studies (Mundell, 1957; Markusen, 1983; Kohli, 2004), terms of trade are a quantitative mea-sure of production technology that can also arbitrarily be termed “interna-tional trade” and that determine the quantity of goods and services that can be purchased (imported) by a national economy in exchange for the goods and services supplied (exported) by it. In other words, terms of trade, similar to traditional technologies in the real sector, quantitatively determine the pos-sibility of transforming one type of welfare into another. Over the past two centuries, the role of international trade in production has been steadily on the rise. This role was further enhanced by the significantly increased open-ness of most countries’ economies across the globe and by the increasing speed and depth of information dissemination regarding foreign markets and declining transportation costs as a result of technological progress (including the unprecedented drop in prices following the invention of the steam engine), as well as the lowering of institutional costs and barri ers (Harrison, 1996). Another important factor is the impressive evolution of production-linked aspects of trade — from trade in final products that are produced entirely in a national territory to trade in added value and intensive incorporation of in-ternational producers into globally distributed added value chains — that have rapidly boosted the role of foreign goods in domestic consumption (Bernard et al., 2007).
2 It is important to note in this connection that one of the major causes of the economic problems faced by the USSR in the 1980s was the Soviet leadership’s low level of economic competence (see Gaidar, 2006).

281G. Idrisov et al. / Russian Journal of Economics 2 (2016) 279−301
2. Measuring economic results: GDP and GDI
The level of a given country’s economic development, although a broad no-tion from the perspective of its context, is typically measured in the economic literature by applying economic growth indices,3 including most importantly that of real gross domestic product (real GDP). In practice, real GDP (or GDP adjust-ed for the price level during a given period) represents a measure of the physi-cal volume of the goods and services produced by an economy. For example, the comparative values of real GDP for the same country at different points in time describe changes in the production of goods and services measured “in physical units” (i.e., as “tons of product” or “number of items”), while each changing component in the physical volume of output is weighted against certain values that are determined by the structure of production during the initial pe-riod. Similarly, when comparing the real GDP values of two countries, a certain fixed comparative price basis must be relied upon (such as, for example, prices based on the Purchasing Power Parity hypothesis; PPP4) to estimate the quantita-tive output of each of the two economies. As a result of their relative simplicity, the real GDP and real GDP per capita indices have enjoyed widespread use as measures of the level of economic development in actual practice. Concurrently, it is clear that these indices take no account of certain economic development indicators, such as consumption growth, declines in the poverty rate, weakening social polarization, achievement of social justice, and the diminishing volatility of the impacts of external and internal shocks on individual welfare (Arrow et al., 2010; World Bank, 2013).
The factors that are conducive to economic growth are extensively ad-dressed in the academic literature (see Idrisov and Sinelnikov-Murylev, 2014). The principal factors include a country’s endowment in terms of production factors, labor and capital (Helpman, 2004); indicators of institutional develop-ment (Acemoglu et al., 2001; Mauro, 1995); demographic indices and features of a country’s residents (Murphy et al., 1991); the population’s education level (Barro, 1991; Krueger and Lindahl, 2000); the financial sector’s development indices (Beck and Levine, 2004; Roubini and Sala-i-Martin, 1992); geographical location features (Bloom et al., 2003); indices of public sector activity (Barro, 1991; Sala-i-Martin, 1997); social capital indices (Temple and Johnson, 1998); and many other factors. A change in the terms of trade is also an important de-termining factor of real GDP growth (Rodrik, 2006). The studies (Barro and Sala-i-Martin, 1995; Fischer, 1993) demonstrate that, in spite of the strong influ-ence exerted by a given country’s individual features on its economic growth (the authors reviewed indices that included the level of government expendi-tures, human capital development, political instability in an economy, etc.),
3 As a rule, a distinction is made between a nation’s level of economic development and the level of economic growth. Economic development is characterized by close and complex links to a nation’s welfare, social justice, the poverty rate, social polarization, and efficient operation of public institutions, while economic growth is typically understood as the rate of GDP growth (Helpman, 2004; Idrisov and Sinelnikov-Murylev, 2013). 4 The PPP is one of the basic concepts that determines price ratios at the international level. The PPP implies that, in the absence of transportation costs and any other transaction costs, the same market basket of goods and services can be bought in different countries for a fixed sum of money, as recalculated in their national curren-cies on the basis of a current exchange rate (Taylor, 2003).

282 G. Idrisov et al. / Russian Journal of Economics 2 (2016) 279−301
the inputs of changes in the terms of trade play the key role (see also Jawaid and Waheed, 2011; Feenstra et al., 2013).5
The mechanisms involved in calculating the impact of changes in trade on real GDP and economic development differ significantly in terms of their nature: real GDP is calculated on the basis of a fixed vector of prices as of a given mo-ment, whereas any change in the terms of trade implies that relative prices will also change. In other words, in contrast to the production component in the im-pact of the terms of trade on economic development, their long-run impact on the growth rate of real GDP becomes manifest in the changing stimuli for the production of goods, whose relative prices are also changing. Over the short run, in the presence of idle and non-competitive (with respect to imports) pro-duction capacities, the impact becomes manifest in the growth pattern of do-mestic demand.6 Simultaneously, in the absence of competitive idle production capacities, income growth will push up savings or imports, and in the short-term perspective, the improved terms of trade will either have no effect whatsoever on the value of real GDP or (in some cases) may even trigger its decline7 — all other conditions equal.
The foregoing confirms that the index of real GDP reflects only the quantita-tive (“in physical units”) output of an economy, while frequently underestimating the development potential of the additional income generated by the improved terms of trade. Notably, all these processes are strongly influenced by the cur-rent established regime for the national currency’s exchange rate against foreign currencies: as a rule, in the event of a free-floating exchange rate regime, im-proving terms of trade produce a stronger national currency, which lowers com-petitiveness for all domestic producers (and not just the export-oriented ones), whereas worsening terms of trade weaken the national currency and push down the level of competitiveness. These effects will also impact GDP over the short and/or long run. In case of a fixed or “quasi-fixed” exchange rate regime, chang-ing terms of trade will necessitate some type of intervention on the part of the central bank (by way of increasing the money supply, sterilizing the money supply, or adjusting the amount of gold and foreign currency reserves), thus inducing fluctuations in the real foreign exchange rate and giving rise to effects similar to those resulting from changes in the nominal foreign exchange rate. In addition to real GDP, an important quantitative measure of the economic devel-opment level is real gross domestic income8 (real GDI), which reflects an econ-omy’s real potential for consumption and savings. Notably, in nominal terms,
5 As a rule, all the factors specified here cannot fully explain the differences in the economic development levels or in the economic growth rates in one country or between countries; a large and yet unexplained part of that impact must necessarily be associated with differences in total factor productivity levels (Helpman, 2004). 6 Notably, if a change in the terms of trade is regarded by economic agents as temporary in nature, it may produce a change in the savings index and not the consumption index. 7 In those cases in which real GDP is calculated as the Laspeyres index, a country’s improving terms of trade will push down relative import prices which, in turn, will result in an increased GDP deflator when confronting rigid prices for other products and eventually in a lower value of real GDP, as a consequence. For further detail, see e.g., Kohli (2004). 8 GDI (Gross Domestic Income) measures the purchasing power of the total income generated by domestic production (including the impact of changes in the terms of trade on that income) in a country’s territory over a certain period of time (Bartelsman and Beaulieu, 2007). Real GDI is equivalent to gross domestic product at constant prices plus the trading gain (or less the trading loss) resulting from changes in the terms of trade (see OECD Glossary of Statistical Terms, https://stats.oecd.org/glossary).

283G. Idrisov et al. / Russian Journal of Economics 2 (2016) 279−301
GDP and GDI should have identical values (based on statistical calculations) because they measure the “volume of the economy” as either production-side or income-side estimates.9 In real terms, the difference between GDP and GDI becomes manifest mainly in the price deflators — the GDI deflator is calculated on the basis of the consumer basket (i.e., it takes the prices of imported goods into account but disregards the prices of exported goods), whereas the GDP de-flator uses the basket of produced goods.10 Thus, these indices are always equal in a closed economy.
In contrast to real GDP, which measures the physical production volume in an economy, real GDI reflects the real purchasing power of the incomes of a nation’s economic agents. To trace the movement of GDI over time (for a single country) and space (for multiple countries), a certain fixed basic price vector should be set that will be applied to derive the aggregate indices of the consumption changes across an economy, expressed “in physical units”.
A change in the terms of trade can have a strong impact on real GDI already in a short-term perspective. Thus, for example, a change in the relative value of exports vs. imports that results from improvements to the terms of trade will re-sult in domestic economic agents having greater purchasing power due to their increased incomes from foreign trade. If the structure of its balance of trade is constant, a country can then afford to reduce its exports while importing the same quantity of goods and services; or, vice versa, it can increase its imports while maintaining the volume of its exports at the same level. This is growth of the so-called input of the terms of trade in real terms, which will lead to GDI growth in both nominal and real terms.
Over the long term, changes in the terms of trade will be accompanied by changes in domestic prices (primarily as a result of the effects of the law of one price on tradable goods and the corresponding translation into prices for non-tradable goods), but this can occur in different ways depending on whether the foreign exchange rate is fixed or floating. However, the value of GDI calcu-lated in terms of world prices will likewise increase/decline in real terms due to better/worse terms of trade.
In this connection, for a quantitative or qualitative estimation of the changes in a country’s economic development, its wealth or welfare, the analysis of the movement of real GDI is much more useful than the analysis of the rate of economic growth — that is, real GDP (Mendoza, 1997; Bleaney and Greenaway, 2001; Kohli, 2004). The former analysis reveals the extent of a change in
9 As a rule, differences in nominal values arise when different methodologies are applied in the calculations: GDP describes the expenditure side, whereas GDI describes the income side. Nevertheless, in both Russia’s and in world statistical practices, both of these approaches are used to estimate GDP. Estimating GDP on the basis of income sources and as one of the three available methods for deriving GDP values (but by no means the pri-mary one) is undertaken by Rosstat only when analyzing the value structure of GDP but not for determining its nominal volume or movement because not all the income indices are calculated directly. Indeed, some of them are derived using the balance method (see Kohli, 2004; Rosstat methodological provisions on statistics, http://www.gks.ru/bgd/free/B99_10/IssWWW.exe/Stg/d000/i000320r.htm). 10 Notably, the discrepancy described here arises to a certain extent from the interpretation of the differences between the values of real GDP and GDI, which is capable of reflecting the mechanism that conveys the im-pact of a change in the terms of trade. In this connection, the GDP deflator is calculated as the quotient of nominal GDP and real GDP (in constant prices for a given year). In other words, the deflator index is second-ary to the nominal and real GDP indices. See Rosstat methodology for calculating macroeconomic indices, http://www.gks.ru/free_doc/new_site/vvp/met-dop.doc.

284 G. Idrisov et al. / Russian Journal of Economics 2 (2016) 279−301
an economy’s potential for consumption and savings (or, in a certain sense, “postponed consumption”), and not an increase in the production of goods in physical terms.
In their economic development reviews, many statistics agencies in both the USA and Europe analyze jointly both real GDP and GDI. In this connec-tion, the multi-vectored movement of these two indices is also frequently ana-lyzed (Kohli, 2006; Nalewaik, 2012). Thus, for example, in the case of worsening terms of trade, the situation may be interpreted (almost literally) as follows: our economy now produces more (real GDP has increased), but we have become poorer (real GDI has declined) because our output, which is estimated in world prices, is now worth less (Kohli, 2004).11 As a rule, real GDI is one of the vari-ables applied by the National Bureau of Economic Research to determine busi-ness cycle dates in the USA.12
In addition to the indices described above, economic development measure-ments frequently rely on GDP estimated on the basis of PPP in nominal terms, which implicitly (but not arithmetically) represents an intermediate index be-tween real GDP and real GDI. On the one hand, the value of GDP estimated as PPP relative to current prices simultaneously demonstrates how much more a given country is producing goods in physical terms than it produced previously and how much more the basket of goods produced is worth in the context of the current terms of trade. On the other hand, the PPP-based GDP index is com-parable between countries because, as a rule, the same PPP price vector is ap-plied — in other words, it shows how much higher the value of a basket of goods produced by one country (on a per capita basis) is than that of a similar basket of goods produced by another country.
Performing a joint interpretation of the movement patterns of the three eco-nomic development indices and determinants of long-run economic growth is a complex task (see Table 1); the approaches to addressing it differ greatly de-pending on the individual specificities of each country (some considerations for Russia will be presented later in this paper). For example, in Australia, the slow-down in the growth rate of real GDI observed over the 1999–2014 period was less rapid13 than the downward movement of real GDP. This state of affairs was primarily due to the improved terms of trade (the 2004–2011 period witnessed rising prices for iron ore and coal exported by Australia). In China, the aver-age annual growth rates displayed by GDP and GDI over the 1994–2008 period were practically the same, but in 2009, the post-crisis year, the growth rate of real GDP declined (from 12.8% on average over the 1999–2008 period to 9.21% in 2009), which differed from real GDI, which experienced a slight acceleration in its growth rate (from 12.3% on average over the 1999–2008 period to 12.7% in 2009) and is explained by the improved terms of trade. Nevertheless, the sub-
11 For additional interpretations of the movement patterns of GDP and GDI in the US economy, see the official website of the US Bureau of Economic Analysis at https://www.bea.gov/newsreleases/national/gdp/gdpnews-release.htm, http://www.bea.gov/scb/pdf/2014/08%20August/0814_revisions_to_gdp_gdi_and_their_major_components.pdf. 12 See the official comments released by the National Bureau of Economic Research (NBER) at http://www.nber.org/cycles/recessions_faq.html, http://www.nber.org/cycles/sept2010.html. 13 The average rate of GDI growth declined from 5.28% over the 1999–2008 period to 3.05% in 2009 and 2.28% over the 2010–2014 period.
http://www.bea.gov/scb/pdf/2014/08%20August/0814_revisions_to_gdp_gdi_and_their_major_components.pdf

285G. Idrisov et al. / Russian Journal of Economics 2 (2016) 279−301
Table 1Average growth rates of PPP-based real GDP, real GDI and GDP per capita for a given period in each year (as % per annum).
Country 1994–1997
1998 1999–2008
2009 2010–2014
Average growth rate of real GDP (in 2005 USD)†Australia 3.92 4.43 4.46 1.73 2.56Canada 2.89 4.14 3.58 –2.71 2.42France 1.94 3.56 2.56 –2.94 0.67Germany 1.43 1.97 1.98 –5.64 1.81Japan 2.05 –2.00 1.36 –5.53 0.89South Korea 7.29 –5.71 7.11 0.71 3.58Norway 4.89 2.68 2.67 –1.63 1.77UK 2.58 3.51 3.36 –4.31 2.22USA 3.66 4.45 3.22 –2.80 2.28Brazil 3.31 0.04 4.22 –0.33 1.78China 10.07 7.83 12.80 9.21 8.01India 6.38 6.18 8.71 8.48 6.96Armenia 5.35 7.30 13.11 –14.15 3.94Belarus 0.86 8.40 9.51 0.20 2.76Kazakhstan –2.10 –1.90 10.97 1.20 5.42Russia –2.15 –5.30 8.69 –7.82 2.01
Average growth rate of real GDI (in base year local currency)Australia 3.90 4.34 5.28 3.05 2.28Canada 3.05 2.52 4.65 –5.79 2.53France 1.83 3.90 2.44 –2.30 0.78Germany 1.41 2.47 1.74 –3.83 1.93Japan 1.79 –1.51 0.65 –3.49 1.22Korea 6.91 –4.84 5.59 2.48 3.63Norway 5.42 –0.31 6.56 –9.48 1.50UK 2.68 3.63 3.30 –3.86 2.36USA 3.73 4.78 3.05 –2.19 2.12Brazil 3.50 –0.12 4.30 –0.67 1.75China 10.12 7.42 12.29 12.70 8.71India 6.32 6.77 8.51 7.87 7.13Armenia 5.36 7.28 12.85 –16.16 1.99Belarus –1.01 14.20 11.99 –6.84 4.38Kazakhstan –6.09 –3.55 12.51 –12.82 5.03Russia –2.77 –8.01 14.39 –24.29 3.18
Average growth rate of nominal per capita PPP-based GDP (in current international dollars)Australia 4.47 6.06 5.58 7.24 1.72Canada 3.80 4.59 5.52 –3.40 2.58France 3.75 4.95 5.24 –0.58 2.69Germany 2.75 2.81 5.58 –3.06 4.25Japan 3.65 –1.19 4.10 –4.75 1.94South Korea 8.25 –5.38 8.70 –0.83 3.84Norway 7.87 –1.91 10.59 –9.85 1.56UK 5.95 3.13 5.57 –3.52 2.00USA 4.36 4.36 4.92 –2.89 3.09Brazil 3.65 –0.40 5.59 –0.44 2.46China 10.97 7.96 15.14 9.53 9.15India 6.44 5.49 9.74 7.91 7.28Armenia 9.04 9.32 17.04 –13.20 5.27Belarus 3.13 10.10 13.46 1.21 4.39Kazakhstan 1.36 0.89 13.63 –0.66 5.51Russia –0.23 –4.16 17.80 –3.89 3.94
† The rate of growth of real GDP as estimated by the World Bank is precisely the same as that in the official data released by Rosstat.Source: Authors’ calculations based on World Bank data.

286 G. Idrisov et al. / Russian Journal of Economics 2 (2016) 279−301
sequent change in the structure of China’s foreign trade (a shift in its imports toward mineral resources and other raw materials whose world prices were on the rise and in its exports toward machinery and equipment, the market for which was characterized by high rates of competition and relatively declining prices) re-sulted in worsened terms of trade (Ahuja et al., 2012) that triggered a slowdown in the growth rate of real GDI and real GDP (to 8.7% and 8.0%, respectively) over the 2010–2014 period. At the same time, in those countries that exported energy resources (Canada, Norway, Kazakhstan and Russia) the drop of real GDI in 2009 was far greater (relatively speaking) than that of real GDP in the other countries, once again because the terms of trade in these countries had deterio-rated significantly. Once again, it must be emphasized that an economic policy focused solely on the real GDP index produces a much more narrow view of the emerging economy and may lead to an incorrect understanding of the cur-rent economic situation and the measures necessary for its stabilization. A simple statistical analysis can demonstrate that the 1998 crisis — and the 2008–2009 cri-sis — produced a far steeper drop in real income in Russia (that is, consumption and saving) than of real output. In Russia, the extent of the negative impact of the terms of trade on economic development in 2009 was manifest not only in a more significant drop in GDP (by 7.8% vs. 5.3% in 1998) but also in a drop in GDI — by 24.3% vs. 8.0% in 1998. On the whole, such a steep decline in real income in the economy was compensated for by allocations from the Reserve Fund; for this reason, neither residents’ real disposable income nor the real con-sumption index in the private and public sectors displayed a similarly impressive decline. As a result, whereas in the post-1998 economic situation characterized by recovery growth, when there were substantial reserves of idle production ca-pacities, the terms of trade (which were not only favorable but constantly improv-ing) became a major driver of GDP and GDI growth; after the 2009–2010 period, when GDI had dropped by nearly a quarter (and the resulting loss was compen-sated for by allocations from the Reserve Fund) and GDP had dropped by 7.8%, the absence of any further permanent improvements in the terms of trade resulted in a situation in which the external sources of growth were exhausted (Idrisov and Sinelnikov-Murylev, 2014).
3. Economic crises in Russia and economic development indicators
After a long period of improving terms of trade in the first decade of the 21st century, the Russian economy is now experiencing their sharp deterioration. The index of Russia’s terms of trade with foreign countries in 2014 dropped by an average of 8.8% from 2013, and its decline in Q4 2014 from the same period of 2013 saw a drop of approximately 30% (Bank of Russia, 2014a). This drop was caused by the decline in world prices for Russia’s top exports alongside the rising prices of its imports (in Q3 and Q4 2014, by 5–7% compared to the same period in 2013; Bank of Russia, 2014a), which primarily resulted from its self-imposed food import ban.
The significantly worsened terms of trade resulted in shrinking their “tradition-ally” high input in Russia’s economic development, i.e., during the first decade of the 21st century, a phenomenon that is not fully reflected by the movement in real GDP, which in such situations does not sufficiently account for the change

287G. Idrisov et al. / Russian Journal of Economics 2 (2016) 279−301
in the consumption and saving potential of economic agents. Thus, in particular, the increase of real GDP in 2014, as shown by Rosstat’s preliminary estimates, amounted to 0.56%, whereas real GDI in 2014 declined on average by 1.85% from 2013.
A similar situation can also be observed over the period of the 2008–2009 financial and economic crisis (Table 2). In spite of the numerous declarations made by Russian officials and economists that the crisis had bypassed Russia and that it remained a “safe haven”14, the income decline in real terms, which in 2009 amounted to 24.3% from 2008, was much deeper than the slowdown in the rate of economic growth measured in terms of real GDP (7.8% from 2008). This means that at the time of this crisis, which was caused by significantly wors-ening terms of trade, the drop in real GDP falls far short of reflecting the true eco-nomic decline due to the specific structure of Russia’s economy. Meanwhile, dur-ing the 2010–2013 post-crisis period, the recovery rate of real GDI was moving ahead of that of real GDP, i.e., 8.4% vs. 3.4%, respectively (see Table 2), which occurred because of both the improved terms of trade and the depth to which the real GDI index had sunk as a result of the crisis. Concurrently, the PPP-based nominal GDP index was increasing over that period at the average rate of 7.0% per annum, which was higher than the average for developed countries but lower than the average for developing economies.
Thus, the use of real GDP as an economic policy target results in situations in which the government, on the one hand, strives to increase production in terms of physical units while the actual value of domestic products in the world econo-my may be lower than it was previously. On the other hand, the use of real GDP focuses less attention on the reduced volumes of real consumption, saving and investment — the factors that determine the conditions for current and future economic development. Table 2 demonstrates that real GDI in Russia was on
14 See Vladimir Putin’s interview at http://www.ntv.ru/novosti/140177/.
Table 2Movement of economic growth and foreign trade indices in Russia during the crisis periods.
1998 1999 2000 2008 2009 2010 2011 2012 2013 2014
Index of Russia’s terms of trade (2000 = 100%)
– – 100.0 241.9 179.8 203.9 245.7 250.0 244.8 223.3
Brent crude oil price ($/barrel)
12.8 17.9 28.7 96.9 61.7 79.6 111.3 111.6 108.6 99.0
Real GDP growth (as % relative to previous year)
94.7 106.4 110.0 105.2 92.2 104.5 104.3 103.4 101.3 100.6
Real GDI growth (as % relative to previous year)
92.0 104.6 124.0 113.6 75.7 115.8 115.9 104.4 98.5 98.1
PPP-based GDP growth (as % relative to previous period; in international dollars for correspond ing year)
95.7 108.0 114.9 121.1 96.2 105.8 110.2 106.9 105.1 –
Source: Compiled by the authors on the basis of World Bank data.

288 G. Idrisov et al. / Russian Journal of Economics 2 (2016) 279−301
the decline from 2013 onwards because of the falling export prices (denominated in US dollars) for oil, petroleum products, gas, ferrous and non-ferrous metal products, whereas real GDP, while remaining on the rise, did so only at a de-clining rate. Looking back, we understand that the degree of economic recovery after the 2008–2009 crisis has been somewhat overestimated precisely because the index of GDP growth in terms of physical volume was applied as the main economic development indicator.
Although the Russian economy in 2013–2014 was increasing its production volume in physical terms, it was becoming poorer in terms of consumption and savings rates.
As noted above, the Federal State Statistics Service (Rosstat), regretfully, does not calculate real GDI; nonetheless, real income movement can be indirectly es-timated using the statistics on real expenditures presented in Table 3. An analysis of the structure of GDP in real terms points to the existence of negative trends both in 2009, when final consumption expenditures declined by 3.9%, and gross savings by 41%,15 and in 2013, when the rate of growth of final consumption expenditures dropped by 2.5 pp, that of expenditures on public administration dropped by 1.5 pp, and gross saving dropped most drastically by 7.1%.16 In this connection, budget deficits in the situation observed in 2009 amounted to 5.9% of GDP, whereas the volume of the Reserve Fund shrank from 9.8% of GDP as of 1 January 2009 to 4.7% of GDP as of 1 January 2010, which compensated for the drop in households” real income and the public sector as a result of the finan-cial and economic crisis, leaving their real consumption expenditure rate practi-cally unchanged. It is important to note that, as with real GDI, actual gross capital formation also began to decline from 2013 onwards (–7.1% in 2013), which re-flects a shrinkage of the private sector’s real income that is available for invest-ment in future economic growth.
15 Notably, the significant decline in gross savings over the 2008–2009 period was accompanied by a significant shrinkage of its share in total GDP — from 25.5% in 2008 to 16.3% in 2009. Concurrently, the share of final consumption expenditures in total GDP somewhat increased — from 66.7% in 2008 to 69.5% in 2009 (including both the aggregate index and the specific indices for households (48.4% in 2008 vs. 49.9% in 2009) and for public administration (17.8% in 2008 vs. 19.2% in 2009)). 16 Over the 2013–2014 period, the movement pattern displayed by the share of gross capital formation in GDP was somewhat similar to that during the 2008–2009 period, namely the relative decline of that index (from 21.3% in 2013 to 19.6% in 2014) alongside the unchanged relative share of final consumption expenditures in GDP (73.4% in 2013 and 73.6% in 2014).
Table 3Movement of the volume indices of final use of GDP in Russia during the crisis periods (physical volume, as a % relative to previous period).
1998 1999 2000 2008 2009 2010 2011 2012 2013 2014
Physical volume index of GDP use
94.7 106.4 110.0 105.2 92.2 104.5 104.3 103.4 101.3 100.6
Final consumption expenditures
97.9 98.8 105.6 108.6 96.1 103.5 105.3 106.4 103.9 100.9
by households 96.6 97.1 107.3 110.6 94.9 105.5 106.8 107.8 105.0 101.3by public
administration101.0 103.1 102.0 103.4 99.4 98.5 101.4 102.6 101.1 99.9
Gross savings 54.8 93.4 175.2 110.5 59.0 128.5 121.0 103.1 92.9 92.7
Source: Compiled by the authors on the basis of data released by Rosstat.

289G. Idrisov et al. / Russian Journal of Economics 2 (2016) 279−301
A clearer understanding of the negative trends in the Russian economy in 2013–2014 — not in terms of production volume measured “in physical units” but in terms of the real purchasing power of incomes and real expenditures of economic agents — could have helped with a more consistent implementation of measures similar to those outlined in the Plan of Priority Measures to Ensure Sustainable Economic Development and Social Stability in 201517 and that aimed at diversifying Russia’s production and exports.
4. Decline of real GDP and GDI as a result of worsening terms of trade, the introduction of sanctions and the ruble’s depreciation in late 2014 and 2015
Under current macroeconomic conditions, the worsening situation in the trade sphere is an important — but by no means the only — factor that has been respon-sible for the slowdown of economic development in Russia. Thus, the elaboration of economic policy measures will require a detailed analysis of all the factors and mechanisms that play a role in the worsening macroeconomic situation. With this purpose in mind, we will decompose the actual rate of economic growth into its structural and cyclical components (see Drobyshevsky et al., 2014; Drobyshevsky and Kazakova, 2015; Kazakova, 2015).18
Over the past fifteen years, the structural rate of growth in the Russian economy has declined from 4–5% to 0.5–1.0% per annum (Kazakova, 2015) as a result of declining labor rates and declining rates of capital involvement in the production of goods and services and the similarly declining rate of growth in the effectiveness of their use. These declines have occurred because of the worsening business climate in the RF (or the absence of its improvement), including its legal (the legislative, judicial and law enforcement), social (education, health care), financial (budget, tax and customs administration, the banking system, insurance), and infrastructural systems. All these institutions over the period under consideration were either de-teriorating (public administration, the law enforcement and judicial systems), or the rate of their improvement was far behind society’s rapidly growing demand (tax administration, road infrastructure). The slowdown in the long-run rate of growth sharply increased the Russian economy’s vulnerability to ongoing shock-induced and cyclical short-term situational changes (both external and internal changes).
17 Adopted by RF Government Resolution No. 98-r of 27 January 2015 “On Approving the Plan of Priority Measures to Ensure Sustainable Economic Development and Social Stability in 2015.” 18 In view of the Russian economy’s high dependence on the world markets for raw materials and energy carriers, this decomposition can be augmented by the growth component determined by the terms of foreign trade. This approach implies that the rate of economic growth can actually be decomposed into three arbitrary components: (1) the structural component is the theoretically possible rate of economic growth in the middle phase of the business cycle, which is geared to the average oil price index estimated for a period of many years, i.e., the rate of growth as determined by the involvement of additional labor and capital in production, with an increased efficiency of their use; (2) the foreign trade component is the rate of economic growth explained by the terms of foreign trade and determined by the deviation of the actual oil price from the average oil price index over a long-term period, which results in the transfer of income to (from) the national economy, where that income then becomes available for spending on domestic and foreign consumer and capital goods, including investment goods (these are the additional incomes generated by a change in the terms of trade); and (3) the situational (cyclical) component is the rate of economic growth explained by random (unpredictable) shocks experienced by the Russian economy and by the business cycle, where the economic activity fluctuates in response to domestic and external stimuli (changes).
290 G. Idrisov et al. / Russian Journal of Economics 2 (2016) 279−301
Alongside the slowdown in the structural rate of growth, 2014 saw two more serious changes:• a change in the geopolitical situation in connection with the events in
the Republic of Crimea and Ukraine that were caused by the introduction of financial and technological sanctions against Russia by a number of coun-tries, Russia’s retaliatory ban on food imports,19 and the increased risks of doing business and becoming involved in economic activities as a result of the increased uncertainty with regard to future foreign and domestic econo-mic policy;
• the worsening terms of trade (the falling prices for oil and some of Russia’s other exports and the growing import prices as a result of the ban on food im-ports), which in combination with financial sanctions and growing uncertainty resulted in the ruble’s plummet against the world’s major currencies.Thus, the complicated geopolitical situation and worsening terms of trade
coupled with a sharp slowdown in the structural rate of economic growth served as a major direct cause of the emerging turbulence in the financial sphere and the negative dynamics of the real sector.
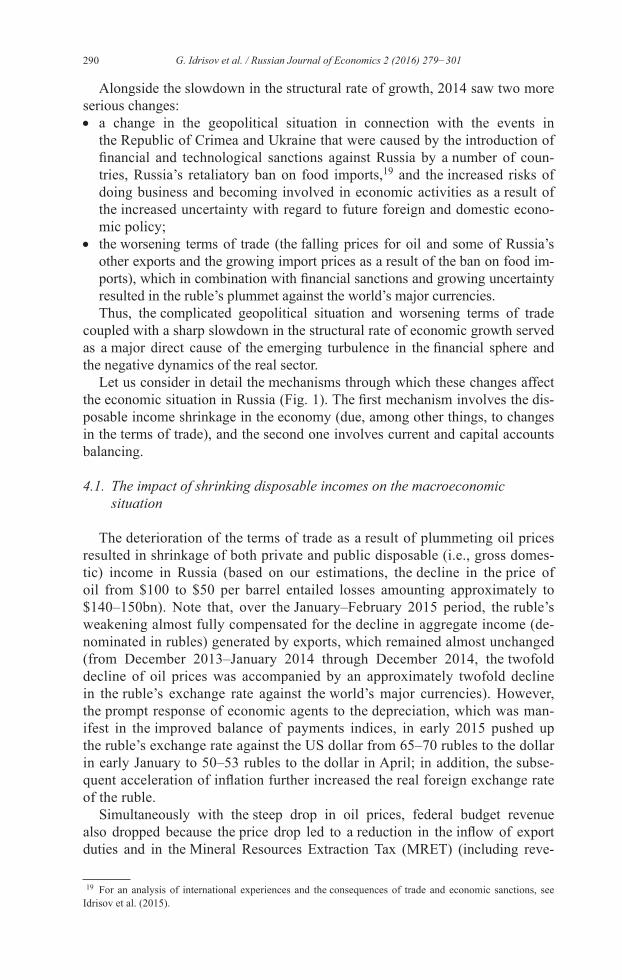
Let us consider in detail the mechanisms through which these changes affect the economic situation in Russia (Fig. 1). The first mechanism involves the dis-posable income shrinkage in the economy (due, among other things, to changes in the terms of trade), and the second one involves current and capital accounts balancing.
4.1. The impact of shrinking disposable incomes on the macroeconomic situation
The deterioration of the terms of trade as a result of plummeting oil prices resulted in shrinkage of both private and public disposable (i.e., gross domes-tic) income in Russia (based on our estimations, the decline in the price of oil from $100 to $50 per barrel entailed losses amounting approximately to $140–150bn). Note that, over the January–February 2015 period, the ruble’s weakening almost fully compensated for the decline in aggregate income (de-nominated in rubles) generated by exports, which remained almost unchanged (from December 2013–January 2014 through December 2014, the twofold decline of oil prices was accompanied by an approximately twofold decline in the ruble’s exchange rate against the world’s major currencies). However, the prompt response of economic agents to the depreciation, which was man-ifest in the improved balance of payments indices, in early 2015 pushed up the ruble’s exchange rate against the US dollar from 65–70 rubles to the dollar in early January to 50–53 rubles to the dollar in April; in addition, the subse-quent acceleration of inflation further increased the real foreign exchange rate of the ruble.
Simultaneously with the steep drop in oil prices, federal budget revenue also dropped because the price drop led to a reduction in the inflow of export duties and in the Mineral Resources Extraction Tax (MRET) (including reve-
19 For an analysis of international experiences and the consequences of trade and economic sanctions, see Idrisov et al. (2015).
291G. Idrisov et al. / Russian Journal of Economics 2 (2016) 279−301
Fig.
1. M
echa
nism
s of R
ussi
a’s w
orse
ning
mac
roec
onom
ic si
tuat
ion.
Sour
ce: C
ompi
led
by th
e au
thor
s.

292 G. Idrisov et al. / Russian Journal of Economics 2 (2016) 279−301
nue in rubles resulting from the specific formula for calculating the amount of the MRET and the export duty) by approximately RUB 750bn, or by 1.15% of GDP. Such a shrinkage of the inflow of oil and gas rent-generated incomes re-duced the amount of resources available for investment in both physical and hu-man capital and in infrastructure, thus also undermining fundamental economic growth factors (i.e., shrinkage of the structural growth component) over the me-dium and long term.
In the Keynesian aggregate demand and aggregate supply model20 the move-ment of output over the short term is determined not so much by supply op-portunities but by changes in aggregate domestic and foreign demand. Thus, with the shrinkage of the disposable income of Russian economic agents (in both the private and public sectors), the demand for both domestic and foreign consumer and capital goods also declines (in a simple model, no distinction is made between consumer goods and investment goods), which in the very short run results in a decline in the GDP growth rate. The volume of output in physical terms is also affected — in addition to shrinking domestic de-mand through the autonomous domestic expenditure multiplier — by changes in the volume of exports resulting from the ruble’s depreciation (see below) through the net export multiplier (i.e., output growth in export-oriented sectors induces the multiplier effect in other sectors of the economy). If an expansion-ary or contractionary monetary policy is also simultaneously implemented (in the case of a quasi-fixed foreign exchange rate, a change in the balance of pay-ments induces a change in the money supply), its impact on output fluctuations will also be substantial.
When analyzing the speed of an economy’s response to the ongoing changes, it is important to consider that the disposable income decline can be perceived as either a temporary or permanent phenomenon, depending on the actual dura-tion of each shock. During the short-term period, economic agents may believe that changes in the terms of trade are only temporary and will have no long-term effect on income level. If such is the case, their response will take the form of a short-term decline in the volume of saving with no consumption decline. In other words, the long-run rate of GDP growth may remain unchanged, but the level of GDP will decline, indicating that in the short run, the growth rate will be changing alongside the movement toward a new GDP level. After a cer-tain period of time, if economic agents realize that the change in the terms of trade has become permanent, society on the whole will become poorer (in terms of purchasing power). If inequality does not change, a poorer society will spend more on consumption and save less. A decline in savings by comparison with the previous equilibrium condition results in an excess of capital retirement over investment and a diminished capital stock. Consequently, GDP declines to a lower level than it would have in response to a temporary shock produced by a change in the terms of trade.
Thus, when considering these preconditions, no distinction is made regard-ing the shrinkage of disposable income in the economy between real and nomi-nal terms because prices are rigid. In reality, this precondition is true only over
20 It is assumed that prices and wages are rigid in nominal terms and that there are some unused production factors in the economy.

293G. Idrisov et al. / Russian Journal of Economics 2 (2016) 279−301
the short run. Moreover, this fact is largely responsible for the differences in the mechanisms whereby changes in the terms of trade influence real GDP and real GDI in the manner described above because it is primarily the change in relative prices that induces a change in GDI that corresponds to the changes in economic agents’ consumption and savings levels. As previously noted, against the backdrop of the improving terms of trade in the first decade of this cen-tury due to the rising prices of energy carriers, the rate of economic growth was accelerating in response to increasing real disposable income. In addition, growth in the prices of energy carriers resulted in increased foreign exchange inflows into Russia. Under conditions of a quasi-fixed exchange rate of the ru-ble, the Bank of Russia resorted to monetary expansion. As a result, there was a short-run boost to economic growth and an increase in gross domestic in-come: over that period, the rate of GDI growth was practically twice as high as that of GDP growth.
Under the present conditions, with a floating foreign exchange rate, the Bank of Russia is making no market interventions to sustain the long-run exchange rate of the ruble against major foreign currencies by purchasing rubles and selling foreign currency. Therefore, there is no Keynesian short-run negative effect of the con-tracting money supply on economic growth.
4.2. Impact of the ruble’s depreciation on the macroeconomic situation
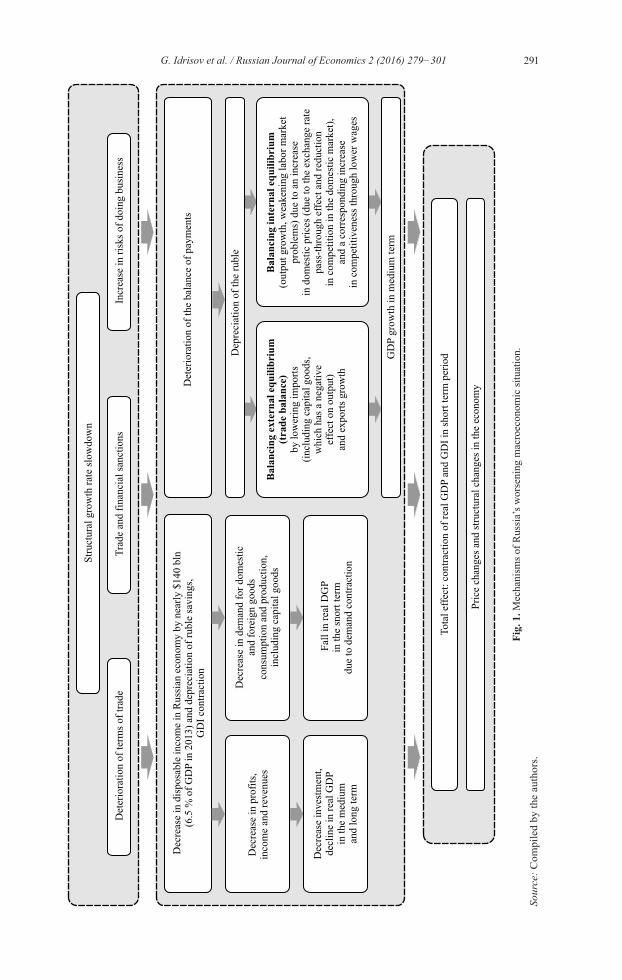
As a result of the dramatic movement of oil prices and certain other Russian exports (natural gas and some metallurgy products), the introduction of financial sanctions and the increased risks associated with engaging in economic activity in Russia, the equilibrium of the trade and capital accounts in the balance of pay-ments was disrupted. In Q4 2014, the balance of trade changed only slightly from Q4 2013 because both imports and exports shrank by nearly 20% (the mecha-nisms of this price drop will be discussed below), whereas the negative balance of capital transactions, which in Q4 2013 amounted to $0.1bn, rose to $31.8bn. These changes significantly weakened the ruble, in spite of the increased key in-terest rate (Fig. 2).
In a market economy, a decline in the national currency’s foreign exchange rate represents the main instrument through which new internal and external equilibriums can be achieved. Depreciation directly influences the incentives for boosting or decreasing output as a result of the single price law for tradable goods and the translation of the foreign exchange rate into prices for non-tradable goods, thus changing the structure of imports and exports.
The first thing that occurs following a national currency’s weakening is the re-establishment of the economy’s external equilibrium. Following the change in the terms of trade but prior to the foreign exchange rate’s adjustment, the volume of imports in terms of value begins to surge above that of ex-ports. The trade balance restores its equilibrium due to rising import prices (denominated in rubles), shrinkage of imports in terms of physical volume and value, and the increasing effectiveness of exports — all in terms of increasing competitiveness and volume growth. The weakening of the national currency is compensated for in a certain proportion (in terms of rubles) by the decline in the foreign currency export proceeds of those goods whose world market
294 G. Idrisov et al. / Russian Journal of Economics 2 (2016) 279−301
prices have likewise declined. The current account is additionally balanced by the shrinking volume of wages paid to foreign employees (if these are de-nominated in rubles), and later also by the shrinkage of foreign production factors as a result of rising service costs in ruble terms and the increased in-come generated by the use of domestic production factors abroad. According to the preliminary balance of payments estimates for January–March 2015 re-leased by the Bank of Russia, the current account enjoyed a positive balance of $23.5bn, having declined slightly in Q1 2014 ($25.9bn). Its slight decline in Q1 2015 can be explained by the accelerated shrinkage in the exports of goods and services (by $39.8bn over the same period in 2014) relative to imports of goods and services (by $31.3bn over the same period in 2014; Bozhechkova et al., 2015).
The capital account also achieves an equilibrium because foreign assets be-gin to cost more for the national economy because of the national currency’s declining exchange rate against major world currencies, whereas domestic as-sets become cheaper for foreigners. These factors improve the capital account in the balance of payments; however, in view of Russia’s increasing financial isolation, any large-scale foreign investment inflow in the immediately near fu-ture is unlikely. In Q1 2015, capital outflow slowed, its net index amounted to $32.6bn for the private sector, which represents a drop by 31.7% in relation to the corresponding index for Q1 2014, and by 58% over Q4 2014 (Bozhechkova et al., 2015).
It is rather difficult to offer any precise quantitative estimates of the ultimate adjustment of the national currency’s exchange rate toward a new equilibrium because its resulting value will depend on the structure of trade and capital bal-ances, economic expectations, the degree of the national economy’s dependence on the world economy, the elasticity of export and import prices (both for inter-
Fig. 2. Movement of prices for Urals Crude Oil, the ruble’s nominal and real effective exchange rate, 2010–2015 (as % relative to the initial period, January 2010 = 100%).
Source: Compiled by the authors on the basis of World Bank data.

295G. Idrisov et al. / Russian Journal of Economics 2 (2016) 279−301
mediate goods and for end-use goods), and many other factors. The May 2015 rate of RUB 48–52 per US dollar corresponds to the real effective exchange rate of the ruble in late 2006 to early 2007. An important development that has im-proved expectations and helped mitigate the anxiety (and was yet another fac-tor responsible for the ruble’s depreciation) is the smoother movement pattern of the nominal foreign exchange rate, whose volatility index in Q1 2015 declined by more than half from Q4 2014.21
The most important outcome of the national currency’s weakening is the progress toward re-establishing domestic economic equilibrium (the in-creasing competitiveness of domestic products results in a growing demand for them, which in the presence of idle production capacities boosts actual output, increasing toward its potential level) and the economy’s trajectory of growth after the decline caused by the deteriorating terms of trade. In a simple model based on the law of one price (all goods are tradable and non-differentiated and there are no transportation or other costs associated with trade22), domestic prices demonstrate an instant increase in response to the national currency’s depreciation . In the real exchange rate, pass-through effects for various price indices can be observed.23 The economic productiv-ity level increases as a result of the inflation-triggered devaluation of the cost of labor (because of the comparatively rigid terms of labor contracts), the de-cline of the relative cost of non-tradable production factors (land, climatic conditions, immovable property), infrastructure, non-tradable goods and services .24 The mechanism behind this growth can be described as follows: first, the competitive level of national products increases relative to foreign economies, along with exports and the import substitution index; secondly, production productivity25 in industry increases as a result of income redistri-bution in the direction of employees to companies, which in turn boosts their production volume (GDP) by means of implementing new investment proj-ects funded by their profits. Later, this competitive level declines based on differences in the growth rates of prices for products, wages, rent payments,
21 The authors’ calculations are based on the daily movement of the USD-to-RUB official exchange rate set by the Bank of Russia. 22 The law of one price implies that the level of domestic prices for Russian exports must be sufficiently close to that of world prices (less transport and foreign trade costs), while the prices for imported foreign goods must be close to world prices plus transport and foreign trade costs. In a real economy, the law of one price may fail to work — as a rule, it involves differences in the levels of competition in the markets, different markups applied by trade intermediaries, and discrimination by producers against various categories of consumers (Goldberg and Knetter, 1997; Idrisov, 2015). 23 As estimated by the RANEPA, on average over the 2000–2014 period, the short-run (one-month) exchange rate pass-through effect in Russia amounts to 3–5% for consumer prices and 5–11% for producer prices. The cor-responding mid-run effect (over 12 months) can be as high as 13–14% for consumer prices, and 30– 47% for producer prices (Idrisov et al., 2015b; Trunin, 2015). 24 Notably, the price declines for non-tradable goods and services is a rather protracted process. First, the for-eign exchange rate pass-through effect pushes up the prices for imported final consumption goods and inter-mediate capital goods, which translates into rising prices for domestic non-tradable goods as result of their increased production costs. The rise in prices for tradable and non-tradable goods also results in a decline in personal disposable incomes and thus to weakening demand (including the demand for non-tradable goods), followed by a decline of real prices. 25 Importantly, domestic producers thus have opportunities for bringing down the prices for their products rela tive to imports, which may translate into their boosted sales volume while maintaining productivity at the same level.

296 G. Idrisov et al. / Russian Journal of Economics 2 (2016) 279−301
which increase those incomes derived by the owners of non-tradable produc-tion factors over the medium and long term. However, the new equilibrium of relative prices may differ significantly from that previously observed, thus determining (alongside of changes in the physical volume of output (GDP)) the movement pattern of real GDI.
Over the short term (in 2015), the disposable income (that is, real GDI) decline in Russia was triggered by the deteriorating terms of trade and is not to be set off by growing exports and import substitution. However, the ruble’s depreciation over the long run will generate adequate preconditions for the national econo-my’s launch onto a development trajectory (GDP growth) that will compensate for the decline of the disposable income generated by trade. One of the important economic and political tasks associated with the achievement of such a trajectory will be to play down the inflation expectations resulting from the ruble’s depre-ciation and significantly influencing the interest rates and savings rates, which then translates into domestic investment.
The two most important mechanisms described above, which determine the relationship between the re-establishment of external and domestic equi-librium and the growth rates of GDP and GDI in real terms — in other words, economic development — may occur simultaneously with other less prominent processes. Thus, in particular, the worsening terms of trade in minerals and energy carriers induce an outflow of the production factors (labor and capital) to those sectors of the Russian economy producing tradable and non-tradable goods that are not raw materials. Alongside the diminishing “resource curse” symptoms (including optimization of the volume and structure of budget ex-penditures, improvement of budget institutions, and shrinkage of the share of government involvement in the economy) and increasing the effectiveness and degree of labor and capital involvement in production, these processes may boost long-term rates of economic growth. However, the worsening terms of trade also exacerbate the risks of macroeconomic and social destabilization and the risks of doing business and are fraught with a higher overall uncertainty for the domestic economy’s development. As a result, the financial market dis-plays negative trends — rising interest rates, declining value of Russian stocks, which in the long run, in combination with the introduced financial and sectoral technological sanctions, may translate into both short and long-run declines in the growth rates of GDP and GDI.
The situation as it evolved in Q4 2014–2015 demonstrates that there has been a slight industrial production decline, whereas the demand for those im-ported products that were formerly sold at lower prices — or for the imported foodstuffs that are subject to retaliatory economic sanctions — is becoming re-oriented not to their domestically produced substitutes, but to imports from other countries; that the unexpectedly robust balance of payments translates into the ruble’s strengthening, making it less dependent on the movement of oil quotes; and that domestic prices gradually become stable but that certain com-modity groups display a significant upward movement potential due to the law of one price.
The volume of production in the processing industry largely depends on sev-eral indices — mostly unrelated between themselves — that induce different pro-duction movement patterns in its core sectors. The most important among these

297G. Idrisov et al. / Russian Journal of Economics 2 (2016) 279−301
indices is the foreign exchange rate because it determines the prices of final and intermediate tradable goods by means of the law of one price; another important index is that of domestic and foreign demand. It is important to note that, un-der the conditions peculiar to 2014–2015, the movement patterns displayed by demand on the foreign and domestic markets differed significantly: the demand for Russia’s exports remained effectively unchanged, whereas Russia’s domestic demand was pushed down by the negative expectations with regard to Russia’s prospects for economic development.
As a result, output in the extraction sector of Russian industry (35% of total output in industry in terms of added value volume) evidently began to decline only as late as December 2014; output in those processing sectors (35% of total industry) in which a short-term revival and production growth were observed (due to the favorable foreign trade situation, the opportunities for finding sub-stitutes for imports from Ukraine, the increased competitiveness of Russian products on the foreign market as a result of the ruble’s declining exchange rate) began to shrink from February–March 2015 onwards; output in those pro-cessing sectors (17% of total industry) that were instantly hit by the negative shock (due to their overall demand shrinkage, high dependence on foreign raw materials and equipment that became unaffordable by virtue of its increased prices or altogether unavailable, fewer opportunities for borrowing and invest-ment project funding) began its downward movement in August 2014. There was practically no output decline in the production and supply of electric en-ergy, gas and running water (13% of total industry) (Idrisov et al., 2015a). This finding indicates that the plummeting real output index has probably not hit rock bottom, but we cannot be absolutely certain about this because there is a possibility that the adaptation potential of the Russian economy’s has been underestimated.
5. Conclusions: Short-term economic measures
Under present conditions of macroeconomic instability and intense evolve-ment of the processes described above, there is no single opinion shared by the state authorities and the expert community — not only regarding the medium-term development prospects for the Russian economy but also regarding how to estimate the current economic situation.
However, current macroeconomic trends form the contours of the main objec-tives of economic policy over the short term:
(1) the need for quick adaptation to the current macroeconomic situation, sus-taining the $20–30 per barrel oil price for a long time;
(2) implementation of measures to achieve sustainable growth in the medium and long terms.
One of the main measures of short-term stabilization is to make decisions regarding the budget deficit in 2016 and the obligations of the state (pensions, salaries).
One of the main short-term stabilization and adaptation measures in response to the current situation is to make an informed decision with respect to allowable values of the state budget deficit in 2016 and the parameters of the performance of state social obligations.

298 G. Idrisov et al. / Russian Journal of Economics 2 (2016) 279−301
Among the more suitable26 but politically unrealizable (now) or less suitable27 options, according to the authors, the best approach from the point of view of the authors is as follows:
(1) budget maneuvering in nominal terms to reallocate part of the expenses from non-productive to productive statements;
(2) the refusal of urgent and tough measures of inflation targeting over the next 2–3 years (including a slight increase above the inflation target); and
(3) covering the budget deficit by spending reserves, privatization, and new borrowings.
This solution will allow a return to a budget deficit of 3% of GDP by 2018 with the structure of the 2004 budget and zero economic growth.
Further, to achieve sustainable growth, it is necessary to substantially enhance doing business institutions. The main aim of the reforms is to catalyze economic growth by reducing costs for business, including compliance costs.
The primary measures to achieve sustainable growth are as follows:• new budget rule: to accumulate all additional revenues from oil exports (above
$30 per barrel) and spend them on productive budget sections that do not lead to renewed liabilities;
• to strengthen the integration agenda in the Asia-Pacific region, including intensification of the FTA with ASEAN, and the SCO countries (China and India);
• to ensure the effective import substitution focus on supporting high-tech pro-duction in various value chains (in the first stage, on technically simple goods), the main condition being competitiveness in foreign markets;
• a complete rejection of industrial policy instruments without clear performance indicators such as direct budget subsidy, additional contribution to the autho-rized capital, import tariff and non-tariff measures;
• to split a fiscal and a non-fiscal custom function; a fiscal custom function should be delegated to the Federal Tax Service;
• the reform of tax policy and currency regulation:− consistent and predictable tax policy — while simultaneously reducing
the tax burden and the costs of following the tax legislation — is necessary to improve the business environment;
− in periods of low oil prices, the tax maneuver (“export duty to extraction tax” replacement) that yields +1.5–2.0 pp of GDP should be finished;
− the rules of currency regulation contain archaic “walls”, causing costs and distortions of effective business models;
• the reform of antitrust policy-FAS activity in key areas of law enforcement is sharply higher than in both developed and developing countries. It is necessary to significantly improve the quality of decision-making in the area of antitrust policy and to reduce the number of investigations;
26 For example, cuts in public spending by 7 p.p. of GDP with redistribution of unproductive expenditures (those for national defense, law enforcement, direct support to the economy, public utilities, public adminis-tration, etc., but excluding the cost of servicing the public debt) to productive expenditures (expenditures on health, education, infrastructure, research activities, etc.). 27 For example, holding a nominal sequestration of budget expenditures with a number of articles in the pro-tected part of the wastage, which might undermine the foundation of future revenue and investment, in addition to even more worsening of the public spending structure.

299G. Idrisov et al. / Russian Journal of Economics 2 (2016) 279−301
• the reform of labor market regulation relating to internal and external migra-tion. Attracting a foreign workforce should be based on a flexible and trans-parent mechanism and should be free from administrative and bureaucratic influence. It should be a significant reduction in the costs of external migration and in in-country spatial mobility of the Russian population.In the context of the domestic economy as a whole, this means that during
periods of instability in the real and financial sectors, the structure of govern-ment measures must be arranged so as not only to compensate economic agents for their losses resulting from changes in the terms of trade but also to ensure a structural recovery of the economy, diversification of output, and develop-ment and boosting of a sustainable performance level of the financial markets. In this sense, the window of opportunity from 2008–2009 is no longer open. The Russian economy survived the global financial and economic crisis practi-cally without any structural changes thanks to the spending opportunities offered by the Reserve Fund, which in part became a precondition for the emergence of the economic situation that presented itself in 2014–2015.
In other words, the situation as it has emerged in 2015 is offering us, in a cer-tain sense, a second chance — on the one hand, for more decisive actions, and on the other, for broader measures on the part of the RF Government aimed at imple-menting structural economic reforms and not to be curbed as soon as the terms of trade and the national economy’s output in real terms demonstrate a “positive turn”, as occurred in 2008–2009.
References
Acemoglu, D., Johnson, S., & Robinson, J. A. (2001). The colonial origins of comparative development: An empirical investigation. American Economic Review, 91 (5), 1369–1401.
Ahuja, M. A., Chalk, M. N. A., Porter, M. N., N’Diaye, M. P., & Nabar, M. M. (2012). An end to China’s imbalances? IMF Working Paper, 12/100.
Arrow, K. J., Dasgupta, P., Goulder, L. H., Mumford, K. J., & Oleson, K. (2010). Sustainability and the measurement of wealth. NBER Working Paper, 16599.
Atkin, T., Caputo, M., Robinson, T., & Wang, H. (2014). Macroeconomic consequences of terms of trade episodes, past and present. RBA Research Discussion Paper, 2014-01. Reserve Bank of Australia.
Baer, W. (2014). The Brazilian economy: Growth and development. Santa Barbara: ABC-CLIO.Baldwin, J. R., & Macdonald, R. (2012). Natural resources, the terms of trade, and real income
growth in Canada: 1870 to 2010. Economic Analysis (EA) Research Paper Series, 79. Statistics Canada.
Bank of Russia (2014a). Monetary policy report. Moscow, December (In Russian).Bank of Russia (2014b). Guidelines for the single State monetary policy in 2015 and for 2016 and
2017. Moscow (In Russian).Barro, R. J. (1991). Economic growth in a cross section of countries. Quarterly Journal of
Economics, 106 (2), 407–443.Barro, R. J., & Sala-i-Martin, X. (1995). Economic growth. New York: McGraw-Hill.Bartelsman, E. J., & Beaulieu, J. J. (2009). A consistent accounting of U.S. productivity growth.
In E. R. Berndt, & C. R. Hulten (Eds.), Hard-to-measure goods and services: Essays in honor of Zvi Griliches (Vol. 67, pp. 449–482). Chicago: University of Chicago Press.
Basu, P., & McLeod, D. (1991). Terms of trade fluctuations and economic growth in developing economies. Journal of Development Economics, 37 (1), 89–110.
Beck, T., & Levine, R. (2004). Stock market, banks, and growth: Panel evidence. Journal of Banking and Finance, 28 (3), 423–442.

300 G. Idrisov et al. / Russian Journal of Economics 2 (2016) 279−301
Bernard, A. B., Jensen, J. B., Redding, S. J., & Schott, P. K. (2007). Firms in international trade. Journal of Economic Perspectives, 21 (3), 105–130.
Bernstein, W. J. (2009). A splendid exchange: How trade shaped the world. New York: Grove Press.
Bleaney, M., & Greenaway, D. (2001). The impact of terms of trade and real exchange rate volatility on investment and growth in Sub-Saharan Africa. Journal of Development Economics, 65 (2), 491–500.
Bloom, D. E., Canning, D., & Sevilla, J. (2003). Geography and poverty traps. Journal of Economic Growth, 8 (4), 355–378.
Bojechkova, A., Knobel, A., & Trunin, P. (2015). The balance of payments is pushing up the ruble. In S. M. Drobyshevsky et al. (Eds.), Real-time monitoring of the economic situation in Russia: Trends and challenges of social and economic development (No. 7, pp. 6–9). Moscow: Gaidar Institute, RANEPA, Russian Foreign Trade Academy (In Russian).
Broadberry, S., & O’Rourke, K. (Eds.) (2013). The Cambridge economic history of modern Europe. Moscow: IEP Publ. (In Russian).
Derygin, A., Drobyshevsky, S., Trunin, P., Mamedov, A., & Zatsepin, V. (2015). Anticrisis budget: Government will support consumption, the defense and the state apparatus. In S. M. Drobyshevsky et al. (Eds.), Real-time monitoring of the economic situation in Russia: Trends and challenges of social and economic development (No. 5, pp. 7–11). Moscow: Gaidar Institute, RANEPA, Russian Foreign Trade Academy (In Russian).
Drobyshevsky, S., & Kazakova, M. (2015). Decomposition of GDP growth rates in Russia during 1999–2015. Ekonomicheskoe Razvitie Rossii, 1, 45–46 (In Russian).
Drobyshevsky, S., Kazakova, M., & Sinelnikov-Murylev, S. (2014). Decomposition of GDP growth rates in Russia during 1999–2014. Ekonomicheskaya Politika, 5, 7–37 (In Russian).
Drobyshevsky, S., Petrenko, V., Turuntseva, M., & Khromov, M. (2015). Socio-economic de-velop ment forecasts for 2015: MED expects “–3”, IEP — “–7”. In S. M. Drobyshevsky et al. (Eds.), Real-time monitoring of the economic situation in Russia: Trends and challenges of social and economic development (No. 3, pp. 5–7). Moscow: Gaidar Institute, RANEPA, Russian Foreign Trade Academy (In Russian).
Feenstra, R. C., Mandel, B. R., Reinsdorf, M. B., & Slaughter, M. J. (2013). Effects of terms of trade gains and tariff changes on the measurement of U.S. productivity growth. American Economic Journal: Economic Policy, 5 (1), 59–93.
Fischer, S. (1993). The role of macroeconomic factors in growth. Journal of Monetary Economics, 32 (3), 485–512.
Gaidar, E. (2006). Fall of the empire: Lessons for modern Russia. Moscow: ROSSPEN (In Russian).Harrison, A. (1996). Openness and growth: A time-series, cross-country analysis for developing
countries. Journal of Development Economics, 48 (2), 419–447.Helpman, E. (2004). The mystery of economic growth. Cambridge, MA: Harvard University
Press.Idrisov, G. (2015). Winners and losers: The effects of changes in the terms of trade for the Russian
industry. Ekonomicheskoe Razvitie Rossii, 4, 26–29 (In Russian).Idrisov, G., Kaukin, A., Morgunova, O., & Turuntseva, M. (2015a). Industry: Trends look worse
than data. In S. M. Drobyshevsky et al. (Eds.), Real-time monitoring of the economic situation in Russia: Trends and challenges of social and economic development (No. 7, pp. 21–24). Moscow: Gaidar Institute, RANEPA, Russian Foreign Trade Academy (In Russian).
Idrisov, G., Kaukin, A., & Ponomarev, Y. (2015b). Exchange rate pass-through: Price increase in production will go on. In S. M. Drobyshevsky et al. (Eds.), Real-time monitoring of the economic situation in Russia: Trends and challenges of social and economic development (No. 4, pp. 12–14). Moscow: Gaidar Institute, RANEPA, Russian Foreign Trade Academy (In Russian).
Idrisov, G., & Sinelnikov-Murylev, S. (2013). Fiscal policy and economic growth. Voprosy Ekonomiki, 8, pp. 35–59 (In Russian).
Idrisov, G., & Sinelnikov-Murylev, S. (2014). Forming sources of long-run growth: How to understand them? Voprosy Ekonomiki, 3, 4–20 (In Russian).
Jawaid, S. T., & Waheed, A. (2011). Effects of terms of trade and its volatility on economic growth: a cross country empirical investigation. Transition Studies Review, 18 (2), 217–229.

301G. Idrisov et al. / Russian Journal of Economics 2 (2016) 279−301
Kazakova, M. (2015). Decomposition of the GDP growth rate: The structural growth rate continued to slow down. In S. M. Drobyshevsky et al. (Eds.), Real-time monitoring of the economic situation in Russia: Trends and challenges of social and economic development (No. 2, pp. 20–21). Moscow: Gaidar Institute, RANEPA, Russian Foreign Trade Academy (In Russian).
Knetter, M. M. (1997). Goods prices and exchange rates: What have we learned? Journal of Economic Literature, 35 (3), 1243–1272.
Kohli, U. (2004). Real GDP, real domestic income, and terms-of-trade changes. Journal of International Economics, 62 (1), 83–106.
Kohli, U. (2006). Real GDP, real GDI, and trading gains: Canada, 1981–2005. International Productivity Monitor, 13, 46–56.
Krueger, A. B., & Lindahl, M. (2001). Education for growth: Why and for whom? Journal of Economic Literature, 39 (4), 1101–1136.
Markusen, J. R. (1983). Factor movements and commodity trade as complements. Journal of international economics, 14 (3), 341–356.
Mauro, P. (1995). Corruption and growth. Quarterly Journal of Economics, 110 (3), 681–712.Mendoza, E. G. (1997). Terms-of-trade uncertainty and economic growth. Journal of Development
Economics, 54 (2), 323–356.Mundell, R. A. (1957). International trade and factor mobility. American Economic Review, 47 (3)
321–335.Murphy, K., Shleifer, A., & Vishny, R. (1991). The allocation of talent: Implications for growth.
Quarterly Journal of Economics, 106 (2), 503–530.Nalewaik, J. J. (2012). Estimating probabilities of recession in real time using GDP and GDI.
Journal of Money, Credit and Banking, 44 (1), 235–253.Obstfeld, M., Rogoff, K. S., & Wren-Lewis, S. (1996). Foundations of international macroeco-
nomics. Cambridge, MA: MIT press.Rodrik, D. (2006). Growth strategies. In: P. Aghion, & S. N. Durlauf (eds.). Handbook of economic
growth (pp. 967–1014). Amsterdam: Elsevier, .Roubini, N., & Sala-i-Martin, X. (1992). Financial repression and economic growth. Journal of
Development Economics, 39 (1), 5–30.Sala-i-Martin, X. (1997). I just ran 2 million regressions. American Economic Review, 87 (2),
178–183.Sinelnikov, S. (1995). The fiscal crisis in Russia: 1985–1995. Moscow: Evrasia (In Russian).Taylor, M. P. (2003). Purchasing power parity. Review of International Economics, 11 (3), 436–452.Temple, J., & Johnson, P. A. (1998). Social capability and economic growth. Quarterly Journal of
Economics, 113 (3), 965–990.Trunin, P. (2015). Monetary policy and inflation. In S. M. Drobyshevsky et al. (Eds.), Real-time
monitoring of the economic situation in Russia: Trends and challenges of social and economic development (No. 1, pp. 5–10). Moscow: Gaidar Institute, RANEPA, Russian Foreign Trade Academy (In Russian).
World Bank (2013). Is fiscal policy the answer? А developing country perspective. Washington, DC.