Terahertz time-domain spectroscopy of absorbing … time-domain spectroscopy of absorbing materials...
17
Terahertz Science and Technology, ISSN 1941-7411 Vol.7, No.2, June 2014 53 Invited Paper Terahertz time-domain spectroscopy of absorbing materials and of metamaterials J.-L. Coutaz 1* , M. Bernier 1 , F. Garet 1 , S. Joly 1,a , Y. Miyake 2 , H. Minamide 2 , E. Lheurette 3 , and D. Lippens 3 1 IMEP-LAHC, UMR CNRS 5130, University of Savoie, 73376 Le Bourget du Lac Cedex, France 2 RIKEN, Center for Advanced Photonics, Aoba-ku, Sendai, Miyagi 980-0845, Japan 3 IEMN, UMR CNRS 8520, Avenue Poincaré, CS 60069, 59652 Villeneuve d’Ascq Cedex, France a) Present address: IMS, University of Bordeaux, France *1 Email: [email protected] (Received January 2, 2014) Abstract: This paper gives a review of recent works we performed in view of characterizing natural materials and metamaterials by terahertz time-domain spectroscopy. We address materials that exhibit a low transmittance in given narrow spectral bands or over the whole experimental spectral window. We give rules to select the most adapted technique for a precise characterization of the sample, i.e. for determining with the best precision the refractive index as well as the coefficient of absorption of the material of the tested sample. The procedures are validated and illustrated by examples of characterization of materials like maltose and DAST, and of fishnet metamaterials that exhibit a left-handed character or a chiral behaviour. Keywords: Terahertz time-domain spectroscopy, Metamaterials. doi: 10.11906/TST.053-069.2014.06.05 1. Introduction Since the pioneering works of D. Auston [1] and the IBM teams (D. Grischkowsky [2], and Y. Pastol, G. Arjavalingam, J.-M. Halbout [3]) in the late 80’s, terahertz time-domain spectroscopy (THz-TDS) has become an essential tool to study the electromagnetic response of materials and devices in the far infrared region [4]. It allows researchers to determine, in a short recording time and at room temperature, the spectral parameters of the tested samples with a large dynamics over a very broad frequency range. Moreover, as magnitude and phase of the signals are simultaneously measured, both phase propagation parameters (phase or group velocities, refractive index, and effective index) and extinction parameters (absorption coefficient, peaks of resonance) are obtained. Thus it has been applied to characterize most of natural materials including dielectrics, metals, semiconductors, liquids, superconductors, gases… Concurrently, the technique has addressed the electromagnetic response of devices, like wave-guides (planar guides and fibers), multilayers, couplers for surface wave excitation, etc., and of artificial materials, like photonic bandgap crystals, metamaterials and frequency selective surfaces. In most cases, THz-TDS shows amazing performances: the refractive index of materials is obtained with a precision better than 0.1% and their absorption can be measured down to 0.1 cm -1 [5], over
Transcript of Terahertz time-domain spectroscopy of absorbing … time-domain spectroscopy of absorbing materials...
Terahertz Science and Technology, ISSN 1941-7411 Vol.7, No.2, June 2014
53
Invited Paper
Terahertz time-domain spectroscopy of absorbing materials and of metamaterials
J.-L. Coutaz 1*, M. Bernier 1, F. Garet 1, S. Joly 1,a , Y. Miyake 2, H. Minamide 2, E. Lheurette 3, and D. Lippens 3 1 IMEP-LAHC, UMR CNRS 5130, University of Savoie, 73376 Le Bourget du Lac Cedex, France
2 RIKEN, Center for Advanced Photonics, Aoba-ku, Sendai, Miyagi 980-0845, Japan 3 IEMN, UMR CNRS 8520, Avenue Poincaré, CS 60069, 59652 Villeneuve d’Ascq Cedex, France
a) Present address: IMS, University of Bordeaux, France *1 Email: [email protected]
(Received January 2, 2014)
Abstract: This paper gives a review of recent works we performed in view of characterizing natural materials and metamaterials by terahertz time-domain spectroscopy. We address materials that exhibit a low transmittance in given narrow spectral bands or over the whole experimental spectral window. We give rules to select the most adapted technique for a precise characterization of the sample, i.e. for determining with the best precision the refractive index as well as the coefficient of absorption of the material of the tested sample. The procedures are validated and illustrated by examples of characterization of materials like maltose and DAST, and of fishnet metamaterials that exhibit a left-handed character or a chiral behaviour.
Keywords: Terahertz time-domain spectroscopy, Metamaterials.
doi: 10.11906/TST.053-069.2014.06.05
1. Introduction
Since the pioneering works of D. Auston [1] and the IBM teams (D. Grischkowsky [2], and Y. Pastol, G. Arjavalingam, J.-M. Halbout [3]) in the late 80’s, terahertz time-domain spectroscopy (THz-TDS) has become an essential tool to study the electromagnetic response of materials and devices in the far infrared region [4]. It allows researchers to determine, in a short recording time and at room temperature, the spectral parameters of the tested samples with a large dynamics over a very broad frequency range. Moreover, as magnitude and phase of the signals are simultaneously measured, both phase propagation parameters (phase or group velocities, refractive index, and effective index) and extinction parameters (absorption coefficient, peaks of resonance) are obtained. Thus it has been applied to characterize most of natural materials including dielectrics, metals, semiconductors, liquids, superconductors, gases… Concurrently, the technique has addressed the electromagnetic response of devices, like wave-guides (planar guides and fibers), multilayers, couplers for surface wave excitation, etc., and of artificial materials, like photonic bandgap crystals, metamaterials and frequency selective surfaces. In most cases, THz-TDS shows amazing performances: the refractive index of materials is obtained with a precision better than 0.1% and their absorption can be measured down to 0.1 cm-1 [5], over
Terahertz Science and Technology, ISSN 1941-7411 Vol.7, No.2, June 2014
54
a spectrum ranging from typically 0.1 THz up to 10 THz. Moreover, like in radar technology, the time-domain technique permits some time-windowing of the recorded data, in order to reject unwanted signals (for example rebounds in the set up optics) and artifacts.
The main drawback of THz-TDS is its poor frequency resolution, which is proportional to the inverse duration of the time-equivalent recording, i.e. typically a few GHz.
In this paper, we will review some of our recent researches on THz-TDS applied to characterize samples whose transmission is below the noise level for given spectral bands or over the whole experimental frequency window. In the latter case, reflection THz-TDS should be employed instead of transmission THz-TDS. For moderately absorbing materials, we will give rules to select the most accurate technique in relation to the sample to be characterized. Our rules are experimentally validated by characterizing samples of epoxy (Stycast). When the sample shows high absorption spectral bands, the loss of the signal phase in the bands prevents to employ classical extraction techniques. Nevertheless, we will show that an accurate determination of the refractive index and of the absorption coefficient can be achieved by combining both THz-TDS measurements in transmission and in reflection. For such samples, a rather good determination of the refractive index can also be obtained from transmission THz-TDS data with the help of a Kramers-Kronig (KK) analysis. Finally, we will present how THz-TDS permits to study the amazing electromagnetic properties of metamaterials in the THz range. We will give the example of both left-handed and chiral fishnet-like metamaterials.
2. Basic principles of extraction of sample parameters using THz-TDS
In THz-TDS set ups, an emitting antenna triggered by a train of femtosecond laser pulses generates ultra-short electromagnetic bursts, whose duration is of the order of the picosecond and thus whose spectrum exceeds the THz limit. The receiving antenna is also synchronously triggered by a part of the same laser beam, which is time-delayed as compared to the emitting one. In most common systems, an optical delay line permits to adjust the time delay between emitting and reading pulses while, in some recent systems, an equivalent time-delay is achieved through the beating of two independent lasers with a slightly different repetition rate. The most popular THz-TDS systems make use of photo-conducting switches as THz antennas, fabricated from ultrafast semiconductors like low-temperature grown GaAs for operation at 0.8-µm optical wavelength, or implanted InGaAs for excitation at 1.55-µm. The physics described below will be related to such photo-conducting systems, but other techniques may be employed like optical rectification and electro-optic detection in nonlinear crystals. The receiving antenna delivers a photocurrent signal S proportional to the convolution product of the impinging THz pulse E-field ETHz(t) and of the photo-carrier density N(t) generated by the laser pulse. By varying the time delay τ between both, sampling of the THz pulses is performed:
Terahertz Science and Technology, ISSN 1941-7411 Vol.7, No.2, June 2014
55
( ) ( ) ( )THzS E t N t dtτ τ+∞
−∞
∝ −∫ . (1)
By a numerical Fourier transformation of (1), the complex spectrum S(ω) of S(τ) is obtained. Because S(τ) is a convolution product, its Fourier transform is simply a product of spectra:
( ) ( ) ( )*THzS E Nω ω ω∝ . (2)
The sample to be characterized is inserted in the THz-TDS system and S(τ) is measured. The reference signal Sref(τ) is also measured without sample. The experimental coefficient of transmission texp(ω) of the sample is given by the ratio of both signal and reference spectra:
( )( )
( ) ( ) ( )( ) ( )
( )*
*exp THz laser
expref THz laser
t E NSt
S E Nω ω ωω
ωω ω ω
= = . (3)
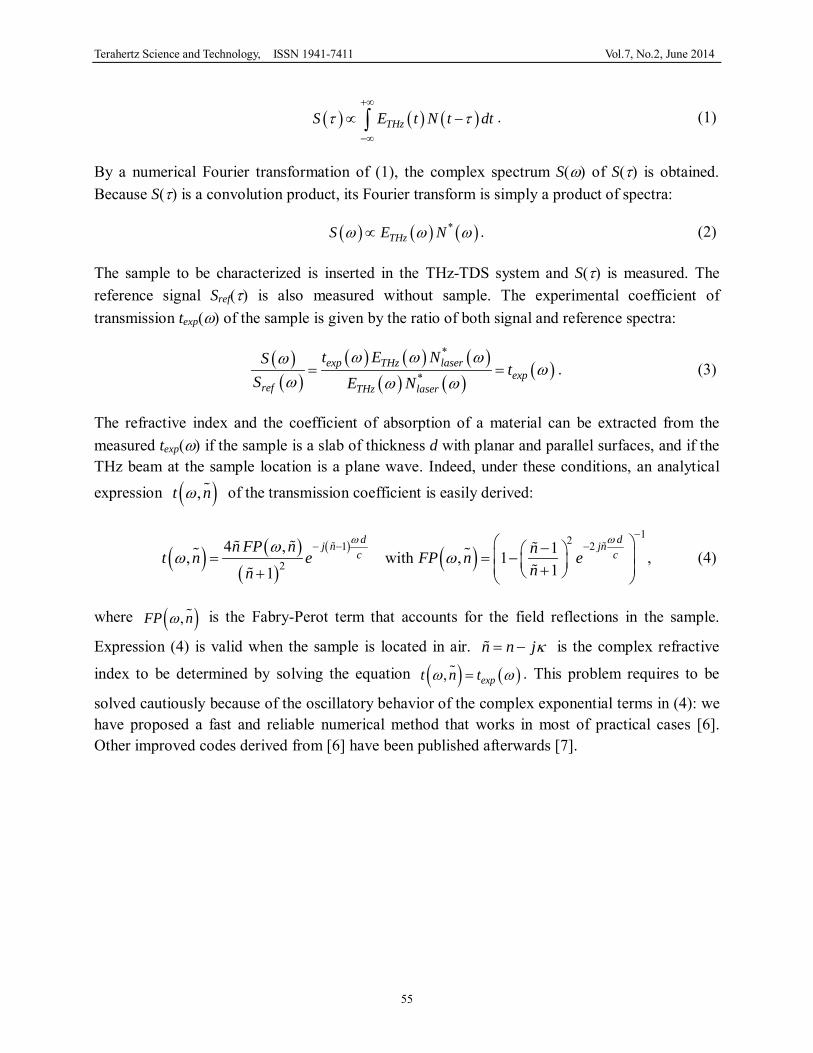
The refractive index and the coefficient of absorption of a material can be extracted from the measured texp(ω) if the sample is a slab of thickness d with planar and parallel surfaces, and if the THz beam at the sample location is a plane wave. Indeed, under these conditions, an analytical expression ( ),t nω of the transmission coefficient is easily derived:
( ) ( )( )
( )( )
121 2
24 , 1, with , 1
11
d dj n jnc cn FP n nt n e FP n e
nn
ω ωωω ω
−− − − − = = − + +
, (4)
where ( ),FP nω is the Fabry-Perot term that accounts for the field reflections in the sample.
Expression (4) is valid when the sample is located in air. n n jκ= − is the complex refractive
index to be determined by solving the equation ( ) ( ), expt n tω ω= . This problem requires to be
solved cautiously because of the oscillatory behavior of the complex exponential terms in (4): we have proposed a fast and reliable numerical method that works in most of practical cases [6]. Other improved codes derived from [6] have been published afterwards [7].
Terahertz Science and Technology, ISSN 1941-7411 Vol.7, No.2, June 2014
56
0
50
100
150
200
0 0.5 1 1.5 2 2.5
MiniZIMEP-LAHCFTIR
Abs
orpt
ion
(cm
-1)
Frequency (THz)
0
50
100
150
200
0 0.5 1 1.5 2
MiniZIMEP-LAHCFTIR
Abs
orpt
ion
(cm
-1)
Frequency (THz) (a) (b)
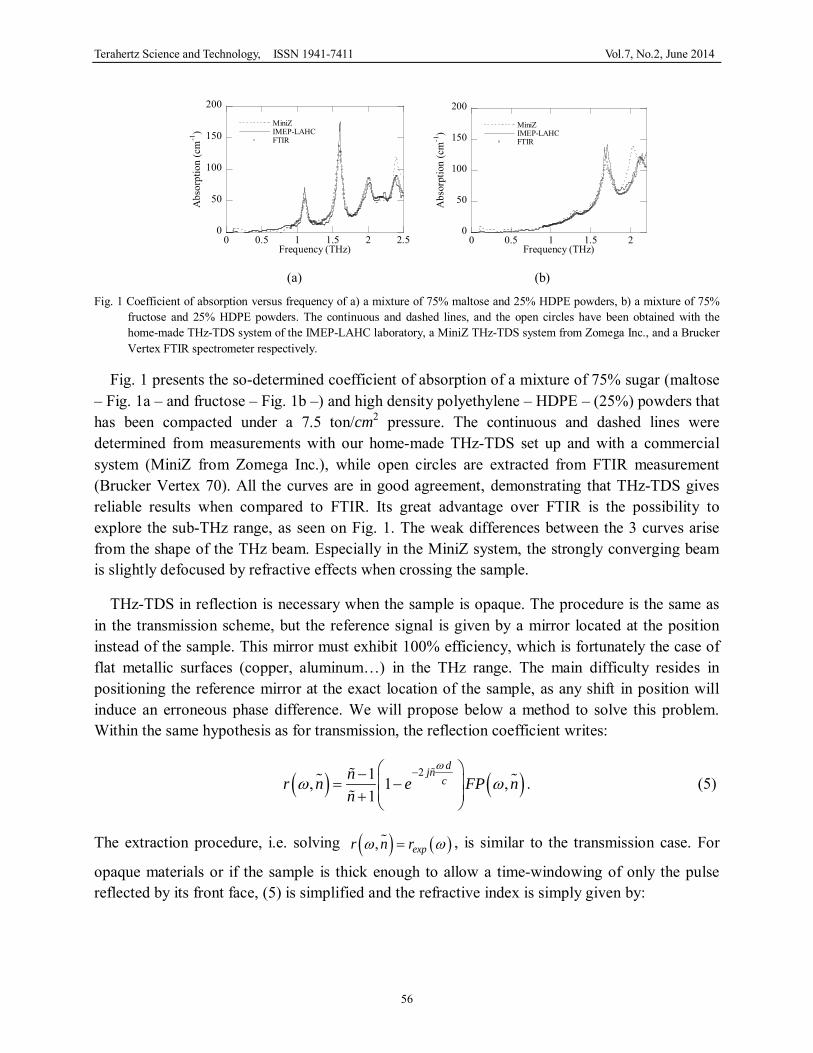
Fig. 1 Coefficient of absorption versus frequency of a) a mixture of 75% maltose and 25% HDPE powders, b) a mixture of 75% fructose and 25% HDPE powders. The continuous and dashed lines, and the open circles have been obtained with the home-made THz-TDS system of the IMEP-LAHC laboratory, a MiniZ THz-TDS system from Zomega Inc., and a Brucker Vertex FTIR spectrometer respectively.
Fig. 1 presents the so-determined coefficient of absorption of a mixture of 75% sugar (maltose – Fig. 1a – and fructose – Fig. 1b –) and high density polyethylene – HDPE – (25%) powders that has been compacted under a 7.5 ton/cm2 pressure. The continuous and dashed lines were determined from measurements with our home-made THz-TDS set up and with a commercial system (MiniZ from Zomega Inc.), while open circles are extracted from FTIR measurement (Brucker Vertex 70). All the curves are in good agreement, demonstrating that THz-TDS gives reliable results when compared to FTIR. Its great advantage over FTIR is the possibility to explore the sub-THz range, as seen on Fig. 1. The weak differences between the 3 curves arise from the shape of the THz beam. Especially in the MiniZ system, the strongly converging beam is slightly defocused by refractive effects when crossing the sample.
THz-TDS in reflection is necessary when the sample is opaque. The procedure is the same as in the transmission scheme, but the reference signal is given by a mirror located at the position instead of the sample. This mirror must exhibit 100% efficiency, which is fortunately the case of flat metallic surfaces (copper, aluminum…) in the THz range. The main difficulty resides in positioning the reference mirror at the exact location of the sample, as any shift in position will induce an erroneous phase difference. We will propose below a method to solve this problem. Within the same hypothesis as for transmission, the reflection coefficient writes:
( ) ( )21, 1 ,1
djncnr n e FP n
n
ω
ω ω− − = −
+
. (5)
The extraction procedure, i.e. solving ( ) ( ), expr n rω ω= , is similar to the transmission case. For
opaque materials or if the sample is thick enough to allow a time-windowing of only the pulse reflected by its front face, (5) is simplified and the refractive index is simply given by:
Terahertz Science and Technology, ISSN 1941-7411 Vol.7, No.2, June 2014
57
( ) ( )( )
11,1 1
exp
exp
rnr n nn r
ωω
ω+−
≈ ⇒ ≈+ −
. (6)
The precision of the extraction is limited by several effects [8]: the beam shape that is not parallel, a bad positioning of the sample (i.e. not perpendicular to the beam), the shape of the sample (not parallel faces) and the precision on its measured thickness, and the experimental noise. In reflection THz-TDS, a bad positioning of the reference mirror is the main limiting effect. Here, we will focus on the noise issue. Taking into account the noise of the laser and the shot noise in the emitting antenna (let us notice that both are transmitted or reflected by the sample), the shot noise in the receiving antenna, the Johnson noise in the detector and the noise in the detection electronics, one can show that the noise-limited precision on ( )expt ω [9] or ( )expr ω [10]
writes:
( ) ( ) ( ) ( ) ( ) ( )
( ) ( ) ( ) ( ) ( ) ( )
2 2
2 2
,
.
exp exp
exp exp
t A t B t C
r A r B r C
ω ω ω ω ω
ω ω ω ω ω
∆ = + +
∆ = + +
(7)
The A, B and C coefficients are specific to each THz-TDS system. The precision on n is obtained by differentiating ( ),t nω or ( ),r nω and supposing that the noise on the phase is
random. In the simplified case of a record of only the first THz pulse (temporal rebounds are filtered), one gets:
( ) ( ) ( )( ) ( )
( )( ) ( ) ( )( )
( ) ( )( )
3
2 22 2
3
2 2
22
1 1 1,
4 1 1transmission:
2 12 1 ,
1 1 1
1 cos 2 1 sinreflection: 2 .
2 1 2 cos
n n n nn e t
n n n
nn
c n n n n
r r rcn rr r
κββ
β
ωαβ
φ φα
ω φ
+ + + −∆ ∆ − + + − ∆ ∆ − + + + −
+ − + −∆ ∆ ∆
− +
(8)
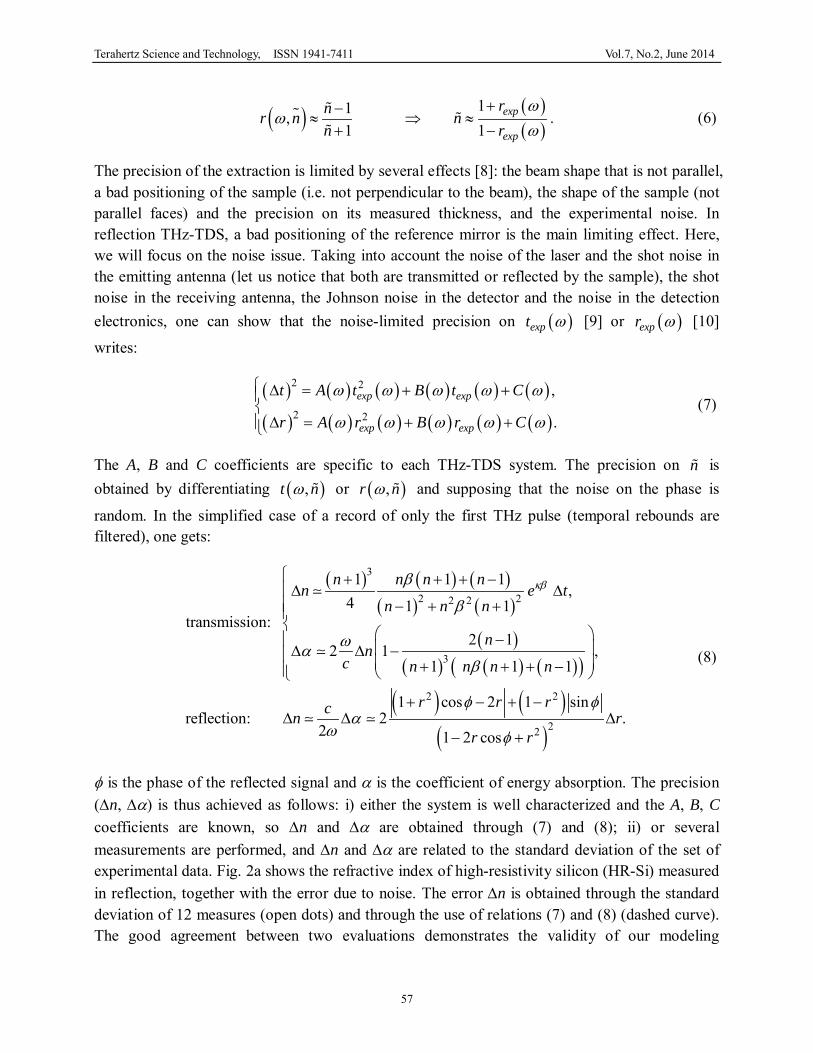
φ is the phase of the reflected signal and α is the coefficient of energy absorption. The precision (∆n, ∆α) is thus achieved as follows: i) either the system is well characterized and the A, B, C coefficients are known, so ∆n and ∆α are obtained through (7) and (8); ii) or several measurements are performed, and ∆n and ∆α are related to the standard deviation of the set of experimental data. Fig. 2a shows the refractive index of high-resistivity silicon (HR-Si) measured in reflection, together with the error due to noise. The error ∆n is obtained through the standard deviation of 12 measures (open dots) and through the use of relations (7) and (8) (dashed curve). The good agreement between two evaluations demonstrates the validity of our modeling
Terahertz Science and Technology, ISSN 1941-7411 Vol.7, No.2, June 2014
58
approach. Above 1.7 THz, our perturbation model is no more valid because of the low value of the reflected field: the noise increases, and calculated and measured ∆n differ. Because of the low loss in HR-Si, the reflection technique is not adapted to a precise determination of n, resulting here in a very bad precision (∆n/n ~30% at 1.5 THz). On the contrary, characterization of Stycast (epoxy glue used at cryogenic temperatures) in transmission is very accurate (Fig. 2b). In the 0.1-1.6 THz experimentally available range, the refractive index n is almost constant and equal to ~2.25, and the precision ∆n for a 0.81-mm thick sample is as good as 0.01%. Let us warn the reader that this amazing precision is only the noise contribution to which other sources of error must be added. In this case, the actual precision is mostly limited by the error on the sample thickness and on the sample positioning (angle of incidence not exactly equal to 0°).
00.5
11.5
22.5
33.5
4
0.2 0.4 0.6 0.8 1 1.2 1.4 1.6
index nDn_expDn_calc
Ref
ract
ive
inde
x
Frequency (THz)
2
2.1
2.2
2.3
2.4
0.000
0.002
0.004
0.006
0.008
0.010
0.3 0.6 0.9 1.2 1.5
n1.62 mm0.81 mm
Refr
activ
e in
dex
n
Precision ∆n
Frequency (THz) (a) (b)
Fig. 2 (a) Index of refraction versus frequency of HR-Si (continuous line with black markers) measured in reflection, together with the error calculated using relations (7) and (8) (continuous line), and measured (open circles); (b) Index of refraction versus frequency of Stycast (continuous line) measured in transmission. The dashed and dotted lines correspond to the experimental error due to noise for respectively a 0.81-mm and a 1.62-mm thick sample.
3. Choice of a transmission or reflection THz-TDS for optimized extraction [10]
Fig. 3 illustrates the necessary choice of the most adapted technique to accurately study a sample, i.e. reflection or transmission THz-TDS. For thick transparent materials, transmission THz-TDS is definitively better as phase accumulation during propagation across the sample is rather big and leads to a precise determination of n. On the other hand, such a technique is impossible with opaque samples, for which the transmitted signal stands below the detector noise level and thus reflection THz-TDS is compulsory. Materials of intermediate transparency require a dedicated study that we perform starting from relations (8). For sake of simplicity, we suppose that the samples are thick enough to save only the first transmitted or reflected THz pulse, by rejecting the Fabry-Perot rebounds by an appropriate time-windowing. Therefore ( ),t nω and
( ),r nω , previously given by (4) and (5), simplify into:
Terahertz Science and Technology, ISSN 1941-7411 Vol.7, No.2, June 2014
59
0.001
0.01
0.1
1
10
1 2 3 4 5 6κ
n
β=1 (d=50 祄
β=10 (d=0.5 mm @ 1 THz)
β=100 (d=5 mm @ 1 THz)
β=1000 (d=5 cm @ 1 THz)
reflection
transmission
( ) ( )( )
( ) ( )12
4 1, ; ,11
j nn j n jt n e e r nn jn j
β κβκ κω ωκκ
− − −− − −= =
+ −+ − , (9)
Even if neglecting the Fabry-Perot effect as done to get (9), the thickness of the sample influences the transmission (but not the reflection) through the coefficient /d cβ ω= , which will serve as a parameter for our comparison study. Using relations (7) and (8) with the A, B, C coefficients of our THz-TDS set up, we compute the ratio of the precisions obtained in reflection and in transmission, i.e. ∆nr/∆nt, for a given value of β.
(a) (b)
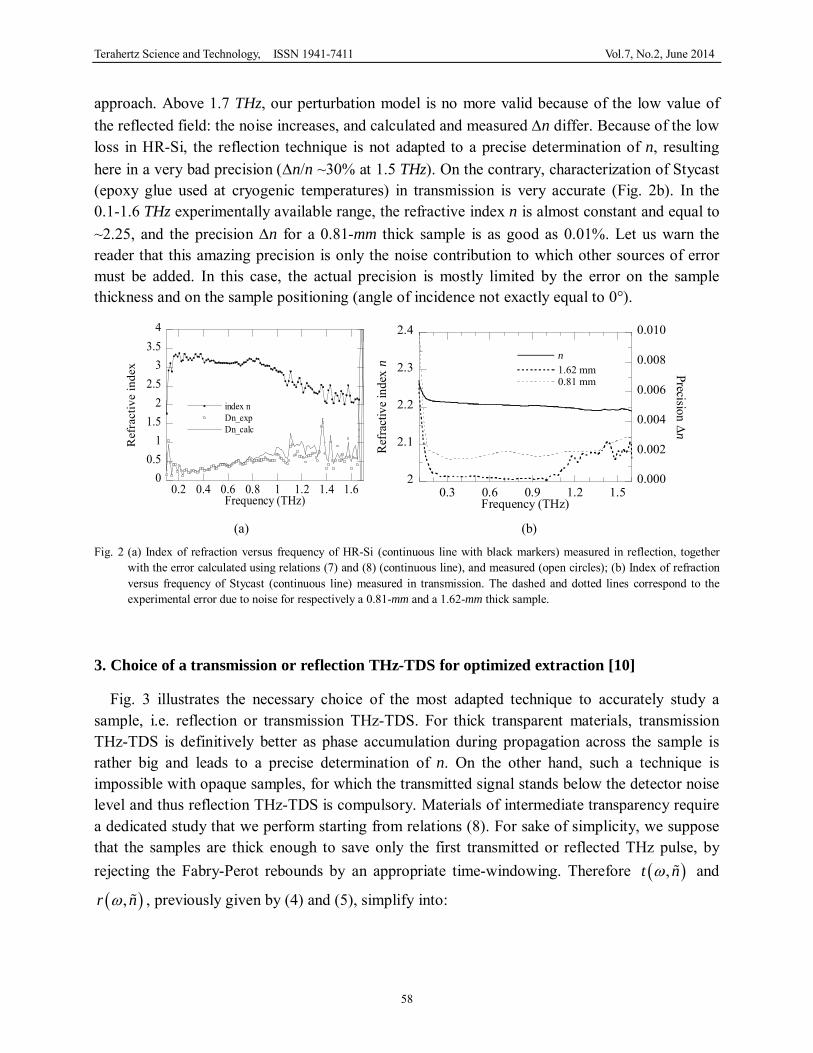
Fig. 3 (a) 3D-map of the ratio ∆nr /∆nt versus n and κ for β=20; (b) limit between the reflection and transmission schemes for an optimized parameter extraction.
Fig. 3 shows the map ∆nr/∆nt versus n and κ for β = 20 that corresponds, for example, to a 1-mm thick sample studied at f = 0.955 THz. When ∆nr/∆nt >1, it is preferable to employ transmission THz-TDS to get a better precision. The result shown in Fig. 3a can be interpreted as follows: At higher κ (high absorption), the transmitted signal is weak and tends to zero. Thus reflection THz-TDS becomes more accurate. This is also the case when both n and κ are small, as the propagation phase in transmission is of the order or smaller than the one in reflection. Fig. 3b presents the limit, plotted in the n-κ plan, between transmission and reflection THz-TDS for an optimized extraction of n. Each curve is drawn for a different β. For each β, the limits do not vary strongly with n but it depends largely on κ. As an example, for a 5-mm thick sample at 1 THz, the limit is around κ=0.6, i.e. α=63 cm-1. Consequently, for 5-mm thick samples with an absorption stronger than α=63 cm-1, reflection is more precise than transmission.
4. Materials with strong absorption peaks or bands [11]
In any THz-TDS set up, the distance between the emitting and receiving antennas is not measured with a precision better than the involved THz wavelengths. Moreover, when a sample
Terahertz Science and Technology, ISSN 1941-7411 Vol.7, No.2, June 2014
60
is located in the THz beam and as soon as it is thicker than the THz wavelength, the induced phase change is very large and thus it is only known modulo 2π. One gets rid of this difficulty by assuming that the phase difference due to propagation in the sample varies almost linearly with frequency (due to the ω/c dependence) and thus should be null at ω = 0. Let us notice that this hypothesis may be wrong if there exist some resonances outside the experimental frequency window, at lower frequencies.
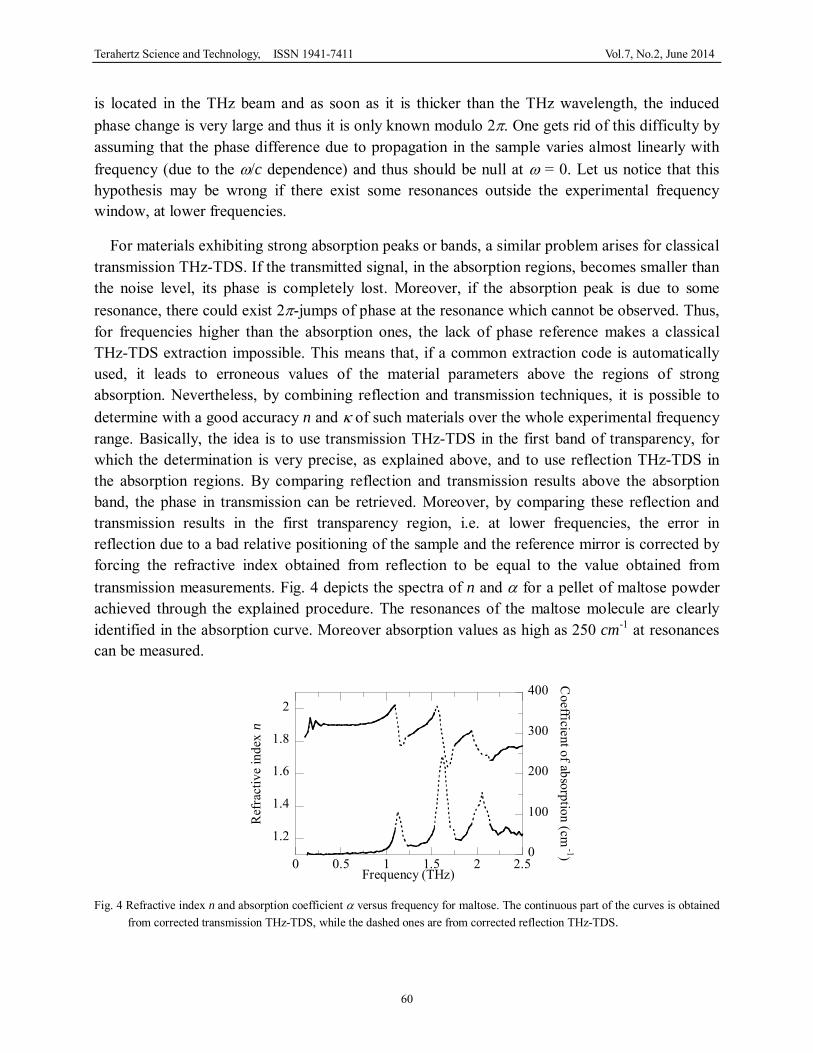
For materials exhibiting strong absorption peaks or bands, a similar problem arises for classical transmission THz-TDS. If the transmitted signal, in the absorption regions, becomes smaller than the noise level, its phase is completely lost. Moreover, if the absorption peak is due to some resonance, there could exist 2π-jumps of phase at the resonance which cannot be observed. Thus, for frequencies higher than the absorption ones, the lack of phase reference makes a classical THz-TDS extraction impossible. This means that, if a common extraction code is automatically used, it leads to erroneous values of the material parameters above the regions of strong absorption. Nevertheless, by combining reflection and transmission techniques, it is possible to determine with a good accuracy n and κ of such materials over the whole experimental frequency range. Basically, the idea is to use transmission THz-TDS in the first band of transparency, for which the determination is very precise, as explained above, and to use reflection THz-TDS in the absorption regions. By comparing reflection and transmission results above the absorption band, the phase in transmission can be retrieved. Moreover, by comparing these reflection and transmission results in the first transparency region, i.e. at lower frequencies, the error in reflection due to a bad relative positioning of the sample and the reference mirror is corrected by forcing the refractive index obtained from reflection to be equal to the value obtained from transmission measurements. Fig. 4 depicts the spectra of n and α for a pellet of maltose powder achieved through the explained procedure. The resonances of the maltose molecule are clearly identified in the absorption curve. Moreover absorption values as high as 250 cm-1 at resonances can be measured.
1.2
1.4
1.6
1.8
2
0
100
200
300
400
0 0.5 1 1.5 2 2.5
Ref
ract
ive
inde
x n
Coefficient of absorption (cm
-1)
Frequency (THz) Fig. 4 Refractive index n and absorption coefficient α versus frequency for maltose. The continuous part of the curves is obtained
from corrected transmission THz-TDS, while the dashed ones are from corrected reflection THz-TDS.
Terahertz Science and Technology, ISSN 1941-7411 Vol.7, No.2, June 2014
61
This method can be applied for any sample showing frequency regions of very low transmission or even of no transmission. This is the case, as previously illustrated, for materials that absorb energy (transformation of electromagnetic energy into heat) because of the excitation of resonances (ro -vibration of molecules, photons, etc.). But the method can also treat the case of devices exhibiting electromagnetic resonances, like Fabry-Pérot resonators, photonic crystals with photonic forbidden bandgaps, waveguides, metamaterials…
5. Combined THz-TDS and Kramers-Kronig analysis [12]
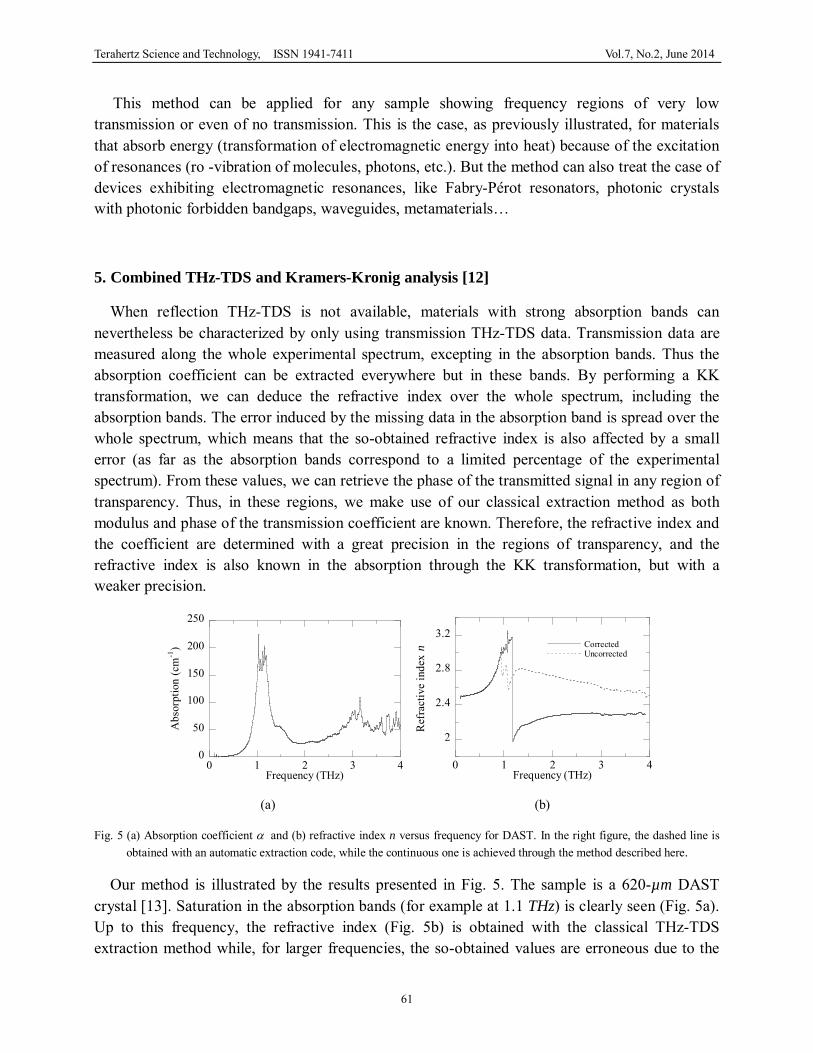
When reflection THz-TDS is not available, materials with strong absorption bands can nevertheless be characterized by only using transmission THz-TDS data. Transmission data are measured along the whole experimental spectrum, excepting in the absorption bands. Thus the absorption coefficient can be extracted everywhere but in these bands. By performing a KK transformation, we can deduce the refractive index over the whole spectrum, including the absorption bands. The error induced by the missing data in the absorption band is spread over the whole spectrum, which means that the so-obtained refractive index is also affected by a small error (as far as the absorption bands correspond to a limited percentage of the experimental spectrum). From these values, we can retrieve the phase of the transmitted signal in any region of transparency. Thus, in these regions, we make use of our classical extraction method as both modulus and phase of the transmission coefficient are known. Therefore, the refractive index and the coefficient are determined with a great precision in the regions of transparency, and the refractive index is also known in the absorption through the KK transformation, but with a weaker precision.
0
50
100
150
200
250
0 1 2 3 4
Abs
orpt
ion
(cm
-1)
Frequency (THz)
2
2.4
2.8
3.2
0 1 2 3 4
CorrectedUncorrected
Ref
ract
ive
inde
x n
Frequency (THz) (a) (b)
Fig. 5 (a) Absorption coefficient α and (b) refractive index n versus frequency for DAST. In the right figure, the dashed line is obtained with an automatic extraction code, while the continuous one is achieved through the method described here.
Our method is illustrated by the results presented in Fig. 5. The sample is a 620-µm DAST crystal [13]. Saturation in the absorption bands (for example at 1.1 THz) is clearly seen (Fig. 5a). Up to this frequency, the refractive index (Fig. 5b) is obtained with the classical THz-TDS extraction method while, for larger frequencies, the so-obtained values are erroneous due to the
Terahertz Science and Technology, ISSN 1941-7411 Vol.7, No.2, June 2014
62
lack of transmitted THz signal in the first absorption band centered around 1.1 THz. Performing a KK analysis over the entire experimental spectral range (0-4 THz), we get with good a approximation the refractive index of DAST in the second region of transparency, i.e. over ~1.2 THz. In this region, this so-determined value of n is then compared to the uncorrected one, which allows us to know the expected phase in transmission and thus to correct the measured value from the modulo 2π phase jump artifact. The phase-corrected index is plotted as a thick line in Fig. 5a. In the absorption band around 1.1 THz, the plotted refractive index is determined by the KK transformation, and thus it is quite noisy.
6. Characterization of fishnet-like metamaterials
Because of the sub-millimeter wavelength of THz waves, metamaterials for the THz regime can be manufactured using mechanical tools or MEMS technologies. Therefore, a large variety of such THz metamaterials have been fabricated and investigated. They show amazing properties, like left-handed character, chirality, high nonlinearity, etc. To achieve a left-handed response, both dielectric permittivity ε and magnetic permeability µ must be ideally negative. This is observed in the vicinity of resonances. Thanks to the KK transformation, the real part of the permittivity or permeability resembles the spectral derivative of its imaginary part. Thus, when the imaginary part (electromagnetic losses) shows a peak of resonance, the real part exhibits a peak followed by a dip. For smartly designed materials, permittivity or permeability values could be negative at the dip. By introducing in the metamaterial micronic structures showing a dipolar resonance and others showing a magnetic resonance (it could be the same structures), electric and magnetic resonances are excited. Moreover, by a proper design, both resonances may occur at the same frequency, for which the metamaterial exhibits a left-handed character. This was the original bright idea by Pendry [14], subsequently demonstrated by Smith and Schulz [15] who fabricated a left-handed 2D material made of a collection of vertical poles (dielectric resonance) and vertical loops (magnetic resonance). Unfortunately, these materials can only be excited under an oblique incidence, to make the exciting fields well oriented within the dipolar moments. In the THz range, this makes rather tricky the material fabrication [16].
(a) (b)
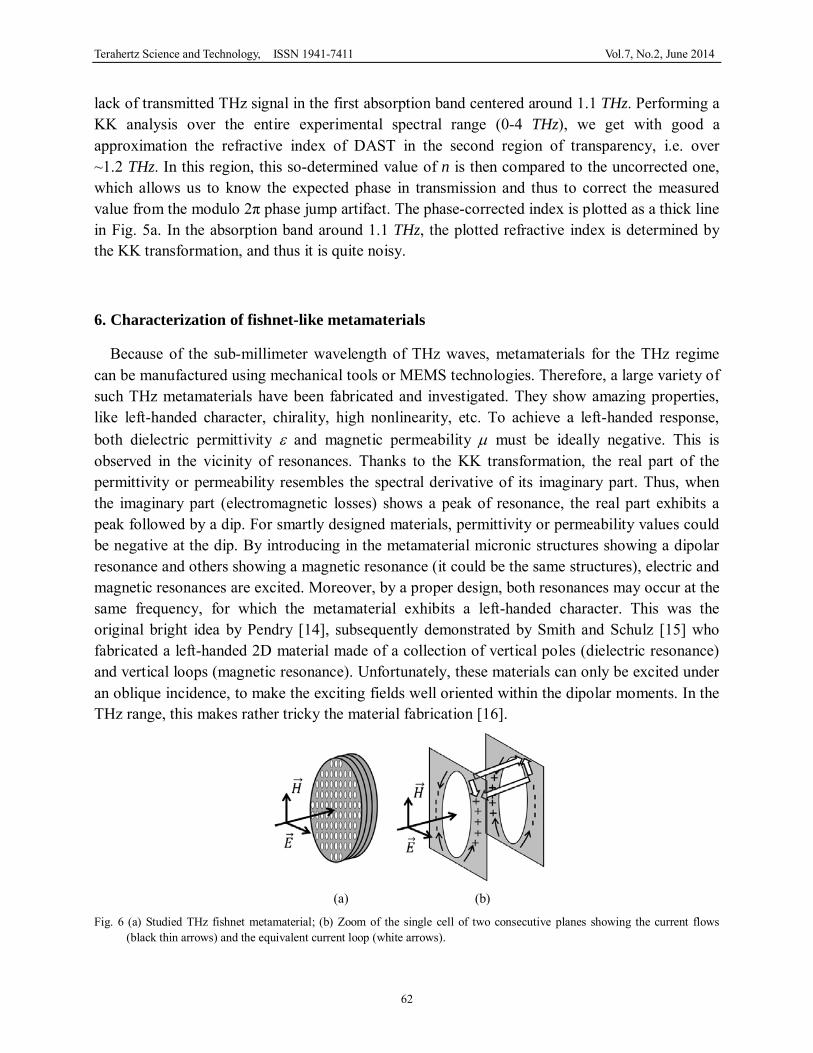
Fig. 6 (a) Studied THz fishnet metamaterial; (b) Zoom of the single cell of two consecutive planes showing the current flows (black thin arrows) and the equivalent current loop (white arrows).
Terahertz Science and Technology, ISSN 1941-7411 Vol.7, No.2, June 2014
63
A smart alternative and much simple geometry has been proposed afterwards by Sorolla [17]. A bi-layer array of holes, the so-called fishnet metamaterial, is etched in a 2D metal film. Several of such perforated films are stacked together, with a dielectric buffer layer in between (Fig. 6a). The left-handed behavior of the stack may be understood as follows: the impinging THz beam polarizes each hole, i.e. it forces positive and negative free carriers to move and aggregate at opposite locations at the hole edge (Fig. 6b). By choosing a proper hole size and shape, the polarization phenomenon could be resonant at a given THz frequency. The moving of the charges induces a current flowing along the hole contour. In the second stack just below the first one, an opposite current is generated through the coupling between the two stacks. In the incidence plane, the positive current in the first stack and the negative current in the second stack are assimilated to elements of a current loop by associating conduction and displacements currents illustrated by arrows in Fig. 6b. The induced magnetic dipole can also be resonant for an optimized buffer layer thickness. In such materials, both dipolar and magnetic moments lie in the film plane thus both can be excited by a plane wave at normal incidence.
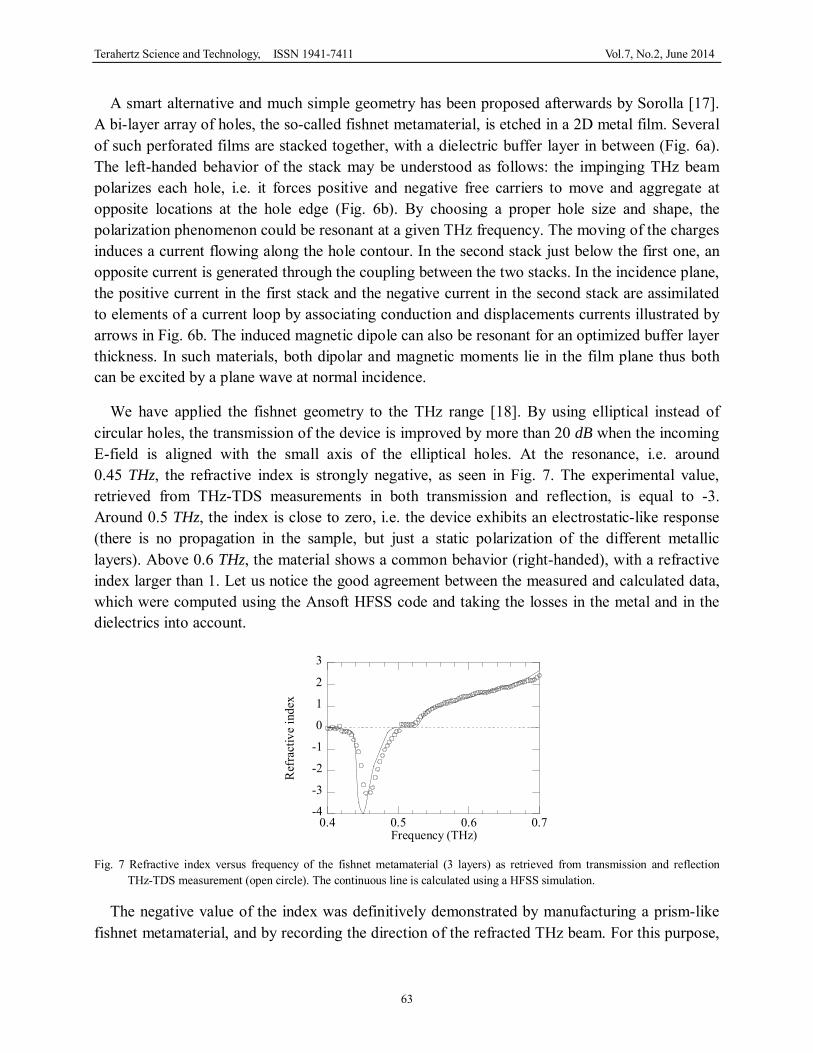
We have applied the fishnet geometry to the THz range [18]. By using elliptical instead of circular holes, the transmission of the device is improved by more than 20 dB when the incoming E-field is aligned with the small axis of the elliptical holes. At the resonance, i.e. around 0.45 THz, the refractive index is strongly negative, as seen in Fig. 7. The experimental value, retrieved from THz-TDS measurements in both transmission and reflection, is equal to -3. Around 0.5 THz, the index is close to zero, i.e. the device exhibits an electrostatic-like response (there is no propagation in the sample, but just a static polarization of the different metallic layers). Above 0.6 THz, the material shows a common behavior (right-handed), with a refractive index larger than 1. Let us notice the good agreement between the measured and calculated data, which were computed using the Ansoft HFSS code and taking the losses in the metal and in the dielectrics into account.
-4
-3
-2
-1
0
1
2
3
0.4 0.5 0.6 0.7
Ref
ract
ive
inde
x
Frequency (THz) Fig. 7 Refractive index versus frequency of the fishnet metamaterial (3 layers) as retrieved from transmission and reflection
THz-TDS measurement (open circle). The continuous line is calculated using a HFSS simulation.
The negative value of the index was definitively demonstrated by manufacturing a prism-like fishnet metamaterial, and by recording the direction of the refracted THz beam. For this purpose,
Terahertz Science and Technology, ISSN 1941-7411 Vol.7, No.2, June 2014
64
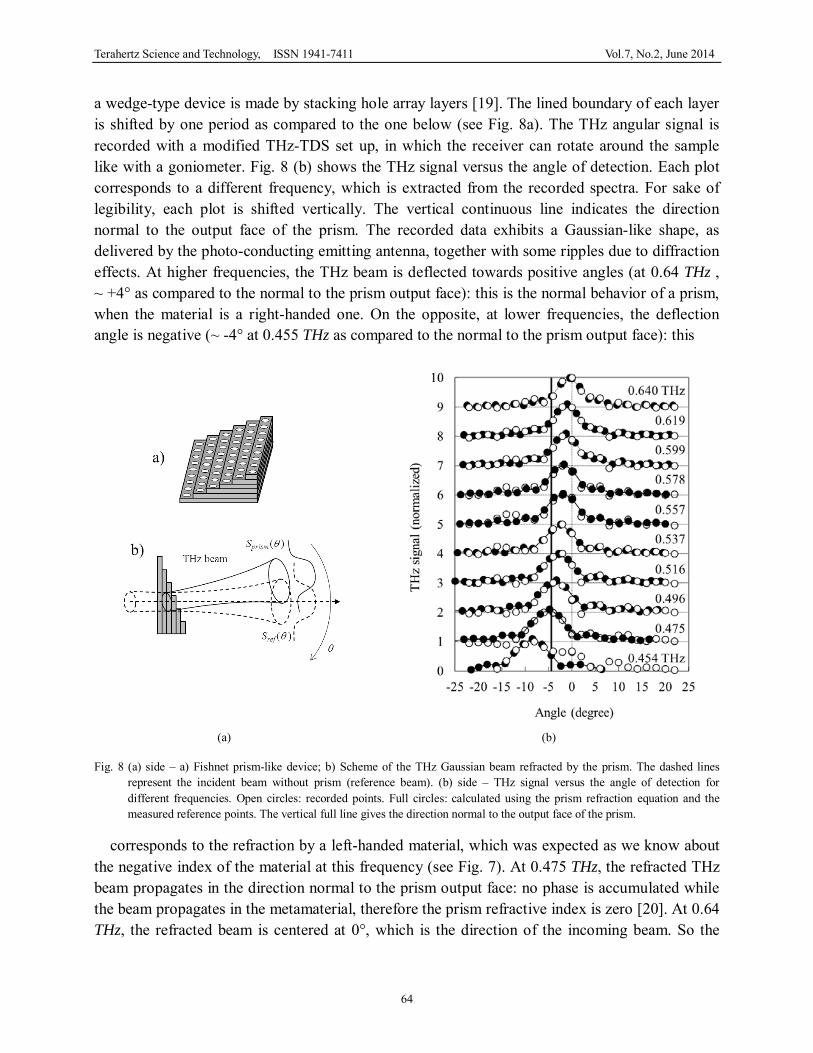
a wedge-type device is made by stacking hole array layers [19]. The lined boundary of each layer is shifted by one period as compared to the one below (see Fig. 8a). The THz angular signal is recorded with a modified THz-TDS set up, in which the receiver can rotate around the sample like with a goniometer. Fig. 8 (b) shows the THz signal versus the angle of detection. Each plot corresponds to a different frequency, which is extracted from the recorded spectra. For sake of legibility, each plot is shifted vertically. The vertical continuous line indicates the direction normal to the output face of the prism. The recorded data exhibits a Gaussian-like shape, as delivered by the photo-conducting emitting antenna, together with some ripples due to diffraction effects. At higher frequencies, the THz beam is deflected towards positive angles (at 0.64 THz , ~ +4° as compared to the normal to the prism output face): this is the normal behavior of a prism, when the material is a right-handed one. On the opposite, at lower frequencies, the deflection angle is negative (~ -4° at 0.455 THz as compared to the normal to the prism output face): this
(a) (b)
Fig. 8 (a) side – a) Fishnet prism-like device; b) Scheme of the THz Gaussian beam refracted by the prism. The dashed lines represent the incident beam without prism (reference beam). (b) side – THz signal versus the angle of detection for different frequencies. Open circles: recorded points. Full circles: calculated using the prism refraction equation and the measured reference points. The vertical full line gives the direction normal to the output face of the prism.
corresponds to the refraction by a left-handed material, which was expected as we know about the negative index of the material at this frequency (see Fig. 7). At 0.475 THz, the refracted THz beam propagates in the direction normal to the prism output face: no phase is accumulated while the beam propagates in the metamaterial, therefore the prism refractive index is zero [20]. At 0.64 THz, the refracted beam is centered at 0°, which is the direction of the incoming beam. So the
Terahertz Science and Technology, ISSN 1941-7411 Vol.7, No.2, June 2014
65
THz beam is not deviated by the prism, thus 1n ≈ .
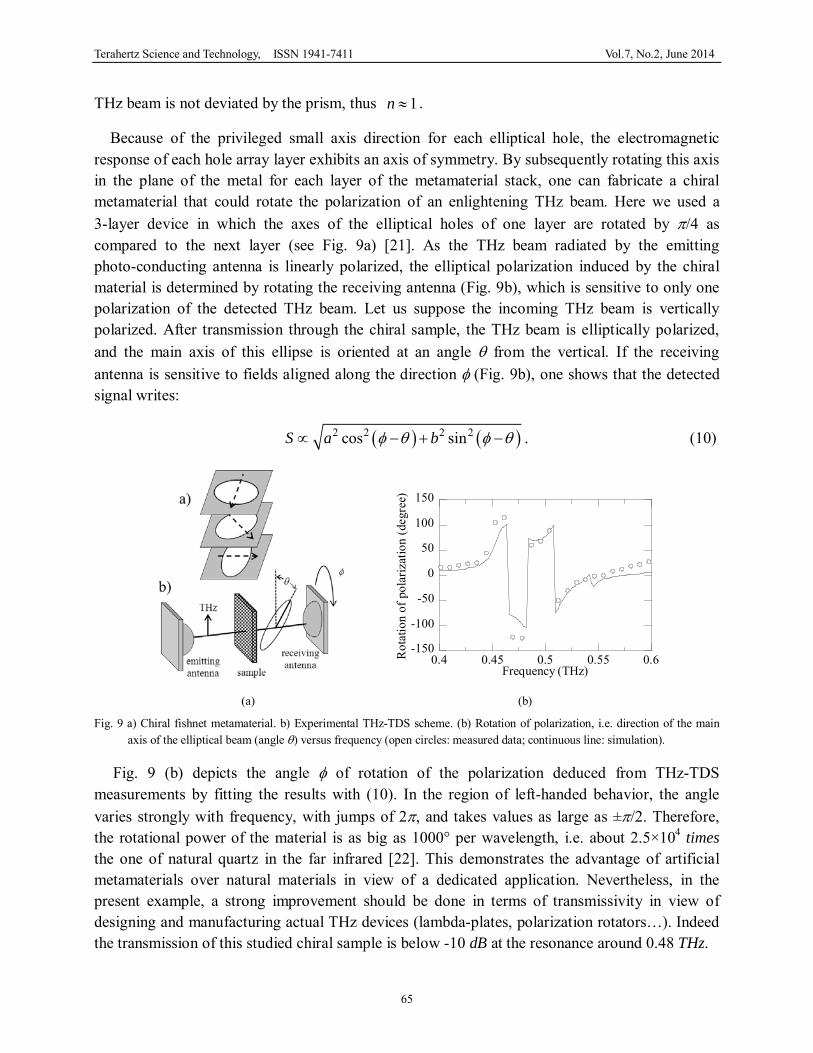
Because of the privileged small axis direction for each elliptical hole, the electromagnetic response of each hole array layer exhibits an axis of symmetry. By subsequently rotating this axis in the plane of the metal for each layer of the metamaterial stack, one can fabricate a chiral metamaterial that could rotate the polarization of an enlightening THz beam. Here we used a 3-layer device in which the axes of the elliptical holes of one layer are rotated by π/4 as compared to the next layer (see Fig. 9a) [21]. As the THz beam radiated by the emitting photo-conducting antenna is linearly polarized, the elliptical polarization induced by the chiral material is determined by rotating the receiving antenna (Fig. 9b), which is sensitive to only one polarization of the detected THz beam. Let us suppose the incoming THz beam is vertically polarized. After transmission through the chiral sample, the THz beam is elliptically polarized, and the main axis of this ellipse is oriented at an angle θ from the vertical. If the receiving antenna is sensitive to fields aligned along the direction φ (Fig. 9b), one shows that the detected signal writes:
( ) ( )2 2 2 2cos sinS a bφ θ φ θ∝ − + − . (10)
-150
-100
-50
0
50
100
150
0.4 0.45 0.5 0.55 0.6Rot
atio
n of
pol
ariz
atio
n (d
egre
e)
Frequency (THz) (a) (b)
Fig. 9 a) Chiral fishnet metamaterial. b) Experimental THz-TDS scheme. (b) Rotation of polarization, i.e. direction of the main axis of the elliptical beam (angle θ) versus frequency (open circles: measured data; continuous line: simulation).
Fig. 9 (b) depicts the angle φ of rotation of the polarization deduced from THz-TDS measurements by fitting the results with (10). In the region of left-handed behavior, the angle varies strongly with frequency, with jumps of 2π, and takes values as large as ±π/2. Therefore, the rotational power of the material is as big as 1000° per wavelength, i.e. about 2.5×10⁴ times the one of natural quartz in the far infrared [22]. This demonstrates the advantage of artificial metamaterials over natural materials in view of a dedicated application. Nevertheless, in the present example, a strong improvement should be done in terms of transmissivity in view of designing and manufacturing actual THz devices (lambda-plates, polarization rotators…). Indeed the transmission of this studied chiral sample is below -10 dB at the resonance around 0.48 THz.
Terahertz Science and Technology, ISSN 1941-7411 Vol.7, No.2, June 2014
66
-6
-4
-2
0
2
4
6
0.4 0.45 0.5 0.55 0.6
∆n
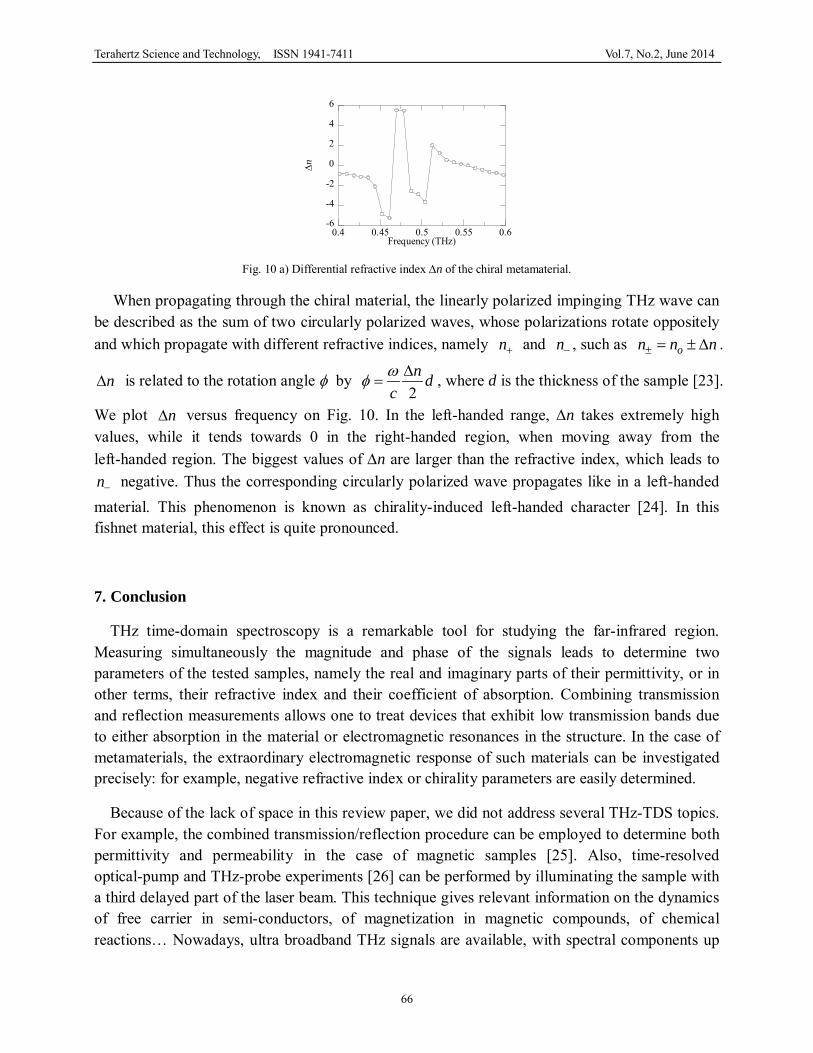
Frequency (THz) Fig. 10 a) Differential refractive index ∆n of the chiral metamaterial.
When propagating through the chiral material, the linearly polarized impinging THz wave can be described as the sum of two circularly polarized waves, whose polarizations rotate oppositely and which propagate with different refractive indices, namely n+ and n− , such as on n n± = ± ∆ .
n∆ is related to the rotation angle φ by 2n d
cωφ ∆
= , where d is the thickness of the sample [23].
We plot n∆ versus frequency on Fig. 10. In the left-handed range, ∆n takes extremely high values, while it tends towards 0 in the right-handed region, when moving away from the left-handed region. The biggest values of ∆n are larger than the refractive index, which leads to n− negative. Thus the corresponding circularly polarized wave propagates like in a left-handed material. This phenomenon is known as chirality-induced left-handed character [24]. In this fishnet material, this effect is quite pronounced.
7. Conclusion
THz time-domain spectroscopy is a remarkable tool for studying the far-infrared region. Measuring simultaneously the magnitude and phase of the signals leads to determine two parameters of the tested samples, namely the real and imaginary parts of their permittivity, or in other terms, their refractive index and their coefficient of absorption. Combining transmission and reflection measurements allows one to treat devices that exhibit low transmission bands due to either absorption in the material or electromagnetic resonances in the structure. In the case of metamaterials, the extraordinary electromagnetic response of such materials can be investigated precisely: for example, negative refractive index or chirality parameters are easily determined.
Because of the lack of space in this review paper, we did not address several THz-TDS topics. For example, the combined transmission/reflection procedure can be employed to determine both permittivity and permeability in the case of magnetic samples [25]. Also, time-resolved optical-pump and THz-probe experiments [26] can be performed by illuminating the sample with a third delayed part of the laser beam. This technique gives relevant information on the dynamics of free carrier in semi-conductors, of magnetization in magnetic compounds, of chemical reactions… Nowadays, ultra broadband THz signals are available, with spectral components up
Terahertz Science and Technology, ISSN 1941-7411 Vol.7, No.2, June 2014
67
to more than 200 THz [27], which makes possible THz-TDS up to a few tens of THz [28], giving information on both the THz and infrared responses of materials. In the case of molecules, the excitation of the whole frame of the molecule is investigated (THz region) as well as the vibrations of the chemical links in the molecule (infrared). Finally, let us notice the availability of large power THz TDS systems, built around amplified femtosecond mode-locked lasers. The huge THz peak power delivered by such systems permits to observe nonlinear THz effects [29] in natural materials and in metamaterials, opening the way to a new domain of science.
Acknowledgement
Part of this work was supported by the ANR-JST France-Japan International Strategic Collaborative Research Program ‘‘Wireless communication using Terahertz plasmonic nano ICT devices’’ (WITH).
References
[1] D. H. Auston and K. P. Chueng. “Coherent time-domain far-infrared spectroscopy”. J. Opt. Soc. Am. B2, 606-612 (1985).
[2] M. van Exter, Ch. Fattinger, and D. Grischkowsky. “Terahertz time-domain spectroscopy of water vapour”. Opt. Lett. 14, 1129-1131 (1989).
[3] Y. Pastol, G. Arjavalingam, J.-M. Halbout, et. al.. “Coherent broadband microwave spectroscopy using picosecond optoelectronic antennas”. Appl. Phys. Lett. 54, 307-309 (1989).
[4] D. Mittleman editor. Sensing with terahertz radiation, Springer Series in Optical Sciences. 85 (2003); K. Sakai editor. Terahertz Optoelectronics, Springer Topics in Applied Physics. 97 (2005); X.-C. Zhang and Jingzhou Xu. Introduction to THz Wave Photonics, Berlin: Springer (2009); Yun-Shik Lee. Principles of Terahertz Science and Technology, Berlin: Springer (2009); E. Bründermann, H.-W. Hübers, and M. Kimmitt. THz techniques, Springer Series in Optical Sciences, 151 (2012).
[5] L. Duvillaret, F. Garet, and J.-L. Coutaz. “Highly precise determination of optical constants and sample thickness in terahertz time-domain spectroscopy”. Appl. Opt. 38, 409-415 (1999).
[6] L. Duvillaret, F. Garet, and J.-L. Coutaz. “Reliable method for extraction of material parameters in time domain THz spectroscopy”. IEEE J. Sel. Topics in Quant. Electron. 2, 739-746 (1996).
[7] T. Dorney, R. Baraniuk, and D. Mittleman. “Material parameter estimation with Terahertz Time-Domain Spectroscopy”. J. Opt. Soc. Am. A 18, 1562-1571 (2001); W. Withayachumnankul, B. Ferguson, T. Rainsford, et. al.. “Simple material parameter estimation via terahertz time-domain spectroscopy”. Electronics Lett. 41, 800-801 (2005); I. Pupeza, R. Wilk, and M. Koch. “Highly accurate optical material parameter determination with THz time-domain spectroscopy”. Opt. Express 15, 4335-4350 (2007).
[8] W. Withayachumnankul, B. M. Fischer, H. Lin, et. al.. “Uncertainty in terahertz time-domain spectroscopy measurement”. J. Opt. Soc. Amer. B25, 1059-1072 (2008).
Terahertz Science and Technology, ISSN 1941-7411 Vol.7, No.2, June 2014
68
[9] L. Duvillaret, F. Garet, and J.-L. Coutaz. “Influence of noise on the characterization of materials by terahertz time-domain spectroscopy”. J. Opt. Soc. Amer. B17, 452-460 (2000).
[10] M. Bernier, F. Garet, B. Blampey, et. al.. “Comparative study of material parameter extraction using terahertz time-domain spectroscopy in transmission and in reflection”. submitted.
[11] M. Bernier, F. Garet, and J.-L. Coutaz. “Precise determination of the complex refractive index of samples showing low transmission bands by THz time-domain spectroscopy”. IEEE TeraHertz Science and Technologies 3, 295 (2013).
[12] M. Bernier, F. Garet, Y. Miyake, et. al.. “Combined terahertz time-domain spectroscopy and Kramers-Kronig analysis for the characterization of materials exhibiting strong absorption bands”. submitted.
[13] M. Walther, K. Jensby, S. R. Keiding, et. al.. “Far-infrared properties of DAST”, Opt. Lett. 25, 911-913 (2000).
[14] J. B. Pendry, A. J. Holden, D. J. Robbins, et. al.. “Magnetism from Conductors and Enhanced Nonlinear Phenomena”. IEEE Trans. Microwave Theory Tech. 47, 2075-2084 (1999).
[15] D. R. Smith, W. J. Padilla, D. C. Vier, et. al.. “Composite Medium with Simultaneously Negative Permeability and Permittivity”. Phys. Rev. Lett. 84, 4184-4187 (2000).
[16] K. Fan, A. C. Strikwerda, H. Tao, et. al.. “Stand-up magnetic metamaterials at terahertz frequencies”. Opt. Express 13, 12619 (2011).
[17] M. Beruete, M. Sorolla, and I. Campillo. “Left-handed extraordinary optical transmission through a photonic crystal of subwavelength hole arrays”. Opt. Express 14, 5445-5455 (2006).
[18] S. Wang, F. Garet, K. Blary, et. al.. “Composite left/right-handed stacked hole arrays at sub-millimeter wavelengths”. J. Appl. Phys. 107, 074510 (2010).
[19] M. Navarro-Cía, M. Beruete, M. Sorolla, et. al.. “Negative refraction in a prism made of stacked subwavelength hole arrays”. Opt. Express 16, 560-566 (2008).
[20] J. Valentine, S. Zhang, T. Zentgraf, et. al.. “Three-dimensional optical metamaterial with a negative refractive index”. Nature 455, 376-379 (2008).
[21] S. Wang, F. Garet, E. Lheurette, et. al.. “Giant rotary power of a fishnet-like metamaterial”. APL Mater. 1, 032116 (2013).
[22] D. Charlemagne and A. Hadni. “Sur la biréfringence et le pouvoir rotatoire du quartz dans l'infrarouge lointain à la température de l'azote liquide et à température ordinaire”. Optica Acta 16, 53-60 (1969).
[23] B. Wang, J. Zhou, T. Koschny, et. al.. “Chiral metamaterials: simulations and experiments”. J. Opt. A: Pure Appl. Opt. 11, 114003 (2009).
[24] S. Tretyakov, I. Nefedov, A. Sihvola, et. al.. “Waves and energy in chiral nihility”. J. Electromagn. Waves Appl. 17, 695-706 (2003); J. B. Pendry. “A chiral route to negative refraction”. Science 306, 1353-1355 (2004).
[25] H. Nemec, F. Kadlec, P. Kuzel, et. al.. “Independent determination of the complex refractive index and wave impedance by time-domain terahertz spectroscopy”. Optics Communications 260, 175-183 (2006).
[26] H. Nemec, F. Kadlec, and P. Kuzel. “Methodology of an optical pump-terahertz probe experiment: An analytical frequency-domain approach”. J. Chem. Phys. 117, 8454-8466 (2002); M. C. Beard, G. M. Turner,
Terahertz Science and Technology, ISSN 1941-7411 Vol.7, No.2, June 2014
69
and C. A. Schmuttenmaer. “Terahertz spectroscopy”. J. Phys. Chem. 106, 7146-7159 (2002).
[27] E. Matsubara, M. Nagai, and M. Ashida, Coherent infrared spectroscopy system from terahertz to near infrared using air plasma produced by 10-fs pulses, J. Opt. Soc. Am. B30, 1627-1630 (2013).
[28] I.-C. Ho, X. Guo, and X.-C. Zhang. “Design and performance of reflective ultra-broadband terahertz time-domain spectroscopy with air-biased-coherent-detection”. Proc. SPIE 7601, Terahertz Technology and Applications III, 76010K (2010); M. Zalkovskij, C. Zoffmann Bisgaard, A. Novitsky, et. al.. “Ultrabroadband terahertz spectroscopy of chalcogenide glasses”. Appl. Phys. Lett. 100, 031901 (2012); D. Turton, T. Harwood, A. Lapthorn, et. al.. “Ultrabroadband terahertz spectroscopies of biomolecules and water”. Proc. SPIE 8623, Ultrafast Phenomena and Nanophotonics XVII, 862303 (2013).
[29] See for example a special issue of New J. Phys., volume 15 (2013) entitled “Focus on Nonlinear Terahertz Studies” (Guest editors: A. Leitenstorfer, K. A. Nelson, K. Reimann, and K. Tanaka).