TENTH REPORT OF THE MALAYSIAN DIALYSIS AND …
223
TENTH REPORT OF THE MALAYSIAN DIALYSIS AND TRANSPLANT REGISTRY 2002 edited by T. O. LIM Y. N. LIM D. G. LEE NATIONAL RENAL REGISTRY (NRR) C /o Disease and Treatment Registry Units 29 & 31, 2 nd Floor, Jalan Ipoh 52100 Kuala Lumpur Malaysia Tel No: 03 4045 8636 Fax No: 03 4045 1252 Email: [email protected] Web site: http://www.crc.gov.my/nrr
Transcript of TENTH REPORT OF THE MALAYSIAN DIALYSIS AND …
TENTH REPORT
OF
THE MALAYSIAN
DIALYSIS AND TRANSPLANT
REGISTRY
2002
edited by
T. O. LIM Y. N. LIM D. G. LEE
NATIONAL RENAL REGISTRY (NRR) C/o Disease and Treatment Registry Units
29 & 31, 2nd Floor, Jalan Ipoh 52100 Kuala Lumpur
Malaysia
Tel No: 03 4045 8636 Fax No: 03 4045 1252
Email: [email protected] Web site: http://www.crc.gov.my/nrr

Renal Registry Unit (RRU) National Disease and Treatment Registry Units 2nd Floor, 29 & 31, Jalan Ipoh 51200 Kuala Lumpur Malaysia Tel.: (603) 4045 8636 Fax: (603) 4045 1252 Email: [email protected] Website: http://www.crc.gov.my/nrr
Electronic version Electronic version of this directory can be downloaded at http://www.crc.gov.my/nrr
National Disease and Treatment Registry Unit, CRC Dr. Rugayah Bakri, Head
Staff of the Renal Registry Unit Lee Day Guat
Mardhiah Arifin
Nor Azliana Ramli
Biometrics Unit CRC Ms. Celine Tsai, Head (Information Security Officer)
Mr. Kevin Ng Hong Heng, Network Administrator
Mr. Adlan Abdul Rahman, Assistant Network Administrator
Ms. Lim Jie Ying, Database Administrator
Mr. Patrick Lum, Webmaster
Mr. Sebastian Thoo, Programmer
Mr. Liang Hung Shan, Statistician
I
ACKNOWLEDGEMENTS
The National Renal Registry Committee would like to thank all who have contributed work hard to get this Tenth Report of the Malaysian Dialysis and Transplant Registry
2002.
We would like to especially thank the following:
All centre coordinators, staff, nephrologists and physicians in-charge of dialysis centres and renal units from the various government, non-governmental and private
centres without whose dedication, hard work and timely data collection and submission this registry report would not be possible.
The Clinical Research Centre, HKLand the Ministry of Health, Malaysia
for assistance seen and unseen.
And of course not forgetting our industry support:
Baxter Healthcare (Asia)
Fresenius Medical Care
Janssen-Cilag
MX Services
Pharmacia Malaysia
All who has supported in the Directory of Dialysis Centres in Malaysia 2003
NATIONAL RENAL REGISTRY COMMITTEE

II
PARTICIPATING CENTRES
FEDERAL TERRITORY
GOVERNMENT Pusat Hemodialisis KEMENTAH
Kuala Lumpur Hospital
Kuala Lumpur Hospital (Paed.)
Labuan Hospital
Putrajaya Hospital
Universiti Kebangsaan Malaysia Hospital
University Malaya Medical Centre
NGO Charis-NKF Dialysis Centre
Kuala Lumpur Lions Renal Centre
MAA-Medicare Charity Dialysis Centre, Cheras
MAA-Medicare Charity Dialysis Centre, Kuala Lumpur
NKF Dialysis Centre, Hang Lekiu
Pusat Hemodialisis Yayasan Felda
Pusat Rawatan Islam, Kuala Lumpur
Rotary Club Damansara-NKF Dialysis Centre, Kepong
The Nayang-NKF Dialysis Centre
PRIVATE Aiman Dialysis Centre
Bangsar Dialysis Centre
Cheras Dialysis Centre
Lifeline Dialysis Clinic
Pantai Medical Centre, Kuala Lumpur
Pusat Pakar Tawakal
Renal Dialysis Centre, Gleneagles Intan Medical Centre
Renal Healthcare
Renal-Link Sentosa
S.P. Menon Dialysis Centre, Kuala Lumpur
Smartcare Dialysis Centre, Cheras
The Kidney Dialysis Centre
Trans-Renal Care Haemodialysis Centre
Tung Shin Hospital

III
JOHOR GOVERNMENT 810 Rumah Sakit Angkatan Tentera, Majidee
Batu Pahat Hospital
Kluang Hospital
Kota Tinggi Hospital
Muar Hospital
Pontian Hospital
Segamat Hospital
Sultanah Aminah Hospital
NGO Batu Pahat Rotary Haemodialysis Centre
Che Eng Khor Haemodialysis Centre
JB Lion MAA-Medicare Charity Dialysis Centre
Kluang Rotary Haemodialysis Centre
Mersing Rotary Haemodialysis Centre
Muar Lions Renal Centre
Persatuan Membaiki Akhlak Che Luan Khor
Pontian Rotary Haemodialysis Centre
Pusat Hemodialisis Rotary Kota Tinggi
Pusat Hemodialisis Rotary Kulai
Pusat Muhibah Hemodialisis Pesatuan Tionghua Segamat
Pusat Rawatan Dialisis Yayasan Pembangunan Keluarga Johor-NKF
Rotary Haemodialysis Centre, Johor Bahru
PRIVATE BP Renal Care, Southern Hospital
Haemo Care
Johor Specialist Hospital
Pathlab Dialysis Centre
Premier Renal Care
Pusat Dialisis Penawar
Pusat Hemodialisis Darul Takzim
Puteri Specialist Hospital
Systemic Dialysis Centre

IV
KEDAH
GOVERNMENT 807 Rumah Sakit Angkatan Tentera, Sg Petani
Alor Setar Hospital
Baling Hospital
Kuala Nerang Hospital
Kulim Hospital
Langkawi Hospital
Pusat Kesihatan Jitra
Sik Hospital
Sungai Petani Hospital
Yan Hospital
NGO Buddhist Tzu-Chi Dialysis Centre, Jitra
Lion Club of Alor Setar-NKF Dialysis Centre
Pertubuhan Bakti Fo En Bandar Kulim
Superkids Trinity-NKF Dialysis Centre
PRIVATE Kulim Haemodialysis
Metro Specialist Hospital
Pusat Dialisis Dr. K K Tan
Pusat Hemodialisis S P
Renal Care, Kedah Medical Centre
Renal Medicare Centre, Putra Medical Centre
Strand Specialist Hospital
KELANTAN
GOVERNMENT Pusat Perubatan Angkatan Tentera, Kota Bharu
Kota Bharu Hospital
Kuala Krai Hospital
Pasir Mas Hospital
Tanah Merah Hospital
Universiti Sains Malaysia Hospital
NGO KB Rotary-MAA Dialysis Centre
PRIVATE Renal-Link, Kelantan

V
MALACCA
GOVERNMENT 94 Hospital Angkatan Tentera, Terendak
Melaka Hospital
NGO Amitabha Haemodialysis Centre
Pusat Hemodialisis SJAM Bacang Melaka
Yayasan Hemodialisis Kebajikan Southern Melaka
PRIVATE Damai Medical & Heart Clinic
Harmoni Medical-Care
Mahkota Medical Centre
Pantai Air Keroh Hospital
Tenang Haemodialysis Centre
NEGERI SEMBILAN
GOVERNMENT Kuala Pilah Hospital
Port Dickson Hospital
Seremban Hospital
NGO Pusat Hemodialisis Mawar N. Sembilan, Bahau
Pusat Hemodialisis Mawar N. Sembilan, Lukut
Pusat Hemodialisis Mawar N. Sembilan, Seremban
PRIVATE Renal-Link, Seremban
PAHANG
GOVERNMENT Jerantut Hospital
Mentakab Hospital
Raub Hospital
Tengku Ampuan Afzan Hospital
NGO Pahang Buddhist Association Haemodialysis Centre
PRIVATE Kuantan Specialist Centre
Pusat Hemodialisis Islam Makmur
VI
PERAK
GOVERNMENT 96 Hospital Angkatan Tentera, Lumut
Seri Manjung Hospital
Taiping Hospital
Tanjung Malim Hospital
Teluk Intan Hospital
NGO Aixin-NKF Dialysis Centre
Hope Haemodialysis Society Ipoh
MAA-Medicare Charity Dialysis Centre, Teluk Intan
Moral Uplifting-NKF Dialysis Centre
Pusat Hemodialisis Darul Iltizam
Pusat Hemodialisis Manjung-NKF
Woh Peng Cheang Seah Dialysis Centre
Yayasan Dialisis Pertubohan Pendidikan Akhlak-NKF
PRIVATE Berchaam Dialysis Centre
C.S. Loo Kidney & Medical Specialist Centre
Pusat Dialisis Ehsan Perak
Pusat Dialisis Penawar Permai
Pusat Dialisis Taiping
Pusat Rawatan Islam Ar-Ridzuan
Renal Care, Ipoh Specialist Centre
PERLIS
GOVERNMENT Kangar Hospital
PENANG
GOVERNMENT Bukit Mertajam Hospital
Butterworth Hospital
Sg Bakap Hospital
NGO AMD Rotary Dialysis Centre
Buddhist Tzu Chi Dialysis Centre, Butterworth
Buddhist Tzu-Chi Dialysis Centre, Pulau Pinang
Fo Yi Haemodialysis Centre
MAA-Medicalre Charity Dialysis Centre, Butterworth

VII
Penang Caring Dialysis Centre
Pertubuhan Hemodialisis Seberang Perai Selatan
Province Wellesley Renal Medifund Dialysis Centre
Pusat Hemodialisis Zakat
The Penang Community Haemodialysis Society
PRIVATE Bukit Mertajam Specialist Hospital
Gleneagles Medical Centre
Island Hospital
K K Tan Specialist Centre
Lam Wah Ee Hospital
Loh Guan Lye Specialist Centre
Pantai Mutiara Hospital
Penang Adventist Hospital
Renal Link, Penang
Seberang Perai Haemodialysis Centre, Bagan Specialist Centre
SABAH
GOVERNMENT Beaufort Hospital
Duchess of Kent Hospital
Keningau Hospital
Lahad Datu Hospital
Queen Elizabeth Hospital
Tawau Hospital
NGO MAA-Micare Kidney Charity Fund, Kota Kinabalu
Persatuan Buah Pinggang Sabah
Rotary Club Tawau Tanjung Haemodialysis Centre
Sandakan Kidney Society
PRIVATE Sabah Medical Centre
SARAWAK
GOVERNMENT 801 Rumah Sakit Angkatan Tentera, Kuching
Bintulu Hospital
Miri Hospital
Sarawak General Hospital
VIII
Sarikei Hospital
Serian Hospital
Sibu Hospital
Sri Aman Hospital
NGO CHKMUS-MAA Medical Charity Dialysis Centre
KAS-Rotary/NKF Dialysis Centre
Persatuan Bulan Sabit Merah Cawangan Miri
PRIVATE Normah Medical Specialist Centre
Sibu Kidney Foundation Haemodialysis Centre
Timberland Medical Centre
SELANGOR
GOVERNMENT 819 Rumah Sakit Angkatan Tentera, TUDM
95 Hospital Angkatan Tentera, Kinrara
Banting Hospital
Kajang Hospital
Selayang Hospital
Tanjung Karang Hospital
Tengku Ampuan Rahimah Hospital
Tg. Ampuan Jemaah Hospital
NGO Bakti-NKF Dialysis Centre
Berjaya NKF Dialysis Centre
Haemodialysis Association Klang
MAA-Medicare Charity Dialysis Centre, Kajang
Persatuan Dialisis Kurnia PJ
Pertubohan Hemodialisis Pasar Meru
Pusat Rawatan Islam, Petaling Jaya
SJAM-KPS Haemodialysis
Yayasan Kebajikan SSL Heamodialisis
PRIVATE Ampang Puteri Specialist Hospital
Assunta Hospital
Damansara Specialist Hospital
Healthcare Dialysis Centre
Kajang Dialysis Centre
IX
PJ Dialysis Centre
Pusat Hemodialisis Majlis Perbandaran Kelang
Reddy Clinic
S.P. Menon Dialysis Centre, Klang
S.P. Menon Dialysis Centre, Petaling Jaya
Selangor Medical Centre
Smartcare Dialysis Centre, Subang Jaya
Sri Kota Medical Centre
Subang Jaya Medical Centre
Sunway Medical Centre
TRENGGANU
GOVERNMENT Besut Hospital
Dungun Hospital
Kemaman Hospital
Kuala Terengganu Hospital
NGO TDC-NKF Trengganu Dialysis Centre

X
National Renal Registry (NRR) Committee
NRR Advisory Committee members
2002 to 2004
Chairman: Dato’ Dr. Zaki Morad B Mohd Zaher Members: Dr. Lim Yam Ngo Dr. T. Thiruventhiran Dr. Tan Hee Wu MSN Nominees Professor Dr. Tan Si Yan Dr. Wong Hin Seng Dr. Lim Teck Onn Dr. Rugayah Bakri CRC Nominees Ms. Lee Day Guat
Hj. Mohd Harith Fadzella DAMAN Nominees Ms. Asma Abdullah

XI
CONTENTS INTRODUCTION.......................................................................................................................................... 1 REPORT SUMMARY ................................................................................................................................... 2 METHODS……………............................................................................................................................... 11 1. ALL RENAL REPLACEMENT THERAPY IN MALAYSIA................................................................ 14
1.1 STOCK AND FLOW .................................................................................................................... 14 1.2 TREATMENT PROVISION RATE ............................................................................................. 16
2. DIALYSIS IN MALAYSIA..................................................................................................................... 19 2.1 DIALYSIS TREATMENT PROVISION...................................................................................... 19 2.2 PATIENT DEMOGRAPHICS ..................................................................................................... 22 2.3 METHOD AND LOCATION ....................................................................................................... 24 2.4 PRIMARY RENAL DISEASE ..................................................................................................... 25 2.5 DEATH ON DIALYSIS................................................................................................................ 26 2.6. DIALYSIS CENTRE, CAPACITY AND TREATMENT PROVISION...................................... 28
3. HAEMODIALYSIS IN MALAYSIA ...................................................................................................... 36 3.1 HAEMODIALYSIS IN GOVERNMENT CENTRES.......................................................................... 36
3.1.1 STOCK AND FLOW .................................................................................................................... 36 3.1.2 PLACE OF HAEMODIALYSIS AND ITS FINANCE................................................................ 37 3.1.3 DEATH ON HAEMODIALYSIS AND TRANSFER TO PERITONEAL DIALYSIS ............... 39 3.1.4 GOVERNMENT HAEMODIALYSIS CENTRES....................................................................... 41 3.1.5 HAEMODIALYSIS PATIENTS’ CHARACTERISTICS ............................................................ 44 3.1.6 SURVIVAL ANALYSIS – GOVERNMENT CENTRES............................................................ 45 3.1.7 WORK RELATED REHABILITATION AND QUALITY OF LIFE ON HAEMODIALYSIS,
GOVERNMENT CENTRES ....................................................................................................... 46 3.1.8 HAEMODIALYSIS PRACTICES IN GOVERNMENT CENTRES .......................................... 49 3.1.9 DYSLIPIDAEMIA IN HD PATIENTS, GOVERNMENT CENTRES....................................... 54 3.1.10 MANAGEMENT OF RENAL BONE DISEASE, GOVERNMENT CENTRES ....................... 58 3.1.11 MANAGEMENT OF BLOOD PRESSURE, GOVERNMENT CENTRES................................ 61 3.1.12 TREATMENT OF ANAEMIA, GOVERNMENT HD CENTRES............................................. 65 3.1.13 NUTRITIONAL STATUS OF HD PATIENTS GOVERNMENT CENTRES ........................... 74 3.1.14 SEROLOGICAL STATUS, HD PATIENTS GOVERNMENT CENTRES................................ 76
3.2 HAEMODIALYSIS IN NON-GOVERNMENTAL ORGANISATION (NGO) CENTRES .............. 78 3.2.1 STOCK AND FLOW .................................................................................................................... 78 3.2.3 DEATH ON HAEMODIALYSIS, NGO CENTRES.................................................................... 79 3.2.4 NGO HAEMODIALYSIS CENTRES .......................................................................................... 81 3.2.5 HAEMODIALYSIS PATIENTS’ CHARACTERISTICS, NGO CENTRES............................... 84 3.2.6 SURVIVAL ANALYSIS, NGO CENTRES ................................................................................. 85 3.2.7 WORK RELATED REHABILITATION AND QUALITY OF LIFE ON HAEMODIALYSIS,
NGO CENTRES........................................................................................................................... 87 3.2.8 HAEMODIALYSIS PRACTICES IN NGO CENTRES............................................................... 89 3.2.9 DYSLIPIDAEMIA IN HD PATIENTS, NGO CENTRES........................................................... 94 3.2.10 MANAGEMENT OF RENAL BONE DISEASE, NGO CENTRES............................................ 98 3.2.11 MANAGEMENT OF BLOOD PRESSURE, NGO CENTRES.................................................. 101 3.2.12 TREATMENT OF ANAEMIA, NGO HD CENTRES .............................................................. 105 3.2.13 NUTRITIONAL STATUS OF HD PATIENTS, NGO CENTRES ........................................... 114 3.2.14 SEROLOGICAL STATUS, HD PATIENTS , NGO CENTRES................................................ 116
3.3 HAEMODIALYSIS IN PRIVATE CENTRES.................................................................................. 118 3.3.1 STOCK AND FLOW .................................................................................................................. 118 3.3.3 DEATH ON HAEMODIALYSIS, PRIVATE CENTRES.......................................................... 119 3.3.5 HAEMODIALYSIS PATIENTS’ CHARACTERISTICS, PRIVATE CENTRES..................... 121 3.3.6 SURVIVAL ANALYSIS, PRIVATE HD CENTRES ............................................................... 122 3.3.7 WORK RELATED REHABILITATION AND QUALITY OF LIFE ON HAEMODIALYSIS,
PRIVATE CENTRES ................................................................................................................ 124 3.3.8 HAEMODIALYSIS PRACTICES IN PRIVATE CENTRES ................................................... 126

XII
3.3.9 DYSLIPIDAEMIA IN HD PATIENTS, PRIVATECENTRES................................................. 131 3.3.10 MANAGEMENT OF RENAL BONE DISEASE, PRIVATECENTRES.................................. 135 3.3.11 MANAGEMENT OF BLOOD PRESSURE, PRIVATE CENTRES......................................... 138 3.3.12 TREATMENT OF ANAEMIA, PRIVATE HD CENTRES..................................................... 142 3.3.13 NUTRITIONAL STATUS OF HD PATIENTS PRIVATE CENTRES.................................... 151 3.3.14 SEROLOGICAL STATUS, HD PATIENTS PRIVATECENTRES.......................................... 153
4.CHRONIC PERITONEAL DIALYSIS .................................................................................................. 155 4.1 STOCK AND FLOW................................................................................................................. 155 4.2 FUNDING FOR CHRONIC PERITONEAL DIALYSIS.......................................................... 156 4.3 DEATH ON CAPD AND TRANSFER TO HAEMODIALYSIS ............................................. 157 4.4 GOVERNMENT CAPD CENTRES.......................................................................................... 159 4.5 CAPD PATIENTS’ CHARACTERISTICS............................................................................... 160 4.6 SURVIVAL ANALYSIS ........................................................................................................... 161 4.7 WORK RELATED REHABILITATION AND QUALITY OF LIFE ON CAPD .................... 163 4.8 CAPD PRACTICES................................................................................................................... 165 4.9. DYSLIPIDAEMIA IN CAPD PATIENTS, GOVERNMENT CENTRES................................ 166 4.10 MANAGEMENT OF RENAL BONE DISEASE, GOVERNMENT CENTRES ..................... 170 4.11 MANAGEMENT OF BLOOD PRESSURE, GOVERNMENT CENTRES ............................. 173 4.12 TREATMENT OF ANAEMIA, GOVERNMENT CAPD CENTRES ...................................... 177 4.13 NUTRITIONAL STATUS OF CAPD PATIENTS, GOVERNMENT CENTRES .................. 186 4.14 SEROLOGICAL STATUS, CAPD PATIENTS, GOVERNMENT CENTRES........................ 188
5.RENAL TRANSPLANTATION ............................................................................................................ 190 5.1 STOCK AND FLOW ................................................................................................................. 190 5.2 PLACE AND TYPE OF RENAL TRANSPLANT.................................................................... 191 5.3 DEATH AFTER TRANSPLANTATION AND GRAFT FAILURE ........................................ 193 5.4 CENTRES OF FOLLOW-UP .................................................................................................... 195 5.5 TRANSPLANT RECIPIENTS’ CHARACTERISTICS ........................................................... 197 5.6 SURVIVAL ANALYSIS ........................................................................................................... 198 5.7 WORK RELATED REHABILITATION AND QUALITY OF LIFE IN TRANSPLANT
RECIPIENTS ............................................................................................................................. 200

XIII
LIST OF TABLES Table 1.01: Stock and Flow of RRT, Malaysia 1995 - 2002 .................................................................. 14 Table 1.02: New Dialysis Acceptance Rate and New Transplant Rate per million population 1995 –
2002...………………………………………………………………………………………16 Table 1.03: RRT Prevalence Rate per million population 1995 – 2002 ................................................. 17 Table 2.01: Stock and flow – Dialysis Patients 1995 – 2002 ................................................................ 19 Table 2.02: Dialysis Treatment Rate per million population 1995 – 2002............................................ 19 Table 2.03: Dialysis Treatment Rate by State, per million state population, 2002................................. 19 Table 2.04: Dialysis Treatment Rate by Gender, per million male or female population 1999– 2002... 20 Table 2.05: Dialysis Treatment Rate by Age Group, per million age group population 1999 – 2002 ... 21 Table 2.06: Percentage Age Distribution of Dialysis Patients 1999 – 2002........................................... 22 Table 2.07: Gender distribution of Dialysis Patients 1999 – 2002 ........................................................ 23 Table 2.08: Method and Location of Dialysis ........................................................................................ 24 Table 2.09: Primary Renal Disease 1999– 2002.................................................................................... 25 Table 2.10: Deaths on Dialysis 1995 – 2002 ........................................................................................ 26 Table 2.11: Causes of Death on Dialysis 1999 - 2002........................................................................... 27 Table 2.12: Number of dialysis centres, number of HD machines and treatment capacity, HD capacity to
patient ratio By State, December 2002 ................................................................................ 28 Table 2.13: Number of dialysis centres, dialysis patients and HD machines and treatment capacity, by
sector December 2002 ......................................................................................................... 31 Table 3.1.01: Stock and flow of Haemodialysis Patients, Government Centres 1995 – 2002................... 36 Table 3.1.02: Place for HD, Government Centres 1999 – 2002 ................................................................. 37 Table 3.1.03: Finance for HD, Government Centres 1999 – 2002 ............................................................ 38 Table 3.1.04: HD Death Rate and Transfer to PD, Government Centres 1995 – 2002 ............................. 39 Table 3.1.05: Causes of Death on HD, Government Centres 1999 – 2002 ............................................... 40 Table 3.1.07: Centre Distribution of HD patients, Government Centres 2002........................................... 41 Table 3.1.08: Age Distribution of HD patients, Government Centres 1999 – 2002.................................. 44 Table 3.1.09: HD Patient Characteristics, Government Centres 1999 – 2002............................................ 44 Table 3.1.10: HD patient Survival related to Year of Entry, Government Centres 1997 – 2002 .............. 45 Table 3.1.11: HD Technique Survival related to Year of Entry, Government Centres 1997– 2002 ......... 46 Table 3.1.12: Work Related Rehabilitation on HD, Government Centres 1999 – 2002............................. 47 Table 3.1.13: Quality of Life on Haemodialysis, Government Centres 1999 – 2002................................. 48 Table 3.1.14: Vascular Access on Haemodialysis, Government Centres 1999 – 2002 .............................. 49 Table 3.1.15: Difficulties reported with Vascular Access, Government Centres 1999 – 2002 .................. 49 Table 3.1.16: Complications reported with Vascular Access, Government Centres 1999 – 2002 ............. 50 Table 3.1.17: Blood Flow Rates in Government HD Units 1999– 2002 ................................................... 50 Table 3.1.18: Number of HD Sessions per week, Government HD Units 1999 – 2002............................ 51 Table 3.1.19: Duration of HD in Government Units 1999 – 2002 ............................................................ 51 Table 3.1.20: Dialyser membrane types in Government HD Units 1999 – 2002 ...................................... 51 Table 3.1.21: Dialyser Reuse Frequency in Government HD Units 1999- 2002....................................... 52 Table 3.1.22: Dialysate Buffer used in Government HD Units 1999 – 2002 ............................................ 52 Table 3.1.23: Distribution of Prescribed KT/V, Government Centres 1999 – 2002................................... 53 Table 3.1.24: Distribution of serum Cholesterol Levels (mmol/l), HD patients, Government Centres 1999
– 2002.................................................................................................................................. 54 Table 3.1.25: Distribution of serum Triglyceride (mmol/l), HD patients, Government Centres 1999 – 2002
............................................................................................................................................. 55 Table 3.1.26: Distribution of serum LDL (mmol/l), HD patient, Government Centres 1999– 2002.......... 56 Table 3.1.27: Distribution of serum HDL (mmol/l), HD patient, Government Centres 1999- 2002 ......... 57 Table 3.1.28: Treatment for Renal Bone Disease, HD patients, Government Centres 1999 – 2002 ......... 58 Table 3.1.29: Distribution of serum Phosphate (mmol/l), HD patients, Government Centres 1999 – 2002
……………………………………………………………………………………………...58 Table 3.1.30: Distribution of serum Calcium (mmol/l), HD patients, Government Centres 1999– 2002.. 59 Table 3.1.31: Distribution of serum iPTH(ng/L), HD patients, Government Centres 1999 – 2002 .......... 60 Table 3.1.32: Treatment for hypertension, HD patients, Government Centres 1999 – 2002..................... 61

XIV
Table 3.1.33: Distribution of Systolic BP without anti-hypertensives, HD patients, Government Centres 1999 – 2002......................................................................................................................... 61
Table 3.1.34: Distribution of Diastolic BP without anti-hypertensives HD patients, Government Centres 1999– 2002.......................................................................................................................... 62
Table 3.1.35: Distribution of systolic BP on anti-hypertensives, HD patients, Government Centres 1999 – 2002..................................................................................................................................... 63
Table 3.1.36: Distribution of diastolic BP on anti-hypertensives, HD patients, Government Centre 1999–2002 ……………………………………………………………………………64
Table 3.1.37: Treatment for Anaemia, HD patients, Government Centres 1999 – 2002 ........................... 65 Table 3.1.38: Distribution of rHuEpo dose per week, HD patients, Government Centres 1999 – 2002 .. 65 Table 3.1.39: Distribution of serum Iron without rHuEpo, HD patients, Government Centres 1999 – 2002
............................................................................................................................................. 66 Table 3.1.40: Distribution of serum Iron on rHuEpo,HD patients, Government Centres 1999 – 2002..... 67 Table 3.1.41: Distribution of Transferrin Saturation without rHuEpo, HD patients, Government Centres
1999 – 2002……………………………………………………………………………….. 68 Table 3.1.42: Distribution of Transferrin Saturation on rHuEpo, HD patients, Government Centres 1999 –
2002………………………………………………………………………………………...69 Table 3.1.43: Distribution of serum Ferritin without rHuEpo, HD patients, Government Centres 1999 –
2002……………………………………………………………………………………….. 70 Table 3.1.44: Distribution of serum Ferritin on rHuEpo, HD patients, Government Centres 1999 – 2002 71 Table 3.1.45: Distribution of Haemoglobin concentration without rHuEpo, HD patients, Government
Centres 1999 – 2002............................................................................................................ 72 Table 3.1.46: Distribution of Haemoglobin concentrationon rHuEpo, HD patients, Government Centres
1999 – 2002......................................................................................................................... 73 Table 3.1.47: Distribution of serum Albumin (g/L), HD patients, Government Centres 1999 - 2002 ..... 74 Table 3.1.48: Distribution of Body Mass Index, HD patients, Government Centres 1999 – 2002............ 75 Table 3.1.49: Prevalence of positive anti-HCV and HbsAg, HD patients, Government Centres 1999–
2002………………………………………………………………………………………...76 Table 3.2.01: Stock and Flow HD patients, NGO Centres 1995 – 2002 ................................................... 78 Table 3.2.04: Death Rate on HD and Transfer to PD, NGO Centres 1995 – 2002.................................... 79 Table 3.2.05: Causes of Death, NGO Centres 1999 – 2002 ...................................................................... 80 Table 3.2.07: Centre Distribution of HD patients, NGO Centres, 2002 .................................................... 81 Table 3.2.08: Age Distribution of Dialysis Patients, NGO Centres 1999 – 2002...................................... 84 Table 3.2.09: Patients’ Characteristics, NGO Centres 1999 – 2002.......................................................... 84 Table 3.2.10: HD Patient Survival, NGO Centres 1997 – 2002 ............................................................... 85 Table 3.2.11: HD Technique Survival, NGO Centres 1997-2002 ............................................................ 86 Table 3.2.12: Work Related Rehabilitation on HD, NGO centres 1999-2002 .......................................... 87 Table 3.2.13: Quality of Life on Haemodialysis, NGO Centres 1999 – 2002.......................................... 88 Table 3.2.14: Vascular Access on Haemodialysis, NGO Centres 1999 – 2002 ........................................ 89 Table 3.2.15: Difficulties reported with Vascular Access , NGO Centres 1999 – 2002............................ 89 Table 3.2.16: Complications reported with Vascular Access, NGO Centres 1999 – 2002........................ 90 Table 3.2.17: Blood Flow Rates in NGO HD Units 1999 – 2002 ............................................................. 90 Table 3.2.18: Number of HD Sessions per week, NGO HD Units 1999 – 2002...................................... 91 Table 3.2.19: Duration of HD in NGO HD Units 1999 – 2002................................................................ 91 Table 3.2.20: Dialyser membrane types in NGO HD Units 1999 – 2002 ................................................. 91 Table 3.2.21: Dialyser Reuse Frequency in NGO HD Units 1999 – 2002 ................................................ 92 Table 3.2.22: Dialysate Buffer used in NGO HD Units 1999 – 2002 ....................................................... 92 Table 3.2.23: Distribution of Prescribed KT/V, NGO Centres 1999 – 2002............................................. 93 Table 3.2.24: Distribution of serum Cholesterol Concentrations (mmol/l), HD patients, NGO Centres
1999 – 2002......................................................................................................................... 94 Table 3.2.25: Distribution of serum Triglyceride (mmol/l), HD patients, NGO Centres 1999 – 2002 ... 95 Table 3.2.26: Distribution of serum LDL (mmol/l), HD patients, NGO Centres 1999 – 2002 ................. 96 Table 3.2.27: Distribution of serum HDL (mmol/l), HD patients, NGO Centres 1999 – 2002................. 97 Table 3.2.28: Treatment for Renal Bone Disease, HD patients, NGO Centres 1999 – 2002 .................... 98 Table 3.2.29: Distribution of serum Phosphate (mmol/l), HD patients, NGO Centres 1999– 2002.......... 98 Table 3.2.30: Distribution of serum Calcium (mmol/l), HD patients, NGO Centres 1999 – 2002............ 99

XV
Table 3.2.31: Distribution of serum iPTH (ng/L), HD patients, NGO Centres 1999 – 2002 .................. 100 Table 3.2.32: Treatment for hypertension, HD patients, NGO Centres 1999 – 2002.............................. 101 Table 3.2.33: Distribution of Systolic BP without anti-hypertensives, HD patients, NGO Centres 1999 –
2002................................................................................................................................... 101 Table 3.2.34: Distribution of Diastolic BP without anti-hypertensives, HD patients, NGO Centres 1999 –
2002................................................................................................................................... 102 Table 3.2.35: Distribution of systolic BP on anti-hypertensives, HD patients, NGO Centres 1999 – 2002
........................................................................................................................................... 103 Table 3.2.36: Distribution of diastolic BP on anti-hypertensives, HD patients, NGO Centres 1999 – 2002
........................................................................................................................................... 104 Table 3.2.37: Treatment for Anaemia, HD patients, NGO Centres 1999 – 2002 .................................... 105 Table 3.2.38: Distribution of rHuEpo dose per week, HD patients, NGO Centres 1999 – 2002 ............ 105 Table 3.2.39: Distribution of serum Iron without rHuEpo, HD patients, NGO Centres 1999 – 2002..... 106 Table 3.2.40: Distribution of serum Iron on rHuEpo,HD patients, NGO Centres 1999 – 2002.............. 107 Table 3.2.41: Distribution of serum Transferrin Saturation without rHuEpo, HD patients, NGO Centres
1999 – 2002……………………………………………………………………………….108 Table 3.2.42: Distribution of serum Transferrin Saturation on rHuEpo, HD patients, NGO Centres 1999 –
2002……………………………………………………………………………………….109 Table 3.2.43: Distribution of serum Ferritin without rHuEpo, HD patients, NGO Centres 1999 – 2002 110 Table 3.2.44: Distribution of serum Ferritin on rHuEpo, HD patients, NGO Centres 1999 – 2002........ 111 Table 3.2.45: Distribution of Haemoglobin without rHuEpo, HD patients, NGO Centres 1999–2002 .. 112 Table 3.2.46: Distribution of Haemoglobin on rHuEpo, HD patients, NGO Centres 1999 – 2002......... 113 Table 3.2.47: Distribution of serum Albumin (g/L), HD patients, NGO Centres 1999 – 2002............... 114 Table 3.2.48: Distribution of Body Mass Index, HD patients, NGO Centres 1999 – 2002..................... 115 Table 3.2.49: Prevalence of positive anti-HCV and HbsAg, HD patients, NGO Centres 1999–2002 .... 116 Table 3.3.01: Stock and Flow HD Patient, Private Centres 1995 – 2002................................................ 118 Table 3.3.04: HD Death Rate and Transfer to PD, Private Centres 1995 – 2002.................................... 119 Table 3.3.05: Causes of Death HD Patient, Private Centres 1999 – 2002............................................... 120 Table 3.3.08: Age Distribution of Dialysis Patients, Private Centres 1999 – 2002................................. 121 Table 3.3.09: Patients’ Characteristics , Private Centres 1999 – 2002 .................................................... 121 Table 3.3.10: HD Patient Survival, Private Centres 1997 – 2002 ........................................................... 122 Table 3.3.11: HD Technique Survival, Private Centres........................................................................... 123 Table 3.3.12: Work Related Rehabilitation on HD, Private centres 1999-2002...................................... 124 Table 3.3.13: Quality of Life on Haemodialysis, Private Centres 1999-2002.......................................... 125 Table 3.3.14: Vascular Access on Haemodialysis, Private Centres 1999 - 2002 .................................... 126 Table 3.3.15: Difficulties reported with Vascular Access, Private Centres 1999 - 2002......................... 126 Table 3.3.16: Complications reported with Vascular Access, Private Centres 1999 - 2002.................... 127 Table 3.3.17: Blood Flow Rates in Private HD Units 1999 - 2002 ......................................................... 127 Table 3.3.18: Number of HD Sessions per week, Private HD Units 1999 - 2002 ................................... 128 Table 3.3.19: Duration of HD in Private HD Units, 1999 - 2002............................................................ 128 Table 3.3.20: Dialyser membrane types in Private HD Units 1999 - 2002 .............................................. 128 Table 3.3.21: Dialyser Reuse Frequency in Private HD Units 1999 - 2002 ............................................. 129 Table 3.3.22: Dialysate Buffer used in Private HD Units 1999 – 2002................................................... 129 Table 3.3.23: Distribution of Prescribed KT/V, Private Centres 1999 - 2002......................................... 130 Table 3.3.24: Distribution of Serum Cholesterol Levels (mmol/l), HD patients, Private Centres 1999-
2002................................................................................................................................... 131 Table 3.3.25: Distribution of serum Triglyceride (mmol/l), HD patients, Private Centres 1999-2002 ... 132 Table 3.3.26: Distribution of serum LDL (mmol/l), HD patient, Private Centres 1999-2002................. 133 Table 3.3.27: Distribution of serum HDL (mmol/l), HD patient, Private Centres 1999 –2002.............. 134 Table 3.3.28: Treatment for Renal Bone Disease, HD patients, Private Centres 1999–2002................. 135 Table 3.3.29: Distribution of serum Phosphate (mmol/l), HD patients, Private Centres 1999 –2002..... 135 Table 3.3.30: Distribution of serum Calcium (mmol/l), HD patients, Private Centres 1999-2002.......... 136 Table 3.3.31: Distribution of serum iPTH (ng/L), HD patients, Private Centres 1999-2002 ................ 137 Table 3.3.32: Treatment for hypertension, HD patients, Private Centres 1999-2002.............................. 138 Table 3.3.33: Distribution of Systolic BP without anti-hypertensives, HD patients Private Centres 1999-
2002................................................................................................................................... 138

XVI
Table 3.3.34: Distribution of Diastolic BP without anti-hypertensives, HD patients, Private Centres 1999-2002................................................................................................................................... 139
Table 3.3.35: Distribution of systolic BP on anti-hypertensives, HD patients, Private Centres 1999-2002........................................................................................................................................... 140
Table 3.3.36: Distribution of diastolic BP on anti-hypertensives, HD patients, Private Centres 1999-2002........................................................................................................................................... 141
Table 3.3.37: Treatment for Anaemia, HD patients, Private Centres 1999-2002 .................................. 142 Table 3.3.38: Distribution of rHuEpo dose per week, HD patients, Private Centres 1999-2002 ............ 142 Table 3.3.39: Distribution of serum Iron without rHuEpo, HD patients, PrivateCentres 1999-2002...... 143 Table 3.3.40: Distribution of serum Iron on rHuEpo,HD patients, Private Centres 1999-2002.............. 144 Table 3.3.41: Distribution of serum Transferrin Saturation without rHuEpo, HD patients, Private Centres
1999-2002.......................................................................................................................... 145 Table 3.3.42: Distribution of serum Transferrin Saturation on rHuEpo, HD patients, Private Centres
1999-2002.......................................................................................................................... 146 Table 3.3.43: Distribution of serum Ferritin without rHuEpo, HD patients, Private Centres 1999-2002 147 Table 3.3.44: Distribution of serum Ferritin on rHuEpo, HD patients, Private Centres 1999-2002........ 148 Table 3.3.45: Distribution of Haemoglobin concentration without rHuEpo, HD patients, Private Centres
1999-2002.......................................................................................................................... 149 Table 3.3.46: Distribution of haemoglobin concentration on rHuEpo, HD patients, Private Centres 1999-
2002................................................................................................................................... 150 Table 3.3.47: Distribution of serum Albumin (g/L), HD patients, Private Centres 1999-2002............... 151 Table 3.3.48: Distribution of Body Mass Index HD patients, Private Centres 1999-2002...................... 152 Table 3.3.49: Prevalence of positive anti-HCV antibody and HbsAg, HD patients, Private Centres 1999-
2002................................................................................................................................... 153 Table 4.01: Stock and Flow of Chronic PD Patients 1995 – 2002 ........................................................ 155 Table 4.03: Funding for CAPD, Government Centres 1999 – 2002..................................................... 156 Table 4.04: Death Rate and Transfer to HD Government Centres 1995 – 2002 .................................. 157 Table 4.05: Causes of Death on CAPD, Government Centres 1999 – 2002 ....................................... 158 Table 4.06: Causes of Transfer to CAPD 1999 – 2002 ........................................................................ 158 Table 4.07: Centre Distribution of CAPD patients, 2002..................................................................... 159 Table 4.08: Percentage Age Distribution of CAPD patients 1999 – 2002............................................ 160 Table 4.09: CAPD Patient Characteristics 1999- 2002 ........................................................................ 160 Table 4.10: CAPD Patient Survival related to Year of Entry, Government Centres 1997– 2002 ........ 161 Table 4.11: CAPD Technique Survival related to Year of Entry, Government Centres 1997 – 2002.. 162 Table 4.12: Work Related Rehabilitation on CAPD, Government Centres 1999 – 2002..................... 163 Table 4.13: Quality of Life on CAPD, Government Centres 1999 – 2002........................................... 164 Table 4.14: Chronic Peritoneal Dialysis Regimes 1999 – 2002 ........................................................... 165 Table 4.15: CAPD Connectology 1999 – 2002 .................................................................................... 165 Table 4.16: CAPD Number of Exchanges per day 1999 – 2002 .......................................................... 165 Table 4.17: CAPD Volume per Exchange 1999 – 2002....................................................................... 165 Table 4.24: Distribution of serum Cholesterol Concentrations (mmol/l), CAPD patients, Government
Centres 1999 – 2002.......................................................................................................... 166 Table 4.25: Distribution of serum Triglyceride (mmol/l), CAPD patients, Government Centres 1999 –
2002................................................................................................................................. 167 Table 4.26: Distribution of serum LDL (mmol/l), CAPD patient, Government Centres 1999 – 2002.......
…………………………………………………………………………………………….168 Table 4.27: Distribution of serum HDL (mmol/l), CAPD patient, Government Centres 1999 – 2002 ......
…………………………………………………………………………………………….169 Table 4.28: Treatment for Renal Bone Disease, CAPD patients, Government Centres 1999 – 2002 .. 170 Table 4.29: Distribution of serum Phosphate concentration (mmol/l), CAPD patients, Government
Centres 1999 – 2002.......................................................................................................... 170 Table 4.30: Distribution of serum Calcium concentration (mmol/l), CAPD patients, Government
Centres 1999 – 2002.......................................................................................................... 171 Table 4.31: Distribution of serum intact PTH (ng/L) concentration, CAPD patients, Government
Centres 1999 – 2002.......................................................................................................... 172 Table 4.32: Treatment for hypertension, CAPD patients, Government Centres 1999 – 2002.............. 173
XVII
Table 4.33: Distribution of Systolic BP without anti-hypertensives, CAPD patients, Government Centres 1999 – 2002.......................................................................................................... 173
Table 4.34: Distribution of Diastolic BP without anti-hypertensives, CAPD patients, Government Centres 1999 – 2002.......................................................................................................... 174
Table 4.35: Distribution of systolic BP on anti-hypertensives CAPD patients, Government Centres 1999 – 2002............................................................................................................................... 175
Table 4.36: Distribution of diastolic BP on anti-hypertensives, CAPD patients, Government Centres 1999 – 2002...................................................................................................................... 176
Table 4.37: Treatment for Anaemia, CAPD patients, Government Centres 1999 – 2002.................... 177 Table 4.38: Distribution of rHuEpo dose per week, CAPD patients, Government Centres 1999 – 2002
…………………………………………………………………………………………….177 Table 4.39: Distribution of serum Iron concentration without rHuEpo, CAPD patients, Government
Centres 1999 – 2002.......................................................................................................... 178 Table 4.40: Distribution of serum Iron concentration on rHuEpo, CAPD patients, Government Centres
1999 – 2002...................................................................................................................... 179 Table 4.41: Distribution of serum Transferrin Saturation without rHuEpo, CAPD patients, Government
Centres 1999 – 2002.......................................................................................................... 180 Table 4.42: Distribution of serum Transferrin Saturation on rHuEpo, CAPD patients, Government
Centres 1999 – 2002.......................................................................................................... 181 Table 4.43: Distribution of serum Ferritin without rHuEpo, CAPD patients, Government Centres 1999
– 2002............................................................................................................................... 182 Table 4.44: Distribution of serum Ferritin concentration on rHuEpo, CAPD patients, Government
Centres 1999 – 2002.......................................................................................................... 183 Table 4.45: Distribution of Haemoglobin concentration without rHuEpo, CAPD patients, Government
Centres 1999 – 2002.......................................................................................................... 184 Table 4.46: Distribution of Haemoglobin concentration on rHuEpo, CAPD patients, Government
Centres 1999 – 2002.......................................................................................................... 185 Table 4.47: Distribution of serum Albumin concentration (g/L), CAPD patients, Government Centres
1999 – 2002...................................................................................................................... 186 Table 4.48: Distribution of Body Mass Index CAPD patients, Government Centres 1999 – 2002...... 187 Table 4.49: Prevalence of positive anti-HCV and HBsAg CAPD patients, Government Centres 1999 –
2002.................................................................................................................................. 188 Table 5.01 Stock and Flow of Renal Transplant Patients 1995 – 2002 .............................................. 190 Table 5.02: Place of Renal Transplantation 1995 – 2002.................................................................... 191 Table 5.03: Type of Renal Transplantation 1995 – 2002 ..................................................................... 192 Table 5.04: Transplant Patients Death Rate and Graft Loss 1995 – 2002 ............................................. 193 Table 5.05: Causes of Death in Transplant Recipients 1999 – 2002 .................................................... 194 Table 5.06: Causes of Graft Failure 1999 – 2002.................................................................................. 194 Table 5.07: Distribution of Centres of Follow-up of Transplant Recipients, 20002 ............................ 195 Table 5.08: Percentage age distribution of transplant recipients 1999 – 2002 ..................................... 197 Table 5.09: Renal Transplant Recipients’ Characteristics 1999 – 2002 ............................................... 197 Table 5.10: Transplant Patient Survival related to Year of Transplant 1997 – 2002............................ 198 Table 5.11: Transplant Allograft Survival related to Year of Transplant 1997 – 2002 ....................... 199 Table 5.12: Work Related Rehabilitation in Transplant Recipients 1999 – 2002................................. 200 Table 5.13: Quality of Life, Transplant recipients 1999 – 2002............................................................ 201
XVIII
LIST OF FIGURES Figure 1.01: Stock and Flow of RRT, Malaysia 1995 - 2002 .................................................................. 14
(a) New Dialysis and Transplant patients........................................................................................ 14 (b) Patients Dialysing and with Functioning Transplant at 31st December 1995 – 2002................. 15
Figure 1.02: New Dialysis Acceptance and New Transplant Rate 1995 - 2002 ...................................... 16 Figure 1.03: Dialysis and Transplant Prevalence Rate per million population 1995 - 2002.................... 17 Figure 2.04: Dialysis Treatment by Gender 1999 - 2002......................................................................... 20 Figure 2.05: Dialysis Acceptance Rate by Age Group 1999 - 2002 ........................................................ 21 Figure 2.06: Age Distribution of New Dialysis patients 1999 – 2002 .................................................... 22 Figure 2.07: Gender Distribution of New Dialysis patients 1999 – 2002 ............................................... 23 Figure 2.08: Method and Location of New Dialysis Patients .................................................................. 24 Figure 2.10: Death Rates on Dialysis 1995 – 2002................................................................................. 26 Figure 2.12 (a): Distribution of dialysis centres by State, December 2002 ................................................. 29 Figure 2.12 (b): Distribution of dialysis patients by State, December 2002................................................ 29 Figure 2.12 (c): Distribution of dialysis treatment by State, December 2002 ............................................. 30 Figure 2.12 (d): HD capacity to patient ratio by State, December 2002...................................................... 30 Figure 2.13 (a): Distribution of dialysis centres by Sector, December 2002............................................... 31 Figure 2.13 (b): Distribution of HD capacity by Sector, December 2002 ................................................... 32 Figure 2.13 (c): Distribution of dialysis patients by Sector, December 2002.............................................. 32 Figure 2.13 (d): HD capacity: patient ratio by Sector, December 2002 ....................................................... 33 Figure 3.1.01: Stock and Flow HD patients, Government Centres 1995 – 2002........................................ 36 Figure 3.1.02: Place of HD, Government Centres 1999- 2002................................................................... 37 Figure 3.1.03: Finance for new HD, Government Centres 1999 – 2002 .................................................... 38 Figure 3.1.04: Death Rate on HD, Government Centres 1995 – 2002 ....................................................... 39 Figure 3.1.10: HD patient Survival related to Year of Entry, Government Centres 1997– 2002 .............. 45 Figure 3.1.11: HD Technique Survival by Year of Entry, Government Centres 1997 – 2002.................... 46 Figure 3.1.23: Cumulative distribution of Prescribed KT/V by year........................................................... 53 Figure 3.1.24: Cumulative distribution of serum cholesterol concentration by year................................... 54 Figure 3.1.25: Cumulative distribution of serum triglyceride concentration by year.................................. 55 Figure 3.1.26: Cumulative distribution of serum LDL concentration by year............................................. 56 Figure 3.1.27: Cumulative distribution of serum HDL by year................................................................... 57 Figure 3.1.29: Cumulative distribution of serum Phosphate by year........................................................... 58 Figure 3.1.30: Cumulative distribution of serum Calcium by year ............................................................ 59 Figure 3.1.31: Cumulative distribution of serum iPTH by year.................................................................. 60 Figure 3.1.33: Cumulative distribution of Systolic BP without anti-hypertensives by year........................ 61 Figure 3.1.34: Cumulative distribution of Diastolic BP without anti hypertensives by year....................... 62 Figure 3.1.35: Cumulative distribution of systolic BP on anti-hypertensives by year................................. 63 Figure 3.1.36: Cumulative distribution of diastolic BP on anti-hypertensives by year ............................... 64 Figure 3.1.39: Cumulative Distribution of serum Iron without rHuEpo by year......................................... 66 Figure 3.1.40: Cumulative Distribution of serum Iron on rHuEpo by year................................................. 67 Figure 3.1.41: Cumulative distribution of serum Transferrin Saturation without rHuEpo by year ............. 68 Figure 3.1.42: Cumulative distribution of serum Transferrin Saturation on rHuEpo by year ..................... 69 Figure 3.1.43: Cumulative distribution of serum Ferritin without rHuEpo by year .................................... 70 Figure 3.1.44: Cumulative distribution of serum Ferritin on rHuEpo by year ............................................ 71 Figure 3.1.45: Cumulative distribution of Haemoglobin concentration without rHuEpo by year............... 72 Figure 3.1.46: Cumulative distribution of Haemoglobin concentration on rHuEpo, by year...................... 73 Figure 3.1.47: Cumulative distribution of serum Albumin by year............................................................. 74 Figure 3.1.48: Cumulative distribution of BMI by year .............................................................................. 75 Figure 3.1.49: Prevalence of positive anti-HCV and HbsAg, HD patients, Government Centres 1999–
2002………………………………………………………………………………………...76 Figure 3.2.01: Stock and Flow HD patients, NGO Centres 1995 – 2002.................................................... 78 Figure 3.2.04: Death Rate on HD, NGO Centres, 1995 – 2002 .................................................................. 79 Figure 3.2.10: HD Patient Survival, NGO Centres 1997 –2002.................................................................. 85 Figure 3.2.11: HD Technique Survival by year of entry, NGO centres 1997 –2002................................... 86

XIX
Figure 3.2.23: Cumulative distribution of Prescribed KT/V by year........................................................... 93 Figure 3.2.24: Cumulative distribution of serum cholesterol concentration by year................................... 94 Figure 3.2.25: Cumulative distribution of serum triglyceride concentration by year .................................. 95 Figure 3.2.26: Cumulative distribution of serum LDL by year ................................................................... 96 Figure 3.2.27: Cumulative distribution of serum HDL by year................................................................... 97 Figure 3.2.29: Cumulative distribution of serum Phosphate by year........................................................... 98 Figure 3.2.30: Cumulative distribution of serum Calcium by year ............................................................. 99 Figure 3.2.31: Cumulative distribution of serum iPTH by year ................................................................ 100 Figure 3.2.33: Cumulative distribution of Systolic BP without anti-hypertensives by year..................... 101 Figure 3.2.34: Cumulative distribution of Diastolic BP without anti-hypertensives by year .................... 102 Figure 3.2.35: Cumulative distribution of systolic BP on anti-hypertensives by year............................... 103 Figure 3.2.36: Cumulative distribution of diastolic BP on anti-hypertensives by year ............................. 104 Figure 3.2.39: Cumulative distribution of serum Iron without rHuEpo by year........................................ 106 Figure 3.2.40: Cumulative distribution of serum Iron on rHuEpo by year................................................ 107 Figure 3.2.41: Cumulative distribution of serum Transferrin Saturation without rHuEpo by year ........... 108 Figure 3.2.42: Cumulative distribution of serum Transferrin Saturation on rHuEpo by year .................. 109 Figure 3.2.43: Cumulative distribution of serum Ferritin without rHuEpo by year .................................. 110 Figure 3.2.44: Cumulative distribution of serum Ferritin on rHuEpo by year .......................................... 111 Figure 3.2.45: Cumulative Distribution of Haemoglobin without rHuEpo by year .................................. 112 Figure 3.2.46: Cumulative distribution of Haemoglobin on rHuEpo by year ........................................... 113 Figure 3.2.47: Cumulative distribution of serum Albumin by year........................................................... 114 Figure 3.2.48: Cumulative distribution of BMI by year ............................................................................ 115 Figure 3.2.49: Prevalence of positive anti-HCV and HbsAg HD patients, NGO Centres 1999 – 2002 .... 116 Figure 3.3.01: Stock and Flow HD Patient, Private Centres 1995 – 2002................................................. 118 Figure 3.3.04: Death Rate on HD, Private Centres 1995 – 2002............................................................... 119 Figure 3.3.10: HD Patient Survival by year of entry, Private Centres....................................................... 122 Figure 3.3.11: HD Technique Survival by year of entry, Private Centres ................................................. 123 Figure 3.3.23: Cumulative distribution of Prescribed KT/V by Year........................................................ 130 Figure 3.3.24: Cumulative distribution of serum cholesterol concentration by year................................. 131 Figure 3.3.25: Cumulative distribution of serum triglyceride concentration by year ................................ 132 Figure 3.3.26: Cumulative distribution of serum LDL by year ................................................................. 133 Figure 3.3.27: Cumulative distribution of serum HDL by year................................................................. 134 Figure 3.3.29: Cumulative distribution of serum Phosphate by year......................................................... 135 Figure 3.3.30: Cumulative distribution of serum Calcium by year ........................................................... 136 Figure 3.3.31: Cumulative distribution of serum iPTH by year, ............................................................... 137 Figure 3.3.33: Cumulative distribution of Systolic BP without anti-hypertensives by year...................... 138 Figure 3.3.34: Cumulative distribution of Diastolic BP without anti-hypertensives by year .................... 139 Figure 3.3.35: Cumulative distribution of systolic BP on anti-hypertensives by year............................... 140 Figure 3.3.36: Cumulative distribution of diastolic BP on anti-hypertensives by year ............................. 141 Figure 3.3.39: Cumulative distribution of serum Iron without rHuEpo by year........................................ 143 Figure 3.3.40: Cumulative distribution of serum Iron on rHuEpo by year................................................ 144 Figure 3.3.41: Cumulative distribution of serum Transferrin Saturation without rHuEpo by year ........... 145 Figure 3.3.42: Cumulative distribution of serum Transferrin Saturation on rHuEpo by year ................... 146 Figure 3.3.43: Cumulative distribution of serum Ferritin without rHuEpo by year .................................. 147 Figure 3.3.44: Cumulative distribution of serum Ferritin on rHuEpo by year .......................................... 148 Figure 3.3.45: Cumulative distribution of Hb without rHuEpo by year ................................................... 149 Figure 3.3.46: Cumulative distribution of Haemoglobin on rHuEpo by year ........................................... 150 Figure 3.3.47: Cumulative distribution of serum Albumin by year........................................................... 151 Figure 3.3.48: Cumulative distribution of body mass index by year......................................................... 152 Figure 3.3.49: Prevalence of positive anti-HCV antibody and HbsAg HD patients, Private Centres 1999 –
2002……………………………………………………………………………………….153 Figure 4.01: Stock and Flow of Chronic PD Patients 1995 – 2002 ........................................................ 155 Figure 4.03: Funding for new CAPD, Government Centres 1999 – 2002.............................................. 156 Figure 4.04: Death Rates on CAPD, Government Centres 1995 – 2002................................................ 157 Figure 4.10: CAPD Patient Survival related to Year of Entry, Government Centres 1997 – 2002........ 161 Figure 4.11: CAPD Technique Survival by Year of Entry Government Centres 1997 – 2002 .............. 162
XX
Figure 4.24: Cumulative distribution of serum cholesterol concentration by year ................................. 166 Figure 4.25: Cumulative distribution of serum triglyceride concentration by year ................................ 167 Figure 4.26: Cumulative distribution of serum LDL by year ................................................................. 168 Figure 4.27: Cumulative distribution of serum HDL by year................................................................. 169 Figure 4.29: Cumulative distribution of serum Phosphate by year........................................................ 170 Figure 4.30: Cumulative distribution of serum Calcium concentration by year..................................... 171 Figure 4.31: Cumulative Distribution of serum iPTH by year ............................................................... 172 Figure 4.33: Cumulative distribution of Systolic BP without anti-hypertensives by year...................... 173 Figure 4.34: Cumulative distribution of Diastolic BP without anti-hypertensives by year .................... 174 Figure 4.35: Cumulative distribution of systolic BP on anti-hypertensives by year............................... 175 Figure 4.36: Cumulative distribution of diastolic BP on anti-hypertensives by year ............................. 176 Figure 4.39: Cumulative distribution of serum Iron without rHuEpo by year........................................ 178 Figure 4.40: Cumulative distribution of serum Iron concentration on rHuEpo by year. ........................ 179 Figure 4.41: Cumulative distribution of serum Transferrin Saturation without rHuEpo by year ........... 180 Figure 4.42: Cumulative distribution of serum Transferrin Saturation on rHuEpo by year ................... 181 Figure 4.43: Cumulative distribution of serum Ferritin without rHuEpo by year .................................. 182 Figure 4.44: Cumulative distribution of serum Ferritin concentration on rHuEpo, by year................... 183 Figure 4.45: Cumulative distribution of haemoglobin concentration without rHuEpo by year............. 184 Figure 4.46: Cumulative distribution of Haemoglobin on rHuEpo by year ........................................... 185 Figure 4.47: Cumulative distribution of serum Albumin concentration by year .................................... 186 Figure 4.48: Cumulative distribution of BMI by year ............................................................................ 187 Figure 4.49: Prevalence of positive anti-HCV and HBsAg CAPD patients, Government Centres 1999 –
2002……………………………………………………………………………………….188 Figure 5.01: Stock and Flow Renal Transplant Patients, 1995 – 2002................................................... 190 Figure 5.04: Transplant Recipient Death Rate 1995– 2002.................................................................... 193 Figure 5.10: Transplant Patient Survival by Year of Transplant 1997 – 2002 ...................................... 198 Figure 5.11: Transplant Allograft Survival by Year of Transplant 1997-2002 .................................... 199

1
INTRODUCTION The National Renal Registry celebrated its 10th anniversary without any fanfare last year. The apprehension that was felt in the initial years regarding long-term viability of the registry gave way to a sense of confidence that we can meet the challenge and manage a registry successfully. The Registry continues to develop, thanks to all the Nephrologists in the country as well as their staff who undertook the arduous task of collecting and sending data. The NRR committee decided last year that in the interest of greater efficiency and lower operational costs the running of the registry be placed under the National Disease and Registry Units of the Clinical Research Centre of the Ministry of Health. The unit which also manages five other registries has a good IT infrastructure and state of the art data security system. The pooling of human and IT resources not only lower operational costs but also optimizes the use of expensive technology. The Registry must continue to be sensitive to the needs of its subscribers and look into providing information on any new interests that its data can generate. With the imminent introduction of National Health Financing System more detailed data on the financing of dialysis treatment may be required. The tenth report for the year 2002 saw a drop in the dialysis acceptance rate to 71 per million population. This was due to the decrease in the intake of hemodialysis patients in all the three sectors. The economic climate must have affected the growth in the private and NGO sectors. The Ministry of Health has an ongoing program of opening new centers in the smaller district hospitals. However operational delays may have affected patient intake. In general the dialysis and transplant activities in the country has remained stable and parameters looking at standards of care have shown improvements in general. There is a need to develop CAPD further. Hemodialysis units are finding it difficult to recruit staff. In the MOH hospitals there are space constraints in developing Hemodialysis units. An expanded CAPD program may address some of these constraints. Current limitations in the use of CAPD include the cost of the treatment. Finally a concerted effort by primary care physicians, Public Health Departments and other interested parties including NGOs must be made to address the “epidemic” of Diabetes Mellitus. Forty seven percent of all new patients taken in for RRT in 2002 had ESRD due to diabetes. There has to be better control of diabetes and hypertension if any headway is to be made in this direction. I once again thank all the data contributors and hope we have thus far met the expectations of all parties who use the report from the registry. Dr Sake Mora Mohammad Zither Chairman National Renal Registry.

2
REPORT SUMMARY
1 ALL RENAL REPLACEMENT THERAPIES
1.1 At 31st December 2002, 9812 patients were on renal replacement therapy, comprising 8418 on dialysis and 1394 with functioning transplants. 1734 new dialysis patients were accepted in 2002.
1.2 The new renal transplant rate was 5 per million population. The overall dialysis acceptance rate decreased to 71 per million population. This reduction was contributed by the decrease in intake of new hemodialysis patients into all three sectors which is not compensated by an increase in CAPD intake. Dialysis prevalence rate however increased to 343 per million population.
2 DIALYSIS IN MALAYSIA
2.1 Dialysis acceptance rate by state ranged from 120 per million state population for Johor to 33 per million per state population in Sabah.
By age group, dialysis acceptance rate ranged between a stable rate of 4 per million child population to 387 per million population for age group 55 to 64 years. Dialysis provision rate for patients older than 65 years was 356 per million population for age.
2.2 Males made up 55% of all new dialysis patients
2.3 Centre Haemodialysis (HD) accounted for 81% of new dialysis acceptance in 2002, 1% in office and very few into home HD. Acceptance into the CAPD programme continued to show increasing trend at 18%.
2.4 One third of new dialysis patients had unknown primary disease. Nearly half of new dialysis patients (47%) had ESRD due to diabetic nephropathy. Chronic glomerulonephritis was only found in 7% of the new dialysis patients.
2.5 Overall death rate on dialysis was 10%; HD death rate was 9%, and CAPD death rate was at 14%. 39% of deaths on dialysis were attributed to cardiovascular causes and 15% to sepsis unrelated to peritonitis. 22% died at home.
2.6 Centre survey 2002: This survey was again conducted at the end of 2002 to provide up-to-date information on dialysis-patient and centre census in Malaysia. Note that the total number of dialysis patients in this survey differs from that reported to the registry which depends on individual patient reporting from all centres.
There were a total of 8708 dialysis patients in Malaysia giving a dialysis treatment rate of 360 per million population (pmp). Dialysis treatment rate
3
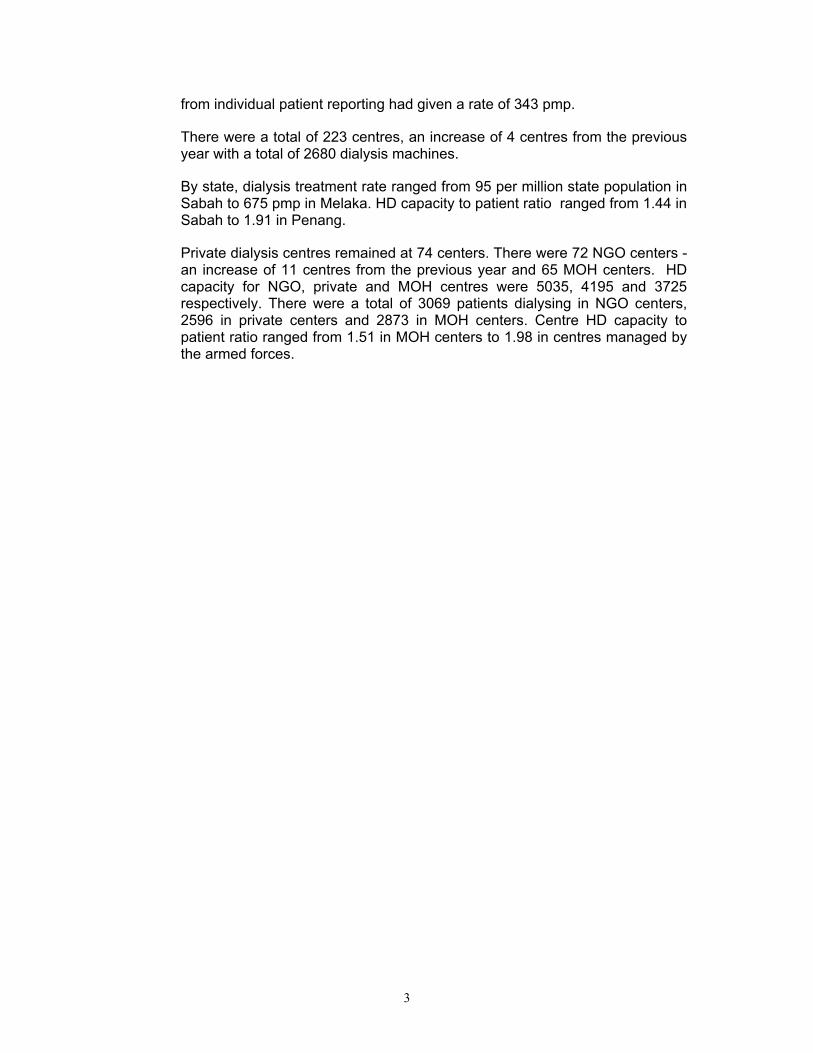
from individual patient reporting had given a rate of 343 pmp.
There were a total of 223 centres, an increase of 4 centres from the previous year with a total of 2680 dialysis machines.
By state, dialysis treatment rate ranged from 95 per million state population in Sabah to 675 pmp in Melaka. HD capacity to patient ratio ranged from 1.44 in Sabah to 1.91 in Penang.
Private dialysis centres remained at 74 centers. There were 72 NGO centers - an increase of 11 centres from the previous year and 65 MOH centers. HD capacity for NGO, private and MOH centres were 5035, 4195 and 3725 respectively. There were a total of 3069 patients dialysing in NGO centers, 2596 in private centers and 2873 in MOH centers. Centre HD capacity to patient ratio ranged from 1.51 in MOH centers to 1.98 in centres managed by the armed forces.

4
3 HAEMODIALYSIS
3.1 Haemodialysis in Government Centres
3.1.1 At 31st December 2002, 450 new patients were accepted into government HD centers. There were 2602 prevalent patients dialysing in government centres.
3.1.2 96% of new patients were accepted into centre HD, 1% into home HD and 2% into office HD. 99% of new patients were funded by the government.
3.1.3 Death rate stood at 10% per year. Cardiovascular disorders, infections and deaths at home were the 3 commonest causes of death at 35%, 21% and 21% respectively
3.1.4 In 2002, there were a total of 77 government HD centres, 8 run by Ministry of Defence, 3 university hospital centres and the rest under the Ministry of Health.
3.1.5 New HD patients in 2002: Modal age-group 55 – 64 years; 58% males, 39% were diabetics, 4% had HBsAg, and 3% had anti-HCV antibodies.
3.1.6 HD patient and technique survival in government centres at 6 months for 2002 were 92% and 89% respectively.
3.1.7 Overall, 42% of HD patients were able to work part or full time. 67% had normal quality of life index.
3.1.8 Haemodialysis Practices: In 2002, 75% were dialysed via wrist AVF, 20% via brachiocephalic fistula. 93% reported no difficulties with their vascular access; only 14% had vascular access complications. Proportion of patients with higher blood flow rates of 300-349 increased from 20% in 1999 to 41% in 2002. Almost all were on thrice-weekly dialysis, 98% on 4 hours per session. Use of cellulosic membrane dialysers decreased further to 14% and synthetic membrane dialyser usage increased to 79%. 99% reuse dialysers - 51% reused their dialysers 12 times or more. Usage of bicarbonate buffer increased to 97%. Median prescribed KT/V decreased to 1.4; and 67% achieved a KT/V of more than 1.3.
3.1.9 Dyslipidaemia in haemodialysis patients: This has remained mostly unchanged over the years. In 2002, 68% of HD patients had serum cholesterol concentration < 5.3 mmol/l with median at 4.9 mmol/l. 88% had serum triglyceride concentration <3.5 mmol/l with median at 1.7 mmol/l; 96% had serum LDL concentration <5 mmol/l with median at 2.9 mmol/l; and 93% had serum HDL concentration of < 2 mmol/l with median at 1.1 mmol/l.
3.1.10 Renal bone disease: In 2002, 92% of patients were on oral calcium carbonate, only 5% were on aluminium hydroxide. Use of vitamin D remained at 24%. 34% achieved serum phosphate concentration <1.6 mmol/l; 55% had serum calcium concentration between 2.2-2.6 mmol/l, and 24% with iPTH

5
between 100–250 ng/l. Median PTH concentration increased to 125 ng/L.
3.1.11 Blood pressure control: This too has remained fairly constant over the years. In 2002, 67% required anti-hypertensive therapy. Of these, 61% achieved systolic blood pressure(BP) < 160 mmHg, and 64% a diastolic BP< 90 mmHg. Of the 33% not on anti-hypertensive therapy, 83% had systolic BP < 160 mmHg and 80% diastolic BP < 90 mmHg.
3.1.12 Management of anaemia: In 2002, 89% of patients were on oral iron supplements. Intravenous iron usage has increased to 11%. 66% of HD patients were on recombinant erythropoietin with 56% on 2000-4000 units weekly. 80% of those without erythropoietin and 77% on erythropoietin injections had transferring saturation > 20%. 80% of patients without erythropoietin and 90% of those on erythropoietin supplements had serum ferritin > 100 ng/l. 10% of patients on erythropoietin injections had haemoglobin concentration >12 g/dL, 33% with haemoglobin concentration between 10 and 12g/dL. 51% of those not on erythropoietin therapy had haemoglobin concentration <10 g/dL.
3.1.13 Nutritional status: 57% of HD patients had serum albumin > 40 g/l with 59% with body mass index of between 18.5 and 25kg/m2.
3.1.14 Anti-HCV and HBsAg status: In 2002, proportion of patients with anti-HCV antibodies decreased to 23%. Proportion with HbsAg was 5%.
3.2 Haemodialysis in Non-Governmental Organisation (NGO) Centres
3.2.1 At 31st December 2002, 2932 patients were on HD in centres managed by NGOs. 516 new patients were accepted for HD in 2002 compared to 695 in 2001.
3.2.3 Death rate in NGO HD centres was 8% in 2002. Cardiovascular disorders, deaths at home, and infections were the 3 commonest causes of death at 41%, 17% and 14% respectively.
3.2.4 In 2002, there were a total of 69 NGO dialysis centres.
3.2.5 New HD patients in 2002: Modal age-group 55-64 years; 51% were males, more than half (54%) were diabetics, 3% had HBsAg and 2% had anti-HCV antibodies.
3.2.6 HD patient and technique survival in NGO centres at 6 months for 2002 were similar at 97%
3.2.7 Overall, 28% of HD patients were able to work part or full time, 27% were homemakers and 8% pensioners. 55% had normal quality of life index.
3.2.8 Haemodialysis Practices: In 2002, 83% were dialysed via wrist AVF, 14% via brachiocephalic fistulae. 93% reported no difficulties with their vascular access; only 10% had vascular access complications. 58% had blood flow rates between 250 and 299 ml/min, 97% were on thrice-weekly and 3% on

6
twice weekly HD. 99% had HD for 4 hours per session. Synthetic membrane usage increased to 52% in 2002. 95% reused dialysers - 76% reused their dialysers at least six times, and 13% more than 11 times. Usage of bicarbonate buffer was 100%. Median prescribed Kt/V was 1.5; 79% had Kt/V more than 1.3.
3.2.9 Dyslipidaemia in haemodialysis patients: In 2002, 67% of HD patients had serum cholesterol concentration < 5.3 mmol/l with median at 4.9 mmol/l. 85% had serum triglyceride concentration <3.5 mmol/l with median at 1.7 mmol/l. 96% had serum LDL < 5 mmol/L.
3.2.10 Renal bone disease: In 2002, 93% of HD patients were on oral calcium carbonate, only 1% were on aluminium hydroxide. Proportion on active vitamin D supplements was 22%. 33% achieved serum phosphate concentration <1.6 mmol/l; 58% had serum calcium concentration between 2.2 and 2.6 mmol/l and only 13% with iPTH between 100 – 250 ng/l. Median PTH concentration was 28.6 ng/L.
3.2.11 Blood pressure control: In 2002, 66% required anti-hypertensive therapy. Of these, 57% achieved systolic BP < 160 mmHg, and 68% diastolic BP < 90 mmHg. Of the 34% not on any anti-hypertensive therapy, 78% had systolic BP <160 mmHg and 81% diastolic BP < 90 mmHg.
3.2.12 Management of anaemia: In 2002, 68% were on recombinant erythropoietin with 48% on 2000 units weekly and 44% on 2000 – 4000 units weekly. 66% on erythropoietin injections had transferring saturation >20%. 90% of those on erythropoietin had serum ferritin of > 100 ug/l. 38% of patients on erythropoietin had haemoglobin concentration >10 g/dL with 8% with haemoglobin concentration >12 g/dL.
3.2.13 Nutritional status: The proportion of patients with serum albumin concentration of >40 g/l was 40% in 2002. 60% had body mass index of between 18.5 and 25 kg/m2.
3.2.14 Anti-HCV and HBsAg status: In 2002, a lower proportion (16%) of patients had anti-HCV antibodies, 6% were positive for HBsAg.
3.3 Haemodialysis In Private Centres
3.3.1 At 31st December 2002, 1990 patients were dialysing in private dialysis centres. 470 new patients were accepted for HD in private centers compared to 515 in 2000 and 500 in 2001.
3.3.3 Death rate in private centres was 9% in 2002. Cardiovascular disorders, deaths at home and sepsis were the 3 commonest causes of death at 47%, 28% and 7% each respectively.
3.3.5 New HD patients in 2002: Modal age-group > 55 years; 57% were males, 54% were diabetics, 3% had HBsAg, and 3% had anti-HCV antibody
3.3.6 HD patient survival and technique survival in private centres at 6 months for

7
2002 were similar at 97%.
3.3.7 In 2002, 25% were able to work full or part time, 23% were homemakers. 15% were retirees and 18% were older than 65 years. 56% had a normal quality of life.
3.3.8 Haemodialysis Practices: In 2002, 75% were dialysed via wrist AVF, 18% via brachiocephalic fistula. 88% reported no difficulties with their vascular access; only 14% had vascular access complications. 76% had blood flow rates between 200 and 299 ml/min. Only 74% were on thrice-weekly dialysis, 25% had twice weekly dialysis. 93% had 4 hours per HD session, 7% 4.5-5 hours. Use of synthetic membranes increased to 42%. 6% did not reuse dialysers, 57% reused their dialysers at least six times. Usage of bicarbonate buffer was 94%. Median prescribed KT/V was 1.5; 72% had KT/V more than 1.3.
3.3.9 Dyslipidaemia in haemodialysis patients: In 2002, 71% of HD patients had serum cholesterol concentration < 5.3 mmol/l with median at 4.8 mmol/l. 89% had serum triglyceride concentration <3.5 mmol/l with median at 1.9mmol/l. 98% had serum LDL < 5 mmol/L
3.3.10 Renal bone disease: In 2002, 89% of HD patients were on oral calcium carbonate, only 2% were on aluminium hydroxide and 23% on active vitamin D supplements. 32% achieved serum phosphate concentration <1.6 mmol/l; 57% had serum calcium concentration between 2.2 and 2.6 mmol/l and 17% with iPTH between 100 – 250 ng/l with median at 66.3 ng/L.
3.3.11 Blood pressure control: In 2002, 67% required anti-hypertensive therapy. Of these, 52% achieved systolic BP < 160 mmHg, and 62% diastolic BP < 90 mmHg.
3.3.12 Management of anaemia: In 2002, 68% were on recombinant erythropoietin with 33% on 2000 units weekly and 56% on 2000 – 4000 units weekly. 45% of patients on erythropoietin had haemoglobin concentration >10 g/dL with 10% with haemoglobin concentration >12 g/dL. 17% still received blood transfusion.
3.3.13 Nutritional status: Proportion of patients with serum albumin concentration of >40 g/l was 35% in 2002. 61% had body mass index of between 18.5 and 25 kg/m2 .
3.3.14 Anti-HCV and HBsAg status: More HD patients were anti-HCV positive over the years unlike those dialysed in NGO and governement centres. In 2002, 26% of patients had anti-HCV antibodies, 3% were positive for HbsAg.
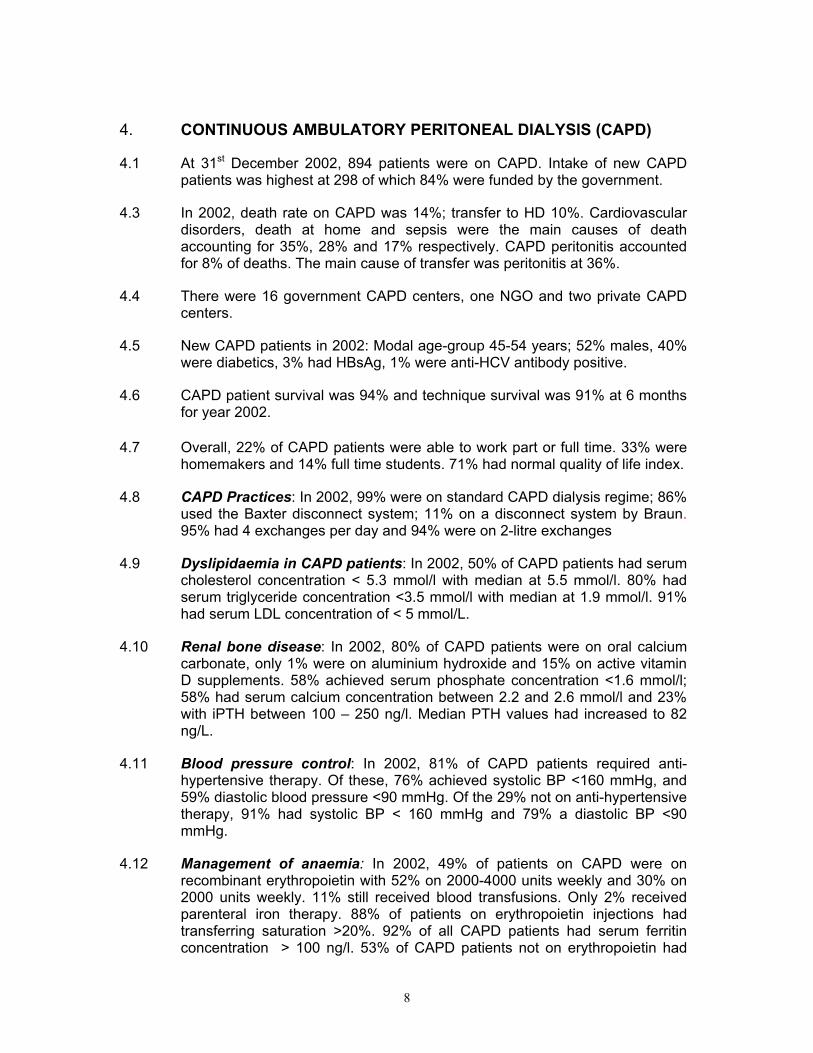
8
4. CONTINUOUS AMBULATORY PERITONEAL DIALYSIS (CAPD)
4.1 At 31st December 2002, 894 patients were on CAPD. Intake of new CAPD patients was highest at 298 of which 84% were funded by the government.
4.3 In 2002, death rate on CAPD was 14%; transfer to HD 10%. Cardiovascular disorders, death at home and sepsis were the main causes of death accounting for 35%, 28% and 17% respectively. CAPD peritonitis accounted for 8% of deaths. The main cause of transfer was peritonitis at 36%.
4.4 There were 16 government CAPD centers, one NGO and two private CAPD centers.
4.5 New CAPD patients in 2002: Modal age-group 45-54 years; 52% males, 40% were diabetics, 3% had HBsAg, 1% were anti-HCV antibody positive.
4.6 CAPD patient survival was 94% and technique survival was 91% at 6 months for year 2002.
4.7 Overall, 22% of CAPD patients were able to work part or full time. 33% were homemakers and 14% full time students. 71% had normal quality of life index.
4.8 CAPD Practices: In 2002, 99% were on standard CAPD dialysis regime; 86% used the Baxter disconnect system; 11% on a disconnect system by Braun. 95% had 4 exchanges per day and 94% were on 2-litre exchanges
4.9 Dyslipidaemia in CAPD patients: In 2002, 50% of CAPD patients had serum cholesterol concentration < 5.3 mmol/l with median at 5.5 mmol/l. 80% had serum triglyceride concentration <3.5 mmol/l with median at 1.9 mmol/l. 91% had serum LDL concentration of < 5 mmol/L.
4.10 Renal bone disease: In 2002, 80% of CAPD patients were on oral calcium carbonate, only 1% were on aluminium hydroxide and 15% on active vitamin D supplements. 58% achieved serum phosphate concentration <1.6 mmol/l; 58% had serum calcium concentration between 2.2 and 2.6 mmol/l and 23% with iPTH between 100 – 250 ng/l. Median PTH values had increased to 82 ng/L.
4.11 Blood pressure control: In 2002, 81% of CAPD patients required anti-hypertensive therapy. Of these, 76% achieved systolic BP <160 mmHg, and 59% diastolic blood pressure <90 mmHg. Of the 29% not on anti-hypertensive therapy, 91% had systolic BP < 160 mmHg and 79% a diastolic BP <90 mmHg.
4.12 Management of anaemia: In 2002, 49% of patients on CAPD were on recombinant erythropoietin with 52% on 2000-4000 units weekly and 30% on 2000 units weekly. 11% still received blood transfusions. Only 2% received parenteral iron therapy. 88% of patients on erythropoietin injections had transferring saturation >20%. 92% of all CAPD patients had serum ferritin concentration > 100 ng/l. 53% of CAPD patients not on erythropoietin had
9
haemoglobin concentration <10 g/l. Of those on erythropoietin therapy, 38% had haemoglobin concentration >10 g/dL with 10% > 12 g/dL.
4.13 Nutritional status: Only 16% of CAPD patients had serum albumin >40 g/l compared to 58% of government HD patients. 48% had body mass index of between 18.5 and 25 kg/m2. 31% had body mass index >25 kg/m2.
4.14 Anti-HCV and HBsAg status: The HbsAg and anti-HCV status of CAPD patients were constant over the years at 2-3% and 3-5% respectively.

10
5. RENAL TRANSPLANTATION
5.1 At 31st December 2002, there were 1394 functioning renal transplants, and 132 new renal transplant recipients.
5.2 There were 35 renal transplantations done locally in Malaysia in 2002. There were 76 renal transplantation from so-called cadaveric donors and 10 from commercial live donors done overseas.
5.3 In 2002, 19 (1%) of transplant recipients died and 32 (3%) lost their grafts. Cardiovascular diseases and sepsis and were the commonest causes of death accounting for 26% and 16% respectively. Rejection accounted for 59% of graft loss.
5.4 There were 46 centres of follow-up for renal transplant recipients.
5.5 Modal age group for new transplant recipients in 2002 was 35-44 years; 45% were males, 16% diabetics; 6% were HBsAg positive and none had anti-HCV antibodies at the time of transplantation.
5.6 Six month patient survival in 2002 was 96% and graft survival was 95%.
5.7 Overall, 67% of transplant recipients were able to work part or full time, and 17% were homemakers. 95% had normal quality of life index.

11
METHODS 1. COVERAGE There were 223 haemodialysis centers and 20 centres with active CAPD services in Malaysia as of December 2002, of which 230 reported data to the Registry. Thus, centre coverage is now to 94.6%. We assessed completeness of patient ascertainment by comparing the number of patients registered on the Registry patient database at end of year 2002 and patient census data obtained independently from the annual centre survey in December 2002. Based on the patient prevalence estimates calculated from these 2 independent sources of data (343 versus 374 patients/million population), we estimated the patient ascertainment rate by the Registry to be 91%. 2. STATISTICAL ANALYSIS Kaplan Meier method1 was used to estimate probability of survival and log rank test used to compare survival function. Technique failure is defined as occurrence of death or transfer to another modality of dialysis. Similarly, graft failure is defined as occurrence of death or returned to dialysis. Annual death rates were calculated by dividing the number of deaths in a year by the estimated mid-year patient population. For summarizing continuous laboratory data, we have moved away from calculating summary statistics like mean, standard deviation and instead plot the cumulative frequency distribution graph. We are following the approach used by the UK Renal Registry2. Cumulative distribution plot shows a listing of the sample values of a variable on the X axis and the proportion of the observations less than or greater than each value on the Y axis. An accompanying table gives the Median (50% of values are above or below it), upper quartile (UQ, 25% of values above and 75% below it) and lower quartile (LQ, 75% of values above and 25% below it). Other percentiles can be read directly off the cumulative distribution plot. The table also shows percent of observations above or below a target value, or with an interval of values; the target value or interval obviously vary with the type of laboratory data.. For example, target value for prescribed KT/V is >1.3 and that for haemoglobin is >10 and <12 g/l. The choice of target value is guided by published clinical practice guidelines, for example, the DOQI guideline; or otherwise they represent consensus of the local dialysis community. In contrast to other results reported in this report, Tables 2.12 and 2.13 are based on centre survey data rather than individual patient data reported to the Registry. This is to provide a up-to-date information on patient and centre census in the country and thus overcome the inevitable time lag between processing individual patient data and subsequent reporting of results. The survey was conducted in the month of December 2002. Centre response rate to the survey was 100% responded. Standard error estimates are not reported because no sample was taken. Results on distribution by state are also expressed in per million-population since states obviously vary in their population sizes. State population data are based on 2002 census population projection. It is very difficult

12
to estimate the amount of cross boundary patient flow; this source of error is therefore not accounted for in computing state estimates. However, we minimise the bias by combining states (Selangor and Wilayah Persekutuan, Kedah and Perlis) based on geographical considerations. HD treatment capacity is derived by assuming on average patients underwent 3 HD sessions per week and a centre can maximally operate 2.5 shifts per day. A single HD machine can therefore support 5 patients’ treatment. Obviously HD treatment capacity is calculated only for centre HD. The ratio of the number of centre HD capacity to number of centre HD patients is a useful measure of utilisation of available capacity. References: 1. Kaplan EL, Meier P. Non-parametric estimation from incomplete observations. J Am
Stat Assoc 1958; 53:457-81 2. UKRENALREG 1999 UK Renal Registry, Bristol, UK. GLOSSARY
CAPD Continuous Ambulatory Peritoneal Dialysis CPD Continuous Peritoneal Dialysis ESRD End Stage Renal Disease HD Haemodialysis LQ Lower Quartile MOH Ministry of Health NGO Non-Government Organisation pmp per million population QOL Quality of Life rHuEpo Recombinant Human Erythropoietin RRT Renal Replacement Therapy UQ Upper Quartile

13
RENAL REPLACEMENT THERAPY
IN
MALAYSIA
Stock and Flow
Treatment Provision Rate
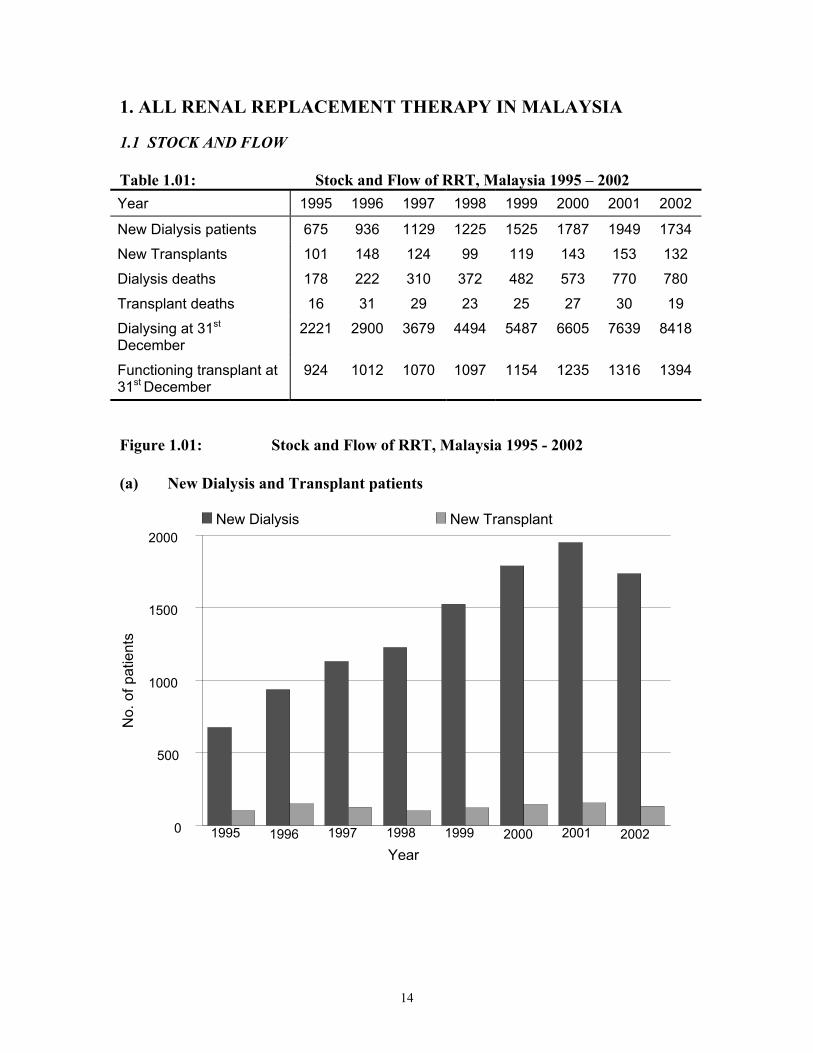
14
1. ALL RENAL REPLACEMENT THERAPY IN MALAYSIA
1.1 STOCK AND FLOW Table 1.01: Stock and Flow of RRT, Malaysia 1995 – 2002 Year 1995 1996 1997 1998 1999 2000 2001 2002
New Dialysis patients 675 936 1129 1225 1525 1787 1949 1734
New Transplants 101 148 124 99 119 143 153 132
Dialysis deaths 178 222 310 372 482 573 770 780
Transplant deaths 16 31 29 23 25 27 30 19
Dialysing at 31st
December 2221 2900 3679 4494 5487 6605 7639 8418
Functioning transplant at 31st December
924 1012 1070 1097 1154 1235 1316 1394
Figure 1.01: Stock and Flow of RRT, Malaysia 1995 - 2002
(a) New Dialysis and Transplant patients
No.
of p
atie
nts
0
500
1000
1500
2000 New Dialysis New Transplant
1995 1996 1997 1998 1999 2000 2001 2002 Year
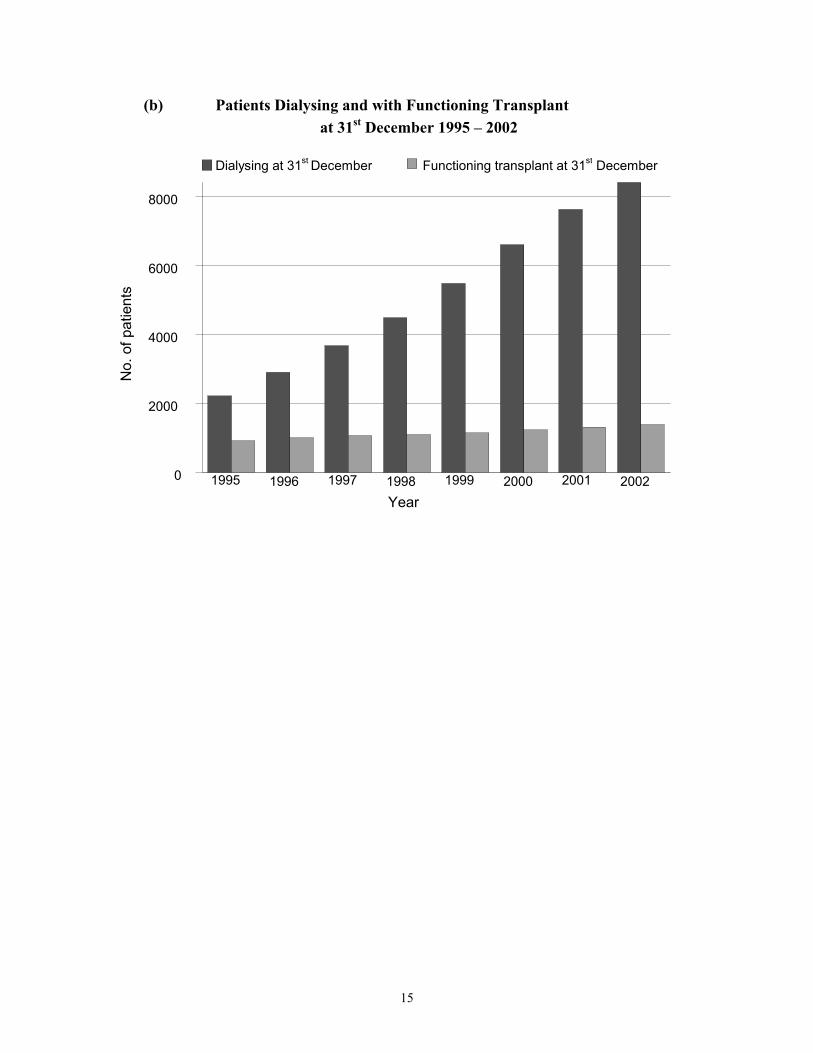
15
(b) Patients Dialysing and with Functioning Transplant at 31st December 1995 – 2002
No.
of p
atie
nts
0
2000
4000
6000
8000
Dialysing at 31st December Functioning transplant at 31st December
1995 1996 1997 1998 1999 2000 2001 2002 Year
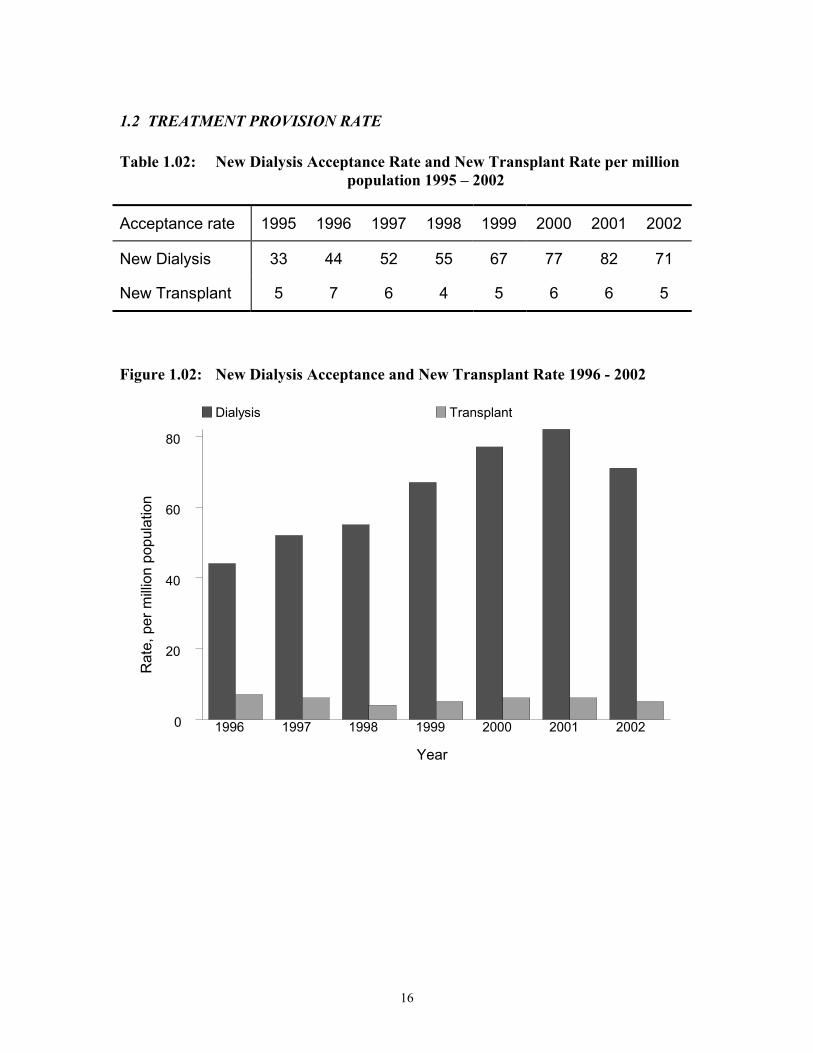
16
1.2 TREATMENT PROVISION RATE Table 1.02: New Dialysis Acceptance Rate and New Transplant Rate per million population 1995 – 2002
Acceptance rate 1995 1996 1997 1998 1999 2000 2001 2002
New Dialysis 33 44 52 55 67 77 82 71
New Transplant 5 7 6 4 5 6 6 5
Figure 1.02: New Dialysis Acceptance and New Transplant Rate 1996 - 2002
Rat
e, p
er m
illion
pop
ulat
ion
Year
0
20
40
60
80
Dialysis Transplant
1996 1997 1998 1999 2000 2001 2002

17
Table 1.03: RRT Prevalence Rate per million population 1995 – 2002
Prevalence rate 1995 1996 1997 1998 1999 2000 2001 2002
Dialysis 107 137 170 203 242 284 321 343
Transplant 45 48 49 49 51 53 55 57
Figure 1.03: Dialysis and Transplant Prevalence Rate per million population 1996 - 2002
Rat
e, p
er m
illion
pop
ulat
ion
Year
0
100
200
300
400 Dialysis Transplant
1996 1997 1998 1999 2000 2001 2002

18
DIALYSIS IN MALAYSIA
Dialysis Treatment Provision
Patient Demographics
Method and Location
Primary Renal Disease
Death on Dialysis
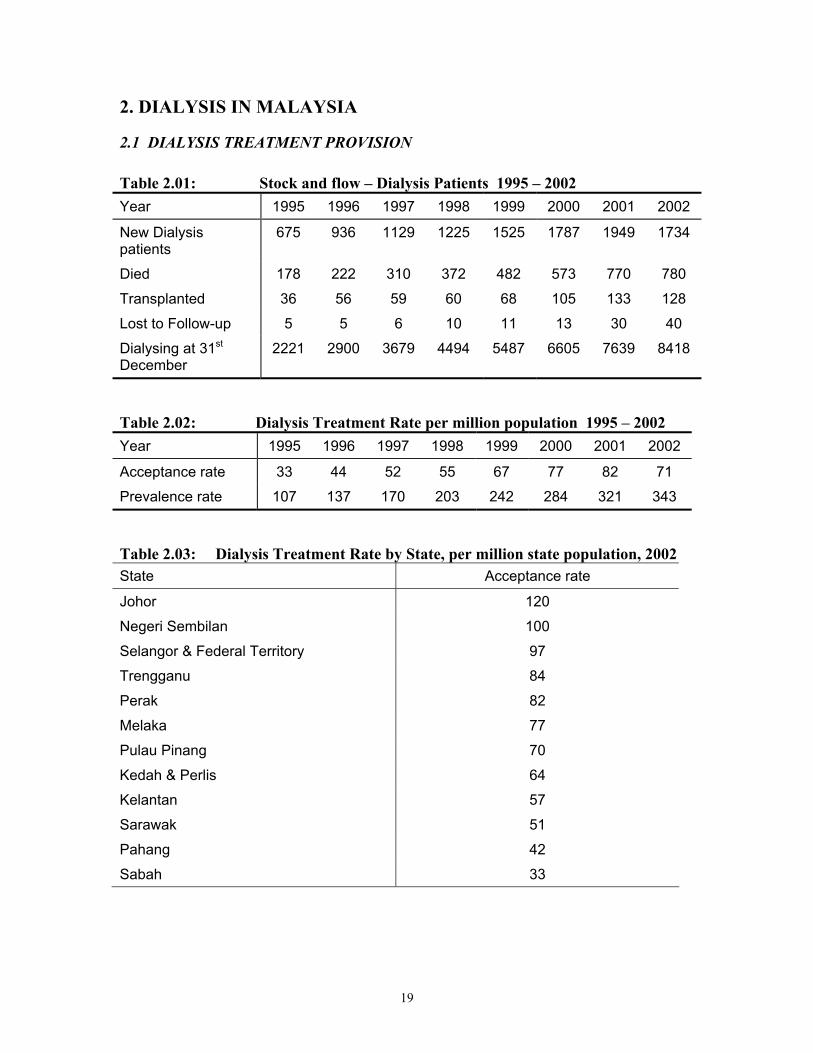
19
2. DIALYSIS IN MALAYSIA
2.1 DIALYSIS TREATMENT PROVISION Table 2.01: Stock and flow – Dialysis Patients 1995 – 2002 Year 1995 1996 1997 1998 1999 2000 2001 2002
New Dialysis patients
675 936 1129 1225 1525 1787 1949 1734
Died 178 222 310 372 482 573 770 780
Transplanted 36 56 59 60 68 105 133 128
Lost to Follow-up 5 5 6 10 11 13 30 40
Dialysing at 31st
December 2221 2900 3679 4494 5487 6605 7639 8418
Table 2.02: Dialysis Treatment Rate per million population 1995 – 2002 Year 1995 1996 1997 1998 1999 2000 2001 2002
Acceptance rate 33 44 52 55 67 77 82 71
Prevalence rate 107 137 170 203 242 284 321 343
Table 2.03: Dialysis Treatment Rate by State, per million state population, 2002 State Acceptance rate
Johor 120
Negeri Sembilan 100
Selangor & Federal Territory 97
Trengganu 84
Perak 82
Melaka 77
Pulau Pinang 70
Kedah & Perlis 64
Kelantan 57
Sarawak 51
Pahang 42
Sabah 33
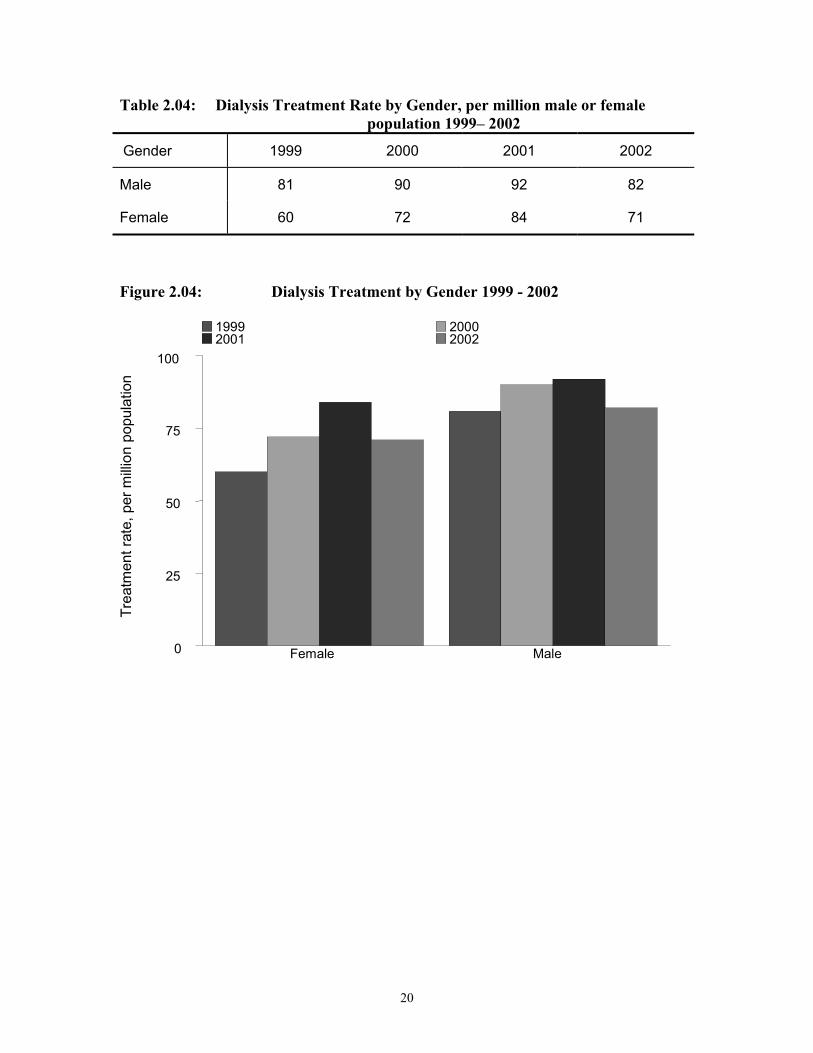
20
Table 2.04: Dialysis Treatment Rate by Gender, per million male or female population 1999– 2002
Gender 1999 2000 2001 2002
Male 81 90 92 82
Female 60 72 84 71
Figure 2.04: Dialysis Treatment by Gender 1999 - 2002
Trea
tmen
t rat
e, p
er m
illion
pop
ulat
ion
0
25
50
75
100
1999 2000 2001 2002
Female Male

21
Table 2.05: Dialysis Treatment Rate by Age Group, per million age group population 1999 – 2002
Age groups (years) 1999 2000 2001 2002
1-14 4 4 4 4
15-24 16 18 22 23
25-34 42 44 44 41
35-44 84 99 96 80
45-54 224 244 238 203
55-64 369 424 467 387
> 65 292 347 399 356
Figure 2.05: Dialysis Treatment Rate by Age Group 1999 - 2002
Trea
tmen
t rat
e, p
er m
illion
pop
ulat
ion
0
200
400
600
1999 2000 2001 2002
1-14 15-24 25-34 35-44 45-54 55-64 >=65
Age
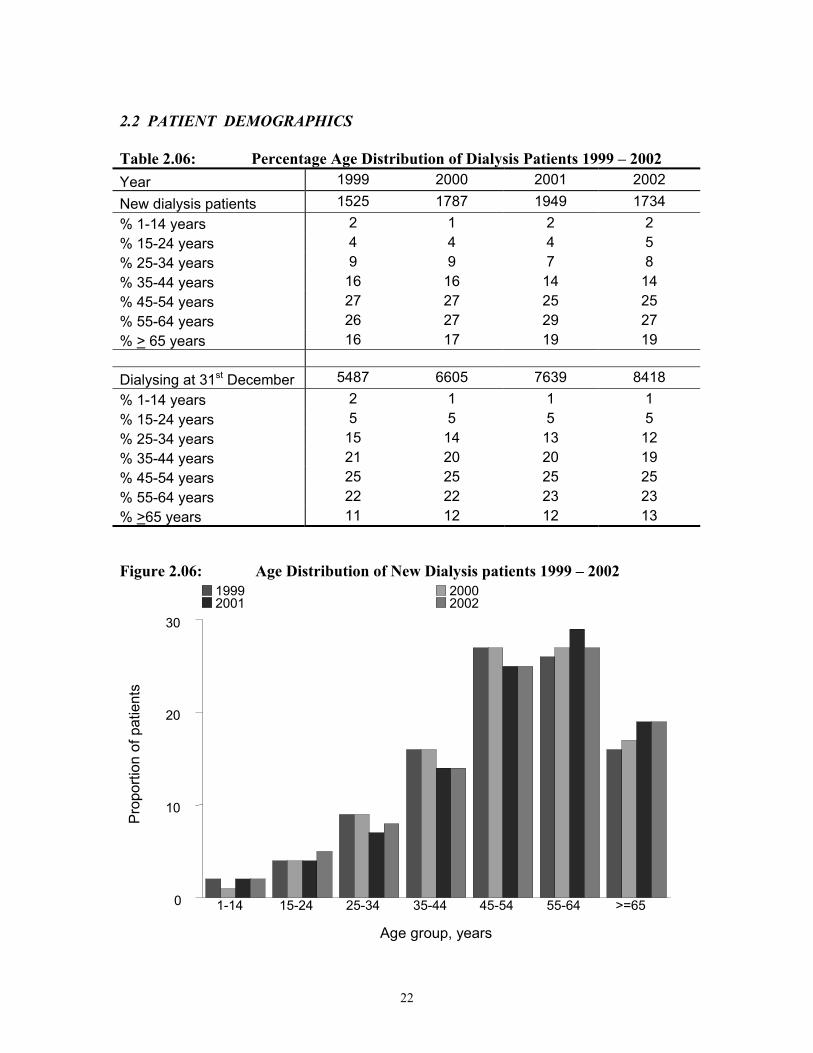
22
2.2 PATIENT DEMOGRAPHICS Table 2.06: Percentage Age Distribution of Dialysis Patients 1999 – 2002 Year 1999 2000 2001 2002
New dialysis patients 1525 1787 1949 1734 % 1-14 years 2 1 2 2 % 15-24 years 4 4 4 5 % 25-34 years 9 9 7 8 % 35-44 years 16 16 14 14 % 45-54 years 27 27 25 25 % 55-64 years 26 27 29 27 % > 65 years 16 17 19 19 Dialysing at 31st December 5487 6605 7639 8418 % 1-14 years 2 1 1 1 % 15-24 years 5 5 5 5 % 25-34 years 15 14 13 12 % 35-44 years 21 20 20 19 % 45-54 years 25 25 25 25 % 55-64 years 22 22 23 23 % >65 years 11 12 12 13
Figure 2.06: Age Distribution of New Dialysis patients 1999 – 2002
Prop
ortio
n of
pat
ient
s
Age group, years
0
10
20
30
1999 2000 2001 2002
1-14 15-24 25-34 35-44 45-54 55-64 >=65

23
Table 2.07: Gender distribution of Dialysis Patients 1999 – 2002
Year 1999 2000 2001 2002
New Dialysis patients 1525 1787 1949 1734
% Male 58 57 53 55
% Female 42 43 47 45
Dialysing at 31st
December 5487 6605 7639 8418
% Male 56 56 55 55
% Female 44 44 45 45
Figure 2.07: Gender Distribution of New Dialysis patients 1999 – 2002
Prop
ortio
n of
pat
ient
s
Gender0
20
40
60
1999 2000 2001 2002
Male Female

24
2.3 METHOD AND LOCATION Table 2.08: Method and Location of Dialysis Year 1999 2000 2001 2002
New Dialysis patients 1525 1787 1949 1734 % Centre HD 85 87 84 81 % Home HD 0 0 1 0 % Office HD 2 1 1 1 % CAPD 13 12 15 18 Dialysing at 31st December
5487 6605 7639 8418
% Centre HD 84 86 87 86 % Home HD 1 1 1 1 % Office HD 4 3 2 2 % CAPD 11 10 10 11
Figure 2.08: Method and Location of New Dialysis Patients
Prop
ortio
n of
pat
ient
s
Method and location of dialysis
0
50
100
1999 2000 2001 2002
Centre HD Home HD Office HD CAPD

25
2.4 PRIMARY RENAL DISEASE Table 2.09: Primary Renal Disease 1999– 2002
Year 1999 2000 2001 2002
New Dialysis patients 1525 1787 1949 1734
% Unknown cause 30 30 32 33
% Diabetic Nephropathy 40 44 45 47
% Glomerulonephritis 11 10 7 7
% Polycystic kidney 1 1 2 1
% Obstructive Uropathy 4 3 3 2
% Gouty Nephropathy 0 0 1 0
% Toxic Nephropathy 1 0 1 0
% Miscellaneous 12 12 10 9

26
2.5 DEATH ON DIALYSIS Table 2.10: Deaths on Dialysis 1995 – 2002 Year 1995 1996 1997 1998 1999 2000 2001 2002
No. of dialysis patients at risk
1980 2561 3290 4087 4991 6046 7122 8029
Dialysis deaths 178 222 310 372 482 573 770 780
Dialysis death rate % 9 9 9 9 10 9 11 10
No. of HD patients at risk
1694 2177 2819 3566 4424 5422 6412 7198
HD deaths 120 160 237 298 382 483 642 667
HD death rate % 7 7 8 8 9 9 10 9
No. of CAPD patients at risk
287 384 471 521 567 625 711 831
CAPD deaths 58 62 73 74 100 90 128 113
CAPD death rate % 20 16 15 14 18 14 18 14
Figure 2.10: Death Rates on Dialysis 1995 – 2002
Dea
th ra
te
Year
Annual death rate on HD Annual death rate on CAPD
1995 1996 1997 1998 1999 2000 2001 2002 0
10
20
30
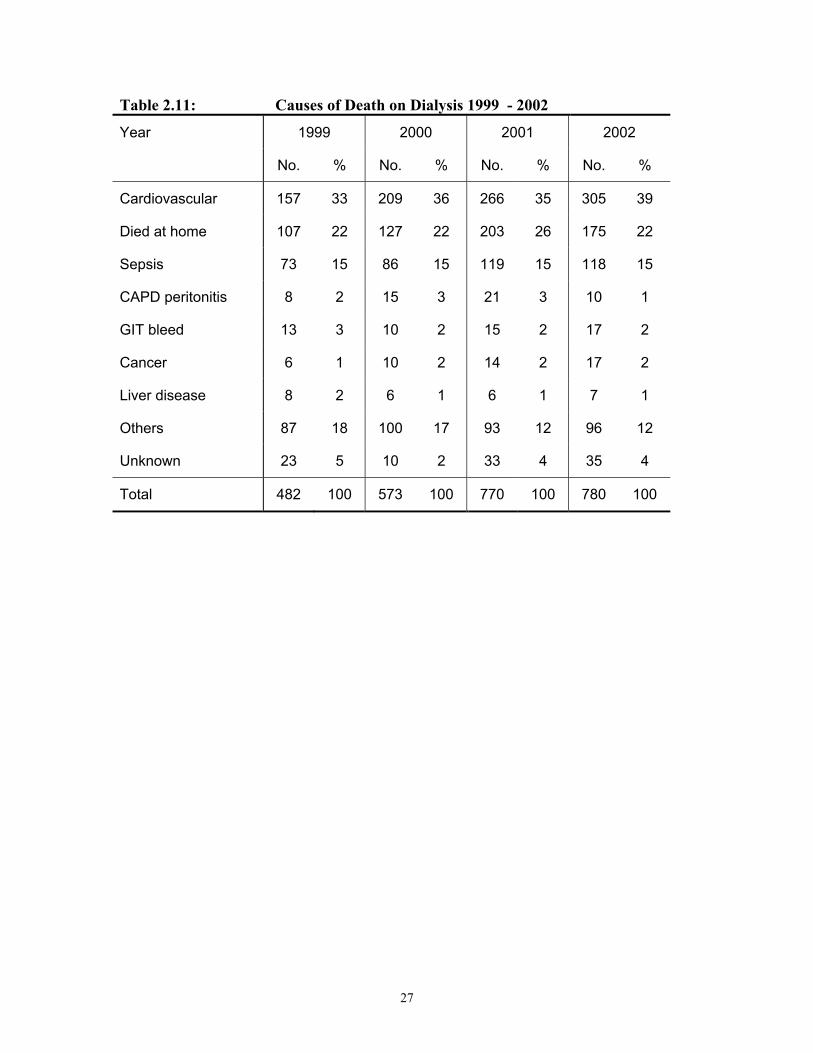
27
Table 2.11: Causes of Death on Dialysis 1999 - 2002
Year 1999 2000 2001 2002
No. % No. % No. % No. %
Cardiovascular 157 33 209 36 266 35 305 39
Died at home 107 22 127 22 203 26 175 22
Sepsis 73 15 86 15 119 15 118 15
CAPD peritonitis 8 2 15 3 21 3 10 1
GIT bleed 13 3 10 2 15 2 17 2
Cancer 6 1 10 2 14 2 17 2
Liver disease 8 2 6 1 6 1 7 1
Others 87 18 100 17 93 12 96 12
Unknown 23 5 10 2 33 4 35 4
Total 482 100 573 100 770 100 780 100

28
2.6. DIALYSIS CENTRE, CAPACITY AND TREATMENT PROVISION (Up-To- Date Results From Year 2002 Centre Survey, as at December 2002) Table 2.12: Number of dialysis centres, number of HD machines and treatment capacity, HD capacity to patient ratio
By State, December 2002 State Centres
HD (No.)
Centre HD
machines
Centre HD
machines pmp
Centre HD
capacity (No.)
Centre HD
capacity pmp
Centre HD
patients (No.)
Centre HD
patients pmp
HD capacity:patient
ratio
All dialysis patients
(No.)
Dialysis treatment rate pmp
Melaka (Me) 10 141 209 705 1046 455 675 1.55 460 682
Penang (Pe) 24 310 223 1550 1115 813 585 1.91 832 598
Johor (Jo) 33 391 135 1955 676 1359 470 1.44 1381 478
Perak (Pe) 20 301 139 1505 696 995 460 1.51 1024 474
Selangor & Federal Territory (SF)
62 805 137 4025 686 2499 426 1.61 2606 444
Negeri Sembilan (Ne)
7 119 133 595 663 337 376 1.77 352 392
Sarawak (Sw) 14 171 79 855 395 570 263 1.5 650 300
Kedah & Perlis (KP)
22 162 83 810 414 512 262 1.58 531 271
Trengganu (Tr)
5 55 58 275 292 158 168 1.74 162 172
Pahang (Pa) 7 69 51 345 256 207 154 1.67 217 161
Kelantan (Ke) 8 71 50 355 249 199 140 1.78 205 144
Sabah (Sb) 11 85 30 425 151 266 95 1.6 288 103
Malaysia 223 2680 115 13400 576 8370 360 1.6 8708 374 pmp = per million population

29
Figure 2.12 (a): Distribution of dialysis centres by State, December 2002 .
. N
umbe
r of d
ialy
sis
cent
res
0
10
20
30
40
50
60
70
Tr Ne Pa Ke Me Sb Sw Pk KP Pe Jo SF State
Figure 2.12 (b): Distribution of dialysis patients by State, December 2002
Num
ber o
f dia
lysi
s pa
tient
s
0 100 300 500
1000
1500
2000
3000
Tr Ke Pa Sb Ne Me KP Sw Pe Pk Jo SF
State
Key: Please refer Table 2.12

30
Figure 2.12 (c): Distribution of dialysis treatment by State, December 2002
Dia
lysi
s pa
tient
s/m
illion
pop
ulat
ion
0 50
100 150 200 250 300
400
500
600
700
Sb Ke Pa Tr KP Sw Ne SF Pk Jo Pe Me
State
Figure 2.12 (d): HD capacity to patient ratio by State, December 2002
HD
cap
acity
: pa
tient
0
.5
1
1.5
2
Jo Sw Pk Me KP Sb SF Pa Tr Ne Ke Pe State
Key: Please refer Table 2.12
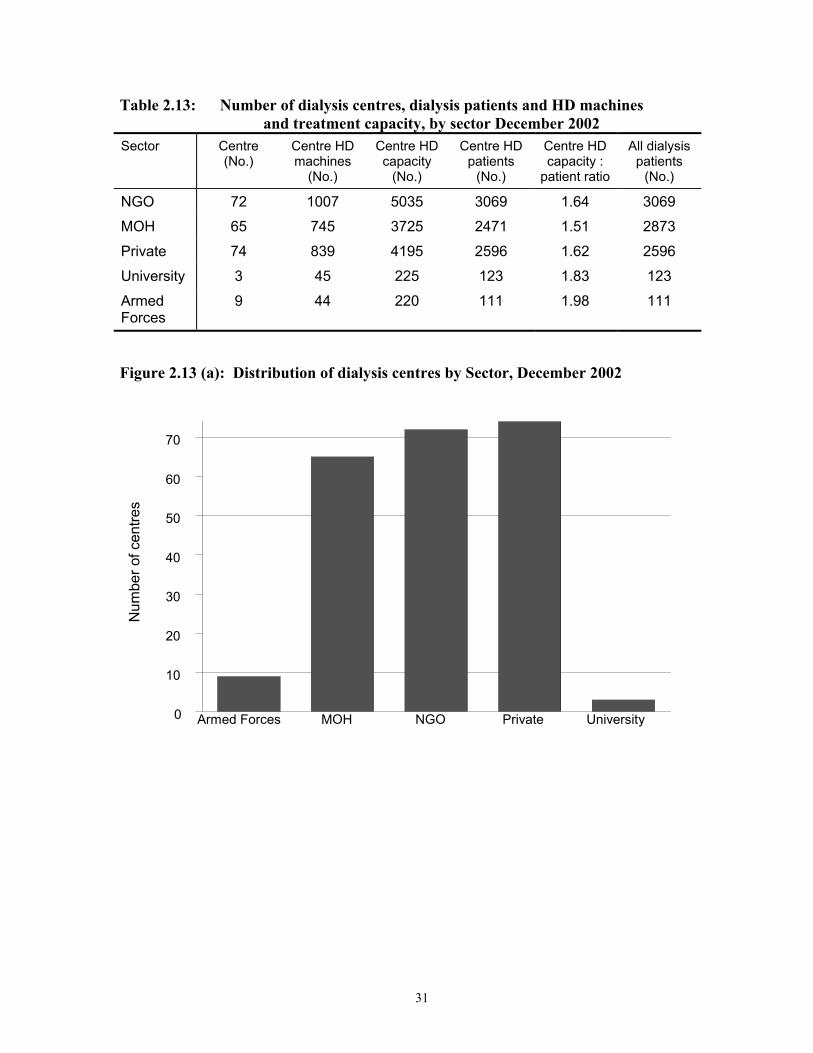
31
Table 2.13: Number of dialysis centres, dialysis patients and HD machines and treatment capacity, by sector December 2002
Sector Centre (No.)
Centre HD machines
(No.)
Centre HD capacity
(No.)
Centre HD patients
(No.)
Centre HD capacity :
patient ratio
All dialysis patients
(No.)
NGO 72 1007 5035 3069 1.64 3069
MOH 65 745 3725 2471 1.51 2873
Private 74 839 4195 2596 1.62 2596
University 3 45 225 123 1.83 123
Armed Forces
9 44 220 111 1.98 111
Figure 2.13 (a): Distribution of dialysis centres by Sector, December 2002
Num
ber o
f cen
tres
0
10
20
30
40
50
60
70
Armed Forces MOH NGO Private University

32
Figure 2.13 (b): Distribution of HD capacity by Sector, December 2002
HD
cap
acity
0 200 500
1000
2000
3000
4000
5000
Armed Forces MOH NGO Private University
Figure 2.13 (c): Distribution of dialysis patients by Sector, December 2002
Num
ber o
f dia
lysi
s pa
tient
s
0 200
500
1000
1500
2000
3000
Armed Forces MOH NGO Private University

33
Figure 2.13 (d): HD capacity: patient ratio by Sector, December 2002
HD
cap
acity
: pa
tient
ratio
1
1.5
2
MOH NGO Private

34
HAEMODIALYSIS IN MALAYSIA
HAEMODIALYSIS IN GOVERNMENT CENTRES
HAEMODIALYSIS IN NON-GOVERNMENTAL ORGANISATION (NGO) CENTRES
HAEMODIALYSIS IN PRIVATE CENTRES

35
HAEMODIALYSIS
IN
GOVERNMENT CENTRES
Stock and Flow
Place of Haemodialysis and its Finance
Death on Haemodialysis and Transfer to PD
Government Haemodialysis Centres
Haemodialysis Patient Characteristics
Survival Analysis
Work related rehabilitation and quality of life
Haemodialysis practices
Dyslipidaemia in HD patients
Treatment of Renal Bone Disease
Management of Blood Pressure
Management of Anaemia
Nutritional status
Prevalence of anti-HCV and HbsAg

36
3. HAEMODIALYSIS IN MALAYSIA
3.1 HAEMODIALYSIS IN GOVERNMENT CENTRES
3.1.1 STOCK AND FLOW
Table 3.1.01: Stock and flow of Haemodialysis Patients, Government Centres 1995 – 2002
Year 1995 1996 1997 1998 1999 2000 2001 2002
New patients 209 293 410 346 393 407 468 450
Died 85 115 139 159 210 198 219 262
Transferred to PD 13 7 9 6 12 6 27 41
Transplanted 25 35 34 30 26 26 41 32
Lost to follow up 5 1 3 7 5 4 3 8
On HD at 31st December
1126 1298 1574 1765 1942 2177 2425 2602
Figure 3.1.01: Stock and Flow HD patients, Government Centres 1995 – 2002
No.
of p
atie
nts
0
1000
2000
3000 New patients on RRT at 31st December
1995 1996 1997 1998 1999 2000 2001 2002
Year

37
3.1.2 PLACE OF HAEMODIALYSIS AND ITS FINANCE Table 3.1.02: Place for HD, Government Centres 1999 – 2002 Year 1999 2000 2001 2002 New patients 393 407 468 450 % Centre HD 94 96 94 96 % Home HD 1 1 2 1 % Office HD 5 3 4 2 On HD at 31st December 1942 2177 2425 2602 % Centre HD 88 90 91 92 % Home HD 3 2 2 2 % Office HD 9 8 7 6
Figure 3.1.02: Place of HD, Government Centres 1999- 2002
Prop
ortio
n of
pat
ient
s
Place of HD
0
50
100
1998 1999 2000 2001
Centre HD Home HD Office HD

38
Table 3.1.03: Finance for HD, Government Centres 1999 – 2002
Year 1999 2000 2001 2002
New patients 393 407 468 450
Government funded 99 99 98 99
% Self funded 0 1 2 1
% Employer subsidy 0 0 0 1
% Charity 0 0 0 0 on HD at 31st December 1942 2177 2425 2602
% Government funded 98 98 98 99
% Self funded 1 1 1 1
% Employer subsidy 1 1 0 1
% Charity 0 0 0 0
Figure 3.1.03: Finance for new HD, Government Centres 1999 – 2002
Prop
ortio
n of
pat
ient
s
Funding for HD
0
50
100
1999 2000 2001 2002
Government funded Self funded Employer subsidy Charity

39
3.1.3 DEATH ON HAEMODIALYSIS AND TRANSFER TO PERITONEAL DIALYSIS
Table 3.1.04: HD Death Rate and Transfer to PD, Government Centres 1995 – 2002
year 1995 1996 1997 1998 1999 2000 2001 2002
No. at risk 1126 1212 1436 1670 1854 2060 2301 2514
Deaths 85 115 139 159 210 198 219 262
Death rate % 8 9 10 10 11 10 10 10
Transfer to PD 13 7 9 6 12 6 27 41
Transfer to PD rate % 1 1 1 0 1 0 1 2
All Losses 98 122 148 165 222 204 246 303
All Losses rate % 9 10 10 10 12 10 11 12
Figure 3.1.04: Death Rate on HD, Government Centres 1995 – 2002
Dea
th ra
te %
0
10
20
30 Annual death rate
1995 1996 1997 1998 1999 2000 2001 2002
Year

40
Table 3.1.05: Causes of Death on HD, Government Centres 1999 – 2002
Cause of death 1999 2000 2001 2002
No. % No. % No. % No. %
Cardiovascular 79 38 73 37 87 40 91 35
Died at home 44 21 33 17 35 16 56 21
Sepsis 37 18 43 22 43 20 56 21
GIT bleed 6 3 6 3 4 2 7 3
Cancer 2 1 6 3 3 1 7 3
Liver disease 2 1 1 1 1 0 2 1
Others 33 16 32 16 34 16 30 11
Unknown 7 3 4 2 12 5 12 5
Total 210 100 198 100 219 100 262 100
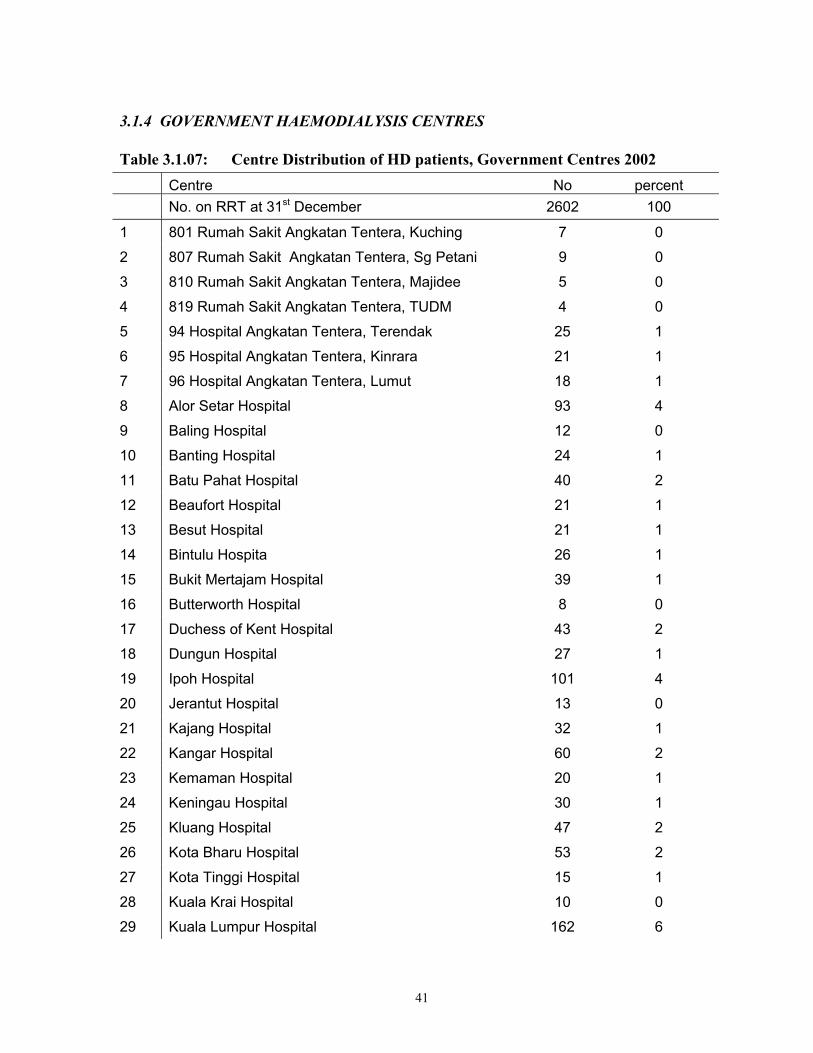
41
3.1.4 GOVERNMENT HAEMODIALYSIS CENTRES
Table 3.1.07: Centre Distribution of HD patients, Government Centres 2002 Centre No percent No. on RRT at 31st December 2602 100
1 801 Rumah Sakit Angkatan Tentera, Kuching 7 0
2 807 Rumah Sakit Angkatan Tentera, Sg Petani 9 0
3 810 Rumah Sakit Angkatan Tentera, Majidee 5 0
4 819 Rumah Sakit Angkatan Tentera, TUDM 4 0
5 94 Hospital Angkatan Tentera, Terendak 25 1
6 95 Hospital Angkatan Tentera, Kinrara 21 1
7 96 Hospital Angkatan Tentera, Lumut 18 1
8 Alor Setar Hospital 93 4
9 Baling Hospital 12 0
10 Banting Hospital 24 1
11 Batu Pahat Hospital 40 2
12 Beaufort Hospital 21 1
13 Besut Hospital 21 1
14 Bintulu Hospita 26 1
15 Bukit Mertajam Hospital 39 1
16 Butterworth Hospital 8 0
17 Duchess of Kent Hospital 43 2
18 Dungun Hospital 27 1
19 Ipoh Hospital 101 4
20 Jerantut Hospital 13 0
21 Kajang Hospital 32 1
22 Kangar Hospital 60 2
23 Kemaman Hospital 20 1
24 Keningau Hospital 30 1
25 Kluang Hospital 47 2
26 Kota Bharu Hospital 53 2
27 Kota Tinggi Hospital 15 1
28 Kuala Krai Hospital 10 0
29 Kuala Lumpur Hospital 162 6

42
30 Kuala Lumpur Hospital (Paed.) 3 0
31 Kuala Nerang Hospital 7 0
32 Kuala Pilah Hospital 33 1
33 Kuala Terengganu Hospital 68 3
34 Kuching Hospital 83 3
35 Kulim Hospital 19 1
36 Labuan Hospital 25 1
37 Lahad Datu Hospital 12 0
38 Langkawi Hospital 18 1
39 Melaka Hospital 53 2
40 Mentakab Hospital 42 2
41 Miri Hospital 66 3
42 Muar Hospital 59 2
43 Pasir Mas Hospital 8 0
44 Pontian Hospital 18 1
45 Port Dickson Hospital 11 0
46 Pulau Pinang Hospital 77 3
47 Pusat Hemodialisis KEMENTAH 14 1
48 Pusat Kesihatan Jitra 12 0
49 Pusat Perubatan Angkatan Tentera (KB) 11 0
50 Putrajaya Hospital 34 1
51 Queen Elizabeth Hospital 74 3
52 Raub Hospital 32 1
53 Sarikei Hospital 13 0
54 Segamat Hospital 37 1
55 Selayang Hospital 54 2
56 Seremban Hospital 49 2
57 Seri Manjung Hospital 7 0
58 Serian Hospital 9 0
59 Sibu Hospital 48 2
60 Sik Hospital 14 1
61 Sri Aman Hospital 19 1
62 Sultanah Aminah Hospital 105 4
63 Sungai Bakap Hospital 6 0

43
64 Sungai Petani Hospital 36 1
65 Taiping Hospital 38 1
66 Tanah Merah Hospital 20 1
67 Tanjung Karang Hospital 32 1
68 Tanjung Malim Hospital 12 0
69 Tawau Hospital 60 2
70 Teluk Intan Hospital 29 1
71 Tengku Ampuan Jemaah Hospital, Sabak Bernam 11 0
72 Tengku Ampuan Afzan Hospital, Kuantan 57 2
73 Tengku Ampuan Rahimah Hospital, Klang 66 3
74 Universiti Kebangsaan Malaysia Hospital 28 1
75 Universiti Sains Malaysia Hospital 13 0
76 University Malaya Medical Centre 65 2
77 Yan Hospital 9 0
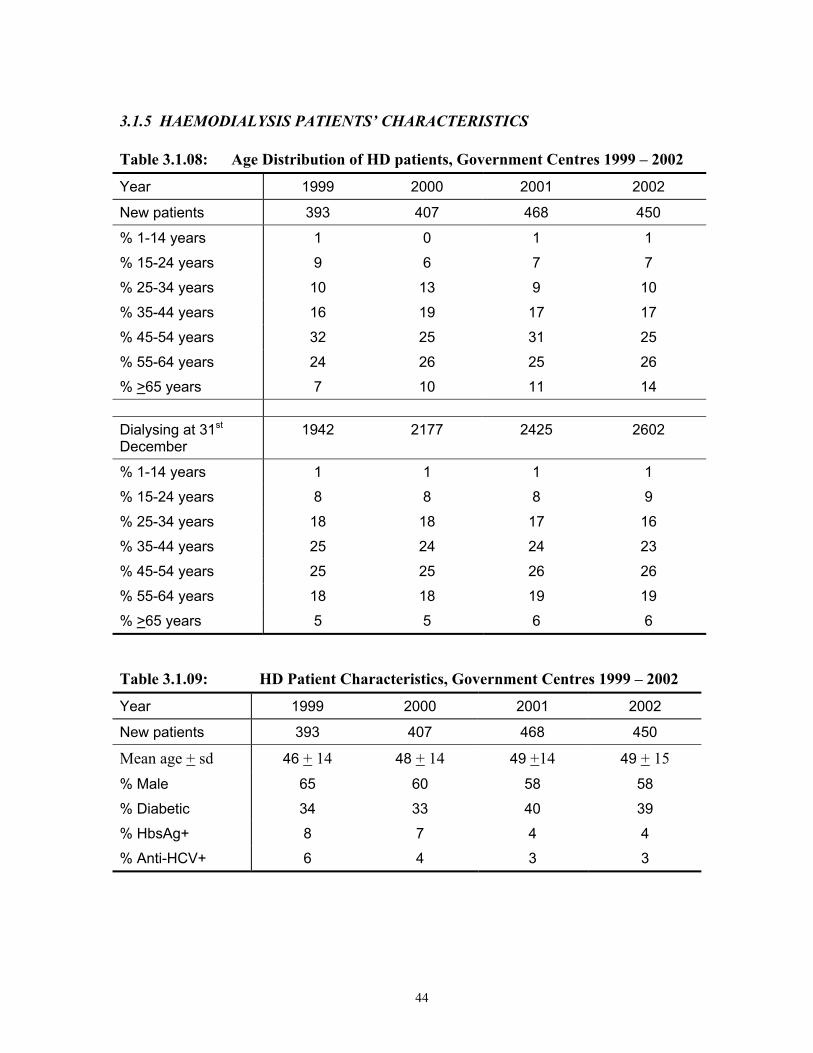
44
3.1.5 HAEMODIALYSIS PATIENTS’ CHARACTERISTICS
Table 3.1.08: Age Distribution of HD patients, Government Centres 1999 – 2002
Year 1999 2000 2001 2002
New patients 393 407 468 450
% 1-14 years 1 0 1 1
% 15-24 years 9 6 7 7
% 25-34 years 10 13 9 10
% 35-44 years 16 19 17 17
% 45-54 years 32 25 31 25
% 55-64 years 24 26 25 26
% >65 years 7 10 11 14 Dialysing at 31st
December 1942 2177 2425 2602
% 1-14 years 1 1 1 1
% 15-24 years 8 8 8 9
% 25-34 years 18 18 17 16
% 35-44 years 25 24 24 23
% 45-54 years 25 25 26 26
% 55-64 years 18 18 19 19
% >65 years 5 5 6 6
Table 3.1.09: HD Patient Characteristics, Government Centres 1999 – 2002
Year 1999 2000 2001 2002
New patients 393 407 468 450
Mean age + sd 46 + 14 48 + 14 49 +14 49 + 15
% Male 65 60 58 58
% Diabetic 34 33 40 39
% HbsAg+ 8 7 4 4
% Anti-HCV+ 6 4 3 3

45
3.1.6 SURVIVAL ANALYSIS – GOVERNMENT CENTRES Table 3.1.10: HD patient Survival related to Year of Entry, Government Centres
1997 – 2002 Year 1997 1998 1999 Interval (months)
% survival SE No % survival SE No % survival SE No
6 93 1 422 94 1 362 92 1 388 12 88 2 393 90 2 339 86 2 359 24 82 2 355 82 2 305 80 2 324 36 75 2 324 75 2 277 73 2 290 48 68 2 291 70 2 244 60 63 2 261 Year 2000 2001 2002 Interval (months)
% survival SE No % survival SE No % survival SE No
6 92 1 429 91 1 472 92 1 250 12 89 1 406 85 2 429 24 81 2 351 No. = number at risk SE = standard error Figure 3.1.10: HD patient Survival related to Year of Entry, Government Centres 1998– 2002 Kaplan-Meier survival estimates, by Year
Cum
ulat
ive
surv
ival
Duration in months 0 12 24 36 48 60
0.00
0.25
0.50
0.75
1.00
Yr 1998
Yr 1999
Yr 2000Yr 2001
Yr 2002

46
Table 3.1.11: HD Technique Survival related to Year of Entry, Government Centres 1997– 2002
Year 1997 1998 1999 Interval % survival SE No % survival SE No % survival SE No 6 93 1 422 93 1 362 91 1 388 12 88 2 393 89 2 339 85 2 359 24 81 2 355 81 2 305 79 2 323 36 74 2 324 74 2 277 71 2 290 48 67 2 291 68 2 245 60 62 2 261 Year 2000 2001 2002 Interval % survival SE No % survival SE No % survival SE No 6 92 1 429 88 1 472 89 2 250 12 88 1 406 81 2 429 24 80 2 351 No. = number at risk SE = standard error
Figure 3.1.11: HD Technique Survival by Year of Entry, Government Centres 1998 – 2002 Kaplan-Meier survival estimates, by Year
Cum
ulat
ive
surv
ival
Duration in months
0 12 24 36 48 60 0.00
0.25
0.50
0.75
1.00
Yr 1998
Yr 1999
Yr 2000Yr 2001
Yr 2002

47
3.1.7 WORK RELATED REHABILITATION AND QUALITY OF LIFE ON HAEMODIALYSIS, GOVERNMENT CENTRES
Table 3.1.12: Work Related Rehabilitation on HD, Government Centres 1999 – 2002
REHABILITATION 1999 2000 2001 2002
STATUS No. % No. % No. % No. %
Full time work for pay 595 35 617 32 685 32 644 30
Part time work for pay 165 10 230 12 204 10 253 12
Able to work but unable to get a job
48 3 74 4 108 5 87 4
Able to work but not yet due to dialysis schedule
54 3 45 2 51 2 74 3
Able but disinclined to work
30 2 35 2 38 2 42 2
Home maker 358 21 419 22 490 23 493 23
Full time student 24 1 45 2 51 2 44 2
Age<15 years 4 0 6 0 6 0 5 0
Retired 204 12 197 10 205 10 192 9
Age>65 years 101 6 129 7 158 7 172 8
Unable to work due to poor health
138 8 115 6 150 7 168 8
Total 1721 100 1912 100 2146 100 2174 100
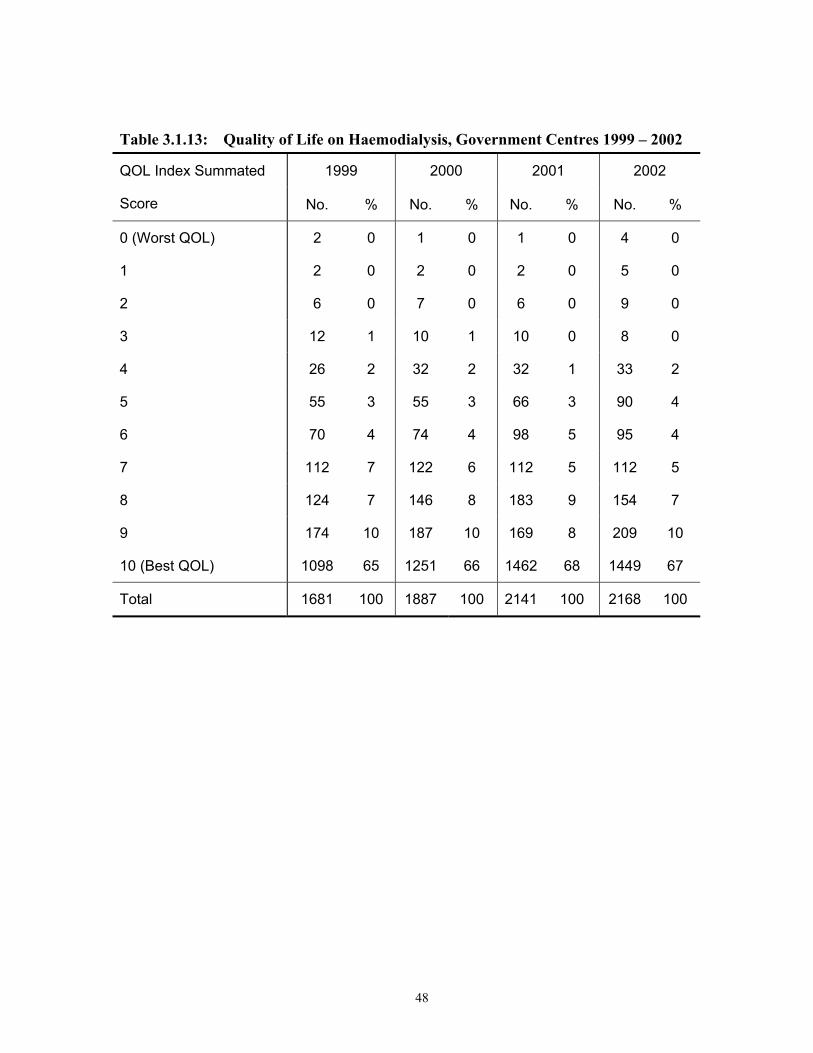
48
Table 3.1.13: Quality of Life on Haemodialysis, Government Centres 1999 – 2002
1999 2000 2001 2002 QOL Index Summated
Score No. % No. % No. % No. %
0 (Worst QOL) 2 0 1 0 1 0 4 0
1 2 0 2 0 2 0 5 0
2 6 0 7 0 6 0 9 0
3 12 1 10 1 10 0 8 0
4 26 2 32 2 32 1 33 2
5 55 3 55 3 66 3 90 4
6 70 4 74 4 98 5 95 4
7 112 7 122 6 112 5 112 5
8 124 7 146 8 183 9 154 7
9 174 10 187 10 169 8 209 10
10 (Best QOL) 1098 65 1251 66 1462 68 1449 67
Total 1681 100 1887 100 2141 100 2168 100

49
3.1.8 HAEMODIALYSIS PRACTICES IN GOVERNMENT CENTRES
Table 3.1.14: Vascular Access on Haemodialysis, Government Centres 1999 – 2002
Access types 1999 2000 2001 2002
No % No % No % No %
Wrist AVF 1480 79 1663 79 1762 76 1819 75
BCF* 296 16 366 17 472 20 492 20
Venous graft 2 0 5 0 4 0 3 0
Artificial graft 23 1 10 0 20 1 19 1
PERMCATH 12 1 14 1 15 1 23 1
Temporary CVC*
51 3 43 2 55 2 63 3
Total 1864 100 2101 100 2328 100 2419 100
* BCF = Brachiocephalic fistula * CVC = Central venous catheter
Table 3.1.15: Difficulties reported with Vascular Access, Government Centres 1999 – 2002
Access 1999 2000 2001 2002
difficulty No % No % No % No %
Difficulty with needle placement
98 5 78 4 89 4 91 4
Difficulty in obtaining desired blood flow rate
58 3 68 3 79 3 58 2
Other difficulty 28 1 15 1 19 1 21 1
No difficulty 1686 90 1946 92 2153 92 2255 93
Total 1870 100 2107 100 2340 100 2425 100
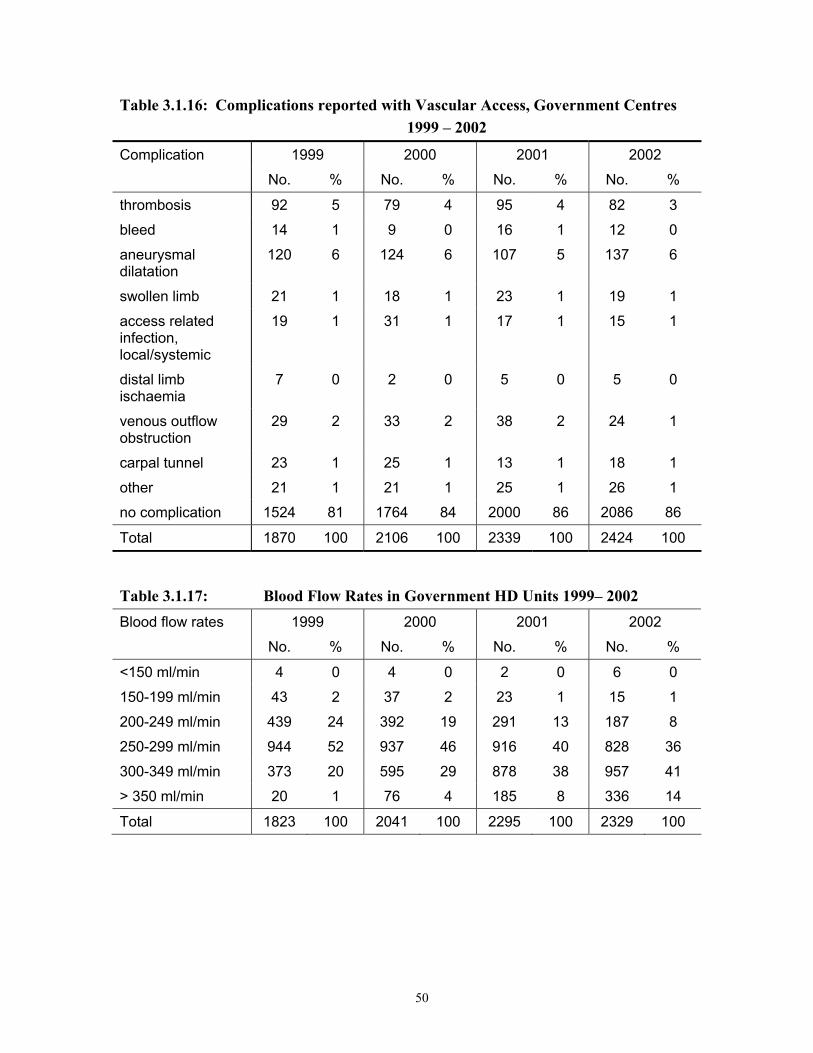
50
Table 3.1.16: Complications reported with Vascular Access, Government Centres 1999 – 2002
Complication 1999 2000 2001 2002
No. % No. % No. % No. %
thrombosis 92 5 79 4 95 4 82 3
bleed 14 1 9 0 16 1 12 0
aneurysmal dilatation
120 6 124 6 107 5 137 6
swollen limb 21 1 18 1 23 1 19 1
access related infection, local/systemic
19 1 31 1 17 1 15 1
distal limb ischaemia
7 0 2 0 5 0 5 0
venous outflow obstruction
29 2 33 2 38 2 24 1
carpal tunnel 23 1 25 1 13 1 18 1
other 21 1 21 1 25 1 26 1
no complication 1524 81 1764 84 2000 86 2086 86
Total 1870 100 2106 100 2339 100 2424 100
Table 3.1.17: Blood Flow Rates in Government HD Units 1999– 2002 Blood flow rates 1999 2000 2001 2002
No. % No. % No. % No. %
<150 ml/min 4 0 4 0 2 0 6 0
150-199 ml/min 43 2 37 2 23 1 15 1
200-249 ml/min 439 24 392 19 291 13 187 8
250-299 ml/min 944 52 937 46 916 40 828 36
300-349 ml/min 373 20 595 29 878 38 957 41
> 350 ml/min 20 1 76 4 185 8 336 14
Total 1823 100 2041 100 2295 100 2329 100

51
Table 3.1.18: Number of HD Sessions per week, Government HD Units 1999 – 2002 HD sessions 1999 2000 2001 2002
Per week No. % No. % No. % No. %
1 1 0 1 0 1 0 2 0
2 18 1 22 1 19 1 19 1
3 1845 99 2074 99 2309 99 2372 99
4 1 0 3 0 11 0 11 0
Total 1865 100 2102 100 2340 100 2404 100
Table 3.1.19: Duration of HD in Government Units 1999 – 2002 Duration of HD 1999 2000 2001 2002
per session No. % No. % No. % No. %
<3 hours 2 0 6 0 1 0 11 0
3.5 hours 0 0 1 0 20 1 0 0
4 hours 1733 93 1983 94 2261 97 2363 98
4.5 hours 107 6 98 5 54 2 26 1
5 hours 23 1 11 1 5 0 2 0
>5 hours 0 0 1 0 0 0 0 0
Total 1865 100 2100 100 2341 100 2402 100
Table 3.1.20: Dialyser membrane types in Government HD Units 1999 – 2002 Dialyser 1999 2000 2001 2002
membrane No. % No. % No. % No. %
Cellulosic 518 38 505 31 409 23 304 14
Cellulose acetate 316 23 295 18 168 9 145 7
Synthetic 541 39 815 50 1200 68 1678 79
Total 1375 100 1615 100 1777 100 2127 100
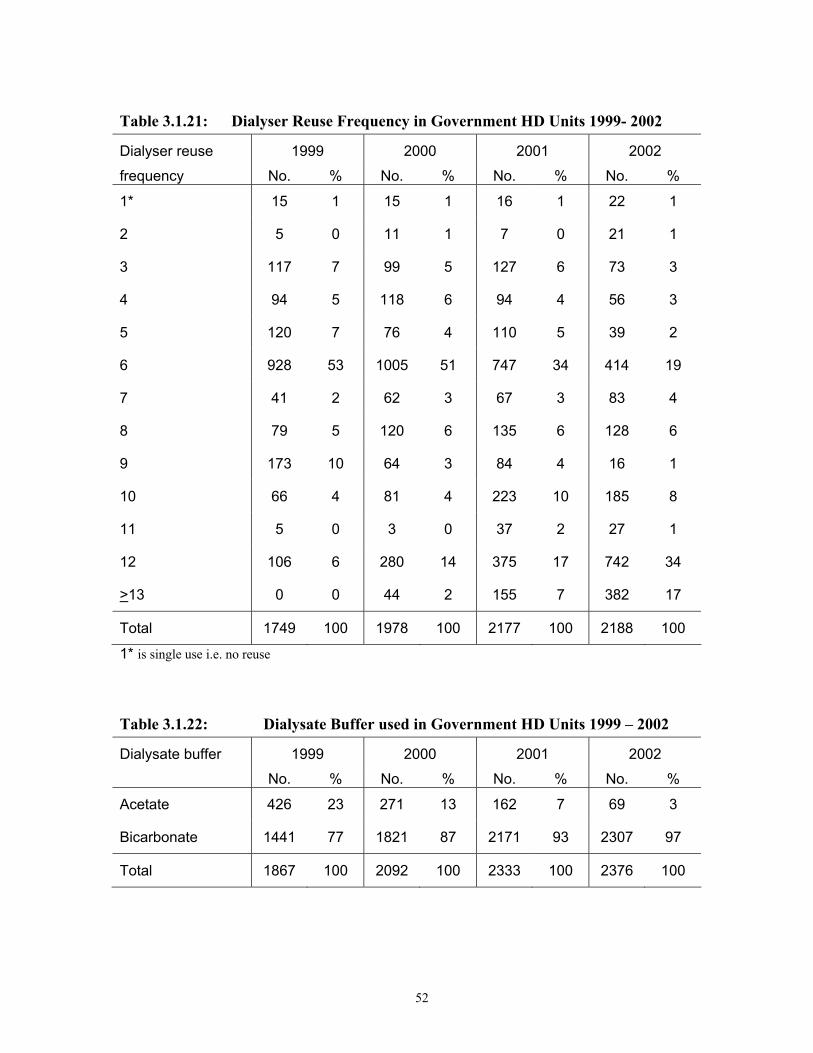
52
Table 3.1.21: Dialyser Reuse Frequency in Government HD Units 1999- 2002
Dialyser reuse 1999 2000 2001 2002
frequency No. % No. % No. % No. %
1* 15 1 15 1 16 1 22 1
2 5 0 11 1 7 0 21 1
3 117 7 99 5 127 6 73 3
4 94 5 118 6 94 4 56 3
5 120 7 76 4 110 5 39 2
6 928 53 1005 51 747 34 414 19
7 41 2 62 3 67 3 83 4
8 79 5 120 6 135 6 128 6
9 173 10 64 3 84 4 16 1
10 66 4 81 4 223 10 185 8
11 5 0 3 0 37 2 27 1
12 106 6 280 14 375 17 742 34
>13 0 0 44 2 155 7 382 17
Total 1749 100 1978 100 2177 100 2188 100
1* is single use i.e. no reuse
Table 3.1.22: Dialysate Buffer used in Government HD Units 1999 – 2002
Dialysate buffer 1999 2000 2001 2002
No. % No. % No. % No. %
Acetate 426 23 271 13 162 7 69 3
Bicarbonate 1441 77 1821 87 2171 93 2307 97
Total 1867 100 2092 100 2333 100 2376 100
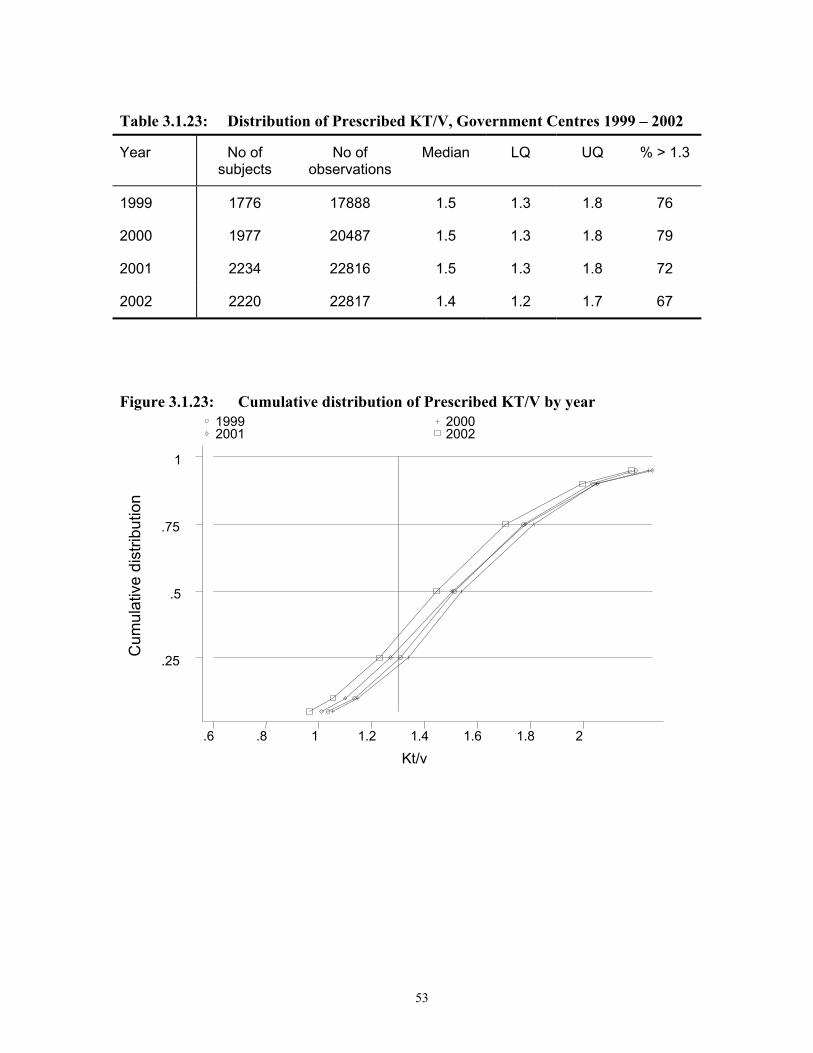
53
Table 3.1.23: Distribution of Prescribed KT/V, Government Centres 1999 – 2002
Year No of subjects
No of observations
Median LQ UQ % > 1.3
1999 1776 17888 1.5 1.3 1.8 76
2000 1977 20487 1.5 1.3 1.8 79
2001 2234 22816 1.5 1.3 1.8 72
2002 2220 22817 1.4 1.2 1.7 67
Figure 3.1.23: Cumulative distribution of Prescribed KT/V by year
Cum
ulat
ive
dist
ribut
ion
Kt/v
1999 2000 2001 2002
.6 .8 1 1.2 1.4 1.6 1.8 2
.25
.5
.75
1

54
3.1.9 DYSLIPIDAEMIA IN HD PATIENTS, GOVERNMENT CENTRES
Table 3.1.24: Distribution of serum Cholesterol Levels (mmol/L), HD patients, Government Centres 1999 – 2002
Year No of subjects
No of observations
Median LQ UQ % Patients < 5.3 mmol/L
1999 1514 2476 4.8 4 5.7 69
2000 1709 2825 4.9 4.1 5.7 69
2001 2007 3416 4.9 4.2 5.8 67
2002 2096 3669 4.9 4.1 5.7 68
Figure 3.1.24: Cumulative distribution of serum cholesterol concentration by year
Cum
ulat
ive
dist
ribut
ion
Serum cholesterol (mmol/L)
1999 2000 2001 2002
1 2 3 4 5.5 7 8 9 10 12 14
.25
.5
.75
1

55
Table 3.1.25: Distribution of serum Triglyceride (mmol/L), HD patients, Government Centres 1999 – 2002
Year No of subjects
No of observations
Median LQ UQ % Patients < 3.5 mmol/L
1999 1400 2221 1.7 1.2 2.5 88
2000 1558 2567 1.7 1.2 2.5 88
2001 1890 3206 1.7 1.2 2.5 87
2002 1990 3475 1.7 1.2 2.5 88
Figure 3.1.25: Cumulative distribution of serum triglyceride concentration by year
Cum
ulat
ive
dist
ribut
ion
Serum triglyceride (mmol/L)
1999 2000 2001 2002
1 2 3.5 5 6
.25
.5
.75
1
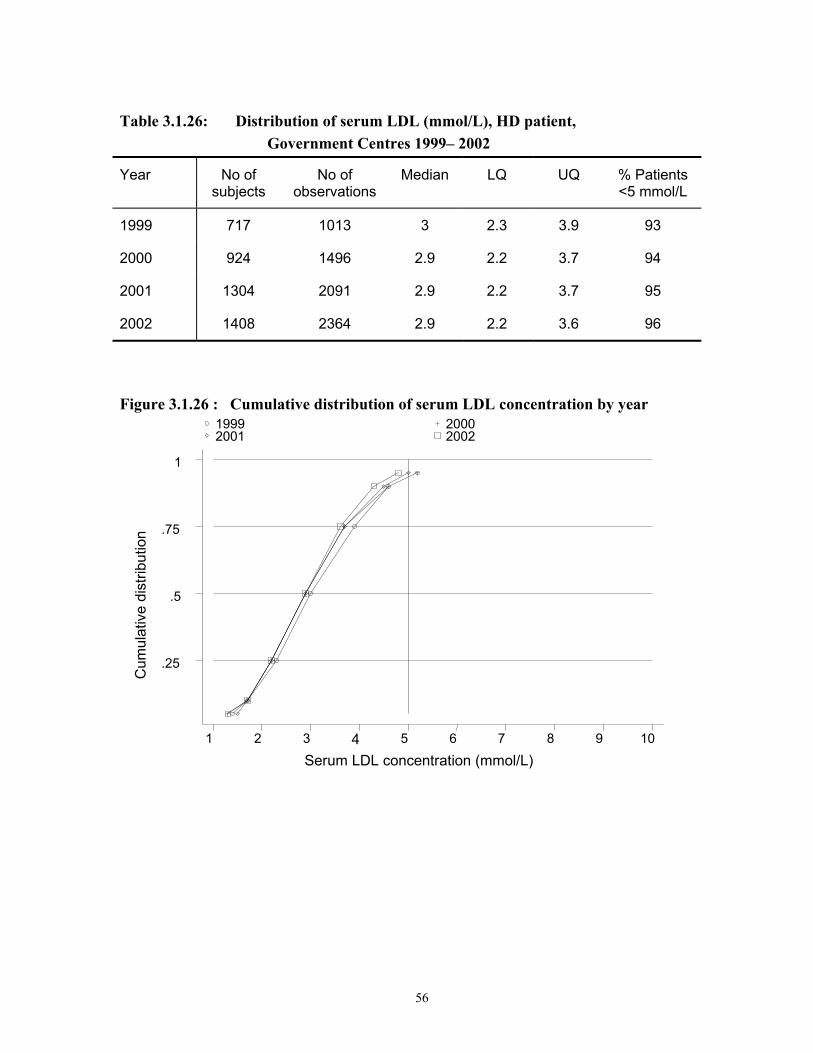
56
Table 3.1.26: Distribution of serum LDL (mmol/L), HD patient, Government Centres 1999– 2002
Year No of subjects
No of observations
Median LQ UQ % Patients <5 mmol/L
1999 717 1013 3 2.3 3.9 93
2000 924 1496 2.9 2.2 3.7 94
2001 1304 2091 2.9 2.2 3.7 95
2002 1408 2364 2.9 2.2 3.6 96
Figure 3.1.26 : Cumulative distribution of serum LDL concentration by year
Cum
ulat
ive
dist
ribut
ion
Serum LDL concentration (mmol/L)
1999 2000 2001 2002
1 2 3 4 5 6 7 8 9 10
.25
.5
.75
1

57
Table 3.1.27: Distribution of serum HDL (mmol/L), HD patient, Government Centres 1999- 2002
Year No of subjects
No of observations
Median LQ UQ % Patients < 2mmol/L
1999 732 1045 1.1 0.9 1.4 95
2000 950 1532 1.1 0.9 1.4 94
2001 1298 2102 1.1 0.9 1.4 93
2002 1414 2395 1.1 0.9 1.4 93
Figure 3.1.27: Cumulative distribution of serum HDL by year
Cum
ulat
ive
dist
ribut
ion
Serum HDL concentration (mmol/L)
1999 2000 2001 2002
1 2 3 4
.25
.5
.75
1

58
3.1.10 MANAGEMENT OF RENAL BONE DISEASE, GOVERNMENT CENTRES
Table 3.1.28: Treatment for Renal Bone Disease, HD patients, Government Centres 1999 – 2002
Year No of subjects % on CaCO3 % on Al(OH)3 % on Vit D 1999 1881 91 9 24 2000 2114 92 8 23 2001 2358 92 4 21 2002 2436 92 5 24
Table 3.1.29: Distribution of serum Phosphate (mmol/l), HD patients, Government Centres 1999 – 2002
Year No of subjects
No of observations
Median LQ UQ % Patients <1.6 mmol/L
1999 1821 5830 1.8 1.4 2.3 36 2000 2046 6600 1.8 1.4 2.3 36 2001 2264 7348 1.8 1.4 2.3 36 2002 2316 7602 1.8 1.4 2.3 34
Figure 3.1.29: Cumulative distribution of serum Phosphate by year
Cum
ulat
ive
dist
ribut
ion
Serum phosphate (mmol/L)
1999 2000 2001 2002
1 1.6 2 3 4
.25
.5
.75
1

59
Table 3.1.30: Distribution of serum Calcium (mmol/l), HD patients, Government Centres 1999– 2002
Year No of subjects
No of observations
Median LQ UQ % Patients > 2.2 & <2.6
mmol/L
1999 1835 5957 2.3 2.1 2.5 52
2000 2058 6707 2.3 2.2 2.5 56
2001 2294 7500 2.4 2.2 2.5 57
2002 2354 7811 2.3 2.1 2.5 55
Figure 3.1.30: Cumulative distribution of serum Calcium by year
Cum
ulat
ive
dist
ribut
ion
Serum calcium (mmol/L)
1999 2000 2001 2002
1 2 2.2 2.6 3 4
.25
.5
.75
1
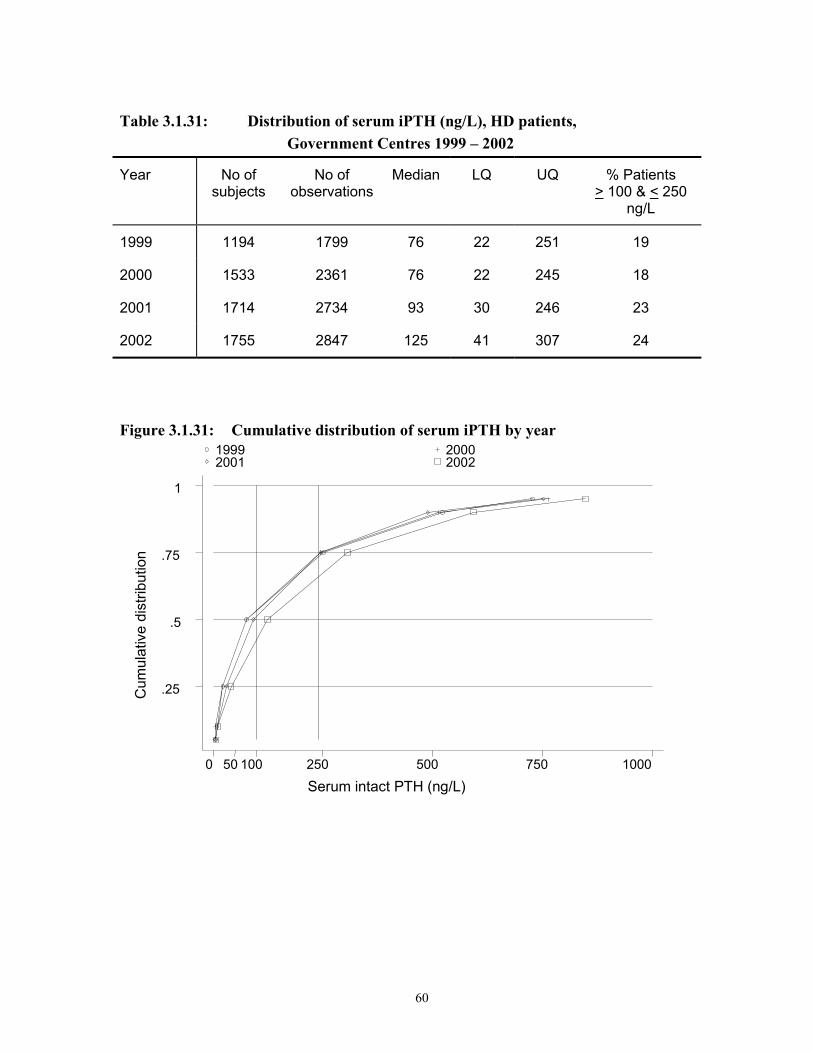
60
Table 3.1.31: Distribution of serum iPTH (ng/L), HD patients, Government Centres 1999 – 2002
Year No of subjects
No of observations
Median LQ UQ % Patients > 100 & < 250
ng/L
1999 1194 1799 76 22 251 19
2000 1533 2361 76 22 245 18
2001 1714 2734 93 30 246 23
2002 1755 2847 125 41 307 24
Figure 3.1.31: Cumulative distribution of serum iPTH by year
Cum
ulat
ive
dist
ribut
ion
Serum intact PTH (ng/L)
1999 2000 2001 2002
0 50 100 250 500 750 1000
.25
.5
.75
1
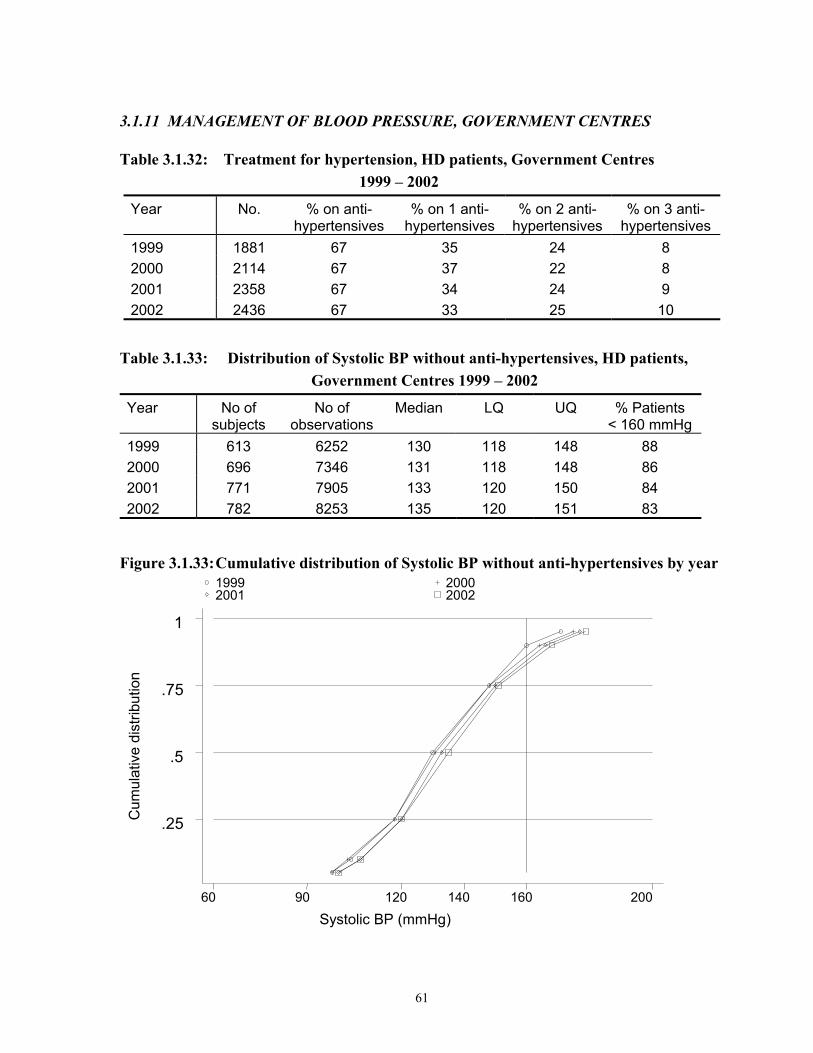
61
3.1.11 MANAGEMENT OF BLOOD PRESSURE, GOVERNMENT CENTRES
Table 3.1.32: Treatment for hypertension, HD patients, Government Centres 1999 – 2002
Year No. % on anti-hypertensives
% on 1 anti-hypertensives
% on 2 anti-hypertensives
% on 3 anti- hypertensives
1999 1881 67 35 24 8 2000 2114 67 37 22 8 2001 2358 67 34 24 9 2002 2436 67 33 25 10
Table 3.1.33: Distribution of Systolic BP without anti-hypertensives, HD patients, Government Centres 1999 – 2002
Year No of subjects
No of observations
Median LQ UQ % Patients < 160 mmHg
1999 613 6252 130 118 148 88 2000 696 7346 131 118 148 86 2001 771 7905 133 120 150 84 2002 782 8253 135 120 151 83
Figure 3.1.33: Cumulative distribution of Systolic BP without anti-hypertensives by year
Cum
ulat
ive
dist
ribut
ion
Systolic BP (mmHg)
1999 2000 2001 2002
60 90 120 140 160 200
.25
.5
.75
1

62
Table 3.1.34: Distribution of Diastolic BP without anti-hypertensives HD patients Government Centres 1999– 2002
Year No of subjects
No of observations
Median LQ UQ % Patients < 90 mmHg
1999 613 6249 79 70 86 80
2000 696 7349 79 70 87 79
2001 770 7902 78 70 86 80
2002 782 8244 79 69 87 80
Figure 3.1.34: Cumulative distribution of Diastolic BP without anti hypertensives by year
Cum
ulat
ive
dist
ribut
ion
Diastolic BP (mmHg)
1999 2000 2001 2002
0 20 40 60 80 90 100 120 140 160
.25
.5
.75
1

63
Table 3.1.35: Distribution of systolic BP on anti-hypertensives, HD patients, Government Centres 1999 – 2002
Year No of subjects
No of observations
Median LQ UQ % Patients < 160 mmHg
1999 1252 12467 150 137 168 61
2000 1401 14289 150 134 169 63
2001 1571 15917 150 135 169 62
2002 1615 16280 150 136 169 61
Figure 3.1.35: Cumulative distribution of systolic BP on anti-hypertensives by year
Cum
ulat
ive
dist
ribut
ion
Systolic BP (mmHg)
1999 2000 2001 2002
60 90 120 140 160 200
.25
.5
.75
1
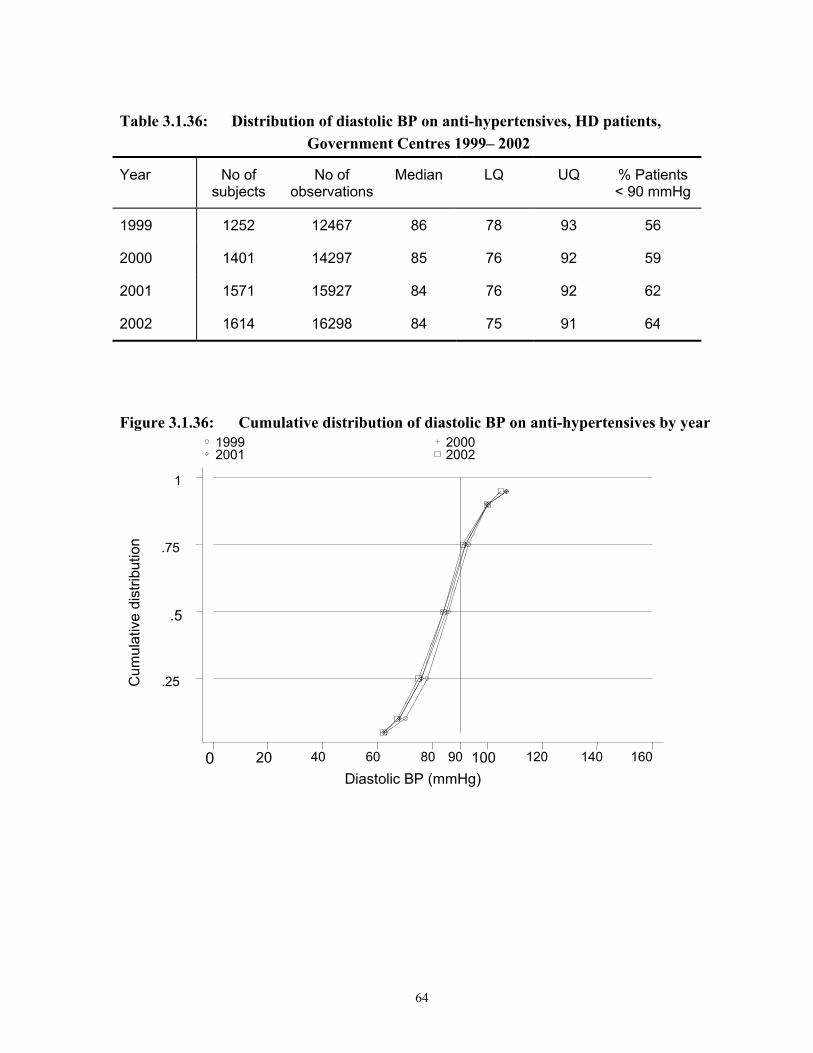
64
Table 3.1.36: Distribution of diastolic BP on anti-hypertensives, HD patients, Government Centres 1999– 2002
Year No of subjects
No of observations
Median LQ UQ % Patients < 90 mmHg
1999 1252 12467 86 78 93 56
2000 1401 14297 85 76 92 59
2001 1571 15927 84 76 92 62
2002 1614 16298 84 75 91 64
Figure 3.1.36: Cumulative distribution of diastolic BP on anti-hypertensives by year
Cum
ulat
ive
dist
ribut
ion
Diastolic BP (mmHg)
1999 2000 2001 2002
0 20 40 60 80 90 100 120 140 160
.25
.5
.75
1

65
3.1.12 TREATMENT OF ANAEMIA, GOVERNMENT HD CENTRES
Table 3.1.37: Treatment for Anaemia, HD patients, Government Centres 1999 – 2002
Year No % on rHuEpo
% received blood
transfusion
% on oral Iron
% received parenteral
Iron
1999 1881 49 16 94 5
2000 2114 54 15 92 7
2001 2358 60 13 91 7
2002 2436 66 11 89 11
Table 3.1.38: Distribution of rHuEpo dose per week, HD patients, Government Centres 1999 – 2002
Year 1999 2000 2001 2002
No. of patients 872 1085 1386 1575
% on 2000 u/week 20 21 20 18
% on 2-4000 u/week 60 57 58 56
% on 4-6000 u/week 6 7 8 10
% on 6-8000 u/week 14 11 12 12
% on 8-12000 u/week 2 4 3 3
% on >12000 u/week 0 0 0 0
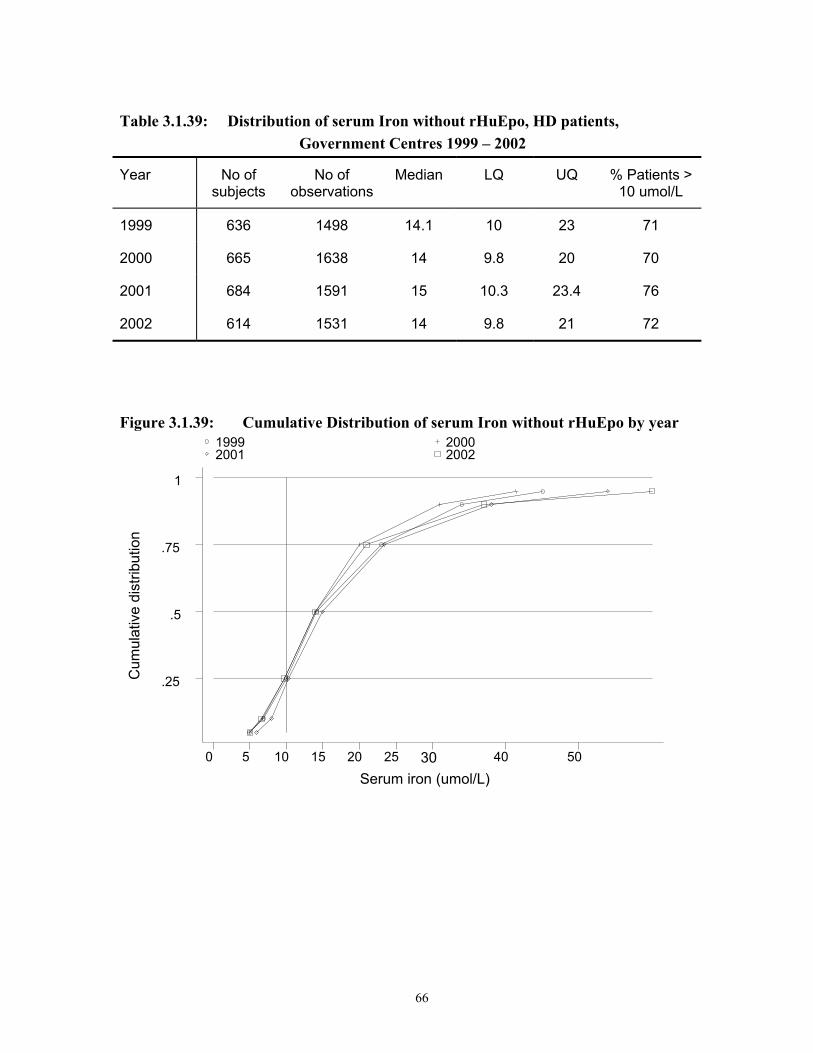
66
Table 3.1.39: Distribution of serum Iron without rHuEpo, HD patients, Government Centres 1999 – 2002
Year No of subjects
No of observations
Median LQ UQ % Patients > 10 umol/L
1999 636 1498 14.1 10 23 71
2000 665 1638 14 9.8 20 70
2001 684 1591 15 10.3 23.4 76
2002 614 1531 14 9.8 21 72
Figure 3.1.39: Cumulative Distribution of serum Iron without rHuEpo by year
Cum
ulat
ive
dist
ribut
ion
Serum iron (umol/L)
1999 2000 2001 2002
0 5 10 15 20 25 30 40 50
.25
.5
.75
1
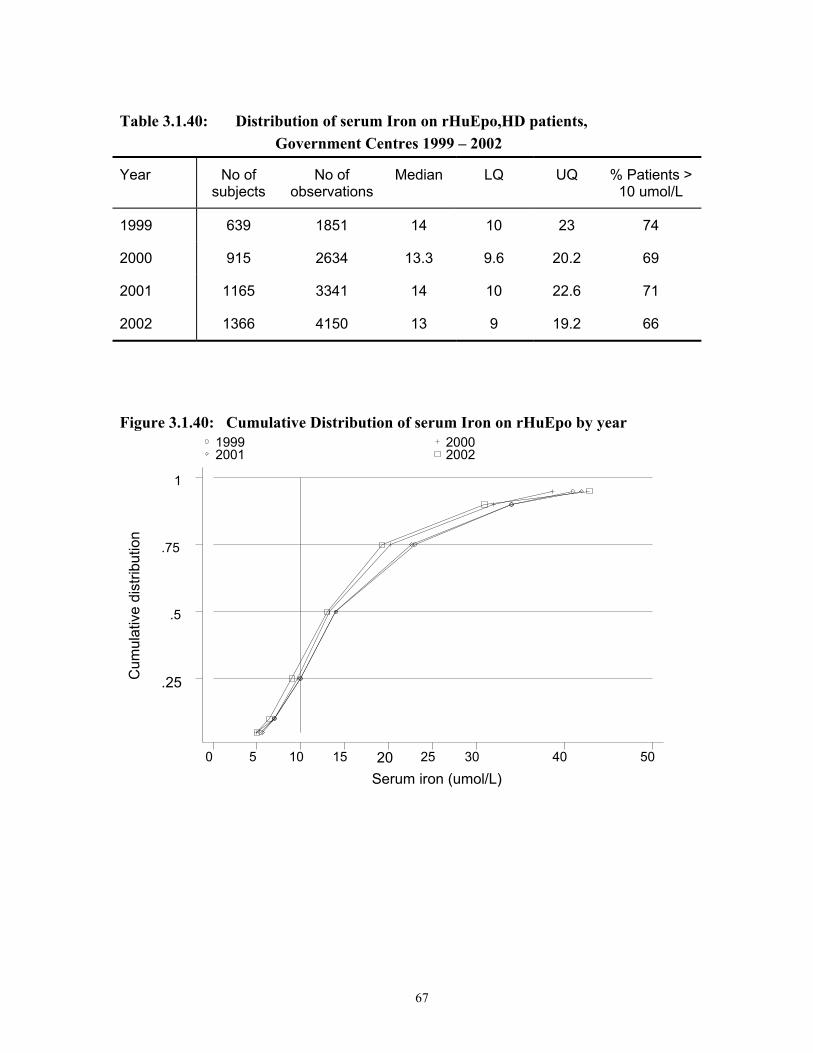
67
Table 3.1.40: Distribution of serum Iron on rHuEpo,HD patients, Government Centres 1999 – 2002
Year No of subjects
No of observations
Median LQ UQ % Patients > 10 umol/L
1999 639 1851 14 10 23 74
2000 915 2634 13.3 9.6 20.2 69
2001 1165 3341 14 10 22.6 71
2002 1366 4150 13 9 19.2 66
Figure 3.1.40: Cumulative Distribution of serum Iron on rHuEpo by year
Cum
ulat
ive
dist
ribut
ion
Serum iron (umol/L)
1999 2000 2001 2002
0 5 10 15 20 25 30 40 50
.25
.5
.75
1

68
Table 3.1.41: Distribution of Transferrin Saturation without rHuEpo, HD patients, Government Centres 1999 – 2002
Year No of subjects
No of observations
Median LQ UQ % Patients > 20%
1999 381 1524 27.2 18.3 41.6 69
2000 559 2236 29.2 19.4 43.4 72
2001 594 2376 30.8 22.5 44.2 80
2002 522 2088 32.3 21.9 48.4 80
Figure 3.1.41: Cumulative distribution of serum Transferrin Saturation without rHuEpo by year
Cum
ulat
ive
dist
ribut
ion
Serum transferrin saturation (%)
1999 2000 2001 2002
0 10 20 30 40 50 60 70 80
.25
.5
.75
1

69
Table 3.1.42: Distribution of Transferrin Saturation on rHuEpo, HD patients, Government Centres 1999 – 2002
Year No of subjects
No of observations
Median LQ UQ % Patients > 20%
1999 481 1924 30.2 21 42.4 78
2000 854 3416 29.8 20.1 42.9 75
2001 1071 4284 31.9 22.6 47.9 80
2002 1204 4816 30.9 21.1 46.8 77
Figure 3.1.42: Cumulative distribution of serum Transferrin Saturation on rHuEpo by year
Cum
ulat
ive
dist
ribut
ion
Serum transferrin saturation (%)
1999 2000 2001 2002
0 10 20 30 40 50 60 70 80
.25
.5
.75
1

70
Table 3.1.43: Distribution of serum Ferritin without rHuEpo, HD patients, Government Centres 1999 – 2002
Year No of subjects
No of observations
Median LQ UQ % Patients > 100 ug/L
1999 288 433 385 157 828 85
2000 379 578 317.5 131.7 743 80
2001 454 719 355.8 157.3 779 86
2002 418 673 353 132 728 80
Figure 3.1.43:Cumulative distribution of serum Ferritin without rHuEpo by year
Cum
ulat
ive
dist
ribut
ion
Serum ferritin (ug/L)
1999 2000 2001 2002
0 50 100 200 400 600 800
.25
.5
.75
1
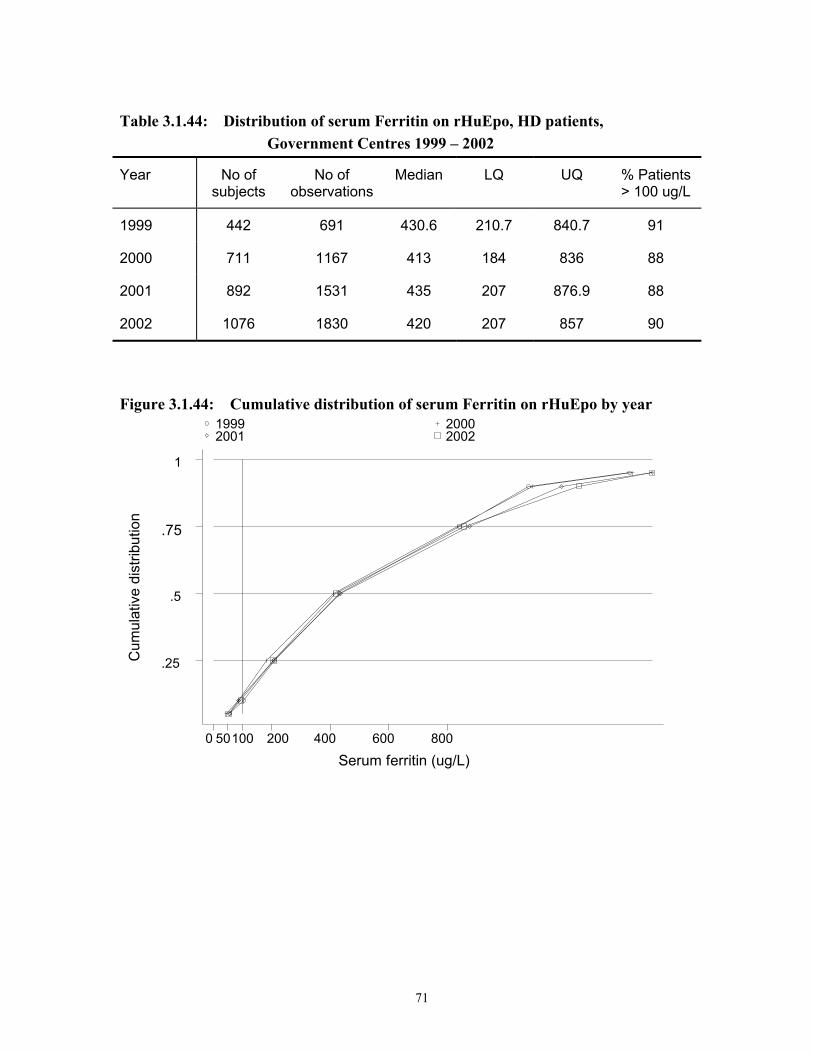
71
Table 3.1.44: Distribution of serum Ferritin on rHuEpo, HD patients, Government Centres 1999 – 2002
Year No of subjects
No of observations
Median LQ UQ % Patients > 100 ug/L
1999 442 691 430.6 210.7 840.7 91
2000 711 1167 413 184 836 88
2001 892 1531 435 207 876.9 88
2002 1076 1830 420 207 857 90
Figure 3.1.44: Cumulative distribution of serum Ferritin on rHuEpo by year
Cum
ulat
ive
dist
ribut
ion
Serum ferritin (ug/L)
1999 2000 2001 2002
0 50 100 200 400 600 800
.25
.5
.75
1

72
Table 3.1.45: Distribution of Haemoglobin concentration without rHuEpo, HD patients, Government Centres 1999 – 2002
Year No of subjects
No of observations
Median LQ UQ % Patients <10 g/dL
% Patients >10 & <12
g/dL
% Patients >12 g/dL
1999 944 2882 9.2 7.7 10.6 64 27 10
2000 939 2836 9.5 8 11 59 27 14
2001 908 2734 9.6 8.3 11.2 54 31 15
2002 783 2380 9.9 8.4 11.4 51 32 17
Figure 3.1.45: Cumulative distribution of Haemoglobin concentration without rHuEpo by year
Cum
ulat
ive
dist
ribut
ion
Hb (g/dL)
1999 2000 2001 2002
0 2 4 6 8 10 12 16 20
.25
.5
.75
1
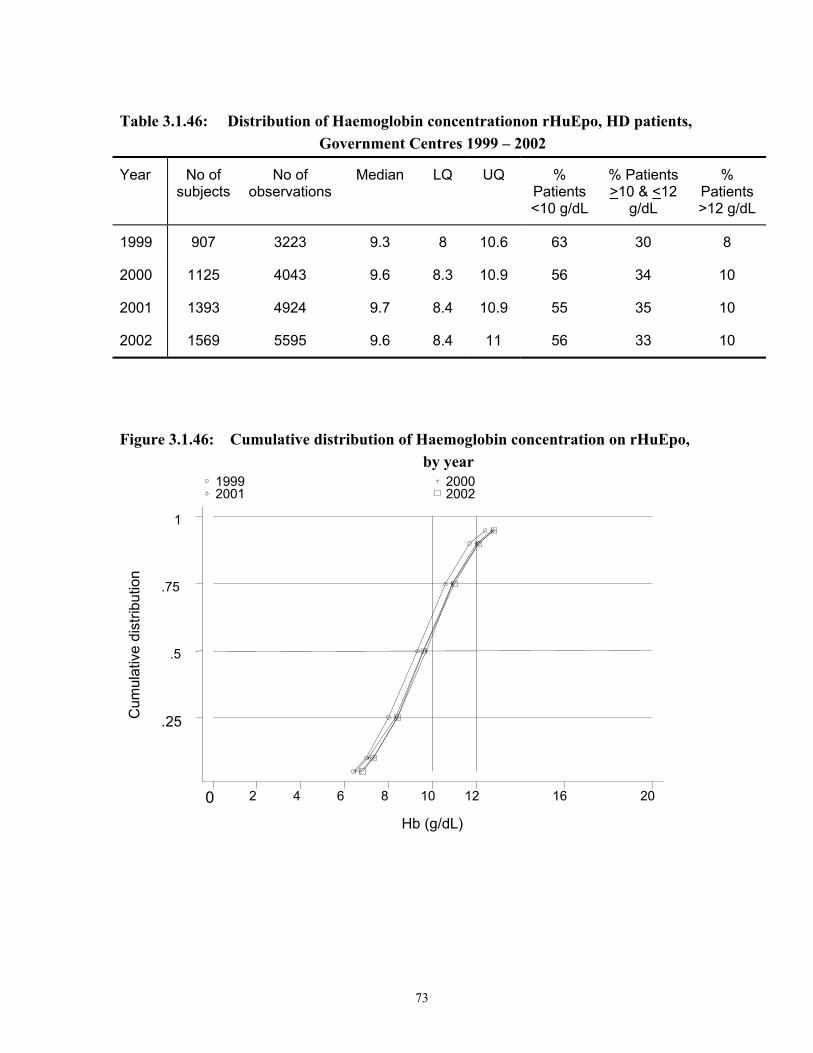
73
Table 3.1.46: Distribution of Haemoglobin concentrationon rHuEpo, HD patients, Government Centres 1999 – 2002
Year No of subjects
No of observations
Median LQ UQ % Patients <10 g/dL
% Patients >10 & <12
g/dL
% Patients >12 g/dL
1999 907 3223 9.3 8 10.6 63 30 8
2000 1125 4043 9.6 8.3 10.9 56 34 10
2001 1393 4924 9.7 8.4 10.9 55 35 10
2002 1569 5595 9.6 8.4 11 56 33 10
Figure 3.1.46: Cumulative distribution of Haemoglobin concentration on rHuEpo, by year
Cum
ulat
ive
dist
ribut
ion
Hb (g/dL)
1999 2000 2001 2002
0 2 4 6 8 10 12 16 20
.25
.5
.75
1

74
3.1.13 NUTRITIONAL STATUS OF HD PATIENTS GOVERNMENT CENTRES
Table 3.1.47: Distribution of serum Albumin (g/L), HD patients, Government Centres 1999 - 2002
Year No of subjects
No of observations
Median LQ UQ % Patients >40g/L
1999 1822 5908 41 37 44 59
2000 2013 6520 40 37 44 56
2001 2279 7503 40.5 37 44 57
2002 2343 7808 40.1 37 44 57
Figure 3.1.47: Cumulative distribution of serum Albumin by year
Cum
ulat
ive
dist
ribut
ion
Serum albumin (g/L)
1999 2000 2001 2002
20 30 35 40 50 60
.25
.5
.75
1
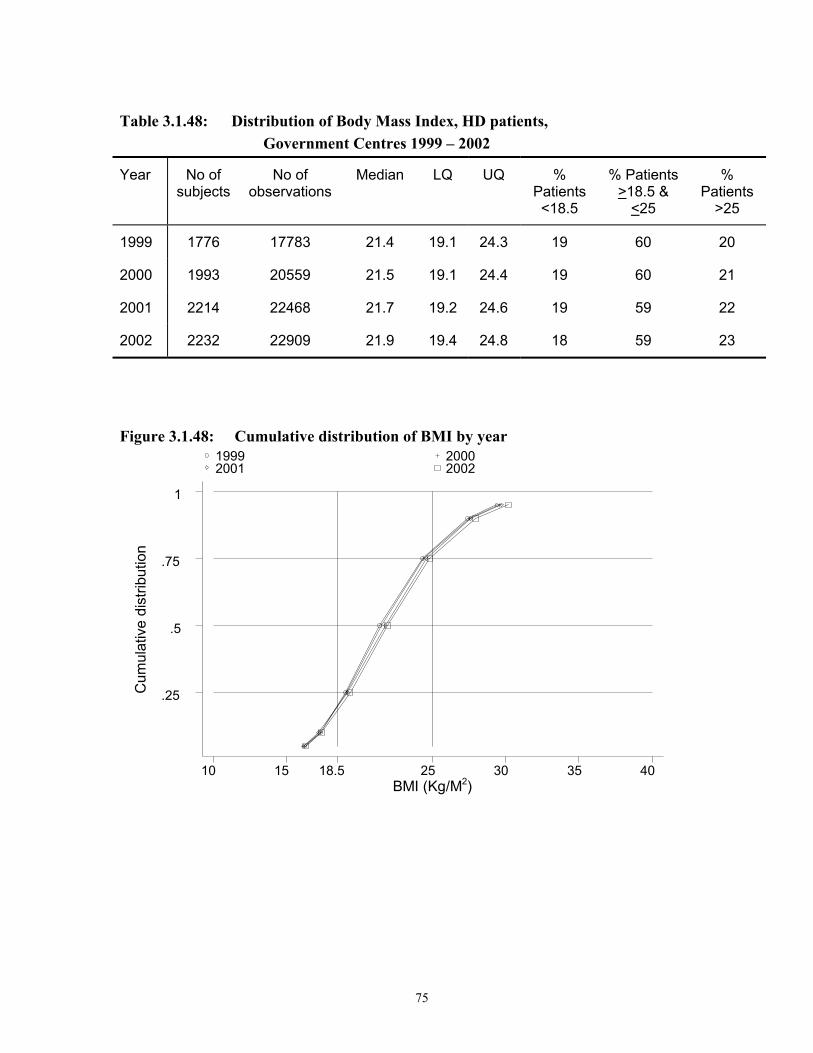
75
Table 3.1.48: Distribution of Body Mass Index, HD patients, Government Centres 1999 – 2002
Year No of subjects
No of observations
Median LQ UQ % Patients <18.5
% Patients >18.5 &
<25
% Patients
>25
1999 1776 17783 21.4 19.1 24.3 19 60 20
2000 1993 20559 21.5 19.1 24.4 19 60 21
2001 2214 22468 21.7 19.2 24.6 19 59 22
2002 2232 22909 21.9 19.4 24.8 18 59 23
Figure 3.1.48: Cumulative distribution of BMI by year
Cum
ulat
ive
dist
ribut
ion
BMI (Kg/M2)
1999 2000 2001 2002
10 15 18.5 25 30 35 40
.25
.5
.75
1

76
3.1.14 SEROLOGICAL STATUS, HD PATIENTS GOVERNMENT CENTRES
Table 3.1.49: Prevalence of positive anti-HCV and HbsAg, HD patients, Government Centres 1999– 2002
Year No % HbsAg positive % anti-HCV positive
1999 1881 6 25
2000 2114 6 29
2001 2358 6 27
2002 2436 5 23
Figure 3.1.49: Prevalence of positive anti-HCV and HbsAg, HD patients, Government Centres 1999 – 2002
Prev
alen
ce %
Year0
5
10
15
20
25
30 HBsAg anti-HCV
1999 2000 2001 2002

77
HAEMODIALYSIS
IN
NON-GOVERNMENTAL ORGANISATION (NGO)
CENTRES
Stock and Flow
Death on Haemodialysis and Transfer to PD
NGO Haemodialysis Centres
Haemodialysis Patient Characteristics
Survival Analysis
Work related rehabilitation and quality of life
Haemodialysis practices
Dyslipidaemia in HD patients
Treatment of Renal Bone Disease
Management of Blood Pressure
Management of Anaemia
Nutritional status
Prevalence of anti-HCV antibodies and HBsAg

78
3.2 HAEMODIALYSIS IN NON-GOVERNMENTAL ORGANISATION (NGO) CENTRES
3.2.1 STOCK AND FLOW
Table 3.2.01: Stock and Flow HD patients, NGO Centres 1995 – 2002
Year 1995 1996 1997 1998 1999 2000 2001 2002
New patients 188 261 347 449 540 658 695 516
Died 15 20 44 86 117 155 220 233
Transferred to PD 0 0 0 1 4 8 10 8
Transplanted 2 5 8 13 15 28 35 46
Lost to Follow up 0 1 0 1 3 2 7 15
On HD at 31st
December 448 698 1007 1368 1788 2267 2705 2932
Figure 3.2.01: Stock and Flow HD patients, NGO Centres 1995 – 2002
No.
of p
atie
nts
0
1000
2000
3000 New patients on RRT at 31st December
1995 1996 1997 1998 1999 2000 2001 2002 Year

79
3.2.3 DEATH ON HAEMODIALYSIS, NGO CENTRES
Table 3.2.04: Death Rate on HD and Transfer to PD, NGO Centres 1995 – 2002
Year 1995 1996 1997 1998 1999 2000 2001 2002
No. of patients at risk
448 573 853 1188 1578 2028 2486 2819
Deaths 15 20 44 86 117 155 220 233
Death rate % 3 3 5 7 7 8 9 8
Transfer to PD 0 0 0 1 4 8 10 8
Transfer to PD rate %
0 0 0 0 0 0 0 0
All Losses 15 20 44 87 121 163 230 241
All Losses rate % 3 3 5 7 8 8 9 9
Figure 3.2.04: Death Rate on HD, NGO Centres, 1995 – 2002
Dea
th ra
te %
0
10
20
30 Annual death rate
1995 1996 1997 1998 1999 2000 2001 2002
Year

80
Table 3.2.05: Causes of Death, NGO Centres 1999 – 2002
1999 2000 2001 2002
Causes of death No. % No. % No. % No. %
Cardiovascular 38 32 58 37 61 28 95 41
Died at home 17 15 38 25 70 32 39 17
Sepsis 12 10 16 10 35 16 33 14
GIT bleed 3 3 1 1 3 1 6 3
Cancer 2 2 1 1 6 3 6 3
Liver disease 4 3 3 2 3 1 3 1
Others 32 27 37 24 29 13 37 16
Unknown 9 8 1 1 13 6 14 6
Total 117 100 155 100 220 100 233 100

81
3.2.4 NGO HAEMODIALYSIS CENTRES
Table 3.2.07: Centre Distribution of HD patients, NGO Centres, 2002 Centre No percent
No.on RRT at 31st December 2932 100 1 AMD Rotary Dialysis Centre, Penang 9 0 2 Aixin-NKF Dialysis Centre 13 0 3 Amitabha Haemodialysis Centre 25 1 4 Bakti-NKF Dialysis Centre, Kelang 53 2 5 Batu Pahat Rotary Haemodialysis Centre 54 2 6 Berjaya NKF Dialysis Centre, Petaling Jaya 55 2 7 Buddhist Tzu Chi Dialysis Centre, Butterworth 8 0 8 Buddhist Tzu-Chi Dialysis Centre, Jitra 7 0 9 Buddhist Tzu-Chi Dialysis Centre, Penang 39 1 10 CHKMUS-MAA Medicare Charity Dialysis Centre 83 3 11 Charis-NKF Dialysis Centre, Cheras 83 3 12 Che Eng Khor Haemodialysis Centre 33 1 13 Fo Yi Haemodialysis Centre 30 1 14 Haemodialysis Association Klang 43 1 15 JB Lion MAA-Medicare Charity Dialysis 89 3 16 KAS-Rotary/NKF Dialysis Centre, Sarawak 26 1 17 KB Rotary-MAA Dialysis Centre 27 1 18 Kluang Rotary Haemodialysis Centre 33 1 19 Kuala Lumpur Lions Renal Centre 7 0 20 Lion Club of Alor Setar-NKF Dialysis Centre 32 1 21 MAA-Medicare Charity Dialysis Centre, Butterworth 52 2 22 MAA-Medicare Charity Dialysis Centre, Cheras 55 2 23 MAA-Medicare Charity Dialysis Centre, Kajang 48 2 24 MAA-Medicare Charity Dialysis Centre, Kuala Lumpur 100 3 25 MAA-Medicare Charity Dialysis Centre, Teluk Intan 50 2 26 MAA-Medicare Kidney Charity Fund, Kota Kinabalu 19 1 28 Mersing Rotary Haemodialysis Centre 5 0 28 Moral Uplifting-NKF Dialysis Centre, Ipoh 57 2 29 Muar Lions Renal Centre 97 3 30 NKF Dialysis Centre, Kuala Lumpur 54 2 31 Pahang Buddhist Association Haemodialysis Centre 25 1

82
32 Penang Caring Dialysis Centre 8 0 33 Persatuan Buah Pinggang Sabah 28 1 34 Persatuan Bulan Sabit Merah Cawangan Miri 58 2 35 Persatuan Dialisis Kurnia PJ 17 1 36 Persatuan Membaiki Akhlak Che Luan Khor 42 1 37 Pertubohan Hemodialisis Pasar Meru 4 0 38 Pertubuhan Bakti Fo En Bandar Kulim 25 1 39 Pertubuhan Hemodialisis Seberang Perai Selatan 31 1 40 Pontian Rotary Haemodialysis Centre 55 2 41 Province Wellesley Renal Medifund Dialysis Centre 15 1 42 Pusat Dialisis Klinik Waqaf An-nur 40 1 43 Pusat Dialisis Terengganu/NKF 32 1 44 Pusat Hemodialisis Darul Iltizam 45 2 45 Pusat Hemodialisis Manjung-NKF 48 2 46 Pusat Hemodialisis Mawar N. Sembilan, Bahau 25 1 47 Pusat Hemodialisis Mawar N. Sembilan, Lukut 26 1 48 Pusat Hemodialisis Mawar N. Sembilan, Seremban 126 4 49 Pusat Hemodialisis Rotary Kota Tinggi 22 1 50 Pusat Hemodialisis Rotary Kulai 76 3 51 Pusat Hemodialisis SJAM Bacang Melaka 116 4 52 Pusat Hemodialisis Yayasan Felda 60 2 53 Pusat Hemodialisis Zakat 15 1 54 Pusat Muhibah Hemodialisis Pesatuan Tionghua
Segamat 77 3
55 Pusat Rawatan Dialisis Yayasan Pembangunan Keluarga Johor-NKF
23 1
56 Pusat Rawatan Islam, Kuala Lumpur 49 2 57 Pusat Rawatan Islam, Petaling Jaya 12 0 58 Rotary Club Damansara-NKF Dialysis Centre, Kepong 53 2 59 Rotary Club Tawau Tanjung Haemodialysis Centre 7 0 60 Rotary Haemodialysis Centre, Johor Bahru 35 1 61 SJAM-KPS Haemodialysis, Kelang 57 2 62 Sibu Kidney Foundation Haemodialysis Centre 43 1 63 Superkids Trinity-NKF Dialysis Centre, Alor Setar 22 1 64 The Nayang-NKF Dialysis Centre, Setapak 50 2 65 The Penang Community Haemodialysis Society 34 1 66 Woh Peng Cheang Seah Dialysis Centre 41 1
83
67 Yayasan Dialisis Pertubohan Pendidikan Akhlak-NKF, Taiping
29 1
68 Yayasan Hemodialisis Kebajikan Southern Melaka 59 2 69 Yayasan Kebajikan SSL Heamodialisis 116 4

84
3.2.5 HAEMODIALYSIS PATIENTS’ CHARACTERISTICS, NGO CENTRES Table 3.2.08: Age Distribution of Dialysis Patients, NGO Centres 1999 – 2002 Year 1999 2000 2001 2002 New Dialysis patients 540 658 695 516 1-14 years 0 0 0 0 15-24 years 1 2 3 2 25-34 years 12 9 8 6 35-44 years 17 16 16 13 45-54 years 29 31 27 25 55-64 years 27 26 28 32 >65 years 13 16 19 21 Dialysing at 31st December 1788 2267 2705 2932 1-14 years 0 0 0 0 15-24 years 4 3 3 3 25-34 years 14 13 12 11 35-44 years 22 21 21 20 45-54 years 28 29 29 28 55-64 years 23 23 23 24 >65 years 10 11 12 13 Table 3.2.09: Patients’ Characteristics, NGO Centres 1999 – 2002 Year 1999 2000 2001 2002
New Dialysis patients 540 658 695 516
Mean age + sd 50 + 13 52 + 13 53 + 14 54 + 13
% Male 58 59 51 51
% Diabetic 41 47 47 54
% HbsAg+ 4 5 4 3
% Anti-HCV+ 6 3 4 2
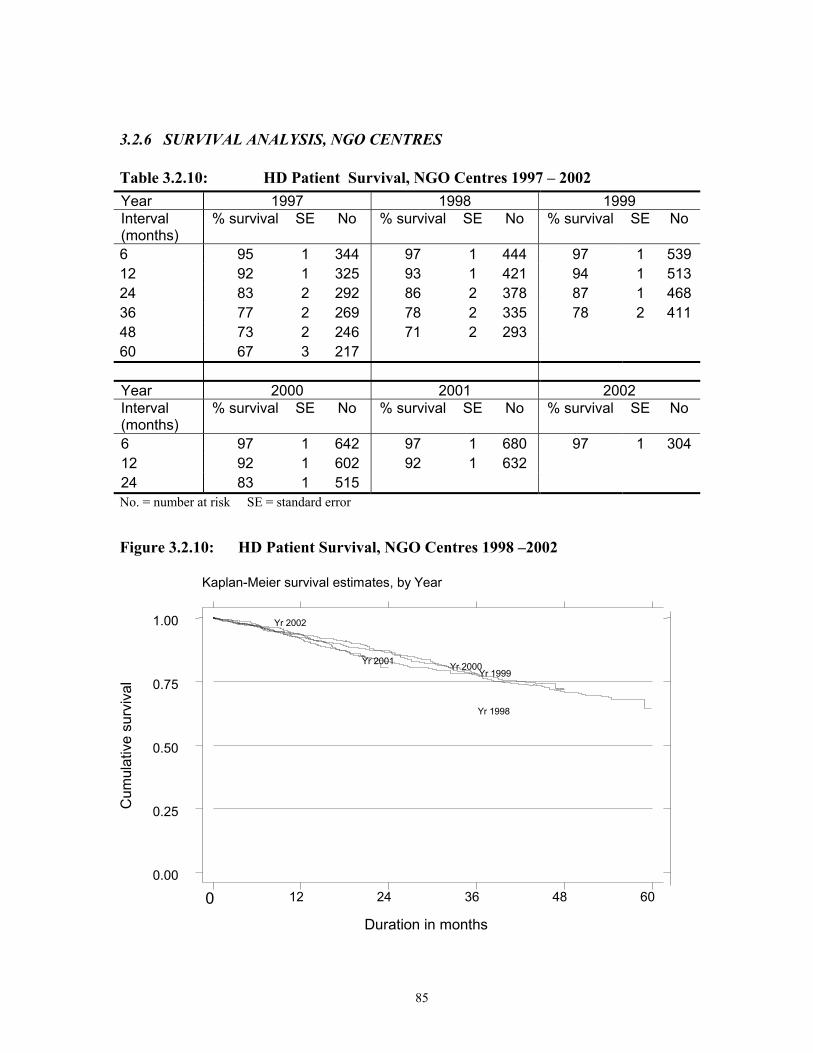
85
3.2.6 SURVIVAL ANALYSIS, NGO CENTRES
Table 3.2.10: HD Patient Survival, NGO Centres 1997 – 2002 Year 1997 1998 1999 Interval (months)
% survival SE No % survival SE No % survival SE No
6 95 1 344 97 1 444 97 1 539 12 92 1 325 93 1 421 94 1 513 24 83 2 292 86 2 378 87 1 468 36 77 2 269 78 2 335 78 2 411 48 73 2 246 71 2 293 60 67 3 217 Year 2000 2001 2002 Interval (months)
% survival SE No % survival SE No % survival SE No
6 97 1 642 97 1 680 97 1 304 12 92 1 602 92 1 632 24 83 1 515 No. = number at risk SE = standard error
Figure 3.2.10: HD Patient Survival, NGO Centres 1998 –2002 Kaplan-Meier survival estimates, by Year
Cum
ulat
ive
surv
ival
Duration in months
0 12 24 36 48 60 0.00
0.25
0.50
0.75
1.00
Yr 1998
Yr 1999Yr 2000Yr 2001
Yr 2002

86
Table 3.2.11: HD Technique Survival, NGO Centres 1997-2002 Year 1997 1998 1999 Interval (months)
% survival SE No % survival SE No % survival SE No
6 95 1 344 97 1 444 97 1 539 12 92 1 325 93 1 421 93 1 513 24 83 2 292 86 2 378 87 1 468 36 77 2 269 77 2 335 77 2 411 48 73 2 246 70 2 293 60 67 3 217 Year 2000 2001 2002 Interval (months)
% survival SE No % survival SE No % survival SE No
6 96 1 642 97 1 680 97 1 304 12 91 1 602 92 1 632 24 82 2 515 No. = number at risk SE = standard error
Figure 3.2.11 HD Technique Survival by year of entry, NGO centres 1998 –2002 Kaplan-Meier survival estimates, by Year
Cum
ulat
ive
surv
ival
Duration in months0 12 24 36 48 60
0.00
0.25
0.50
0.75
1.00
Yr 1998
Yr 1999Yr 2000
Yr 2001
Yr 2002

87
3.2.7 WORK RELATED REHABILITATION AND QUALITY OF LIFE ON HAEMODIALYSIS, NGO CENTRES
Table 3.2.12: Work Related Rehabilitation on HD, NGO centres 1999-2002
1999 2000 2001 2002 REHABILITATION
STATUS No. % No. % No. % No. %
Full time work for pay
128 19 211 18 199 12 229 12
Part time work for pay
106 16 179 15 261 16 314 16
Able to work but unable to get a job
28 4 64 5 88 5 79 4
Able to work but not yet due to dialysis schedule
35 5 28 2 58 4 83 4
Able but disinclined to work
22 3 34 3 27 2 28 1
Home maker 190 29 315 26 397 24 526 27
Full time student 1 0 1 0 2 0 4 0
Age<15 years 0 0 0 0 0 0 0 0
Retired 42 6 112 9 125 8 160 8
Age>65 years 33 5 124 10 218 13 252 13
Unable to work due to poor health
76 11 129 11 255 16 303 15
Total 661 100 1197 100 1630 100 1978 100

88
Table 3.2.13: Quality of Life on Haemodialysis, NGO Centres 1999 – 2002
1999 2000 2001 2002 QOL Index Summated Score
No. % No. % No. % No. %
0 (Worst QOL) 0 0 0 0 3 0 4 0
1 0 0 2 0 3 0 5 0
2 2 0 4 0 4 0 9 0
3 4 1 20 2 27 2 24 1
4 15 2 27 2 54 3 43 2
5 25 4 39 3 91 6 91 5
6 30 5 75 6 117 7 122 6
7 56 9 87 7 144 9 156 8
8 75 11 101 8 151 9 199 10
9 70 11 138 11 232 14 214 11
10 (Best QOL) 380 58 722 59 801 49 1062 55
Total 657 100 1215 100 1627 100 1929 100

89
3.2.8 HAEMODIALYSIS PRACTICES IN NGO CENTRES
Table 3.2.14: Vascular Access on Haemodialysis, NGO Centres 1999 – 2002
Access types 1999 2000 2001 2002
No % No % No % No %
Wrist AVF 610 84 1299 86 1569 83 1830 83
BCF* 92 13 176 12 275 15 309 14
Venous graft 2 0 3 0 8 0 7 0
Artificial graft 5 1 11 1 17 1 23 1
PERMCATH 3 0 2 0 4 0 8 0
Temporary CVC*
11 2 19 1 14 1 22 1
Total 723 100 1510 100 1887 100 2199 100 * BCF = Brachiocephalic fistula * CVC = Central venous catheter
Table 3.2.15: Difficulties reported with Vascular Access , NGO Centres 1999 – 2002
Access 1999 2000 2001 2002
difficulty No % No % No % No %
Difficulty with needle placement
23 3 42 3 71 4 56 3
Difficulty in obtaining desired blood flow rate
20 3 37 2 72 4 71 3
Other difficulty 12 2 8 1 14 1 17 1
No difficulty 672 92 1430 94 1734 92 2062 93
Total 727 100 1517 100 1891 100 2206 100

90
Table 3.2.16: Complications reported with Vascular Access, NGO Centres 1999 – 2002
Complication 1999 2000 2001 2002
No. % No. % No. % No. %
Thrombosis 27 4 46 3 75 4 47 2
Bleed 3 0 5 0 19 1 26 1
Aneurysmal dilatation
18 2 41 3 34 2 40 2
Swollen limb 8 1 15 1 15 1 10 0
Access related infection, local/Systemic
3 0 9 1 5 0 5 0
Distal Limb ischaemia
0 0 14 1 13 1 4 0
Venous outflow obstruction
17 2 16 1 22 1 31 1
Carpal tunnel 1 0 5 0 11 1 5 0
Other 14 2 9 1 31 2 52 2
No complication 636 87 1361 89 1667 88 1986 90
Total 727 100 1521 100 1892 100 2206 100
Table 3.2.17: Blood Flow Rates in NGO HD Units 1999 – 2002 Blood flow rates 1999 2000 2001 2002
No. % No. % No. % No. %
<150 ml/min 1 0 3 0 0 0 1 0
150-199 ml/min 13 2 33 2 27 1 23 1
200-249 ml/min 333 47 516 35 581 32 408 19
250-299 ml/min 293 42 762 52 951 52 1252 58
300-349 ml/min 59 8 141 10 239 13 347 16
> 350 ml/min 3 0 11 1 23 1 117 5
Total 702 100 1466 100 1821 100 2148 100

91
Table 3.2.18: Number of HD Sessions per week, NGO HD Units 1999 – 2002 HD sessions 1999 2000 2001 2002
Per week No. % No. % No. % No. %
1 1 0 4 0 1 0 3 0
2 22 3 104 7 86 5 55 3
3 699 97 1391 92 1801 95 2134 97
4 1 0 5 0 3 0 5 0
Total 723 100 1512 100 1891 100 2198 100
Table 3.2.19: Duration of HD in NGO HD Units 1999 – 2002 Duration of HD 1999 2000 2001 2002
per session No. % No. % No. % No. %
<3 hours 1 0 2 0 2 0 4 0
3.5 hours 1 0 2 0 2 0 15 1
4 hours 715 99 1472 97 1876 99 2163 99
4.5 hours 2 0 23 2 7 0 8 0
5 hours 3 0 12 1 4 0 2 0
>5 hours 0 0 2 0 0 0 0 0
Total 722 100 1513 100 1891 100 2192 100
Table 3.2.20: Dialyser membrane types in NGO HD Units 1999 – 2002 Dialyser 1999 2000 2001 2002
membrane No. % No. % No. % No. %
Cellulosic 328 55 449 39 406 30 343 19
Cellulose acetate 161 27 193 17 269 20 513 29
Synthetic 108 18 514 44 670 50 936 52
Total 597 100 1156 100 1345 100 1792 100

92
Table 3.2.21: Dialyser Reuse Frequency in NGO HD Units 1999 – 2002
Dialyser reuse 1999 2000 2001 2002
frequency No. % No. % No. % No. %
1* 7 1 43 3 76 4 102 5
2 2 0 4 0 7 0 9 0
3 47 7 74 5 61 3 98 5
4 30 4 66 5 95 5 104 5
5 101 15 162 12 158 9 168 8
6 394 59 576 41 462 26 467 22
7 3 0 3 0 15 1 34 2
8 40 6 196 14 470 26 515 25
9 6 1 37 3 48 3 38 2
10 30 4 144 10 141 8 259 12
11 0 0 0 0 2 0 4 0
12 11 2 50 4 72 4 70 3
>13 0 0 47 3 172 10 216 10
Total 671 100 1402 100 1779 100 2084 100
1* is single use i.e. no reuse
Table 3.2.22: Dialysate Buffer used in NGO HD Units 1999 – 2002
Dialysate buffer 1999 2000 2001 2002
No. % No. % No. % No. %
Acetate 58 8 33 2 16 1 7 0
Bicarbonate 654 92 1471 98 1858 99 2174 100
Total 712 100 1504 100 1874 100 2181 100

93
Table 3.2.23: Distribution of Prescribed KT/V, NGO Centres 1999 – 2002
Year No of subjects
No of observations
Median LQ UQ % > 1.3
1999 668 6656 1.5 1.3 1.7 72
2000 1301 13078 1.5 1.3 1.7 71
2001 1710 17323 1.5 1.3 1.7 74
2002 2049 21264 1.5 1.3 1.7 79
Figure 3.2.23: Cumulative distribution of Prescribed KT/V by year
Cum
ulat
ive
dist
ribut
ion
Kt/v
1999 2000 2001 2002
.6 .8 1 1.2 1.4 1.6 1.8 2
.25
.5
.75
1
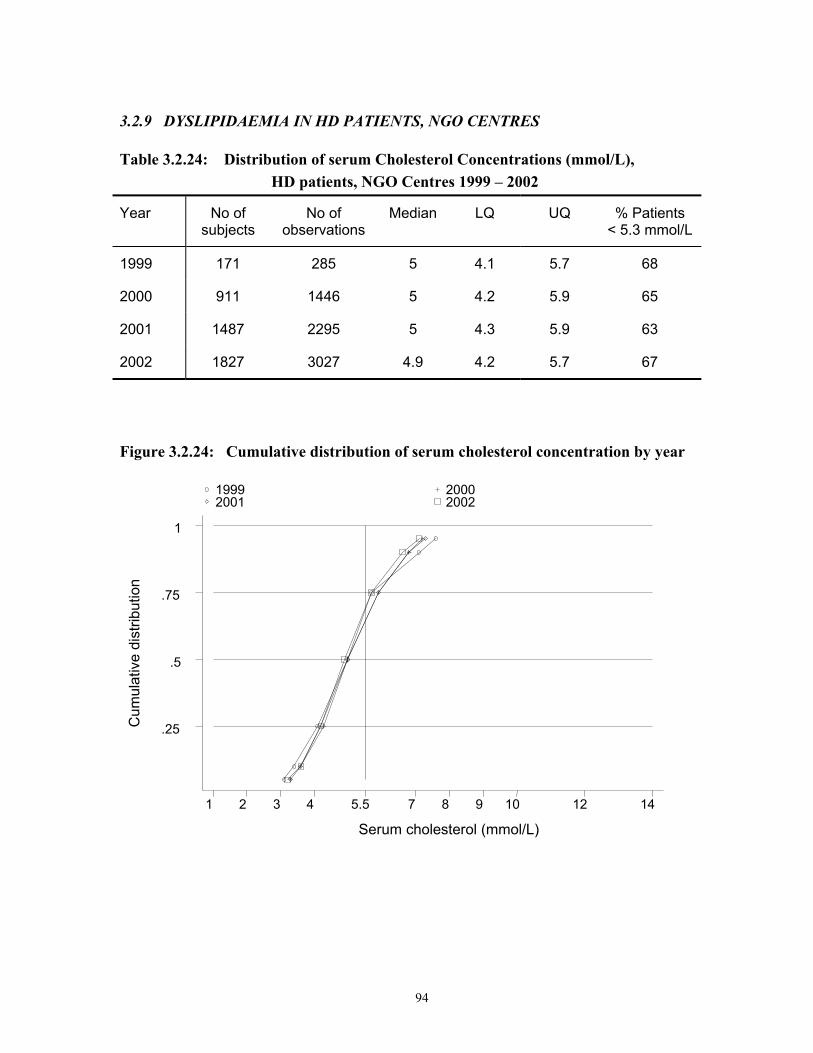
94
3.2.9 DYSLIPIDAEMIA IN HD PATIENTS, NGO CENTRES
Table 3.2.24: Distribution of serum Cholesterol Concentrations (mmol/L), HD patients, NGO Centres 1999 – 2002
Year No of subjects
No of observations
Median LQ UQ % Patients < 5.3 mmol/L
1999 171 285 5 4.1 5.7 68
2000 911 1446 5 4.2 5.9 65
2001 1487 2295 5 4.3 5.9 63
2002 1827 3027 4.9 4.2 5.7 67
Figure 3.2.24: Cumulative distribution of serum cholesterol concentration by year
Cum
ulat
ive
dist
ribut
ion
Serum cholesterol (mmol/L)
1999 2000 2001 2002
1 2 3 4 5.5 7 8 9 10 12 14
.25
.5
.75
1

95
Table 3.2.25: Distribution of serum Triglyceride (mmol/L), HD patients, NGO Centres 1999 – 2002
Year No of subjects
No of observations
Median LQ UQ % Patients < 3.5 mmol/L
1999 148 243 1.8 1.3 2.6 86
2000 584 904 1.8 1.3 2.7 87
2001 987 1349 1.7 1.1 2.6 86
2002 1279 1948 1.7 1.2 2.6 85
Figure 3.2.25: Cumulative distribution of serum triglyceride concentration by year
Cum
ulat
ive
dist
ribut
ion
Serum triglyceride (mmol/L)
1999 2000 2001 2002
1 2 3.5 5 6
.25
.5
.75
1

96
Table 3.2.26: Distribution of serum LDL (mmol/L), HD patients, NGO Centres 1999 – 2002
Year No of subjects
No of observations
Median LQ UQ % Patients <5 mmol/L
1999 39 50 3 2.5 3.7 92
2000 441 631 2.9 2.2 3.6 96
2001 793 1064 2.9 2.3 3.7 96
2002 1001 1468 2.9 2.3 3.6 96
Figure 3.2.26 : Cumulative distribution of serum LDL by year
Cum
ulat
ive
dist
ribut
ion
Serum LDL (mmol/L)
1999 2000 2001 2002
1 2 3 4 5 6 7 8 9 10
.25
.5
.75
1

97
Table 3.2.27: Distribution of serum HDL (mmol/L), HD patients, NGO Centres 1999 – 2002
Year No of subjects
No of observations
Median LQ UQ % Patients < 2mmol/L
1999 41 52 1.1 0.8 1.4 94
2000 466 680 1.2 1 1.5 93
2001 819 1102 1.1 0.9 1.4 96
2002 1036 1544 1.1 0.9 1.4 96
Figure 3.2.27: Cumulative distribution of serum HDL by year
Cum
ulat
ive
dist
ribut
ion
Serum HDL (mmol/L)
1999 2000 2001 2002
1 2 3 4
.25
.5
.75
1
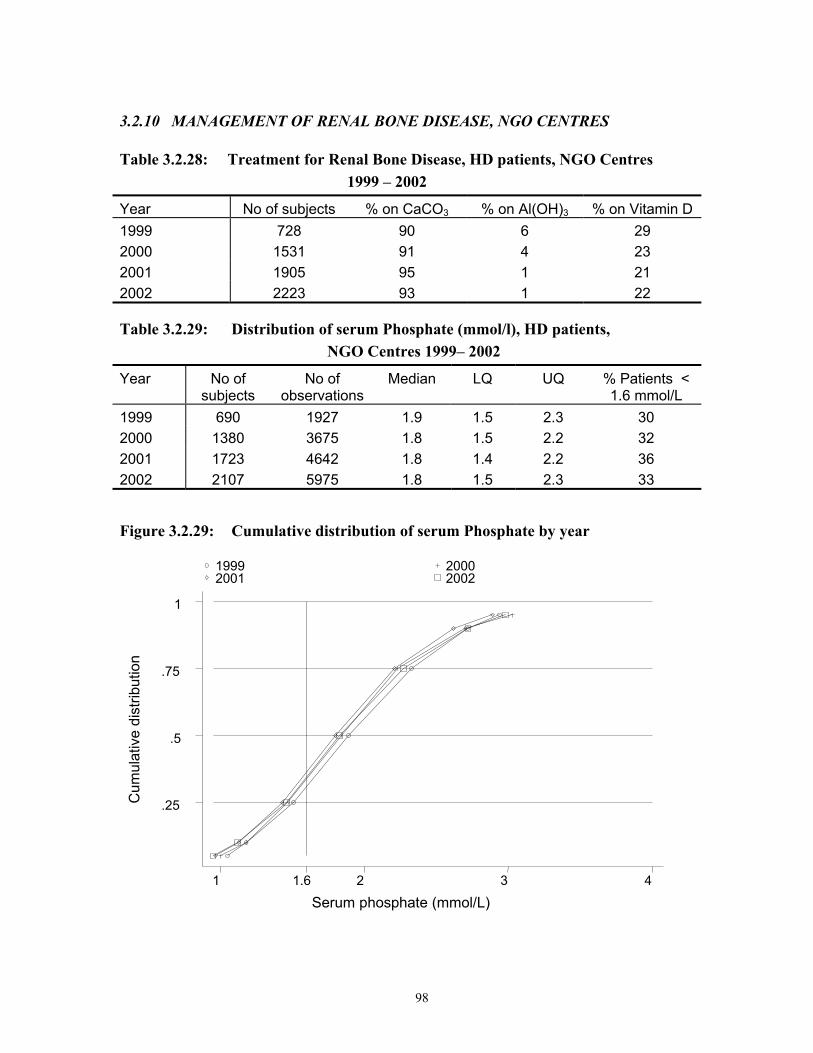
98
3.2.10 MANAGEMENT OF RENAL BONE DISEASE, NGO CENTRES
Table 3.2.28: Treatment for Renal Bone Disease, HD patients, NGO Centres 1999 – 2002
Year No of subjects % on CaCO3 % on Al(OH)3 % on Vitamin D 1999 728 90 6 29 2000 1531 91 4 23 2001 1905 95 1 21 2002 2223 93 1 22
Table 3.2.29: Distribution of serum Phosphate (mmol/l), HD patients, NGO Centres 1999– 2002
Year No of subjects
No of observations
Median LQ UQ % Patients < 1.6 mmol/L
1999 690 1927 1.9 1.5 2.3 30 2000 1380 3675 1.8 1.5 2.2 32 2001 1723 4642 1.8 1.4 2.2 36 2002 2107 5975 1.8 1.5 2.3 33
Figure 3.2.29: Cumulative distribution of serum Phosphate by year
Cum
ulat
ive
dist
ribut
ion
Serum phosphate (mmol/L)
1999 2000 2001 2002
1 1.6 2 3 4
.25
.5
.75
1

99
Table 3.2.30: Distribution of serum Calcium (mmol/l), HD patients, NGO Centres 1999 – 2002
Year No of subjects
No of observations
Median LQ UQ % Patients > 2.2 & <2.6
mmol/L
1999 699 1948 2.3 2.2 2.5 56
2000 1377 3705 2.3 2.2 2.5 61
2001 1733 4709 2.3 2.2 2.5 61
2002 2114 6001 2.3 2.2 2.5 58
Figure 3.2.30: Cumulative distribution of serum Calcium by year
Cum
ulat
ive
dist
ribut
ion
Serum calcium (mmol/L)
1999 2000 2001 2002
1 2 2.2 2.6 3 4
.25
.5
.75
1

100
Table 3.2.31: Distribution of serum iPTH (ng/L), HD patients, NGO Centres 1999 – 2002
Year No of subjects
No of observations
Median LQ UQ % Patients > 100 & < 250
ng/L
1999 279 331 62.2 15.1 206 18
2000 627 846 27 8.3 68 11
2001 950 1269 29.8 9 76.9 13
2002 1275 1752 28.6 8.7 75.3 13
Figure 3.2.31: Cumulative distribution of serum iPTH by year
Cum
ulat
ive
dist
ribut
ion
Serum Intact PTH (ng/L)
1999 2000 2001 2002
0 50 100 250 500 750 1000
.25
.5
.75
1
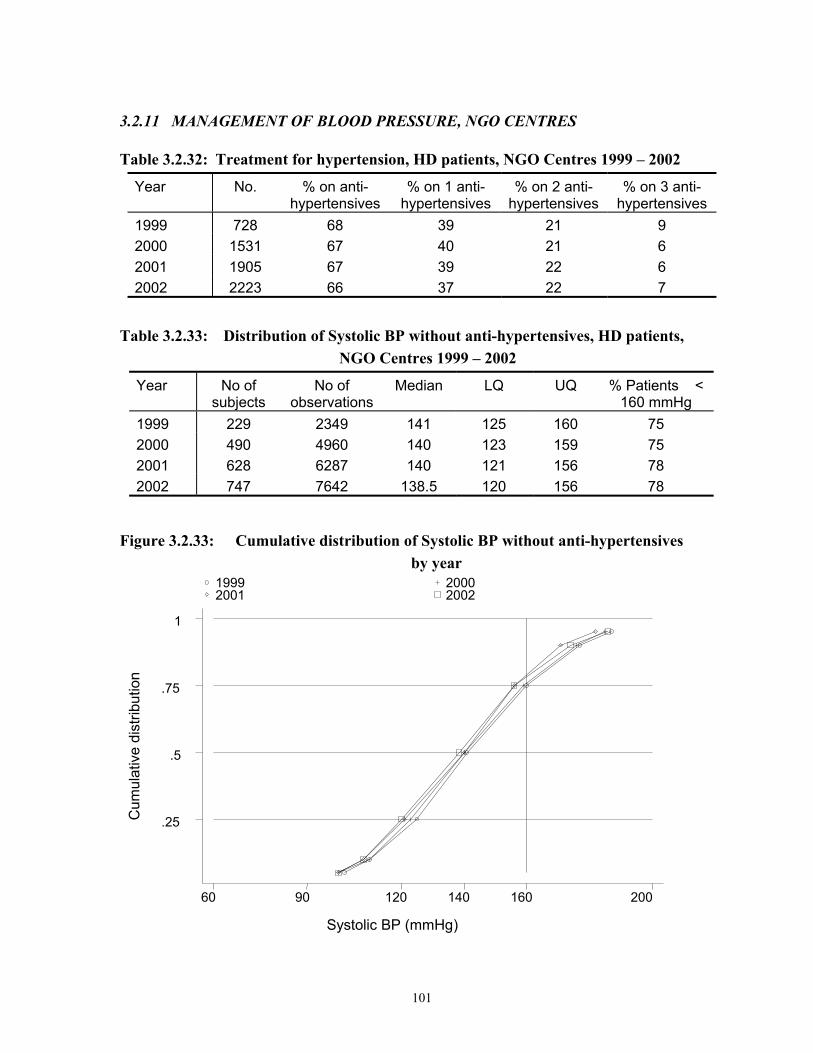
101
3.2.11 MANAGEMENT OF BLOOD PRESSURE, NGO CENTRES
Table 3.2.32: Treatment for hypertension, HD patients, NGO Centres 1999 – 2002
Year No. % on anti-hypertensives
% on 1 anti-hypertensives
% on 2 anti-hypertensives
% on 3 anti- hypertensives
1999 728 68 39 21 9 2000 1531 67 40 21 6 2001 1905 67 39 22 6 2002 2223 66 37 22 7
Table 3.2.33: Distribution of Systolic BP without anti-hypertensives, HD patients, NGO Centres 1999 – 2002
Year No of subjects
No of observations
Median LQ UQ % Patients < 160 mmHg
1999 229 2349 141 125 160 75 2000 490 4960 140 123 159 75 2001 628 6287 140 121 156 78 2002 747 7642 138.5 120 156 78
Figure 3.2.33: Cumulative distribution of Systolic BP without anti-hypertensives by year
Cum
ulat
ive
dist
ribut
ion
Systolic BP (mmHg)
1999 2000 2001 2002
60 90 120 140 160 200
.25
.5
.75
1
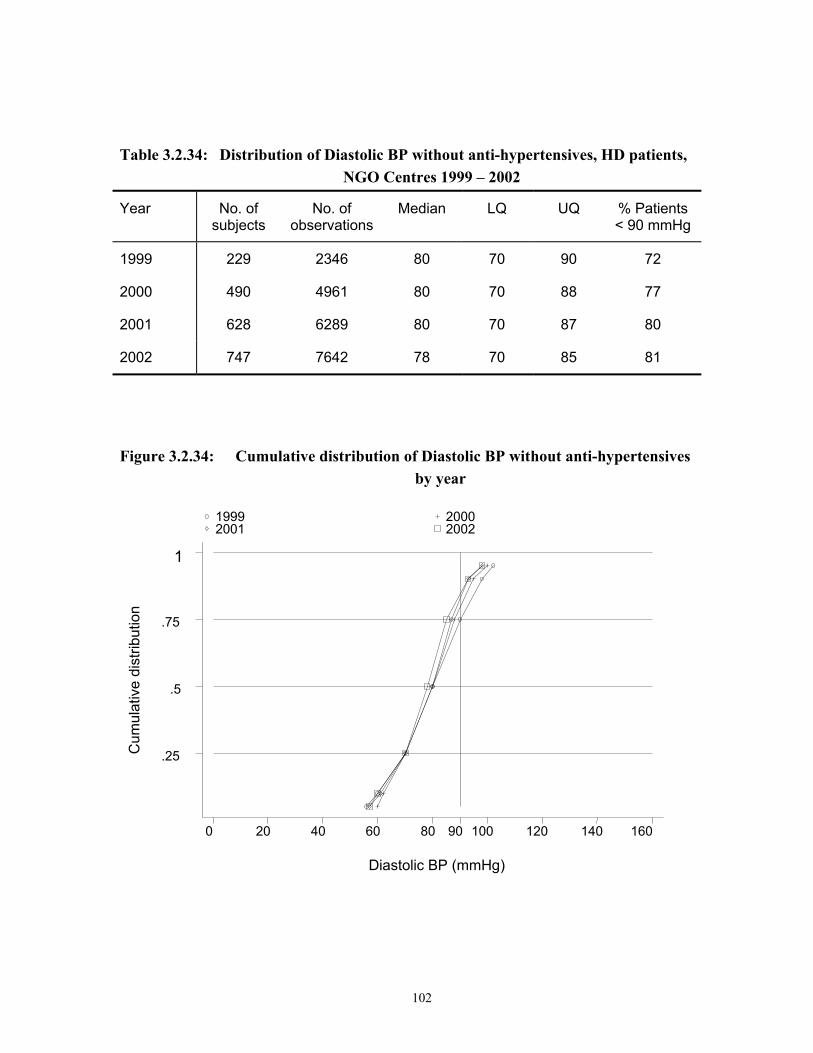
102
Table 3.2.34: Distribution of Diastolic BP without anti-hypertensives, HD patients, NGO Centres 1999 – 2002
Year No. of subjects
No. of observations
Median LQ UQ % Patients < 90 mmHg
1999 229 2346 80 70 90 72
2000 490 4961 80 70 88 77
2001 628 6289 80 70 87 80
2002 747 7642 78 70 85 81
Figure 3.2.34: Cumulative distribution of Diastolic BP without anti-hypertensives by year
Cum
ulat
ive
dist
ribut
ion
Diastolic BP (mmHg)
1999 2000 2001 2002
0 20 40 60 80 90 100 120 140 160
.25
.5
.75
1
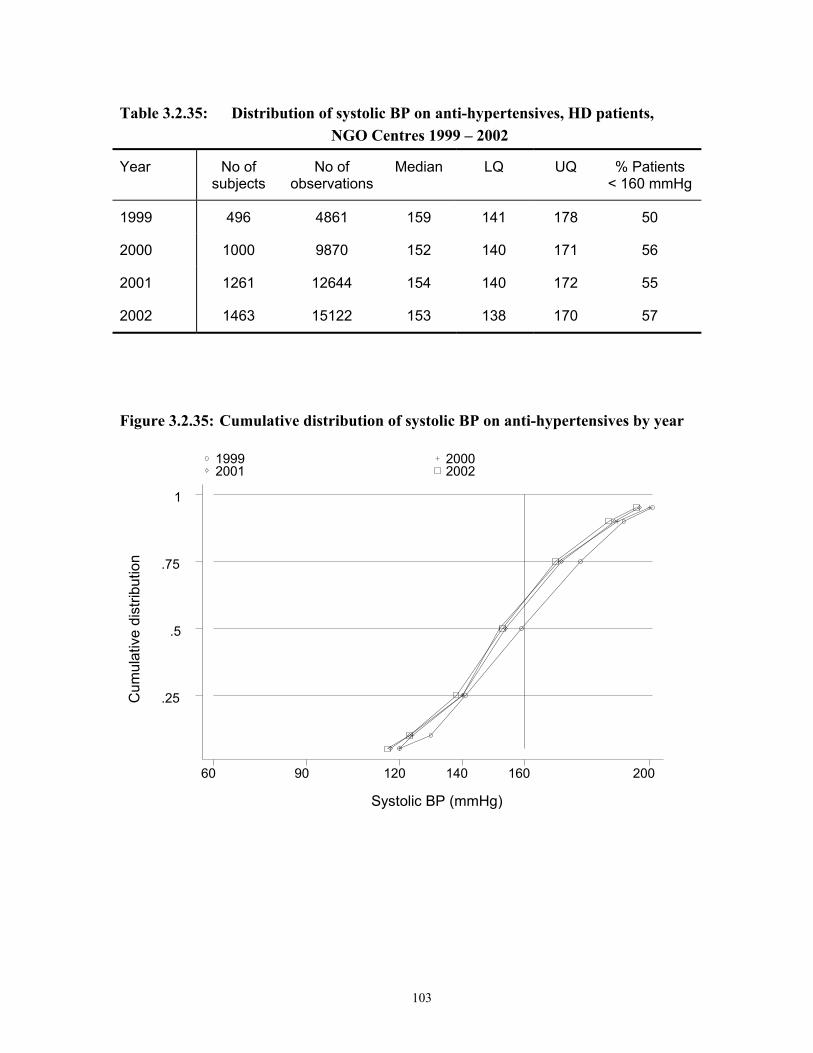
103
Table 3.2.35: Distribution of systolic BP on anti-hypertensives, HD patients, NGO Centres 1999 – 2002
Year No of subjects
No of observations
Median LQ UQ % Patients < 160 mmHg
1999 496 4861 159 141 178 50
2000 1000 9870 152 140 171 56
2001 1261 12644 154 140 172 55
2002 1463 15122 153 138 170 57
Figure 3.2.35: Cumulative distribution of systolic BP on anti-hypertensives by year
Cum
ulat
ive
dist
ribut
ion
Systolic BP (mmHg)
1999 2000 2001 2002
60 90 120 140 160 200
.25
.5
.75
1

104
Table 3.2.36: Distribution of diastolic BP on anti-hypertensives, HD patients, NGO Centres 1999 – 2002
Year No of subjects
No of observations
Median LQ UQ % Patients < 90 mmHg
1999 496 4866 87 78 95 56
2000 999 9855 84 77 92 59
2001 1261 12639 83 75 90 63
2002 1461 15113 81 73 90 68
Figure 3.2.36: Cumulative distribution of diastolic BP on anti-hypertensives by year
Cum
ulat
ive
dist
ribut
ion
Diastolic BP (mmHg)
1999 2000 2001 2002
0 20 40 60 80 90 100 120 140 160
.25
.5
.75
1

105
3.2.12 TREATMENT OF ANAEMIA, NGO HD CENTRES
Table 3.2.37: Treatment for Anaemia, HD patients, NGO Centres 1999 – 2002
Year No % on rHuEpo
% received blood
transfusion
% received oral iron
% received parenteral
iron
1999 728 54 9 87 1
2000 1531 56 12 88 3
2001 1905 62 11 88 3
2002 2223 68 7 88 5
Table 3.2.38: Distribution of rHuEpo dose per week, HD patients, NGO Centres 1999 – 2002
Year 1999 2000 2001 2002
No. of patients 377 816 1153 1466
% on 2000 u/week 66 56 55 48
% on 2-4000 u/week 28 38 39 44
% on 4-6000 u/week 5 4 5 7
% on 6-8000 u/week 1 1 1 1
% on 8-12000 u/week 1 0 0 0
% on >12000 u/week 0 0 0 0

106
Table 3.2.39: Distribution of serum Iron without rHuEpo, HD patients, NGO Centres 1999 – 2002
Year No of subjects
No of observations
Median LQ UQ % Patients > 10
umol/L
1999 41 105 14 10.5 17.6 79
2000 194 338 15.5 10.7 25 78
2001 280 451 14.9 10.5 22.5 77
2002 271 594 13 9 18.4 69
Figure 3.2.39: Cumulative distribution of serum Iron without rHuEpo by year
Cum
ulat
ive
dist
ribut
ion
Serum iron (umol/L)
1999 2000 2001 2002
0 5 10 15 20 25 30 40 50
.25
.5
.75
1

107
Table 3.2.40: Distribution of serum Iron on rHuEpo,HD patients, NGO Centres 1999 – 2002
Year No of subjects
No of observations
Median LQ UQ % Patients > 10 umol/L
1999 48 128 15.1 11 23 79
2000 377 746 14.7 10.6 21 77
2001 572 1027 13.3 9.7 19.3 71
2002 679 1505 11.2 8 16.6 58
Figure 3.2.40: Cumulative distribution of serum Iron on rHuEpo by year
Cum
ulat
ive
dist
ribut
ion
Serum iron (umol/L)
1999 2000 2001 2002
0 5 10 15 20 25 30 40 50
.25
.5
.75
1

108
Table 3.2.41: Distribution of serum Transferrin Saturation without rHuEpo, HD patients, NGO Centres 1999 – 2002
Year No of subjects
No of observations
Median LQ UQ % Patients > 20%
1999 29 116 26.9 21.7 37.7 83
2000 143 572 28.3 19.2 45.1 72
2001 196 784 31.1 21.5 46.7 78
2002 181 724 26.4 16.9 41.9 65
Figure 3.2.41: Cumulative distribution of serum Transferrin Saturation without rHuEpo by year
Cum
ulat
ive
dist
ribut
ion
Transferrin saturation (%)
1999 2000 2001 2002
0 10 20 30 40 50 60 70 80
.25
.5
.75
1

109
Table 3.2.42: Distribution of serum Transferrin Saturation on rHuEpo, HD patients, NGO Centres 1999 – 2002
Year No of subjects
No of observations
Median LQ UQ % Patients > 20%
1999 35 140 29.8 20 43.2 74
2000 289 1156 31.3 21.2 45.3 78
2001 429 1716 29.5 21.5 41.4 78
2002 552 2208 25.3 16.6 39.2 66
Figure 3.2.42: Cumulative distribution of serum Transferrin Saturation on rHuEpo by year
Cum
ulat
ive
dist
ribut
ion
Transferrin saturation (%)
1999 2000 2001 2002
0 10 20 30 40 50 60 70 80
.25
.5
.75
1

110
Table 3.2.43: Distribution of serum Ferritin without rHuEpo, HD patients, NGO Centres 1999 – 2002
Year No of subjects
No of observations
Median LQ UQ % Patients > 100 ug/L
1999 28 46 462.5 222.6 745 89
2000 161 212 432.5 182.5 860 87
2001 271 358 423 177 845 86
2002 305 429 365 173 785 86
Figure 3.2.43: Cumulative distribution of serum Ferritin without rHuEpo by year
Cum
ulat
ive
dist
ribut
ion
Serum ferritin (ug/L)
1999 2000 2001 2002
0 50 100 200 400 600 800
.25
.5
.75
1

111
Table 3.2.44: Distribution of serum Ferritin on rHuEpo, HD patients, NGO Centres 1999 – 2002
Year No of subjects
No of observations
Median LQ UQ % Patients > 100 ug/L
1999 39 63 392 176 1000 94
2000 361 514 509.5 240 971 90
2001 589 870 489.5 227 903 91
2002 823 1263 482 236 895 90
Figure 3.2.44: Cumulative distribution of serum Ferritin on rHuEpo by year
Cum
ulat
ive
dist
ribut
ion
Serum ferritin (ug/L)
1999 2000 2001 2002
0 50 100 200 400 600 800
.25
.5
.75
1

112
Table 3.2.45: Distribution of Haemoglobin without rHuEpo, HD patients, NGO Centres 1999 – 2002
Year No of subjects
No of observations
Median LQ UQ % Patients <10 g/dL
% Patients >10 & <12
g/dL
% Patients >12 g/dL
1999 318 856 9.1 7.9 10.4 65 26 9
2000 574 1472 9.1 7.9 10.9 63 24 13
2001 644 1688 9.3 8 10.6 63 25 11
2002 661 1858 9.5 8.1 11 59 27 14
Figure 3.2.45: Cumulative Distribution of Haemoglobin without rHuEpo by year
Cum
ulat
ive
dist
ribut
ion
Hb (g/dL)
1999 2000 2001 2002
0 2 4 6 8 10 12 16 20
.25
.5
.75
1
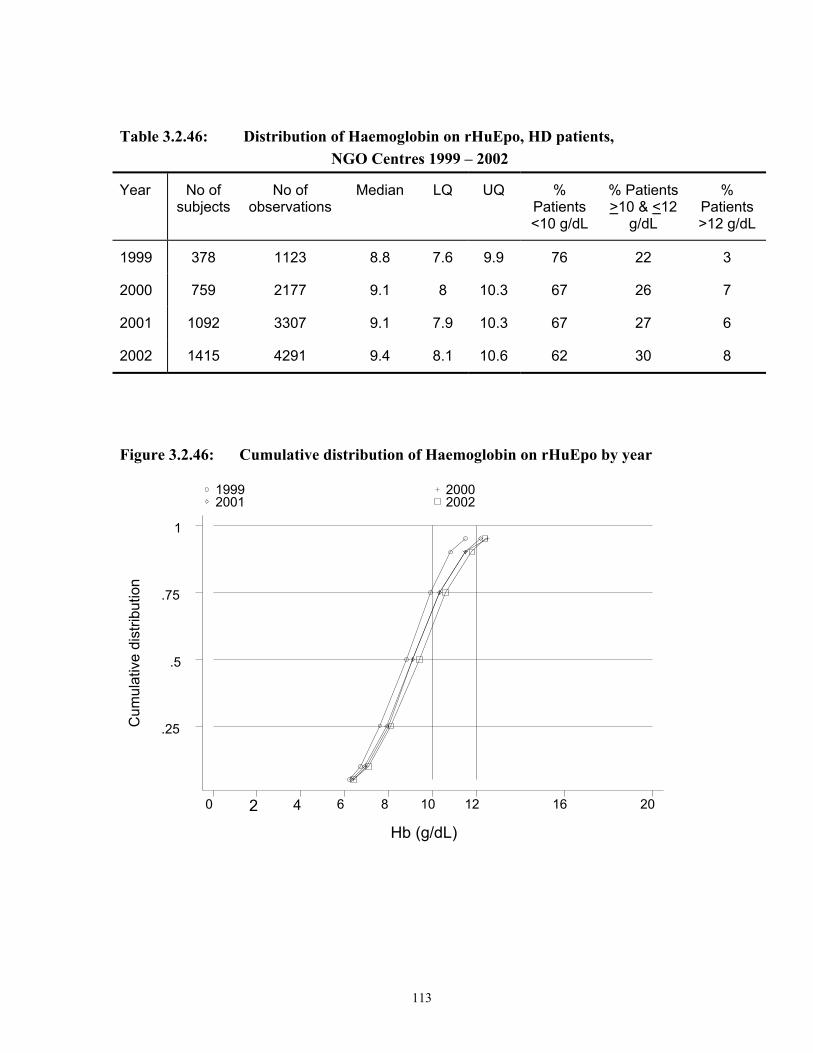
113
Table 3.2.46: Distribution of Haemoglobin on rHuEpo, HD patients, NGO Centres 1999 – 2002
Year No of subjects
No of observations
Median LQ UQ % Patients <10 g/dL
% Patients >10 & <12
g/dL
% Patients >12 g/dL
1999 378 1123 8.8 7.6 9.9 76 22 3
2000 759 2177 9.1 8 10.3 67 26 7
2001 1092 3307 9.1 7.9 10.3 67 27 6
2002 1415 4291 9.4 8.1 10.6 62 30 8
Figure 3.2.46: Cumulative distribution of Haemoglobin on rHuEpo by year
Cum
ulat
ive
dist
ribut
ion
Hb (g/dL)
1999 2000 2001 2002
0 2 4 6 8 10 12 16 20
.25
.5
.75
1

114
3.2.13 NUTRITIONAL STATUS OF HD PATIENTS, NGO CENTRES
Table 3.2.47: Distribution of serum Albumin (g/L), HD patients, NGO Centres 1999 – 2002
Year No of subjects
No of observations
Median LQ UQ % Patients >40g/L
1999 647 1502 39 36 42 44
2000 1220 3311 39 36 41 39
2001 1721 4641 38 35 41 33
2002 2095 5938 39 36 41 44
Figure 3.2.47: Cumulative distribution of serum Albumin by year
Cum
ulat
ive
dist
ribut
ion
Serum albumin (g/L)
1999 2000 2001 2002
20 30 35 40 50 60
.25
.5
.75
1

115
Table 3.2.48: Distribution of Body Mass Index, HD patients, NGO Centres 1999 – 2002
Year No of subjects
No of observations
Median LQ UQ % Patients <18.5
% Patients >18.5 &
<25
% Patients
>25
1999 607 5957 21 18.9 23.7 20 62 18
2000 1217 12077 21.7 19.2 24.3 19 60 21
2001 1532 15266 21.9 19.5 24.7 17 60 23
2002 1820 18849 22 19.6 24.8 16 60 24
Figure 3.2.48: Cumulative distribution of BMI by year
Cum
ulat
ive
dist
ribut
ion
BMI (Kg/M2)
1999 2000 2001 2002
10 15 18.5 25 30 35 40
.25
.5
.75
1

116
3.2.14 SEROLOGICAL STATUS, HD PATIENTS , NGO CENTRES
Table 3.2.49: Prevalence of positive anti-HCV and HbsAg, HD patients, NGO Centres 1999 – 2002
Year No % HBsAg positive % anti-HCV positive
1999 728 8 18
2000 1531 6 20
2001 1905 6 17
2002 2223 6 16
Figure 3.2.49: Prevalence of positive anti-HCV and HbsAg HD patients, NGO Centres 1999 – 2002
Prev
alen
ce %
Year
0
5
10
15
20
25
30 HBsAg anti-HCV
1999 2000 2001 2002

117
HAEMODIALYSIS
IN
PRIVATE CENTRES
Stock and Flow
Death on Haemodialysis and Transfer to PD
Haemodialysis Patient Characteristics
Survival Analysis
Work related rehabilitation and quality of life
Haemodialysis practices
Dyslipidaemia in HD patients
Treatment of Renal Bone Disease
Management of Blood Pressure
Management of Anaemia
Nutritional status
Prevalence of anti-HCV antibodies and HbsAg

118
3.3: HAEMODIALYSIS IN PRIVATE CENTRES
3.3.1 STOCK AND FLOW
Table 3.3.01: Stock and Flow HD Patient, Private Centres 1995 – 2002
Year 1995 1996 1997 1998 1999 2000 2001 2002
New patients 122 174 192 284 400 515 500 470
Died 20 25 54 53 55 130 203 172
Transferred to PD
1 2 3 1 0 7 8 12
Transplanted 2 8 7 5 14 39 45 32
Lost to Follow up 0 2 3 2 2 5 18 14
Dialysing at 31st December
319 465 595 823 1162 1507 1742 1990
Figure 3.3.01: Stock and Flow HD Patient, Private Centres 1995 – 2002
No.
of p
atie
nts
0
500
1000
1500
2000 New patients on RRT at 31st December
1995 1996 1997 1998 1999 2000 2001 2002
Year

119
3.3.3 DEATH ON HAEMODIALYSIS, PRIVATE CENTRES
Table 3.3.04: HD Death Rate and Transfer to PD, Private Centres 1995 – 2002
1995 1996 1997 1998 1999 2000 2001 2002
No. at risk 319 392 530 709 993 1335 1625 1866
Deaths 20 25 54 53 55 130 203 172
Death rate % 6 6 10 7 6 10 12 9
Transfer to PD 1 2 3 1 0 7 8 12
Transfer to PD rate % 0 1 1 0 0 1 0 1
All Losses 21 27 57 54 55 137 211 184
All Losses rate % 7 7 11 8 6 10 13 10
Figure 3.3.04: Death Rate on HD, Private Centres 1995 – 2002
Dea
th ra
te %
0
10
20
30 Annual death rate
1995 1996 1997 1998 1999 2000 2001 2002
Year

120
Table 3.3.05: Causes of Death HD Patient, Private Centres 1999 – 2002
1999 2000 2001 2002
Causes of death No. % No. % No. % No. %
Cardiovascular 13 24 50 38 84 41 80 47
Died at home 14 25 34 26 68 33 48 28
Sepsis 8 15 12 9 15 7 10 6
GIT bleed 1 2 2 2 4 2 3 2
Cancer 1 2 3 2 3 1 4 2
Liver disease 2 4 2 2 2 1 2 1
Others 12 22 22 17 19 9 19 11
Unknown 4 7 5 4 6 3 6 3
Total 55 100 130 100 203 100 172 100
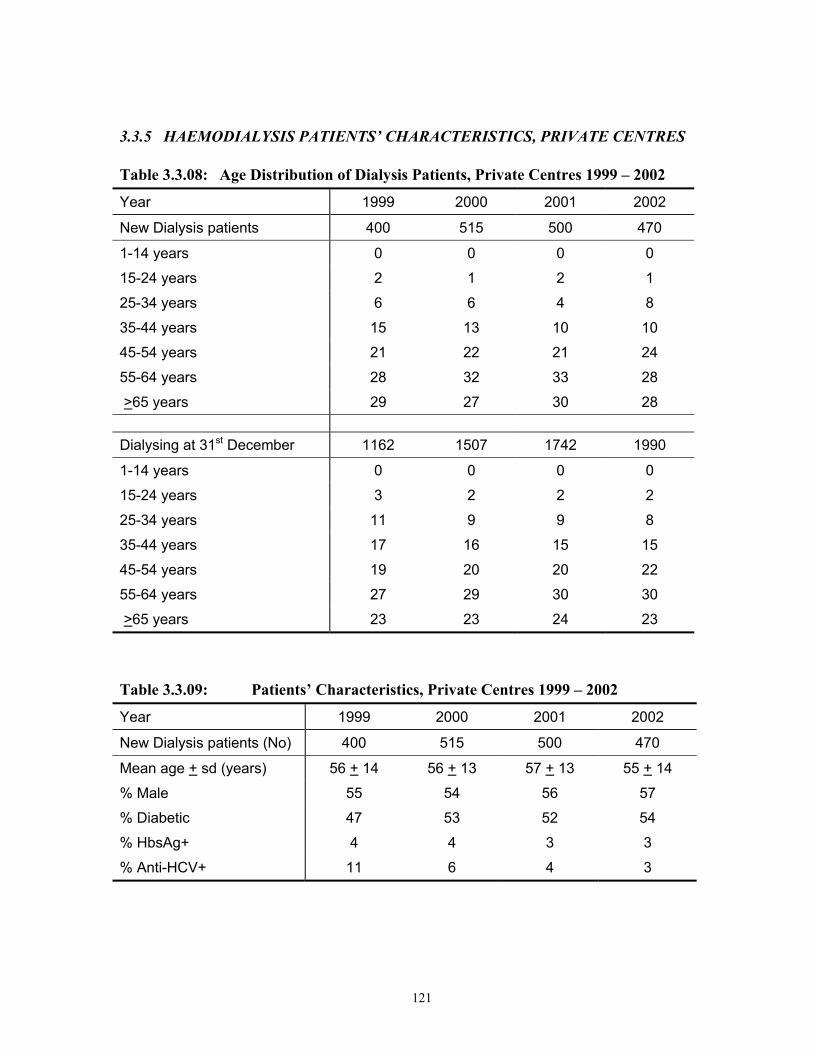
121
3.3.5 HAEMODIALYSIS PATIENTS’ CHARACTERISTICS, PRIVATE CENTRES
Table 3.3.08: Age Distribution of Dialysis Patients, Private Centres 1999 – 2002
Year 1999 2000 2001 2002
New Dialysis patients 400 515 500 470
1-14 years 0 0 0 0
15-24 years 2 1 2 1
25-34 years 6 6 4 8
35-44 years 15 13 10 10
45-54 years 21 22 21 24
55-64 years 28 32 33 28
>65 years 29 27 30 28 Dialysing at 31st December 1162 1507 1742 1990
1-14 years 0 0 0 0
15-24 years 3 2 2 2
25-34 years 11 9 9 8
35-44 years 17 16 15 15
45-54 years 19 20 20 22
55-64 years 27 29 30 30
>65 years 23 23 24 23
Table 3.3.09: Patients’ Characteristics, Private Centres 1999 – 2002
Year 1999 2000 2001 2002
New Dialysis patients (No) 400 515 500 470
Mean age + sd (years) 56 + 14 56 + 13 57 + 13 55 + 14
% Male 55 54 56 57
% Diabetic 47 53 52 54
% HbsAg+ 4 4 3 3
% Anti-HCV+ 11 6 4 3
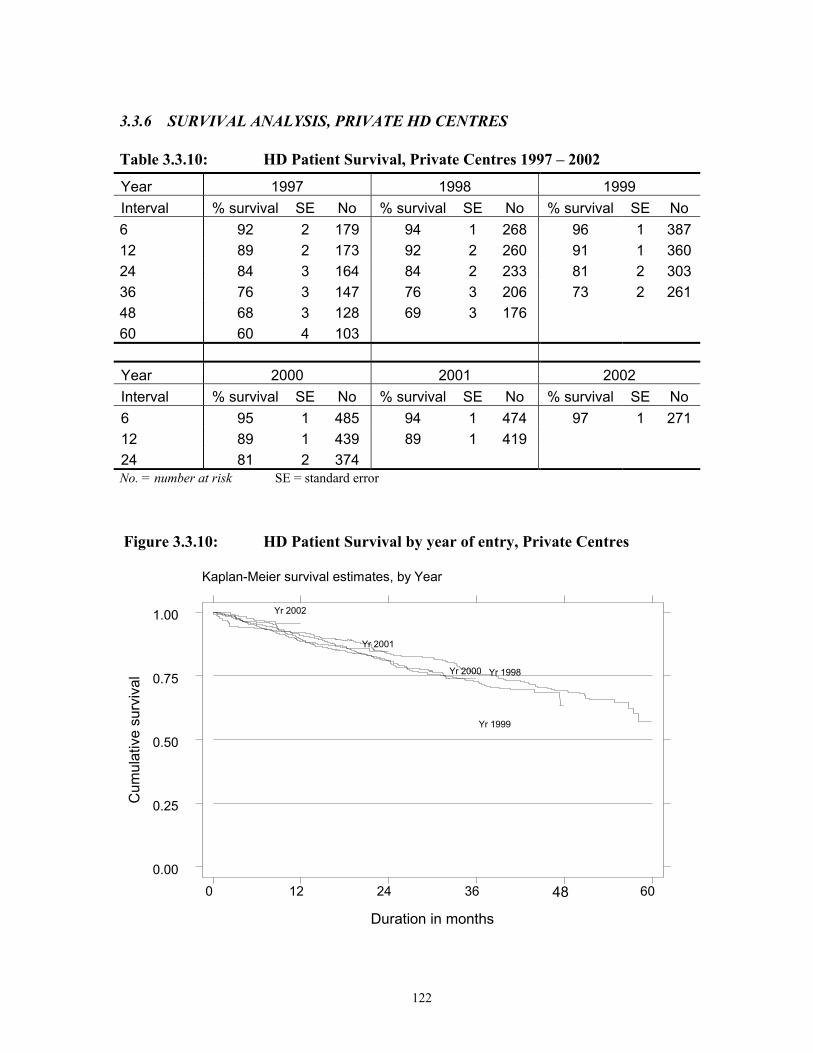
122
3.3.6 SURVIVAL ANALYSIS, PRIVATE HD CENTRES
Table 3.3.10: HD Patient Survival, Private Centres 1997 – 2002
Year 1997 1998 1999 Interval % survival SE No % survival SE No % survival SE No 6 92 2 179 94 1 268 96 1 387 12 89 2 173 92 2 260 91 1 360 24 84 3 164 84 2 233 81 2 303 36 76 3 147 76 3 206 73 2 261 48 68 3 128 69 3 176 60 60 4 103 Year 2000 2001 2002 Interval % survival SE No % survival SE No % survival SE No 6 95 1 485 94 1 474 97 1 271 12 89 1 439 89 1 419 24 81 2 374 No. = number at risk SE = standard error
Figure 3.3.10: HD Patient Survival by year of entry, Private Centres Kaplan-Meier survival estimates, by Year
Cum
ulat
ive
surv
ival
Duration in months
0 12 24 36 48 60 0.00
0.25
0.50
0.75
1.00
Yr 1998
Yr 1999
Yr 2000
Yr 2001
Yr 2002

123
Table 3.3.11: HD Technique Survival, Private Centres
Year 1997 1998 1999 Interval % survival SE No % survival SE No % survival SE No 6 92 2 179 94 1 268 96 1 387 12 88 2 173 92 2 260 91 1 360 24 84 3 164 84 2 233 80 2 303 36 76 3 147 76 3 206 72 2 261 48 67 3 128 69 3 176 60 58 4 103 Year 2000 2001 2002 Interval % survival SE No 6 95 1 485 94 1 474 97 1 271 12 89 1 439 88 1 419 24 80 2 374 No. = number at risk SE = standard error
Figure 3.3.11: HD Technique Survival by year of entry, Private Centres Kaplan-Meier survival estimates, by Year
Cum
ulat
ive
surv
ival
Duration in months0 12 24 36 48 60
0.00
0.25
0.50
0.75
1.00
Yr 1998
Yr 1999
Yr 2000
Yr 2001
Yr 2002

124
3.3.7 WORK RELATED REHABILITATION AND QUALITY OF LIFE ON HAEMODIALYSIS, PRIVATE CENTRES
Table 3.3.12: Work Related Rehabilitation on HD, Private centres 1999-2002
1999 2000 2001 2002 REHABILITATION
STATUS No. % No. % No. % No. %
Full time work for pay
110 30 152 24 159 20 158 18
Part time work for pay
23 6 28 4 41 5 60 7
Able to work but unable to get a job
4 1 7 1 19 2 20 2
Able to work but not yet due to dialysis schedule
4 1 9 1 12 1 15 2
Able but disinclined to work
2 1 5 1 8 1 17 2
Home maker 86 23 173 27 191 23 200 23
Full time student 1 0 1 0 1 0 2 0
Age<15 years 0 0 0 0 0 0 0 0
Retired 46 13 79 12 111 14 134 15
Age>65 years 59 16 119 18 150 18 160 18
Unable to work due to poor health
32 9 72 11 122 15 122 14
Total 367 100 645 100 814 100 888 100

125
Table 3.3.13: Quality of Life on Haemodialysis, Private Centres 1999-2002
1999 2000 2001 2002 QOL Index Summated Score
No. % No. % No. % No. %
0 (Worst QOL) 1 0 1 0 0 0 2 0
1 0 0 0 0 2 0 5 1
2 2 1 1 0 4 0 4 0
3 0 0 10 1 11 1 11 1
4 3 1 19 3 36 4 41 5
5 21 6 48 7 46 6 51 6
6 25 7 54 8 64 8 83 9
7 40 11 52 8 78 10 94 11
8 30 8 65 10 82 10 100 11
9 47 13 62 9 68 8 96 11
10 (Best QOL) 194 53 355 53 423 52 397 45
Total 363 100 667 100 814 100 884 100

126
3.3.8 HAEMODIALYSIS PRACTICES IN PRIVATE CENTRES
Table 3.3.14: Vascular Access on Haemodialysis, Private Centres 1999 - 2002
Access types 1999 2000 2001 2002
No % No % No % No %
Wrist AVF 318 82 602 81 720 77 750 75
BCF* 43 11 113 15 150 16 183 18
Venous graft 4 1 3 0 7 1 4 0
Artificial graft 6 2 10 1 27 3 27 3
PERMCATH 2 1 3 0 6 1 10 1
Temporary CVC*
15 4 15 2 21 2 26 3
Total 388 100 746 100 931 100 1000 100
* BCF = Brachiocephalic fistula * CVC = Central venous catheter
Table 3.3.15: Difficulties reported with Vascular Access, Private Centres 1999 - 2002
Access 1999 2000 2001 2002
difficulty No % No % No % No %
Difficulty with needle placement
12 3 26 3 57 6 47 5
Difficulty in obtaining desired blood flow rate
7 2 23 3 36 4 63 6
Other difficulty 6 2 4 1 3 0 8 1
No difficulty 363 94 694 93 836 90 888 88
Total 388 100 747 100 932 100 1006 100

127
Table 3.3.16: Complications reported with Vascular Access, Private Centres 1999 - 2002
Complication 1999 2000 2001 2002
No. % No. % No. % No. %
Thrombosis 10 3 22 3 39 4 59 6
Bleed 2 1 3 0 4 0 2 0
Aneurysmal dilatation
12 3 39 5 54 6 14 1
Swollen limb 6 2 3 0 5 1 11 1
Access related infection, local/Systemic
1 0 2 0 4 0 7 1
Distal Limb ischaemia
1 0 8 1 2 0 3 0
Venous outflow obstruction
1 0 6 1 14 2 10 1
Carpal tunnel 2 1 3 0 4 0 12 1
Other 6 2 5 1 11 1 22 2
No complication 347 89 656 88 796 85 866 86
Total 388 100 747 100 933 100 1006 100
Table 3.3.17: Blood Flow Rates in Private HD Units 1999 - 2002 Blood flow rates 1999 2000 2001 2002
No. % No. % No. % No. %
<150 ml/min 1 0 2 0 5 1 2 0
150-199 ml/min 9 2 15 2 19 2 25 3
200-249 ml/min 191 53 375 52 362 40 322 33
250-299 ml/min 131 36 241 34 363 40 422 43
300-349 ml/min 23 6 78 11 159 17 182 19
> 350 ml/min 8 2 7 1 8 1 26 3
Total 363 100 718 100 916 100 979 100

128
Table 3.3.18: Number of HD Sessions per week, Private HD Units 1999 - 2002 HD sessions 1999 2000 2001 2002
Per week No. % No. % No. % No. %
1 2 1 3 0 6 1 4 0
2 113 29 215 29 232 25 251 25
3 269 70 520 70 653 70 744 74
4 1 0 2 0 36 4 1 0
Total 385 100 742 100 930 100 1002 100
Table 3.3.19: Duration of HD in Private HD Units, 1999 - 2002 Duration of HD 1999 2000 2001 2002
per session No. % No. % No. % No. %
<3 hours 1 0 0 0 3 0 3 0
3.5 hours 8 2 9 1 11 1 0 0
4 hours 289 75 601 81 821 88 928 93
4.5 hours 51 13 68 9 45 5 29 3
5 hours 35 9 54 7 50 5 42 4
>5 hours 0 0 10 1 0 0 0 0
Total 384 100 742 100 930 100 1002 100
Table 3.3.20: Dialyser membrane types in Private HD Units 1999 - 2002 Dialyser 1999 2000 2001 2002
membrane No. % No. % No. % No. %
Cellulosic 141 80 316 76 330 61 211 42
Cellulose acetate 12 7 16 4 56 10 82 16
Synthetic 23 13 86 21 152 28 212 42
Total 176 100 418 100 538 100 505 100

129
Table 3.3.21: Dialyser Reuse Frequency in Private HD Units 1999 - 2002
Dialyser reuse 1999 2000 2001 2002
frequency No. % No. % No. % No. %
1* 43 12 59 9 60 7 59 6
2 6 2 2 0 1 0 4 0
3 28 8 32 5 44 5 76 8
4 126 36 293 43 227 26 171 18
5 43 12 75 11 89 10 97 10
6 93 27 150 22 206 23 240 25
7 2 1 4 1 3 0 6 1
8 3 1 41 6 188 21 207 22
9 0 0 0 0 0 0 1 0
10 0 0 21 3 36 4 38 4
11 1 0 1 0 4 0 5 1
12 1 0 3 0 23 3 19 2
>13 0 0 0 0 4 0 20 2
Total 346 100 681 100 885 100 943 100 1* is single use i.e. no reuse
Table 3.3.22: Dialysate Buffer used in Private HD Units 1999 – 2002
Dialysate buffer 1999 2000 2001 2002
No. % No. % No. % No. %
Acetate 65 17 77 10 55 6 36 4
Bicarbonate 322 83 663 90 871 94 955 96
Total 387 100 740 100 926 100 991 100

130
Table 3.3.23: Distribution of Prescribed KT/V, Private Centres 1999 - 2002
Year No of subjects
No of observations
Median LQ UQ % > 1.3
1999 236 1725 1.4 1.2 1.6 61
2000 478 4584 1.4 1.2 1.7 68
2001 608 5892 1.4 1.2 1.7 65
2002 665 5914 1.5 1.3 1.7 72
Figure 3.3.23: Cumulative distribution of Prescribed KT/V by Year
Cum
ulat
ive
dist
ribut
ion
Kt/v
1999 2000 2001 2002
.6 .8 1 1.2 1.4 1.6 1.8 2
.25
.5
.75
1
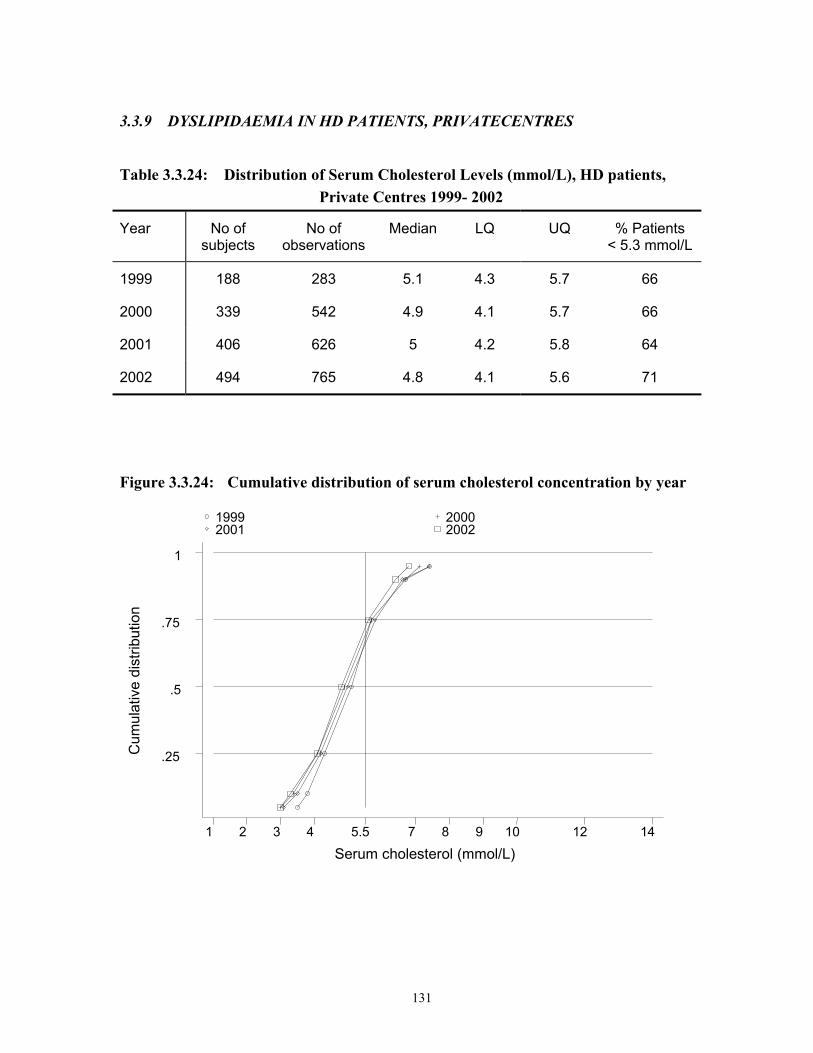
131
3.3.9 DYSLIPIDAEMIA IN HD PATIENTS, PRIVATECENTRES
Table 3.3.24: Distribution of Serum Cholesterol Levels (mmol/L), HD patients, Private Centres 1999- 2002
Year No of subjects
No of observations
Median LQ UQ % Patients < 5.3 mmol/L
1999 188 283 5.1 4.3 5.7 66
2000 339 542 4.9 4.1 5.7 66
2001 406 626 5 4.2 5.8 64
2002 494 765 4.8 4.1 5.6 71
Figure 3.3.24: Cumulative distribution of serum cholesterol concentration by year
Cum
ulat
ive
dist
ribut
ion
Serum cholesterol (mmol/L)
1999 2000 2001 2002
1 2 3 4 5.5 7 8 9 10 12 14
.25
.5
.75
1

132
Table 3.3.25: Distribution of serum Triglyceride (mmol/L), HD patients, Private Centres 1999-2002
Year No of subjects
No of observations
Median LQ UQ % patients < 3.5 mmol/L
1999 87 113 1.8 1.2 2.7 86
2000 254 387 1.7 1.1 2.5 86
2001 287 419 1.6 1.1 2.5 89
2002 326 485 1.9 1.3 2.6 89
Figure 3.3.25: Cumulative distribution of serum triglyceride concentration by year
Cum
ulat
ive
dist
ribut
ion
Serum triglyceride (mmol/L)
1999 2000 2001 2002
1 2 3.5 5 6
.25
.5
.75
1

133
Table 3.3.26: Distribution of serum LDL (mmol/L), HD patient, Private Centres 1999-2002
Year No of subjects
No of observations
Median LQ UQ % patients <5 mmol/L
1999 76 97 3 2.5 3.9 96
2000 226 340 2.9 2.2 3.5 98
2001 276 398 3 2.3 3.6 97
2002 327 474 2.7 2 3.4 98
Figure 3.3.26: Cumulative distribution of serum LDL by year
Cum
ulat
ive
dist
ribut
ion
Serum LDL (mmol/L)
1999 2000 2001 2002
1 2 3 4 5 6 7 8 9 10
.25
.5
.75
1
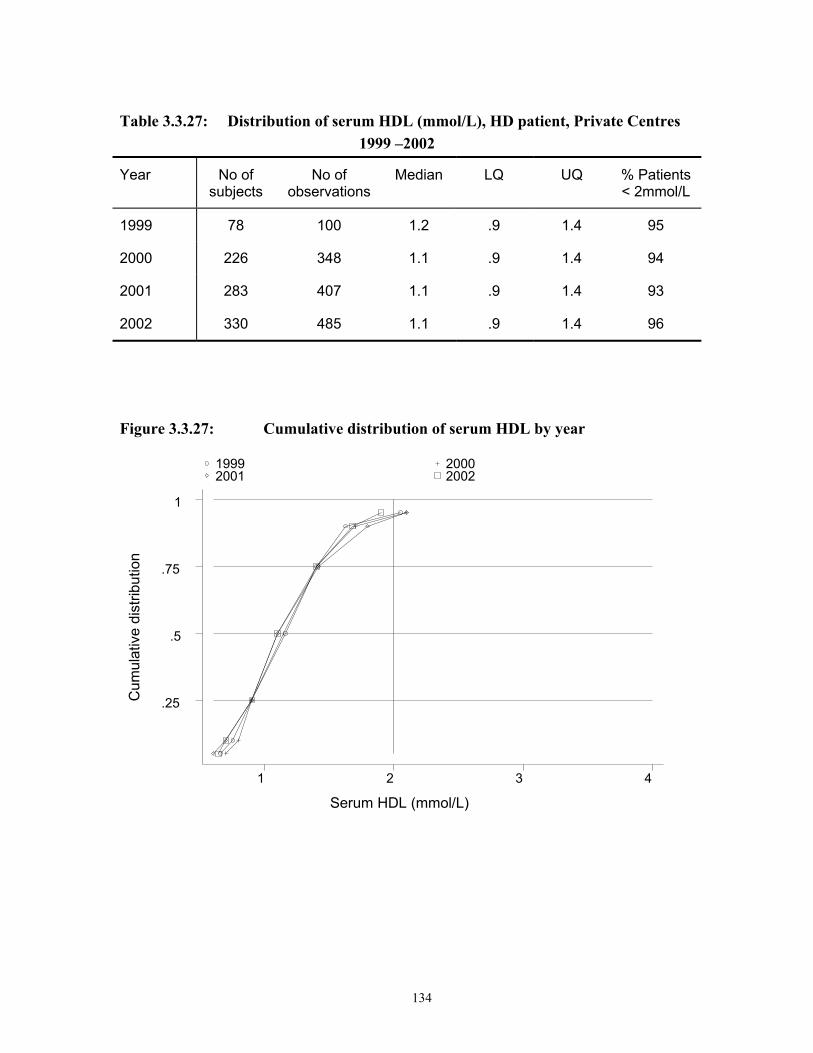
134
Table 3.3.27: Distribution of serum HDL (mmol/L), HD patient, Private Centres 1999 –2002
Year No of subjects
No of observations
Median LQ UQ % Patients < 2mmol/L
1999 78 100 1.2 .9 1.4 95
2000 226 348 1.1 .9 1.4 94
2001 283 407 1.1 .9 1.4 93
2002 330 485 1.1 .9 1.4 96
Figure 3.3.27: Cumulative distribution of serum HDL by year
Cum
ulat
ive
dist
ribut
ion
Serum HDL (mmol/L)
1999 2000 2001 2002
1 2 3 4
.25
.5
.75
1

135
3.3.10 MANAGEMENT OF RENAL BONE DISEASE, PRIVATE CENTRES
Table 3.3.28: Treatment for Renal Bone Disease, HD patients, Private Centres 1999–2002
Year No of subjects % on CaCO3 % on Al(OH)3 % on Vitamin D 1999 389 82 6 30 2000 750 84 3 33 2001 933 89 2 27 2002 1015 89 2 23
Table 3.3.29: Distribution of serum Phosphate (mmol/l), HD patients, Private Centres 1999 –2002
Year No of subjects
No of observations
Median LQ UQ % patients < 1.6 mmol/L
1999 352 946 1.9 1.6 2.3 26 2000 657 1656 1.9 1.5 2.3 31 2001 780 1912 1.8 1.4 2.3 34 2002 872 2052 1.8 1.5 2.3 32
Figure 3.3.29: Cumulative distribution of serum Phosphate by year
Cum
ulat
ive
dist
ribut
ion
Serum phosphate (mmol/L)
1999 2000 2001 2002
1 1.6 2 3 4
.25
.5
.75
1

136
Table 3.3.30: Distribution of serum Calcium (mmol/l), HD patients, Private Centres 1999-2002
Year No of subjects
No of observations
Median LQ UQ % Patients > 2.2 & <2.6
mmol/L
1999 353 969 2.3 2.1 2.5 52
2000 663 1687 2.3 2.2 2.5 56
2001 790 1947 2.3 2.2 2.5 60
2002 878 2101 2.3 2.1 2.5 57
Figure 3.3.30: Cumulative distribution of serum Calcium by year
Cum
ulat
ive
dist
ribut
ion
Serum calcium (mmol/L)
1999 2000 2001 2002
1 2 2.2 2.6 3 4
.25
.5
.75
1
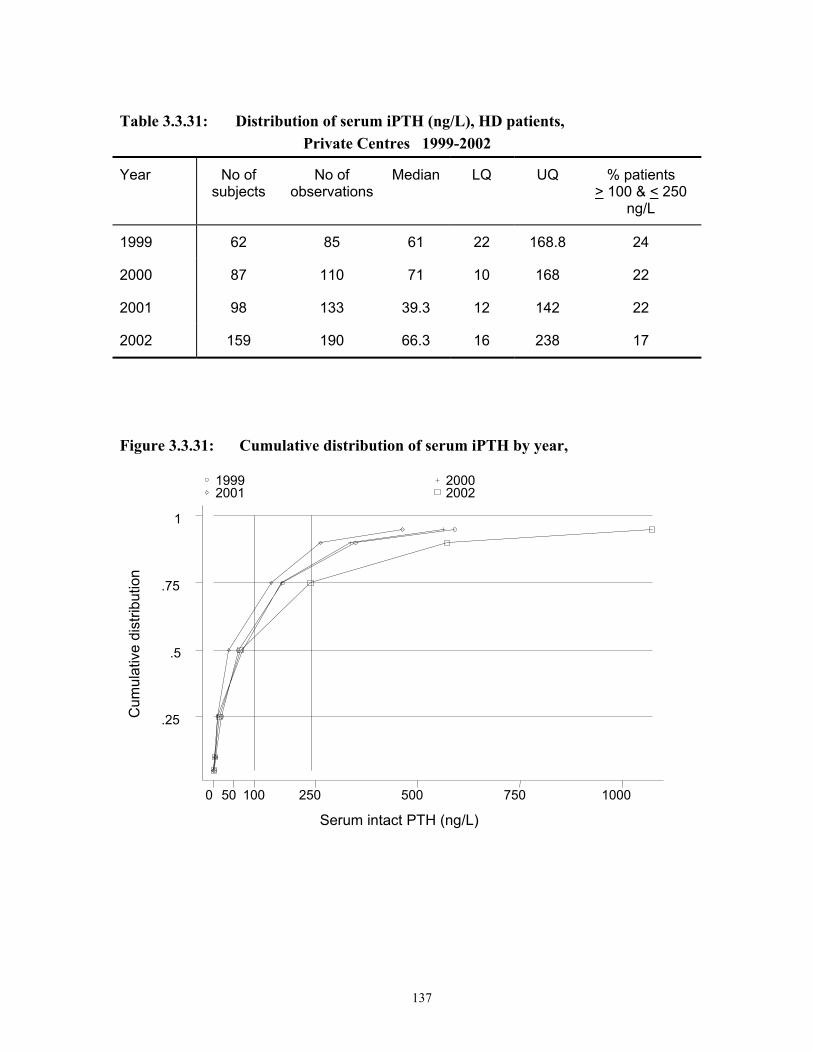
137
Table 3.3.31: Distribution of serum iPTH (ng/L), HD patients, Private Centres 1999-2002
Year No of subjects
No of observations
Median LQ UQ % patients > 100 & < 250
ng/L
1999 62 85 61 22 168.8 24
2000 87 110 71 10 168 22
2001 98 133 39.3 12 142 22
2002 159 190 66.3 16 238 17
Figure 3.3.31: Cumulative distribution of serum iPTH by year,
Cum
ulat
ive
dist
ribut
ion
Serum intact PTH (ng/L)
1999 2000 2001 2002
0 50 100 250 500 750 1000
.25
.5
.75
1

138
3.3.11 MANAGEMENT OF BLOOD PRESSURE, PRIVATE CENTRES
Table 3.3.32: Treatment for hypertension, HD patients, Private Centres 1999-2002
Year No. % on anti-hypertensives
% on 1 anti-hypertensives
% on 2 anti-hypertensives
% on 3 anti- hypertensives
1999 389 64 39 20 6 2000 750 66 41 21 5 2001 933 68 41 23 5 2002 1015 67 38 24 5
Table 3.3.33: Distribution of Systolic BP without anti-hypertensives, HD patients Private Centres 1999-2002
Year No of subjects
No of observations
Median LQ UQ % Patients < 160 mmHg
1999 131 833 142 130 160 69 2000 244 2287 140 125 160 73 2001 287 2633 140 120 151 80 2002 328 2704 140 128 160 73
Figure 3.3.33: Cumulative distribution of Systolic BP without anti-hypertensives by year
Cum
ulat
ive
dist
ribut
ion
Systolic BP (mmHg)
1999 2000 2001 2002
60 90 120 140 160 200
.25
.5
.75
1
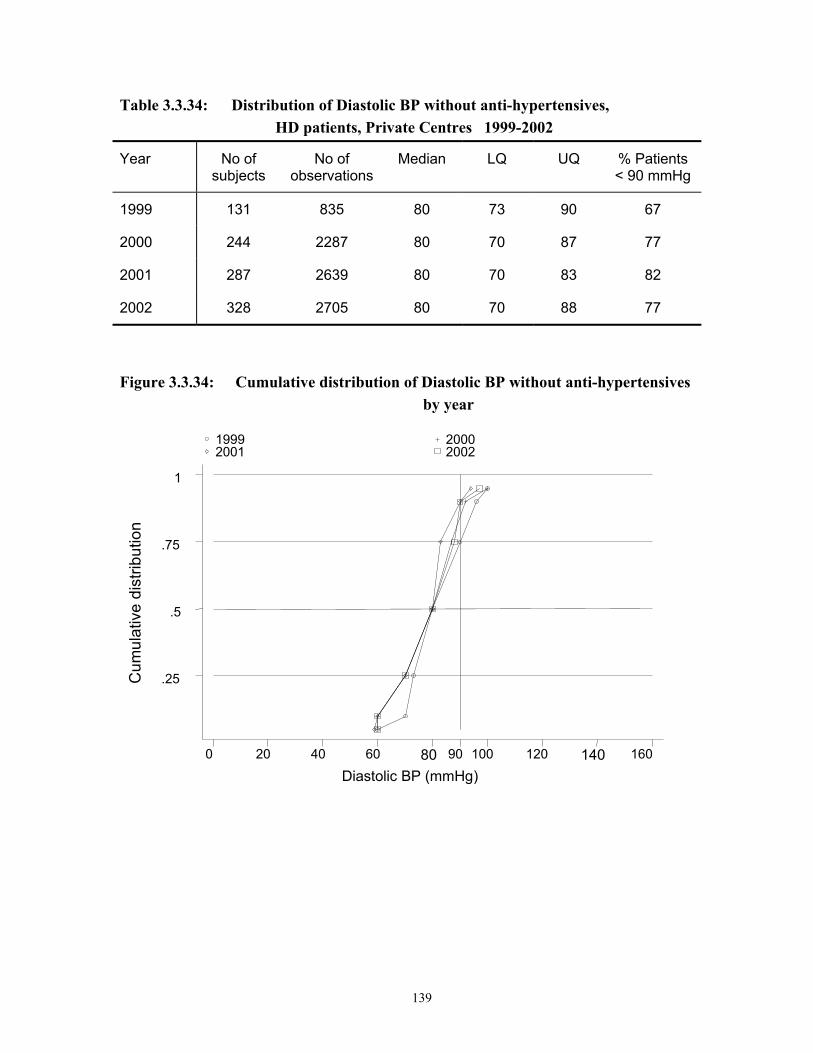
139
Table 3.3.34: Distribution of Diastolic BP without anti-hypertensives, HD patients, Private Centres 1999-2002
Year No of subjects
No of observations
Median LQ UQ % Patients < 90 mmHg
1999 131 835 80 73 90 67
2000 244 2287 80 70 87 77
2001 287 2639 80 70 83 82
2002 328 2705 80 70 88 77
Figure 3.3.34: Cumulative distribution of Diastolic BP without anti-hypertensives by year
Cum
ulat
ive
dist
ribut
ion
Diastolic BP (mmHg)
1999 2000 2001 2002
0 20 40 60 80 90 100 120 140 160
.25
.5
.75
1

140
Table 3.3.35: Distribution of systolic BP on anti-hypertensives, HD patients, Private Centres 1999-2002
Year No of subjects
No of observations
Median LQ UQ % Patients < 160 mmHg
1999 246 1838 153 140 170 53
2000 482 4392 156 140 171 52
2001 631 5879 155 140 172 53
2002 659 5389 156 140 170 52
Figure 3.3.35: Cumulative distribution of systolic BP on anti-hypertensives by year
Cum
ulat
ive
dist
ribut
ion
Systolic BP (mmHg)
1999 2000 2001 2002
60 90 120 140 160 200
.25
.5
.75
1

141
Table 3.3.36: Distribution of diastolic BP on anti-hypertensives, HD patients, Private Centres 1999-2002
Year No of subjects
No of observations
Median LQ UQ % Patients < 90 mmHg
1999 246 1839 84 80 90 56
2000 482 4394 83 76 90 59
2001 631 5880 81 74 90 61
2002 658 5386 80 73 90 62
Figure 3.3.36: Cumulative distribution of diastolic BP on anti-hypertensives by year
Cum
ulat
ive
dist
ribut
ion
Diastolic BP (mmHg)
1999 2000 2001 2002
0 20 40 60 80 90 100 120 140 160
.25
.5
.75
1

142
3.3.12 TREATMENT OF ANAEMIA, PRIVATE HD CENTRES
Table 3.3.37: Treatment for Anaemia, HD patients, Private Centres 1999-2002
Year No % on rHuEpo
% received blood
transfusion
% received oral iron
% received parenteral
iron
1999 389 60 23 81 13
2000 750 64 20 75 3
2001 933 66 20 80 5
2002 1015 68 17 75 4
Table 3.3.38: Distribution of rHuEpo dose per week, HD patients, Private Centres 1999-2002
Year 1999 2000 2001 2002
No. of patients 225 464 595 645
% on 2000 u/week 29 31 29 33
% on 2-4000 u/week 62 58 54 56
% on 4-6000 u/week 4 7 11 8
% on 6-8000 u/week 3 2 2 2
% on 8-12000 u/week 2 2 3 1
% on >12000 u/week 0 0 1 0

143
Table 3.3.39: Distribution of serum Iron without rHuEpo, HD patients, PrivateCentres 1999-2002
Year No of subjects
No of observations
Median LQ UQ % Patients > 10 umol/L
1999 16 26 10.9 9.1 14.4 58
2000 28 45 12.2 9 17.1 64
2001 27 40 14.6 10 21 73
2002 24 39 12 6 19.4 54
Figure 3.3.39: Cumulative distribution of serum Iron without rHuEpo by year
Cum
ulat
ive
dist
ribut
ion
Serum iron (umol/L)
1999 2000 2001 2002
0 5 10 15 20 25 30 40 50
.25
.5
.75
1

144
Table 3.3.40: Distribution of serum Iron on rHuEpo, HD patients, Private Centres 1999-2002
Year No of subjects
No of observations
Median LQ UQ % Patients > 10 umol/L
1999 67 85 12.7 9.1 18.3 69
2000 62 84 13.1 9.1 21.1 67
2001 95 108 13.9 9.6 17.9 72
2002 134 157 12.2 8.4 18.8 61
Figure 3.3.40: Cumulative distribution of serum Iron on rHuEpo by year
Cum
ulat
ive
dist
ribut
ion
Serum iron (umol/L)
1999 2000 2001 2002
0 5 10 15 20 25 30 40 50
.25
.5
.75
1

145
Table 3.3.41: Distribution of serum Transferrin Saturation without rHuEpo, HD patients, Private Centres 1999-2002
Year No of subjects
No of observations
Median LQ UQ % Patients > 20%
1999 9 36 25.1 19.1 29.7 67
2000 24 96 23.6 16.9 35.7 63
2001 21 84 38 25.6 60.1 76
2002 15 60 23.3 14.2 36.6 67
Figure 3.3.41: Cumulative distribution of serum Transferrin Saturation without rHuEpo by year
Cum
ulat
ive
dist
ribut
ion
Serum transferrin saturation (%)
1999 2000 2001 2002
0 10 20 30 40 50 60 70 80
.25
.5
.75
1
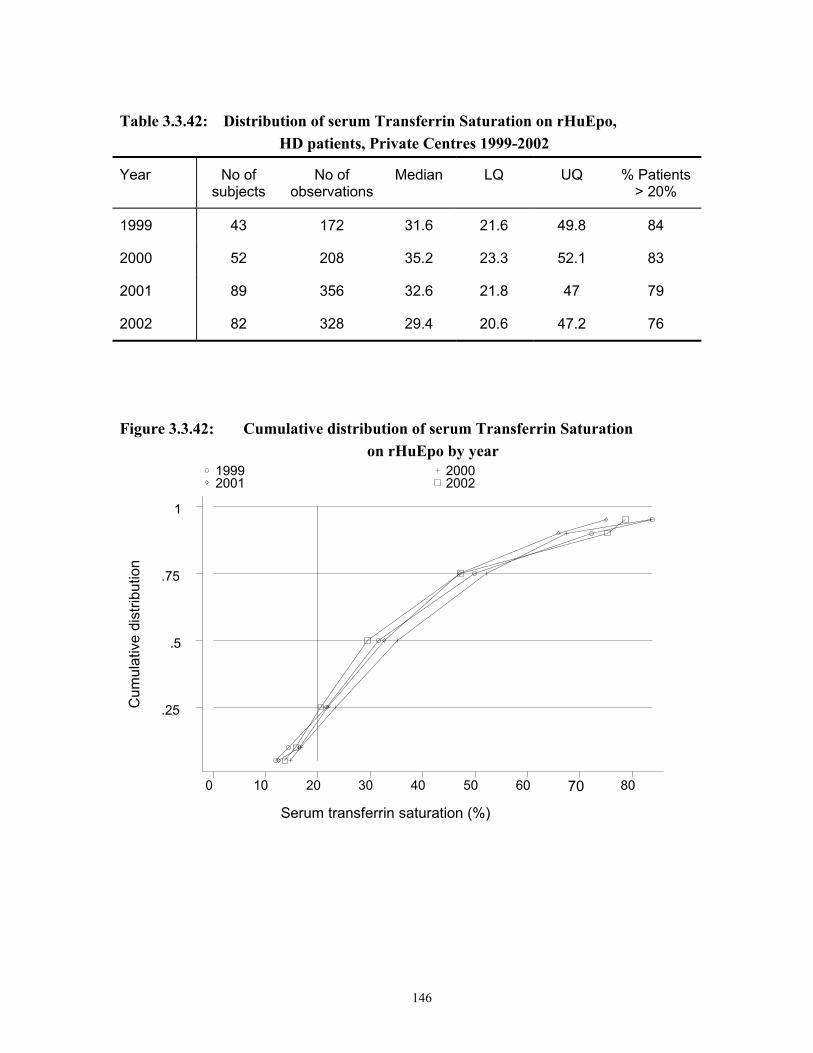
146
Table 3.3.42: Distribution of serum Transferrin Saturation on rHuEpo, HD patients, Private Centres 1999-2002
Year No of subjects
No of observations
Median LQ UQ % Patients > 20%
1999 43 172 31.6 21.6 49.8 84
2000 52 208 35.2 23.3 52.1 83
2001 89 356 32.6 21.8 47 79
2002 82 328 29.4 20.6 47.2 76
Figure 3.3.42: Cumulative distribution of serum Transferrin Saturation on rHuEpo by year
Cum
ulat
ive
dist
ribut
ion
Serum transferrin saturation (%)
1999 2000 2001 2002
0 10 20 30 40 50 60 70 80
.25
.5
.75
1

147
Table 3.3.43: Distribution of serum Ferritin without rHuEpo, HD patients, Private Centres 1999-2002
Year No of subjects
No of observations
Median LQ UQ % Patients > 100 ug/L
1999 21 27 323 90 776 70
2000 31 46 284.6 122 463.7 83
2001 33 45 403 176 831 84
2002 32 45 464.1 228.1 993.7 87
Figure 3.3.43: Cumulative distribution of serum Ferritin without rHuEpo by year
Cum
ulat
ive
dist
ribut
ion
Serum ferritin (ug/L)
1999 2000 2001 2002
0 50 100 200 400 600 800
.25
.5
.75
1
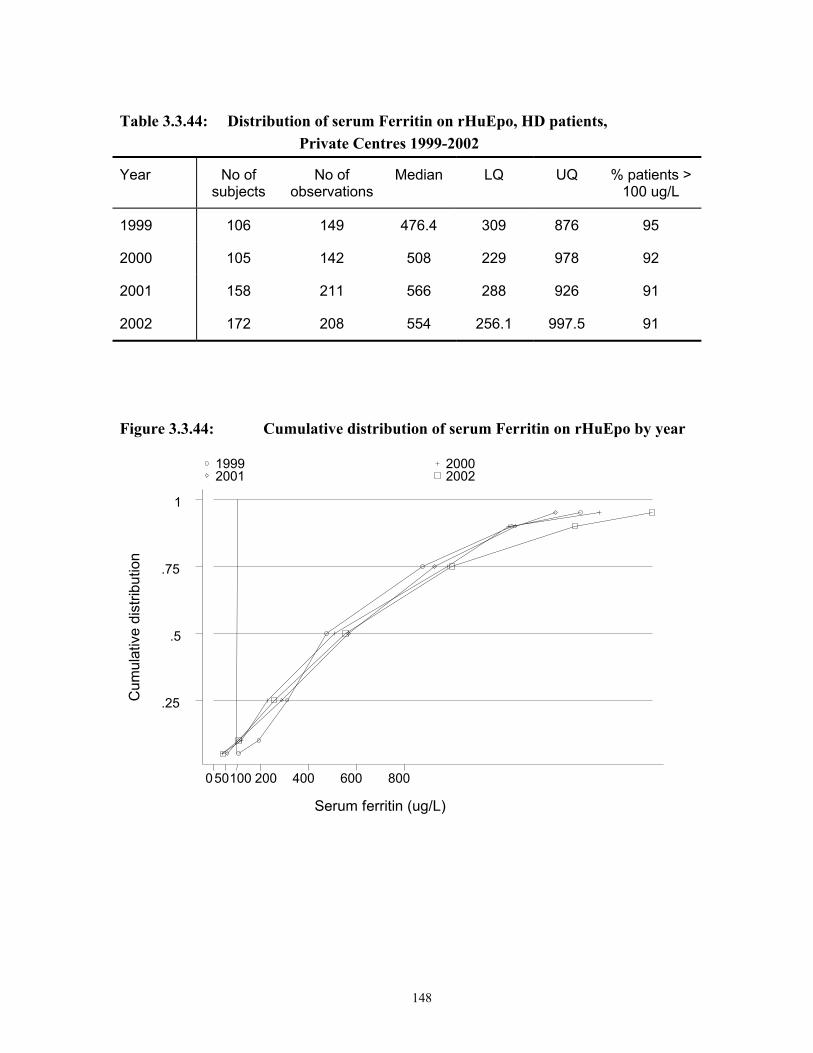
148
Table 3.3.44: Distribution of serum Ferritin on rHuEpo, HD patients, Private Centres 1999-2002
Year No of subjects
No of observations
Median LQ UQ % patients > 100 ug/L
1999 106 149 476.4 309 876 95
2000 105 142 508 229 978 92
2001 158 211 566 288 926 91
2002 172 208 554 256.1 997.5 91
Figure 3.3.44: Cumulative distribution of serum Ferritin on rHuEpo by year
Cum
ulat
ive
dist
ribut
ion
Serum ferritin (ug/L)
1999 2000 2001 2002
0 50 100 200 400 600 800
.25
.5
.75
1

149
Table 3.3.45: Distribution of Haemoglobin concentration without rHuEpo, HD patients, Private Centres 1999-2002
Year No of subjects
No of observations
Median LQ UQ % Patients <10 g/dL
% Patients >10 & <12
g/dL
% Patients >12 g/dL
1999 139 381 8.7 7.7 10.3 70 20 10
2000 241 620 8.8 7.6 10.3 70 22 8
2001 257 627 8.9 7.7 10.2 69 22 9
2002 266 627 9 7.7 10.5 66 22 12
Figure 3.3.45: Cumulative distribution of Hb without rHuEpo by year
Cum
ulat
ive
dist
ribut
ion
Hb (g/dL)
1999 2000 2001 2002
0 2 4 6 8 10 12 16 20
.25
.5
.75
1

150
Table 3.3.46: Distribution of haemoglobin concentration on rHuEpo, HD patients, Private Centres 1999-2002
Year No of subjects
No of observations
Median LQ UQ % Patients <10 g/dL
% Patients >10 & <12
g/dL
% Patients >12 g/dL
1999 219 687 9.4 8.2 10.6 64 30 6
2000 452 1331 9.2 8 10.5 65 28 6
2001 566 1584 9.4 8.4 10.6 61 32 8
2002 633 1692 9.6 8.4 10.9 55 35 10
Figure 3.3.46: Cumulative distribution of Haemoglobin on rHuEpo by year
Cum
ulat
ive
dist
ribut
ion
Hb (g/dL)
1999 2000 2001 2002
0 2 4 6 8 10 12 16 20
.25
.5
.75
1

151
3.3.13 NUTRITIONAL STATUS OF HD PATIENTS PRIVATE CENTRES
Table 3.3.47: Distribution of serum Albumin (g/L), HD patients, Private Centres 1999-2002
Year No of subjects
No of observations
Median LQ UQ % Patients >40g/L
1999 288 798 37 34 41 31
2000 504 1227 37 35 40.6 32
2001 668 1655 37 34 39 22
2002 756 1694 38 35 41 35
Figure 3.3.47: Cumulative distribution of serum Albumin by year
Cum
ulat
ive
dist
ribut
ion
Serum albumin (g/L)
1999 2000 2001 2002
20 30 35 40 50 60
.25
.5
.75
1

152
Table 3.3.48: Distribution of Body Mass Index HD patients, Private Centres 1999-2002
Year No of subjects
No of observations
Median LQ UQ % Patients <18.5
% Patients >18.5 &
<25
% Patients
>25
1999 272 1917 21.6 19.4 24.5 14 64 22
2000 567 5440 21.6 19.4 24.6 17 60 22
2001 689 6684 21.8 19.3 25 18 57 25
2002 639 5571 21.9 19.5 24.8 16 61 23
Figure 3.3.48: Cumulative distribution of body mass index by year
Cum
ulat
ive
dist
ribut
ion
BMI (Kg/M2)
1999 2000 2001 2002
10 15 18.5 25 30 35 40
.25
.5
.75
1

153
3.3.14 SEROLOGICAL STATUS, HD PATIENTS PRIVATECENTRES
Table 3.3.49: Prevalence of positive anti-HCV antibody and HbsAg, HD patients, Private Centres 1999-2002
Year No % HBsAg positive % anti-HCV positive
1999 389 4 17
2000 750 4 24
2001 933 4 23
2002 1015 3 26
Figure 3.3.49: Prevalence of positive anti-HCV antibody and HbsAg HD patients, Private Centres 1999 – 2002
Prev
alen
ce %
Year
0
5
10
15
20
25
30 HBsAg anti-HCV
1999 2000 2001 2002

154
CHRONIC PERITONEAL DIALYSIS
IN
GOVERNMENT CENTRES
Stock and Flow
Funding for CPD
Death on CPD and Transfer to HD
Government CAPD Centres
CAPD Patients’ Characteristics
Survival Analysis
Work related rehabilitation and quality of life
CAPD practices
Dyslipidaemia in CAPD patients
Treatment of Renal Bone Disease
Management of Blood Pressure
Management of Anaemia
Nutritional status
Serological Status on CAPD

155
4. CHRONIC PERITONEAL DIALYSIS
4.1 STOCK AND FLOW
Table 4.01: Stock and Flow of Chronic PD Patients 1995 – 2002
Year 1995 1996 1997 1998 1999 2000 2001 2002
New Dialysis patients
156 208 180 146 192 207 286 298
Died 58 62 73 74 100 90 128 113
Transferred to HD 22 38 50 33 38 63 84 85
Transplanted 7 8 10 12 13 12 12 18
Lost to follow up 0 1 0 0 1 2 2 3
Dialysing at 31st December
328 439 503 538 595 654 767 894
Figure 4.01: Stock and Flow of Chronic PD Patients 1995 – 2002
No.
of p
atie
nts
0
500
1000 New patients on RRT at 31st December
1995 1996 1997 1998 1999 2000 2001 2002
Year

156
4.2 FUNDING FOR CHRONIC PERITONEAL DIALYSIS
Table 4.03: Funding for CAPD, Government Centres 1999 – 2002
Year 1999 2000 2001 2002
New Dialysis patients 192 207 286 298
% Government funded 85 92 88 84
% Self funded 15 7 9 13
% Employer subsidised 0 0 1 1
% Charity 0 1 2 2 Dialysing at 31st December 595 654 767 894
% Government funded 86 88 88 87
% Self funded 12 10 9 10
% Employer subsidised 1 1 1 1
% Charity 1 1 2 2
Figure 4.03: Funding for new CAPD, Government Centres 1999 – 2002
Prop
ortio
n of
pat
ient
s
Funding for CAPD
0
50
100
1999 2000 2001 2002
Government funded Self funded Employer subsidy Charity

157
4.3 DEATH ON CAPD AND TRANSFER TO HAEMODIALYSIS
Table 4.04: Death Rate and Transfer to HD Government Centres 1995 – 2002
Year 1995 1996 1997 1998 1999 2000 2001 2002
No. at risk 328 384 471 521 567 625 711 831
Death (No.) 58 62 73 74 100 90 128 113
Death rate % 18 16 15 14 18 14 18 14
No transferred to HD 22 38 50 33 38 63 84 85
Transfer to HD rate % 7 10 11 6 7 10 12 10
All losses 80 100 123 107 138 153 212 198
All losses rate % 24 26 26 21 24 24 30 24
Figure 4.04: Death Rates on CAPD, Government Centres 1995 – 2002
Dea
th ra
te %
0
10
20
30 Annual death rate
1995 1996 1997 1998 1999 2000 2001 2002
Year

158
Table 4.05: Causes of Death on CAPD, Government Centres 1999 – 2002
Year 1999 2000 2001 2002
No % No % No % No %
Cardiovascular 27 27 28 31 34 27 39 35
Died at home 32 32 22 24 30 23 32 28
Sepsis 16 16 15 17 26 20 19 17
CAPD peritonitis
8 8 15 17 19 15 9 8
GIT bleed 3 3 1 1 4 3 1 1
Cancer 1 1 0 0 2 2 0 0
Liver disease 0 0 0 0 0 0 0 0
Others 10 10 9 10 11 9 10 9
Unknown 3 3 0 0 2 2 3 3
Total 100 100 90 100 128 100 113 100
Table 4.06: Causes of Transfer to CAPD 1999 – 2002
Year 1999 1999 2000 2002
No. % No. % No. % No. %
Peritonitis 23 61 39 62 51 61 31 36
Cather related infection
2 5 1 2 0 0 4 5
Technical problem
0 0 3 5 1 1 5 6
Membrane failure 3 8 10 16 7 8 11 13
Patient preference/cannot cope
3 8 4 6 3 4 9 11
Others 5 13 3 5 7 8 7 8
Unknown 2 5 3 5 15 18 18 21
Total 38 100 63 100 84 100 85 100

159
4.4 GOVERNMENT CAPD CENTRES
Table 4.07: Centre Distribution of CAPD patients, 2002 Centre No Percent
Number on RRT at 31st December 894 100
1 Berjaya NKF Dialysis Centre, Petaling Jaya 3 0
2 Ipoh Hospital 42 5
3 Kota Bharu Hospital 18 2
4 Kuala Lumpur Hospital 167 19
5 Kuala Lumpur Hospital (Paed.) 31 3
6 Kuala Terengganu Hospital 47 5
7 Kuching Hospital 23 3
8 Melaka Hospital 6 1
9 Pulau Pinang Hospital 99 11
10 Queen Elizabeth Hospital 34 4
11 Sabah Medical Centre 1 0
12 Selayang Hospital 32 4
13 Seremban Hospital 70 8
14 Sultanah Aminah Hospital 138 15
15 Tengku Ampuan Afzan Hospital, Kuantan 16 2
16 Tengku Ampuan Rahimah Hospital, Klang 36 4
17 Universiti Kebangsaan Malaysia Hospital 24 3
18 Universiti Sains Malaysia Hospital 1 0
19 University Malaya Medical Centre 106 12

160
4.5 CAPD PATIENTS’ CHARACTERISTICS
Table 4.08: Percentage Age Distribution of CAPD patients 1999 – 2002
Year 1999 2000 2001 2002 New Dialysis patients
192 207 286 298
1-14 years 11 10 9 9
15-24 years 8 11 7 13
25-34 years 7 8 10 9
35-44 years 13 17 14 15
45-54 years 20 26 20 24
55-64 years 26 18 29 18
>65 years 16 11 12 10 Dialysing at 31st
December 595 654 767 894
1-14 years 12 11 11 11
15-24 years 6 7 8 10
25-34 years 14 14 14 12
35-44 years 15 16 17 17
45-54 years 24 24 21 23
55-64 years 20 19 21 19
>65 years 8 8 8 8
Table 4.09: CAPD Patient Characteristics 1999- 2002
Year 1999 2000 2001 2002
New Dialysis patients
192 207 286 298
Mean age + sd 47 + 19 43 + 18 46 + 18 42 + 19
% Male 51 50 47 52
% Diabetic 45 38 41 40
% HBsAg+ 2 4 4 3
% Anti-HCV+ 3 3 2 1

161
4.6 SURVIVAL ANALYSIS
Table 4.10: CAPD Patient Survival related to Year of Entry, Government Centres 1997– 2002 Year 1997 1998 1999 Interval (months)
% survival SE No % survival SE No % survival SE No
6 96 1 186 94 2 142 94 2 188 12 92 2 169 86 3 126 90 2 173 24 79 3 140 72 4 94 73 3 115 36 65 4 101 61 4 73 55 4 74 48 56 4 77 53 4 51 60 49 4 56
Year 2000 2001 2002 Interval (months)
% survival SE No % survival SE No % survival SE No
6 94 2 205 93 1 302 94 2 163 12 88 2 182 88 2 258 24 76 3 136 No. = number at risk SE = standard error
Figure 4.10: CAPD Patient Survival related to Year of Entry, Government Centres 1998 – 2002
Kaplan-Meier survival estimates, by Year
Cum
ulat
ive
surv
ival
Duration in months
0 12 24 36 48 60 0.00
0.25
0.50
0.75
1.00
Yr 1998
Yr 1999
Yr 2000
Yr 2001
Yr 2002

162
Table 4.11: CAPD Technique Survival related to Year of Entry, Government Centres 1997 – 2002 Year 1997 1998 1999 Interval (months)
% survival SE No % survival SE No % survival SE No
6 94 2 186 92 2 142 89 2 188 12 88 2 169 83 3 126 84 3 173 24 74 3 140 65 4 94 57 3 115 36 55 4 101 50 4 73 39 3 74 48 42 4 76 39 4 56 60 32 3 56
Year 2000 200 2002 Interval (months)
% survival SE No % survival SE No % survival SE No
6 91 2 205 89 2 302 91 2 163 12 81 3 183 80 2 260 24 62 3 136 No. = number at risk SE = standard error
Figure 4.11: CAPD Technique Survival by Year of Entry Government Centres 1998 – 2002 Kaplan-Meier survival estimates, by Year
Cum
ulat
ive
surv
ival
Duration in months
0 12 24 36 48 60 0.00
0.25
0.50
0.75
1.00
Yr 1998
Yr 1999
Yr 2000
Yr 2001
Yr 2002
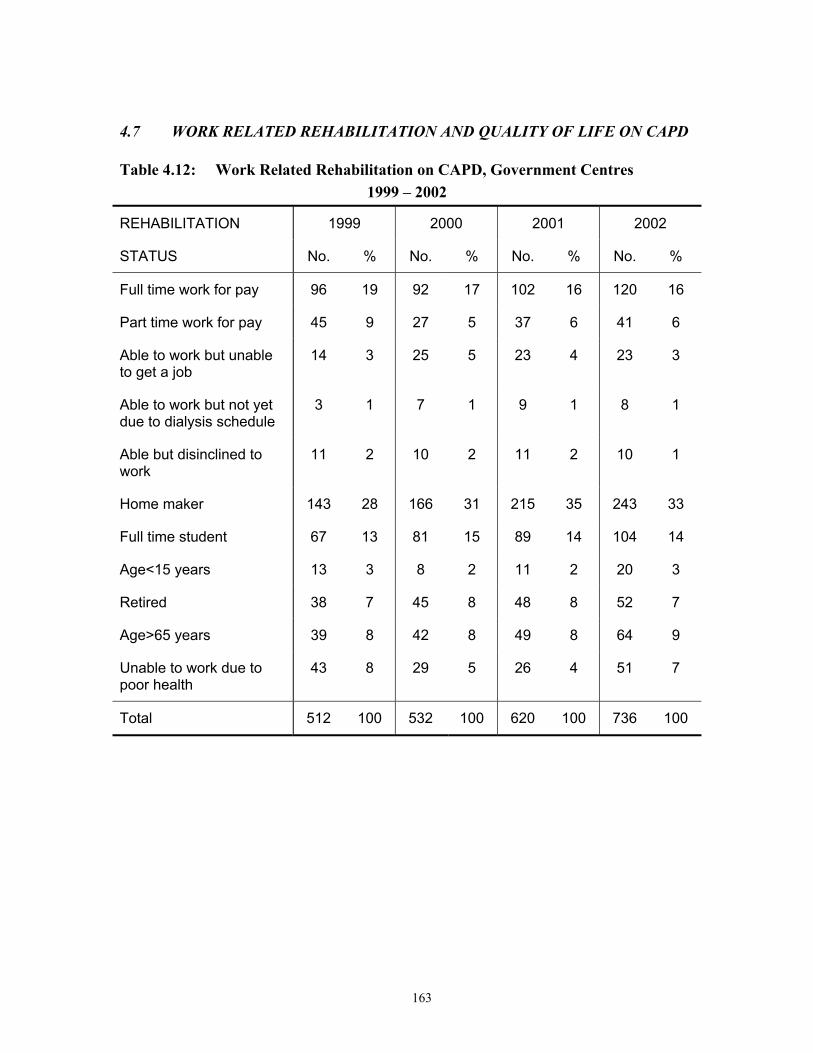
163
4.7 WORK RELATED REHABILITATION AND QUALITY OF LIFE ON CAPD
Table 4.12: Work Related Rehabilitation on CAPD, Government Centres 1999 – 2002
REHABILITATION 1999 2000 2001 2002
STATUS No. % No. % No. % No. %
Full time work for pay 96 19 92 17 102 16 120 16
Part time work for pay 45 9 27 5 37 6 41 6
Able to work but unable to get a job
14 3 25 5 23 4 23 3
Able to work but not yet due to dialysis schedule
3 1 7 1 9 1 8 1
Able but disinclined to work
11 2 10 2 11 2 10 1
Home maker 143 28 166 31 215 35 243 33
Full time student 67 13 81 15 89 14 104 14
Age<15 years 13 3 8 2 11 2 20 3
Retired 38 7 45 8 48 8 52 7
Age>65 years 39 8 42 8 49 8 64 9
Unable to work due to poor health
43 8 29 5 26 4 51 7
Total 512 100 532 100 620 100 736 100
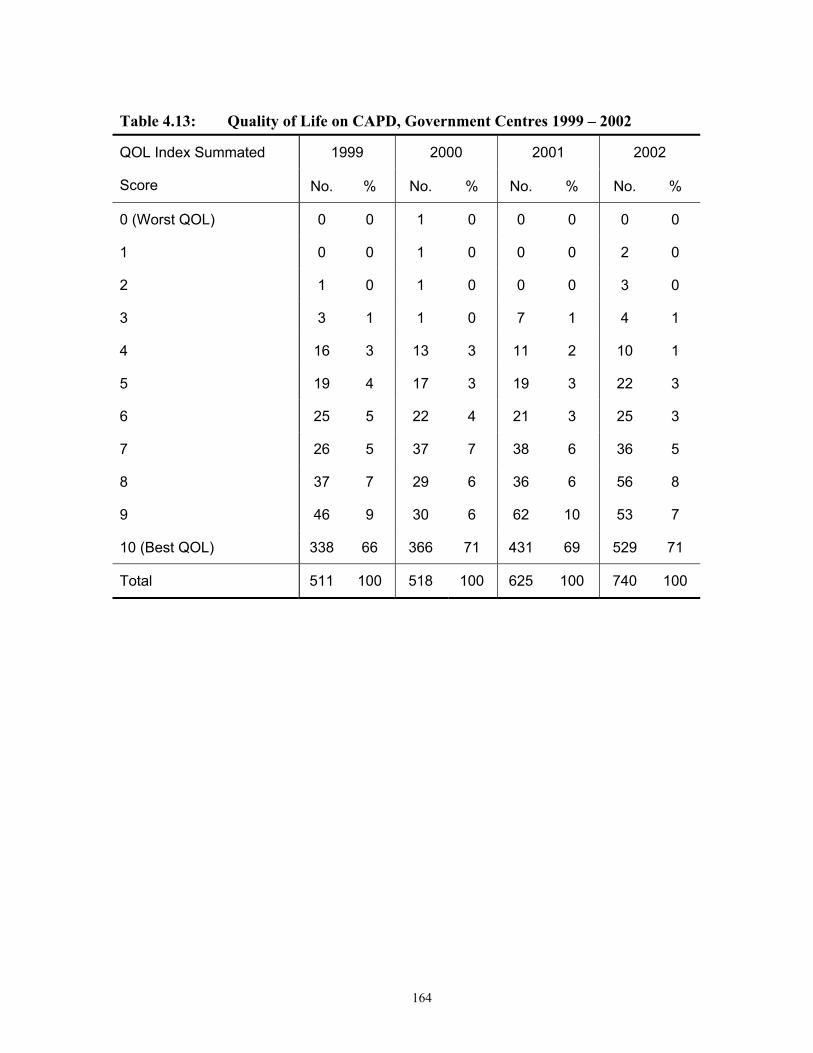
164
Table 4.13: Quality of Life on CAPD, Government Centres 1999 – 2002
1999 2000 2001 2002 QOL Index Summated
Score No. % No. % No. % No. %
0 (Worst QOL) 0 0 1 0 0 0 0 0
1 0 0 1 0 0 0 2 0
2 1 0 1 0 0 0 3 0
3 3 1 1 0 7 1 4 1
4 16 3 13 3 11 2 10 1
5 19 4 17 3 19 3 22 3
6 25 5 22 4 21 3 25 3
7 26 5 37 7 38 6 36 5
8 37 7 29 6 36 6 56 8
9 46 9 30 6 62 10 53 7
10 (Best QOL) 338 66 366 71 431 69 529 71
Total 511 100 518 100 625 100 740 100
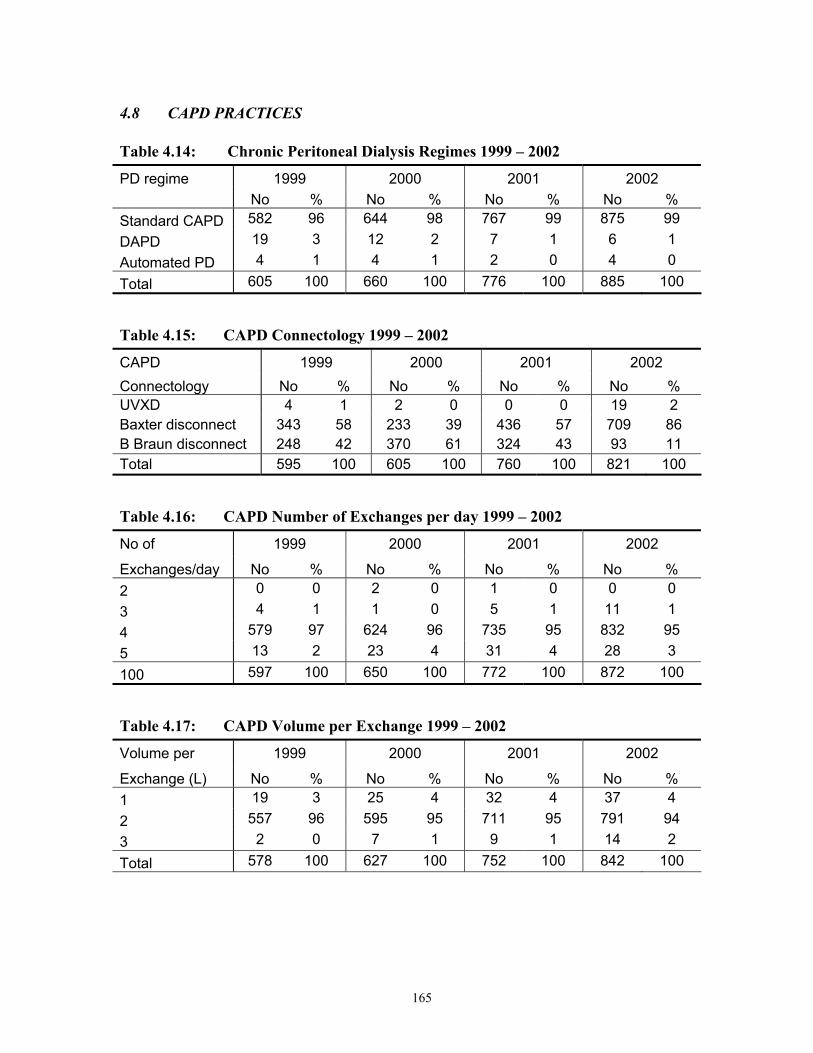
165
4.8 CAPD PRACTICES
Table 4.14: Chronic Peritoneal Dialysis Regimes 1999 – 2002
PD regime 1999 2000 2001 2002 No % No % No % No % Standard CAPD 582 96 644 98 767 99 875 99 DAPD 19 3 12 2 7 1 6 1 Automated PD 4 1 4 1 2 0 4 0 Total 605 100 660 100 776 100 885 100
Table 4.15: CAPD Connectology 1999 – 2002
CAPD 1999 2000 2001 2002 Connectology No % No % No % No % UVXD 4 1 2 0 0 0 19 2 Baxter disconnect 343 58 233 39 436 57 709 86 B Braun disconnect 248 42 370 61 324 43 93 11 Total 595 100 605 100 760 100 821 100
Table 4.16: CAPD Number of Exchanges per day 1999 – 2002
No of 1999 2000 2001 2002
Exchanges/day No % No % No % No % 2 0 0 2 0 1 0 0 0 3 4 1 1 0 5 1 11 1 4 579 97 624 96 735 95 832 95 5 13 2 23 4 31 4 28 3 100 597 100 650 100 772 100 872 100
Table 4.17: CAPD Volume per Exchange 1999 – 2002
Volume per 1999 2000 2001 2002
Exchange (L) No % No % No % No % 1 19 3 25 4 32 4 37 4 2 557 96 595 95 711 95 791 94 3 2 0 7 1 9 1 14 2 Total 578 100 627 100 752 100 842 100

166
4.9. DYSLIPIDAEMIA IN CAPD PATIENTS, GOVERNMENT CENTRES
Table 4.24: Distribution of serum Cholesterol Concentrations (mmol/L), CAPD patients, Government Centres 1999 – 2002
Year No of subjects
No of observations
Median LQ UQ % Patients < 5.3 mmol/L
1999 434 619 5.5 4.8 6.5 48
2000 526 833 5.8 4.9 6.8 40
2001 581 902 5.7 4.8 6.6 44
2002 764 1286 5.5 4.6 6.5 50
Figure 4.24: Cumulative distribution of serum cholesterol concentration by year
Cum
ulat
ive
dist
ribut
ion
Serum cholestrol (mmol/L)
1999 2000 2001 2002
1 2 3 4 5.5 7 8 9 10 12 14
.25
.5
.75
1

167
Table 4.25: Distribution of serum Triglyceride (mmol/L), CAPD patients, Government Centres 1999 – 2002
Year No of subjects
No of observations
Median LQ UQ % Patients < 3.5 mmol/L
1999 421 602 1.9 1.3 2.9 82
2000 520 819 2.1 1.4 3.1 79
2001 576 897 2 1.4 3.1 80
2002 765 1286 1.9 1.3 3.1 80
Figure 4.25: Cumulative distribution of serum triglyceride concentration by year
Cum
ulat
ive
dist
ribut
ion
Serum triglyceride (mmol/L)
1999 2000 2001 2002
1 2 3.5 5 6
.25
.5
.75
1

168
Table 4.26: Distribution of serum LDL (mmol/L), CAPD patient, Government Centres 1999 – 2002
Year No of subjects
No of observations
Median LQ UQ % Patients <5 mmol/L
1999 198 263 3.4 2.8 4.4 82
2000 271 392 3.6 2.7 4.3 88
2001 411 592 3.3 2.6 4.2 89
2002 661 1076 3.2 2.5 4.1 91
Figure 4.26: Cumulative distribution of serum LDL by year
Cum
ulat
ive
dist
ribut
ion
Serum LDL (mmol/L)
1999 2000 2001 2002
1 2 3 4 5 6 7 8 9 10
.25
.5
.75
1
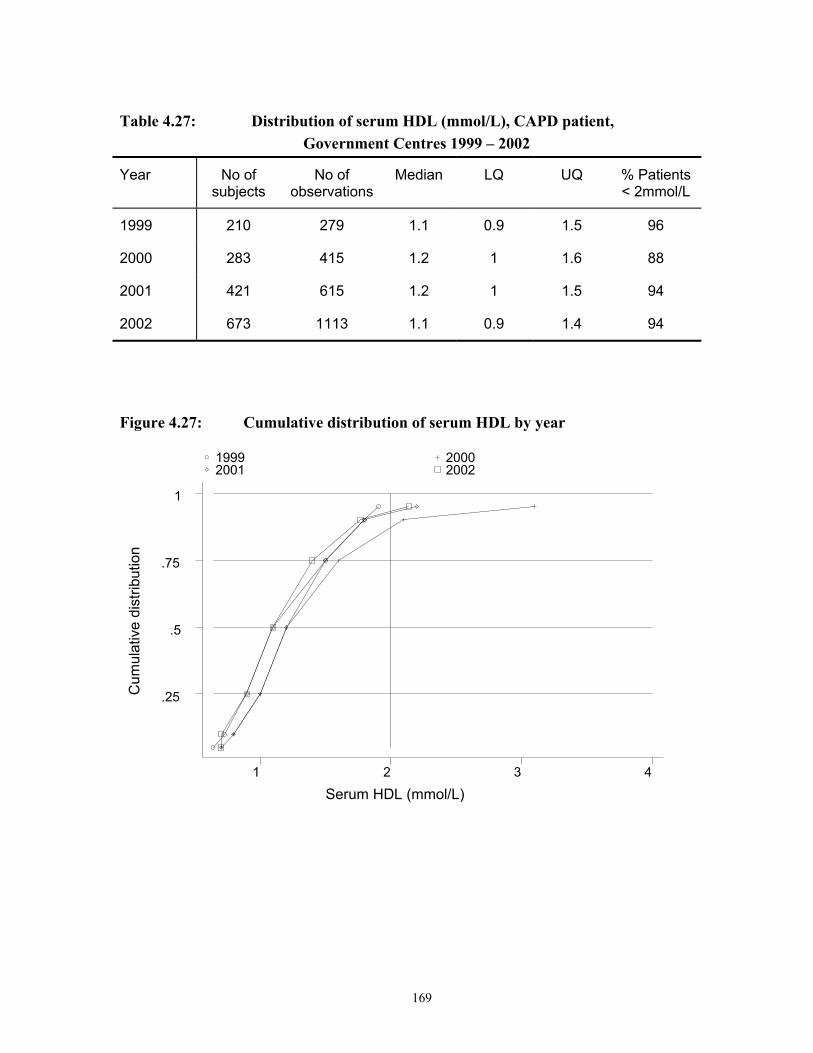
169
Table 4.27: Distribution of serum HDL (mmol/L), CAPD patient, Government Centres 1999 – 2002
Year No of subjects
No of observations
Median LQ UQ % Patients < 2mmol/L
1999 210 279 1.1 0.9 1.5 96
2000 283 415 1.2 1 1.6 88
2001 421 615 1.2 1 1.5 94
2002 673 1113 1.1 0.9 1.4 94
Figure 4.27: Cumulative distribution of serum HDL by year
Cum
ulat
ive
dist
ribut
ion
Serum HDL (mmol/L)
1999 2000 2001 2002
1 2 3 4
.25
.5
.75
1

170
4.10 MANAGEMENT OF RENAL BONE DISEASE, GOVERNMENT CENTRES
Table 4.28: Treatment for Renal Bone Disease, CAPD patients, Government Centres 1999 – 2002
Year No of subjects % on CaCO3 % on Al(OH)3 % on Vitamin D 1999 610 74 6 12 2000 662 79 2 15 2001 781 75 1 11 2002 889 80 1 15 Table 4.29: Distribution of serum Phosphate concentration (mmol/L), CAPD patients,
Government Centres 1999 – 2002
Year No of subjects
No of observations
Median LQ UQ % Patients < 1.6 mmol/L
1999 583 1783 1.6 1.3 2 51 2000 633 1879 1.5 1.2 1.9 56 2001 732 2206 1.5 1.1 1.8 60 2002 860 2706 1.5 1.2 1.9 58
Figure 4.29: Cumulative distribution of serum Phosphate by year
Cum
ulat
ive
dist
ribut
ion
Serum phosphate (mmol/L)
1999 2000 2001 2002
1 1.6 2 3 4
.25
.5
.75
1

171
Table 4.30: Distribution of serum Calcium concentration (mmol/L), CAPD patients, Government Centres 1999 – 2002
Year No of subjects
No of observations
Median LQ UQ % Patients > 2.2 & <2.6
mmol/L
1999 594 1830 2.4 2.2 2.5 55
2000 642 1954 2.4 2.2 2.5 58
2001 749 2282 2.4 2.2 2.5 59
2002 864 2753 2.3 2.2 2.5 58
Figure 4.30: Cumulative distribution of serum Calcium concentration by year
Cum
ulat
ive
dist
ribut
ion
Serum calcium (mmol/L)
1999 2000 2001 2002
1 2 2.2 2.6 3 4
.25
.5
.75
1

172
Table 4.31: Distribution of serum iPTH (ng/L) concentration, CAPD patients, Government Centres 1999 – 2002
Year No of subjects
No of observations
Median LQ UQ % Patients > 100 & < 250
ng/L
1999 365 482 56 18 168 17
2000 406 555 43 11.8 110 18
2001 531 740 50 14 144 20
2002 679 997 82 24 196 23
Figure 4.31: Cumulative Distribution of serum iPTH by year
Cum
ulat
ive
dist
ribut
ion
Serum intact PTH (ng/L)
1999 2000 2001 2002
0 50 100 250 500 750 1000
.25
.5
.75
1

173
4.11 MANAGEMENT OF BLOOD PRESSURE, GOVERNMENT CENTRES
Table 4.32: Treatment for hypertension, CAPD patients, Government Centres 1999 – 2002
Year No. % on anti-hypertensives
% on 1 anti-hypertensives
% on 2 anti-hypertensives
% on 3 anti- hypertensives
1999 610 82 30 33 19 2000 662 78 31 27 20 2001 781 76 31 28 18 2002 889 81 31 31 19
Table 4.33: Distribution of Systolic BP without anti-hypertensives, CAPD patients, Government Centres 1999 – 2002
Year No of subjects
No of observations
Median LQ UQ % Patients < 160 mmHg
1999 98 699 120 110 142 87 2000 141 1114 120 110 138 91 2001 165 1322 127 110 140 92 2002 156 1191 123 110 140 91
Figure 4.33: Cumulative distribution of Systolic BP without anti-hypertensives by year
Cum
ulat
ive
dist
ribut
ion
Systolic BP (mmHg)
1999 2000 2001 2002
60 90 120 140 160 200
.25
.5
.75
1
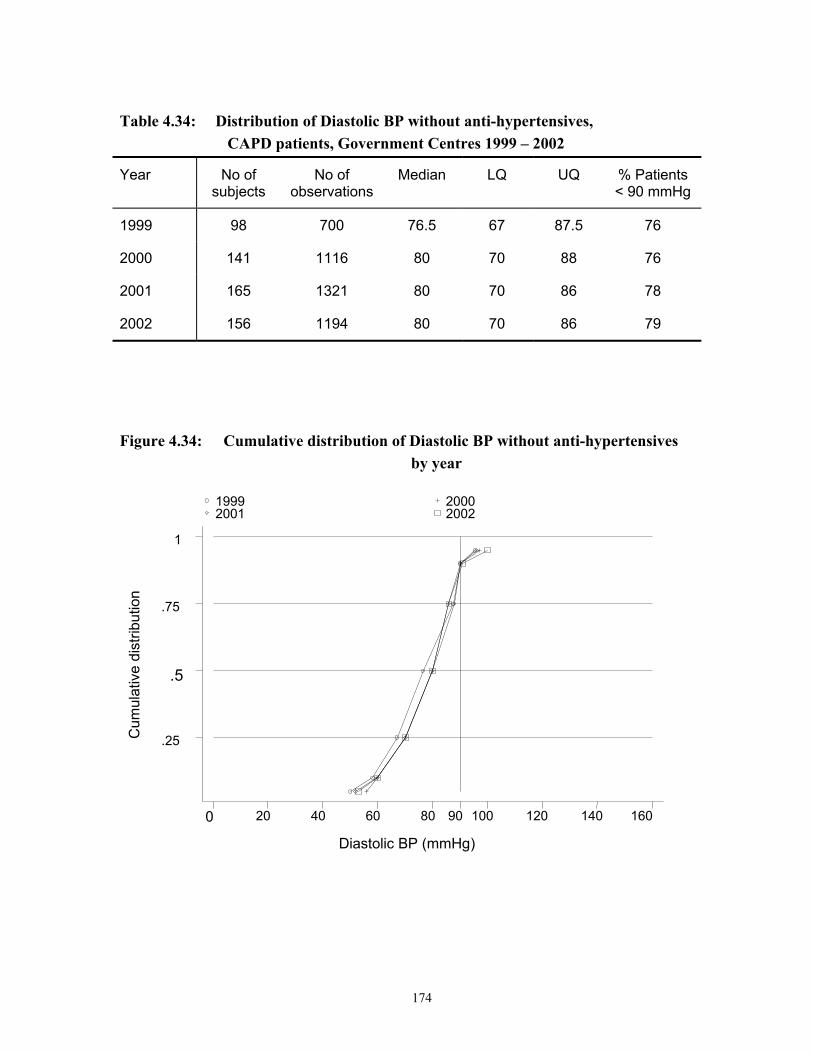
174
Table 4.34: Distribution of Diastolic BP without anti-hypertensives, CAPD patients, Government Centres 1999 – 2002
Year No of subjects
No of observations
Median LQ UQ % Patients < 90 mmHg
1999 98 700 76.5 67 87.5 76
2000 141 1116 80 70 88 76
2001 165 1321 80 70 86 78
2002 156 1194 80 70 86 79
Figure 4.34: Cumulative distribution of Diastolic BP without anti-hypertensives by year
Cum
ulat
ive
dist
ribut
ion
Diastolic BP (mmHg)
1999 2000 2001 2002
0 20 40 60 80 90 100 120 140 160
.25
.5
.75
1

175
Table 4.35: Distribution of systolic BP on anti-hypertensives CAPD patients, Government Centres 1999 – 2002
Year No of subjects
No of observations
Median LQ UQ % Patients < 160 mmHg
1999 478 3833 140 130 160 72
2000 497 4188 140 123 158 76
2001 574 4669 140 124 159 75
2002 685 5759 140 128 157 76
Figure 4.35: Cumulative distribution of systolic BP on anti-hypertensives by year
Cum
ulat
ive
dist
ribut
ion
Systolic BP (mmHg)
1999 2000 2001 2002
60 90 120 140 160 200
.25
.5
.75
1
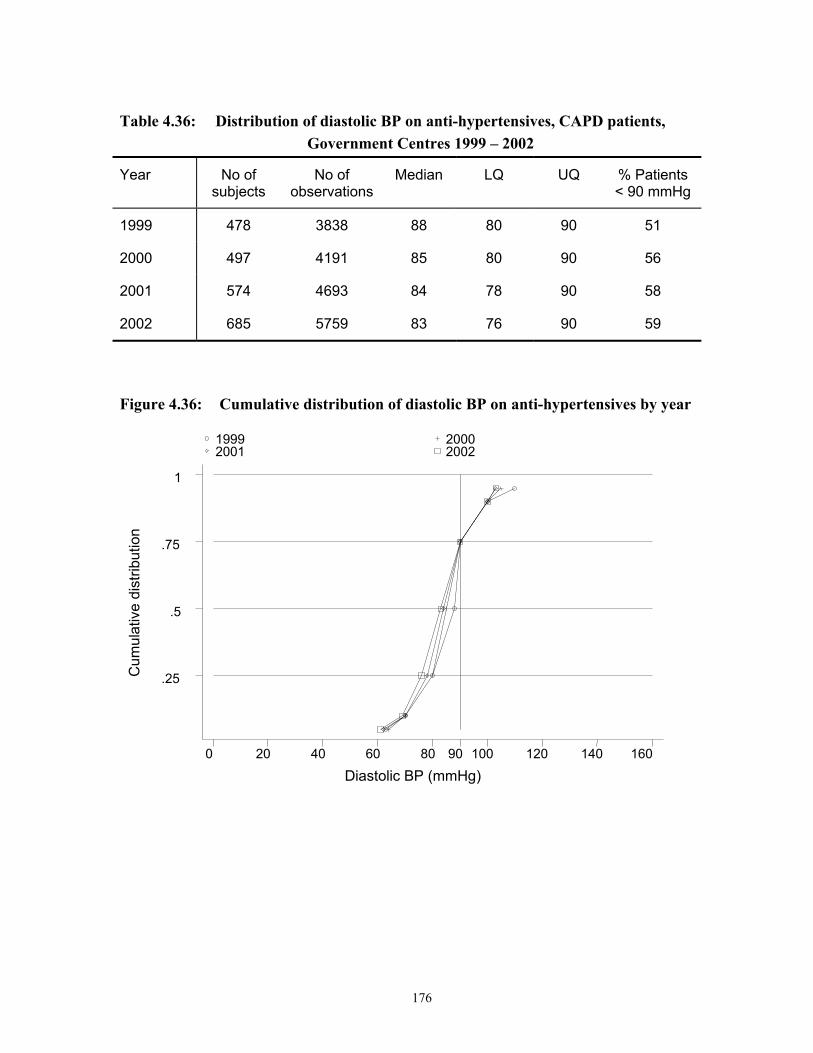
176
Table 4.36: Distribution of diastolic BP on anti-hypertensives, CAPD patients, Government Centres 1999 – 2002
Year No of subjects
No of observations
Median LQ UQ % Patients < 90 mmHg
1999 478 3838 88 80 90 51
2000 497 4191 85 80 90 56
2001 574 4693 84 78 90 58
2002 685 5759 83 76 90 59
Figure 4.36: Cumulative distribution of diastolic BP on anti-hypertensives by year
Cum
ulat
ive
dist
ribut
ion
Diastolic BP (mmHg)
1999 2000 2001 2002
0 20 40 60 80 90 100 120 140 160
.25
.5
.75
1
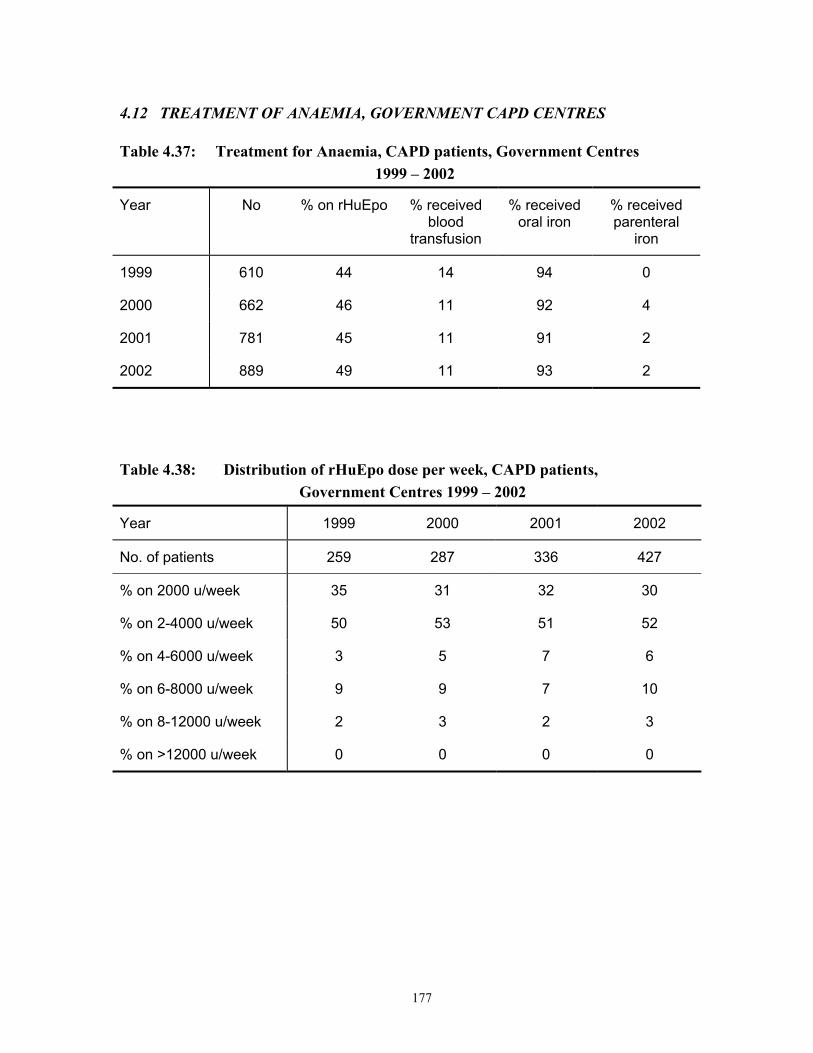
177
4.12 TREATMENT OF ANAEMIA, GOVERNMENT CAPD CENTRES
Table 4.37: Treatment for Anaemia, CAPD patients, Government Centres 1999 – 2002
Year No % on rHuEpo % received blood
transfusion
% received oral iron
% received parenteral
iron
1999 610 44 14 94 0
2000 662 46 11 92 4
2001 781 45 11 91 2
2002 889 49 11 93 2
Table 4.38: Distribution of rHuEpo dose per week, CAPD patients, Government Centres 1999 – 2002
Year 1999 2000 2001 2002
No. of patients 259 287 336 427
% on 2000 u/week 35 31 32 30
% on 2-4000 u/week 50 53 51 52
% on 4-6000 u/week 3 5 7 6
% on 6-8000 u/week 9 9 7 10
% on 8-12000 u/week 2 3 2 3
% on >12000 u/week 0 0 0 0

178
Table 4.39: Distribution of serum Iron concentration without rHuEpo, CAPD patients, Government Centres 1999 – 2002
Year No of subjects
No of observations
Median LQ UQ % Patients > 10 umol/L
1999 202 470 15 11 26 78
2000 255 549 15.8 10 23 75
2001 314 652 17 11 33 80
2002 361 804 15.3 10 23 74
Figure 4.39: Cumulative distribution of serum Iron without rHuEpo by year
Cum
ulat
ive
dist
ribut
ion
Serum iron (umol/L)
1999 2000 2001 2002
0 5 10 15 20 25 30 40 50
.25
.5
.75
1

179
Table 4.40: Distribution of serum Iron concentration on rHuEpo, CAPD patients, Government Centres 1999 – 2002
Year No of subjects
No of observations
Median LQ UQ % Patients > 10 umol/L
1999 143 392 18 11 28 81
2000 244 557 15 10 25 73
2001 306 718 17 11 32 77
2002 376 994 15 10.8 23 77
Figure 4.40: Cumulative distribution of serum Iron concentration on rHuEpo by year.
Cum
ulat
ive
dist
ribut
ion
Serum iron (umol/L)
1999 2000 2001 2002
0 5 10 15 20 25 30 40 50
.25
.5
.75
1

180
Table 4.41: Distribution of serum Transferrin Saturation without rHuEpo, CAPD patients, Government Centres 1999 – 2002
Year No of subjects
No of observations
Median LQ UQ % Patients > 20%
1999 134 536 34.2 23.3 45.1 85
2000 234 936 35.3 22.4 50 80
2001 262 1048 38.7 26.8 60 88
2002 309 1236 36.4 24.8 57.4 85
Figure 4.41: Cumulative distribution of serum Transferrin Saturation without rHuEpo by year
Cum
ulat
ive
dist
ribut
ion
Serum transferrin saturation (%)
1999 2000 2001 2002
0 10 20 30 40 50 60 70 80
.25
.5
.75
1
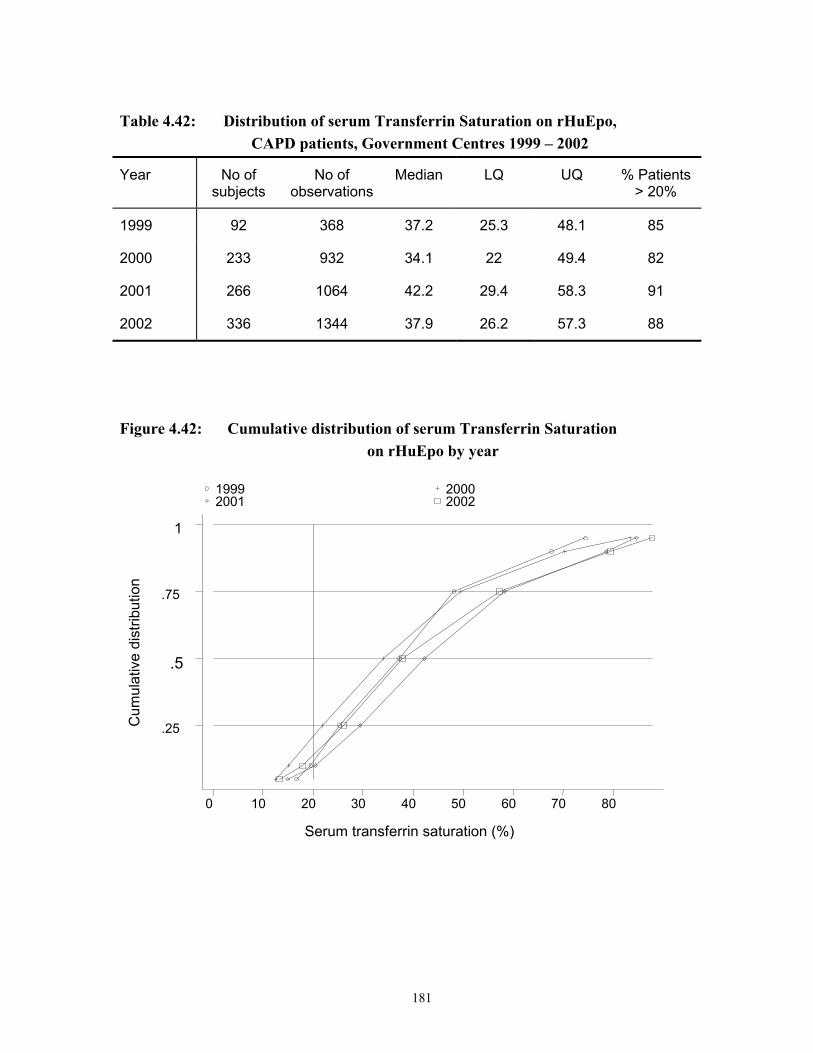
181
Table 4.42: Distribution of serum Transferrin Saturation on rHuEpo, CAPD patients, Government Centres 1999 – 2002
Year No of subjects
No of observations
Median LQ UQ % Patients > 20%
1999 92 368 37.2 25.3 48.1 85
2000 233 932 34.1 22 49.4 82
2001 266 1064 42.2 29.4 58.3 91
2002 336 1344 37.9 26.2 57.3 88
Figure 4.42: Cumulative distribution of serum Transferrin Saturation on rHuEpo by year
Cum
ulat
ive
dist
ribut
ion
Serum transferrin saturation (%)
1999 2000 2001 2002
0 10 20 30 40 50 60 70 80
.25
.5
.75
1

182
Table 4.43: Distribution of serum Ferritin without rHuEpo, CAPD patients, Government Centres 1999 – 2002
Year No of subjects
No of observations
Median LQ UQ % Patients > 100 ug/L
1999 124 154 482 259.7 729 93
2000 144 204 462 167.5 726.3 86
2001 223 317 432 225.5 763 91
2002 235 364 485.6 209.3 905.6 92
Figure 4.43: Cumulative distribution of serum Ferritin without rHuEpo by year
Cum
ulat
ive
dist
ribut
ion
Serum ferritin (ug/L)
1999 2000 2001 2002
0 50 100 200 400 600 800
.25
.5
.75
1

183
Table 4.44: Distribution of serum Ferritin concentration on rHuEpo, CAPD patients, Government Centres 1999 – 2002
Year No of subjects
No of observations
Median LQ UQ % Patients > 100 ug/L
1999 136 201 553.3 254 857.3 93
2000 180 271 545 292.9 839.5 90
2001 261 418 548.1 266.8 902 91
2002 344 587 542.3 271 927 93
Figure 4.44: Cumulative distribution of serum Ferritin concentration on rHuEpo, by year
Cum
ulat
ive
dist
ribut
ion
Serum ferritin (ug/L)
1999 2000 2001 2002
0 50 100 200 400 600 800
.25
.5
.75
1

184
Table 4.45: Distribution of Haemoglobin concentration without rHuEpo, CAPD patients, Government Centres 1999 – 2002
Year No of subjects
No of observations
Median LQ UQ % Patients <10 g/dL
% Patients >10 & <12
g/dL
% Patients >12 g/dL
1999 336 967 9.4 8.3 10.7 61 32 7
2000 342 960 9.8 8.6 11 53 35 12
2001 405 1084 9.8 8.6 11.1 55 33 12
2002 433 1206 9.8 8.7 11.1 53 34 13
Figure 4.45: Cumulative distribution of haemoglobin concentration without rHuEpo by year
Cum
ulat
ive
dist
ribut
ion
Hb (g/dL)
1999 2000 2001 2002
0 2 4 6 8 10 12 16 20
.25
.5
.75
1
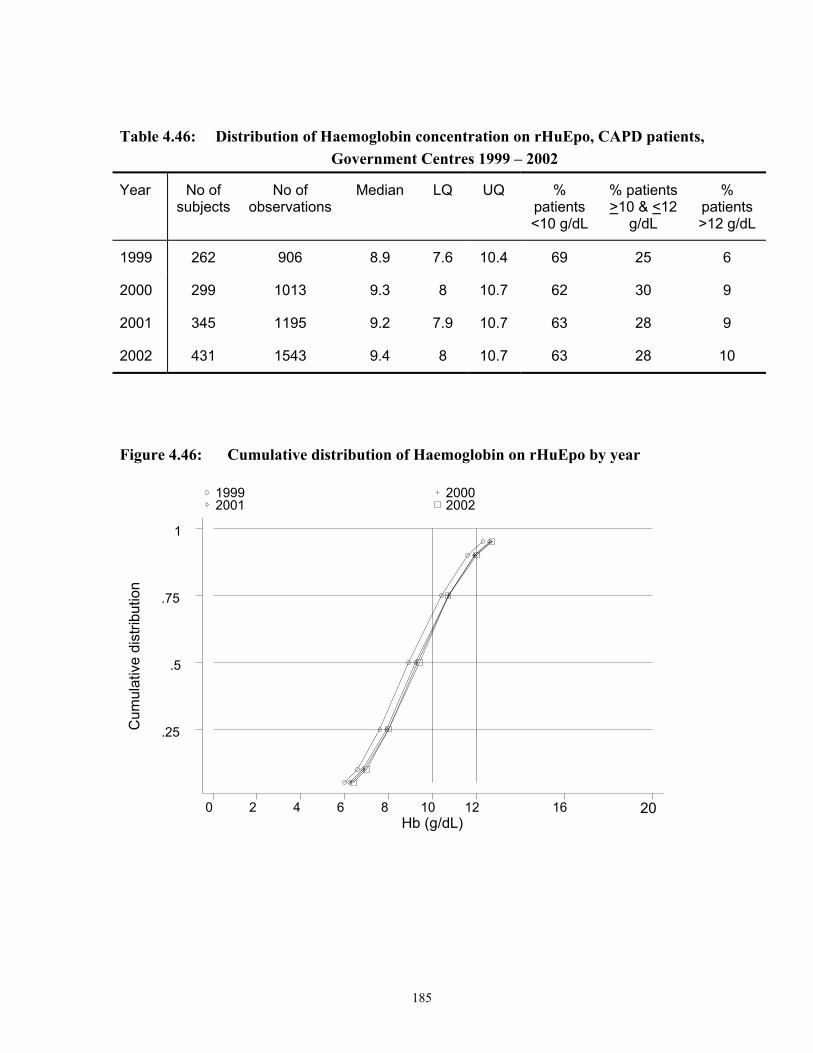
185
Table 4.46: Distribution of Haemoglobin concentration on rHuEpo, CAPD patients, Government Centres 1999 – 2002
Year No of subjects
No of observations
Median LQ UQ % patients <10 g/dL
% patients >10 & <12
g/dL
% patients >12 g/dL
1999 262 906 8.9 7.6 10.4 69 25 6
2000 299 1013 9.3 8 10.7 62 30 9
2001 345 1195 9.2 7.9 10.7 63 28 9
2002 431 1543 9.4 8 10.7 63 28 10
Figure 4.46: Cumulative distribution of Haemoglobin on rHuEpo by year
Cum
ulat
ive
dist
ribut
ion
Hb (g/dL)
1999 2000 2001 2002
0 2 4 6 8 10 12 16 20
.25
.5
.75
1

186
4.13 NUTRITIONAL STATUS OF CAPD PATIENTS, GOVERNMENT CENTRES
Table 4.47: Distribution of serum Albumin concentration (g/L), CAPD patients, Government Centres 1999 – 2002
Year No of subjects
No of observations
Median LQ UQ % Patients >40g/L
1999 597 1872 35 31 38 18
2000 640 1970 35 31 39 19
2001 750 2301 34 30 38 15
2002 860 2772 34 31 38 16
Figure 4.47: Cumulative distribution of serum Albumin concentration by year
Cum
ulat
ive
dist
ribut
ion
Serum albumin (g/L)
1999 2000 2001 2002
20 30 35 40 50 60
.25
.5
.75
1

187
Table 4.48: Distribution of Body Mass Index CAPD patients, Government Centres 1999 – 2002
Year No of subjects
No of observations
Median LQ UQ % Patients <18.5
% Patients >18.5 &
<25
% Patients
>25
1999 550 4316 21.5 19 24.7 22 56 23
2000 599 4990 21.5 18.6 24.8 25 53 23
2001 655 5525 21.9 18.7 25.3 23 50 27
2002 738 6240 22.2 18.9 25.8 22 48 31
Figure 4.48: Cumulative distribution of BMI by year
Cum
ulat
ive
dist
ribut
ion
BMI (Kg/M2)
1999 2000 2001 2002
10 15 18.5 25 30 35 40
.25
.5
.75
1

188
4.14 SEROLOGICAL STATUS, CAPD PATIENTS, GOVERNMENT CENTRES
Table 4.49: Prevalence of positive anti-HCV and HBsAg CAPD patients, Government Centres 1999 – 2002
Year No % HBsAg positive % anti-HCV positive
1999 610 2 5
2000 662 2 5
2001 781 2 3
2002 889 3 4
Figure 4.49: Prevalence of positive anti-HCV and HBsAg CAPD patients, Government Centres 1999 – 2002
Prev
alen
ce %
Year
0
5
10
15
20
25
30 HBsAg anti-HCV
1999 2000 2001 2002
189
RENAL TRANSPLANTATION
Stock and Flow
Place and Type of Transplant
Death after Transplantation and Graft Failure
Centres of Follow-up
Characteristics of Transplant Patients
Survival Analysis
Work related Rehabilitation and Quality of Life
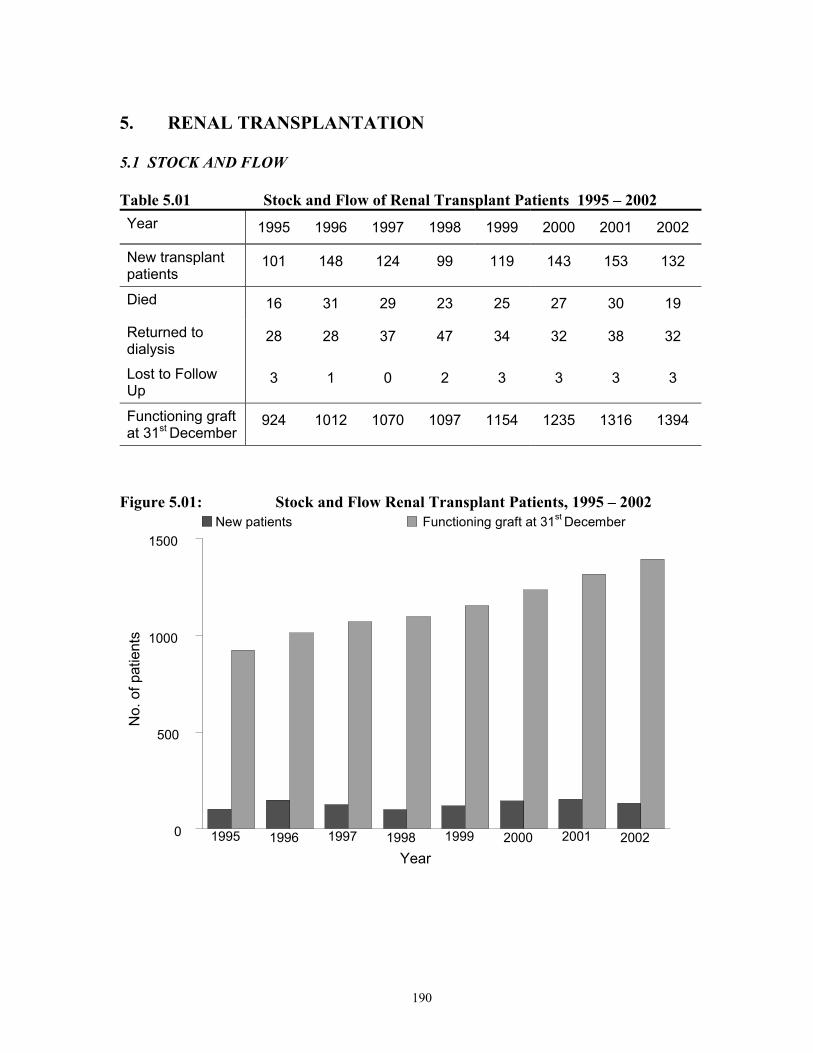
190
5. RENAL TRANSPLANTATION
5.1 STOCK AND FLOW Table 5.01 Stock and Flow of Renal Transplant Patients 1995 – 2002 Year 1995 1996 1997 1998 1999 2000 2001 2002
New transplant patients
101 148 124 99 119 143 153 132
Died 16 31 29 23 25 27 30 19
Returned to dialysis
28 28 37 47 34 32 38 32
Lost to Follow Up
3 1 0 2 3 3 3 3
Functioning graft at 31st December
924 1012 1070 1097 1154 1235 1316 1394
Figure 5.01: Stock and Flow Renal Transplant Patients, 1995 – 2002
No.
of p
atie
nts
0
500
1000
1500 New patients Functioning graft at 31st December
1995 1996 1997 1998 1999 2000 2001 2002 Year
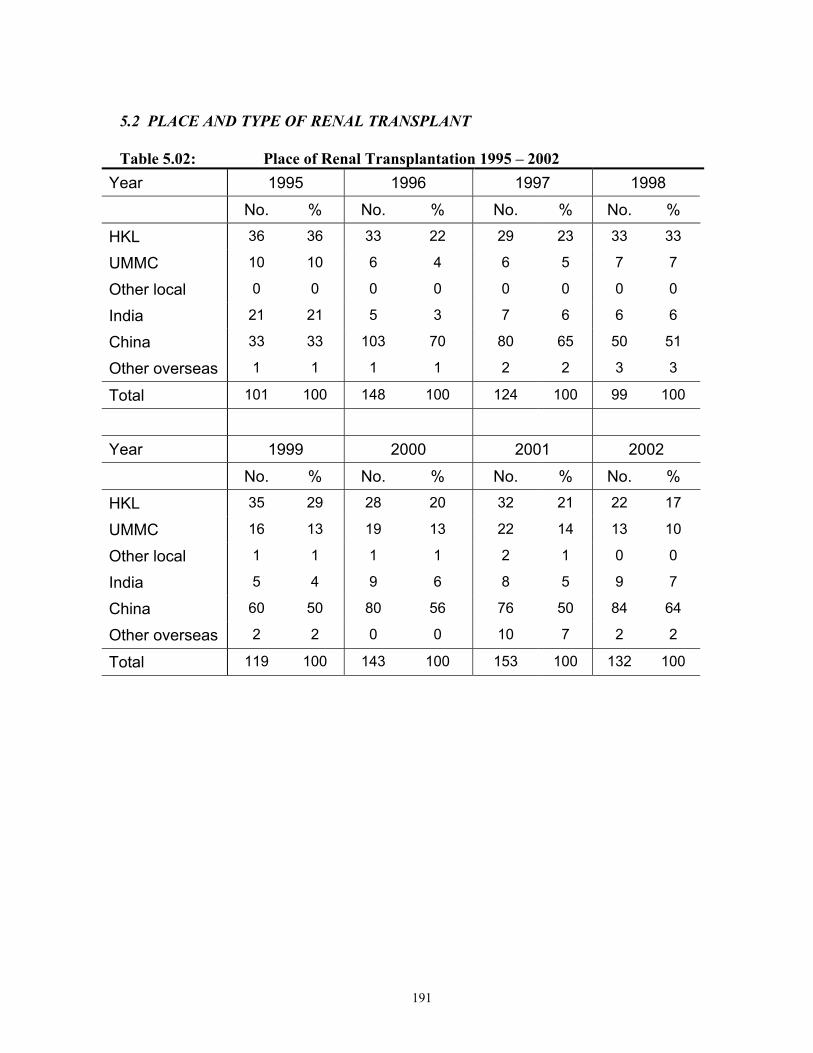
191
5.2 PLACE AND TYPE OF RENAL TRANSPLANT Table 5.02: Place of Renal Transplantation 1995 – 2002
Year 1995 1996 1997 1998
No. % No. % No. % No. %
HKL 36 36 33 22 29 23 33 33
UMMC 10 10 6 4 6 5 7 7
Other local 0 0 0 0 0 0 0 0
India 21 21 5 3 7 6 6 6
China 33 33 103 70 80 65 50 51
Other overseas 1 1 1 1 2 2 3 3
Total 101 100 148 100 124 100 99 100
Year 1999 2000 2001 2002
No. % No. % No. % No. %
HKL 35 29 28 20 32 21 22 17
UMMC 16 13 19 13 22 14 13 10
Other local 1 1 1 1 2 1 0 0
India 5 4 9 6 8 5 9 7
China 60 50 80 56 76 50 84 64
Other overseas 2 2 0 0 10 7 2 2
Total 119 100 143 100 153 100 132 100
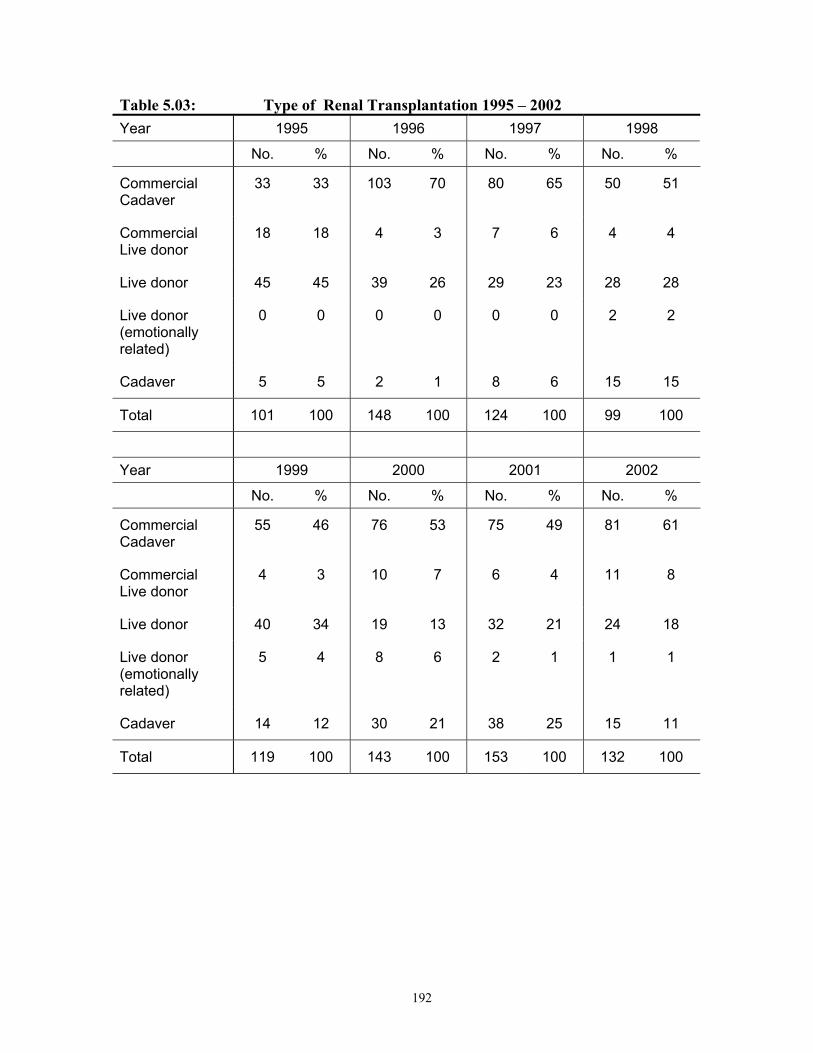
192
Table 5.03: Type of Renal Transplantation 1995 – 2002 Year 1995 1996 1997 1998
No. % No. % No. % No. %
Commercial Cadaver
33 33 103 70 80 65 50 51
Commercial Live donor
18 18 4 3 7 6 4 4
Live donor 45 45 39 26 29 23 28 28
Live donor (emotionally related)
0 0 0 0 0 0 2 2
Cadaver 5 5 2 1 8 6 15 15
Total 101 100 148 100 124 100 99 100
Year 1999 2000 2001 2002
No. % No. % No. % No. %
Commercial Cadaver
55 46 76 53 75 49 81 61
Commercial Live donor
4 3 10 7 6 4 11 8
Live donor 40 34 19 13 32 21 24 18
Live donor (emotionally related)
5 4 8 6 2 1 1 1
Cadaver 14 12 30 21 38 25 15 11
Total 119 100 143 100 153 100 132 100

193
5.3 DEATH AFTER TRANSPLANTATION AND GRAFT FAILURE Table 5.04: Transplant Patients Death Rate and Graft Loss 1995 – 2002 Year 1995 1996 1997 1998 1999 2000 2001 2002
No. at risk 924 968 1041 1084 1126 1195 1276 1355
Transplant death 16 31 29 23 25 27 30 19
Transplant death rate % 2 3 3 2 2 2 2 1
Graft loss 28 28 37 47 34 32 38 32
Graft loss % 3 3 4 4 3 3 3 2
All losses 44 59 66 70 59 59 68 51
All losses rate % 5 6 6 6 5 5 5 4
Figure 5.04: Transplant Recipient Death Rate 1995– 2002
Dea
th ra
te %
0
10
20
30 Annual death rate
1995 1996 1997 1998 1999 2000 2001 2002 Year

194
Table 5.05: Causes of Death in Transplant Recipients 1999 – 2002 Year 1999 2000 2001 2002 No % No % No % No %
Cardiovascular 3 12 10 37 6 20 5 26
Died at home 4 16 0 0 4 13 3 16
Sepsis 7 28 9 33 17 57 3 16
GIT bleeding 1 4 1 4 0 0 0 0
Cancer 3 12 2 7 2 7 4 21
Liver disease 1 4 1 4 0 0 1 5
Others 3 12 4 15 1 3 3 16
Unknown 3 12 0 0 0 0 0 0
Total 25 100 27 100 30 100 19 100
Table 5.06: Causes of Graft Failure 1999 – 2002 Year 1999 2000 2001 2002
No. % No. % No. % No. %
Rejection 22 65 19 59 22 58 19 59
Cyclosporine/ drug toxicity
0 0 0 0 0 0 1 3
Ureteric obstruction
0 0 0 0 0 0 0 0
Vascular causes(stenosis/ thrombosis)
1 3 3 9 1 3 0 0
Renal disease, recurrent/de novo
0 0 0 0 2 5 1 3
Technical complication
0 0 3 9 1 3 0 0
Others 0 0 3 9 1 3 1 3
Unknown 11 32 4 13 11 29 10 31
Total 34 100 32 100 38 100 32 100
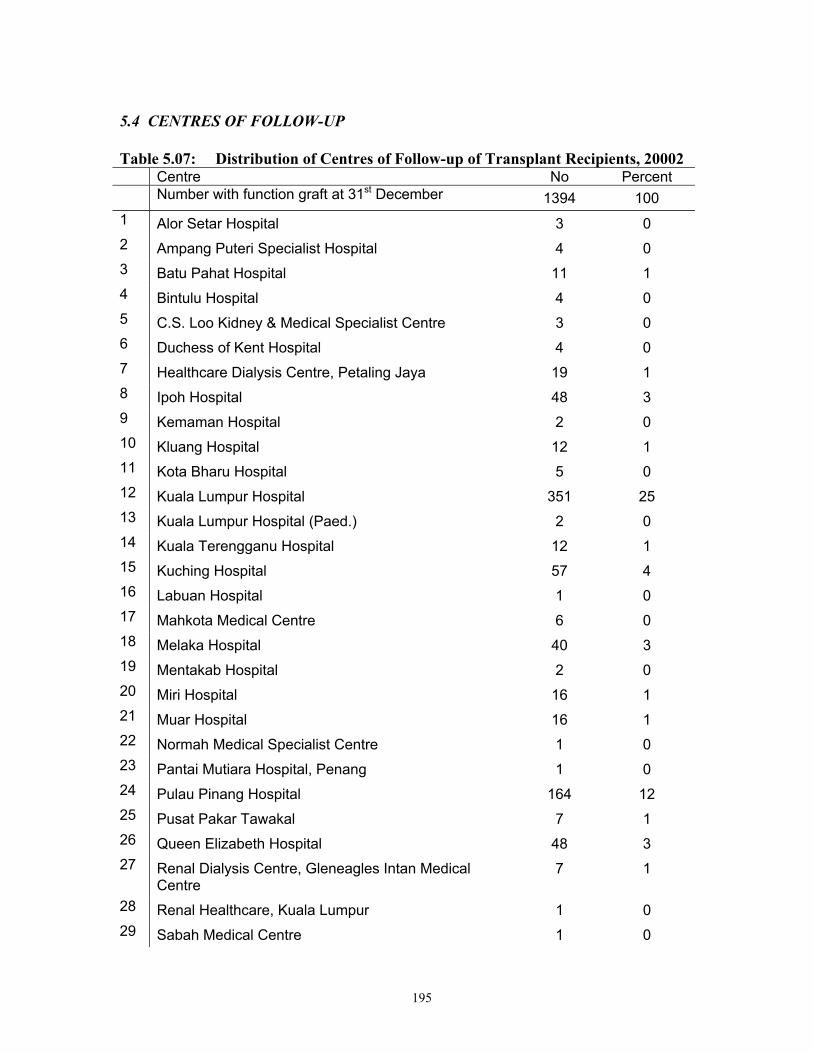
195
5.4 CENTRES OF FOLLOW-UP Table 5.07: Distribution of Centres of Follow-up of Transplant Recipients, 20002 Centre No Percent Number with function graft at 31st December 1394 100 1 Alor Setar Hospital 3 0 2 Ampang Puteri Specialist Hospital 4 0 3 Batu Pahat Hospital 11 1 4 Bintulu Hospital 4 0 5 C.S. Loo Kidney & Medical Specialist Centre 3 0 6 Duchess of Kent Hospital 4 0 7 Healthcare Dialysis Centre, Petaling Jaya 19 1 8 Ipoh Hospital 48 3 9 Kemaman Hospital 2 0 10 Kluang Hospital 12 1 11 Kota Bharu Hospital 5 0 12 Kuala Lumpur Hospital 351 25 13 Kuala Lumpur Hospital (Paed.) 2 0 14 Kuala Terengganu Hospital 12 1 15 Kuching Hospital 57 4 16 Labuan Hospital 1 0 17 Mahkota Medical Centre 6 0 18 Melaka Hospital 40 3 19 Mentakab Hospital 2 0 20 Miri Hospital 16 1 21 Muar Hospital 16 1 22 Normah Medical Specialist Centre 1 0 23 Pantai Mutiara Hospital, Penang 1 0 24 Pulau Pinang Hospital 164 12 25 Pusat Pakar Tawakal 7 1 26 Queen Elizabeth Hospital 48 3 27 Renal Dialysis Centre, Gleneagles Intan Medical
Centre 7 1
28 Renal Healthcare, Kuala Lumpur 1 0 29 Sabah Medical Centre 1 0

196
30 Segamat Hospital 10 1 31 Selangor Medical Centre 2 0 32 Selayang Hospital 29 2 33 Seremban Hospital 34 2 34 Sibu Hospital 30 2 35 Subang Jaya Medical Centre 18 1 36 Sultanah Aminah Hospital 149 11 37 Sunway Medical Centre 1 0 38 Taiping Hospital 2 0 39 Tawau Hospital 5 0 40 Teluk Intan Hospital 1 0 41 Tengku Ampuan Afzan Hospital, Kuantan 30 2 42 Tengku Ampuan Rahimah Hospital, Klang 55 4 43 Timberland Medical Centre 13 1 44 Universiti Kebangsaan Malaysia Hospital 7 1 45 Universiti Sains Malaysia Hospital 3 0 46 University Malaya Medical Centre 157 11

197
5.5 TRANSPLANT RECIPIENTS’ CHARACTERISTICS Table 5.08: Percentage age distribution of transplant recipients 1999 – 2002 Year 1999 2000 2001 2002
New transplant patients 119 143 153 132
1-14 years 2 0 5 3
15-24 years 9 9 14 6
25-34 years 22 13 22 6
35-44 years 28 24 27 39
45-54 years 28 40 14 23
55-64 years 12 7 16 19
>65 years 0 7 3 3 Functioning graft at 31st December
1154 1235 1316 1394
1-14 years 3 3 3 3
15-24 years 14 13 13 13
25-34 years 31 31 29 29
35-44 years 30 30 30 30
45-54 years 16 17 18 19
55-64 years 5 5 5 6
>65 years 0 0 1 1 Table 5.09: Renal Transplant Recipients’ Characteristics 1999 – 2002 Year 1999 2000 2001 2002
New transplant patients 119 143 153 132
Mean age + sd 40 + 12 43 + 13 39 + 15 44 + 13
% Male 71 60 73 45
% Diabetic 17 20 16 16
% HBsAg+ 3 4 0 6
% Anti-HCV+ 3 2 8 0

198
5.6 SURVIVAL ANALYSIS Table 5.10: Transplant Patient Survival related to Year of Transplant 1997 – 2002 Year 1997 1998 1999 Interval (months)
% survival SE No % survival SE No % survival SE No
6 97 2 116 95 2 99 1 117 12 95 2 113 95 2 99 1 116 24 94 2 110 95 2 98 1 113 36 91 3 101 95 2 97 2 48 88 3 96 95 2 60 87 3 92 Year 2000 2001 2002 Interval (months)
% survival SE No % survival SE No % survival SE No
6 95 2 130 96 2 145 96 2 12 94 2 128 95 2 24 92 2 No. = number at risk SE = standard error
Figure 5.10: Transplant Patient Survival by Year of Transplant 1997 – 2002 Kaplan-Meier survival estimates, by Year
Cum
ulat
ive
surv
ival
Duration in months0 12 24 36 48 60
0.00
0.25
0.50
0.75
1.00 Yr 1998Yr 1999
Yr 2000
Yr 2001Yr 2002

199
Table 5.11:Transplant Allograft Survival related to Year of Transplant 1997 – 2002 Year 1997 1998 1999 Interval (months)
% survival SE No % survival SE No % survival SE No
6 93 2 116 87 3 87 97 1 116 12 90 3 113 87 3 86 97 1 115 24 87 3 109 87 3 85 96 2 113 36 81 3 101 83 4 82 93 2 93 48 77 4 96 83 4 60 76 4 92 Year 2000 2001 2002 Interval (months)
% survival SE No % survival SE No % survival SE No
6 91 2 131 94 2 145 95 2 12 89 3 128 93 2 106 24 85 3 110 No. = number at risk SE = standard error
Figure 5.11: Transplant Allograft Survival by Year of Transplant 1997-2002 Kaplan-Meier survival estimates, by Year
Cum
ulat
ive
surv
ival
Duration in months
0 12 24 36 48 60 0.00
0.25
0.50
0.75
1.00
Yr 1998
Yr 1999
Yr 2000
Yr 2001
Yr 2002
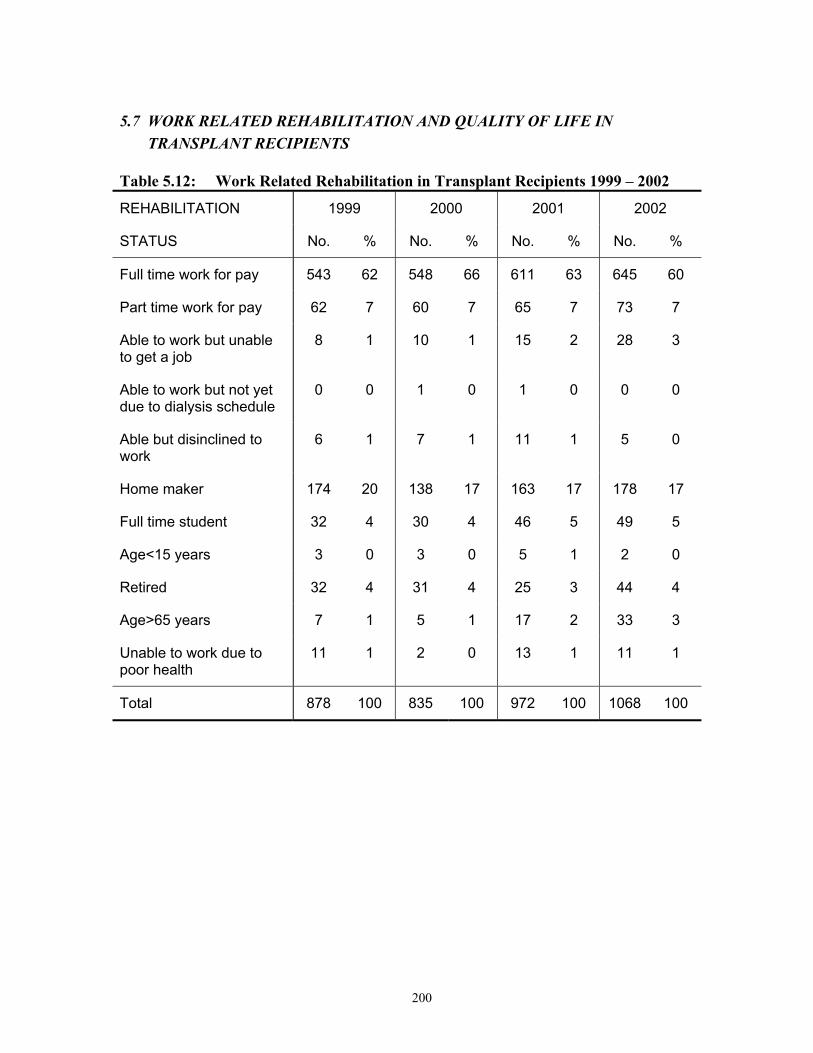
200
5.7 WORK RELATED REHABILITATION AND QUALITY OF LIFE IN TRANSPLANT RECIPIENTS Table 5.12: Work Related Rehabilitation in Transplant Recipients 1999 – 2002
REHABILITATION 1999 2000 2001 2002
STATUS No. % No. % No. % No. %
Full time work for pay 543 62 548 66 611 63 645 60
Part time work for pay 62 7 60 7 65 7 73 7
Able to work but unable to get a job
8 1 10 1 15 2 28 3
Able to work but not yet due to dialysis schedule
0 0 1 0 1 0 0 0
Able but disinclined to work
6 1 7 1 11 1 5 0
Home maker 174 20 138 17 163 17 178 17
Full time student 32 4 30 4 46 5 49 5
Age<15 years 3 0 3 0 5 1 2 0
Retired 32 4 31 4 25 3 44 4
Age>65 years 7 1 5 1 17 2 33 3
Unable to work due to poor health
11 1 2 0 13 1 11 1
Total 878 100 835 100 972 100 1068 100

201
Table 5.13: Quality of Life, Transplant recipients 1999 – 2002
1999 2000 2001 2002 QOL Index Summated
Score No. % No. % No. % No. %
0 (Worst QOL) 0 0 0 0 0 0 0 0
1 0 0 0 0 0 0 0 0
2 0 0 0 0 0 0 0 0
3 0 0 0 0 4 0 1 0
4 0 0 2 0 0 0 1 0
5 1 0 0 0 4 0 2 0
6 4 0 2 0 4 0 2 0
7 8 1 1 0 5 1 13 1
8 5 1 12 1 16 2 21 2
9 9 1 23 3 19 2 15 1
10 (Best QOL) 852 97 780 95 914 95 1022 95
Total 879 100 820 100 966 100 1077 100