
Tenofovir nephrotoxicity in resource limited setting of Western India : Higher rate of renal...
25
Tenofovir nephrotoxicity in resource limited setting of Western India : Higher rate of renal function decline, acute kidney injury and progression to chronic kidney disease compared to Western data A.Dravid 1 ,A.Sadre 2 ,S.Dhande 1 , A.Borkar 1 ,M.Kulkarni 1 ,M.Dravid 3 1 Ruby hall clinic, Department of HIV Medicine, Pune, India 2 Ruby hall clinic, Department of Nephrology, Pune, India 3 Infectious disease clinic, Department of HIV Medicine, Dhule, India
-
Upload
daniella-barker -
Category
Documents
-
view
216 -
download
0
Transcript of Tenofovir nephrotoxicity in resource limited setting of Western India : Higher rate of renal...
Tenofovir nephrotoxicity in resource limited setting of Western India : Higher rate of renal function decline, acute kidney injury and progression to
chronic kidney disease compared to Western data
A.Dravid1,A.Sadre2,S.Dhande1, A.Borkar1,M.Kulkarni1,M.Dravid3
1 Ruby hall clinic, Department of HIV Medicine, Pune, India2 Ruby hall clinic, Department of Nephrology, Pune, India
3 Infectious disease clinic, Department of HIV Medicine, Dhule, India
Introduction• India has the second highest population of HIV positive patients
in the world which stands at 2.5 million out of which 600,000 patients are on antiretroviral therapy.
• Tenofovir based antiretroviral therapy is increasingly used for treatment naïve and treatment experienced patients in India over the last 5 years as per recommendation by national guidelines
• It has coincided with availability of generic fixed dose combinations of Tenofovir/emtricitabine(TE), Tenofovir/Emtricitabine/Efavirenz(TEE) and Tenofovir/Lamivudine/Efavirenz(TLE)
• Tenofovir nephrotoxicity is characterized by proximal tubular cell dysfunction that may be associated with Fanconi’s syndrome, acute kidney injury or progression to chronic kidney disease.
• Tenofovir nephrotoxicity develops in 1-2% patients
Introduction
• Majority of the data on Tenofovir nephrotoxicity comes from either randomized controlled trials or from observational studies conducted in Western,resource rich settings.
• Clinical trials have strict inclusion criteria and tend to exclude patients with comorbidities which hampers their generalisability to real world settings.
• Data from resource limited settings like India is sparse and is plagued by missing data, limited covariates for analysis, high incidence of lost to follow up and short follow up.
Objective
• Primary objective of this study was to determine annual decline in estimated glomerular filtration rate(eGFR) by MDRD equation in patients taking Tenofovir based ART and comparing it with patients on Tenofovir sparing regimens
• Secondary objective was to determine incidence of acute kidney injury(AKI) in Tenofovir exposed population which led to Tenofovir withdrawal.
• Recovery of renal function on Tenofovir cessation was studied and proportion of patients who progress to Stage 3-5 Chronic kidney disease despite Tenofovir withdrawal was estimated.
Methods• The study was carried out at Ruby Hall Clinic,Pune which is a tertiary
centre for HIV/AIDS clinical care in Western India.• Electronic medical records of patients are stored in a central database
from which demographic, clinical and laboratory data of all patients was extracted.
• Patients who were initiated on or switched to Tenofovir based antiretroviral therapy from 1st March 2009 to 1st March 2013 were included in this retrospective observational cohort study.
• Patients having atleast 1 follow up serum creatinine and creatinine clearance values were included.
• Patients already on Tenofovir based ART prior to 2009 were also included provided they had regular baseline and follow up data available.
• Patients started on Tenofovir sparing regimens (i.e. Zidovudine and Stavudine based regimens) during the said period were taken as control population
Methods• Age,Sex,CD4 count, HBsAg status, serum creatinine, Baseline
WHO stage 3-4 infection, Use of concomitant antiretroviral drugs along with Tenofovir( Non nucleoside reverse transcriptase inhibitors (NNRTI) versus protease inhibitors (PI) were the demographic variables studied.
• Serum creatinine was measured at baseline and 6 monthly follow up by Von Jaffe method.
• Glomerular filtration rate (eGFR) was measured at baseline and at every 6 monthly follow up by Cockcroft Gault (CG) formula and Modification of diet in renal disease(MDRD) equation.
• Total duration of exposure to Tenofovir in months was calculated for each patient.
Methods• Tenofovir was initiated in patients with Creatinine Clearance (Cr Cl) > 50 ml/min. • Patients started on Tenofovir at baseline Cr Cl < 50 ml/min were excluded.• Patients having missing baseline and follow up serum creatinine values were also
excluded• Annual decline in GFR was calculated by CG formula and MDRD equation for
Tenofovir containing and Tenofovir sparing regimens.• Acute Kidney Injury was defined as Serum creatinine > 2 mg/dl, Cr Cl decrease to
< 50 ml/min or GFR decrease > 50% of baseline (Rifle criteria 2002). • Patients with GFR value < 60 ml/min(MDRD equation), 6 months after Tenofovir
discontinuation were classified as having Chronic kidney disease (CKD). • Presence of co morbidities which increase incidence of renal toxicity like diabetes
mellitus, hypertension, use of concomitant nephrotoxic drugs, obstructive uropathy and urinary tract infecton were recorded.
• Angiotensin converting enzyme inhibitors(ACEI), Non steroidal anti-inflammatory drugs(NSAID’s), Amino glycosides and Amphotericin B were the nephrotoxic drugs studied.
• Obstructive uropathy included conditions like renal calculus disease, urethral stricture and benign prostatic hypertrophy.
Methods
• Entire data was analysed by the SPSS software(STATA) version 18
• One way Anova test was used to compare GFR decline amongst subgroups of patients
• Multivariate logistic regression analysis was applied to the dataset to identify factors significantly associated with increasing risk of acute kidney injury in Tenofovir exposed patients

Results
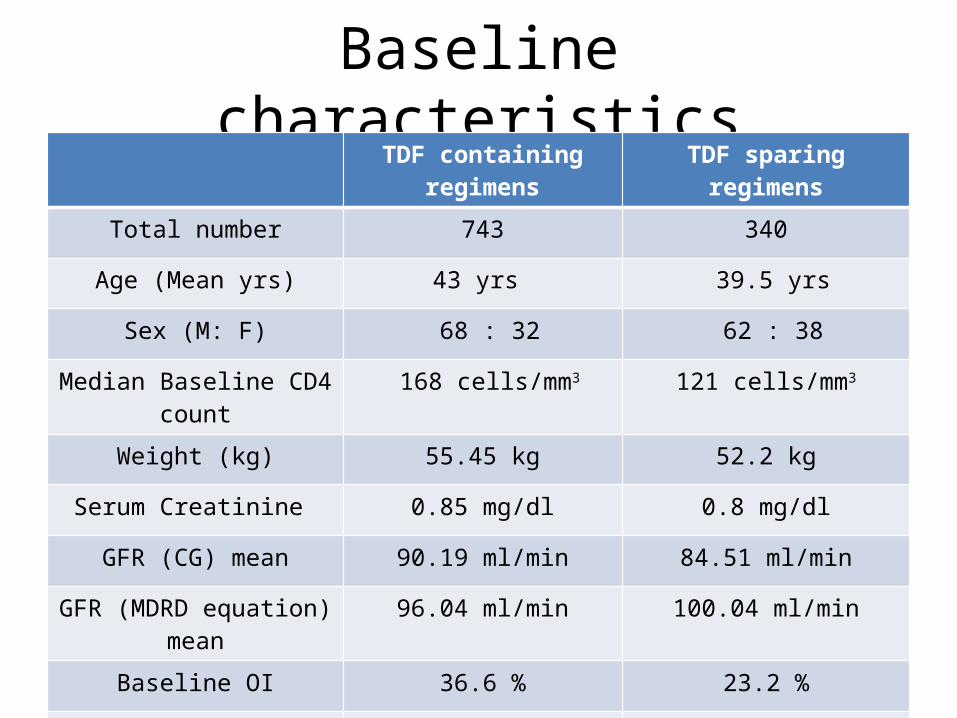
Baseline characteristicsTDF containing regimens TDF sparing regimens
Total number 743 340
Age (Mean yrs) 43 yrs 39.5 yrs
Sex (M: F) 68 : 32 62 : 38
Median Baseline CD4 count 168 cells/mm3 121 cells/mm3
Weight (kg) 55.45 kg 52.2 kg
Serum Creatinine 0.85 mg/dl 0.8 mg/dl
GFR (CG) mean 90.19 ml/min 84.51 ml/min
GFR (MDRD equation) mean 96.04 ml/min 100.04 ml/min
Baseline OI 36.6 % 23.2 %
Mean duration of F/U 21 months 33 months
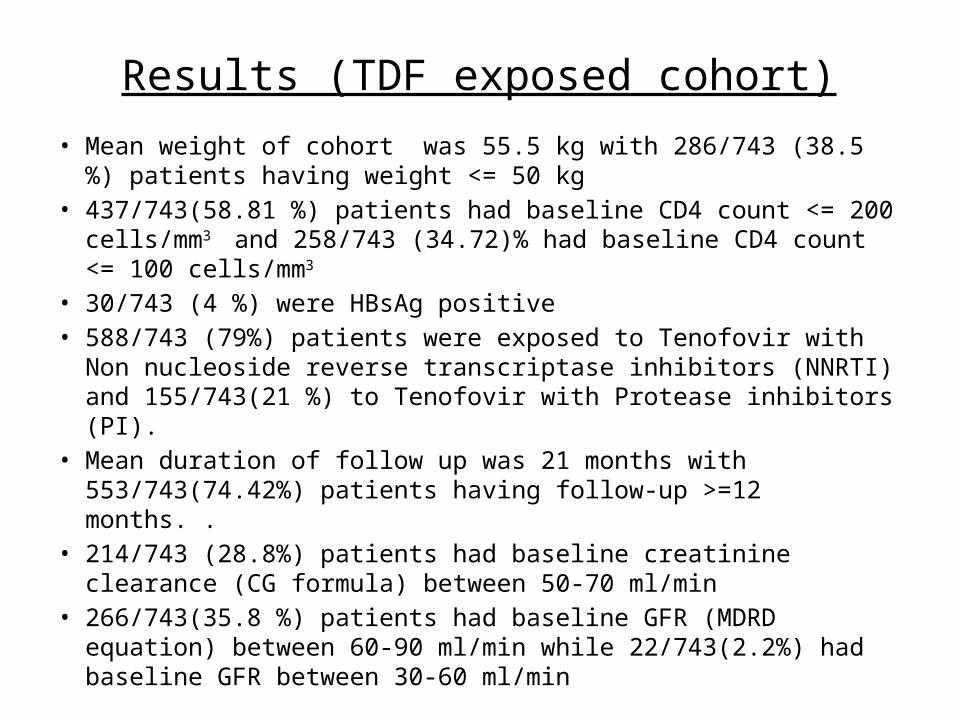
Results (TDF exposed cohort)
• Mean weight of cohort was 55.5 kg with 286/743 (38.5 %) patients having weight <= 50 kg
• 437/743(58.81 %) patients had baseline CD4 count <= 200 cells/mm3
and 258/743 (34.72)% had baseline CD4 count <= 100 cells/mm3
• 30/743 (4 %) were HBsAg positive• 588/743 (79%) patients were exposed to Tenofovir with Non
nucleoside reverse transcriptase inhibitors (NNRTI) and 155/743(21 %) to Tenofovir with Protease inhibitors (PI).
• Mean duration of follow up was 21 months with 553/743(74.42%) patients having follow-up >=12 months. .
• 214/743 (28.8%) patients had baseline creatinine clearance (CG formula) between 50-70 ml/min
• 266/743(35.8 %) patients had baseline GFR (MDRD equation) between 60-90 ml/min while 22/743(2.2%) had baseline GFR between 30-60 ml/min
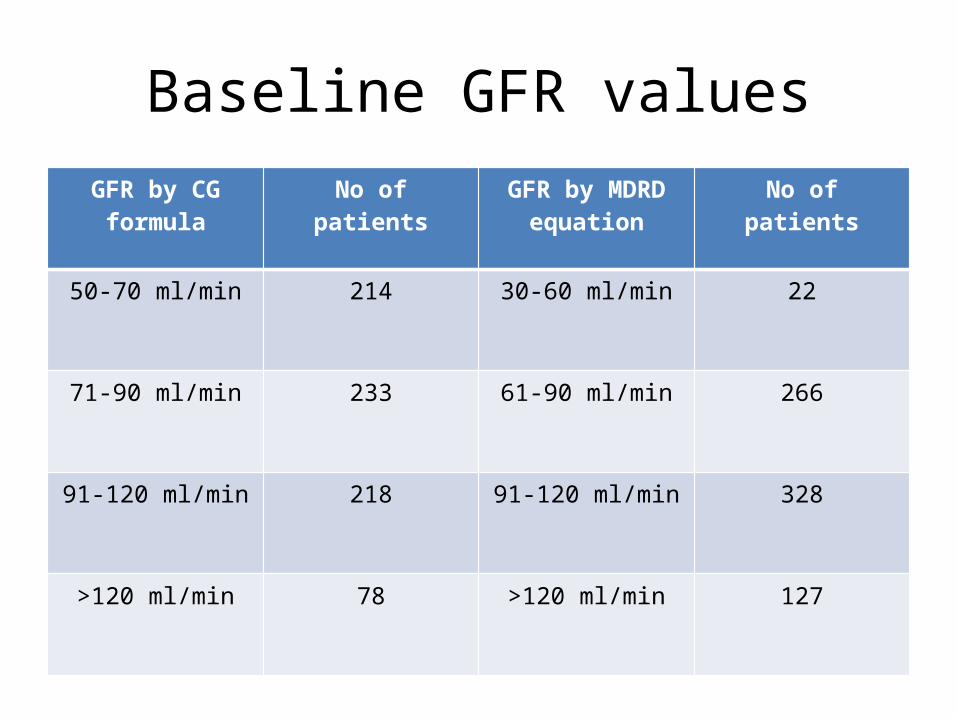
Baseline GFR valuesGFR by CG formula No of patients GFR by MDRD
equationNo of patients
50-70 ml/min 214 30-60 ml/min 22
71-90 ml/min 233 61-90 ml/min 266
91-120 ml/min 218 91-120 ml/min 328
>120 ml/min 78 >120 ml/min 127
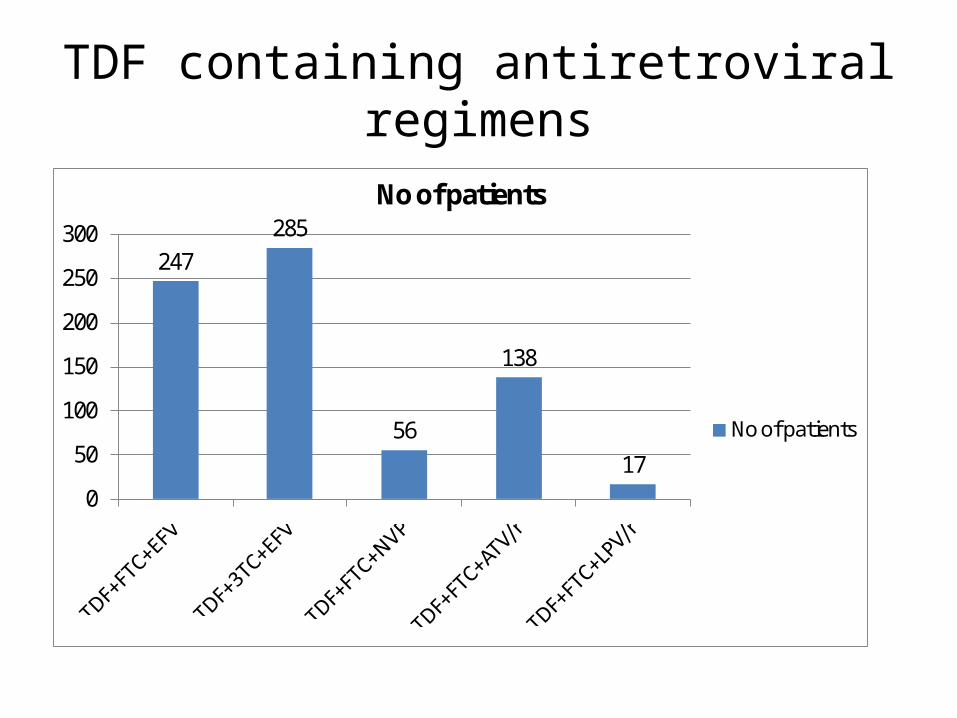
TDF containing antiretroviral regimens
247285
56
138
170
50
100
150
200
250
300
No of patients
No of patients
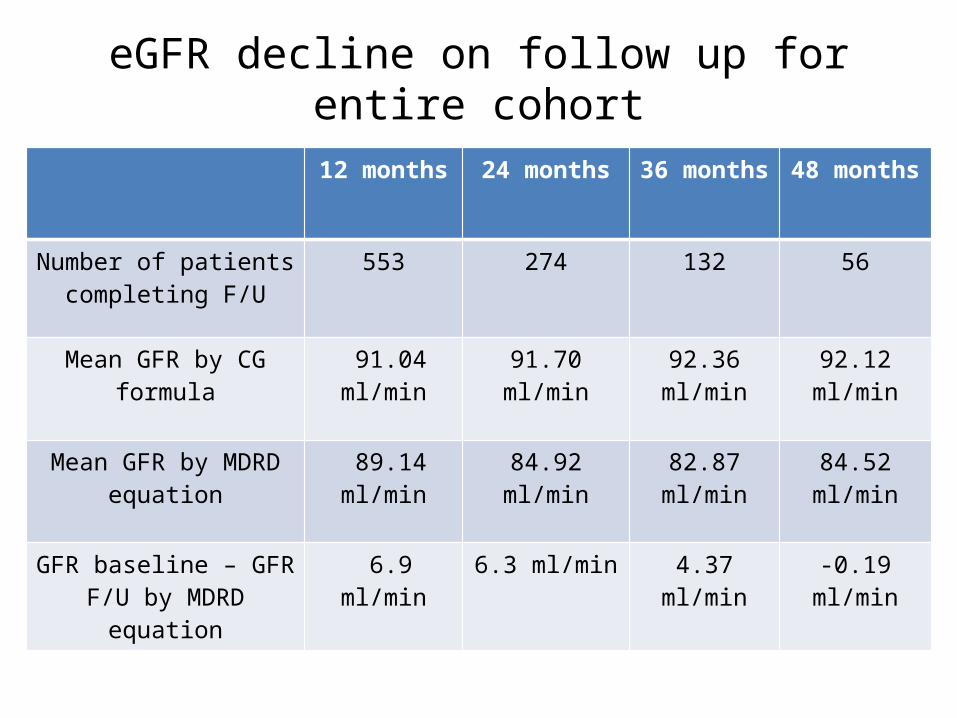
eGFR decline on follow up for entire cohort
12 months 24 months 36 months 48 months
Number of patients completing F/U
553 274 132 56
Mean GFR by CG formula 91.04 ml/min 91.70 ml/min 92.36 ml/min 92.12 ml/min
Mean GFR by MDRD equation
89.14 ml/min 84.92 ml/min 82.87 ml/min 84.52 ml/min
GFR baseline – GFR F/U by MDRD equation
6.9 ml/min 6.3 ml/min 4.37 ml/min -0.19 ml/min
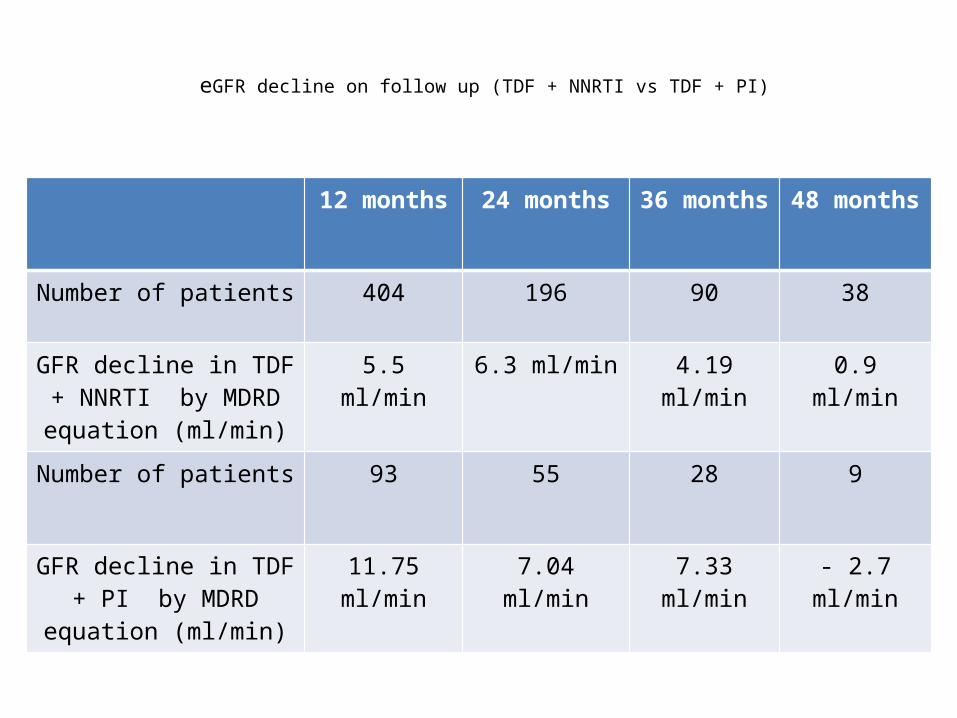
eGFR decline on follow up (TDF + NNRTI vs TDF + PI)
12 months 24 months 36 months 48 months
Number of patients 404 196 90 38
GFR decline in TDF + NNRTI by MDRD equation
(ml/min)
5.5 ml/min 6.3 ml/min 4.19 ml/min 0.9 ml/min
Number of patients 93 55 28 9
GFR decline in TDF + PI by MDRD equation (ml/min)
11.75 ml/min 7.04 ml/min 7.33 ml/min - 2.7 ml/min
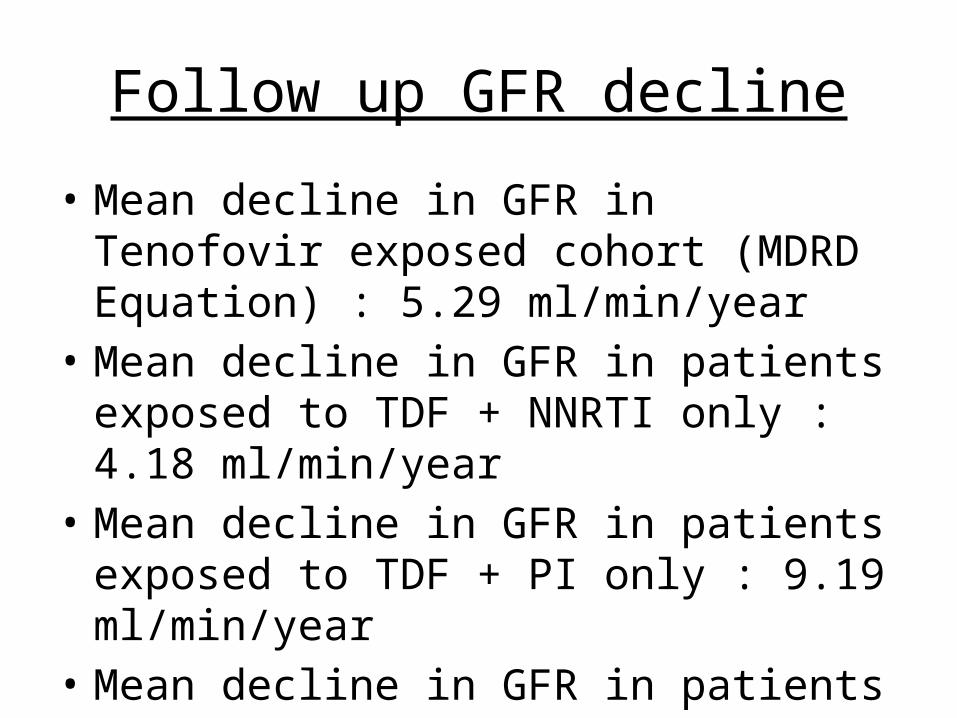
Follow up GFR decline
• Mean decline in GFR in Tenofovir exposed cohort (MDRD Equation) : 5.29 ml/min/year
• Mean decline in GFR in patients exposed to TDF + NNRTI only : 4.18 ml/min/year
• Mean decline in GFR in patients exposed to TDF + PI only : 9.19 ml/min/year
• Mean decline in GFR in patients exposed to Tenofovir sparing regimens : 1.3 ml/min/year
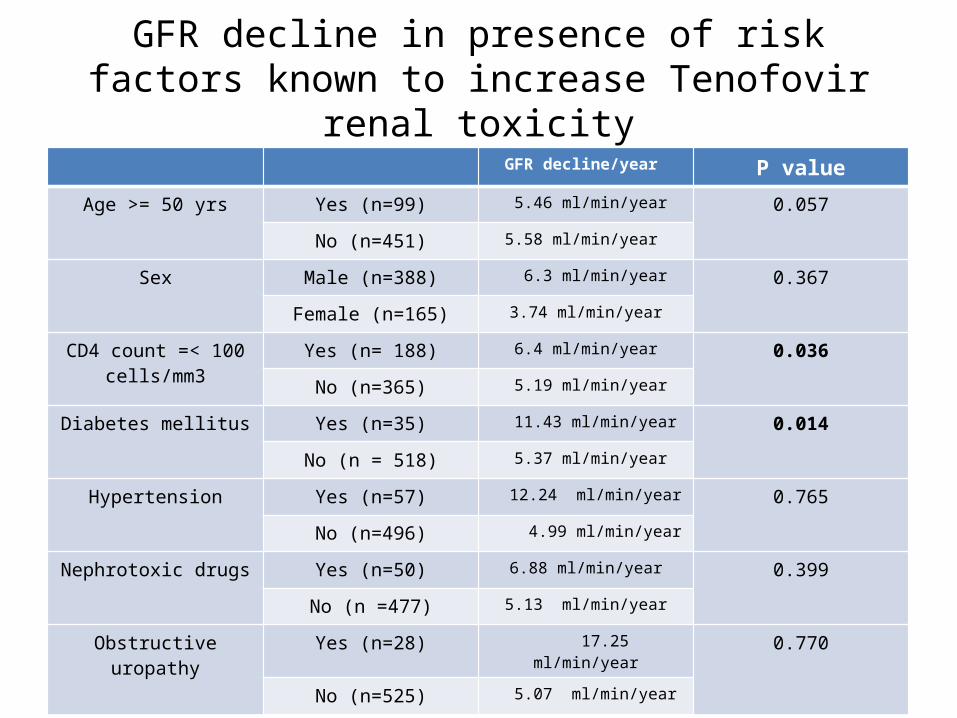
GFR decline in presence of risk factors known to increase Tenofovir renal toxicity
GFR decline/year P value
Age >= 50 yrs Yes (n=99) 5.46 ml/min/year 0.057
No (n=451) 5.58 ml/min/year
Sex Male (n=388) 6.3 ml/min/year 0.367
Female (n=165) 3.74 ml/min/year
CD4 count =< 100 cells/mm3
Yes (n= 188) 6.4 ml/min/year 0.036
No (n=365) 5.19 ml/min/year
Diabetes mellitus Yes (n=35) 11.43 ml/min/year 0.014
No (n = 518) 5.37 ml/min/year
Hypertension Yes (n=57) 12.24 ml/min/year 0.765
No (n=496) 4.99 ml/min/year
Nephrotoxic drugs Yes (n=50) 6.88 ml/min/year 0.399
No (n =477) 5.13 ml/min/year
Obstructive uropathy Yes (n=28) 17.25 ml/min/year 0.770
No (n=525) 5.07 ml/min/year
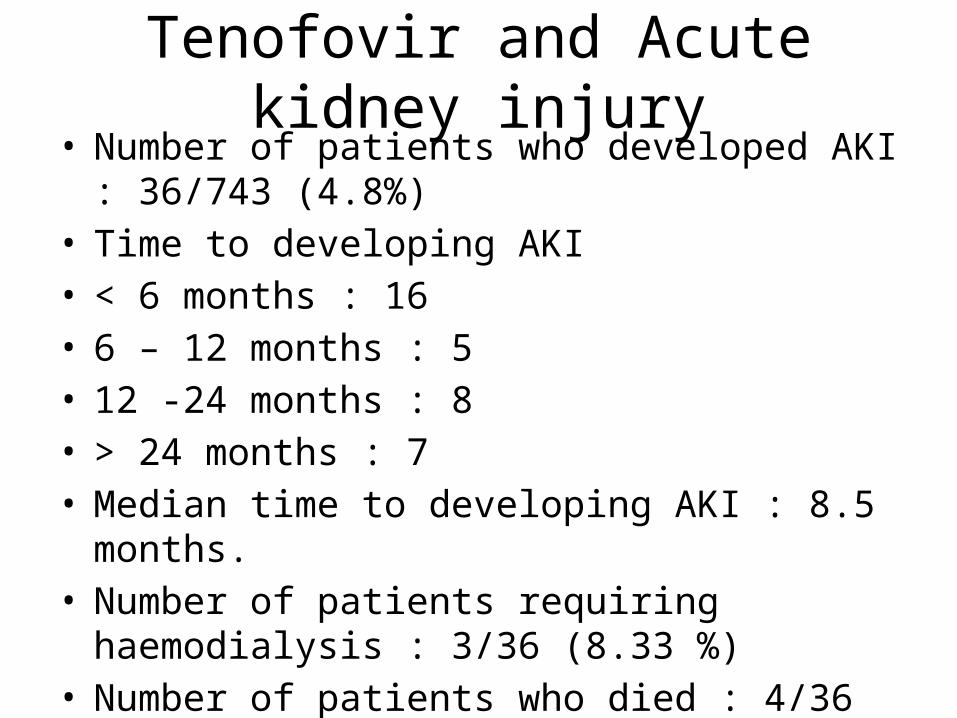
Tenofovir and Acute kidney injury• Number of patients who developed AKI : 36/743
(4.8%)• Time to developing AKI• < 6 months : 16• 6 – 12 months : 5• 12 -24 months : 8• > 24 months : 7• Median time to developing AKI : 8.5 months.• Number of patients requiring haemodialysis : 3/36
(8.33 %)• Number of patients who died : 4/36 (11.11 %)
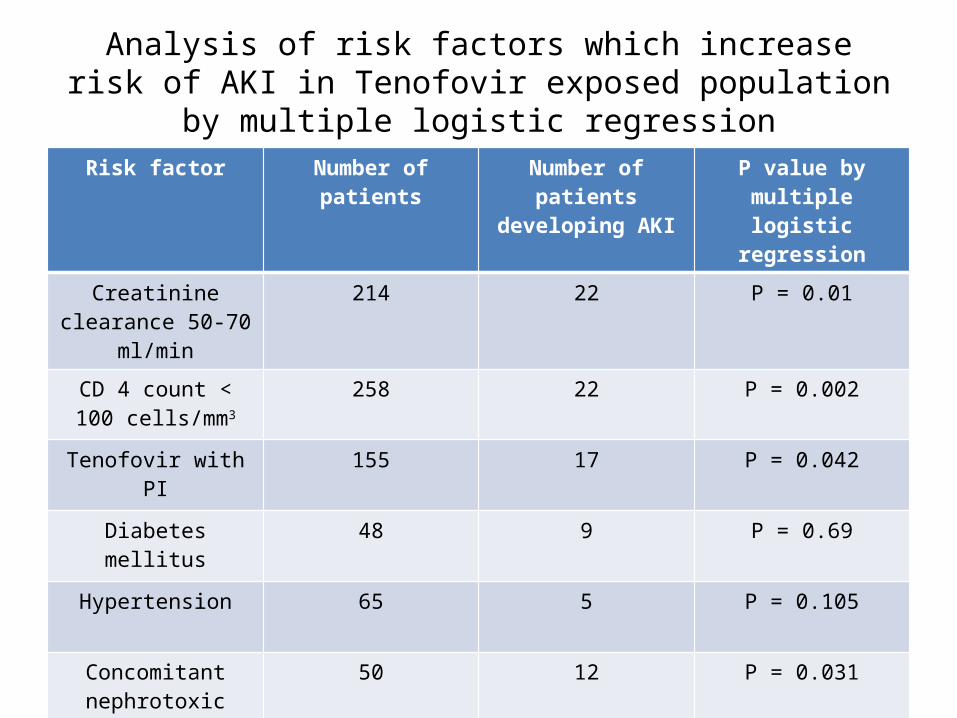
Analysis of risk factors which increase risk of AKI in Tenofovir exposed population by multiple logistic regression
Risk factor Number of patients Number of patients developing AKI
P value by multiple logistic regression
Creatinine clearance 50-70 ml/min
214 22 P = 0.01
CD 4 count < 100 cells/mm3
258 22 P = 0.002
Tenofovir with PI 155 17 P = 0.042
Diabetes mellitus 48 9 P = 0.69
Hypertension 65 5 P = 0.105
Concomitant nephrotoxic drugs
50 12 P = 0.031
Obstructive uropathy 37 11 P = 0.001
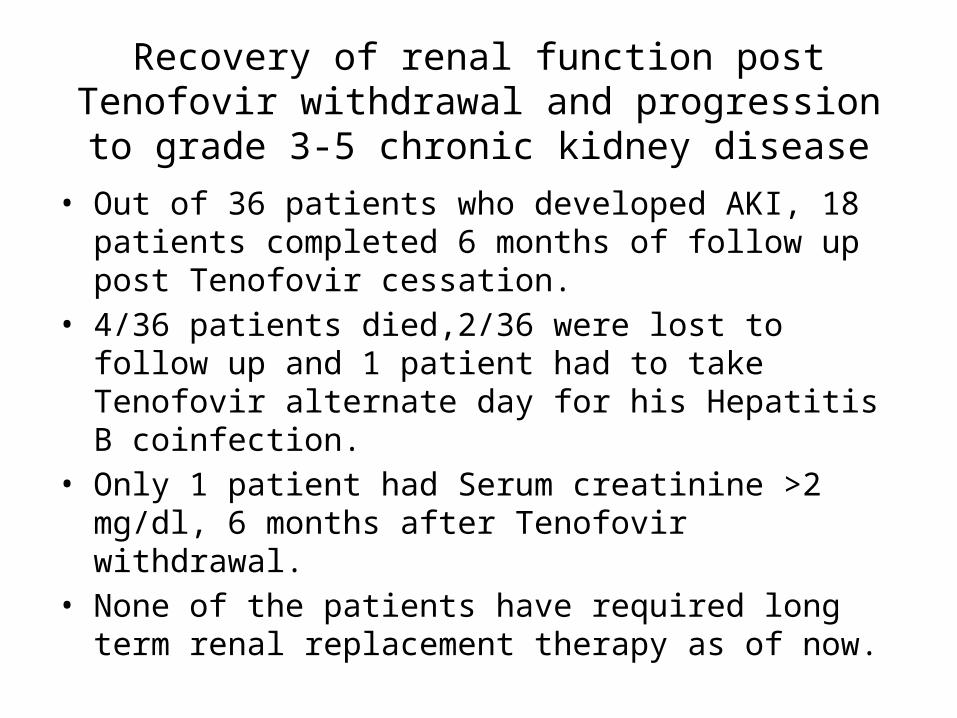
Recovery of renal function post Tenofovir withdrawal and progression to grade 3-5 chronic kidney disease
• Out of 36 patients who developed AKI, 18 patients completed 6 months of follow up post Tenofovir cessation.
• 4/36 patients died,2/36 were lost to follow up and 1 patient had to take Tenofovir alternate day for his Hepatitis B coinfection.
• Only 1 patient had Serum creatinine >2 mg/dl, 6 months after Tenofovir withdrawal.
• None of the patients have required long term renal replacement therapy as of now.
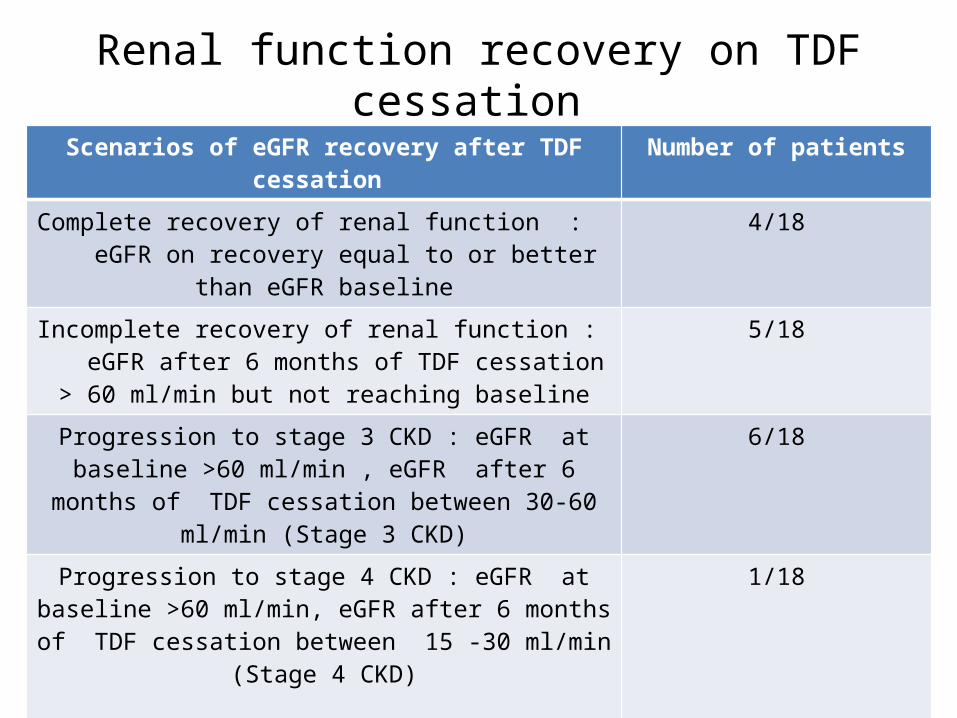
Renal function recovery on TDF cessation Scenarios of eGFR recovery after TDF cessation Number of patients
Complete recovery of renal function : eGFR on recovery equal to or better than eGFR baseline
4/18
Incomplete recovery of renal function : eGFR after 6 months of TDF cessation > 60 ml/min but not reaching
baseline
5/18
Progression to stage 3 CKD : eGFR at baseline >60 ml/min , eGFR after 6 months of TDF cessation between 30-60
ml/min (Stage 3 CKD)
6/18
Progression to stage 4 CKD : eGFR at baseline >60 ml/min, eGFR after 6 months of TDF cessation between 15 -30
ml/min (Stage 4 CKD)
1/18
eGFR baseline < 60 ml/min and eGFR after TDF cessation showed incomplete recovery and remained < 60 ml/min
(Stage 3 CKD)
2/18
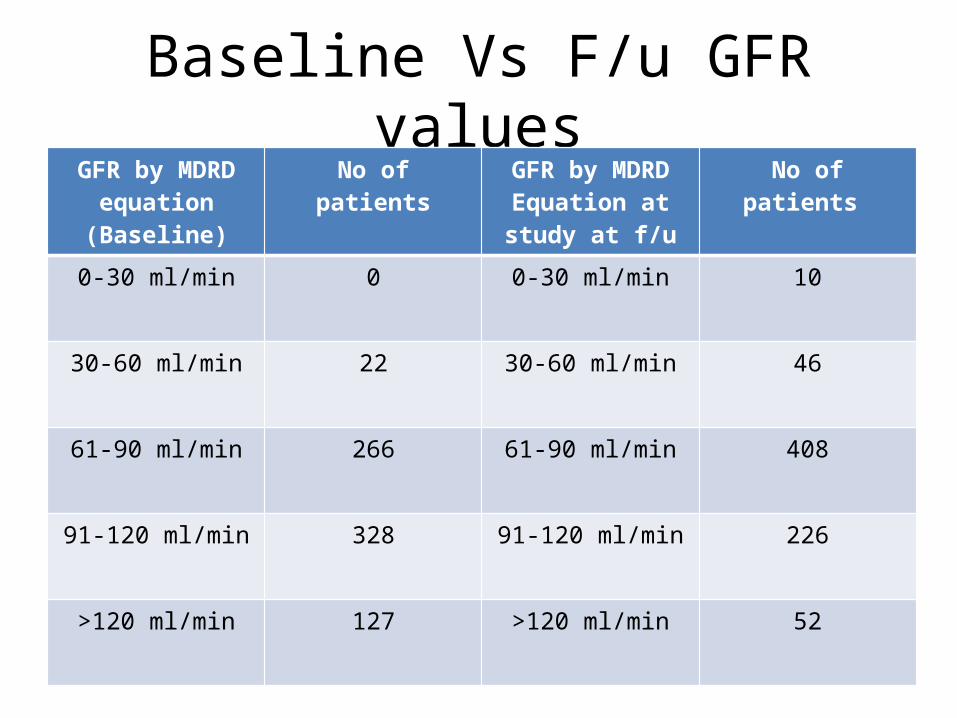
Baseline Vs F/u GFR valuesGFR by MDRD
equation (Baseline)No of patients GFR by MDRD
Equation at study at f/u
No of patients
0-30 ml/min 0 0-30 ml/min 10
30-60 ml/min 22 30-60 ml/min 46
61-90 ml/min 266 61-90 ml/min 408
91-120 ml/min 328 91-120 ml/min 226
>120 ml/min 127 >120 ml/min 52
Discussion• Renal function decline in patients on Tenofovir based ART
was much higher than patients taking Tenofovir sparing ART (mean 5.29 ml/min/year vs 1.3 ml/min/year)
• Renal function decline was higher in patients taking Tenofovir with PI’s than in patients taking Tenofovir with NNRTI (9.19 ml/min/year vs 4.14 ml/min/year).
• Normal age related GFR decline in HIV negative population is 1 ml/min/year.
• So in effect, eGFR decline seen in patients taking Tenofovir based ART in our cohort is similar to that seen in patients suffering from diabetic nephropathy.
• The decline seems to be progressive over a period of 3 years.
Discussion and conclusions• We also found higher incidence of acute kidney injury
amongst our Tenofovir exposed population compared to that seen in Western resource rich settings (4.8% vs 1 %)
• This could be attributable to lower baseline creatinine clearance, lower eGFR, lower baseline CD4 count and higher incidence of co-morbidities in our cohort.
• Recovery of eGFR after withdrawal of Tenofovir is incomplete in significant proportion of patients in our cohort. These patients are at risk of progression to stage 3-5 Chronic kidney disease.
• Finally, management of Tenofovir nephrotoxicity in resource limited settings like India is tough due to limited access to routine laboratory monitoring, renal replacement therapy and alternate antiretroviral drugs like Abacavir.
CONCLUSIONS Drawbacks of our study :• Retrospective observational cohort design• CKD EPI equation and AKIN criteria could not be applied to
our dataset• Routine urine examination data was not available at baseline
and follow up for all the patients. It could have helped us to identify nephrotoxicity earlier.
• Although we tried to identify all factors which increase risk of renal toxicity by Tenofovir, there could be unknown confounding factor which could have been missed.


