A national authority's perspective on the European Citizens' Initiative.

TACIRPublication Policy
Reports approved by vote of the Tennessee Advisory Commission on
Intergovernmental Relations are labeled as such on their covers with the
following banner at the top: Report of the Tennessee Advisory Commission on
Intergovernmental Relations. All other reports by Commission staff are prepared
to inform members of the Commission and the public and do not necessarily
reflect the views of the Commission. They are labeled Staff Report to Members
of the Tennessee Advisory Commission on Intergovernmental Relations on their
covers. TACIR Fast Facts are short publications prepared by Commission staff to
inform members and the public.
Tennessee Advisory Commission on Intergovernmental Relations226 Capitol Boulevard Building · Suite 508 · Nashville, Tennessee 37243
Phone: 615.741.3012 · Fax: 615.532.2443E-mail: [email protected] · Website: www.tn.gov/tacir

Tennessee Valley Authority’sPayments in Lieu of Taxes
Annual Report to the Tennessee General Assembly
Matthew Owen, Ph.D.Policy Coordinator
Mark McAdoo, M.S., M.S.M.Research Manager
Melissa Brown, M.Ed.Deputy Executive Director
Teresa GibsonWeb Development & Publications Manager
January 2018
Report of the Tennessee Advisory Commission on Intergovernmental Relations

Tennessee Advisory Commission on Intergovernmental Relations. This document was produced as an Internet publication.
Recommended citation:
Tennessee Advisory Commission on Intergovernmental Relations. 2018. Tennessee Valley Authority’s Payments in Lieu of Taxes: Annual Report to the Tennessee General Assembly.


TO: Commission Members
FROM: Cliff Lippard Executive Director
DATE: 26 January 2018
SUBJECT: Tennessee Valley Authority Payments in Lieu of Taxes—Annual Report for Approval
The attached Commission report is submitted for your approval. The report responds to Public Chapter 475, Acts of 2009, which directed the Commission to monitor changes in the wholesale distribution of electric power by the Tennessee Valley Authority and its distributors for possible effects on the Authority’s payments in lieu of taxes to the states in the Valley region and to Public Chapter 1035, Acts of 2010, which made the report an annual requirement. There are no recommended actions to be taken by the General Assembly in this year’s report.
226 Capitol Boulevard Bldg., Suite 508 Nashville, Tennessee 37243-0760
Phone: (615) 741-3012 Fax: (615) 532-2443
www.tn.gov/tacir


iWWW.TN.GOV/TACIR
Tennessee Valley Authority’s Payments in Lieu of TaxesAnnual Report to the Tennessee General Assembly
ContentsTennessee Valley Authority’s Payments in Lieu of Taxes ................................................................... 1
TVA’s Payments in Lieu of Taxes Continue to Fluctuate .....................................................................................3
TVA’s Efforts to Meet Power Needs and Remain Within Its Debt Limit .........................................................5
Short-Term System-Management Strategies ...............................................................................................5
Long-Term System-Management Strategies ................................................................................................6
The Shift Away from Coal: Environmental and Business Reasons .............................................................. 11
Fossil Plant Retirements Required by Environmental Agreements ................................................... 11
Fossil Plant Retirements for Business Reasons .......................................................................................... 12
The EPA’s Clean Power Plan: Current Status and Potential Effect on TVA ....................................... 14
New Energy Sources to Meet the Region’s Needs ................................................................................... 15
References ........................................................................................................................................... 21
Appendix A: TVA’s Allocation Formula ............................................................................................. 25
Appendix B: Tennessee’s Allocation Formula .................................................................................. 27
Appendix C: Distribution of Counties’ Share of TVA Payments in Lieu of Taxes to Tennessee by Tennessee Fiscal Year .............................................................................................................. 29
Appendix D: Distribution of Cities’ Share of TVA Payments in Lieu of Taxes to Tennessee by Tennessee Fiscal Year .............................................................................................................. 31
Appendix E: Payments Distributed to Counties in Areas Affected by TVA Construction by Tennessee Fiscal Year .............................................................................................................. 39
Appendix F: Payments Distributed to Cities in Areas Affected by TVA Construction by Tennessee Fiscal Year ................................................................................................................... 41
Appendix G: TVA 2015 IRP Recommendations by Resource Type ................................................. 49


1WWW.TN.GOV/TACIR
Tennessee Valley Authority’s Payments in Lieu of TaxesAnnual Report to the Tennessee General Assembly
Tennessee Valley Authority’s Payments in Lieu of Taxes
The Tennessee Advisory Commission on Intergovernmental Relations was directed by the Electric Generation and Transmission Cooperative Act of 2009 (Section 4 of Public Chapter 475, Acts of 2009) to monitor changes in the wholesale distribution of electric power by the Tennessee Valley Authority (TVA) and its distributors for possible effects on the Authority’s payments in lieu of taxes (PILOTs) to the states in the Valley region. The Commission’s report was to “include recommendations, if any, on adjustments to the state tax system that would keep the state and local governments whole from such future changes.” The Act authorized the creation of nonprofit membership cooperatives to generate and transmit electricity in Tennessee. At the time, one such co-op already owned a power-generating facility in Mississippi, and the legislature was concerned that, having authorized them, they had opened the door to a potential decline in TVA’s payments to the states if the co-ops began selling electricity directly to distributors.
After considering a number of options, including those developed by the Commission,1 the Tennessee General Assembly passed Public Chapter 1035, Acts of 2010, requiring payments equivalent to TVA’s Tennessee PILOT from any other entity providing wholesale electric current for resale within the state, such as the electric generation and transmission cooperatives authorized in 2009. Public Chapter 1035 was designed to ensure that revenue from power sales in the TVA region would not depend on who produced that power or who sold it. The act also renewed the requirement that the Commission monitor the effects of the 2009 act and report to the General Assembly annually. This is the Commission’s report for the 2018 legislative session.
Although the 2010 law put to rest immediate concerns about the potential loss of TVA revenue created by the 2009 law, concerns about the problems created by TVA’s debt ceiling, which has not been raised since 1979,2 and the threat of privatization continue to reappear from time to time. Both were among the reasons given by power distributors in the region for seeking authorization to form the generation and transmission co-operatives authorized by the 2009 Act. TVA’s debt ceiling remains $30 billion, which because of inflation now has the buying power that $10 billion would have had in 1979, but the threat of privatization has diminished at least for the time being.3 Figure 1 shows the level of TVA’s debt since 2009.
1 Tennessee Advisory Commission on Intergovernmental Relations 2010.2 16 United States Code 831 n-4(a).3 Tennessee Valley Authority 2015g.
TVA’s payments in lieu of taxes continue to fluctuate; payments to Tennessee are estimated to increase by $3 million for federal fiscal year 2017-18.

WWW.TN.GOV/TACIR2
Tennessee Valley Authority’s Payments in Lieu of TaxesAnnual Report to the Tennessee General Assembly
To manage within its $30 billion debt limit, TVA has adopted a number of innovative but by its own account costly financing techniques, some of which can alter the amount of PILOT revenue paid directly to states. The lease-and-lease-back technique used so far to finance the expansion of power production in Tennessee does not affect the amount of the PILOT paid directly to Tennessee, but the sale-and-lease-back technique used at one of its plants in Mississippi reduced the amount paid directly to that state, and the potential for the same exists throughout the region. The difference is in who owns the property and whether it is subject to state and local taxes.
Recent changes in TVA’s supply system continue to affect the balance of PILOTs across the region. TVA has shifted power production away from coal in response to economic factors and environmental mandates, retiring numerous coal-fired units at its power plants since 2012, while completing a second nuclear reactor at its Watts Bar facility in Rhea County and building or acquiring several new natural gas-fired facilities. In the states where these new or retired facilities are located, the changes have affected the value of TVA power property, one of two factors determining each state’s share of the PILOT. TVA’s investments in nuclear and natural gas in Tennessee combined with retirements of coal-fired units in Alabama and Kentucky have more than offset coal-fired retirements in Tennessee in past years. But this year, the Authority’s investments in natural gas-fired units in Kentucky, which increased the value of TVA power property in that state, caused a slight shift in the balance of the PILOT away from Tennessee. Moreover, the December 2017 retirement of the last four coal-fired units at TVA’s Johnsonville plant in Humphreys County will reduce that plant’s value and could reduce Tennessee’s share of the PILOT going
Figure 1. Tennessee Valley Authority Statutory Debtat Federal Fiscal Year End
(in billions)
Source: Tennessee Valley Authority 2014a; Tennessee Valley Authority 2017a; and email from Stephen Schoolfield, senior program manager-taxes, Tennessee Valley Authority, January 11, 2018.
22.8 23.624.7 24.1 24.8
23.6 23.9 24.2 24.2 24.4
0
5
10
15
20
25
$30
2009 2010 2011 2012 2013 2014 2015 2016 2017 2018Projected

3WWW.TN.GOV/TACIR
Tennessee Valley Authority’s Payments in Lieu of TaxesAnnual Report to the Tennessee General Assembly
forward, unless it too is offset by increases in the value of TVA power property elsewhere in the state or by net reductions in other states.
TVA’s decision to make these changes predates but is consistent with the management strategy laid out in its 2015 Integrated Resource Plan (IRP).4 The IRP calls for closing a number of old coal-fired generating plants, building or acquiring plants powered by natural gas, expanding nuclear-powered facilities, and relying more on renewable energy and energy efficiency. The plan’s strategies for increasing energy efficiency, if successful, could reduce TVA revenues and ultimately the PILOT for all recipients, as could other factors, such as the economy and the weather. None of these changes appear to warrant legislative action at this time but should continue to be monitored.
TVA’s Payments in Lieu of Taxes Continue to FluctuateAccording to a press release issued in November 2017, TVA’s actual payments in lieu of taxes for federal fiscal year 2016-17 amounted to $517 million, of which $344 million was paid to Tennessee governments, including $3.4 million in direct payments to counties. Payments to all states decreased $18 million from the previous fiscal year. TVA attributes this decrease to mild winter weather, which resulted in less electricity being used for heating, and consumers’ energy efficiency efforts.5 Following decreases in each of the last two fiscal years, payments to all states for the current fiscal year, federal fiscal year 2017-18, are estimated to increase $7 million to a total of $524 million.
Payments to Tennessee are estimated to increase $3 million to a total of $347 million, of which $3.4 million will again be paid directly to counties, in federal fiscal year 2017-18. But Tennessee’s percentage of the Authority’s overall payments decreased for the first time since federal fiscal year 2008-09, though only slightly. This decrease is likely attributable to the construction of new natural gas-fired units at TVA’s Paradise steam plant in Kentucky, which increased the value of TVA power property in that state relative to other states in the region, including Tennessee.6
Total payments are based on five percent of prior-year gross proceeds7 from power sales, and funds are divided among the eight states in which
4 Tennessee Valley Authority 2015d.5 Tennessee Valley Authority 2017e; see link for information on TVA’s 2017 tax equivalent payments.6 Email from Stephen Schoolfield, senior program manager-taxes, Tennessee Valley Authority, January 11, 2018.7 TVA interprets “gross proceeds” as the proceeds from the sale of power to municipalities, cooperatives, and industries. The TVA Act specifically excludes TVA’s sales to federal agencies from the PILOT calculation.
Tennessee continues to receive more than 66% of the payments in lieu of taxes TVA distributes to states in the region, though its percentage decreased this year for the first time since 2008-09.

WWW.TN.GOV/TACIR4
Tennessee Valley Authority’s Payments in Lieu of TaxesAnnual Report to the Tennessee General Assembly
TVA owns power property8 based both on revenues from power sold by TVA and on the value of TVA power property located in each state. Although TVA buys power from other sources, those purchases have no effect on the amount each state receives from its PILOTs. See appendix A for an explanation of TVA’s allocation formula.
Tennessee still receives more than 66% of the total distributed through TVA’s formula. Past increases in this percentage helped offset what would have otherwise been larger decreases in TVA’s payments to Tennessee in three of the last five federal fiscal years. See table 1.
Tennessee’s local governments continue to receive around 45% of the amount TVA allocates to Tennessee for distribution through the state’s own formula. Under Tennessee Code Annotated, Section 67-9-101 et seq., this formula distributes a portion of Tennessee’s share to cities and counties with additional payments set aside for local governments in counties with TVA construction. The rest is reserved for the state. Distributions through the formula, which are calculated on a state fiscal year basis, are directly affected by the increasing total payments to Tennessee in federal fiscal year 2017-18 and by TVA construction projects. See appendix B for an explanation of Tennessee’s allocation formula.
On a state fiscal year basis, the 2017-18 allocations excluding payments set aside for local governments in counties with TVA construction will increase by $741 thousand for counties, by $315 thousand for cities, and by $115 thousand for the state’s own agencies. Payments related to TVA construction, however, will decrease by $610 thousand for counties and by $322 thousand for cities because of recent project completions. While combined these amounts result in a small overall increase, they total less than the estimated increase in payments to Tennessee for federal fiscal
8 TVA interprets “power property” to include facilities that generate electricity, property used to transmit electricity, coal assets, and a portion of the overall value of TVA’s reservoir properties.
2017-18* 2016-17 2015-16 2014-15 2013-14 2012-13
TVA's Overall PILOT 523.7$ 517.1$ 534.8$ 542.0$ 533.1$ 547.4$
Tennessee's Percent x 66.33% 66.54% 65.78% 65.31% 62.83% 61.69%
Tennessee's Amount 347.3$ 344.1$ 351.8$ 354.0$ 335.0$ 337.7$
Direct Payment to Counties - 3.4 3.4 3.4 3.4 3.4 3.4
Tennessee's Share 344.0$ 340.7$ 348.5$ 350.6$ 331.6$ 334.3$
Source: Tennessee Valley Authority
Table 1. Tennessee Valley Authority Revenue Sharing Distribution to Tennessee by Federal Fiscal Year (in millions)
* Estimate based on unaudited gross receipts. TVA distributes payments monthly from October through August based on this estimate then makes a final payment for the fiscal year in September based on audited revenue figures. It is not unusual for the final payment to be adjusted upward from the original estimated amount.
Note: Share distributed to Tennessee may not equal amount allocated to state minus direct payments to counties because of rounding.

5WWW.TN.GOV/TACIR
Tennessee Valley Authority’s Payments in Lieu of TaxesAnnual Report to the Tennessee General Assembly
year 2017-18 because the state’s fiscal year begins on July 1, three months earlier than the federal fiscal year. As a result, Tennessee’s distribution to local governments and the state for state fiscal year 2017-18 includes TVA’s payments for the last three months of federal fiscal year 2016-17, when the PILOT decreased. See appendixes C and D for the distribution to local governments within the state by county and city since state fiscal year 2010-11, excluding payments set aside for local governments in counties with TVA construction, which can be found in appendixes E and F.
TVA’s Efforts to Meet Power Needs and Remain Within Its Debt LimitTo meet the region’s power demand, TVA must plan for both short-term and long-term fluctuations in the use of electricity while staying within its statutory debt limit of $30 billion. The Authority has developed a number of strategies for managing its system to meet demand within these constraints. These strategies have and will continue to affect TVA’s payments to Tennessee.
Short-Term System-Management Strategies
TVA meets short-term-demand increases that result from extreme weather by operating additional facilities that are used only in times of high demand, purchasing power from other utilities, and cutting off power to customers with interruptible contracts. These strategies enabled TVA to meet record power demands on January 8, 2015, when demand hit the third highest winter peak in TVA’s history at 32,723 megawatts9 and again on February 19, 2015, when demand set a record for that month at 32,109 megawatts.10 According to the Authority, “meeting the demand required the combined effort of TVA’s employees and generating facilities, coordination with the Valley’s 155 local power companies and large industrial customers, and the cooperation of businesses and households to conserve.”11 TVA used natural gas plants to supplement the power provided by its coal-fired, nuclear, and hydroelectric facilities and purchased additional power from the open market to manage a similar period of peak demand in 2014.12 But managing peak demand can require temporarily cutting off power to customers that have agreed to allow TVA and its distributors to interrupt service to them during emergencies13 in exchange for credits on their power bills14 as happened at Murray State University in 2014.15 Although extreme
9 Tennessee Valley Authority 2015a.10 Tennessee Valley Authority 2015f.11 Ibid.12 Tennessee Valley Authority 2014c.13 Flessner 2014.14 Tennessee Valley Authority 2011.15 Canning, Lampe, and Null 2014.
TVA must plan for both short-term and long-term fluctuations in the use of electricity while staying within its statutory debt limit of $30 billion.

WWW.TN.GOV/TACIR6
Tennessee Valley Authority’s Payments in Lieu of TaxesAnnual Report to the Tennessee General Assembly
weather could affect the amount and distribution of TVA’s payments to the states, these events were too short-lived to have a noticeable effect.
Long-Term System-Management Strategies
TVA’s long-term management strategies are laid out in its updated Integrated Resource Plan, which was approved by the TVA Board in August 2015. The update, a response to changes in the utility industry including lower-cost natural gas and renewables as well as decreased demand caused by economic changes and energy efficiency efforts,16 analyzed five strategies for meeting demand.
• Traditional utility approaches for optimizing cost• Planning to meet demand while also meeting an emissions target• Purchasing additional power from other utilities to meet most
demand increases• Maximizing energy efficiency• Maximizing renewables17
These strategies could affect the amount and distribution of the Authority’s payments to the states in the future. TVA has been continually updating its generating system to meet the needs of the region’s growing economy and tighter air-quality standards. As early as the 1960s and 1970s, TVA was investing heavily in nuclear power for both of these reasons. More recently, the Authority has invested in natural gas-powered facilities to meet periodic surges in demand caused by the weather. TVA’s implementation of its long-term management strategies, which will affect the distribution of its PILOTs, will be affected by the economics of power production and the requirements of the Clean Air Act (CAA) and other environmental regulations as well as TVA’s debt limit.
TVA’s Debt Limit and Financing Arrangements
Earlier concerns about TVA’s financing arrangements for new generating capacity in the region and their potential effects on PILOTs in the region and across the state have diminished as the Authority has modified its strategies. In order to stay within the $30 billion debt ceiling imposed on it by the Congress in 1979,18 TVA began using new financing methods,19 some of which affected the distribution of PILOT funds for some states, including the amount those states had available to allocate to their counties and cities. One technique is the leasing of generating facilities, an approach TVA has no current plans to expand.20
16 Tennessee Valley Authority 2015h.17 Tennessee Valley Authority 2015d.18 16 United States Code 831 n-4(a).19 US General Accounting Office 2003.20 For details on existing lease arrangements, see Tennessee Valley Authority 2017b.
TVA’s long-term management strategies could affect the amount
and distribution of its payments to the states in
the future.

7WWW.TN.GOV/TACIR
Tennessee Valley Authority’s Payments in Lieu of TaxesAnnual Report to the Tennessee General Assembly
Shortly before the Electric Generation and Transmission Cooperative Act was passed in 2009, TVA entered into an agreement with a group of its distributors organized as the Seven States Power Corporation, a nonprofit company.21 Seven States purchased an interest in TVA’s Southaven, Mississippi, power plant with the agreement that TVA would continue to operate it. TVA later bought back all of Seven States’ interest in the plant.22 Under the sale-and-lease-back arrangement, while it was active, all sales of electricity produced at Southaven were through TVA and, therefore, were accounted for as TVA revenues and subject to the PILOT allocation to states.
Leasing arrangements such as the one used in Southaven during this agreement do not change the total amount of the PILOT under the TVA formula, nor do they change the allocation across states. Section 15d(g) of the Tennessee Valley Authority Act of 1933 says that
. . . power generating and related facilities operated by the Corporation under lease and lease-purchase agreements shall constitute power property held by the Corporation within the meaning of section 13 of this Act . . .
This provision causes facilities operated by TVA under leases to be included in the calculation of the value of power property under Section 13, which means that the value of TVA property in a state does not change when TVA sells a facility and then leases it back as the Authority did with Southaven.23
Although the change in ownership of the Southaven plant did not affect the amount of TVA’s PILOT allocated to each state, it did affect the PILOT distribution to the state of Mississippi. When TVA leases power property owned by other entities, it reduces the PILOT distributed to the state in which the property is located to the extent that it reimburses the plant owners for taxes they must pay to the state or local governments. This reduces the amount of TVA PILOT that goes through the state’s own allocation formula. Section 15d(g) of the 1933 act goes on to say
. . . that portion of the payment due for any fiscal year under said section 13 to a state where such facilities are located which is determined or estimated by the Board to result from holding such facilities or selling electric energy generated thereby shall be reduced by the amount of any taxes or tax equivalents applicable
21 Tennessee Valley Authority 2009.22 Tennessee Valley Authority 2013a.23 Moreover, this means that when TVA leases a facility that it did not previously own, such as the Caledonia plant in Mississippi, the value of TVA power property in the state where the facility is located actually increases.
The sale-and-lease-back technique used at one of TVA’s plants in Mississippi reduced the amount paid to that state, and the potential for similar arrangements exists throughout the region.

WWW.TN.GOV/TACIR8
Tennessee Valley Authority’s Payments in Lieu of TaxesAnnual Report to the Tennessee General Assembly
5% of TVA's Gross Proceeds is Distributed to
States Based on
Revenuesfrom
Power Sold by
TVA
50%
Value of TVA
Property in Each State
50%
to such fiscal year paid by the owners or others on account of said facilities to said state and to local taxing jurisdictions therein.
The initial sale-and-lease-back arrangement at the Southaven plant and the Authority’s current lease arrangement at the privately owned Caledonia plant, also in Mississippi, illustrate the effect of this second provision. Privately owned plants are, of course, subject to state and local taxes. Consequently, the portion of the TVA PILOT paid directly to Mississippi, related to Caledonia, was reduced by approximately $1 million in 2016-17 and will again be reduced by an estimated $1 million in 2017-18.24 This works much like the $3+ million in direct payments TVA makes to counties in Tennessee. Direct payments are taken off the top of TVA’s PILOT to each state, reducing the amount allocated through the state’s statutory formula.
The amount allocated through Tennessee’s formula, including the amount retained by the state in its general fund, would be reduced by any taxes paid on account of any plant operated through a sale-and-lease-back arrangement if that were to occur. Tennessee might want to mitigate that reduction by modifying its allocation formula to offset the direct payments of taxes by, for example, reducing the allocation to any particular jurisdiction by the amount of the reimbursement TVA made to the plant owners. It is possible, of course, that the reimbursement amount to those jurisdictions could be greater than the allocation through the state formula, so considerable thought would need to go into making such a change.
TVA chose a somewhat different leasing strategy to raise funds for generating expansions in Tennessee without approaching its debt ceiling. Thus far, arrangements in Tennessee have been lease-and-lease-back agreements, which do not jeopardize the amount of the PILOT controlled by Tennessee’s allocation formula. An example is the natural gas combined-cycle plant built between 2010 and 2012 in Hawkins County next to the John Sevier fossil plant and leased to a private company in January 2012. The company paid TVA $1 billion for the lease and then leased the plant back to TVA for 30 years.25 This lease arrangement changes neither the ownership of the property nor TVA revenues and thus has no effect on the PILOT allocation across states or the amount distributed to Tennessee. Similarly, after repurchasing Seven States’ 90% share of the Southaven plant, TVA then entered into a leasing arrangement with Southaven Combined Cycle Generation LLC in which the facility is leased to the company and, in turn, the facility is leased back to TVA.26
24 Email from Stephen Schoolfield, senior program manager-taxes, Tennessee Valley Authority, September 28, 2017; and Schoolfield 2017.25 Tennessee Valley Authority 2013a.26 Tennessee Valley Authority 2013c.

9WWW.TN.GOV/TACIR
Tennessee Valley Authority’s Payments in Lieu of TaxesAnnual Report to the Tennessee General Assembly
Currently, TVA has no reported plans for any new lease arrangements in Tennessee, including sale-lease-back arrangements that would affect the state’s share of the Authority’s PILOT, in the short-term.27 However, the possibility exists that TVA could use leasing strategies in the future to finance new construction if its debt limit remains capped at $30 billion. In its most recent Form 10-K filed with the US Securities and Exchange Commission, TVA acknowledges its use of these innovative financing techniques and says that it may eventually seek similar arrangements. But it mentions no immediate plans to do so.28
In the past, TVA has said that
while such leasing transactions allow TVA to diversify its asset financing program, financing an asset by using the proceeds of leasing transactions is typically more costly to TVA than financing an asset with the proceeds of Bonds.29
In April 2015, TVA purchased Quantum Utility Generation’s Choctaw combined-cycle natural gas plant near Ackerman, Mississippi. Although the purchase used traditional forms of financing, the acquisition allows for future ownership by Seven States Power Corporation, which could affect the PILOT depending on the type of sale or lease arrangement adopted.30
Rebalancing Power Sources and Increasing Efficiency Could Affect PILOTs
As TVA continues to rebalance its generating fleet, the resulting changes could cause shifts in the value of power property from state to state and from county to county, which could affect each state’s and county’s share of TVA’s PILOT. Many of these changes—consistent with environmental mandates, the economics of power production, and the recommendations in TVA’s 2015 IRP—involve the retirement of existing coal-fired units at TVA power plants. Because retired units are no longer used to produce power, TVA accelerates their depreciation so that only their residual value is included in the PILOT distribution formula.31
Changes in TVA’s generating fleet in recent years have generally increased the value of TVA power property in Tennessee relative to other states in the region.32 Although TVA retired coal-fired units at its John Sevier
27 Email from Stephen Schoolfield, senior program manager-taxes, Tennessee Valley Authority, January 11, 2018.28 Tennessee Valley Authority 2017b.29 Tennessee Valley Authority 2013a.30 Tennessee Valley Authority 2015e.31 Email from Stephen Schoolfield, senior program manager-taxes, Tennessee Valley Authority, January 6, 2016.32 Email from Stephen Schoolfield, senior program manager-taxes, Tennessee Valley Authority, September 28, 2017.
TVA has no current plans for any sale-lease-back arrangements in Tennessee that would affect the state’s share of TVA’s PILOT.

WWW.TN.GOV/TACIR10
Tennessee Valley Authority’s Payments in Lieu of TaxesAnnual Report to the Tennessee General Assembly
plant in Hawkins County between 2012 and 2014 and at its Johnsonville plant in Humphreys County in 2015, the resulting reductions in these plants’ values have been more than offset both by TVA’s investments in its Tennessee facilities and by its retirement of additional coal-fired units in other states. Recent investments in TVA’s Tennessee facilities include natural gas-fired units completed in 2012 at its John Sevier plant, a second nuclear unit completed in 2016 at its Watts Bar plant in Rhea County, and ongoing construction begun in 2015 at Boone Dam on the border of Sullivan and Washington counties. TVA also retired coal-fired units at its Colbert and Widows Creek plants in Alabama between 2013 and 2016 and at its Shawnee plant in Kentucky in 2014.33
But as discussed above, Tennessee’s share of TVA power property decreased in federal fiscal year 2016-17 for the first time since federal fiscal year 2008-09. The decrease this year is likely attributable to investments in natural gas-fired units completed in 2017 at TVA’s Paradise plant in Kentucky, which increased the value of TVA power property in that state despite the subsequent retirement of two of the plant’s three coal-fired units.34 Moreover, TVA’s retirement of the last four coal-fired units at its Johnsonville plant in December 2017 could reduce Tennessee’s share of TVA power property and the PILOT in future years unless it too is offset by increases in the value of TVA power property elsewhere in the state or by net reductions in other states.35 TVA is currently building natural gas-fired units and a solar power facility at its Allen plant in Memphis, but it plans to retire all three coal-fired units at the plant once the new gas-fired units become commercially operational. The 2016 sale of TVA’s partially finished Bellefonte nuclear plant in Alabama will reduce the value of TVA power property in that state, though only slightly.36
TVA’s 2015 IRP also calls for energy efficiency savings of between 900 and 1,300 megawatts by 2023 and between 2,000 and 2,800 megawatts by 2033.37 Some of that improved efficiency will occur through upgrading power transmission and distribution systems; some will occur in private homes and businesses. As customers update their homes, commercial and industrial facilities, and electrical appliances and equipment, those changes reduce existing power demand, which could reduce TVA revenues and
33 Tennessee Valley Authority 2017b; and Flessner 2017.34 Email from Stephen Schoolfield, senior program manager-taxes, Tennessee Valley Authority, January 11, 2018.35 Tennessee Valley Authority 2018.36 Tennessee Valley Authority 2017b; and email from Stephen Schoolfield, senior program manager-taxes, Tennessee Valley Authority, January 17, 2018.37 Tennessee Valley Authority 2015d. By way of comparison, TVA’s combined-cycle natural gas plant in Ackerman, Mississippi is capable of producing 705 megawatts of electricity, enough to power more than 400,000 homes; see, https://www.tva.gov/Energy/Our-Power-System/Natural-Gas/Ackerman-Combined-Cycle-Plant.
TVA continues to rebalance its generation fleet, which could cause
shifts in the value of power property from
state to state and in each state’s share of TVA’s
PILOT.

11WWW.TN.GOV/TACIR
Tennessee Valley Authority’s Payments in Lieu of TaxesAnnual Report to the Tennessee General Assembly
ultimately the PILOT for all recipients if the amount of electricity consumed does not continue to grow with the population and the economy.
The Shift Away from Coal: Environmental and Business ReasonsSince the 1950s, coal-fired plants have been TVA’s largest single source of power, but because of their age and changing air-quality requirements, the Authority is shifting emphasis from coal to other power sources (see figure 2 from the 2015 IRP and appendix G). As its coal-fired power plants age, TVA must either retire them or install costly upgrades to meet new air-quality standards that tighten restrictions on the emission of particulates, sulfur dioxide, nitrogen oxides, mercury, lead, and carbon—the major byproducts of burning coal. The cost of upgrading existing coal-fired facilities, the relative cleanliness of other fuels, and the decreasing cost of natural gas have also resulted in a competitive advantage for other methods of generating electricity.
Fossil Plant Retirements Required by Environmental Agreements
To resolve a series of legal challenges brought under the Clean Air Act by several states, including Tennessee, and environmental groups, TVA entered into two settlements in April 2011 in which it agreed to retire 18 of its 59 coal-fired units before 2018. Those retired prior to last year’s report
Figure 2. TVA Capacity Changes in Megawatts by 2023 and 2033
Source: Tennessee Valley Authority 2015d.

WWW.TN.GOV/TACIR12
Tennessee Valley Authority’s Payments in Lieu of TaxesAnnual Report to the Tennessee General Assembly
include two of four coal-fired units at TVA’s John Sevier plant in Hawkins County, which as noted above were replaced by a combined-cycle gas plant on an adjacent site, six of the ten coal-fired units at its Johnsonville plant in Humphreys County, and six of eight coal-fired units at its Widows Creek plant in Alabama.38 With the retirement of the last four units at the Johnsonville plant in December 2017, all 18 affected units have now been retired.39 See table 2.
Fossil Plant Retirements for Business Reasons
Because of the competitive advantage over coal of other methods of generating electricity, TVA has retired 12 additional coal-fired units since 2013 and plans to retire three more by the end of 2018. The units retired for business reasons include the two remaining coal-fired units at TVA’s John Sevier plant in Hawkins County and one of the ten units at its Shawnee plant in Kentucky in 2014, the last two units at its Widows Creek plant in Alabama in 2015, and all five coal-fired units at its Colbert plant in Alabama in 2016. Following the completion of new natural gas-fired units at its Paradise plant in Kentucky, TVA also retired two of the three coal-fired units at that facility in April 2017. Similarly, the Authority plans to retire all three coal-fired units at the Allen plant in Memphis and replace them with gas-fired units on an adjacent site before 2019.40 See table 3.
38 Tennessee Valley Authority 2014b; and Tennessee Valley Authority 2017b.39 Tennessee Valley Authority 2018.40 Tennessee Valley Authority 2014b; Tennessee Valley Authority 2017b; and Tennessee Valley Authority 2017c.
Fossil PlantUnits
Affected
ExistingScrubbers and
SCRs*Requirements Under
Environmental Agreements
Retirements Implemented or Planned to be Implemented
by TVA as a Result of Environmental Agreements
John Sevier 2 of 4 None Retire two units no later than December 31, 2012
Retired Units 1 and 2 on December 31, 2012
Retire six units no later than December 31, 2015
Retired Units 5-10 on December 31, 2015
Retire four units no later than December 31, 2017
Retired Units 1-4 on December 31, 2017
Retire two of Units 1-6 no later than July 31, 2013
Retired Units 3 and 5 onJuly 31, 2013
Retire two of Units 1-6 no later than July 31, 2014
Retired Units 1, 2, 4, and 6 on July 31, 2014
Retire two of Units 1-6 no later than July 31, 2015
* Selective catalytic reduction systems (“SCR”)
Source: Tennessee Valley Authority 2014b; Tennessee Valley Authority 2017b; and Tennessee Valley Authority 2018.
Table 2. Tennessee Valley Authority Coal-Fired Units to be Retired Under Environmental Agreements
Johnsonville 10 of 10 None
Widows Creek 6 of 8 None

13WWW.TN.GOV/TACIR
Tennessee Valley Authority’s Payments in Lieu of TaxesAnnual Report to the Tennessee General Assembly
Fossil PlantUnits
AffectedExisting Scrubbers
and SCRs*Requirements Under
Environmental Agreements
Retirements Implemented or Planned to be Implemented by TVA for Business Reasons
Allen 3 of 3 SCRs on all three units
Install scrubbers or retire no later than December 31, 2018
The Board approved the construction of a gas-fired plant at the current location of the Allen coal-fired site Retire Units 1-3 after completion of the gas-fired plant before December 31, 2018
Colbert 5 of 5 SCR on Unit 5 Remove from service, control, convert, or retire Units 1-4 no later than June 30, 2016 Remove from service, control, or retire Unit 5 no later than December 31, 2015 Control or retire removed from service units within three years
Retired Units 1-5 on April 16, 2016
John Sevier 2 of 4 None Remove from service two units no later than December 31, 2012 and control, convert, or retire those units no later than December 31, 2015
Retired Units 3 and 4 on June 25, 2014
Paradise 2 of 3 Scrubbers and SCRs on all three units
Upgrade scrubbers on Units 1 and 2 no later than December 31, 2012 Continuously operate emission control equipment on Units 1-3
New gas-fired plant built at the current location of the Paradise coal-fired plant began operation on April 7, 2017 Retired Units 1 and 2 of coal-fired plant on April 15, 2017
Shawnee 1 of 10 None Control, convert, or retire Units 1 and 4 no later than December 31, 2017
Retired Unit 10 on June 30, 2014
Widows Creek 2 of 8 Scrubbers and SCRs on Units 7 and 8
Continuously operate existing emissions control equipment on Units 7 and 8
Retired Units 7 and 8 on September 30, 2015
* Selective catalytic reduction systems ("SCR")
Source: Tennessee Valley Authority 2014b; Tennessee Valley Authority 2017b; and Tennessee Valley Authority 2017c.
Table 3. Tennessee Valley Authority Coal-Fired Units to be Retired for Business Reasons

WWW.TN.GOV/TACIR14
Tennessee Valley Authority’s Payments in Lieu of TaxesAnnual Report to the Tennessee General Assembly
TVA plans to continue operating 26 other coal-fired units. These include the lone unit at its Bull Run plant in Anderson County, both units at its Cumberland plant in Stewart County, all four units at its Gallatin plant in Sumner County, all nine units at its Kingston plant in Roane County, the nine remaining units at its Shawnee plant in Kentucky, and the lone remaining unit at its Paradise plant also in Kentucky. TVA decided to add pollution control devices to two of the units at Shawnee and all four units at Gallatin rather than retire them—TVA had the option to control or retire these units under the environmental settlements it agreed to in 2011.41 See table 4.
The EPA’s Clean Power Plan: Current Status and Potential Effect on TVA
In its Clean Power Plan (CPP), the US Environmental Protection Agency (EPA) sets carbon-pollution reduction goals for each state. The CPP rule establishes interim and final carbon dioxide (CO2) emission standards for
41 Tennessee Valley Authority 2017b.
Fossil PlantUnits
AffectedExisting Scrubbers
and SCRs*Requirements Under
Environmental AgreementsOther Actions Taken or
Planned
Bull Run 1 of 1 Scrubber and SCRs on unit
Continuously operate existing emission control equipment
Continuously operate existing emission control equipment
Cumberland 2 of 2 Scrubbers and SCRs on both units
Continuously operate existing emission control equipment
Continuously operate existing emission control equipment
Gallatin 4 of 4 None Control, convert, or retire all four units no later than December 31, 2017
Added scrubbers and SCRs on all four units
Kingston 9 of 9 Scrubbers and SCRs on all nine units
Continuously operate existing emission control equipment
Continuously operate existing emission control equipment
Paradise 1 of 3 Scrubbers and SCRs on all three units
Upgrade scrubbers on Units 1 and 2 no later than December 31, 2012 Continuously operate emission control equipment on Units 1-3
Continuously operate existing emission control equipment on Unit 3
Shawnee 9 of 10 None Control, convert, or retire Units 1 and 4 no later than December 31, 2017
Added scrubbers and SCRs on Units 1 and 4
* Selective catalytic reduction systems (“SCR”)
Source: Tennessee Valley Authority 2014b; Tennessee Valley Authority 2017b; and telephone interview with Don Houston, senior air program manager, Environmental and Energy Policy Department, Tennessee Valley Authority, January 11, 2018.
Table 4. Tennessee Valley Authority Coal-Fired Units That Will Continue to be Operated and Other Actions to be Taken

15WWW.TN.GOV/TACIR
Tennessee Valley Authority’s Payments in Lieu of TaxesAnnual Report to the Tennessee General Assembly
fossil fuel-fired electric steam generating units (generally, coal- and oil-fired power plants) and natural gas-fired combined-cycle generating units. The rule requires each state to develop and implement plans that ensure the power plants in it—either individually, together, or in combination with other measures—achieve interim CO2 emission standards between 2022 and 2029 and final CO2 emission standards by 2030. Each state may select the measures it prefers “to shape [its] own emissions reduction pathways over the 2022-29 period.” The rule also allows states to work on “multi-state approaches, including emissions trading.”42
Although finalized in August 2015, the CPP has not been implemented, and whether it will be implemented remains unclear. More than two dozen states—joined by industry and trade groups, utilities, and several policy organizations—sued to block the CPP, and the US Supreme Court granted a request to halt its implementation while the case is ongoing.43 Further, in October 2017, the EPA issued a proposal to repeal the rule.44 But the process for finalizing the repeal could take approximately a year, according to news reports. Several states and environmental groups have also indicated that they will challenge the repeal in court.45
If the CPP were to become effective, then complying with it could result in further shifts away from coal-fired power in TVA’s generating network. But it is too early to tell whether the Authority would have to retire coal-fired units in addition to those already scheduled to be retired for environmental or business reasons. According to TVA, “the impact of these rules on TVA and the states in TVA’s service territory cannot be determined until the state plans are developed and approved by the EPA, but the impact on TVA could be significant.”46
New Energy Sources to Meet the Region’s Needs
As TVA retires existing coal-fired units, new energy sources—including natural gas, nuclear, wind, and solar—are being developed to meet the region’s electricity needs. As noted above, new natural gas-fired units at TVA’s Paradise plant in Kentucky became commercially operational in April 2017, and construction continues on natural gas-fired units at its Allen plant in Memphis—planned to be completed before 2019. A second nuclear reactor at TVA’s Watts Bar plant in Rhea County also became commercially operational in October 2016.47 While TVA sold its unfinished Bellefonte nuclear plant in Alabama in November 2016 citing
42 US Environmental Protection Agency 2017a.43 Tsang and Wyatt 2017.44 US Environmental Protection Agency 2017b.45 Volcovici 2017; The New York Times 2017; and Henry 2017.46 Tennessee Valley Authority 2015c.47 Tennessee Valley Authority 2016d.
TVA is gradually moving from coal to other power sources because of the age of its coal-fired power plants, air quality requirements, and the changing economies of power production.

WWW.TN.GOV/TACIR16
Tennessee Valley Authority’s Payments in Lieu of TaxesAnnual Report to the Tennessee General Assembly
no need for another large nuclear facility,48 it submitted an application to the US Nuclear Regulatory Commission in May 2017 for the future placement of so-called “small modular reactor” units at a site near Oak Ridge, though TVA acknowledges it is “still several years away from any potential construction decision.”49 TVA has contracts to purchase electricity from eight wind farms.50 It recently entered contracts for solar power from projects being developed in Shelby County51 and Alabama,52 and in 2017, it announced the construction of a solar facility at its Allen plant in Memphis.53
TVA continues to modify its renewable energy incentive programs both within the changing market for renewables, such as wind, solar, and hydroelectric, and as part of its ongoing effort to rebalance its generating system. These programs have no effect on TVA’s gross revenues, nor do they affect power sales in any state, and so have little to no effect on PILOTs to the several states. Participants continue to buy power from their local power companies and sell all of the power they generate through a system called dual metering to TVA. Their only potential effect would be the extent to which they reduce the Authority’s acquisition of new power property in any particular state.
TVA is making substantial changes in these incentive programs as it implements its 2015 IRP. The Authority has said in the past that
as renewable energy system costs continue to decrease and become more affordable, there is less need for subsidies for small-scale renewable generation. TVA wants to promote sustainable growth in small-scale renewable generation while continuing to support local industry and provide a smooth path to grid parity.54
TVA has been encouraging the private sector to develop small and medium renewable energy projects by buying electricity from participants in several programs, two of which remain open to new applicants in 2018. The Green Power Providers program buys power from homeowners and businesses who install small renewable energy projects—including solar, wind, biomass, and hydro—with individual capacities of 50 kilowatts or less.55 A 50-kilowatt solar installation can provide enough power for approximately
48 Tennessee Valley Authority 2016a.49 Tennessee Valley Authority 2017f.50 Tennessee Valley Authority 2017b.51 Tennessee Valley Authority 2016c.52 Tennessee Valley Authority 2016b.53 Tennessee Valley Authority 2017d.54 Tennessee Valley Authority 2013b.55 Tennessee Valley Authority “Green Power Providers.”
New energy sources, including nuclear, natural
gas, wind, and solar, are being developed to meet
the region’s electricity needs.

17WWW.TN.GOV/TACIR
Tennessee Valley Authority’s Payments in Lieu of TaxesAnnual Report to the Tennessee General Assembly
five average-sized homes in Tennessee.56 The Green Power Providers program will continue adding new projects in 2018.57 Distributed Solar Solutions (DSS) is a pilot program that buys power from medium-sized solar projects directed by local power companies.58 Eligible projects were initially required to have capacities greater than 50 kilowatts but no more than five megawatts;59 the maximum individual capacity for new projects was reduced to two megawatts in 2017.60 Currently, TVA plans to continue accepting new applicants for the DSS pilot but has not yet finalized program details for 2018.61 The Renewable Standard Offer (RSO) program, which stopped accepting new applicants after 2015,62 buys power from owners of medium-sized projects—including solar, wind, biomass, or methane—with individual capacities greater than 50 kilowatts but no more than 20 megawatts.63 The RSO offering remains open to projects that have existing capacity allocations and are in the process of being completed.64
TVA has controlled the cost of its renewable energy programs by limiting participation and capacity and by reducing subsidies over time. The Authority limited the RSO to 100 megawatts of new capacity per year from 2011 when the program began through 2015,65 though it increased its annual limit on the RSO’s Solar Solutions Initiative—and access to the iniative’s premium rate—to 20 megawatts of new capacity in 201566 up from 10 megawatts when the initiative began in 2012.67 TVA has limited Distributed Solar Solutions to a total of 10 megawatts of new capacity per year since introducing the pilot program in 2016.68 TVA has also limited Green Power Providers to 10 megawatts of new capacity per year since it first placed a cap on the program in 2012.69 Half of the Green Power Providers program’s total allocation of 10 megawatts will be reserved for residential and smaller non-residential customers in 2018, while the other half will be reserved for larger non-residential customers.70 This is
56 Email from Grace Robertson, marketing manager, Lightwave Solar, February 23, 2015.57 Tennessee Valley Authority “Green Power Providers.”58 Tennessee Valley Authority “Distributed Solar Solutions.”59 Tennessee Valley Authority “Guidelines for Distributed Solar Solutions (2016).”60 Tennessee Valley Authority “Guidelines for Distributed Solar Solutions (2017).”61 Telephone interview with Steve Noe, manager, midscale renewables, Business Development and Renewables Group, Tennessee Valley Authority, January 16, 2018.62 Tennessee Valley Authority 2017b.63 Tennessee Valley Authority “Guidelines for Renewable Standard Offer.”64 Tennessee Valley Authority 2017b.65 Tennessee Valley Authority “Guidelines for Renewable Standard Offer.”66 Tennessee Valley Authority “Solar Solutions Initiative: Frequently Asked Questions.”67 Telephone interview with Neil Placer, senior manager, Renewable Energy Solutions, Tennessee Valley Authority, February 20, 2015.68 Tennessee Valley Authority “Guidelines for Distributed Solar Solutions (2016).”69 Telephone interview with Neil Placer, senior manager, Renewable Energy Solutions, Tennessee Valley Authority, February 20, 2015.70 Tennessee Valley Authority “Green Power Providers.” Under the program, smaller non-residential customers are those subject to the GSA-1 rate schedule. In general, the GSA-1 rate schedule is for businesses that not only have contracted demand or actual demand no greater than 50 kilowatts but also have used no more than 15,000 kilowatt-hours of electricity in any of the last 12 months.
TVA has controlled the cost of its renewable energy programs by limiting participation and capacity and by reducing subsidies over time.

WWW.TN.GOV/TACIR18
Tennessee Valley Authority’s Payments in Lieu of TaxesAnnual Report to the Tennessee General Assembly
a change from past years when the program’s 10-megawatt allocation was split equally between residential and non-residential customers.71
TVA pays RSO participants a base rate that varies seasonally and with time of day and that increases each year a participant remains in the program. The base rate for new RSO participants in 2015 varied from less than three cents per kilowatt-hour to more than five cents per kilowatt-hour when it was introduced, with participants receiving a 5% increase each year.72 Within the RSO program, participants who generate no more than one megawatt of solar power may earn a premium of four cents per kilowatt-hour through the Solar Solutions Initiative for the first 10 years they participate in the RSO,73 down from eight cents when the iniative began in 2012.74 Similar to its RSO participants, TVA pays Distributed Solar Solutions participants a base rate that varies seasonally and with time of day and that increases each year a participant remains in the program. The base rate for new DSS participants in 2017 ranged from less than three cents per kilowatt-hour to almost five cents per kilowatt-hour, a decrease from 2016 when it ranged from less than four cents per kilowatt-hour to almost seven cents per kilowatt-hour. But the annual percentage increase doubled to 3% from 1.5%. Similar to RSO participants who qualify for the Solar Solutions Initiative, DSS participants also earn a premium of almost three cents per kilowatt-hour in addition to the escalated base rate.75 TVA has not finalized a rate schedule for new participants in 2018.76 TVA continues to alter the rates paid to new Green Power Providers participants. New residential and smaller non-residential participants in 2018 with systems greater than 500 watts but no greater than 10 kilowatts will receive nine cents per kilowatt-hour; all other new participants will receive 7.5 cents per kilowatt-hour.77 New Green Power Providers participants had previously received at least the retail rate,78 which on average in Tennessee is approximately 10.5 cents per kilowatt-hour for residential customers, 10.3 cents per kilowatt-hour for commercial customers, and 5.9 cents per kilowatt-hour for industrial customers, according to the US Energy Information Administration.79 Prior to 2016, new participants also received an additional premium above the retail rate for the first 10 years they participated in the program, though
71 Tennessee Valley Authority “Green Power Providers Program Participation Guidelines (2017).”72 Tennessee Valley Authority “Renewable Standard Offer Contract.”73 Tennessee Valley Authority “Solar Solutions Initiative: Frequently Asked Questions.”74 Roy 2013.75 Tennessee Valley Authority “Distributed Solar Solutions Contract (2016)”; Tennessee Valley Authority “Distributed Solar Solutions Contract (2017)”; and Tennessee Valley Authority “Guidelines for Distributed Solar Solutions (2017).”76 Telephone interview with Steve Noe, manager, midscale renewables, Business Development and Renewables Group, Tennessee Valley Authority, January 16, 2018.77 Tennessee Valley Authority “Green Power Providers.”78 Tennessee Valley Authority “Green Power Providers Program Participation Guidelines (2017).”79 US Energy Information Administration 2017.

19WWW.TN.GOV/TACIR
Tennessee Valley Authority’s Payments in Lieu of TaxesAnnual Report to the Tennessee General Assembly
TVA had reduced this premium over the years to two cents per kilowatt-hour for new participants in 201580 from its original twelve cents in 2012.81
According to TVA’s October 2015 report on efforts to develop a method for assessing the benefits and costs associated with various forms of distributed power-generation like the ones supported by these programs, the average value for solar generation for TVA was just over seven cents per kilowatt-hour, which was less than the average retail rate charged in 2015.82 In order to develop the method, TVA assembled a cross-section of participants from the Tennessee Valley region, including local power companies, the Tennessee Valley Public Power Association, various environmentally focused non-governmental entities, solar industry representatives, academia, state governments, and national research institutions. Response to the report has been mixed. Among participants who were critical of the report, while generally complimentary of the process and the effort, the Southern Environmental Law Center said the analysis did not properly consider solar power’s environmental and health benefits,83 and the Southern Alliance for Clean Energy, agreeing with that assessment, expressed concern that TVA already “lags behind neighboring states like Georgia and North Carolina in developing a strong solar market.”84 But others urged TVA to pursue the least cost source of power to keep its electric rates as low and competitive as possible.85
80 Tennessee Valley Authority “Green Power Providers Program Participation Guidelines (2015).”81 Smith and Coggeshall 2013.82 Flessner 2015; and Tennessee Valley Authority 2015b.83 Southern Environmental Law Center 2015.84 Nelson 2015.85 Flessner 2015.


21WWW.TN.GOV/TACIR
Tennessee Valley Authority’s Payments in Lieu of TaxesAnnual Report to the Tennessee General Assembly
ReferencesCanning, Rob, Chad Lampe, and John Null. 2014. “Damage to at Least 40% of MSU’s Main Buildings Due to
Power Outage and Freezing Temps.” WKMS, January 7. http://wkms.org/post/damage-least-40-msus-main-buildings-due-power-outage-and-freezing-temps.
Flessner, Dave. 2014. “‘Arctic Blast’ Pushes TVA Power Use to All-Time High.” Chattanooga Times Free Press, January 8. http://www.timesfreepress.com/news/business/aroundregion/story/2014/jan/08/arctic-blast-pushes-tva-power-use-all-time-high/128523/.
———. 2015. “Study find value of solar power less than what TVA pays.” Chattanooga Times Free Press, October 21. http://www.timesfreepress.com/news/business/aroundregion/story/2015/oct/21/study-find-value-solar-power-less-whtvpays/331624/.
———. 2017. “Boone Dam Repairs to Cost TVA $450 Million.” Chattanooga Times Free Press, August 10. http://www.timesfreepress.com/news/business/aroundregion/story/2017/aug/10/boone-dam-repairs-cost-tv450-million/442797/.
Henry, Devin. 2017. “Dem AG Vows to Sue Over Clean Power Plan Repeal.” The Hill, October 9. http://thehill.com/policy/energy-environment/354572-dem-ag-vows-to-sue-over-clean-power-plan-repeal.
Nelson, Toni. 2015. “TVA Undermines Distributed Solar and Disregards Its Own Stakeholder Process.” Footprints on the Path to Clean Energy (blog), Southern Alliance for Clean Energy, November 11. http://blog.cleanenergy.org/2015/11/11/tva-undermines-distributed-solar-and-disregards-its-own-stakeholder-process/.
Roy, Asa. 2013. PV Solar Resource Guide for Rural Distributors in TN. http://cire.utk.edu/files/Roy,%20Asa%20-%20Solar%20Resources%20in%20Rural%20TN.pdf (link discontinued).
Schoolfield, Stephen. 2017. “TACIR Commission—TVA’s PILOT.” Presentation at TACIR meeting, December 14.
Smith, Stephen A. and Charlie Coggeshall. 2013. “TVA Continues to Mismanage Solar.” Footprints on the Path to Clean Energy (blog), Southern Alliance for Clean Energy, May 10. http://blog.cleanenergy.org/2013/05/10/tva-continues-to-mismanage-solar-power/.
Southern Environmental Law Center. 2015. “New TVA analysis takes first step toward recognizing the value of solar.” News release, October 20. https://www.southernenvironment.org/news-and-press/news-feed/new-tva-analysis-takes-first-step-toward-recognizing-the-value-of-solar.
Tennessee Advisory Commission on Intergovernmental Relations. 2010. The Electric Generation and Transmission Cooperative Act of 2009 and Its Possible Impact on the Tennessee Valley Authority’s Payments in Lieu of Taxes. https://www.tn.gov/content/dam/tn/tacir/documents/electric_generation_cooperative_act.pdf.
Tennessee Valley Authority. 2009. Form 10-Q for the Quarterly Period Ended June 30, 2009.
———. 2011. Environmental Impact Statement for TVA’s Integrated Resource Plan: TVA’s Environmental & Energy Future, Volume 1.
———. 2013a. Form 10-K.
———. 2013b. “Green Power Providers: Frequently Asked Questions.” Accessed February 10, 2015. http://www.tva.com/greenpowerswitch/providers/pdf/gpp_faq.pdf (link discontinued).

WWW.TN.GOV/TACIR22
Tennessee Valley Authority’s Payments in Lieu of TaxesAnnual Report to the Tennessee General Assembly
———. 2013c. “TVA Secures Lease-Purchase Financing for Mississippi Gas Plant.” News release, August 9. http://www.tva.gov/news/releases/julsep13/miss_gas_plant.htm (link discontinued).
———. 2014a. Budget Proposal and Management Agenda: For the Fiscal Year Ending September 30, 2015. https://www.tva.gov/file_source/TVA/Site%20Content/About%20TVA/Guidelines%20and%20Reports/budget_proposal_2015.pdf.
———. 2014b. Form 10-K.
———. 2014c. “TVA System Meets Single-Day Electricity Record.” News release, January 8. https://www.tva.gov/Newsroom/Press-Releases/TVA-System-Meets-SingleDay-Electricity-Record (link discontinued).
———. 2015a. “Conservation, Preparation Key to Meeting High Electric Power Demand.” News release, January 8. https://www.tva.gov/Newsroom/Press-Releases/Conservation,-Preparation-Key-to-Meeting-High-Electric-Power-Demand.
———. 2015b. Distributed Generation—Integrated Value (DG-IV): A Methodology to Value DG on the Grid. https://www.tva.gov/file_source/TVA/Site%20Content/Energy/Renewables/dgiv_document_october_2015-2.pdf.
———. 2015c. Form 10-K.
———. 2015d. Integrated Resource Plan.
———. 2015e. “TVA Completes Purchase of Mississippi Natural Gas Plant.” News release, April 14. https://www.tva.gov/Newsroom/Press-Releases/TVA-Completes-Purchase-of-Mississippi-Natural-Gas-Plant.
———. 2015f. “TVA Meets February Record Peak Demand.” News release, February 19. https://www.tva.gov/Newsroom/Press-Releases/TVA-Meets-February-Record-Peak-Demand.
———. 2015g. “TVA Response to Administration’s FY 2016 Budget.” News release, February 2. https://www.tva.gov/Newsroom/Press-Releases/TVA-Response-to-Administration%E2%80%99s-FY-2016-Budget.
———. 2015h. “TVA’s Integrated Resource Plan Calls for Low-Cost, Reliable Energy Choices.” News release, July 13. https://www.tva.gov/Newsroom/Press-Releases/TVA%E2%80%99s-Integrated-Resource-Plan-Calls-for-Low%E2%80%93Cost,-Reliable-Energy-Choices.
———. 2016a. “TVA Completes Bellefonte Sale.” News release, November 14. https://www.tva.gov/Newsroom/Press-Releases/TVA-Completes-Bellefonte-Sale.
———. 2016b. “TVA, NextEra Energy Resources Celebrate Commissioning of Alabama’s Largest Solar Energy Project.” News release, November 18. https://www.tva.gov/Newsroom/Press-Releases/TVA-NextEra-Energy-Resources-Celebrate-Commissioning-of-Alabamas-Largest-Solar-Energy-Project.
———. 2016c. “TVA and Silicon Ranch Partner on Large-Scale Solar Farm at NSA Mid-South.” News release, April 18. https://www.tva.gov/Newsroom/Press-Releases/TVA-and-Silicon-Ranch-Partner-on-Large%E2%80%93Scale-Solar-Farm-at-NSA-Mid%E2%80%93South.
———. 2016d. “TVA’s Watts Bar Unit 2 Achieves Commercial Operation.” News release, October 19. https://www.tva.gov/Newsroom/Press-Releases/TVAs-Watts-Bar-Unit-2-Achieves-Commercial-Operation.
———. 2017a. Budget Proposal and Management Agenda: For the Fiscal Year Ending September 30, 2018. https://www.tva.com/file_source/TVA/Site%20Content/About%20TVA/Guidelines%20and%20Reports/fy_2018.pdf.
———. 2017b. Form 10-K.

23WWW.TN.GOV/TACIR
Tennessee Valley Authority’s Payments in Lieu of TaxesAnnual Report to the Tennessee General Assembly
———. 2017c. Form 10-Q for the Quarterly Period Ended March 31, 2017.
———. 2017d. “TVA Installing Solar Site in Memphis.” News release, April 25. https://www.tva.gov/Newsroom/Press-Releases/TVA-Installing-Solar-Site-in-Memphis.
———. 2017e. “TVA Maintains Focus on Delivering Value to the People of the Tennessee Valley.” News release, November 9. https://www.tva.gov/Newsroom/Press-Releases/TVA-Maintains-Focus-on-Delivering-Value-to-the-People-of-the-Tennessee-Valley.
———. 2017f. “TVA Submits Early Site Permit Application for Clinch River SMRs.” News release, May 13. https://www.tva.gov/Newsroom/Press-Releases/TVA-Submits-Early-Site-Permit-Application-For-Clinch-River-SMRs.
———. 2018. “TVA Takes Johnsonville Fossil Plant Offline.” News release, January 4. https://www.tva.gov/Energy/TVA-Takes-Johnsonville-Fossil-Plant-Offline.
———. “Distributed Solar Solutions.” Accessed January 16, 2018. https://www.tva.gov/Energy/Valley-Renewable-Energy/Distributed-Solar-Solutions.
———. “Distributed Solar Solutions Contract (2016).” Accessed December 28, 2015. https://www.tva.gov/file_source/TVA/Site%20Content/Energy/Renewables/Distributed%20Solar%20Solutions/DSS%20Contract.pdf.
———. “Distributed Solar Solutions Contract (2017).” Accessed January 16, 2018. https://www.tva.gov/file_source/TVA/Site%20Content/Economic%20Development/Our%20Team%20and%20Partners/PDFs/2017_dss_contract_.pdf.
———. “Green Power Providers.” Accessed January 16, 2018. https://www.tva.gov/Energy/Valley-Renewable-Energy/Green-Power-Providers.
———. “Green Power Providers Program Participation Guidelines (Effective January 1, 2015).” Accessed December 28, 2015. https://www.tva.gov/file_source/TVA/Site%20Content/Energy/Renewables/Green%20Power%20Providers/GPP_Guidelines_2015.pdf.
———. “Green Power Providers Program Participation Guidelines (Effective January 1, 2017).” Accessed January 4, 2018. https://www.tva.gov/file_source/TVA/Site%20Content/Energy/Renewables/Green%20Power%20Providers/gpp_guidelines_2017.pdf.
———. “Guidelines for Distributed Solar Solutions (2016).” Accessed December 28, 2015. https://www.tva.gov/file_source/TVA/Site%20Content/Energy/Renewables/Distributed%20Solar%20Solutions/DSS%20Guidelines.pdf.
———. “Guidelines for Distributed Solar Solutions (2017).” Accessed October 26, 2017. https://www.tva.gov/file_source/TVA/Site%20Content/Economic%20Development/Our%20Team%20and%20Partners/PDFs/2017_dss_guidelines_.pdf.
———. “Guidelines for Renewable Standard Offer.” Accessed December 28, 2015. https://www.tva.com/file_source/TVA/Site%20Content/Energy/Renewables/Renewable%20Standard%20Offer/guidelines.pdf. (link discontinued).
———. “Renewable Standard Offer Contract.” Accessed December 28, 2015. https://www.tva.com/file_source/TVA/Site%20Content/Energy/Renewables/Renewable%20Standard%20Offer/contract.pdf. (link discontinued).

WWW.TN.GOV/TACIR24
Tennessee Valley Authority’s Payments in Lieu of TaxesAnnual Report to the Tennessee General Assembly
———. “Solar Solutions Initiative: Frequently Asked Questions.” Accessed December 28, 2015. https://www.tva.com/Energy/Renewable-Energy-Solutions/Solar-Solutions-Initiative/Solar-Solutions-Initiative-Q-%2B-A (link discontinued).
The New York Times. 2017. “What Is the Clean Power Plan, and How Can Trump Repeal It?” The New York Times, October 10. https://www.nytimes.com/2017/10/10/climate/epa-clean-power-plan.html.
Tsang, Linda and Alexandra M. Wyatt. 2017. Clean Power Plan: Legal Background and Pending Litigation in West Virginia v. EPA. Congressional Research Service, March 8. https://fas.org/sgp/crs/misc/R44480.pdf.
US Energy Information Administration. 2017. “Table 5.6.A. Average Price of Electricity to Ultimate Customers by End-Use Sector.” Electric Power Monthly, December 22. https://www.eia.gov/electricity/monthly/archive/december2017.pdf.
US Environmental Protection Agency. 2017a. “Fact Sheet: Overview of the Clean Power Plan.” Last modified May 9. Accessed October 30, 2017. https://archive.epa.gov/epa/cleanpowerplan/fact-sheet-overview-clean-power-plan.html.
———. 2017b. Repeal of Carbon Pollution Emission Guidelines for Existing Stationary Sources: Electric Utility Generating Units. Proposed rule. 82 Fed. Reg. 48035, issued October 10, and published October 16.
US General Accounting Office. 2003. Tennessee Valley Authority: Information on Lease-Leaseback and Other Financing Arrangements. GAO-03-784, June.
Volcovici, Valerie. 2017. “Trump EPA to Propose Repealing Obama’s Climate Regulation Document.” Reuters, October 4. http://www.reuters.com/article/us-usa-epa-carbon-exclusive/trump-epa-to-propose-repealing-obamas-climate-regulation-document-idUSKCN1C90BY.

25WWW.TN.GOV/TACIR
Tennessee Valley Authority’s Payments in Lieu of TaxesAnnual Report to the Tennessee General Assembly
Appendix A: TVA’s Allocation Formula
Section 13 ‐ In Lieu of Tax Payments Overview
Overview: Section 13 of the TVA Act requires TVA to pay ‘tax equivalent payments’ to states in which its power operations are carried out and to counties in which it has acquired reservoir land, allocable to power purposes, or power properties that were formerly subject to local ad valorem taxation. Power operations are determined to be carried out if TVA has power sales and/or holds power property in a given state. Calculation: The total tax equivalent payments to be paid to the states and counties is determined by taking 5 percent of gross proceeds from the sale of power, from the prior fiscal year, (excluding sales to federal agencies, off‐system sales, and interdivisional sales). The resulting amount is essentially the “bucket” of tax equivalent payments that are to be distributed to the states and counties which TVA carries out its power operations. Currently, the eight states in which TVA carries out its power operations are: Alabama, Georgia, Illinois, Kentucky, Mississippi, North Carolina, Tennessee, and Virginia. The percentage amount to be allocated to each state is determined by a two‐part calculation; 1.) 50 percent is based on the ratio of TVA power property within the respective state, compared to TVA’s total net book value of power properties for the prior fiscal year, and 2.) 50 percent is based on the ratio of power sales within the respective state, compared to TVA’s total power sales for the prior fiscal year. The two percentages, calculated above, are then averaged and the resulting percentage is multiplied by the total “bucket” of tax equivalent payments to be distributed, and the resulting dollar amount represents the payments to be distributed to the respective state during TVA’s fiscal year. Direct Payments to counties: The TVA Act also requires TVA to directly make payments to counties in which TVA has acquired/purchased reservoir land, allocable to power purposes, or power property from a privately owned and operated utility company. (E.g. TVA purchases a power plant from Southern Company in order to serve a given load in the TVA service territory. Whereas Southern Company has historically paid property taxes to the county in which this power property is located, TVA is not subject to taxation and therefore the county cannot levy property taxes for this power property. However, in an effort to keep the county whole, the TVA Act requires TVA to make payments “in‐lieu” of taxes to the county.) The amount to be paid to the county is determined by taking the average of the prior two years property tax bills and the resulting amount is paid, annually, to the county for as long as TVA owns the property. In addition, any direct payments to a county reduce the amount paid directly to the state by TVA. While this reduces the total amount paid directly to the state, it doesn’t change the overall tax equivalent payments that the state is due, determined above. Section 15(d)g of the TVA Act: This section recognizes that generating facilities operated by TVA under lease or lease purchase agreements constitute power property held by TVA within the meaning of Section 13. As such, any property taxes reimbursed by TVA to the leaseholder, as a result of the negotiated lease agreement, will reduce the overall amount owed to the state by TVA. This section essentially prevents a “double‐dipping” on the tax payments to the county/state since TVA has already reimbursed the leaseholder for the property taxes. Additional Facts: ‐ The TVA Board, each November, approves the estimated (based on unaudited financial numbers) payments, for the current fiscal year, to be paid during the months of October through August. ‐ In addition, the Board approves the “final” payment for September of the prior fiscal year which is based off audited financial data. ‐ Each state redistributes the tax equivalent payments to the counties based upon each state’s individual legislation. ‐ Once TVA has remitted the tax equivalent payments to the individual states it has no authority to dictate how the monies are redistributed.

WWW.TN.GOV/TACIR26
Tennessee Valley Authority’s Payments in Lieu of TaxesAnnual Report to the Tennessee General Assembly
Example: State of Example's Tax Equivalent Payments for FY20XX
FY 20XX Gross proceeds from Power Sales:
$11,000,000,000
Multiplied by 5%:$550,000,000 (Represents "bucket" of taxequivalent dollars to be allocated to the states
and counties.)
Example's calculated percentage of total TVA power assets: 23%
Example's calculatedpercentage of total TVA power sales: 15%
CalculatedAverage:19%
Multiply by:
Example's calculated share of total "bucket" of In‐Lieu‐of‐tax payments:
$104,500,000
Total payments to the STATE of Example:$98,500,000
Total payments to COUNTIES in Example:$6,000,000
NOTE: Total payments to the state are reduced by $6M, due to the direct payment and section 15(d)g provisions. However total payments to the state of Example as a whole (including counties within the state), are $104.5M, as calculated above.
TVA must make $1,000,000 direct payments to County for power property that it purchased from Southern Company approximately five years ago. (DIRECT PAYMENTS‐ reduction to payments to the state.)
TVA makes $5,000,000 annual payments to a leaseholder for a lease purchase agreement related to a power‐generating facility (Section 15(d)g payment reduction to the state)Reduce by:
Reduce by:
NOTE: Amounts above are for illustrative purposes only and do NOT represent actual amounts for a specific fiscal year.
Source: Schoolfield 2017.
27WWW.TN.GOV/TACIR
Tennessee Valley Authority’s Payments in Lieu of TaxesAnnual Report to the Tennessee General Assembly
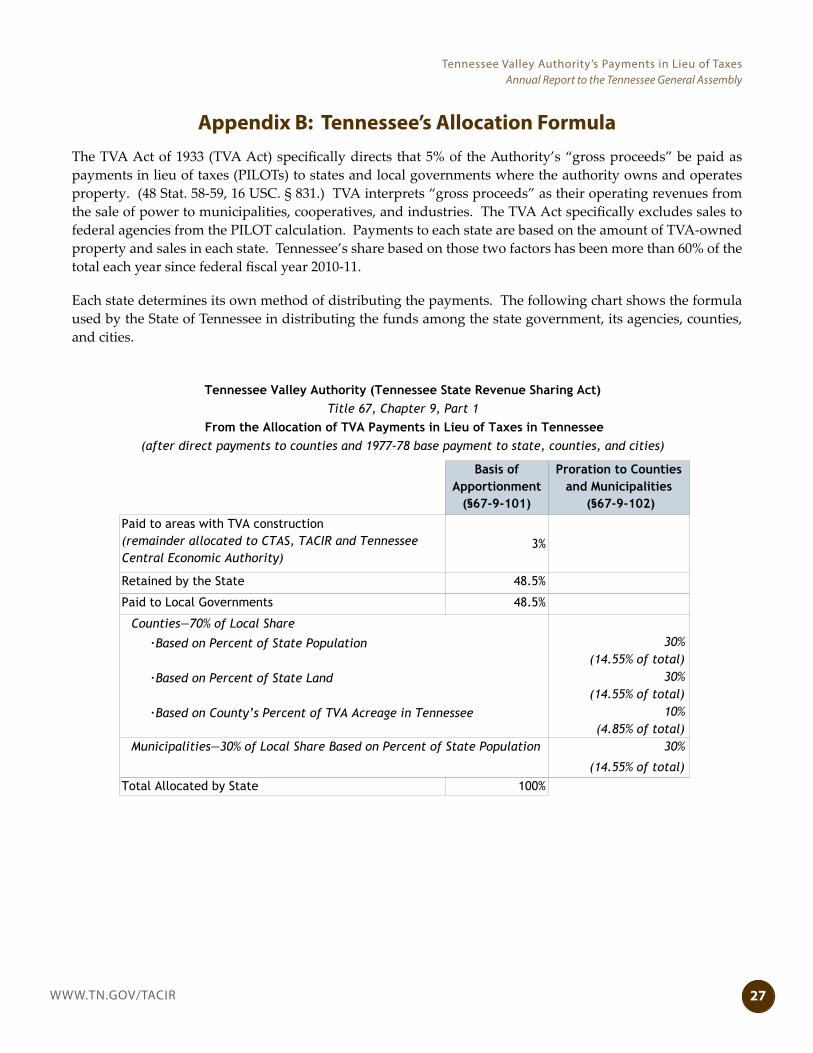
Appendix B: Tennessee’s Allocation FormulaThe TVA Act of 1933 (TVA Act) specifically directs that 5% of the Authority’s “gross proceeds” be paid as payments in lieu of taxes (PILOTs) to states and local governments where the authority owns and operates property. (48 Stat. 58-59, 16 USC. § 831.) TVA interprets “gross proceeds” as their operating revenues from the sale of power to municipalities, cooperatives, and industries. The TVA Act specifically excludes sales to federal agencies from the PILOT calculation. Payments to each state are based on the amount of TVA-owned property and sales in each state. Tennessee’s share based on those two factors has been more than 60% of the total each year since federal fiscal year 2010-11.
Each state determines its own method of distributing the payments. The following chart shows the formula used by the State of Tennessee in distributing the funds among the state government, its agencies, counties, and cities.
Basis of Apportionment
(§67-9-101)
Proration to Counties and Municipalities
(§67-9-102)
Paid to areas with TVA construction(remainder allocated to CTAS, TACIR and Tennessee Central Economic Authority)
3%
Retained by the State 48.5%
Paid to Local Governments 48.5%
30%(14.55% of total)
30%(14.55% of total)
10%(4.85% of total)
30%
(14.55% of total)Total Allocated by State 100%
·Based on County’s Percent of TVA Acreage in Tennessee
Municipalities—30% of Local Share Based on Percent of State Population
Counties—70% of Local Share
·Based on Percent of State Population
·Based on Percent of State Land
Tennessee Valley Authority (Tennessee State Revenue Sharing Act)Title 67, Chapter 9, Part 1
From the Allocation of TVA Payments in Lieu of Taxes in Tennessee(after direct payments to counties and 1977-78 base payment to state, counties, and cities)


29WWW.TN.GOV/TACIR
Tennessee Valley Authority’s Payments in Lieu of TaxesAnnual Report to the Tennessee General Assembly
Appendix C: Distribution of Counties’ Share of TVA Payments in Lieu of Taxes to Tennessee by Tennessee Fiscal Year
Distribution of Counties’ Share of TVA Payments in Lieu of Taxes to Tennessee by Tennessee Fiscal YearCounty 2017-18 2016-17 2015-16 2014-15 2013-14 2012-13 2011-12 2010-11
Anderson 1,148,257$ 1,140,471$ 1,173,627$ 1,157,568$ 1,107,511$ 1,136,571$ 1,147,126$ 1,100,866$
Bedford 806,433 800,352 826,171 813,673 774,647 797,382 806,367 732,398
Benton 1,725,938 1,714,385 1,766,920 1,741,324 1,662,030 1,708,401 1,727,685 1,633,032
Bledsoe 496,430 492,676 508,555 500,872 476,869 490,848 496,357 468,146
Blount 1,454,729 1,443,998 1,489,557 1,467,505 1,398,641 1,438,757 1,454,611 1,326,878
Bradley 1,059,194 1,051,291 1,084,953 1,068,668 1,017,788 1,047,433 1,058,574 981,379
Campbell 1,316,850 1,307,542 1,348,530 1,328,569 1,266,520 1,302,746 1,317,495 1,254,904
Cannon 370,065 367,340 378,865 373,289 355,867 366,014 370,013 348,509
Carroll 786,049 780,040 805,454 793,157 754,741 777,115 785,932 758,072
Carter 831,239 825,098 851,393 838,655 798,916 822,077 831,293 810,761
Cheatham 558,137 553,870 571,916 563,184 535,905 551,793 558,053 525,121
Chester 400,739 397,676 410,633 404,364 384,777 396,185 400,680 374,276
Claiborne 950,425 943,604 973,360 958,919 913,968 940,195 950,780 895,244
Clay 278,249 276,122 285,118 280,766 267,166 275,086 278,207 265,325
Cocke 754,642 749,426 771,553 760,844 727,398 746,880 754,576 718,123
Coffee 969,841 962,603 993,854 978,703 931,481 959,016 970,045 908,690
Crockett 361,141 358,381 370,056 364,407 346,771 357,050 361,100 346,011
Cumberland 1,050,235 1,042,213 1,076,151 1,059,729 1,006,632 1,036,458 1,048,212 952,613
Davidson 4,628,778 4,593,798 4,741,771 4,670,173 4,446,488 4,576,766 4,628,107 4,361,282
Decatur 624,479 620,217 638,793 629,779 601,716 618,088 624,690 593,986
DeKalb 413,787 410,625 424,001 417,529 397,308 409,085 413,726 389,484
Dickson 816,079 809,854 836,184 823,445 783,642 806,824 816,097 813,609
Dyer 769,896 764,011 788,979 776,934 739,302 761,219 769,856 736,296
Fayette 955,036 947,735 978,614 963,673 916,995 944,181 954,893 851,112
Fentress 615,119 610,417 630,305 620,682 590,617 608,127 615,027 576,256
Franklin 1,120,924 1,113,088 1,147,012 1,130,560 1,079,303 1,109,196 1,121,190 1,043,522
Gibson 925,401 918,328 948,247 933,771 888,542 914,884 925,264 885,645
Giles 808,090 801,957 827,896 815,345 776,135 798,972 807,970 773,003
Grainger 983,113 976,602 1,005,707 991,550 947,604 973,279 983,827 926,382
Greene 1,107,440 1,099,096 1,134,480 1,117,355 1,063,869 1,095,024 1,107,326 1,039,792
Grundy 454,442 450,999 465,559 458,514 436,505 449,323 454,374 437,177
Hamblen 895,606 889,305 916,902 903,504 861,818 886,145 895,993 851,911
Hamilton 3,458,866 3,433,751 3,542,017 3,489,550 3,326,019 3,421,361 3,459,494 3,270,907
Hancock 267,569 265,524 274,174 269,989 256,913 264,528 267,529 253,632
Hardeman 848,556 842,070 869,506 856,231 814,757 838,912 848,431 814,763
Hardin 1,085,003 1,077,274 1,110,917 1,094,593 1,043,767 1,073,418 1,085,365 1,030,245
Hawkins 1,291,118 1,282,909 1,318,698 1,301,342 1,247,268 1,278,803 1,291,456 1,233,682
Haywood 668,267 663,010 684,599 674,151 641,516 660,525 668,026 642,046
Henderson 843,627 837,362 864,648 851,486 810,501 834,487 844,041 791,075
Henry 1,682,427 1,670,799 1,722,705 1,697,459 1,619,085 1,664,871 1,683,664 1,591,410
Hickman 788,690 782,792 807,737 795,667 757,959 779,742 788,395 736,402
Houston 417,012 414,070 426,986 420,714 401,205 412,591 417,208 393,999
Humphreys 1,562,903 1,552,477 1,599,168 1,576,452 1,505,955 1,547,147 1,564,093 1,477,349
Jackson 383,846 380,911 393,322 387,317 368,556 379,483 383,788 361,090
Jefferson 1,006,702 1,000,580 1,027,208 1,014,289 974,060 997,527 1,006,976 938,892
Johnson 494,271 490,759 505,769 498,499 475,815 489,034 494,287 470,204
Knox 3,532,625 3,506,590 3,617,045 3,564,161 3,397,172 3,493,517 3,531,930 3,256,384
Lake 220,157 218,474 225,592 222,148 211,388 217,655 220,124 211,242
Lauderdale 655,321 650,313 671,477 661,229 629,212 647,859 655,207 624,612
Lawrence 892,645 885,845 914,610 900,692 857,208 882,533 892,513 847,209
Lewis 364,473 361,711 373,390 367,739 350,084 360,367 364,419 342,683

WWW.TN.GOV/TACIR30
Tennessee Valley Authority’s Payments in Lieu of TaxesAnnual Report to the Tennessee General Assembly
Distribution of Counties’ Share of TVA Payments in Lieu of Taxes to Tennessee by Tennessee Fiscal YearCounty 2017-18 2016-17 2015-16 2014-15 2013-14 2012-13 2011-12 2010-11
Lincoln 794,397 788,370 813,863 801,528 762,990 785,435 794,280 749,557
Loudon 1,137,478 1,131,078 1,159,187 1,145,537 1,103,081 1,127,861 1,137,769 1,049,161
Macon 452,186 448,729 463,349 456,275 434,174 447,046 452,119 423,871
Madison 1,204,133 1,194,946 1,233,824 1,214,961 1,156,193 1,190,421 1,203,913 1,145,433
Marion 1,180,630 1,172,933 1,206,616 1,190,264 1,139,383 1,169,001 1,181,424 1,127,850
Marshall 585,272 580,870 599,491 590,481 562,331 578,726 585,187 540,818
Maury 1,180,372 1,171,466 1,209,217 1,190,947 1,133,882 1,167,122 1,180,242 1,078,721
McMinn 895,732 889,511 915,988 903,169 863,151 886,466 895,699 853,788
McNairy 732,372 726,774 750,453 738,589 702,813 723,650 731,860 690,053
Meigs 789,534 779,845 803,409 791,935 756,365 777,159 785,769 741,479
Monroe 1,596,020 1,585,671 1,630,983 1,608,999 1,540,592 1,580,511 1,596,657 1,495,898
Montgomery 1,661,232 1,648,543 1,702,216 1,676,246 1,595,111 1,642,365 1,660,987 1,412,457
Moore 204,769 203,279 209,673 206,575 196,911 202,544 204,788 183,409
Morgan 670,131 664,854 686,398 675,974 643,406 662,374 669,848 624,298
Obion 757,329 751,541 776,021 764,176 727,170 748,723 757,216 731,502
Overton 577,016 572,606 591,262 582,235 554,033 570,458 576,930 539,338
Perry 665,771 661,077 681,478 671,581 640,758 658,738 665,973 627,042
Pickett 192,111 190,643 196,854 193,849 184,459 189,928 192,082 181,526
Polk 794,851 790,102 810,455 800,594 769,837 787,770 794,908 758,495
Putnam 870,259 863,646 891,761 878,158 835,657 860,410 870,164 792,789
Rhea 1,157,939 1,150,431 1,183,879 1,167,614 1,117,108 1,146,610 1,158,702 1,089,000
Roane 1,604,918 1,594,781 1,639,940 1,620,023 1,551,797 1,591,648 1,607,852 1,535,851
Robertson 908,258 901,323 930,656 916,354 872,017 897,839 908,015 811,532
Rutherford 2,338,930 2,321,247 2,396,046 2,359,854 2,246,782 2,312,637 2,338,588 1,817,568
Scott 672,904 667,760 689,517 678,990 646,101 665,256 672,804 634,567
Sequatchie 367,092 364,355 375,932 370,330 352,829 363,022 367,039 333,743
Sevier 1,249,557 1,240,164 1,280,090 1,260,762 1,200,413 1,235,571 1,249,480 1,100,751
Shelby 7,016,977 6,964,888 7,185,270 7,078,634 6,745,491 6,939,521 7,015,996 6,980,900
Smith 482,866 479,384 494,172 487,014 464,662 477,683 482,832 454,953
Stewart 2,791,312 2,772,961 2,857,324 2,816,181 2,688,874 2,763,366 2,783,192 2,590,836
Sullivan 1,788,290 1,775,264 1,831,340 1,804,161 1,719,425 1,768,826 1,788,563 1,753,034
Sumner 1,642,536 1,624,332 1,676,777 1,651,393 1,572,119 1,618,297 1,636,538 1,432,404
Tipton 852,219 845,712 873,233 859,917 818,315 842,544 852,092 769,609
Trousdale 211,912 210,501 216,542 213,616 204,485 209,807 211,923 200,505
Unicoi 305,365 303,033 312,896 308,124 293,214 301,897 305,319 292,625
Union 1,069,374 1,062,503 1,093,583 1,078,448 1,031,532 1,058,960 1,070,325 1,012,221
Van Buren 333,888 331,407 341,952 336,847 320,909 330,195 333,869 315,160
Warren 754,461 749,031 772,074 760,921 726,089 746,379 754,395 722,461
Washington 1,163,691 1,155,001 1,191,801 1,173,993 1,118,365 1,150,766 1,163,545 1,063,613
Wayne 855,624 849,097 876,736 863,361 821,581 845,916 855,513 807,521
Weakley 815,671 809,450 835,781 823,040 783,237 806,419 815,559 782,975
White 583,823 579,453 598,047 589,045 560,941 577,315 583,797 563,790
Williamson 1,796,604 1,783,034 1,840,433 1,812,660 1,725,892 1,776,427 1,796,341 1,419,606
Wilson 1,329,458 1,319,411 1,361,917 1,341,350 1,277,095 1,314,518 1,329,268 1,147,797
Total 99,936,128$ 99,201,346$ 102,309,124$ 100,805,418$ 96,107,481$ 98,843,609$ 99,921,756$ 93,348,135$

31WWW.TN.GOV/TACIR
Tennessee Valley Authority’s Payments in Lieu of TaxesAnnual Report to the Tennessee General Assembly
Appendix D: Distribution of Cities’ Share of TVA Payments in Lieu of Taxes to Tennessee by Tennessee Fiscal Year
Distribution of Cities’ Share of TVA Payments in Lieu of Taxes to Tennessee by Tennessee Fiscal Year
City 2017-18 2016-17 2015-16 2014-15 2013-14 2012-13 2011-12 2010-11
Adams 7,178$ 7,142$ 7,428$ 7,337$ 7,003$ 7,219$ 7,314$ 6,370$
Adamsville 25,139 25,015 26,012 25,693 24,530 25,281 25,615 22,429
Alamo 27,912 27,773 28,886 28,529 27,233 28,071 28,443 26,925
Alcoa 95,807 95,330 99,149 97,925 93,477 96,351 97,629 87,037
Alexandria 10,954 10,899 11,336 11,196 10,687 11,016 11,162 9,161
Algood 39,632 39,434 41,014 40,508 38,667 39,856 40,385 35,450
Allardt 7,189 7,153 7,440 7,348 7,014 7,230 7,326 7,225
Altamont 11,850 11,791 12,263 12,112 11,561 11,917 12,075 12,784
Ardmore 13,755 13,686 14,235 14,059 13,420 13,833 14,016 13,392
Arlington 137,094 136,411 141,876 140,125 133,759 131,338 133,080 109,241
Ashland City 51,493 51,236 53,289 52,631 50,240 51,785 52,472 45,578
Athens 152,751 151,990 158,074 156,125 149,039 153,617 155,653 150,203
Atoka 107,430 94,630 98,422 97,207 92,791 95,644 96,912 94,566
Atwood 10,636 10,583 11,007 10,872 10,378 10,697 10,839 11,254
Auburntown 3,050 3,035 3,157 3,118 2,976 3,068 3,108 2,836
Baileyton 4,887 4,863 5,058 4,995 4,768 4,915 4,980 5,672
Baneberry 5,466 5,438 5,656 5,586 5,333 5,497 5,570 5,278
Bartlett 640,545 637,351 662,887 654,705 604,217 622,796 631,057 528,413
Baxter 15,478 15,401 16,018 15,821 15,102 15,566 15,773 14,394
Bean Station 34,631 34,458 35,839 35,257 33,656 34,303 32,655 29,249
Beersheba Spring 5,409 5,382 5,598 5,529 5,277 5,440 5,512 6,223
Bell Buckle 5,670 5,641 5,868 5,795 5,532 5,702 5,778 4,558
Belle Meade 33,021 32,856 34,172 33,751 32,217 33,208 33,648 33,120
Bells 27,634 27,497 28,598 28,245 26,962 27,791 28,160 26,030
Benton 15,705 15,627 16,253 16,052 15,323 15,794 16,004 15,148
Berry Hill 10,920 10,865 6,302 6,224 5,941 6,124 6,205 7,585
Bethel Springs 8,142 8,101 8,426 8,322 7,944 8,188 8,297 8,587
Big Sandy 6,996 6,964 7,216 7,135 6,842 7,032 7,116 6,509
Blaine 21,046 20,941 21,780 21,511 20,534 21,165 21,446 18,974
Bluff City 20,101 20,003 20,787 20,536 19,623 20,213 20,475 17,995
Bolivar 61,426 61,120 63,569 62,784 59,932 61,774 62,594 65,295
Braden 3,198 3,182 3,309 3,268 3,120 3,216 3,259 3,050
Bradford 11,907 11,848 12,322 12,170 11,618 11,975 12,133 12,549
Brentwood 458,127 455,842 474,106 429,531 410,018 422,625 428,231 396,833
Brighton 31,013 30,859 32,095 31,699 30,259 31,189 31,603 29,665
Bristol 306,349 304,839 316,910 313,042 298,983 308,066 312,105 291,356
Brownsville 116,871 116,289 120,942 119,451 114,032 117,533 119,090 121,121
Bruceton 16,760 16,676 17,344 17,130 16,352 16,855 17,078 17,488
Bulls Gap 8,369 8,327 8,660 8,554 8,165 8,416 8,528 8,035
Burlison 4,819 4,795 4,987 4,926 4,702 4,847 4,911 5,098
Burns 16,646 16,563 17,227 17,014 16,241 16,741 16,963 16,194
Byrdstown 9,106 9,060 9,423 9,307 8,884 9,157 9,279 10,162
Calhoun 5,556 5,529 5,750 5,679 5,421 5,588 5,662 5,582
Camden 40,618 40,416 42,035 41,516 39,630 40,848 41,390 43,080
Carthage 26,149 26,018 27,061 26,727 25,513 26,297 26,646 25,332
Caryville 26,047 25,917 26,955 26,623 25,413 26,195 26,542 25,411
Cedar Hill 3,561 3,543 3,685 3,639 3,474 3,581 3,628 3,354
Celina 16,953 16,868 17,544 17,327 16,540 17,049 17,275 15,519
Centertown 2,755 2,742 2,852 2,816 2,688 2,771 2,808 2,892
Centerville 41,479 41,273 42,921 42,393 40,474 41,714 42,265 42,844

WWW.TN.GOV/TACIR32
Tennessee Valley Authority’s Payments in Lieu of TaxesAnnual Report to the Tennessee General Assembly
Distribution of Cities’ Share of TVA Payments in Lieu of Taxes to Tennessee by Tennessee Fiscal Year
City 2017-18 2016-17 2015-16 2014-15 2013-14 2012-13 2011-12 2010-11
Chapel Hill 16,386 16,304 16,957 16,748 15,987 16,479 16,697 13,302
Charleston 7,382 7,345 7,639 7,545 7,202 7,424 7,522 7,090
Charlotte 14,004 13,934 14,493 14,314 13,664 14,084 14,271 18,580
Chattanooga 1,944,355 1,934,875 2,010,675 1,986,387 1,898,099 1,955,139 1,980,503 1,793,597
Church Hill 76,394 76,013 79,059 78,083 74,536 76,827 77,847 66,578
Clarksburg 4,456 4,434 4,612 4,555 4,348 4,482 4,541 3,207
Clarksville 1,507,393 1,499,878 1,559,970 1,540,715 1,470,723 1,515,943 1,536,051 1,164,312
Cleveland 468,913 466,579 485,242 479,262 457,524 471,568 477,813 421,870
Clifton 30,549 30,396 31,614 31,224 29,805 30,722 31,129 34,279
Clinton 113,722 113,165 117,614 116,189 111,007 114,355 115,843 108,017
Coalmont 9,537 9,489 9,869 9,747 9,305 9,591 9,718 10,669
Collegedale 93,914 93,445 97,189 95,990 91,629 94,446 95,699 73,307
Collierville 516,514 513,938 534,530 527,932 503,948 519,443 508,019 498,590
Collinwood 11,135 11,080 11,524 11,382 10,864 11,199 11,347 11,524
Columbia 399,169 397,208 412,886 407,863 389,602 401,400 406,646 377,900
Cookeville 353,270 351,509 365,593 361,080 344,676 348,409 351,679 299,982
Coopertown 48,510 48,268 50,202 49,583 47,330 48,785 49,433 40,728
Copperhill 4,014 3,994 4,154 4,103 3,917 4,037 4,090 5,751
Cornersville 13,539 13,472 14,012 13,839 13,210 13,616 13,797 11,704
Cottage Grove 998 993 1,033 1,020 974 1,004 1,017 1,092
Covington 102,486 101,975 106,061 104,752 99,993 103,068 104,435 95,241
Cowan 19,946 19,848 20,633 20,382 19,467 20,058 20,321 20,169
Crab Orchard 8,527 8,485 8,825 8,716 8,320 8,576 8,689 9,431
Cross Plains 19,436 19,339 20,114 19,866 18,963 19,546 19,805 17,522
Crossville 124,984 124,361 129,343 127,747 119,432 123,104 124,737 117,411
Crump 16,193 16,112 16,758 16,551 15,799 16,285 16,501 17,117
Cumberland City 16,693 16,676 16,816 16,771 16,607 16,713 16,760 16,723
Cumberland Gap 5,602 5,574 5,797 5,726 5,465 5,633 5,708 2,656
Dandridge 32,697 32,538 33,809 33,402 31,921 32,878 33,303 24,196
Dayton 84,094 83,688 86,938 85,897 82,110 84,557 85,645 73,789
Decatur 18,121 18,030 18,753 18,521 17,680 18,223 18,465 16,048
Decaturville 9,907 9,858 10,250 10,124 9,668 9,963 10,094 9,743
Decherd 26,794 26,660 27,727 27,385 26,142 26,945 27,303 25,297
Dickson 164,853 164,032 170,604 168,498 160,843 165,789 167,988 216,906
Dover 16,068 15,988 16,629 16,423 15,677 16,159 16,374 16,228
Dowelltown 4,026 4,005 4,166 4,115 3,928 4,048 4,102 3,399
Doyle 6,089 6,059 6,302 6,224 5,941 6,124 6,205 6,347
Dresden 34,075 33,905 35,264 34,828 33,246 34,268 34,723 35,067
Ducktown 5,386 5,359 5,574 5,505 5,255 5,417 5,489 4,805
Dunlap 54,622 54,350 56,527 55,829 53,294 54,932 55,661 52,983
Dyer 26,546 26,413 27,472 27,133 25,900 26,696 27,050 27,077
Dyersburg 194,415 193,446 201,197 198,713 189,686 195,518 198,112 196,402
Eagleville 6,849 6,815 7,088 7,000 6,682 6,888 6,979 6,325
East Ridge 237,891 236,705 246,189 243,150 232,104 239,240 242,414 232,279
Eastview 7,994 7,954 8,273 8,171 7,800 8,040 8,146 6,955
Elizabethton 162,037 161,236 167,644 165,591 158,127 162,949 165,094 159,034
Elkton 6,554 6,522 6,783 6,699 6,395 6,591 6,679 6,820
Englewood 18,563 18,476 19,169 18,947 18,140 18,661 18,893 19,084
Enville 2,143 2,132 2,218 2,191 2,091 2,155 2,184 2,588
Erin 15,013 14,939 15,537 15,345 14,648 15,099 15,299 16,768

33WWW.TN.GOV/TACIR
Tennessee Valley Authority’s Payments in Lieu of TaxesAnnual Report to the Tennessee General Assembly
Distribution of Cities’ Share of TVA Payments in Lieu of Taxes to Tennessee by Tennessee Fiscal Year
City 2017-18 2016-17 2015-16 2014-15 2013-14 2012-13 2011-12 2010-11
Erwin 69,161 68,816 71,573 70,690 67,479 69,553 70,476 65,274
Estill Springs 25,700 25,584 26,513 26,215 25,133 25,832 26,143 28,214
Ethridge 5,273 5,247 5,457 5,389 5,145 5,303 5,373 6,032
Etowah 39,575 39,377 40,955 40,450 38,612 39,799 40,327 41,223
Fairview 90,739 90,286 90,594 89,476 85,411 88,037 89,205 78,934
Farragut 257,134 255,852 242,633 239,638 228,751 235,785 238,913 221,892
Fayetteville 77,467 77,081 80,167 79,178 75,584 77,906 78,939 79,369
Finger 3,379 3,362 3,497 3,454 3,297 3,398 3,443 3,939
Forest Hills 57,151 56,866 59,144 58,414 55,761 54,875 55,603 53,006
Franklin 804,202 748,991 778,995 769,381 691,474 712,731 722,184 632,821
Friendship 7,580 7,542 7,844 7,747 7,395 7,623 7,724 6,847
Friendsville 10,353 10,301 10,714 10,582 10,101 10,412 10,550 10,016
Gadsden 5,330 5,303 5,515 5,447 5,200 5,360 5,431 6,223
Gainesboro 10,909 10,854 11,289 11,150 10,643 10,970 11,116 9,892
Gallatin 390,906 388,957 355,313 350,927 334,984 345,284 349,864 269,158
Gallaway 7,711 7,672 7,980 7,881 7,523 7,755 7,857 7,495
Garland 3,515 3,498 3,638 3,593 3,430 3,535 3,582 3,691
Gates 7,337 7,300 7,593 7,499 7,158 7,378 7,476 10,140
Gatlinburg 44,723 44,500 46,283 45,712 43,635 44,977 45,573 38,060
Germantown 454,974 452,706 470,844 465,032 443,906 457,555 448,845 461,148
Gibson 4,490 4,468 4,647 4,590 4,381 4,516 4,576 4,659
Gilt Edge 5,409 5,382 5,598 5,529 5,277 5,440 5,512 5,503
Gleason 16,386 16,304 16,957 16,748 15,987 16,479 16,697 16,464
Goodlettsville 180,536 179,636 186,833 184,527 176,144 181,560 183,968 166,118
Gordonsville 13,755 13,686 14,235 14,059 13,420 13,833 14,016 14,045
Grand Junction 3,685 3,667 3,814 3,767 3,596 3,706 3,755 3,612
Graysville 17,032 16,947 17,626 17,408 16,618 17,129 17,356 17,342
Greenback 12,065 12,005 12,486 12,332 11,772 12,134 12,295 10,736
Greenbrier 72,947 72,583 75,491 74,560 71,172 73,361 74,334 60,467
Greeneville 171,012 170,160 176,969 174,788 166,857 171,981 174,259 174,122
Greenfield 24,743 24,619 25,606 25,290 24,141 24,883 25,213 24,848
Gruetli-Laager 20,558 20,456 21,276 21,013 20,058 20,675 20,949 21,011
Guys 5,284 5,258 5,469 5,401 5,156 5,314 5,385 5,436
Halls 25,571 25,443 26,462 26,136 24,948 25,716 26,057 26,008
Harriman 75,004 74,645 77,516 76,596 73,252 75,412 76,373 78,894
Harrogate 49,769 49,521 51,505 50,869 48,558 50,051 50,715 49,798
Hartsville 26,863 26,729 27,800 27,457 26,210 27,016 27,374 26,953
Henderson 71,541 71,184 74,036 73,122 69,800 71,947 72,901 69,718
Hendersonville 582,532 579,628 602,851 595,410 568,360 585,836 593,607 485,760
Henning 10,716 10,662 11,090 10,953 10,455 10,777 10,920 13,707
Henry 5,262 5,235 5,445 5,378 5,134 5,291 5,362 5,852
Hickory Valley 1,123 1,117 1,162 1,147 1,095 1,129 1,144 1,531
Hohenwald 42,856 42,644 44,342 43,798 41,820 43,098 43,666 42,501
Hollow Rock 8,142 8,101 8,426 8,322 7,944 8,188 8,297 10,837
Hornbeak 6,044 6,014 6,255 6,178 5,897 4,835 4,899 4,895
Hornsby 3,436 3,419 3,556 3,512 3,352 3,455 3,501 3,444
Humboldt 95,845 95,367 99,188 97,964 93,513 96,388 97,667 106,544
Huntingdon 45,188 44,963 46,764 46,187 44,089 45,444 46,047 48,943
Huntland 9,888 9,839 10,233 10,107 9,647 9,944 10,076 10,309
Huntsville 17,950 17,861 18,577 18,023 17,204 17,482 15,310 12,694

WWW.TN.GOV/TACIR34
Tennessee Valley Authority’s Payments in Lieu of TaxesAnnual Report to the Tennessee General Assembly
Distribution of Cities’ Share of TVA Payments in Lieu of Taxes to Tennessee by Tennessee Fiscal Year
City 2017-18 2016-17 2015-16 2014-15 2013-14 2012-13 2011-12 2010-11
Jacksboro 22,906 22,792 23,705 23,412 22,349 23,036 23,341 21,236
Jackson 741,019 737,332 766,812 757,366 723,030 745,213 755,078 672,772
Jamestown 22,214 22,103 22,989 22,705 21,674 22,340 22,636 20,696
Jasper 37,681 37,493 38,995 38,514 36,278 37,393 37,889 36,170
Jefferson City 96,705 96,225 100,063 98,833 94,363 92,199 93,416 97,486
Jellico 26,704 26,571 27,636 27,295 26,055 26,856 27,212 27,549
Johnson City 719,123 715,553 744,102 734,954 701,702 723,185 732,738 643,659
Jonesborough 57,276 56,990 59,274 58,542 55,882 57,601 58,365 52,297
Kenton 14,526 14,453 15,033 14,847 14,173 14,608 14,802 14,698
Kimball 15,819 15,740 16,370 16,168 15,434 15,908 16,119 14,765
Kingsport 581,421 578,522 601,701 594,274 567,165 576,588 569,376 516,573
Kingston 70,108 69,772 72,455 71,595 68,471 70,490 71,387 62,060
Kingston Springs 31,252 31,096 32,342 31,942 30,491 31,429 31,846 31,207
Knoxville 2,065,855 2,055,742 2,136,605 2,110,695 2,016,510 2,077,360 2,104,418 1,994,445
Lafayette 50,733 50,480 52,502 51,854 49,499 51,021 51,697 43,721
Lafollette 84,711 84,289 87,660 86,580 82,654 85,190 86,318 89,935
Lagrange 1,508 1,501 1,561 1,541 1,471 1,517 1,537 1,531
Lakeland 140,950 140,247 145,866 144,066 137,521 141,749 143,630 122,082
Lakesite 20,706 20,603 21,428 21,164 20,202 20,823 21,100 21,607
Lakewood - - - - - - - 26,345
La Vergne 369,531 367,689 382,421 377,700 360,541 371,627 376,557 297,405
Lawrenceburg 118,248 117,659 122,373 120,862 115,371 118,919 120,496 121,496
Lebanon 371,949 370,099 308,125 304,331 290,541 299,451 303,412 280,015
Lenoir City 99,520 99,032 102,938 101,687 97,136 100,076 101,383 78,264
Lewisburg 126,541 125,914 130,931 129,324 123,479 127,255 128,934 117,859
Lexington 86,969 86,536 89,995 88,887 84,858 87,461 88,618 83,398
Liberty 3,515 3,498 3,638 3,593 3,430 3,535 3,582 4,130
Linden 10,303 10,252 10,662 10,531 10,053 10,362 10,499 11,430
Livingston 46,016 45,786 47,621 47,033 44,896 46,277 46,890 44,678
Lobelville 10,172 10,121 10,526 10,396 9,924 10,229 10,365 11,535
Lookout Mountain 20,774 20,670 21,499 21,233 20,269 20,892 21,169 22,508
Loretto 19,436 19,339 20,114 19,866 18,963 19,546 19,805 19,919
Loudon 64,290 63,986 66,419 65,639 62,806 64,636 65,450 53,645
Louisville 45,585 45,357 47,175 28,268 26,984 27,814 28,183 23,847
Luttrell 12,179 12,118 12,603 12,448 11,882 12,248 12,410 13,212
Lynchburg 6,560 6,527 6,786 6,703 6,402 6,596 6,683 5,667
Lynnville 3,310 3,294 3,424 3,382 3,231 3,328 3,372 4,613
Madisonville 51,901 51,642 53,711 53,048 50,638 52,195 52,888 44,329
Manchester 114,551 113,980 118,547 117,084 111,765 115,201 116,729 106,259
Martin 130,511 129,862 135,049 133,387 127,346 131,249 132,984 118,747
Maryville 312,244 310,687 323,135 319,147 304,648 314,015 318,180 260,391
Mason 18,245 18,154 18,882 18,649 17,801 18,349 18,592 15,755
Maury City 7,643 7,605 7,909 7,812 7,457 7,686 7,788 9,037
Maynardville 27,362 27,226 28,317 27,967 26,697 27,517 27,882 20,054
McEwen 19,997 19,898 20,690 20,436 19,515 20,110 20,375 19,307
McKenzie 60,213 59,912 62,313 61,544 58,748 60,554 61,357 59,589
McLemoresville 3,992 3,972 4,131 4,080 3,894 4,014 4,067 3,432
McMinnville 154,532 153,763 159,913 157,943 150,779 155,407 157,465 144,116
Medina 54,679 49,487 51,470 50,834 38,490 39,674 40,200 32,467
Medon 2,563 2,550 2,652 2,619 2,500 2,577 2,057 3,027
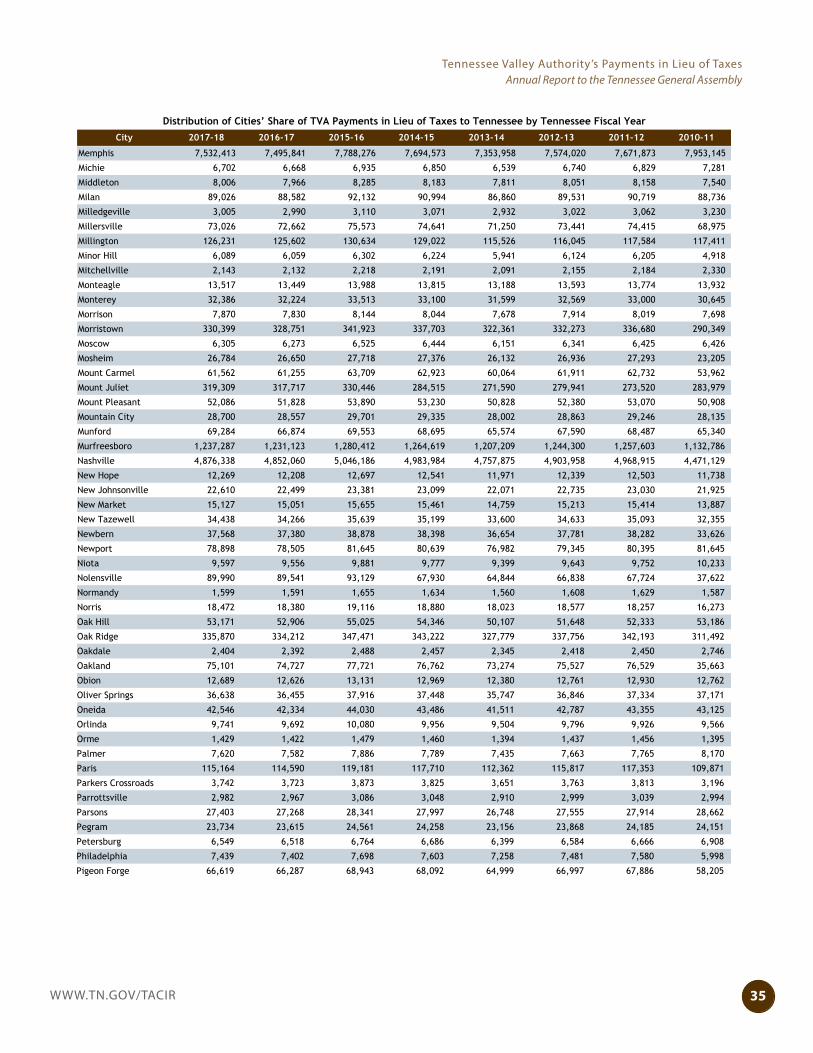
35WWW.TN.GOV/TACIR
Tennessee Valley Authority’s Payments in Lieu of TaxesAnnual Report to the Tennessee General Assembly
Distribution of Cities’ Share of TVA Payments in Lieu of Taxes to Tennessee by Tennessee Fiscal Year
City 2017-18 2016-17 2015-16 2014-15 2013-14 2012-13 2011-12 2010-11
Memphis 7,532,413 7,495,841 7,788,276 7,694,573 7,353,958 7,574,020 7,671,873 7,953,145
Michie 6,702 6,668 6,935 6,850 6,539 6,740 6,829 7,281
Middleton 8,006 7,966 8,285 8,183 7,811 8,051 8,158 7,540
Milan 89,026 88,582 92,132 90,994 86,860 89,531 90,719 88,736
Milledgeville 3,005 2,990 3,110 3,071 2,932 3,022 3,062 3,230
Millersville 73,026 72,662 75,573 74,641 71,250 73,441 74,415 68,975
Millington 126,231 125,602 130,634 129,022 115,526 116,045 117,584 117,411
Minor Hill 6,089 6,059 6,302 6,224 5,941 6,124 6,205 4,918
Mitchellville 2,143 2,132 2,218 2,191 2,091 2,155 2,184 2,330
Monteagle 13,517 13,449 13,988 13,815 13,188 13,593 13,774 13,932
Monterey 32,386 32,224 33,513 33,100 31,599 32,569 33,000 30,645
Morrison 7,870 7,830 8,144 8,044 7,678 7,914 8,019 7,698
Morristown 330,399 328,751 341,923 337,703 322,361 332,273 336,680 290,349
Moscow 6,305 6,273 6,525 6,444 6,151 6,341 6,425 6,426
Mosheim 26,784 26,650 27,718 27,376 26,132 26,936 27,293 23,205
Mount Carmel 61,562 61,255 63,709 62,923 60,064 61,911 62,732 53,962
Mount Juliet 319,309 317,717 330,446 284,515 271,590 279,941 273,520 283,979
Mount Pleasant 52,086 51,828 53,890 53,230 50,828 52,380 53,070 50,908
Mountain City 28,700 28,557 29,701 29,335 28,002 28,863 29,246 28,135
Munford 69,284 66,874 69,553 68,695 65,574 67,590 68,487 65,340
Murfreesboro 1,237,287 1,231,123 1,280,412 1,264,619 1,207,209 1,244,300 1,257,603 1,132,786
Nashville 4,876,338 4,852,060 5,046,186 4,983,984 4,757,875 4,903,958 4,968,915 4,471,129
New Hope 12,269 12,208 12,697 12,541 11,971 12,339 12,503 11,738
New Johnsonville 22,610 22,499 23,381 23,099 22,071 22,735 23,030 21,925
New Market 15,127 15,051 15,655 15,461 14,759 15,213 15,414 13,887
New Tazewell 34,438 34,266 35,639 35,199 33,600 34,633 35,093 32,355
Newbern 37,568 37,380 38,878 38,398 36,654 37,781 38,282 33,626
Newport 78,898 78,505 81,645 80,639 76,982 79,345 80,395 81,645
Niota 9,597 9,556 9,881 9,777 9,399 9,643 9,752 10,233
Nolensville 89,990 89,541 93,129 67,930 64,844 66,838 67,724 37,622
Normandy 1,599 1,591 1,655 1,634 1,560 1,608 1,629 1,587
Norris 18,472 18,380 19,116 18,880 18,023 18,577 18,257 16,273
Oak Hill 53,171 52,906 55,025 54,346 50,107 51,648 52,333 53,186
Oak Ridge 335,870 334,212 347,471 343,222 327,779 337,756 342,193 311,492
Oakdale 2,404 2,392 2,488 2,457 2,345 2,418 2,450 2,746
Oakland 75,101 74,727 77,721 76,762 73,274 75,527 76,529 35,663
Obion 12,689 12,626 13,131 12,969 12,380 12,761 12,930 12,762
Oliver Springs 36,638 36,455 37,916 37,448 35,747 36,846 37,334 37,171
Oneida 42,546 42,334 44,030 43,486 41,511 42,787 43,355 43,125
Orlinda 9,741 9,692 10,080 9,956 9,504 9,796 9,926 9,566
Orme 1,429 1,422 1,479 1,460 1,394 1,437 1,456 1,395
Palmer 7,620 7,582 7,886 7,789 7,435 7,663 7,765 8,170
Paris 115,164 114,590 119,181 117,710 112,362 115,817 117,353 109,871
Parkers Crossroads 3,742 3,723 3,873 3,825 3,651 3,763 3,813 3,196
Parrottsville 2,982 2,967 3,086 3,048 2,910 2,999 3,039 2,994
Parsons 27,403 27,268 28,341 27,997 26,748 27,555 27,914 28,662
Pegram 23,734 23,615 24,561 24,258 23,156 23,868 24,185 24,151
Petersburg 6,549 6,518 6,764 6,686 6,399 6,584 6,666 6,908
Philadelphia 7,439 7,402 7,698 7,603 7,258 7,481 7,580 5,998
Pigeon Forge 66,619 66,287 68,943 68,092 64,999 66,997 67,886 58,205
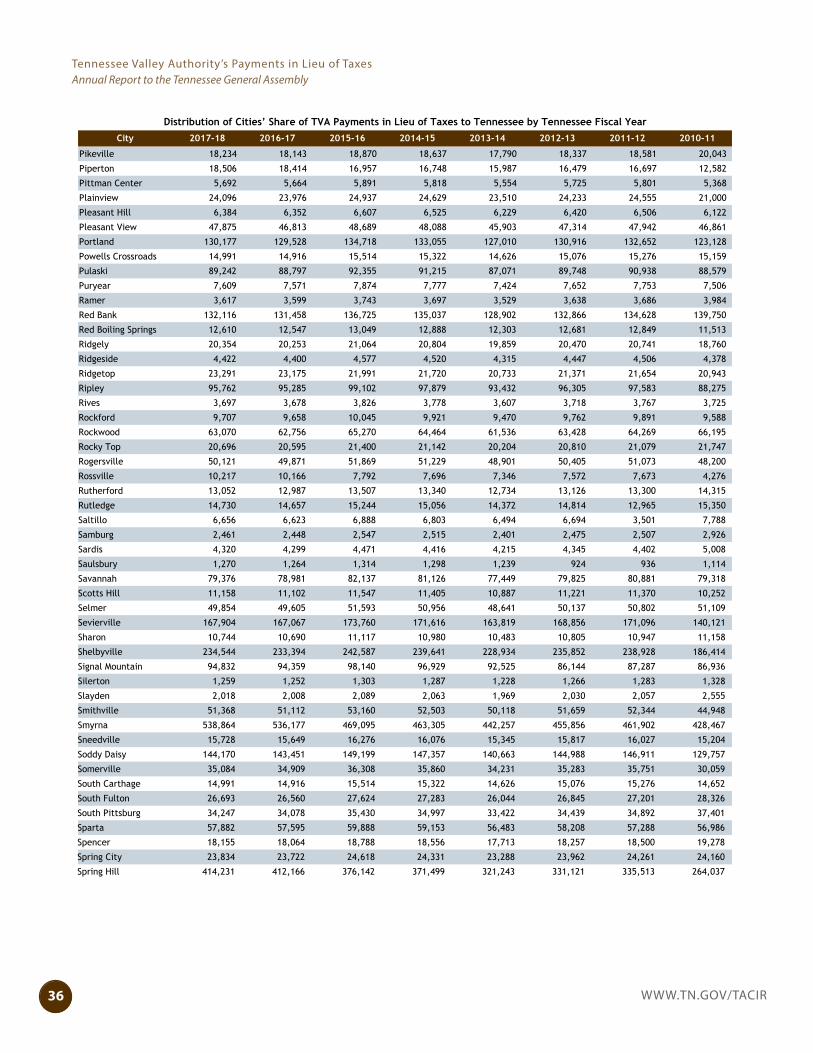
WWW.TN.GOV/TACIR36
Tennessee Valley Authority’s Payments in Lieu of TaxesAnnual Report to the Tennessee General Assembly
Distribution of Cities’ Share of TVA Payments in Lieu of Taxes to Tennessee by Tennessee Fiscal Year
City 2017-18 2016-17 2015-16 2014-15 2013-14 2012-13 2011-12 2010-11
Pikeville 18,234 18,143 18,870 18,637 17,790 18,337 18,581 20,043
Piperton 18,506 18,414 16,957 16,748 15,987 16,479 16,697 12,582
Pittman Center 5,692 5,664 5,891 5,818 5,554 5,725 5,801 5,368
Plainview 24,096 23,976 24,937 24,629 23,510 24,233 24,555 21,000
Pleasant Hill 6,384 6,352 6,607 6,525 6,229 6,420 6,506 6,122
Pleasant View 47,875 46,813 48,689 48,088 45,903 47,314 47,942 46,861
Portland 130,177 129,528 134,718 133,055 127,010 130,916 132,652 123,128
Powells Crossroads 14,991 14,916 15,514 15,322 14,626 15,076 15,276 15,159
Pulaski 89,242 88,797 92,355 91,215 87,071 89,748 90,938 88,579
Puryear 7,609 7,571 7,874 7,777 7,424 7,652 7,753 7,506
Ramer 3,617 3,599 3,743 3,697 3,529 3,638 3,686 3,984
Red Bank 132,116 131,458 136,725 135,037 128,902 132,866 134,628 139,750
Red Boiling Springs 12,610 12,547 13,049 12,888 12,303 12,681 12,849 11,513
Ridgely 20,354 20,253 21,064 20,804 19,859 20,470 20,741 18,760
Ridgeside 4,422 4,400 4,577 4,520 4,315 4,447 4,506 4,378
Ridgetop 23,291 23,175 21,991 21,720 20,733 21,371 21,654 20,943
Ripley 95,762 95,285 99,102 97,879 93,432 96,305 97,583 88,275
Rives 3,697 3,678 3,826 3,778 3,607 3,718 3,767 3,725
Rockford 9,707 9,658 10,045 9,921 9,470 9,762 9,891 9,588
Rockwood 63,070 62,756 65,270 64,464 61,536 63,428 64,269 66,195
Rocky Top 20,696 20,595 21,400 21,142 20,204 20,810 21,079 21,747
Rogersville 50,121 49,871 51,869 51,229 48,901 50,405 51,073 48,200
Rossville 10,217 10,166 7,792 7,696 7,346 7,572 7,673 4,276
Rutherford 13,052 12,987 13,507 13,340 12,734 13,126 13,300 14,315
Rutledge 14,730 14,657 15,244 15,056 14,372 14,814 12,965 15,350
Saltillo 6,656 6,623 6,888 6,803 6,494 6,694 3,501 7,788
Samburg 2,461 2,448 2,547 2,515 2,401 2,475 2,507 2,926
Sardis 4,320 4,299 4,471 4,416 4,215 4,345 4,402 5,008
Saulsbury 1,270 1,264 1,314 1,298 1,239 924 936 1,114
Savannah 79,376 78,981 82,137 81,126 77,449 79,825 80,881 79,318
Scotts Hill 11,158 11,102 11,547 11,405 10,887 11,221 11,370 10,252
Selmer 49,854 49,605 51,593 50,956 48,641 50,137 50,802 51,109
Sevierville 167,904 167,067 173,760 171,616 163,819 168,856 171,096 140,121
Sharon 10,744 10,690 11,117 10,980 10,483 10,805 10,947 11,158
Shelbyville 234,544 233,394 242,587 239,641 228,934 235,852 238,928 186,414
Signal Mountain 94,832 94,359 98,140 96,929 92,525 86,144 87,287 86,936
Silerton 1,259 1,252 1,303 1,287 1,228 1,266 1,283 1,328
Slayden 2,018 2,008 2,089 2,063 1,969 2,030 2,057 2,555
Smithville 51,368 51,112 53,160 52,503 50,118 51,659 52,344 44,948
Smyrna 538,864 536,177 469,095 463,305 442,257 455,856 461,902 428,467
Sneedville 15,728 15,649 16,276 16,076 15,345 15,817 16,027 15,204
Soddy Daisy 144,170 143,451 149,199 147,357 140,663 144,988 146,911 129,757
Somerville 35,084 34,909 36,308 35,860 34,231 35,283 35,751 30,059
South Carthage 14,991 14,916 15,514 15,322 14,626 15,076 15,276 14,652
South Fulton 26,693 26,560 27,624 27,283 26,044 26,845 27,201 28,326
South Pittsburg 34,247 34,078 35,430 34,997 33,422 34,439 34,892 37,401
Sparta 57,882 57,595 59,888 59,153 56,483 58,208 57,288 56,986
Spencer 18,155 18,064 18,788 18,556 17,713 18,257 18,500 19,278
Spring City 23,834 23,722 24,618 24,331 23,288 23,962 24,261 24,160
Spring Hill 414,231 412,166 376,142 371,499 321,243 331,121 335,513 264,037

37WWW.TN.GOV/TACIR
Tennessee Valley Authority’s Payments in Lieu of TaxesAnnual Report to the Tennessee General Assembly
Distribution of Cities’ Share of TVA Payments in Lieu of Taxes to Tennessee by Tennessee Fiscal Year
City 2017-18 2016-17 2015-16 2014-15 2013-14 2012-13 2011-12 2010-11
Springfield 186,421 185,492 192,924 190,542 181,886 187,479 189,965 174,772
St. Joseph 8,867 8,823 9,177 9,064 8,652 8,918 9,036 9,329
Stanton 5,125 5,100 5,304 5,239 5,001 5,155 5,223 6,921
Stantonville 3,209 3,193 3,321 3,280 3,131 3,227 3,270 3,511
Sunbright 6,259 6,228 6,478 6,398 6,107 6,295 6,378 6,493
Surgoinsville 20,422 20,321 21,135 20,874 19,926 20,538 20,811 20,943
Sweetwater 68,628 68,288 71,005 70,135 66,970 69,015 67,081 74,382
Tazewell 25,185 25,059 26,063 25,742 24,572 25,328 25,629 25,051
Tellico Plains 10,017 9,967 10,365 10,238 9,774 10,074 10,207 9,705
Tennessee Ridge 15,512 15,435 16,054 15,855 15,135 15,600 15,807 15,013
Thompson’s Station 53,590 30,250 31,462 31,073 24,274 25,020 25,352 19,390
Three Way 19,379 19,283 20,055 19,808 18,908 19,489 19,748 18,850
Tiptonville 50,619 50,367 52,385 51,738 49,388 50,907 51,582 53,625
Toone 4,128 4,107 4,272 4,219 4,027 4,151 4,206 3,714
Townsend 5,080 5,055 5,257 5,192 4,957 5,109 5,177 2,746
Tracy City 16,794 16,710 17,380 17,165 16,385 16,889 17,113 18,895
Trenton 48,352 48,110 50,038 49,420 47,175 48,626 49,271 52,702
Trezevant 9,741 9,692 10,080 9,956 9,504 9,796 9,926 10,309
Trimble 7,223 7,187 7,475 7,383 7,048 7,264 7,361 8,193
Troy 15,546 15,469 16,089 15,890 15,168 15,635 15,842 14,326
Tullahoma 212,212 211,158 219,591 216,889 207,066 213,412 216,234 203,176
Tusculum 30,197 30,046 31,250 30,865 29,462 30,368 30,771 28,112
Unicoi 41,185 40,980 42,622 42,095 40,183 41,419 41,968 39,602
Union City 123,544 122,928 127,853 126,275 120,538 124,244 125,892 122,397
Vanleer 4,479 4,457 4,635 4,578 4,370 4,505 4,564 5,109
Viola 1,485 1,478 1,537 1,518 1,449 1,494 1,514 1,452
Vonore 16,714 16,631 17,297 17,084 16,308 16,809 17,032 13,077
Walden 21,522 21,415 22,273 21,998 20,999 21,644 21,932 22,058
Wartburg 10,410 10,358 10,773 10,640 10,156 10,469 10,608 10,016
Wartrace 7,382 7,345 7,639 7,545 7,202 7,424 7,522 7,090
Watauga 5,193 5,168 5,375 5,308 5,067 5,223 5,292 4,535
Watertown 16,748 16,665 17,333 17,119 16,341 16,843 17,067 15,316
Waverly 46,549 46,317 48,172 47,578 45,416 46,813 47,434 45,679
Waynesboro 27,770 27,632 28,739 28,384 27,095 27,928 28,298 25,074
Westmoreland 25,015 24,890 25,887 25,568 24,406 25,157 25,490 23,554
White Bluff 36,354 36,173 37,622 37,158 35,470 36,561 37,046 32,962
White House 131,538 115,707 120,343 118,857 113,457 116,946 118,497 111,312
White Pine 24,902 24,777 25,770 25,452 24,296 25,043 25,375 22,474
Whiteville 52,593 52,330 54,427 53,755 51,313 52,891 53,592 52,218
Whitwell 19,266 19,170 19,938 19,692 18,797 19,375 19,632 18,681
Williston 4,479 4,457 4,635 4,578 4,370 4,505 4,564 3,838
Winchester 99,760 99,278 103,134 101,898 97,407 100,308 101,599 85,513
Winfield 11,850 11,791 12,263 12,112 11,561 11,917 12,075 10,252
Woodbury 30,390 30,238 31,450 31,062 29,651 30,562 30,968 27,324
Woodland Mills 4,286 4,265 4,436 4,381 4,182 4,311 4,368 4,333
Yorkville 3,243 3,227 3,356 3,315 3,164 3,261 3,305 3,297
Total 41,552,235$ 41,237,328$ 42,569,233$ 41,924,787$ 39,911,386$ 41,084,012$ 41,546,075$ 38,728,809$


39WWW.TN.GOV/TACIR
Tennessee Valley Authority’s Payments in Lieu of TaxesAnnual Report to the Tennessee General Assembly
Appendix E: Payments Distributed to Counties in Areas Affected by TVA Construction by Tennessee Fiscal Year
County 2017-18 2016-17 2015-16 2014-15 2013-14 2012-13 2011-12 2010-11
Anderson -$ -$ -$ -$ -$ -$ -$ -$
Bedford - - - - - - - -
Benton - - - - - - - -
Bledsoe - - - - - - - -
Blount - - - - - - - -
Bradley - - - - - - - -
Campbell - - - - - - - -
Cannon - - - - - - - -
Carroll - - - - - - - -
Carter - - - - - - - -
Cheatham - - - - - - - -
Chester - - - - - - - -
Claiborne - - - - - - - -
Clay - - - - - - - -
Cocke - - - - - - - -
Coffee - - - - - - - -
Crockett - - - - - - - -
Cumberland - - - - - - - -
Davidson - - - - - - - -
Decatur - - - - - - - -
DeKalb - - - - - - - -
Dickson - - - - - - - -
Dyer - - - - - - - -
Fayette - - - - - - - -
Fentress - - - - - - - -
Franklin - - - - - - - -
Gibson - - - - - - - -
Giles - - - - - - - -
Grainger - - - - - - - -
Greene - - - - - - - -
Grundy - - - - - - - -
Hamblen - - - - - - - -
Hamilton - - - - - - - -
Hancock - - - - - - - -
Hardeman - - - - - - - -
Hardin - - - - - - - -
Hawkins - 94,093 192,291 291,767 371,390 382,108 391,021 -
Haywood - - - 138,513 264,448 270,577 411,110 507,617
Henderson - - - - - - - -
Henry - - - - - - - -
Hickman - - - - - - - -
Houston - - - - - - - -
Humphreys - - - - - - - -
Jackson - - - - - - - -
Jefferson - - - - - - - -
Johnson - - - - - - - -
Knox - - - - - - - -
Lake - - - - - - - -
Payments Distributed to Counties in Areas Affected by TVA Construction by Tennessee Fiscal Year

WWW.TN.GOV/TACIR40
Tennessee Valley Authority’s Payments in Lieu of TaxesAnnual Report to the Tennessee General Assembly
County 2017-18 2016-17 2015-16 2014-15 2013-14 2012-13 2011-12 2010-11
Payments Distributed to Counties in Areas Affected by TVA Construction by Tennessee Fiscal Year
Lauderdale - - - - - - - -
Lawrence - - - - - - - -
Lewis - - - - - - - -
Lincoln - - - - - - - -
Loudon - - - - - - - -
Macon - - - - - - - -
Madison - - - - - - - -
Marion - - - - - - - -
Marshall - - - - - - - -
Maury - - - - - - - -
McMinn 9,785 39,170 160,097 158,150 150,970 154,469 156,465 142,140
McNairy - - - - - - - -
Meigs 380,086 569,656 776,106 766,666 731,857 748,819 758,495 707,917
Monroe 8,363 33,425 136,614 134,953 128,825 131,811 134,088 120,917
Montgomery - - - - - - - -
Moore - - - - - - - -
Morgan - - - - - - - -
Obion - - - - - - - -
Overton - - - - - - - -
Perry - - - - - - - -
Pickett - - - - - - - -
Polk - - - - - - - -
Putnam - - - - - - - -
Rhea 323,282 484,521 660,117 652,088 622,481 636,908 645,138 592,515
Roane 223,672 335,230 456,721 451,166 430,682 440,663 446,358 412,727
Robertson - - - - - - - -
Rutherford - - - - - - - -
Scott - - - - - - - -
Sequatchie - - - - - - - -
Sevier - - - - - - - -
Shelby 457,129 456,750 - - - - - -
Smith - - - - - - - -
Stewart - - - - - - - -
Sullivan 578,612 578,132 - - - - - -
Sumner 501,334 501,840 501,559 495,459 472,964 - - -
Tipton - - - - - - - -
Trousdale - - - - - - - -
Unicoi - - - - - - - -
Union - - - - - - - -
Van Buren - - - - - - - -
Warren - - - - - - - -
Washington 559,958 559,493 - - - - - -
Wayne - - - - - - - -
Weakley - - - - - - - -
White - - - - - - - -
Williamson - - - - - - - -
Wilson - - - - - - - -
Total 3,042,223$ 3,652,310$ 2,883,505$ 3,088,761$ 3,173,617$ 2,633,544$ 2,942,675$ 2,483,833$

41WWW.TN.GOV/TACIR
Tennessee Valley Authority’s Payments in Lieu of TaxesAnnual Report to the Tennessee General Assembly
Appendix F: Payments Distributed to Cities in Areas Affected by TVA Construction by Tennessee Fiscal Year
City 2017-18 2016-17 2015-16 2014-15 2013-14 2012-13 2011-12 2010-11
Adams -$ -$ -$ -$ -$ -$ -$ -$
Adamsville - - - - - - - -
Alamo - - - - - - - -
Alcoa - - - - - - - -
Alexandria - - - - - - - -
Algood - - - - - - - -
Allardt - - - - - - - -
Altamont - - - - - - - -
Ardmore - - - - - - - -
Arlington 5,958 5,953 - - - - - -
Ashland City - - - - - - - -
Athens 2,520 10,086 41,224 40,722 38,873 39,774 40,288 38,668
Atoka - - - - - - - -
Atwood - - - - - - - -
Auburntown - - - - - - - -
Baileyton - - - - - - - -
Baneberry - - - - - - - -
Bartlett 27,836 27,813 - - - - - -
Baxter - - - - - - - -
Bean Station - 5,056 10,333 - - - - -
Beersheba Spring - - - - - - - -
Bell Buckle - - - - - - - -
Belle Meade - - - - - - - -
Bells - - - - - - - -
Benton - - - - - - - -
Berry Hill - - - - - - - -
Bethel Springs - - - - - - - -
Big Sandy - - - - - - - -
Blaine - - - - - - - -
Bluff City 6,394 6,389 - - - - - -
Bolivar - - - - - - - -
Braden - - - - - - - -
Bradford - - - - - - - -
Brentwood - - - - - - - -
Brighton - - - - - - - -
Bristol 98,519 98,438 - - - - - -
Brownsville - - - 75,881 144,872 148,229 225,217 275,591
Bruceton - - - - - - - -
Bulls Gap - 1,222 2,497 3,789 4,823 4,962 5,078 -
Burlison - - - - - - - -
Burns - - - - - - - -
Byrdstown - - - - - - - -
Calhoun 92 367 1,501 1,483 1,415 1,448 1,467 1,438
Camden - - - - - - - -
Carthage - - - - - - - -
Caryville - - - - - - - -
Cedar Hill - - - - - - - -
Celina - - - - - - - -
Centertown - - - - - - - -
Centerville - - - - - - - -
Payments Distributed to Cities in Areas Affected by TVA Construction by Tennessee Fiscal Year

WWW.TN.GOV/TACIR42
Tennessee Valley Authority’s Payments in Lieu of TaxesAnnual Report to the Tennessee General Assembly
City 2017-18 2016-17 2015-16 2014-15 2013-14 2012-13 2011-12 2010-11Payments Distributed to Cities in Areas Affected by TVA Construction by Tennessee Fiscal Year
Chapel Hill - - - - - - - -
Charleston - - - - - - - -
Charlotte - - - - - - - -
Chattanooga - - - - - - - -
Church Hill - 11,154 22,794 34,586 44,025 45,295 46,352 -
Clarksburg - - - - - - - -
Clarksville - - - - - - - -
Cleveland - - - - - - - -
Clifton - - - - - - - -
Clinton - - - - - - - -
Coalmont - - - - - - - -
Collegedale - - - - - - - -
Collierville 22,446 22,428 - - - - - -
Collinwood - - - - - - - -
Columbia - - - - - - - -
Cookeville - - - - - - - -
Coopertown - - - - - - - -
Copperhill - - - - - - - -
Cornersville - - - - - - - -
Cottage Grove - - - - - - - -
Covington - - - - - - - -
Cowan - - - - - - - -
Crab Orchard - - - - - - - -
Cross Plains - - - - - - - -
Crossville - - - - - - - -
Crump - - - - - - - -
Cumberland City - - - - - - - -
Cumberland Gap - - - - - - - -
Dandridge - - - - - - - -
Dayton 73,084 109,535 149,231 147,416 140,723 143,985 145,845 132,064
Decatur 51,679 77,453 105,523 104,240 99,507 101,813 103,129 91,060
Decaturville - - - - - - - -
Decherd - - - - - - - -
Dickson - - - - - - - -
Dover - - - - - - - -
Dowelltown - - - - - - - -
Doyle - - - - - - - -
Dresden - - - - - - - -
Ducktown - - - - - - - -
Dunlap - - - - - - - -
Dyer - - - - - - - -
Dyersburg - - - - - - - -
Eagleville - - - - - - - -
East Ridge - - - - - - - -
Eastview - - - - - - - -
Elizabethton - - - - - - - -
Elkton - - - - - - - -
Englewood 287 1,148 4,693 4,636 4,425 4,528 4,586 4,611
Enville - - - - - - - -
Erin - - - - - - - -

43WWW.TN.GOV/TACIR
Tennessee Valley Authority’s Payments in Lieu of TaxesAnnual Report to the Tennessee General Assembly
City 2017-18 2016-17 2015-16 2014-15 2013-14 2012-13 2011-12 2010-11Payments Distributed to Cities in Areas Affected by TVA Construction by Tennessee Fiscal Year
Erwin - - - - - - - -
Estill Springs - - - - - - - -
Ethridge - - - - - - - -
Etowah 653 2,616 10,690 10,560 10,081 10,314 10,448 10,622
Fairview - - - - - - - -
Farragut - - - - - - - -
Fayetteville - - - - - - - -
Finger - - - - - - - -
Forest Hills - - - - - - - -
Franklin - - - - - - - -
Friendship - - - - - - - -
Friendsville - - - - - - - -
Gadsden - - - - - - - -
Gainesboro - - - - - - - -
Gallatin 107,582 107,690 94,533 93,383 89,143 - - -
Gallaway - - - - - - - -
Garland - - - - - - - -
Gates - - - - - - - -
Gatlinburg - - - - - - - -
Germantown 19,772 19,756 - - - - - -
Gibson - - - - - - - -
Gilt Edge - - - - - - - -
Gleason - - - - - - - -
Goodlettsville 17,482 17,500 49,708 49,103 46,874 - - -
Gordonsville - - - - - - - -
Grand Junction - - - - - - - -
Graysville 15,265 22,879 31,170 30,791 29,393 30,074 30,463 32,150
Greenback - - - - - - - -
Greenbrier - - - - - - - -
Greeneville - - - - - - - -
Greenfield - - - - - - - -
Gruetli-Laager - - - - - - - -
Guys - - - - - - - -
Halls - - - - - - - -
Harriman 26,214 39,289 53,528 52,877 50,476 51,646 52,313 53,620
Harrogate - - - - - - - -
Hartsville - - - - - - - -
Henderson - - - - - - - -
Hendersonville 160,320 160,481 160,392 158,441 151,247 - - -
Henning - - - - - - - -
Henry - - - - - - - -
Hickory Valley - - - - - - - -
Hohenwald - - - - - - - -
Hollow Rock - - - - - - - -
Hornbeak - - - - - - - -
Hornsby - - - - - - - -
Humboldt - - - - - - - -
Huntingdon - - - - - - - -
Huntland - - - - - - - -
Huntsville - - - - - - - -

WWW.TN.GOV/TACIR44
Tennessee Valley Authority’s Payments in Lieu of TaxesAnnual Report to the Tennessee General Assembly
City 2017-18 2016-17 2015-16 2014-15 2013-14 2012-13 2011-12 2010-11Payments Distributed to Cities in Areas Affected by TVA Construction by Tennessee Fiscal Year
Jacksboro - - - - - - - -
Jackson - - - - - - - -
Jamestown - - - - - - - -
Jasper - - - - - - - -
Jefferson City - - - - - - - -
Jellico - - - - - - - -
Johnson City 281,531 281,297 - - - - - -
Jonesborough 22,999 22,980 - - - - - -
Kenton - - - - - - - -
Kimball - - - - - - - -
Kingsport 178,650 263,392 173,482 263,229 334,998 339,940 339,020 -
Kingston 24,497 36,715 50,021 49,413 47,169 48,262 48,886 41,853
Kingston Springs - - - - - - - -
Knoxville - - - - - - - -
Lafayette - - - - - - - -
Lafollette - - - - - - - -
Lagrange - - - - - - - -
Lakeland 6,125 6,120 - - - - - -
Lakesite - - - - - - - -
Lakewood - - - - - - - -
La Vergne - - - - - - - -
Lawrenceburg - - - - - - - -
Lebanon - - - - - - - -
Lenoir City - - - - - - - -
Lewisburg - - - - - - - -
Lexington - - - - - - - -
Liberty - - - - - - - -
Linden - - - - - - - -
Livingston - - - - - - - -
Lobelville - - - - - - - -
Lookout Mountain - - - - - - - -
Loretto - - - - - - - -
Loudon - - - - - - - -
Louisville - - - - - - - -
Luttrell - - - - - - - -
Lynchburg - - - - - - - -
Lynnville - - - - - - - -
Madisonville 860 3,436 14,045 13,874 13,245 13,551 13,786 12,225
Manchester - - - - - - - -
Martin - - - - - - - -
Maryville - - - - - - - -
Mason - - - - - - - -
Maury City - - - - - - - -
Maynardville - - - - - - - -
McEwen - - - - - - - -
McKenzie - - - - - - - -
McLemoresville - - - - - - - -
McMinnville - - - - - - - -
Medina - - - - - - - -
Medon - - - - - - - -

45WWW.TN.GOV/TACIR
Tennessee Valley Authority’s Payments in Lieu of TaxesAnnual Report to the Tennessee General Assembly
City 2017-18 2016-17 2015-16 2014-15 2013-14 2012-13 2011-12 2010-11Payments Distributed to Cities in Areas Affected by TVA Construction by Tennessee Fiscal Year
Memphis 318,777 318,513 - - - - - -
Michie - - - - - - - -
Middleton - - - - - - - -
Milan - - - - - - - -
Milledgeville - - - - - - - -
Millersville 15,532 15,548 15,539 15,350 14,653 - - -
Millington 5,486 5,481 - - - - - -
Minor Hill - - - - - - - -
Mitchellville 590 590 590 583 556 - - -
Monteagle - - - - - - - -
Monterey - - - - - - - -
Morrison - - - - - - - -
Morristown - - - - - - - -
Moscow - - - - - - - -
Mosheim - - - - - - - -
Mount Carmel - 8,988 18,369 27,871 35,477 36,501 37,352 -
Mount Juliet - - - - - - - -
Mount Pleasant - - - - - - - -
Mountain City - - - - - - - -
Munford - - - - - - - -
Murfreesboro - - - - - - - -
Nashville - - - - - - - -
New Hope - - - - - - - -
New Johnsonville - - - - - - - -
New Market - - - - - - - -
New Tazewell - - - - - - - -
Newbern - - - - - - - -
Newport - - - - - - - -
Niota 135 539 2,202 2,176 2,077 2,125 2,152 2,265
Nolensville - - - - - - - -
Normandy - - - - - - - -
Norris - - - - - - - -
Oak Hill - - - - - - - -
Oak Ridge 121,081 181,471 247,239 244,231 233,143 238,546 241,628 217,749
Oakdale - - - - - - - -
Oakland - - - - - - - -
Obion - - - - - - - -
Oliver Springs 13,338 19,991 27,236 26,905 25,683 26,278 26,618 26,262
Oneida - - - - - - - -
Orlinda - - - - - - - -
Orme - - - - - - - -
Palmer - - - - - - - -
Paris - - - - - - - -
Parkers Crossroads - - - - - - - -
Parrottsville - - - - - - - -
Parsons - - - - - - - -
Pegram - - - - - - - -
Petersburg - - - - - - - -
Philadelphia - - - - - - - -
Pigeon Forge - - - - - - - -

WWW.TN.GOV/TACIR46
Tennessee Valley Authority’s Payments in Lieu of TaxesAnnual Report to the Tennessee General Assembly
City 2017-18 2016-17 2015-16 2014-15 2013-14 2012-13 2011-12 2010-11Payments Distributed to Cities in Areas Affected by TVA Construction by Tennessee Fiscal Year
Pikeville - - - - - - - -
Piperton - - - - - - - -
Pittman Center - - - - - - - -
Plainview - - - - - - - -
Pleasant Hill - - - - - - - -
Pleasant View - - - - - - - -
Portland 35,648 35,684 35,842 35,406 33,799 - - -
Powells Crossroads - - - - - - - -
Pulaski - - - - - - - -
Puryear - - - - - - - -
Ramer - - - - - - - -
Red Bank - - - - - - - -
Red Boiling Springs - - - - - - - -
Ridgely - - - - - - - -
Ridgeside - - - - - - - -
Ridgetop - - - - - - - -
Ripley - - - - - - - -
Rives - - - - - - - -
Rockford - - - - - - - -
Rockwood 22,961 34,413 46,885 46,315 44,212 45,237 45,821 46,767
Rocky Top - - - - - - - -
Rogersville - 7,318 14,955 22,691 28,884 29,717 30,410 -
Rossville - - - - - - - -
Rutherford - - - - - - - -
Rutledge - - - - - - - -
Saltillo - - - - - - - -
Samburg - - - - - - - -
Sardis - - - - - - - -
Saulsbury - - - - - - - -
Savannah - - - - - - - -
Scotts Hill - - - - - - - -
Selmer - - - - - - - -
Sevierville - - - - - - - -
Sharon - - - - - - - -
Shelbyville - - - - - - - -
Signal Mountain - - - - - - - -
Silerton - - - - - - - -
Slayden - - - - - - - -
Smithville - - - - - - - -
Smyrna - - - - - - - -
Sneedville - - - - - - - -
Soddy Daisy - - - - - - - -
Somerville - - - - - - - -
South Carthage - - - - - - - -
South Fulton - - - - - - - -
South Pittsburg - - - - - - - -
Sparta - - - - - - - -
Spencer - - - - - - - -
Spring City 20,133 30,175 41,111 40,611 38,767 39,665 40,178 42,248
Spring Hill - - - - - - - -

47WWW.TN.GOV/TACIR
Tennessee Valley Authority’s Payments in Lieu of TaxesAnnual Report to the Tennessee General Assembly
City 2017-18 2016-17 2015-16 2014-15 2013-14 2012-13 2011-12 2010-11Payments Distributed to Cities in Areas Affected by TVA Construction by Tennessee Fiscal Year
Springfield - - - - - - - -
St. Joseph - - - - - - - -
Stanton - - - 3,333 6,362 6,510 9,891 15,769
Stantonville - - - - - - - -
Sunbright - - - - - - - -
Surgoinsville - 2,982 6,094 9,246 11,769 12,109 12,391 -
Sweetwater 1,129 4,512 18,443 18,218 17,391 17,794 17,361 20,381
Tazewell - - - - - - - -
Tellico Plains 165 661 2,700 2,668 2,546 2,605 2,651 2,666
Tennessee Ridge - - - - - - - -
Thompson’s Station - - - - - - - -
Three Way - - - - - - - -
Tiptonville - - - - - - - -
Toone - - - - - - - -
Townsend - - - - - - - -
Tracy City - - - - - - - -
Trenton - - - - - - - -
Trezevant - - - - - - - -
Trimble - - - - - - - -
Troy - - - - - - - -
Tullahoma - - - - - - - -
Tusculum - - - - - - - -
Unicoi - - - - - - - -
Union City - - - - - - - -
Vanleer - - - - - - - -
Viola - - - - - - - -
Vonore 277 1,107 4,523 4,468 4,265 4,364 4,440 3,606
Walden - - - - - - - -
Wartburg - - - - - - - -
Wartrace - - - - - - - -
Watauga 396 396 - - - - - -
Watertown - - - - - - - -
Waverly - - - - - - - -
Waynesboro - - - - - - - -
Westmoreland 6,884 6,891 6,887 6,804 6,495 - - -
White Bluff - - - - - - - -
White House 18,157 16,588 16,579 16,377 15,633 - - -
White Pine - - - - - - - -
Whiteville - - - - - - - -
Whitwell - - - - - - - -
Williston - - - - - - - -
Winchester - - - - - - - -
Winfield - - - - - - - -
Woodbury - - - - - - - -
Woodland Mills - - - - - - - -
Yorkville - - - - - - - -
Total 1,731,456$ 2,053,041$ 1,480,559$ 1,657,675$ 1,773,001$ 1,445,274$ 1,537,771$ 1,071,615$


49WWW.TN.GOV/TACIR
Tennessee Valley Authority’s Payments in Lieu of TaxesAnnual Report to the Tennessee General Assembly
Appendix G: TVA 2015 IRP Recommendations by Resource Type
Coal: Continue with announced plans to retire units at Allen, Colbert, Johnsonville, Paradise and Widows Creek. Evaluate the potential retirement of Shawnee Fossil Plant in the mid-2020s if additional environmental controls are required. Consider retirements of fully controlled units if cost effective.
Nuclear: Pursue additional power uprates at all three Browns Ferry units by 2023. Continue work on Small Modular Reactors as part of technology innovation efforts and look for opportunities for cost sharing to render these more cost-effective for our ratepayers.
Hydroelectric: Pursue an additional 50 MW of hydro capacity at TVA facilities and consider additional hydro opportunities where feasible.
Demand Response: Add between 450 and 575 MWs of demand reduction by 2023 and similar amounts by 2033, dependent on availability and cost of this customer-owned resource.
Energy Efficiency: Achieve savings between 900 and 1,300 MW by 2023 and between 2,000 and 2,800 MWs by 2033. Work with our local power company partners to refine delivery mechanisms, program designs and program efficiencies with the goal of lowering total cost and increasing deliveries of efficiency programs.
Solar: Add between 150 and 800 MW of large-scale solar by 2023 and between 3,150 and 3,800 MW of large-scale solar by 2033. The trajectory and timing of solar additions will be highly dependent on pricing, performance and integration costs.
Wind: Add between 500 and 1,750 MW by 2033, dependent on pricing, performance and integration costs. Given the variability of wind selections in the scenarios, evaluate accelerating wind deliveries into the first 10 years of the plan if operational characteristics and pricing result in lower-cost options.
Natural Gas (Combustion Turbine and Combined Cycle): Add between 700 and 2,300 MW by 2023 and between 3,900 and 5,500 MW by 2033. The key determinants of future natural gas needs are trajectories on natural gas pricing and energy efficiency and renewables pricing and availability.
Source: Tennessee Valley Authority, Integrated Resource Plan (2015), 116-17.